system level performance of millimeter-wave...
TRANSCRIPT

System Level Performance of Millimeter-waveAccess Link for Outdoor Coverage
Mohamed Abouelseoud and Gregg CharltonInterDigital, King of Prussia, PA 19406, USA
Email:[email protected], [email protected]
Abstract— The increased demand on data and the scarcityof available bandwidth motivate research for new technologiesbeyond 4G. In this paper we provide a system level study ofa new cellular architecture that incorporates millimeter wavetechnology (60 GHz) for the access link. A system level simulationis carried out for a university campus and an urban environmentand the sensitivity to various design parameters has been studied.The objective of such a system is to provide up to 500X thewireless network capacity that is delivered today without asignificant increase in energy or deployment costs.
I. INTRODUCTION
The exponential growth of data demand, increased use ofsmart-phones and tablets and the emergence of new wirelessapplications with rich multimedia content create a need for anew synergetic strategies capable delivering this huge demand.
The use of small cells increases the spacial reuse andreduces transmit power which leads to greater throughput inthe network. The main downside is the need for interferencemanagement and the cost associated with deploying manysmall cell base stations. Another viable solution is to explorehigher frequency bands where huge amounts of spectrumare available with potentially very affordable licensing costs.The bandwidth of the 60 GHz unlicensed spectrum alone isabout 7 GHz (depending on country), which is more thanall available bandwidth in the traditional cellular spectrum.The availability of this bandwidth opens the door for newapplications that need higher network capacity and powersavings by trading spectrum for power and using simplerwaveforms.
There has been a lot of work in both academia and industryinvestigating the use of 60 GHz carriers, for example [1]–[4] for indoor coverage and [5] for outdoor coverage. Therehave been other activities in the industrial standards as well,for example, IEEE 802.11ad, WirelessHD, ECMA-387, IEEE802.15.3c and the Wireless Gigabit Alliance (WiGig).
There are, however, many challenges associated with the60 GHz band. The high molecular oxygen absorption is aconcern for long links. Another limiting factor is due to the40 dBm FCC EIRP limit. Furthermore, the 60 GHz band isunlicensed, making it difficult to predict how well differentRATs may coexist and if operators will consider the band re-liable enough. Another big concern is the propagation channelitself. The millimeter wave (mmW) carriers have near opticalproperties with high penetration losses, high reflection losses,
Fig. 1: The proposed system architecture
and little diffraction, leading to LOS dominated coverage. Itis expected that the mmW base stations (mBs) to be deployedin heavily crowded areas where the LOS between the mB andthe UE can be easily blocked.
The proposed architecture, Figure 1, includes new smallmmW base stations (mBs) that are overlaid on a cellularnetwork. The mBs are denser than the eNBs and self-backhaulusing a mmW MESH network to the eNB (or other wiredaccess). The phased array antennas create narrow steerablebeams that provide links with low interference to both accesslinks and backhaul transmissions. Each such node is alsoconnected to a coverage network on a traditional carrier (e.g.,a cellular network) to provide mobility management, security,and other control functions.
In this paper we provide a system level study for the outdooraccess link of a mmW system. We simulate the physical layerof such system and carry out sensitivity studies on multipledesign parameters. Deployments in a university campus andan urban area are studied and we evaluate the effect of thedirectivity of the Tx and Rx antenna, the density of the mBs,modulation schemes, system threshold, inter-site distance andmB location placement.
II. SIMULATOR DESIGN
The simulator comprises two main modules. The first isthe cell planning tool, WINPROP from AWE Communica-tions [6], which is capable of creating outdoor scenarios inwhich the user is able to specify the RF properties of thevarious building materials and vegetation areas. Based on raytracing, the tool determines the delay, signal strength, and

(a) 3D view (b) mBs deployments
Fig. 2: University college campus mBs deployments
type of interaction the path rays encounter from transmitterto receiver for each path arriving at a user-defined grid pointwhile taking the transmit antenna pattern into account. allows
The second module is a system simulator written in Mat-lab. This tool uses data from WINPROP to create channelmodels that are used to estimate the throughput achieved byUEs. The UEs locations are randomly drawn from the setof pre-generated grid points. Each dropped UE is randomlyoriented in azimuth and elevation.The simulator models theimpacts of the transmit power, inter-cell interference, receiveantenna gain, modulation scheme, scheduler parameters, etc.The statistics are then collected to generate an estimate of theoverall network performance.
A. Channel Model
The aforementioned WINPROP tool is configured to run in adeterministic fashion in which individual rays (LOS, reflected,and diffracted) are traced between each transmitter and theentire set of user-defined grid points. The signal strength,delay and angle of arrival for each ray are function of the re-flection and diffraction angles, building materials, propagationmodel, transmit antenna pattern etc. The received power/delaycombination allows for the creation of a tapped delay profile.A fading profile is applied to each of the identified rays tocapture the fast fading environment. The fading profile followsa Rician distribution rather than a Rayleigh distribution with k-factor of 10 because of the LOS characteristics of the channel.
B. Tx and Rx Antenna Design and Beam Assignments
To generate the mB’s desired antenna patterns we use auniform rectangular planar phase array (URA) while varyingthe number of elements. The UE is associated to one of thepossible beams that the array could generate. Each URA isassumed to cover 90◦ in azimuth. The design parameters forthe tested patterns are given in Table I. The gain of the Rxantenna depends on the received ray AoA. An ideal omni-directional antenna and a directional antenna have been tested.The omni-directional antenna has a uniform 0 dBi gain in alldirections while the directional antenna is a 4x4 URA withelement spacing equal to half the wavelength. The antennaarray generates 5 beams in the 0◦ elevation angle plane with
No ofBeams
Sep.Angle(◦)
No ofEle-ments(NxN)
Gain(dBi)
3dBbeam-width(◦)
CrossoverPoint(◦)
Spacing(λ)
CrossoverPointGain(dB)
5 18 12 21.6 6.5 8.9 0.32 -5.937 12.86 16 24.1 4.75 6.5 0.33 -5.959 10 20 26 3.7 5 0.34 -5.81
TABLE I: Base station antenna patterns specification
approximately 60◦ beamwidth with overlap at the 3 dB point.This is equivalent to approximately 30◦ beam separation. Aset of down-tilted beams and a set of up-tilted beams are usedto form a 5x3 beam array. Also, back-to-back planar phasedarray antennas are used to cover the front and the back of theUE to provide coverage all around the UE.
UE-mB association is a two stage process. In the first stage,the received power from all mBs antenna beams is measured atthe UE location with a quasi-omni antenna pattern in the casewhere the UE antenna is directional, or an ideal-omni antennaif no directional antenna is used. The quasi-omni antennapattern is just the pattern of a single element patch antennawhich effectively constrains the possible pointing direction ofthe array. The mB array and corresponding beam providingthe largest Rx power is selected. In the second stage (only fordirectional receive antennas), all possible Rx beams at the UEare varied to determine the best receive antenna pattern.
C. Self Blockage
It is assumed that the signal coming from the back side ofthe UE is attenuated by 40 dB. For an average blocker 175 cmtall and 60 cm wide holding the UE 30 cm away, the blockingangle is a 90◦ azimuth angle centered at the back of the UEand elevation angles between 62.8◦ and 90◦.
D. SINR and Throughput Calculation
After calculating the instantaneous SINR for the scheduledUEs, the SINR is mapped to its corresponding throughput.Shannon capacity formula provides an upper bound on per-formance where R = B log2(1 + SINR), B is the bandwidthand R is the achieved rate. A second method is to map SINRto throughput via a lookup table. We use tables based on LTE(QPSK, 16QAM and 64-QAM) [7] and also based on adaptivemodulation and coding schemes from 802.16ad [8].
E. Default Simulation Parameters
We consider 10 UE drops, each comprising 1000 samples(TTIs). The total number of UEs per drop is 50 whichcorresponds to a UE density of 730 UE/km2. A TTI durationis assumed to be 1 msec. The carrier frequency is 60 GHz.Following 802.11ad, a total of 2640 MHz bandwidth is usedand divided into 512 sub-carriers of which 336 are used fordata. The UE noise figure is 6 dB. Unless otherwise noted,Round Robin scheduling is used to distribute the resourcesequally among the users and ideal omni-directional Rx An-tennas are used. The mB antenna’s down-tilt angle is 0◦ and

0 500 1000 1500 2000 2500 3000 35000
10
20
30
40
50
60
70
80
90
100
User Throughput (Mbps)
CD
F (
%)
5 beams/array−5mB7 beams/array−4mB9 beams/array−4mB5 beams/array−5mBs7 beams/array−5mBs9 beams/array−5mBs9 beams/array−5mBs (T)18 beams/array−5mBs
Fig. 3: User throughput for various mBs deployments
mBs have an EIRP of 40 dBm. The mB’s height is 4 m andthe UE’s height is 1.5 m.
III. UNIVERSITY CAMPUS PERFORMANCE EVALUATION
The studied campus shown in Figure 2 is an abstractedversion of a large, public university that contains trees andbuildings of various heights. Two proposed mB placementschemes are considered. The first relies on 4 mBs placed at thecorners of the college campus with the intent that they providecoverage to the main quadrangle. The other has an additional5th mB placed at the center of the quadrangle itself. Accesslink system performance is measured by the metrics of userthroughput and total network throughput.
A. Multiple mB Configurations
Two mB deployment schemes are tested. The number ofazimuth beams per array is varied from 5 to 9. The default tiltangle is set to 0◦. For the 9 beams/array case, two tilt angleswere applied to the antenna arrays, 0◦ and −15◦. The EIRP isheld constant for each mB antenna type so the improvementseen as one moves to narrower beams is not due to increasedtransmit power.
Figures 3 and 4 show the user and the total cell throughput,respectively. The additional mB at the center of campusimproves performance where the added interference does notovercome the SNR improvement and the frequency reuse gain.As expected, generally, narrower beams (7 vs. 5 beams/array)provide better performance since there is less likelihood ofinter-mB interference, however when the beams are verynarrow (as for the 9 beams case), the results are sensitiveto the tilt angle. This is seen where the performance for the7 beams/array scenario outperforms the 9 beams/array case.For the 9 beams/array case, the 0◦ tilt angle is superior to the−15◦ tilt angle but there are cases in which having a down-tiltis helpful such as when the UE is very close to the mB, shownin figures 3 and 4 as (T). This is seen by noting the significantimprovement when the best of the two tilt angles is chosenfor each UE, the 18 beams/array in figures 3 and 4.
0 10 20 30 40 50 60 70 800
10
20
30
40
50
60
70
80
90
100
Total Cell Throughput (Gbps)
CD
F (
%)
5 beams/array−5mB7 beams/array−4mB9 beams/array−4mB5 beams/array−5mBs7 beams/array−5mBs9 beams/array−5mBs9 beams/array−5mBs (T)18 beams/array−5mBs
Fig. 4: Total cell throughput for various mBs deployments
0 1000 2000 3000 4000 5000 6000 7000 8000 90000
10
20
30
40
50
60
70
80
90
100
User Throughput (Mbps)
CD
F (
%)
SINR throughput−RRSNR throughput−RRSINR throughput−PF, B=1SNR throughput−PF, B=1
Fig. 5: SINR throughput vs SNR throughput
B. Interference
Interference is a matter of concern in all wireless systems.To determine the effect of interference, we calculate a hypo-thetical value which is the SNR throughput. The SNR through-put is the achieved throughput assuming zero interference.Comparing this value to the achieved SINR throughput, onecan determine the effect of the interference on the systemunder study. Figure 5 shows the SNR and SINR UE throughputCDF. The mBs in this test are assumed to have 5 beams/array.Two schedulers have been tested, the Round Robin andthe proportional fair schedule (PF) [9] schedulers. A PF isconsidered to balance between delay and fairness constraintsand maximizing the network throughput. The results show thateven for the Round Robin scheduler, the SNR throughput andthe SINR throughput are very close to each other. This isbecause of the mmW characteristics (high path loss, materialabsorption, limited diffraction and the Oxygen absorption) inaddition to the use of the transmitter narrow beams. Thisresult shows that a mmW system is not an interference limitedsystem and pushing more power in the system will increasesystem capacity.
0 10 20 30 40 50 60 70 80 900
10
20
30
40
50
60
70
80
90
100
Total Cell Throughput (Gbps)
CD
F (
%)
SC−802.11ad MCSOFDM−802.11ad MCSShannon CapacityQPSK16−QAM64−QAM
Fig. 6: Total cell throughput for various modulation schemes
C. Modulation
We consider various upper limits on modulation schemeswhen mapping SINR to throughput. QPSK, 16-QAM and64-QAM tables based on LTE from [7] are used to mapthe calculated SINR to the achieved throughput. We comparethese results with the Shannon capacity SINR to throughputmapping. Modulation and coding schemes based on IEEE802.11ad [8] are tested as well, one is based on single carrier(MCS indices 1-12) and the other is based on OFDM (MCSindices 13-24).
Figure 6 shows the total cell throughput CDF. Because ofthe availability of bandwidth, a simple modulation scheme canbe used where this would be enough to provide a high qualityof service and at the same time reduces receiver complexity.This can be shown from the results in the figure where evenwhen limiting the modulation scheme to QPSK, the mmWsystem provide performance that exceed any known deployedtechnology. The average total network throughput for QPSKis 29.8 Gbps. The area of the college campus is 0.076 km2
and with that average network throughput, a throughput of392 Gbps/km2 can be achieved.
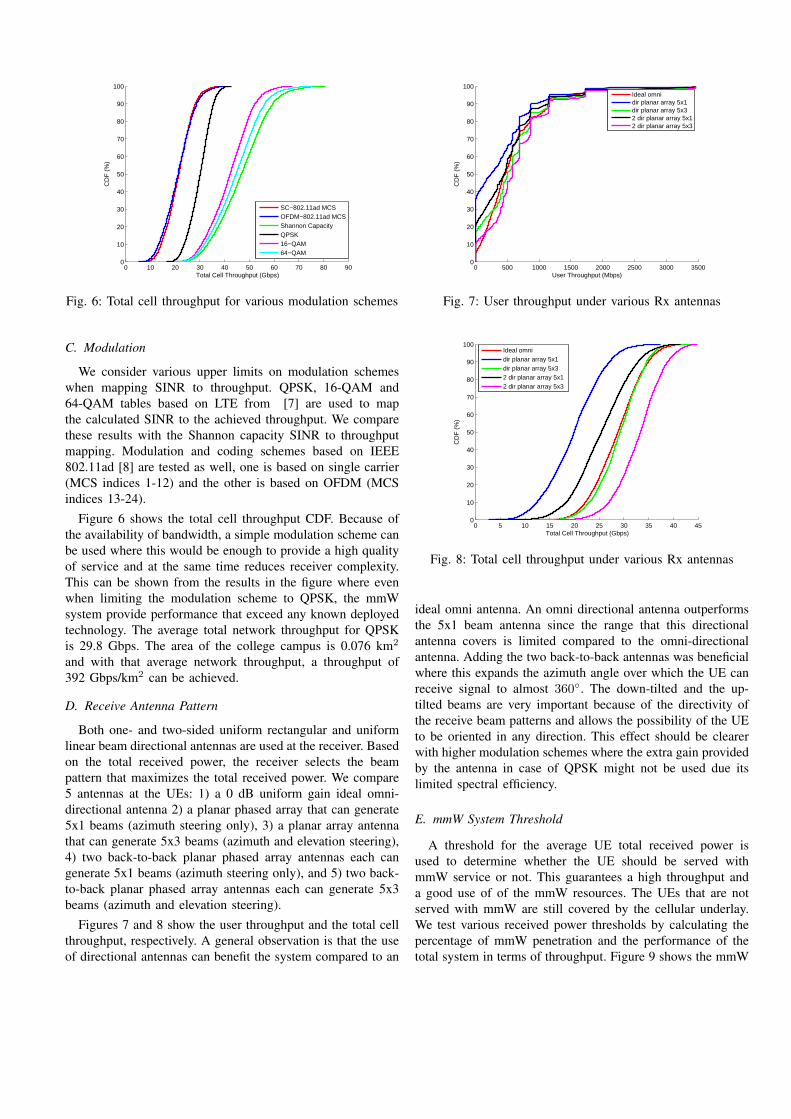
D. Receive Antenna Pattern
Both one- and two-sided uniform rectangular and uniformlinear beam directional antennas are used at the receiver. Basedon the total received power, the receiver selects the beampattern that maximizes the total received power. We compare5 antennas at the UEs: 1) a 0 dB uniform gain ideal omni-directional antenna 2) a planar phased array that can generate5x1 beams (azimuth steering only), 3) a planar array antennathat can generate 5x3 beams (azimuth and elevation steering),4) two back-to-back planar phased array antennas each cangenerate 5x1 beams (azimuth steering only), and 5) two back-to-back planar phased array antennas each can generate 5x3beams (azimuth and elevation steering).
Figures 7 and 8 show the user throughput and the total cellthroughput, respectively. A general observation is that the useof directional antennas can benefit the system compared to an
0 500 1000 1500 2000 2500 3000 35000
10
20
30
40
50
60
70
80
90
100
User Throughput (Mbps)
CD
F (
%)
Ideal omnidir planar array 5x1dir planar array 5x32 dir planar array 5x12 dir planar array 5x3
Fig. 7: User throughput under various Rx antennas
0 5 10 15 20 25 30 35 40 450
10
20
30
40
50
60
70
80
90
100
Total Cell Throughput (Gbps)
CD
F (
%)
Ideal omnidir planar array 5x1dir planar array 5x32 dir planar array 5x12 dir planar array 5x3
Fig. 8: Total cell throughput under various Rx antennas
ideal omni antenna. An omni directional antenna outperformsthe 5x1 beam antenna since the range that this directionalantenna covers is limited compared to the omni-directionalantenna. Adding the two back-to-back antennas was beneficialwhere this expands the azimuth angle over which the UE canreceive signal to almost 360◦. The down-tilted and the up-tilted beams are very important because of the directivity ofthe receive beam patterns and allows the possibility of the UEto be oriented in any direction. This effect should be clearerwith higher modulation schemes where the extra gain providedby the antenna in case of QPSK might not be used due itslimited spectral efficiency.
E. mmW System Threshold
A threshold for the average UE total received power isused to determine whether the UE should be served withmmW service or not. This guarantees a high throughput anda good use of of the mmW resources. The UEs that are notserved with mmW are still covered by the cellular underlay.We test various received power thresholds by calculating thepercentage of mmW penetration and the performance of thetotal system in terms of throughput. Figure 9 shows the mmW

0 500 1000 1500 2000 2500 3000 35000
10
20
30
40
50
60
70
80
90
100
User Throughput (Mbps)
CD
F (
%)
mmw RX thr =−Infmmw RX thr =−90mmw RX thr =−85mmw RX thr =−80mmw RX thr =−75mmw RX thr =−70
Fig. 9: mmW UE throughput CDF
−Inf −90 −85 −80 −75 −700
10
20
30
40
50
60
70
80
90
100
mmw RX power service threshold
Per
cent
age
of U
Es
serv
ed w
ith m
mw
Fig. 10: mmW penetration percentage
UE throughput CDF and Figure 10 shows the percentage ofUEs that are served with mmW with respect to all UEs inthe system. Note that there is a trade-off between the mmWpenetration percentage and throughput. Using a high thresholdguarantees a high service quality but at the same time will limitthe number of UEs that are served. In the system under study,-80 dBm is considered a good threshold that guarantees 90%mmW penetration and around 200 Mbps tenth percentile UEthroughput.
IV. URBAN DEPLOYMENT
Identical metrics have been generated for a small urbanmorphology which is loosely based on a portion of London,England in which a series of uniform buildings of similardimensions are laid out in a uniform pattern. This deploymentincludes a high preponderance of urban canyons. Figure 11ashows a 2-D view of this scenario for 7 mBs and 16 arrayswhile Figure 11b shows the identical scenario with 9 mBsand 25 arrays. In both cases, adequate SNR coverage can beprovided down the urban canyons but the denser deploymentprovides increased network throughput due to higher signalstrength overcoming the effects of additional interference.
Figures 12 and 13 show the user and total throughput CDF.The main result is that adding more mBs and antenna arrays
(a) 7 mBs/16 arrays (b) 9 mBs/25 arrays
Fig. 11: Urban deployment
Fig. 12: User throughput, Urban Scenario
provides significant performance improvement. The mediantotal cell throughput was improved by over 40% by increasingthe number of mBs from 7 to 9.
A. Inter-site Distance
A single street (urban canyon) was created with mBs posi-tioned at either end 600m apart. mBs use 20x20 URA antennaarrays. Additional mBs are then equally spaced between theend points to determine the performance gains for a higherbase station density and to determine if there becomes a pointof diminishing returns in which further reducing inter-sitedistance (ISD) provides little benefit.
The median total throughput was plotted for a varyingnumber of mBs, Figure 14a. Continuing to add mBs improvesperformance as the received signal power increases with thereduced mB-UE distance. In Figure 14b the median UEthroughput is plotted for the cases in which the throughputis mapped to the SINR as well as to the SNR. The latteris a purely hypothetical exercise designed to estimate theimpact of interference on user throughput. Without interfer-ence, the throughput improves linearly with the increasingmBs (decreasing ISD) and when interference is considered, thethroughput improvement begins to level off. Taken together,the results show that an ISD of 150 m yields good performancebut further reducing ISD provides diminishing returns.

Fig. 13: Total cell throughput, Urban Scenario
2 3 4 5 6 70
2
4
6
8
10
12
14
16
18
20
Number of mBs
Thr
ough
put (
Gbp
s)
(a) Median network throughput
2 3 4 5 6 70
100
200
300
400
500
600
Number of mBs
Thr
ough
put (
Mbp
s)
SINRSNR
(b) Median UE throughput
Fig. 14: Single street
B. Effects of mB Placement
An outdoor shopping plaza was created to accommodate 32potential storefronts, Figure 15a. Obviously not every storewill supply enhanced WiFi service but some will as shown bythe red dots. As a result, the number of storefronts providingmmW service was treated as a simulation variable where thelocations supplying mmW service are then randomly selected.For several combinations of active mBs, numerous randommB drops are done to determine system wide performancesensitivity to the positioning of the mBs.
Figure 15b shows the total throughput CDFs for 4 (blue),8 (green), and 16 (red) active mBs. It is clear that networkperformance improves when more mBs are active; however,the absolute spread between the best and worst drops increaseswith the number of active mBs. The median throughputimproves significantly with the number of active mBs whilethe relative spread measured as the ratio of the medianthroughputs standard deviation to its mean is largest with only4 active mBs. This means that there is greater sensitivity to mBplacement when there are few mBs. In general, performanceimproves with the increasing number of mBs so it is reason-able that uncoordinated mmW deployments are viable thoughperformance would be better if the active mBs were chosenwith some coordination (e.g. 22% improvement between themin and max cases for 16 mBs).
(a) A random plaza deployment (b) mB drops total throughput
Fig. 15: mB placement sensitivity
V. CONCLUSION
A system level simulation for a network of a small mmWbase stations that are overlaid on a cellular network is carriedout for a university campus and an urban area. Results showthat a goal of around 400 Gbps/km2 total network throughputcan be easily achieved even with simple modulation andcoding schemes. The characteristic of the 60 GHz carrierfrequency and the use of transmit antennas with narrowerbeamwidths result in less inter-mB interference and, therefore,better overall performance. It is shown that placing mBs150 m apart is adequate as long as there are clear linesof sight between possible UE locations and nearby mBs.Double sided directional receive antennas are necessary toat least provide the same performance as that of an idealomni. Uncoordinated placement of mBs can be supported sinceadding mBs always improves overall performance and theincrease in intercell interference is more than offset by thereduced UE-mB distance.
REFERENCES
[1] W. Jing, R. Prasad, and I. Niemegeers, “Analyzing 60 GHz radio links forindoor communications,” IEEE Transactions on Consumer Electronics,vol. 55, no. 4, pp. 1832–1840, Nov. 2009.
[2] J. Wang, R. Prasad, P. Pawelczak, and I. Niemegeers, “A link stabilitymodel for indoor 60GHz radio wireless networks,” in Vehicular Technol-ogy Conference Fall (VTC 2009-Fall), 2009 IEEE 70th, sept. 2009, pp.1 –6.
[3] H. Lee, J. Bok, B. G. Jo, G. H. Baek, and H. G. Ryu, “Indoor WPANcommunication system using 2-dimensional array antenna in 60GHzfrequency band,” in Computing, Communications and Applications Con-ference (ComComAp), 2012, jan. 2012, pp. 158 –161.
[4] X. Zhang, L. Lu, R. Funada, C. S. Sum, and H. Harada, “Physical layerdesign and performance analysis on multi-gbps millimeter-wave wlansystem,” in Communication Systems (ICCS), 2010 IEEE InternationalConference on, nov. 2010, pp. 92 –96.
[5] Z. Pi and F. Khan, “System design and network architecture for amillimeter-wave mobile broadband (mmb) system,” in Sarnoff Sympo-sium, 2011 34th IEEE, may 2011, pp. 1 –6.
[6] AWE Communications, “WinProp software suite,” http://www.awe-communications.com.
[7] “IEEE 802.16m evaluation methodology document (EMD),” IEEE 802.16Broadband Wireless Access Working Group, Jan 2009.
[8] “IEEEdraft standard for local and metropolitan area networks-specificrequirements-part 11: Wireless LAN medium access control (MAC) andphysical layer (PHY) specifications. amendment 3: Enhancements forvery high throughput in the 60 GHz band,” IEEE802.11ad, Mar 2012.
[9] D. Tse and P. Viswanath, Fundamentals of Wireless Communication.Cambridge University Press, 2005.