system critical asset reliable scar - society of marine...
TRANSCRIPT

System Critical Asset ReliableSCAR
Brian Graney

What is Maintenance
• Operations owns the Asset• Maintenance is given temporary custody of
Asset• To bring the Asset back into Specification to
meet the Reliability needs of Operations

Cost of Maintenance - EPRI
• Run to Failure - $18.00 Per Hp• Planned Maintenance - $12.00 Per Hp• PM – Reduces Catastrophic Failures by 50%• 3 out of 4 PM find nothing wrong• High Labor and Spare Parts Cost• Condition Based Maintenance - $7.00 Per Hp• CBM – Reduces Catastrophic Failures by 75% • Reliability Centered Maintenance/Proactive - $4.00 Per Hp

Percentage of Maintenance
• Typical Maintenance Program • 40% PM-CBM – 60% Reactive• RCM/Proactive Program• 60% PM-CBM – 40% Reactive • RCM/Proactive – World Class• 80% PM-CBM – 20% Reactive

Function of RCM Principles
• To improve Maintenance by the following: • 1) Effectiveness –• 2) Efficiency -• 3) Productivity -• Thereby improving the Reliability of Assets
for Operations .

Reliability Centered Maintenance
• RCM principles,• Maintenance will be evaluated and applied in
a rational manner that provides the most value to a vessel’s Owner/Operator. Accordingly, improved equipment and system reliability onboard vessel.
• .ABS – Guild - Reliability Centered Maintenance
ABS – Guild RCM
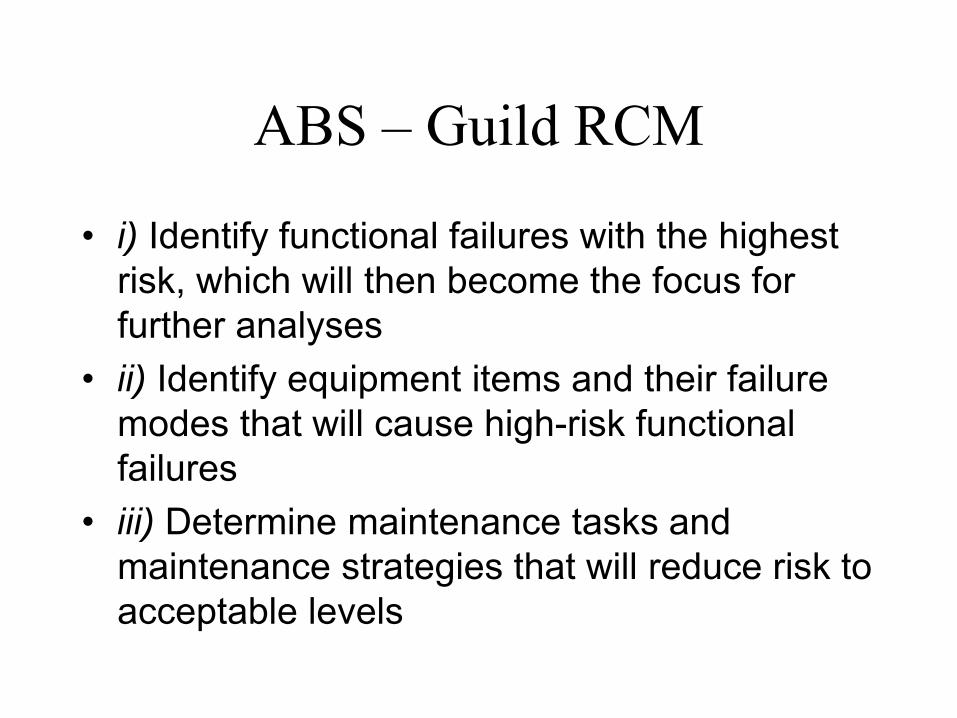
• i) Identify functional failures with the highest risk, which will then become the focus for further analyses
• ii) Identify equipment items and their failure modes that will cause high-risk functional failures
• iii) Determine maintenance tasks and maintenance strategies that will reduce risk to acceptable levels

Components of RCM• Reliability Engineering• Asset Criticality • Failure Mode Effects Analysis• Root Cause Failure Analysis• Weibull Analysis• Planned Maintenance• Condition Based Maintenance• Maintenance Work Flow Management - CMMS• Planning, Scheduling – Inventory Control – Do the right work• Precision Maintenance – Alignment/Balancing• Quality Assurance – Craft – Follow-up – Do the work right• Management of Change – Continuous Improvement Program • Key Performance Indicators

Traditional Asset CriticalityCost Analysis Approach
• Safety – Multiplier Yes – 2, No – 1• Environment – Multiplier – High– 3, Moderate– 2, Low– 1• Replacement Asset Value – 5 Through 1• Cost of Lost Production Value - 5 Through 1• Cost of Scrapping and Rework • Reliability of Asset – Low-3, Moderate-2, High-1

Rating of Assets
• Pyramid of Assets – AAA 1% AA – 3% A – 5%, BBB – 7% BB – 9% • B – 11%, CCC – 13%, CC – 15% C – 17%, D – 19%
D- 19%
C – 45%
A – 9%
B – 27%

Failure Mode Effects Analysis - FMEA
• Simple diagram of system parameters• What is the criticality of system• Identify flow process of system• If failure occurs - what will result from the failure • Diagram from ABS Guidance Notes on Reliability –
Centered Maintenance – 2004.

This is a simplified Top down FMEA system diagram for a Marine Slow Speed Diesel Propulsion Plant for the critical systems.

The Apollo Root Cause Analysis - method is a 4-stage process which facilitates a thorough incident investigation.
Within each of these four stages there are logical steps that guide you through the process of solving a problem.
1) Problem Definition - uses a systematic approach to define the nature and significance of a problem to be investigated
2) Cause and Effect - improves your ability to recognize and describe cause and effect relationships
3) Charting - allows you to chart cause and effect relationships
4) Solutions - uses a practical technique of identifying and evaluating proposed solutions with the goal of preventing recurrence

GENERAL WEIBULL EQUATIONS
1. POF = probability of failure= [1-e –(t / θ) ]2. POS = probability of survival = 1- POF3. Weibull Hazard Rate. = Z(t) = [kθ –k t k-1 ] k =1 ≈ 1/θ4. Weibull Survival = e –(t-λ / θ- λ)k = e – t/ θ
Shown with factors gamma λ & k = 1This simulates the most common failure pattern shown by the type F in Overman study : decreasing and then constant 1/θ

We hear a lot about reliability, but unless you’re a statistician you may not really understand what it all means?Here are a few things PdM managers/engineers should know more about:
1) Manufacturer’s & Designer’s L10 failure equation. 2) Weibull equation for probability of bearing failure. 3) The Weibull Intensity function. 4) Exponential failure probability distribution. 5) MTBF -- Meantime ‘between’ failures. 6) MTTF -- Meantime to failure? 7) POF ---- Probability of failure. 8) POS ---- Probability of Survival.9) Correlation Coefficients–Do estimates track with actual condition?
Why do you need to know all this? 10) Because this is the language of bearing RELIABILITY!
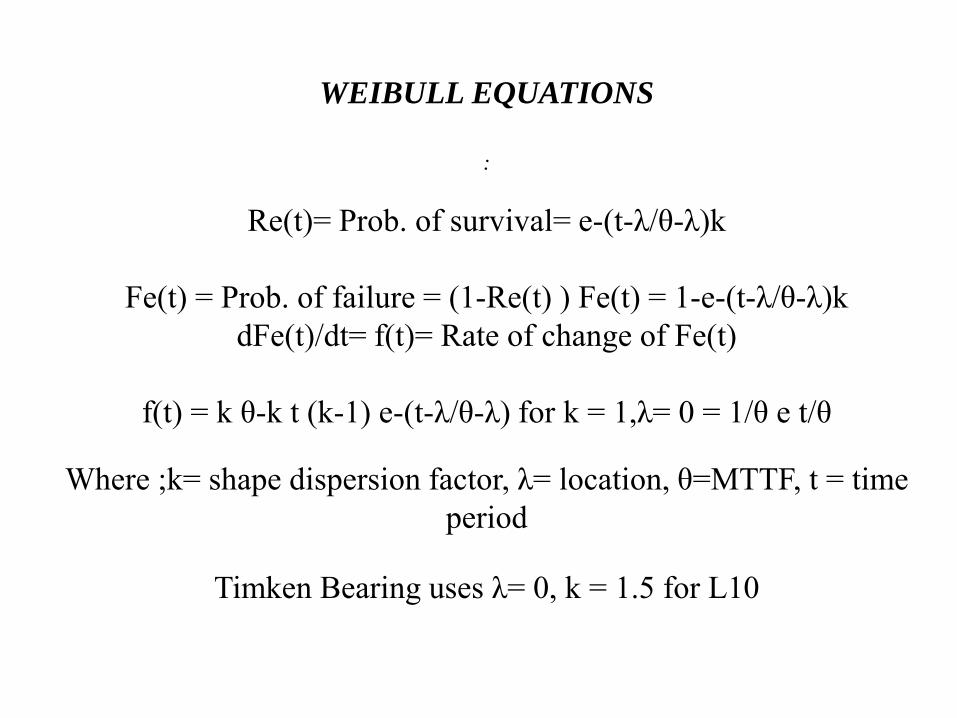
WEIBULL EQUATIONS
:
Re(t)= Prob. of survival= e-(t-λ/θ-λ)k
Fe(t) = Prob. of failure = (1-Re(t) ) Fe(t) = 1-e-(t-λ/θ-λ)k dFe(t)/dt= f(t)= Rate of change of Fe(t)
f(t) = k θ-k t (k-1) e-(t-λ/θ-λ) for k = 1,λ= 0 = 1/θ e t/θ
Where ;k= shape dispersion factor, λ= location, θ=MTTF, t = time period
Timken Bearing uses λ= 0, k = 1.5 for L10

17
THE PATTERN OF FAILURE @ RATED LOADL10 CONVERTED TO WEIBULL EXPONENTIAL FAILURE DISTRIBUTION
Ref: Timken Bearing Manual
Note: At rated load.
MULTIPLES OF L 10 LIFE.
Number of failed bearings.
•MTTF( Mean time to failure) ≈ 4.81 L10 life. 63% of bearings will have failed at MTTF!
Variance from 1 to >14 times L10life. Operating life will depend on static and dynamic operating load and other factors.
LIKE NEW
?NEARFAIL

Single CME to prevent an undesired Event Scenario
Quantitative Approach (Frequency per year)Industry History Approach
↓ Critical Mitigation Element (CME)
>10-2 Unwanted event has occurred in this specific type of operation within this industry using this same technology
No CMEs to prevent an undesired Event Scenario
10-2 to 10-3
Unwanted event almost certain to occur in this specific type of operation within this industry using this same technology during the life of the operation
10-3 to 10-4
Unwanted event likely to occur in this specific type of operation within this industry using this same technology during the life of the operation
2 CMEs, failure of 1 would not allow an undesired Event Scenario
10-4 to 10-6
Unwanted event is unlikely to occur in this specific type of operation within this industry using this same technology during the life of the operation
3 CMEs, failure of 2 would not allow an undesired Event Scenario
10-6 Unwanted event has not occurred in this specific type of operation within this industry using this same technology
> 4 CMEs, failure of 3 would not allow an undesired Event Scenario
Single CME to prevent an undesired Event Scenario

System Critical Asset Reliable (SCAR)
• SCAR – is a method for developing maintenance strategy based on the following criteria:
• 1) Asset Criticality• 2) Mean Time Between Failures (MTBF)• 3) Annual Operating Hrs• 4) Selection of Type of Maintenance (PM – CBM
– RTF)• 5) Maintenance Technology Matrix for CBM.

SCAR Asset Criticality
• Asset Criticality – A Systems Approach is used based on a simple top down Failure Mode Effects Analysis (FMEA) of the operating systems.

Simple Top Down Steam

Simple Top Down Diesel

Systems have three basic flow processes as follows:
• Series – Loss of System Asset Process Ends.• Parallel Path Limited Capacity – Loss of
System Asset Process Continues but with limited Capacity Out-Put.
• Parallel Path 100% Redundancy – Loss of System Asset Process Continues without loss of Capacity.

System Critical Flow Path
• Critical Flow Path
Series Process
1
Parallel Path Limited Capacity
2
Parallel Path 100% Redundancy
3

Definitions of Criticality
• Critical – Loss of system process results in manufacturing production to be shut down.
• Note: Safety and environmental systems are considered critical although may not be part of the manufacturing process.
• Essential - Loss of system process will not shut down manufacturing process.
• Non-Essential – Systems not involved with manufacturing process.

System Criticality Multipliers
• Critical 1 – Series Process – Multiplier 10• Critical 2 – Parallel Path Limited Capacity – Multiplier 8• Critical 3 – Parallel Path 100% Redundancy – Multiplier 6• Essential 1 – Series Process – Multiplier 5• Essential 2 – Parallel Path Limited Capacity – Multiplier 4• Essential 3 – Parallel Path 100% Redundancy – Multiplier 3• Non – Essential – Multiplier 2

Rotating Asset Multipliers
• Class 4 – > 500 HP+ High HP rotating asset with long lead time for replacement – Multiplier 20
• Class 3 - > 100 HP+ < 500 HP – Multiplier 10• Class 2 - > 20 HP < 100 HP Rotating assets between 20
HP-100 HP – Multiplier 6• Class 1 - < 20 HP Rotating assets below 20 HP –
Multiplier 2

Total Critical Value
• The Cross Multiplication of System Multiplier and Asset Multiplier equal Total Criticality Value.
• A value from 200 to 4 will be achieved. This value can be modified by multipliers for MTBF, Safety and Environment.
• In this process Safety and Environment are note codes not multipliers to the Asset Criticality.

Additional Multipliers
• Safety – Yes – Multiplier 2 - No – Multiplier 1• Environment - High – Multiplier 3 – Moderate –
Multiplier 2 – Low – Multiplier 1• MTBF – Low – Multiplier 3 – Moderate –
Multiplier 2 – High – Multiplier 1

Selection Type of Maintenance
• Prior to selecting a type of maintenance for a rotating asset – the normal Planned Maintenance (PM) Interval or Mean Time Between Failures (MTBF) in operating hours needs to be known.
• The normal annual operating hours for the asset will help in determining time intervals for Conducting Maintenance and Condition Monitoring.

Types of Maintenance
• Four Type of Maintenance
PM-CM
Technology -CM
RTF
PM – HRPM - CAL

There are four (4) types of maintenance.
• PM – HR – Planned Maintenance Hourly – Operating hour time based maintenance. Assets with high operating hours and high maintenance. Asset requiring high maintenance due to manufacturing process - Low MTBF- Normally 12% of Rotating Assets.
• PM-CAL – Planned Maintenance Calendar – Time based maintenance. Assets with low operating hours and low maintenance. Normally 3% of Rotating Assets
• CBM – Condition Based Maintenance – Technology based maintenance – Assets with high operating hours and normal maintenance. Medium and High MTBF. Normally 60% of Rotating Assets
• PM-CBM – A combination of both Planned Maintenance and Condition Monitoring –Normally used for large rotating assets. Normally 10% of Rotating Assets
• RTF – Run to Failure. Assets that the cost of replacement is low and are not part of a critical system. This is for Rotating Assets with a Total Critical Value below < 12. Normally 15% of Rotating Assets.
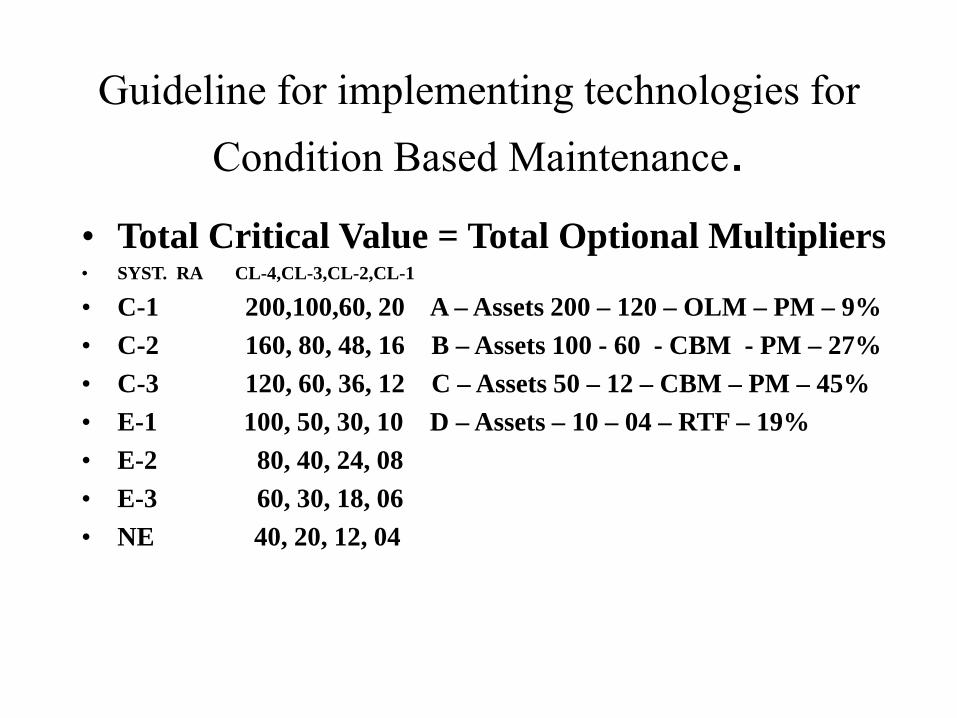
Guideline for implementing technologies for Condition Based Maintenance.
• Total Critical Value = Total Optional Multipliers• SYST. RA CL-4,CL-3,CL-2,CL-1
• C-1 200,100,60, 20 A – Assets 200 – 120 – OLM – PM – 9%• C-2 160, 80, 48, 16 B – Assets 100 - 60 - CBM - PM – 27%• C-3 120, 60, 36, 12 C – Assets 50 – 12 – CBM – PM – 45%• E-1 100, 50, 30, 10 D – Assets – 10 – 04 – RTF – 19% • E-2 80, 40, 24, 08• E-3 60, 30, 18, 06• NE 40, 20, 12, 04

Planned Maintenance• Rotating Assets with High Operating Hrs and High Maintenance– (Hourly PM)
- Operating HRS• Main Diesel Engines• Diesel Generators• Turbo-Chargers• Purifiers • Axial Vane Fans – Normally inaccessible for Vibration Measurements • Framo – Cargo Pumps – Inaccessible for Vibration Measurements • Rotating Assets with Low Operating Hrs and Low Maintenance and Fixed
Assets – Controls – (Calendar PM) – Operational Test• Emergency Diesel Generators• Emergency Fire Pumps – Fire & Foam Pump – Fire & GS Pump• Air Receivers – Piping – Valves • Controls Test – Test Relays etc.

Cost of PM

Condition Monitoring – Why is Condition Monitoring so successful? – RCM Studies have found that machines fail
randomly.– A Potential Failure (P-F) Curve is an inverted
exponential curve.
AlertFault
Ad. Fault
MTBF - Assigning Risk - MTTF
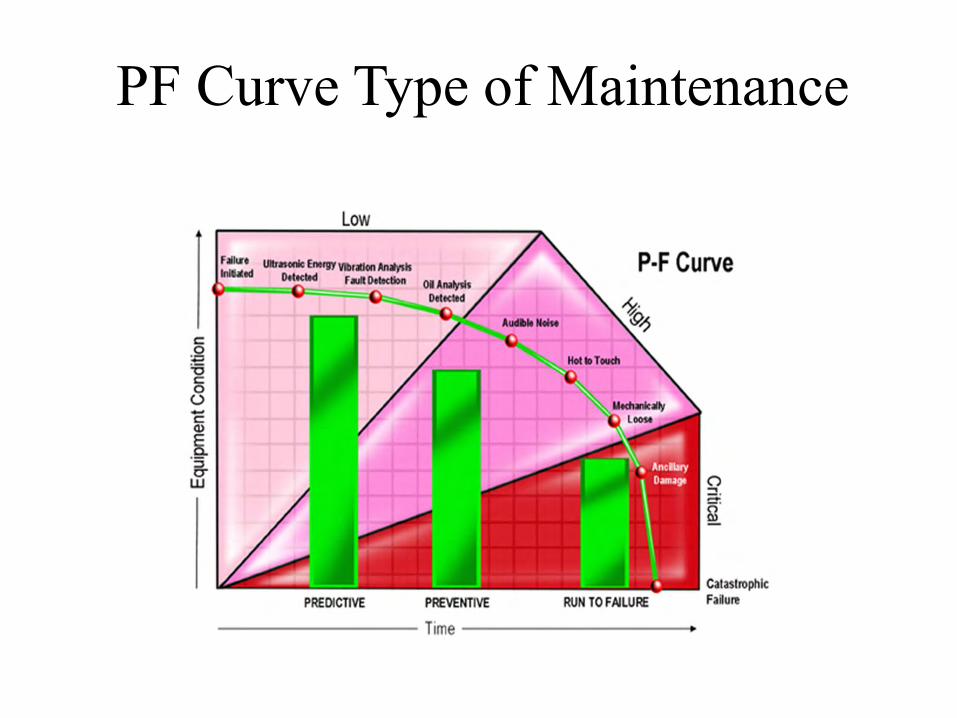
PF Curve Type of Maintenance

Condition Based Maintenance• Operating Parameters - Pressure, Temperature, Flow Rates, Fuel Consumption• Vibration Analysis – General Guild – Measurements Every – 2,160 Operating Hrs • Normal Marine Auxiliary Machinery Operating Hours – 6800 Hrs Per Year –
100% Redundancy = 3,400 Hrs – Semi-Annual Surveys – 1,700 Operating Hrs.• Inferred Thermograph – Survey – 8,760 Operating Hrs – Motor Controls & Switch
Board - Annual Survey• Electrical – Motor – Off Line Test - Megger – 3,400 Operating Hrs or Annually • Lube Oil Analysis – Quarterly or 1,700 Operating Hrs – Physicals – Spectro-
Graphic and Wear Particle Analysis• Ultra-Sonic – Leak Detection Surveys – Semi Annually • Shock Pulse or Ultra-Sonic Mechanical – For Rolling Element Bearing Wear –
Measurements Every 850 Operating Hours – Quarterly – Note: Semi-Annual Surveys – 1,700 Operating Hours.
• Reciprocating Analysis – Monthly or 720 Operating Hrs – Cylinder Pressure Indicator Readings – If necessary Full Reciprocating Analysis with Windrock –Beta Systems for (UE – PP – Vib.) with encoder.
• NDT – Acoustical Emission, Strain Gauge for Fixed Assets.

Cost of CBM

Maintenance Work Flow Management
• CMMS – Computerized Management Maintenance System – Nautical Systems 5• Planned Maintenance Interval – Job Planes – Work Orders – Inventory Control –
Follow-up Reports.• Modules for RCM • Planning and Scheduling – Inventory – Marine Superintendent/Port Engineer• Outside Contractors and Shipyards• Class Requirements – Surveys• Management of Change - Reliability Engineering – Up-Dating Maintenance
Procedures – PM Intervals - CBM – Re-Engineering a System or Asset. • Key Performance Indicators – Fuel Consumption, Unscheduled Repairs - Score
Cards – Wrench Time.

CBM Work Flow Maintenance

Re-evaluation of Maintenance ProceeduresJob PlanesPM IntervalsInventory TrackingWork Orders
Work Orders
Work Orders Work OrdersQA
CBM AnalysisRepair Request
Follow-Up Report Follow-Up Report
Maintenance Superentendant
CBMManager
Mech. Sup. Mech. Eng Elect. Sup.RCM Eng Elect. Eng Planning CMMS
I/T
Scheduling Inventory
StationaryAssets
RotationalAssets
Operations
NDT
PdM Vib.
IR & MCT
Oil Analysis
Elect. Assets
1st Line Supervisor
1st LineSupervisor
Mech. Craft Elect. Craft

Recommended Reading • ABS Guide for Survey Based on Reliability Centered Maintenance -
Robert Conachey• Up-Time Magazine • Terry O’Hanlon - Reliabilityweb.com• John Schultz - Allied Reliability Group• Keith Mobley – Life Cycle Engineering • John Mitchell - Reliability – Score Cards• Jack Nicholas – Reliability – RCM • John Moubray – RCM II• Mark Goldstein – CMMS – Enterprise Management Systems • Ron Moore – Reliability – Life Cycle Engineering