system analysis program overview - hydrogen.energy.gov · u.s. department of energy office of...
TRANSCRIPT
Fred Joseck – Project Manager, Fuel Cell Technologies Office
2018 Annual Merit Review
System Analysis Program OverviewPoster SA01
Washington, D.C. – June 13, 2018

2U.S. DEPARTMENT OF ENERGY OFFICE OF ENERGY EFFICIENCY & RENEWABLE ENERGY FUEL CELL TECHNOLOGIES OFFICE
Structure and ObjectivesSY
STEM
S AN
ALYS
IS
Systems Analysis Fit Within the Hydrogen and Fuel Cells Program
SA activities span across all focus areas and guide early-stage R&D and supporting efforts
Objectives
Evaluate• Technologies and
pathways• Hydrogen supply
and demand• Energy security
benefits Guide• Selection of R&D
technology optionsEstimate• Potential value of
early-stage R&D efforts
Identify• Technology gaps
including H2@scale

3U.S. DEPARTMENT OF ENERGY OFFICE OF ENERGY EFFICIENCY & RENEWABLE ENERGY FUEL CELL TECHNOLOGIES OFFICE
Budget – FY 2018 Appropriation
0.0
0.2
0.4
0.6
0.8
1.0
1.2
1.4
1.6
Studies & Analysis Develop &Maintain Models
Support Functions SystemsIntegration
Fund
ing,
Mill
ions
$
Total funding: $3.0 Million for FY 2018
Focus: Estimate and evaluate early-stage R&D gaps, impact and potential growth.

4U.S. DEPARTMENT OF ENERGY OFFICE OF ENERGY EFFICIENCY & RENEWABLE ENERGY FUEL CELL TECHNOLOGIES OFFICE
Strategy
System Analysis Framework
•Consistent and transparent data
•Prioritized analysis tasks
•Organize data and results for decision making
•Effective analytical workshops to gather key input assumptions for analysis
Models and Tools
• Life cycle analysis benefits of hydrogen and fuel cells for diverse applications
•Portfolio of validated models for near and long term analyses
Studies and Analysis
• Initial phases of technology early market penetration
• Long-term potential and issues
•Energy security analysis
•Energy storage analysis
•Resource supply for hydrogen production
Deliverables/ Results
• Support decision-making processes and milestones
•Direction, planning and resources
• Independent analysis to validate decisions
•Risk analysis of program area targets
• Sustainability metrics
Internal and External Peer Review
FCTO Program Collaboration and Input
Partnerships with labs, industry, academia

5U.S. DEPARTMENT OF ENERGY OFFICE OF ENERGY EFFICIENCY & RENEWABLE ENERGY FUEL CELL TECHNOLOGIES OFFICE
Model and Tool Portfolio
Macro-econ.(Fin. and Employ.)
Market Penetration
Lifecycle Modeling
Vehicle Modeling and SimulationAutonomie
GREET
MA3T, ADOPT, VISION
VISION+, SERA, ANL JOBS
Technology, Fuel, Infrastructure and DataH2A, H2FAST, HDSAM
Outputs Models and Tools
H2
Model Description Factsheets Available at: www.energy.gov/eere/fuelcells/systems-analysis
A versatile, comprehensive and multi-functional portfolio:

6U.S. DEPARTMENT OF ENERGY OFFICE OF ENERGY EFFICIENCY & RENEWABLE ENERGY FUEL CELL TECHNOLOGIES OFFICE
FCTO Analysis Portfolio in Summary
Tech
.,H
2,In
fras
& D
ata
VEHI
CLE
Life
cycl
e
MAR
KET
MAC
RO
H2A
HDSAM
ORNL and HyARC databases
Autonomie
FASTSim
GREET
MA3T
ADOPT
SERA
JOBS
VISION
DATA
VEH
ICLE
Life
Cycl
e
MAR
KET
MAC
RO
H2A, HDSAM and expertinput
AutonomieGREETMA3TVISION
• Covers the full analysis space and includes some redundancies (left figure)
• Some projects (figure below) span all categories for a truly integrated analyses
Analysis Type:
Models:
GPRA*Integrated Analysis
* Government Performance Results Act
Project Example:

7U.S. DEPARTMENT OF ENERGY OFFICE OF ENERGY EFFICIENCY & RENEWABLE ENERGY FUEL CELL TECHNOLOGIES OFFICE
0
1,000
2,000
3,000
4,000
5,000
2014 2015 2016 2017 2018
Preliminary
9
Fuel Cell Car* Sales and Leases in the U.S.
5,000 fuel cell carsby May 2018
0
10
20
30
40
2015 2016 2017 2018
Retail H2 Stations in CaliforniaH2
Sources: California Office of the Governor
Fuel Cell Cars and Stations Growth Over the Years
N e a r l y
*Toyota Mirai, Hyundai Tuscan, Honda Clarity
35 retail H2 stationsby May 2018
200 stations plannedin CA by 2025

8U.S. DEPARTMENT OF ENERGY OFFICE OF ENERGY EFFICIENCY & RENEWABLE ENERGY FUEL CELL TECHNOLOGIES OFFICE
H2 and Fuel Cells Enable Energy Security Benefits
0
1,000
2,000
3,000
2014 2015 2016 2017
Preliminary
2.4 million gallons reducedby 2017
O v e r
Petroleum Displacement (cumulative, in thousands of gallons)

9U.S. DEPARTMENT OF ENERGY OFFICE OF ENERGY EFFICIENCY & RENEWABLE ENERGY FUEL CELL TECHNOLOGIES OFFICE
DOE efforts have enabled early stage R&D innovation
738 patents enabled by FCTO funds
Innovation
36% of H2 and fuel cell patents
come from National Labs
Approx.
Cumulative H2 and fuel cell patents enabled by FCTO (2017)
0
100
200
300
400
500
600
700
800
Cum
ulat
ive
Pate
nts
Fuel Cell H2 Prod & Del. Storage
373 fuel cell patents
273 H2production/ delivery patents
92 H2storage patents

10U.S. DEPARTMENT OF ENERGY OFFICE OF ENERGY EFFICIENCY & RENEWABLE ENERGY FUEL CELL TECHNOLOGIES OFFICE
FY 2017 – FY 2018 Highlights

11U.S. DEPARTMENT OF ENERGY OFFICE OF ENERGY EFFICIENCY & RENEWABLE ENERGY FUEL CELL TECHNOLOGIES OFFICE
Identified key cost areas to guide R&D portfolio
Compression$1.54
Fuel
Cel
lsH 2
Stat
ion
H 2St
orag
e
sBipolar PlatesMembranesBOPMEAFrames/GasketsGDLs
StorageCoolingDispensingOther
BOP/AssemblyOther processingResin
Focusing on…Low and Non PGM
Catalysts,Alkaline
Membranes
Advanced Compression
Alternate Approaches
Low Cost Carbon Fiber (CF)
Long term Materials Approaches
CF Precursor/Conversion

12U.S. DEPARTMENT OF ENERGY OFFICE OF ENERGY EFFICIENCY & RENEWABLE ENERGY FUEL CELL TECHNOLOGIES OFFICE
Identified Fuel Cell Car Cost Reduction Pathways
0
10
20
30
40
50
60
70
80
90
CurrentFCEV
Low Vol.1k units/yr.
UltimateFuel CellHi Vol.
UltimateH2 Prod& Del.Hi Vol.
UltimateStorageHi Vol.
UltimateHi Vol.
Leve
lized
Cos
t of D
rivin
g, ¢
/mile
Lower fuel cell cost
Lower hydrogen cost
Lower onboard storage cost
Now Ultimate***$79/KW $30/KW
Now Ultimate$16/gge** $4/gge
Now Ultimate***$35/kWh $8/kWh
-17¢/mile
-20¢/mile
-6¢/mile
Fuel Cell
H2 Prod. & Del.
H2 Stor.
Fuel Cell Durability Impact Early R&D Needs and Status*
*At 1K units/year **gallon of gasoline equivalent
*** at 500,000/yr.
Over 60% cost reduction

13U.S. DEPARTMENT OF ENERGY OFFICE OF ENERGY EFFICIENCY & RENEWABLE ENERGY FUEL CELL TECHNOLOGIES OFFICE
Updated hydrogen R&D cost target
<$4/gge
Ultimate H2 R&D Cost Target 2025 H2 R&D Cost Target Low-Volume Current Status
$16/ggeto
$13/gge
$7/gge
1 EIA 2017 Annual Energy Outlook2 Elgowainy et. Al., 2016. Cradle-to-Grave Lifecycle Analysis of U.S. Light Duty Vehicle-Fuel Pathways. Argonne National Lab.
Hydrogen R&D Cost* Target
Full Production
H2 R&D Cost Target2025 Ultimate
H2 R&D Cost Target $7/gge <$4/gge
Reference year $ 2016$ 2016$
Reference gasoline mid-size vehicle ICEV HEV
Reference fuel Gasoline Gasoline
Cost of gasoline (untaxed)1 $1.70-5.60/gge $1.70-5.60/gge
Vehicle fuel on-road fuel economy2 30-39 mi./gge 44-60 mi./gge
FCEV on-road fuel economy2 62-87 mi./gge 62-87 mi./gge
FCEV incremental cost vs ICEV2 $0.00-0.03/mi.
FCEV incremental cost vs HEV2 $0.00-0.04/mi.
Preliminary
*Dispensed, untaxed
Assumptions

14U.S. DEPARTMENT OF ENERGY OFFICE OF ENERGY EFFICIENCY & RENEWABLE ENERGY FUEL CELL TECHNOLOGIES OFFICE
Identified H2 Low Volume Cost Status and Targets
$0
$2
$4
$6
$8
$10
$12
$14
$16
$18
Hydr
ogen
Cos
t, $/
gge
Hydrogen Production & Delivery Low Volume Cost Status, Current Selling Price and Targets
Selling Price
Cost status 2025 H2Cost Target
Ultimate H2Cost Target
1 – Draft Record 11007 Hydrogen R&D Cost Target2 - Record 15012 Low-Volume Early-Market Hydrogen Cost Target3 – California Air Resources Board AB 8 publication 2018
1
2
3
1
Assumptions
• Hydrogen central production is assumed
o Delivery by gaseous or liquid truck within 200 miles at volumes of 500-1000 kg/month.
o Production cost based on actual costs provided by industrial gas suppliers and end users.
• Hydrogen cost for compression, storage and dispensing is based on the results from H2FIRST Station Design Report.
• $15-$16.80/gge. is current selling price range for retails stations in CA (12/2017).

15U.S. DEPARTMENT OF ENERGY OFFICE OF ENERGY EFFICIENCY & RENEWABLE ENERGY FUEL CELL TECHNOLOGIES OFFICE
Identified Cost Savings of Higher FC Efficiency
Maximum Cost Saving Benefits Occur for Fuel Cell Systems Designed for ~60 to 62% Peak Efficiency
• For H2 cost of $16/gge, breakeven is close to 64% peak efficiency.
• By achieving H2 cost target of $4/gge, breakeven is ~63% peak efficiency.Net savings @ $16/gge
Results shown for midsize sedan Source: ANL
Preliminary
16U.S. DEPARTMENT OF ENERGY OFFICE OF ENERGY EFFICIENCY & RENEWABLE ENERGY FUEL CELL TECHNOLOGIES OFFICE
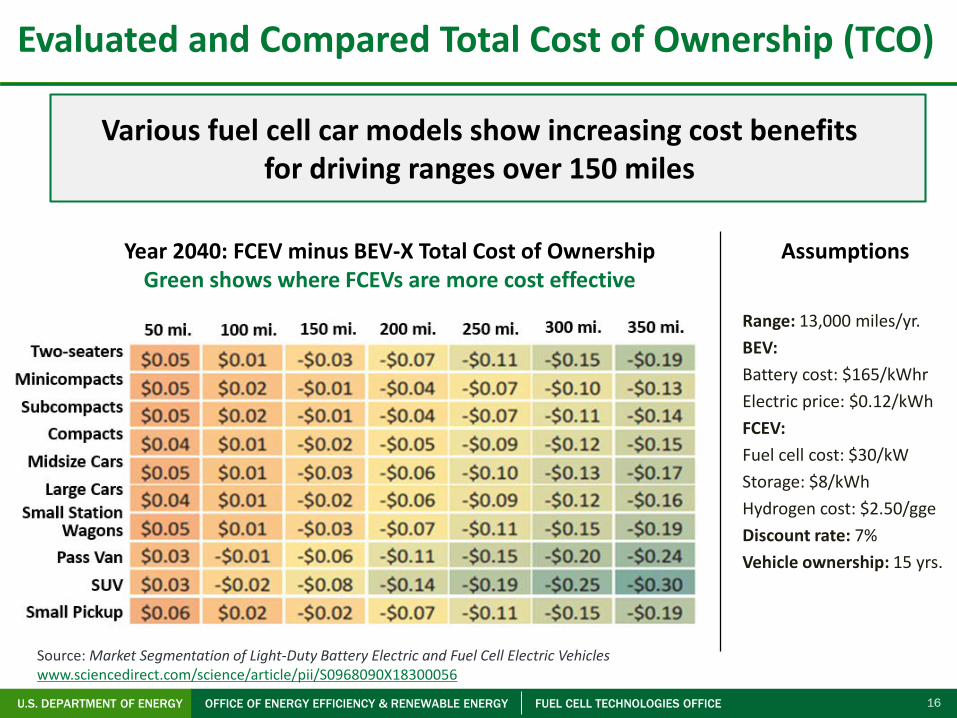
Evaluated and Compared Total Cost of Ownership (TCO)
Year 2040: FCEV minus BEV-X Total Cost of OwnershipGreen shows where FCEVs are more cost effective
Assumptions
Range: 13,000 miles/yr.BEV:Battery cost: $165/kWhrElectric price: $0.12/kWhFCEV:Fuel cell cost: $30/kWStorage: $8/kWhHydrogen cost: $2.50/ggeDiscount rate: 7%Vehicle ownership: 15 yrs.
Source: Market Segmentation of Light-Duty Battery Electric and Fuel Cell Electric Vehicles www.sciencedirect.com/science/article/pii/S0968090X18300056
Various fuel cell car models show increasing cost benefits for driving ranges over 150 miles

17U.S. DEPARTMENT OF ENERGY OFFICE OF ENERGY EFFICIENCY & RENEWABLE ENERGY FUEL CELL TECHNOLOGIES OFFICE
Initiated H2@Scale Analysis
*Illustrative example, not comprehensiveSource: NREL
LBNL
Initial Step (Complete)• Identify potential demand• Examine supply resources• Identify impact potential• Identify infrastructure issues
In-depth Analysis (FY17-18)• Evaluated H2 price requirements• Identified supply options and costs• Examined 3 scenarios• Performed stage-gate review
Additional analysis (FY18)• Evaluated regional scenarios• Examined economic inertia and externalities• Performed spatial analysis
Example of Activities
18U.S. DEPARTMENT OF ENERGY OFFICE OF ENERGY EFFICIENCY & RENEWABLE ENERGY FUEL CELL TECHNOLOGIES OFFICE
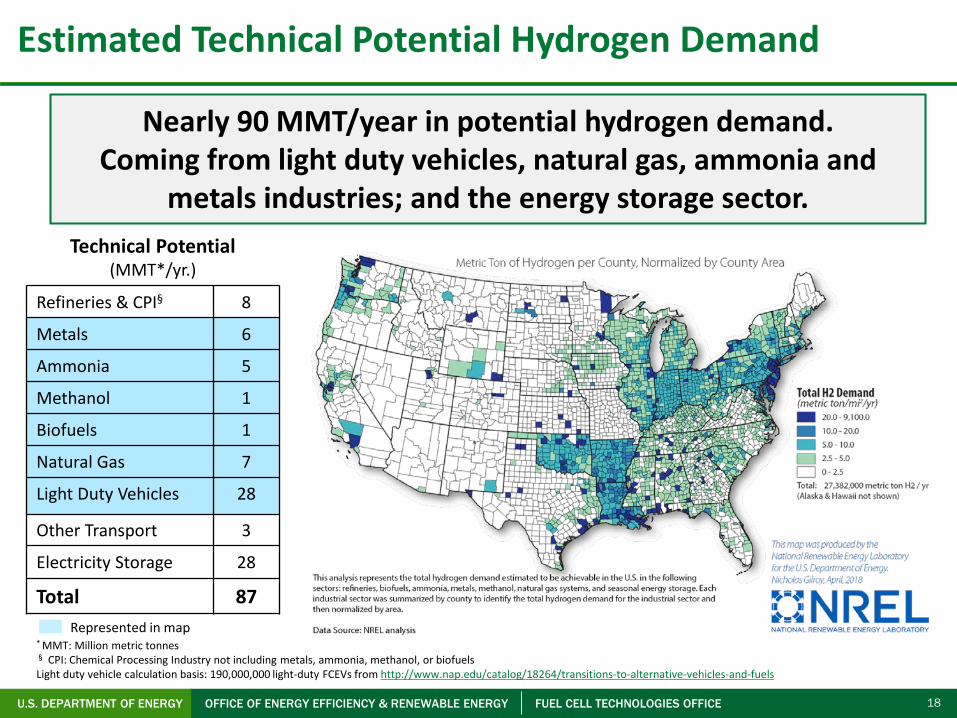
Estimated Technical Potential Hydrogen Demand
Nearly 90 MMT/year in potential hydrogen demand. Coming from light duty vehicles, natural gas, ammonia and
metals industries; and the energy storage sector.
Refineries & CPI§ 8
Metals 6
Ammonia 5
Methanol 1
Biofuels 1
Natural Gas 7
Light Duty Vehicles 28
Other Transport 3
Electricity Storage 28
Total 87
* MMT: Million metric tonnes§ CPI: Chemical Processing Industry not including metals, ammonia, methanol, or biofuelsLight duty vehicle calculation basis: 190,000,000 light-duty FCEVs from http://www.nap.edu/catalog/18264/transitions-to-alternative-vehicles-and-fuels
Technical Potential (MMT*/yr.)
Represented in map

19U.S. DEPARTMENT OF ENERGY OFFICE OF ENERGY EFFICIENCY & RENEWABLE ENERGY FUEL CELL TECHNOLOGIES OFFICE
Integrated H2 Delivery and On-Board Storage Analysis
700 bar Metal Hydride (low-t)
MOF
Delivery & Dispensing Cost [2016$/kg H2]
H2 Delivery/MOF Onboard storage system
• Delivering LN2 for onsite cooling is EXPENSIVE
• Future work: Consider LH2 pathway for MOF
H2 Delivery/Metal Hydride Onboard storage system
• Potential to reduce the delivery/storage costs
Findings (Preliminary)
Assumptions:1000 kg/day station Capacity, 0.8 Capacity factor, 20 bar H2 supply, 4 dispensers
Coordinated approach allows to identify issues associated with coupling refueling infrastructure options with onboard storage technologies

20U.S. DEPARTMENT OF ENERGY OFFICE OF ENERGY EFFICIENCY & RENEWABLE ENERGY FUEL CELL TECHNOLOGIES OFFICE
Recent and Upcoming Activities Summary
FY 2018 Emphasis:
- Early-stage and infrastructure R&D
- Life-cycle analysis of cost, petroleum and water use
- Program impacts on energy security and prosperity
- Sustainability Framework and FCTO metrics
FY 2018 – 2019 Activities:
- Identify gaps and drivers for early stage infrastructure R&D
- Assess early stage R&D impact on energy security
- Integrate analysis to ensure optimization
- Assess targets and metrics for medium and heavy duty trucks
- Conduct H2@scale analysis

21U.S. DEPARTMENT OF ENERGY OFFICE OF ENERGY EFFICIENCY & RENEWABLE ENERGY FUEL CELL TECHNOLOGIES OFFICE
Collaborations span national and international entities
EXTERNAL INPUT• H2USA• CAFCP• HTAC• NRC• AMR
DOE-EERE
Systems Analysis Activities
NATIONAL LABS• Analysis Support • Model Development and
Support
FCTO Program Areas
IndustryOEMs
Domestic & International
Industrial Gas Companies
USDRIVE Tech Teams
OTHER EERE OFFICES• VTO• BETO• Renewables
Collaboration• Canada• China• DOD/VA
22U.S. DEPARTMENT OF ENERGY OFFICE OF ENERGY EFFICIENCY & RENEWABLE ENERGY FUEL CELL TECHNOLOGIES OFFICE
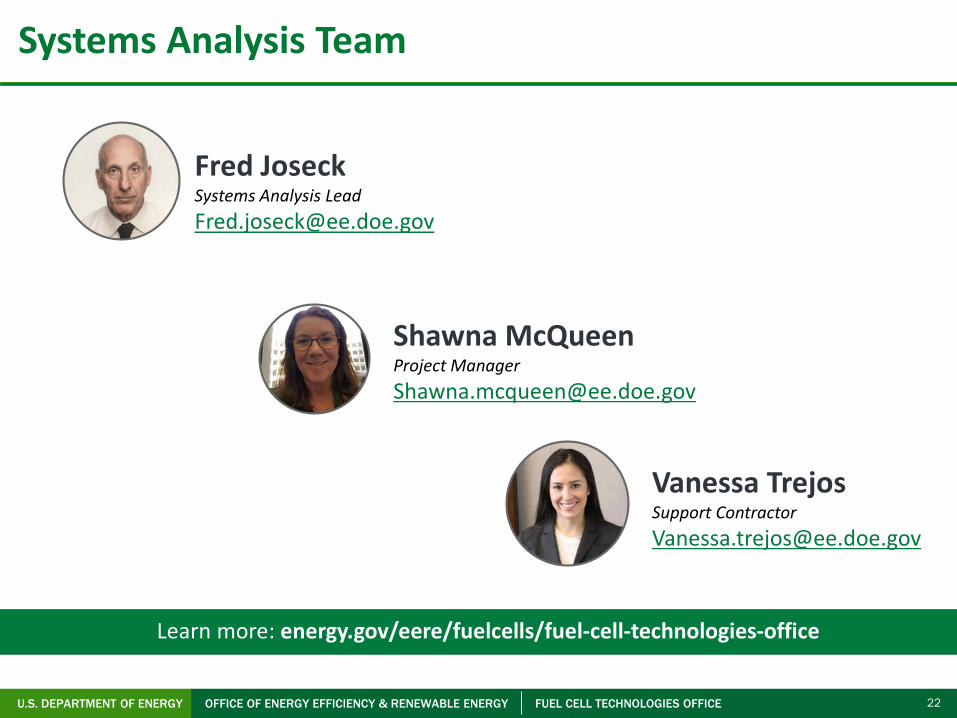
Systems Analysis Team
Vanessa TrejosSupport [email protected]
Shawna McQueenProject [email protected]
Fred Joseck Systems Analysis [email protected]
Learn more: energy.gov/eere/fuelcells/fuel-cell-technologies-office