synthetic indicators of quality of subjective life in the
TRANSCRIPT

Prague Economic Papers, 2021, 30 (5), 529–551, https://doi.org/10.18267/j.pep.783 529
SYNTHE TIC INDICATORS OF QUALIT Y OF SUBJEC TIVE LIFE IN THE EU: RUR AL AND URBAN AREAS
María-Carmen Sánchez-Selleroa , Beatriz García-Carroa , Pedro Sánchez-Sellerob
Abstract1
The aim of this paper is to develop subjective synthetic indicators that quantify the quality of life in the different countries of the EU-28, with data from the 2016 European Quality of Life Survey (EQLS). We add other indicators to the general synthetic ones in order to quantify the different dimensions of quality life due to its multidimensional nature. The successive but unchained application of the principal component analysis and the Mazziota-Pareto analysis allows us to classify 5 dimensions of quality of life: subjective component of governance, public services, environment, general satisfaction with life, and socioeconomic issues. We verify that countries with the lowest or highest positions in the general index usually keep that position in most dimensions. The spatial perspective is fundamental to study of regional development. For this reason, the next objective is the analysis of differences by spatial location using the variance analysis. The general indicator shows significant differences between EU countries but it does not show differences in the quality of life of European citizens in urban and rural areas.
Keywords: Quality of life, European Union, subjective indicators, aggregation methods, spatial dimension, satisfactionJEL Classification: I31, C42, C51, F01
1. Introduction
The quality of life is an issue that continues to generate intensive debate. Not all eco- nomists are willing to accept the subjective view of quality of life and, therefore, some are unwilling to consider other determinants beyond the strictly economic ones. Although
a Department of Economy, Faculty of Economics and Business Administration, A Coruña, University of A Coruña, Spain
b Department of Business Administration, School of Engineering, Zaragoza, University of Zaragoza, Spain
Email: [email protected], [email protected], [email protected]

Prague Economic Papers, 2021, 30 (5), 529–551, https://doi.org/10.18267/j.pep.783530
the concept of quality of life and its measurement encompasses multiple points of view and interpretations, it has kept an economic view from the beginning.
There is a growing recent interest in the EU based on the idea that citizens’ perceptions about themselves do not necessarily agree with the quantitative measurements of some socioeconomic variables. In this context, the Stiglitz-Sen-Fitoussi Report (2009) emerged as an initiative aimed at improving the measurements of the state of the economy and social welfare. The report proposed to complement the information provided by objective indicators of quality of life with subjective measurements.
The result of this proposal was an increase in empirical studies focusing on the multi-dimensional approach to quality of life; see Deutsch and Silber (2005), Matarrita-Cascante (2010), Potter et al. (2012), Ihsan and Aziz (2019). However, this multidimensional approach entails theoretical problems related to the incorporation of dimensions and indicators that adequately represent each dimension; this issue often depends even on the availability of statistics. In addition, it generates statistical problems in order to get the best way to combine these indicators into a synthetic indicator.
Subjective measurements are included to understand citizens’ perceptions in different areas of their lives and considering the multidimensional approach to quality of life. We propose to analyse these indicators, knowing that these measurements are more important as time goes by.
On the other hand, we are interested in finding out whether spatial location has an influence on these indicators. Sánchez et al. (2018) conclude that public policies must take into account that time and space are important in terms of quality of life. Our interest lies in seeking arguments for or against the role of localization of these indicators. Therefore, we propose the following hypotheses:
H1: Choice of subjective indicators of quality of life in EU-28 in 2016 and proposal of a general synthetic indicator following the Mazziotta-Pareto (IMP) grouping methodology.
H2: Obtaining different dimensions of quality of life using the grouping methodology of principal component analysis (PCA). Proposal of a synthetic indicator for each dimension from the integrating variables of each grouping following the Mazziota-Pareto grouping system.
H3: Proposal of radial charts for EU-28 countries that establish the position of each of them in each dimension.
H4: Analysis of the significant differences by spatial location in the general IMP and in the IMP by dimensions.
Figure 1 shows the steps that we will follow to carry out the four hypotheses.

Prague Economic Papers, 2021, 30 (5), 529–551, https://doi.org/10.18267/j.pep.783 531
Figure 1: Methodological summary
Source: Own elaboration
We use the 2016 European Quality of Life Survey to carry out our hypotheses. Our aim is to provide an overview of the quality of life in EU-28 countries, using subjective indicators that reflect the living conditions of European citizens. Our contribution is the successive but not chained application of two different methods of aggregation (principal component analysis and Mazziotta-Pareto analysis). Sánchez-Sellero and García-Carro (2019) link two grouping systems, apply the Mazziota-Pareto analysis to the factors obtained from the principal component analysis, and study the quality of life through subjective and economic indicators. First, we apply Mazziota-Pareto methodology to a set of individual indicators in order to obtain a general synthetic indicator; and then, we apply the same technique to several subsets of indicators that represent different dimensions of quality of life, known after the application of the PCA technique. Although these statistical techniques have already been used individually by other authors in previous papers on quality of life, this same sequential combination of both procedures, which leads us to obtain dimensional synthetic indicators, has not been carried out.
Mazziota-Pareto

Prague Economic Papers, 2021, 30 (5), 529–551, https://doi.org/10.18267/j.pep.783532
We only include subjective indicators and we use the principal component analysis (PCA) only as a source of information, that is, to know what variables integrate each dimension. After that, we calculate the synthetic indicator of Mazziota-Pareto (IMP) with them. Finally, we use variance analysis techniques to study whether there are significant differences in the quality of life according to the spatial dimension. Our aim is to study whether subjective quality of life is significantly different between EU countries and between rural and urban areas of Europe. The spatial perspective is essential for addressing regional development.
The structure of the paper is as follows. Section 2 makes a literature review; Section 3 presents the models; Section 4 shows and analyses the results. The final section concludes.
2. Literature Review
There are objective indicators (income, financial situation, etc.) and subjective indicators (satisfaction with life, satisfaction with education, etc.) of the quality of life in a country. Many authors study quality of life from both points of view. Also, they explain the reasons for choosing ones against others. As Hajiran (2006) says, with the exception of the economic field, all others are intangible variables that are not the objective measurement of most economists.
Over the last decades, the European Statistical System has developed statistics and indicators to measure social progress and sustainable development. Initially, the mea- suring instruments hardly contained questions on subjective issues. Time has led to the es- tablishment of a first set of indicators about quality of life and well-being and a new instrument, which is the EU-SILC 2013 ad hoc module to measure subjective well-being (De Smedt, 2013).
The study of subjective well-being has been of growing interest in academic and research media. According to Bárcena-Martín et al. (2017), subjective well-being is used in psychology to refer to the individual evaluation of the intensity that a person experiences in terms of positive and negative affection, happiness or life satisfaction. From this perspective, material and objective indicators may be necessary, but not sufficient, elements to explain the subjective well-being of people and countries. Hence, quality of life is a set of hopes, expectations, needs and ultimately, people’s values. The analysis of Vladisavljević and Mentus (2018) reveals that life satisfaction is more related to material living conditions, such as income, unemployment and housing conditions, while subjective well-being is more related to non-material indicators such as perceived health, personal security and social connections.
We try to understand citizens’ perceptions and therefore consider the field of sat- isfaction, confidence and valuations that European inhabitants (EU-28) make in different aspects of their personal lives and their economic, political and social environment.

Prague Economic Papers, 2021, 30 (5), 529–551, https://doi.org/10.18267/j.pep.783 533
Although one of the variables that are introduced in this paper is difficulty reaching the end of the month, it is a variable that quantifies an economic position from a personal assessment, and can therefore be classified as subjective. Bárcena-Martin et al. (2017) state that the key determinant of subjective well-being is income, which represents people’s resources. A review of the relationship between income and subjective well-being is found in Clark et al. (2008). Decancq et al. (2015) consider that individual well-being depends not only on income, but also on other dimensions of life, such as health, the quality of social and environmental relations, employment and job satisfaction. Rojas (2010) considers that if it is good to worry about removing people from income poverty, it is even better to worry about placing them in a situation that increases their satisfaction with life.
Quality of life studies in EU countries are found by Hombrados-Mendieta et al.(2013) in Spain and Ferrara and Nisticò (2019) in Italy. There are studies referring to a group of countries (Santacreu et al., 2016), to the OECD group of countries (Decancq, 2017), or to the set of countries of the European Union (Ivaldi et al., 2016; Rogge and Van Nijverseel, 2019), among others.
As broader context, Diener et al. (2015) propose to consider the National Welfare Accounts in order to complement the existing economic and social indicators that reflect the quality of life in countries. Therefore, subjective wellbeing accounts can help decision makers evaluate policies that improve societies beyond economic development. In this sense, the findings of Navarro and Sánchez (2018) underline the impact of public policies on non-economic factors that determine the well-being of citizens.
The spatial dimension information is crucial to obtain a stronger representation of territorial reality and perceptions within the territory, serving to inform decisions about spatial planning and policy formulation (Trogu and Campagna, 2018). Covas et al. (2017) design a procedure in the space field for the evaluation of citizen satisfaction regarding their urban quality of life based on perception indicators. This allows governments to havea support and feedback tool to make decisions. Sánchez et al. (2018) show in a region of Spain that the quality of life in a municipality is explained by the quality of life of the municipality in the previous period and the changes in the quality of life in neigh-boring municipalities in the past and nowadays. Therefore, public policies must take into account that time and space are important in terms of quality of life.
3. Methodology
3.1 Data and variables
We use variables to measure the subjective quality of life from the European Quality of Life Survey (EQLS) database. This quadrennial survey provides information from 2003

Prague Economic Papers, 2021, 30 (5), 529–551, https://doi.org/10.18267/j.pep.783534
to 2016 and it is primarily interested in subjective issues such as people’s level of happiness, satisfaction with their lives and their environment, perceptions about the quality of their society, trust in public institutions, etc. In addition, it also includes information about employment and incomes, and the EQLS indicators provide information complementary to the traditional indicators of economic growth and living standards such as GDP and incomes.
Survey information, including questionnaires and technical reports, is from the Euro- pean Foundation for the Improvement of Living and Working Conditions (Eurofound1). Eurofound’s approach recognizes that quality of life is a broader concept than living conditions and refers to general well-being of people in a society. For this reason, the results of any research based on this survey should take into account public policy decisions, as it shows personal, social and environmental factors of progress and well-being at both European and national levels. This survey was used by Drobnič et al. (2010), Zagorski et al. (2014) and Delhey and Dragolov (2016), among others.
In a study on quality of life, it is difficult to decide the indicators that assess the per- ceptions and satisfactions of individuals in the many areas or dimensions that are included in this concept. It is not easy to opt for an aggregation method that is free of subjectivity in order to normalize the indicators and choose the weights. So, the results may be conditioned by the decisions of the analyst.
We consider microdata on 28 Member States (EU-28) in 2016. We use a data sam- ple collected for each household member randomly selected from a multistage, stratified random sample of households in each country. The selected indicators that allow us to quantify the subjective quality of life are: (I1) satisfaction with life, (I2) feeling of happiness, (I3) satisfaction with education, (I4) satisfaction with the standard of living, (I5) satisfaction with accommodation, (I6) satisfaction with family life, (I7) satisfaction with the local area, (I8) satisfaction with democracy, (I9) satisfaction with economy, (I10) difficulty making ends meet, (I11) quality of health services, (I12) quality of education system, (I13) quality of public transport, (I14) quality of state pension system, (I15) trust in parliament, (I16) trust in legal system and (I17) trust in government.
For the indicators that evaluate the satisfaction, qualities and confidence, participants were asked to rate their opinions on a scale of 10 points ranging from 1 (very dissatisfied, poor quality or total distrust, respectively) to 10 (very satisfied, high quality or full confidence). The difficulty reaching the end of the month is valued in 6 points, from 1 (very easily) to 6 (with great difficulty).
1 We can read on its website (Eurofound 2021): “The European Foundation for the Improvement of Living and Working Conditions (Eurofound) is a tripartite European Union Agency, whose role is to provide knowledge to assist in the development of better social, employment and work-related policies. Eurofound was established in 1975 by Council Regulation (EEC) No. 1365/75 to contribute to the planning and design of better living and working conditions in Europe.”

Prague Economic Papers, 2021, 30 (5), 529–551, https://doi.org/10.18267/j.pep.783 535
3.2 Creation of synthetic indicators
In recent years, different methodologies have been developed to obtain synthetic indi- cators for multidimensional phenomena. The advantage of these indicators is offering a unique global measure that allows a simple way to evaluate objectives and facilitate the interpretation of a lot of starting information. However, these indicators are not exempt from criticism and discussion. On the one hand, the selection of the individual indicators that should be included in a system is not unified, and on the other, the statistical procedure that allows the aggregation of these indicators is not unified.
There is a lot of literature with different methodologies for synthetic indicators; see, e.g., Somarriba and Pena (2009), Giambona and Vassallo (2014), Guardiola and Picazo-Tadeo (2014), Rogge and Van Nijverseel (2019). We respond to the first hypothesis of the study with the development of a general synthetic indicator of the quality of life in the 28 EU countries using the aggregation proposed by Maziotta-Pareto.
This methodology has already been used to measure other multidimensional social phenomena, such as in the field of well-being (Davino et al., 2018), quality of life (Mazziotta and Pareto, 2012), poverty and development (De Muro et al., 2011). Among its advantages, it allows the aggregation of indicators with different units of measurement and with different variability. The optimal values considered for the analysis are arbitrary, easy to calculate and easy to interpret for results.
The IMP method standardizes indicators, followed by their subsequent aggregation in order to calculate synthetic indicators. With the standardization, we obtain indicators independent of their units of measurement and their variability. In contrast, the aggregation produces a synthetic indicator based on the assumption that the standardized indicators are not substitutable among themselves and all have the same relevance to explain the phenomenon. Therefore, the synthetic indicator is an arithmetic mean of standardized indicators, introducing a penalty factor that reflects the variability of each of the indicators in each country.
We start from the matrix I = {Iij}, where i is each of the rows that represents the 28 countries and adding one more row that corresponds to the EU-28 total, and j is each of the columns that represent the individual indicators. We calculate mean and standard deviation of each j indicator, values denoted by MIij and SIij .We obtain the normalized matrix Z = {Zij}, where each of the j normalized indicators has an average of 100 and a standard deviation of 10, being:
100 10 1, 2, ..., ij j
ijj
I MIZ j m
SI
(1)
The sign ± depends on the relationship of the j indicator with quality of life.

Prague Economic Papers, 2021, 30 (5), 529–551, https://doi.org/10.18267/j.pep.783536
Once we normalize the indicators, we scale them again so that for each j indicator the value of the total for the EU-28 is 100, obtaining:
100 ij ij TjR Z Z (2)
where ZTj is the normalized value of the j indicator for the EU-28 total.
Subsequently, we perform the aggregation of the j re-scaled indicators; for this purpose, we calculate for each of the countries the mean, the standard deviation and the coefficient of variation, which are denoted by MRi , SRi and CVi respectively.
2
1 1 m m
ij ij ij j ii i i
i
R R MR SRMR SR CV
m m MR
(3)
Finally, the synthetic indicator for each country is obtained with a linear aggregation, but adding a penalty factor to the arithmetic mean of the re-scaled values of each country, which takes into account the variability of the results within the country. Therefore, we define the IMP as follows:
21 i i i i i iIMP MR CV MR SR CV (4)
The sign of the penalty, ± SRi × CVi depends on the type of phenomenon measured by the synthetic indicator, that is, if the phenomenon is positive as in our case, the quality of life, the sign is positive, because increases in the synthetic indicator correspond to positive variations in the quality of life.
The IMP provides for each EU-28 country a figure that summarizes all the information contained in the individual indicators. The problem is that this figure is not valid to evaluate the different dimensions that comprise quality of life. These dimensions can provide very useful information for comparing homogeneous aspects within the EU countries. Therefore, we apply a PCA analysis to the individual indicators in order to satisfy hypothesis H2, which will allow us to group the indicators into different dimensions.
Specifically, this aggregation technique performs a linear transformation on the sub- jective indicators of the quality of life that are usually correlated with each other, to convert them into a smaller number of uncorrelated and orthogonal factors, whose variances are progressively decreasing. However, we do not use the PCA factors, but this statistical technique will indicate how to group the 17 subjective indicators of quality of life into subgroups that represent homogeneous dimensions as in O’Rourke and Hatcher (2013). We apply the Varimax rotation procedure, and the criterion for determining the number of extracted factors is the percentage of the total variability explained by them, whose value must be greater than 70%.

Prague Economic Papers, 2021, 30 (5), 529–551, https://doi.org/10.18267/j.pep.783 537
Subsequently, for each dimension we obtain an IMP indicator. The information provided by these synthetic indicators will be represented through radial graphs, our hypothesis H3, which will show the position of each of the 28 EU countries on the quality of life in the different dimensions analysed.
4. Results and Discussion
Hypothesis H1: Choice of subjective indicators of the quality of life in EU-28 in 2016 and proposal of a general synthetic indicator following the Mazziotta-Pareto (IMP) grouping methodology.
Figure 1 shows the subjective indicators that we have chosen for evaluating the qual- ity of life. We make a general synthetic indicator for the EU-28 countries with the 17 indicators and the Mazziota-Pareto grouping methodology (Column 2 of Table 1).
We can see a clear division between the EU-28 countries in general terms. Northern and Western European inhabitants show a higher quality of life than Southern and Eastern European ones. These results are similar to those obtained by Rogge and Van Nijverseel (2019).
Hypothesis H2: Obtaining different dimensions of the quality of life using the group- ing methodology of principal component analysis (PCA). Proposal of a synthetic indicator for each dimension from the integrating variables of each grouping following the Mazziota-Pareto grouping system.
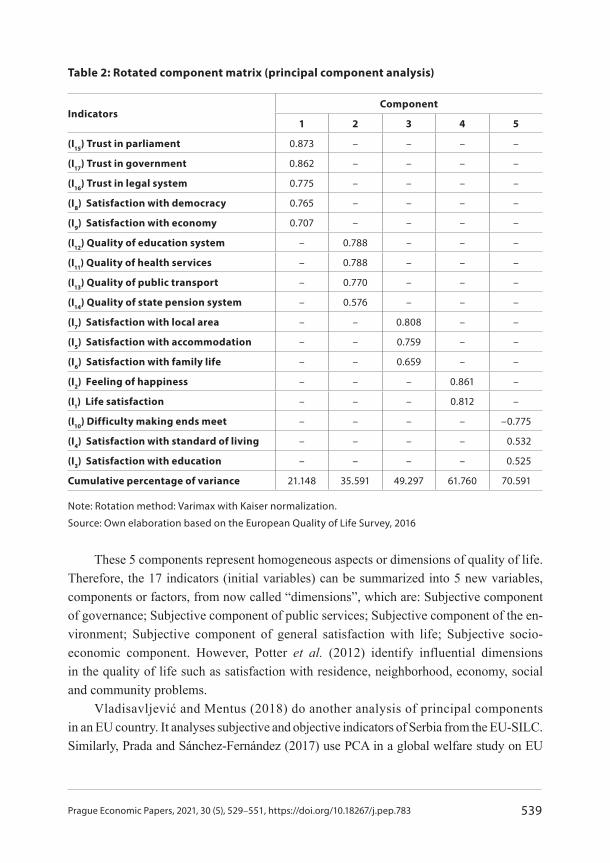
To comply with hypothesis H2, we begin by analysing the suitability of the data and the PCA method. We apply the PCA in order to make groups with the 17 initial indicators. Table 2 shows the matrix of rotated components, which shows the extraction of 5 components or factors – understanding each factor as each grouping – using the Varimax rotation system and ordering the coefficients by size. The 5 components or factors together explain 70.591% of the variance (last row of Table 2). This is an acceptable value. The values of the factorial loads or saturations in the diagonal (values always greater than 0.500) indicate the correlation of each particular indicator with the component.
Prague Economic Papers, 2021, 30 (5), 529–551, https://doi.org/10.18267/j.pep.783538
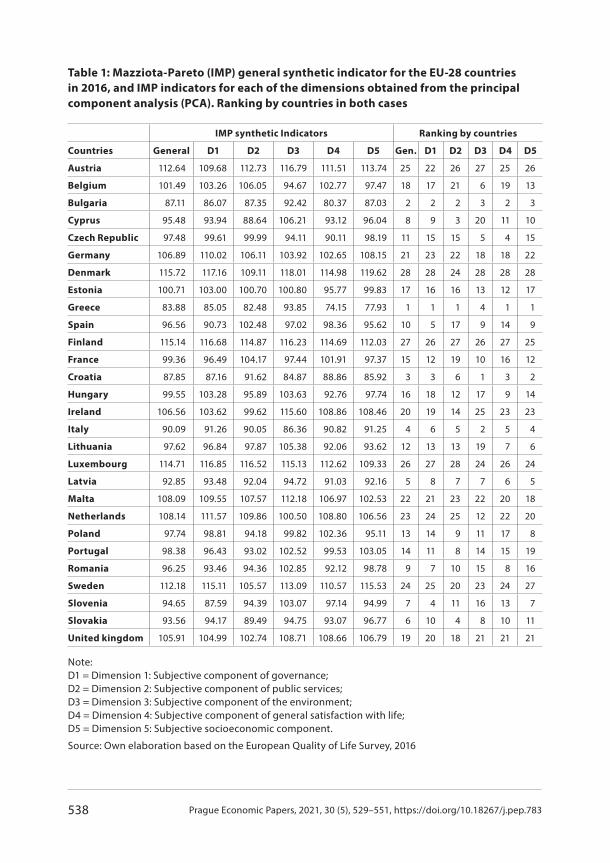
Table 1: Mazziota-Pareto (IMP) general synthetic indicator for the EU-28 countries
in 2016, and IMP indicators for each of the dimensions obtained from the principal
component analysis (PCA). Ranking by countries in both cases
IMP synthetic Indicators Ranking by countries
Countries General D1 D2 D3 D4 D5 Gen. D1 D2 D3 D4 D5
Austria 112.64 109.68 112.73 116.79 111.51 113.74 25 22 26 27 25 26
Belgium 101.49 103.26 106.05 94.67 102.77 97.47 18 17 21 6 19 13
Bulgaria 87.11 86.07 87.35 92.42 80.37 87.03 2 2 2 3 2 3
Cyprus 95.48 93.94 88.64 106.21 93.12 96.04 8 9 3 20 11 10
Czech Republic 97.48 99.61 99.99 94.11 90.11 98.19 11 15 15 5 4 15
Germany 106.89 110.02 106.11 103.92 102.65 108.15 21 23 22 18 18 22
Denmark 115.72 117.16 109.11 118.01 114.98 119.62 28 28 24 28 28 28
Estonia 100.71 103.00 100.70 100.80 95.77 99.83 17 16 16 13 12 17
Greece 83.88 85.05 82.48 93.85 74.15 77.93 1 1 1 4 1 1
Spain 96.56 90.73 102.48 97.02 98.36 95.62 10 5 17 9 14 9
Finland 115.14 116.68 114.87 116.23 114.69 112.03 27 26 27 26 27 25
France 99.36 96.49 104.17 97.44 101.91 97.37 15 12 19 10 16 12
Croatia 87.85 87.16 91.62 84.87 88.86 85.92 3 3 6 1 3 2
Hungary 99.55 103.28 95.89 103.63 92.76 97.74 16 18 12 17 9 14
Ireland 106.56 103.62 99.62 115.60 108.86 108.46 20 19 14 25 23 23
Italy 90.09 91.26 90.05 86.36 90.82 91.25 4 6 5 2 5 4
Lithuania 97.62 96.84 97.87 105.38 92.06 93.62 12 13 13 19 7 6
Luxembourg 114.71 116.85 116.52 115.13 112.62 109.33 26 27 28 24 26 24
Latvia 92.85 93.48 92.04 94.72 91.03 92.16 5 8 7 7 6 5
Malta 108.09 109.55 107.57 112.18 106.97 102.53 22 21 23 22 20 18
Netherlands 108.14 111.57 109.86 100.50 108.80 106.56 23 24 25 12 22 20
Poland 97.74 98.81 94.18 99.82 102.36 95.11 13 14 9 11 17 8
Portugal 98.38 96.43 93.02 102.52 99.53 103.05 14 11 8 14 15 19
Romania 96.25 93.46 94.36 102.85 92.12 98.78 9 7 10 15 8 16
Sweden 112.18 115.11 105.57 113.09 110.57 115.53 24 25 20 23 24 27
Slovenia 94.65 87.59 94.39 103.07 97.14 94.99 7 4 11 16 13 7
Slovakia 93.56 94.17 89.49 94.75 93.07 96.77 6 10 4 8 10 11
United kingdom 105.91 104.99 102.74 108.71 108.66 106.79 19 20 18 21 21 21
Note:D1 = Dimension 1: Subjective component of governance; D2 = Dimension 2: Subjective component of public services; D3 = Dimension 3: Subjective component of the environment; D4 = Dimension 4: Subjective component of general satisfaction with life; D5 = Dimension 5: Subjective socioeconomic component.
Source: Own elaboration based on the European Quality of Life Survey, 2016
Prague Economic Papers, 2021, 30 (5), 529–551, https://doi.org/10.18267/j.pep.783 539
Table 2: Rotated component matrix (principal component analysis)
IndicatorsComponent
1 2 3 4 5
(I15
) Trust in parliament 0.873 – – – –
(I17
) Trust in government 0.862 – – – –
(I16
) Trust in legal system 0.775 – – – –
(I8) Satisfaction with democracy 0.765 – – – –
(I9) Satisfaction with economy 0.707 – – – –
(I12
) Quality of education system – 0.788 – – –
(I11
) Quality of health services – 0.788 – – –
(I13
) Quality of public transport – 0.770 – – –
(I14
) Quality of state pension system – 0.576 – – –
(I7) Satisfaction with local area – – 0.808 – –
(I5) Satisfaction with accommodation – – 0.759 – –
(I6) Satisfaction with family life – – 0.659 – –
(I2) Feeling of happiness – – – 0.861 –
(I1) Life satisfaction – – – 0.812 –
(I10
) Difficulty making ends meet – – – – –0.775
(I4) Satisfaction with standard of living – – – – 0.532
(I3) Satisfaction with education – – – – 0.525
Cumulative percentage of variance 21.148 35.591 49.297 61.760 70.591
Note: Rotation method: Varimax with Kaiser normalization.
Source: Own elaboration based on the European Quality of Life Survey, 2016
These 5 components represent homogeneous aspects or dimensions of quality of life. Therefore, the 17 indicators (initial variables) can be summarized into 5 new variables, components or factors, from now called “dimensions”, which are: Subjective component of governance; Subjective component of public services; Subjective component of the en-vironment; Subjective component of general satisfaction with life; Subjective socio- economic component. However, Potter et al. (2012) identify influential dimensions in the quality of life such as satisfaction with residence, neighborhood, economy, social and community problems.
Vladisavljević and Mentus (2018) do another analysis of principal components in an EU country. It analyses subjective and objective indicators of Serbia from the EU-SILC. Similarly, Prada and Sánchez-Fernández (2017) use PCA in a global welfare study on EU
Prague Economic Papers, 2021, 30 (5), 529–551, https://doi.org/10.18267/j.pep.783540
countries. Also, Ihsan and Aziz (2019) use this technique in multidimensional analyses of the quality of life outside the EU.
The PCA allows us to know which variables are part of each dimension; therefore, Dimension 1 is made up of 5 variables, Dimension 2 is made up of 4 variables, and so on (see Table 2). There is quite a coherent relationship between the variables in all the dimensions. Dimension 5 is the only one related to economic aspects of citizens. We say in favour of this dimension that the grouping formed by the variables (I10) difficulties reaching the end of the month, (I4) satisfaction with the standard of living and (I3) satisfaction with education may be due to the following: education is related to economic difficulties due to more training, thus higher wages, thus lower economic difficulties. Similarly, the greater the economic difficulty, the lower the standard of living. García-Carro and Sánchez-Sellero (2019) hold that in countries whose inhabitants have greater difficulties reaching the end of the month, the satisfaction / well-being indicators are lower. This paper analyses households’ perceptions of their economic situation, measured through the difficulty reaching the end of the month. High poverty rates occur due to increases in these difficulties, which are a loss of well-being.
Once we group variables into five dimensions, we make in each of the dimensions a synthetic indicator of the subjective quality of life for each of the 28 EU countries using the IMP (see Columns 3–7 of Table 1). A general ranking of the EU-28 countries appears in Columns 8–13 of Table 1, based on the indicators calculated in the previous columns of that same table.
We can see in the ranking by countries (Table 1) that the countries that occupy the lo- west or the highest positions in the general IMP usually maintain that position in most dimensions. Specifically, Greece, Bulgaria and Croatia occupy the worst positions, while Denmark, Finland, Luxembourg, Austria and Sweden, the best. Detailing the study by dimensions, we see that the citizens of Greece have the lowest scores for government, public services, general satisfaction and economy, while the inhabitants of Denmark give the highest scores in all dimensions except in public services, corresponding to Luxembourg. Croatia is the country with the lowest synthetic indicator in local environment scores.
Sánchez-Sellero and García-Carro (2019) get similar results. Their study considers that the countries whose inhabitants are most satisfied are Denmark (general satisfaction and education), Ireland (satisfaction with residence) and Luxembourg (public governance). In similar terms, Skikiewicz and Blonski (2018) show that the highest level of satisfaction with life is in Denmark, followed by Sweden, Finland, Belgium and the Netherlands, while the lowest satisfactions correspond to Poland, the Czech Republic and Hungary. Regarding the differences between countries, Bericat (2019) holds that the EU is not a socially homogeneous reality, but that it can clearly distinguish several groups of countries: Nordic,

Prague Economic Papers, 2021, 30 (5), 529–551, https://doi.org/10.18267/j.pep.783 541
continental, Mediterranean, Central and Eastern Europe, and the Balkans. The awareness of the diversity of the five Europes is the only way to represent the multiple social realities of nations and regions of Europe, without thinking of a homogeneous political community and without differences.
Hypothesis H3: Proposal of radial charts for EU-28 countries that establish the position of each of them in each dimension.
We make radial charts since this type of representations allows us to include a lot of information, in order to argue this hypothesis. The aim is to visualize the position of each country with respect to the total average of the EU-28 called the “Reference” value (value = 100), which corresponds in the following figures to the central circle (see Figures 2, 3 and 4). If the value corresponding to a country is higher than the reference value, then this country is in better position than the European average for that dimension. The more differences from the central value, the better the position with respect to the rest. On the contrary, if the corresponding value is lower than the reference value, then this country is in a worse position than the average. Figure 2 represents Dimensions 1 and 2, Figure 3 represents Dimensions 3 and 4, and Figure 4 represents Dimension 5.
Figure 2: Radial Dimension 1 and 2. Subjective component of governance and
Subjective component of public services
Source: Own elaboration based on the European Quality of Life Survey, 2016
AUSTRIABELGIUM
BULGARIACYPRUS
CZECH REPUBLIC
GERMANY
DENMARK
ESTONIA
GREECE
SPAIN
FINLAND
FRANCECROATIA
HUNGRIAIRELAND
ITALYLITHUANIA
LUXEMBOURG
LATVIA
MALTA
NETHERLANDS
POLAND
PORTUGAL
ROMANIA
SWEDEN
SLOVENIASLOVAKIA
UNITED KINGDOM
Dimension 1Dimension 2Reference
12011511010510095908580
HUNGARY

Prague Economic Papers, 2021, 30 (5), 529–551, https://doi.org/10.18267/j.pep.783542
Figure 3: Radial Dimension 3 and 4. Subjective component of the environment and
Subjective component of general satisfaction with life
Source: Own elaboration based on the European Quality of Life Survey, 2016
The radials graphically represent the IMP synthetic indicators (Columns 3–7) in Table 1. The representations of Dimensions 1 and 2 are quite similar (correlation co- efficient equal to 0.877), somewhat logical given the similarity between the concepts of governance (Dimension 1) and public services (Dimension 2). However, the radials have more similarities between Dimensions 4 and 5; as a result, general satisfaction with life and economic perception are the most correlated dimensions (0.913). On the contrary, Dimension 3 is the least correlated with the rest of the dimensions (0.771, 0.666, 0.773, 0.830), and therefore, a country’s position on its satisfaction with the environment is the least related to other subjective aspects of the quality of life.
AUSTRIABELGIUM
BULGARIA
CYPRUS
CZECH REPUBLIC
GERMANY
DENMARK
ESTONIA
GREECE
SPAIN
FINLAND
FRANCE
CROATIAHUNGRIA
IRELANDITALY
LITHUANIA
LUXEMBOURG
LATVIA
MALTA
NETHERLANDS
POLAND
PORTUGAL
ROMANIA
SWEDEN
SLOVENIA
SLOVAKIAUNITED KINGDOM
Dimension 3Dimension 4Reference
AUSTRIA
120
115
110
105
100
95
90
85
80
HUNGARY

Prague Economic Papers, 2021, 30 (5), 529–551, https://doi.org/10.18267/j.pep.783 543
Figure 4: Radial Dimension 5. Socioeconomic subjective component
Source: Own elaboration based on the European Quality of Life Survey, 2016
Hypothesis H4: Analysis of the significant differences by spatial location in the general IMP and in the IMP by dimensions.
The aim of this paper is not only to assess whether there are significant differences in the quality of life between the countries of the EU-28 but also to evaluate the rural-urban differences in the subjective quality of life of people in the 28 EU Member States. For this purpose, we use the variable degree of urbanization (Degurba). According to EUROSTAT, this is a classification that distinguishes three types of areas: cities (densely populated areas, at least 50% of the population lives in urban centres), suburban cities (areas of intermediate density), and rural areas (sparsely populated areas, more than 50% of the population lives in rural areas).
We make an IMP for all the countries based on the 3 location categories in order to answer hypothesis H4, that is, we obtain a general synthetic indicator of the quality of life in cities, another in intermediate locations, and finally, another in rural areas, for each of the EU-28 countries. We perform an ANOVA analysis (see Table 3), which
AUSTRIABELGIUM
BULGARIA
CYPRUS
CZECH REPUBLIC
GERMANY
DENMARK
ESTONIA
GREECE
SPAIN
FINLAND
FRANCE
CROATIAHUNGRIA
IRELANDITALY
LITHUANIA
LUXEMBOURG
LATVIA
MALTA
NETHERLANDS
POLAND
PORTUGAL
ROMANIA
SWEDEN
SLOVENIA
SLOVAKIAUNITED KINGDOM
Dimension 5Reference
AUSTRIA120
115
110
105
100
95
90
85
80
HUNGARY
Prague Economic Papers, 2021, 30 (5), 529–551, https://doi.org/10.18267/j.pep.783544
allows us to find out whether the general synthetic indicator of quality of life (dependent variable) is significantly different depending on the country (effect of the first factor) and, whether this is different depending on the spatial location (effect of the second factor). Then, we repeat this process for each dimension. In this way, we propose 6 ANOVA models: one general and one for each of the 5 dimensions.
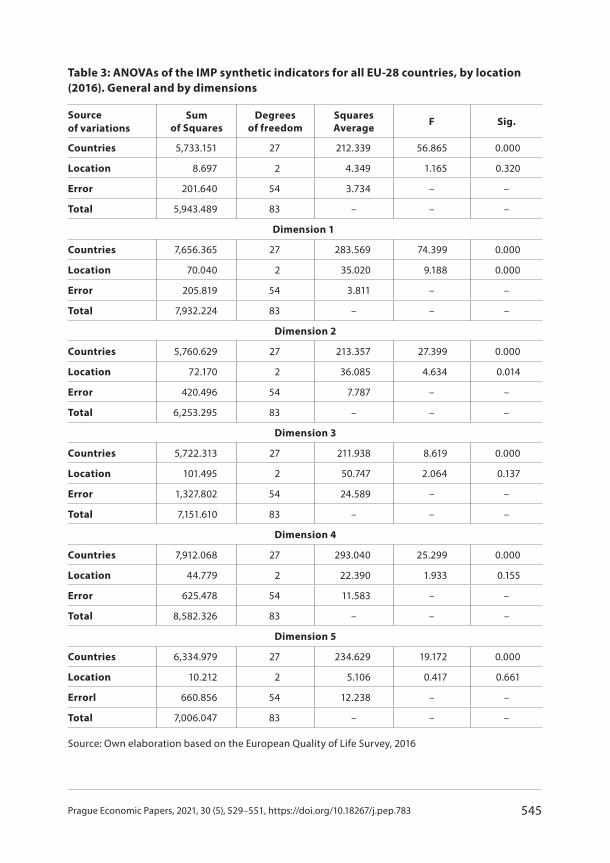
Table 3 shows the results of the ANOVAs, where the F statistics and the critical levels (Sig.) associated with each F statistic appear. The first two rows of each model collect the main effects, that is, the individual effects of the two factors included in the model: countries and location. If we did a two-factor ANOVA with several samples per group, then there would be interactions. In this case, we apply a two-factor ANOVA with a single sample per group (we obtain a single synthetic indicator of quality of life crossing each country with each location); therefore, there are no interactions and there are only the main effects of two factors: countries and location.
The general ANOVA interprets that the average IMP synthetic indicator shows signi- ficant differences between countries (Sig. = 0.000 < 0.05), because the null hypothesis of equality of means is rejected, while there are no significant differences due to spatial location (Sig. = 0.320 > 0.05). The breakdown by dimensions reveals that all the dimensions show significant differences among countries in the average IMP, so in all cases Sig. = 0.000 < 0.05, the same thing not happening in the location. There are significant differences in the average IMP indicators for the different locations in Dimensions 1 and 2(Sig. = 0.000 and Sig. = 0.014 respectively), and there are no significant differences in Dimensions 3, 4 and 5 (Sig. = 0.137, Sig. = 0.155 and Sig. = 0.661 respectively). The reason that significant differences by location are present in Dimensions 1 and 2, related to governance and public services, is easily argued since most public services are concentrated in large cities and in densely populated areas. The amount of public services increases depending on population density. Large population areas are an appropriate place for the establishment and maintenance of services such as hospitals, schools and infrastructure due to their high economic costs.
Therefore, the general indicator of subjective quality of life shows significant diffe-rences between the countries of the EU-28, but does not show significant differences between urban and rural areas. Contributions to this topic have been limited. Shucksmith et al. (2009) only find some differences between urban and rural areas in the poor countries of the south and east of the EU although these differences are not significant. Sørensen (2012) shows evidence in Denmark.
Prague Economic Papers, 2021, 30 (5), 529–551, https://doi.org/10.18267/j.pep.783 545
Table 3: ANOVAs of the IMP synthetic indicators for all EU-28 countries, by location
(2016). General and by dimensions
Source
of variations
Sum
of Squares
Degrees
of freedom
Squares
AverageF Sig.
Countries 5,733.151 27 212.339 56.865 0.000
Location 8.697 2 4.349 1.165 0.320
Error 201.640 54 3.734 – –
Total 5,943.489 83 – – –
Dimension 1
Countries 7,656.365 27 283.569 74.399 0.000
Location 70.040 2 35.020 9.188 0.000
Error 205.819 54 3.811 – –
Total 7,932.224 83 – – –
Dimension 2
Countries 5,760.629 27 213.357 27.399 0.000
Location 72.170 2 36.085 4.634 0.014
Error 420.496 54 7.787 – –
Total 6,253.295 83 – – –
Dimension 3
Countries 5,722.313 27 211.938 8.619 0.000
Location 101.495 2 50.747 2.064 0.137
Error 1,327.802 54 24.589 – –
Total 7,151.610 83 – – –
Dimension 4
Countries 7,912.068 27 293.040 25.299 0.000
Location 44.779 2 22.390 1.933 0.155
Error 625.478 54 11.583 – –
Total 8,582.326 83 – – –
Dimension 5
Countries 6,334.979 27 234.629 19.172 0.000
Location 10.212 2 5.106 0.417 0.661
Errorl 660.856 54 12.238 – –
Total 7,006.047 83 – – –
Source: Own elaboration based on the European Quality of Life Survey, 2016

Prague Economic Papers, 2021, 30 (5), 529–551, https://doi.org/10.18267/j.pep.783546
The results of the 5 dimensions show that the quality of life remains significantly different between EU countries. We observe differences related to governance and public services between urban, intermediate and rural areas. As a result, the quality of life does not show differences according to the spatial dimension besides these exceptions. Therefore, there are no significant differences in the satisfactions most linked to the personal and socio-economic environment. By contrast, there are significant differences in those related to public services and the government. This result contradicts Sørensen (2014), who showed that rural dwellers have a significantly higher life satisfaction than city dwellers when holding socio-economic factors constant.
Figure 5: General synthetic indicators. Ranking of the EU-28 countries classified in 4 scales
A: countries in lowest positionB: countries in low-middle positionC: countries in medium-high positionD: countries in highest position
Note:
Source: Own elaboration based on the European Quality of Life Survey, 2016
Prague Economic Papers, 2021, 30 (5), 529–551, https://doi.org/10.18267/j.pep.783 547
After the discussion of the stated hypotheses, we propose a chart where the different countries of the EU-28 are presented on a map classified in four scales according to the ge- neral ranking established in Table 1.
5. Conclusions
We wanted to provide an overview of the quality of life in the EU-28 countries, using subjective indicators that reflect the living conditions of European citizens. The imple-mentation of this type of subjective indicators that evaluate the quality of life is a useful tool to support governments of different countries for decision-making, and as a feedback mechanism for public opinion to evaluate the performance of their administration. This paper is important for these reasons.
We include only subjective indicators obtained from the 2016 European Quality of Life Survey (EQLS). The originality lies in the successive but not chained application of two different methods of aggregation in the construction of synthetic indicators (principal component analysis and Mazziotta-Pareto analysis). First, we apply the Mazziota-Pareto methodology to a set of individual indicators in order to obtain a general synthetic indicator. Then, we apply the same technique to several subsets of indicators that represent different dimensions of quality of life. We know these dimensions after applying the PCA technique. We only use PCA analysis as a source of information, that is, in order to know which variables make up each dimension. Previous studies on quality of life have used these statistical techniques individually, but they have not performed the same sequential combination of both procedures, which allows us to obtain dimensional synthetic indicators.
We obtain 5 components from the PCA analysis that represent homogeneous aspects or dimensions of quality of life. Therefore, the 17 indicators (initial variables) can be summarized into 5 “dimensions”, which are: Subjective component of governance; Sub- jective component of public services; Subjective component of the environment; Subjective component of general satisfaction with life; Subjective socioeconomic component.
We verify that countries with the lowest or highest positions in the general index usually keep that position in most dimensions in the ranking by countries. Specifically, Greece, Bulgaria and Croatia occupy the worst positions, while Denmark, Finland, Luxembourg, Austria and Sweden, the best. Subsequently, we transfer all the information of the IMP in the five dimensions to radial charts that allow us to include a large amount of information in a visual way. The representations of Dimensions 1 and 2 are quite similar, somewhat logical given the similarity between the concepts of governance (Dimension 1) and public services (Dimension 2). However, the radials have more similarities between
Prague Economic Papers, 2021, 30 (5), 529–551, https://doi.org/10.18267/j.pep.783548
Dimensions 4 and 5; as a result, the general satisfaction with life and economic perception are the most correlated dimensions. On the contrary, the radial of Dimension 3, of the local environment, has the lowest similarities with the rest of the radials. This result indicates that this dimension is the least correlated with the rest of the dimensions, and therefore, a country’s position regarding its satisfaction with the environment is the least related to other subjective aspects of the quality of life.
Finally, we apply statistical techniques of variance analysis to study the differences in the quality of life between EU-28 countries and between urban areas, intermediate locations and rural areas of the EU. The study in both cases is essential for addressing regional development. As a conclusion, both globally and at the level of dimensions, the subjective quality of life shows significant differences between the EU-28 countries. However, there are no differences based on the spatial dimension, except for Dimensions 1 and 2, related to governance and public services. This result is consistent with the fact that most public services are concentrated in large cities and in densely populated areas. Therefore, the quality of rural and urban life does not show differences related to the satisfaction with local environment, the general satisfaction with life and the socioeconomic component.
This paper begins by saying that there is a growing interest based on the idea that citizens’ perceptions about themselves do not necessarily agree with the quantitative measurements of some socioeconomic variables. We believe that the citizens’ feelings should be known to society, sociologists, economists, politicians in any country and the general population.
ReferencesBárcena-Martín, E., Cortés-Aguilar, A., Moro-Egido, A. I. (2017). Social Comparisons
on Subjective Well-being: The Role of Social and Cultural Capital. Journal of Happiness Studies, 18(4), 1121–1145, https://doi.org/10.1007/s10902-016-9768-3
Bericat, E. (2019). The Quality of European Societies: An Overview, in Bericat, E., Jiménez-Rodrigo, M., eds., The Quality of European Societies. Cham: Springer, pp. 27–49, https://doi.org/10.1007/978-3-030-05023-8_2
Clark, A. E., Frijters, P., Shields, M. A. (2008). Relative Income, Happiness, and Utility: An Explanation for the Easterlin Paradox and Other Puzzles. Journal of Economic Literature, 46(1), 95–144, https://doi.org/10.1257/jel.46.1.95
Covas, D., Hernández, G., López, D. M. (2017). Evaluación de la calidad de vida urbana en la ciudad de Cienfuegos desde una dimensión subjetiva. Revista Universidad y Sociedad, 9(2), 193–201.

Prague Economic Papers, 2021, 30 (5), 529–551, https://doi.org/10.18267/j.pep.783 549
Davino, C., Dolce, P., Taralli, S., et al. (2018). A Quantile Composite-indicator Approach for the Measurement of Equitable and Sustainable Well-being: A Case Study of the Italian Provinces. Social Indicators Research, 136(3), 999–1029, https://doi.org/10.1007/s11205-016-1453-8
Decancq, K. (2017). Measuring Multidimensional Inequality in the OECD Member Countries with a Distribution-sensitive Better Life Index. Social Indicators Research, 131(3), 1057–1086, https://doi.org/10.1007/s11205-016-1289-2
Decancq, K., Fleurbaey, M., Schokkaert, E. (2015). Inequality, Income, and Well-being.Handbook of Income Distribution, 2, 67–140, https://doi.org/10.1016/B978-0-444-59428-0.00003-5
De Muro, P., Mazziotta, M., Pareto, A. (2011). Composite Indices of Development and Poverty: An Application to MDGs. Social Indicators Research, 104(1), 1–18, https://doi.org/10.1007/s11205-010-9727-z
De Smedt, M. (2013). Measuring Subjective Issues of Well-being and Quality of Life in the European Statistical System. Social Indicators Research, 114(1), 153–167, https://doi.org/10.1007/s11205-013-0389-5
Delhey, J., Dragolov, G. (2016). Happier Together. Social Cohesion and Subjective Well‐being in Europe. International Journal of Psychology, 51(3), 163–176, https://doi.org/10.1002/ijop.12149
Deutsch, J., Silber, J. (2005). Measuring Multidimensional Poverty: An Empirical Comparison of Various Approaches. Review of Income and Wealth, 51(1), 145–174, https://doi.org/10.1111/j.1475-4991.2005.00148.x
Diener, E., Oishi, S., Lucas, R. E. (2015). National Accounts of Subjective Well-being.American Psychologist, 70(3), 234–242, https://doi.org/10.1037/a0038899
Drobnič, S., Beham, B., Präg, P. (2010). Good Job, Good Life? Working Conditions and Quality of Life in Europe. Social Indicators Research, 99(2), 205–225, https://doi.org/10.1007/s11205-010-9586-7
European Foundation for the Improvement of Living and Working Conditions (2018). European Quality of Life Survey Integrated Data File, 2003–2016. [data collection]. 3rd Edition. UK Data Service. SN: 7348, http://doi.org/10.5255/UKDA-SN-7348-3
European Foundation for the Improvement of Living and Working Conditions (2021). Available at: https://www.eurofound.europa.eu/es/about-eurofound/who-we-are
Ferrara, A. R., Nisticò, R. (2019). Does Institutional Quality Matter for Multidimensional Well-Being Inequalities? Insights from Italy. Social Indicators Research, 145(3), 1063–1105, https://doi.org/10.1007/s11205-019-02123-x
García-Carro, B., Sánchez-Sellero, M. C. (2019). Medición de la pobreza subjetiva en España y su localización espacial. Revista Española de Investigaciones Sociológicas, 165, 83–100, https://doi.org/10.5477/cis/reis.165.83

Prague Economic Papers, 2021, 30 (5), 529–551, https://doi.org/10.18267/j.pep.783550
Giambona, F., Vassallo, E. (2014). Composite Indicator of Social Inclusion for European Countries. Social Indicators Research, 116(1), 269–293, https://doi.org/10.1007/s11205-013-0274-2
Guardiola, J., Picazo-Tadeo, A. J. (2014). Building Weighted-domain Composite Indices of Life Satisfaction with Data Envelopment Analysis. Social Indicators Research, 117(1), 257–274, https://doi.org/10.1007/s11205-013-0346-3
Hajiran, H. (2006). Toward a Quality of Life Theory: Net Domestic Product of Happiness. Social Indicators Research, 75(1), 31–43, https://doi.org/10.1007/s11205-004-4646-5
Hombrados-Mendieta, I., García-Martín, M. A., Gómez-Jacinto, L. (2013). The Relationship between Social Support, Loneliness, and Subjective Well-being in a Spanish Sample from a Multidimensional Perspective. Social Indicators Research, 114(3), 1013–1034, https://doi.org/10.1007/s11205-012-0187-5
Ihsan, N., Aziz, B. (2019). A Multidimensional Analysis of Quality of Life: Pakistan’s Context.Social Indicators Research, 142(1), 201–227, https://doi.org/10.1007/s11205-018-1903-6
Ivaldi, E., Bonatti, G., Soliani, R. (2016). The Construction of a Synthetic Index Comparing Multidimensional Well-being in the European Union. Social Indicators Research, 125(2), 397–430, https://doi.org/10.1007/s11205-014-0855-8
Matarrita-Cascante, D. (2010). Changing Communities, Community Satisfaction, and Quality of Life: A View of Multiple Perceived Indicators. Social Indicators Research, 98(1), 105–127, https://doi.org/10.1007/s11205-009-9520-z
Mazziotta, M., Pareto, A. (2012). A Non-compensatory Approach for the Measurement of the Quality of Life, in Maggino, F., Nuvolati, G., eds., Quality of life in Italy. Dordrecht: Springer, pp. 27–40, https://doi.org/10.1007/978-94-007-3898-0_3
Navarro, M., Sánchez, Á. (2018). Ingreso y bienestar subjetivo: el efecto de las comparaciones sociales. Revista de Economía Mundial, 48, 153–178, https://doi.org/10.33776/rem.v0i48.3879
O’Rourke, N., Hatcher, L. (2013). A Step-by-step Approach to Using SAS for Factor Analysis and Structural Equation Modeling. SAS Institute.
Potter, J., Cantarero, R., Wood, H. (2012). The Multi-dimensional Nature of Predicting Quality of Life. Procedia-Social and Behavioral Sciences, 50, 781–790, https://doi.org/10.1016/j.sbspro.2012.08.080
Prada, A., Sánchez-Fernández, P. (2017). Análisis del nivel de riqueza y desarrollo social en las regiones europeas. Revista de Economía Mundial, 46, 163–190, http://doi.org/10.33776/rem.v0i46.3947
Rogge, N., Van Nijverseel, I. (2019). Quality of Life in the European Union: A Multidimensional Analysis. Social Indicators Research, 141(2), 765–789, https://doi.org/10.1007/s11205-018-1854-y
Rojas, M. (2010). Mejorando los programas de combate a la pobreza en México: del ingreso al bienestar. Perfiles latinoamericanos, 18(35), 35–59.
Prague Economic Papers, 2021, 30 (5), 529–551, https://doi.org/10.18267/j.pep.783 551
Sánchez, Á., Chica-Olmo, J., Jiménez-Aguilera, J. (2018). A Space–Time Study for Mapping Quality of Life in Andalusia During the Crisis. Social Indicators Research, 135(2), 699–728, https://doi.org/10.1007/s11205-016-1497-9
Sánchez-Sellero, M. C., García-Carro, B. (2019). Sentir o tener. Indicadores subjetivos y económicos de la calidad de vida en Europa (EU-28). Revista de Economía Mundial, 53, 157–178, https://doi.org/10.33776/rem.v0i53.4023
Santacreu, M., Bustillos, A., Fernandez-Ballesteros, R. (2016). Multidimensional/multisystems/multinature Indicators of Quality of Life: Cross-cultural Evidence from Mexico and Spain. Social Indicators Research, 126(2), 467–482, https://doi.org/10.1007/s11205-015-0906-9
Shucksmith, M., Cameron, S., Merridew, T., et al. (2009). Urban–rural Differences in Quality of Life Across the European Union. Regional Studies, 43(10), 1275–1289,https://doi.org/10.1080/00343400802378750
Skikiewicz, R., Blonski, K. (2018). Economic Sentiment Level versus the Quality of Life in European Union Member States. Prague Economic Papers, 27(4), 379–396, https://doi.org/10.18267/j.pep.658
Somarriba, N., Pena, B. (2009). Synthetic Indicators of Quality of Life in Europe. Social Indicators Research, 94(1), 115–133, https://doi.org/10.1007/s11205-008-9356-y
Sørensen, J. F. (2012). Testing the Hypothesis of Higher Social Capital in Rural Areas: The Case of Denmark. Regional Studies, 46(7), 873–891, https://doi.org/10.1080/00343404.2012.669471
Sørensen, J. F. (2014). Rural–urban Differences in Life Satisfaction: Evidence from the European Union. Regional Studies, 48(9), 1451–1466, https://doi.org/10.1080/00343404.2012.753142
Stiglitz, J. E., Sen, A., Fitoussi, J. P. (2009). Informe de la Comisión sobre la Medición del Desarrollo Económico y del Progreso Social. París. Available at: http://www. ambafrance-es. org/Informe-de-la-Comision-Stiglitz
Trogu, D., Campagna, M. (2018). Towards Spatial Composite Indicators: A Case Study on Sardinian Landscape. Sustainability, 10(5), 1369, https://doi.org/10.3390/su10051369
Vladisavljević, M., Mentus, V. (2018). The Structure of Subjective Well-Being andIts Relation to Objective Well-Being Indicators: Evidence from EU-SILC for Serbia.Psychological Reports, 122(1), 36–60, https://doi.org/10.1177/0033294118756335
Zagorski, K., Evans, M. D., Kelley, J., et al. (2014). Does National Income Inequality Affect Individuals’ Quality of Life in Europe? Inequality, Happiness, Finances, and Health. Social Indicators Research, 117(3), 1089–1110, https://doi.org/10.1007/s11205-013-0390-z