synthesis on forest bio-economy research and innovation in europe
TRANSCRIPT

Marko Lovrić and Robert Mavsar
Synthesis on forest bio-economy research and innovation in Europe
Study carried out by European Forest Institute on the behest of SCAR SWG FOREST (Strategic
Working Group on forests and forestry research and innovation)

Table of content
1. INTRODUCTION 1 2. MAPPING FOREST BIO-ECONOMY RESEARCH CAPACITIES IN EUROPE 1
2.1. Methodology 1 2.2. Data sources 3
3. RESULTS 4 3.1. Forest bioeconomy capacities 4 3.2. Results of the research activity mapping 8 3.3. Comparison of research capacities and research activity 15
4. DISCUSSION AND CONCLUSIONS 18
Appendix I. Detailed classification of topics 20 Appendix II. Detailed methodology 25 Appendix III. Additional results from the mapping of capacities in forest bioeconomy
28
Appendix IV. Additional results of from the mapping of research activities in forest bioeconomy
34
Figures and tables
TABLES Page 1. Classification of forest bio-economy 2 2. Summary of Collaborations between countries and organizations 15
FIGURES 1. Number of organizations and capacities by region 4 2. Regional research capacities by supply-chain category 5 3. Total capacity by topic 5 4. Country-level capacities by category 6 5. Capacity by population and category 6 6. Capacity by country and forest area 6 7. Capacity by country and removals 6 8. Total capacity of top 10 organizations 7 9. Financing of research activities by year 8 10. Annual total funding and number of projects by time period 8 11. EC’s funding by region and category 9 12. EC’s funding by region and topic 9 13. Change in average annual total funding through time 10 14. EC’s funding by country and category 11 15. EC’s funding in Forest systems 11 16. EC’s funding in Forest biomass & raw materials 11 17. EC’s funding in Primary processing 12 18. EC’s funding in Secondary processing 12 19. Collaboration between countries in Forest systems 13 20. Collaborations between organizations in Forest systems 13 21. Collaboration between central organizations in Forest systems 14 22. Comparison of research capacities and EC’s funding by topic 16 23. Comparison of research capacities and EC’s funding by region 17

1
1. INTRODUCTION
The EU has taken a strategic turn towards bioeconomy (EU 2020 Strategy, 2010), which has also
influenced the EU research and development orientation, by putting more emphasis on bioeconomy
related research and activities (see EU Bioeconomy strategy, 2012). To remain relevant and
competitive the European forest research should be responsive to address these structural changes.
This means that it should develop capacities and research infrastructures, which will be able to address
questions relevant in the new policy setting. Although a number of forest research capacity mapping
exercises have been conducted at EU level it remains unclear how far the bioeconomy research is
addressed in these mapping exercises.
An overall synthesis based on updated information on forest bio-economy research and innovation
covering the complete forest-based systems is thus missing for Europe. Such a synthesis would serve
several important purposes: 1) It would be an important baseline for future strategic advice and new
initiatives from the SWG to strengthen coordination in research and innovation work between the EU,
member states and stakeholders; 2) it would be of great use for alignment and for reference in the
design and framing of European and national calls within the area, and 3) it would constitute an
important strategic document in relation to the developing overall European bioeconomy strategy.
This study shall contribute to better synergies and coherence for addressing research needs in the
forest-based bioeconomy through synthesis of R&I activities. The main objective of this report is to
review and synthesize existing updated information about forest bio-economy research in different
EU member states, including (1) mapping the most relevant research capacities and topics where
activities are already ongoing at regional/national, transnational and European level using existing
data, and (2) analysing gaps and draw conclusions about overlapping and missing activities, and trends
and shifts in research focus. This report is first out of two reports contained within the study, where
the second one will focus on mapping innovations in the field and providing best-practice guidelines
for the uptake and increased success of innovations.
2. MAPPING FOREST BIO-ECONOMY RESEARCH CAPACITIES IN EUROPE
2.1. Methodology
First step in mapping forest bio-economy capacities in Europe was to define what the concept of forest
bioeconomy entails. According to the EU Bioeconomy Strategy, bioeconomy encompasses “… the
production of renewable biological resources and their conversion into food, feed, bio-based products
and bioenergy. It includes agriculture, forestry, fisheries, food and pulp and paper production as well
as parts of chemical, biotechnological and energy industries.” As such, forest bio-economy is a sub-
section of the wider bioeconomy concept. The exact scope of forest bio-economy is based on the
topics encompassed in previous mapping exercises conducted by the EU co-funded projects ERIFORE,
WOODWISDOM, FORESTERRA, INNOVAWOOD and SUMFOREST, and is based on participatory input
from five senior experts.

2
The overview of forest bio-economy classification is presented in Table 1, while sub-topics and
examples of projects in different topics are presented in Appendix I. Major themes of each mapping
exercise that fall within individual topics of the classification are presented in Appendix I, which also
contains a map of Europe with regional categorization of countries.
Table 1. Classification of forest bio-economy
CATEGORY TOPIC
1.1.Forest inventory and economics
1.2.Sustainability assessment
1.3.Forest ecosystem services
1.4.Non-wood forest products
2.1.Forest management
2.2.Tree breeding and forest biotechnology
2.3.Wood properties
2.4.Wood supply chain
2.5.Recycled wood and fibres
3.1.Wood processing
3.2.Pretreatment technologies
3.3.Pulping
3.4.Bioenergy
4.1.Construction and final wood products
4.2.Chemical conversion
4.3.Bioprocessing and biotechnology
4.4.Biopolymer processing
4.5.Fiber technologies
4.6.Other bio-based final / high value products
4.7.Biorefinery
4.8.Downstream processing
All reported national and organizational capacities in all previous mapping exercises and all reviewed
projects have been subjected to this classification. As not all countries and not all topics were
encompassed in all the reviewed mapping exercises, country-by-topic capacities have been
normalized with respect to number of mapping exercises in which a given country and topic were
present, and then scaled from 0 (no capacity) to 1 (maximum capacity, i.e. mentioned in all mapping
exercises that have encompassed that country and topic).
The data source for mapping actual funded research (proxy for research activity) in the field of forest
bio-economy was the CORDIS (Community Research and Development Information Service) database
of the European Commission (FP7 and H2020 projects). The comparison between the research
capacities and research activity would serve as a gap analysis, i.e. would reveal the potential areas of
mismatch between research capacities and actual research activity, with respect to topical and
geographical distribution. Projects in CORDIS data base have been compared to a 54-page ‘core’ forest
bioeconomy description (i.e. description of individual topics in the classification from Table 1 and of
selected project summaries), and then scaled from most similar to least similar. Individual project
summaries where then read, which resulted with selecting and classifying 387 projects. Same type of
descriptive data analysis has been performed on both data types (research capacity and activity), in
order to enable the comparison between the two. Additional descriptive collaboration analysis in
research activity has been performed, which is based on counting joint participation in projects

3
between individual organizations and countries. More detailed description of methodology is
presented in Appendix II.
2.2 Data sources
Data sources for mapping of research capacities include deliverables 1.1, 1.2, 2.1, 2.2, 3.1, 3.2, 4.1 and
4.2 of ERIFORE (http://erifore.eu/) project, from WoodWisdom (http://www.woodwisdom.net/)
project report No. 02/2006, from FORESTERRA project (http://www.foresterra.eu/) deliverable 2.4
and its data base on research capacities (http://www.foresterra.eu/tablas/investigacion.php), from
INNOVAWOOD project (http://www.innovawood.com/) its search engine of research providers
(http://77.74.50.56/ssa/default.aspx and http://www.innovawood-ssa.net/), and from SUMFOREST
(https://www.sumforest.org/) project deliverables 2.1 and 2.2. Data on FP7 and H2020 projects was
retrieved from CORDIS data base on 24.5.2017 (https://data.europa.eu/euodp/en/data/dataset),
based on Excel files both for projects and organizations.

4
3. RESULTS
3.1. Forest bioeconomy capacities
Overall, capacities in forest bioeconomy increase along the supply chain, from Forest systems (122.5
– i.e. sum of all normalized organizational capacities in this category), across Forest biomass & raw
materials (120.23), to Primary processing (210.43) and Secondary processing (204.6). As presented on
Figure 1, total research capacities increase from Southern, across Eastern and Northern to Western
Europe.
Figure 1. Number of organizations and capacities by region
Figure 1 presents the overall distribution of organisations and capacities. It is evident that Western
Europe hosts the highest number of organisations and thus it is not surprising it has the strongest
capacities. On the other hand, the rest of the regions have a similar number of organisations, but
rather big differences in capacities. For example, the number of organizations in Northern Europe is
not much smaller than their number in Eastern (60) and Southern Europe (63), but the overall capacity
is much higher than in the two other regions. The ratio between capacities and the number of
organizations in Northern Europe is 3.4, compared to 2.0 (Eastern Europe) and 1.6 (Southern Europe).
When these regional capacities are broken-down to the four supply-chain categories (Figure 2), it can
be seen that each European region has sizable capacities in each supply-chain category.
0 50 100 150 200 250 300
Western Europe
Northern Europe
Eastern Europe
Southern Europe
Total capacities No. of organizations

5
Figure 2. Regional research capacities by supply-chain category
Figure 2 also shows that both Eastern and Southern Europe have highest capacities in primary
processing, while Western and Northern Europe have highest capacities in secondary processing.
Although total capacities increase along the categories of the supply chain (Figure 1), depiction of
capacities by individual topics within those categories (Figure 3) shows that capacities by topic greatly
vary, where they are most pronounced in Pretreatment technologies (topic 3.2), followed by Forest
inventory and economics (1.1), Forest management (2.1), Wood processing (3.1) and Biopolymer
processing (4.4).
Figure 3. Total capacity by topic
0
10
20
30
40
50
60
70
80
90
100
Western Europe Northern Europe Eastern Europe Southern Europe
FOREST SYSTEMS FOREST BIOMASS & RAW MATERIALS
PRIMARY PROCESSING SECONDARY PROCESSING

6
When country-level research capacities are reviewed (Figure 4), it can be seen that this distribution is
highly uneven; Sweden, Germany, Finland, France and Spain together account for 49% of total
mapped research capacities. Although in general countries have capacities in all categories of the
supply chain, from the leading countries Germany has relatively low capacity in Primary processing
and Italy has relatively low capacity in Secondary processing.
Figure 4. Country-level capacities by category Figure 5. Capacity by population and category
Comparison of research capacities by country in the field of forest-bioeconomy should be done with
some reserve, as it does not take into consideration differences in characteristics (e.g., population
size, forest-sector importance) between individual countries. For example, by dividing total capacities
by country’s population (in millions, Figure 5), by total forest area (in millions of ha, Figure 6), and by
total removals (in millions m3, Figure 7; all based on State of Europe’s Forests 2015), we obtain a very
different image of capacities.
Figure 6. Capacity by country and forest area Figure 7. Capacity by country and removals

7
When total capacities are normalized by population size (i.e. divided by population in millions), it can
be seen that several countries with low population density (Sweden, Finland, Norway and Latvia)
present peaks in the distribution, while highly populated countries with high overall capacities
(Germany, France and Spain) are at the lower ends of distribution. Cross-country comparison looks
again different when capacities are normalized by forest area (Figure 6) and removals (Figure 7), where
countries with low forest coverage such as Netherlands, Belgium, Denmark and Ireland dominate the
distribution. When looking at which organizations have highest cumulative research capacities in the
field of forest bioeconomy (Figure 8), it can be seen that seven out of top ten organizations are located
in the Nordic countries.
Figure 8. Total capacity of top 10 organizations
This development was already indicated by the ratio of regional number of research organizations and
capacities (Figure 1). Figure 8 shows that most of the top organizations have capacities in all categories
of the supply chain. With the exception of SLU (Swedish University of Agricultural Sciences) and LUKE
(Natural Resources Institute Finland), all other top organizations have more capacities in primary and
secondary processing than in the first two categories of the supply chain classification. Additional
results from capacity mapping are presented in Appendix III.

8
3.2. Results of the research activity mapping
In total 387 projects have been identified as “forest bioeconomy research”, with 1978 participants
from 66 countries, and an overall value of 1.4 billion Euros. Figure 9 shows development in funding
and number of projects in the research field. In 2006 only ERA-NET (i.e. WOODWISDOM) projects
began, while FP7 projects started in the 2007-2015 period, and the H2020 projects started in the 2014-
2017 period. Three FP7 projects started in 2015 and two H2020 projects started in 2014.
Figure 9. Financing of research activities by year
An overall trend can be seen of increase in annual funding, and that beginning and ending year of a
framework programme have smaller number of started projects. Average EC funding rate (i.e. share
of EC’s cofunding) increased from the 2008-2014 period (67.1%) to the 2015-2017 period (74.2%),
where the average EC funding rate of the entire observed period was 69.8%.
Figure 10. Annual total funding and number of projects by time period

9
Similar to the increase of capacities along the supply chain, the total annual funding also increases
along the supply chain categories, where with the passage of time greatest increase in funding actually
occurred in the two middle categories of the supply chain (Figure 10). The number of projects during
FP7 was smaller in primary processing than in other categories, whereas in H2020 the number of
projects is very similar across all supply chain categories. Comparing funding and number of projects,
it can be stated that on average projects tend to increase in funding along the supply chain.
Figure 11. EC’s funding by region and category
Level of EC funding decreases from Western, across Northern and Southern, to Eastern Europe
(Figure 11). Similar to regional distribution of capacities, each region has capacities in each section of
the supply chain, while secondary processing is the category with highest EC funding.
Figure 12. EC’s funding by region and topic

10
The distribution of EC funding by topics (Figure 12) is very uneven; where Bioenergy (3.4), Biorefinery
(4.7), Construction and final wood products (4.1) and Sustainability assessment (1.2) have received
more than one hundred million of Euros each. It is also noticeable that on average, share of EC funding
in Western European countries for these topics is higher than for other topics.
Figure 13. Change in average annual total funding through time
When average annual project funding is split for periods that correspond to FP7 (2008-2014) and
H2020 (2015-2017), it can be seen (Figure 13) that the funding was not stable for majority of topics
throughout the observed period. The topics for which the funding has substantially increased in H2020
are Sustainability assessment (1.2), Wood supply chain (2.4) and Downstream processing (4.8), while
the topics for which the funding has substantially decreased in H2020 are Forest inventory and
economics (1.1), Forest ecosystem services (1.3), Non-wood forest products (1.4), and Wood
properties (2.3).
0 5 10 15 20 25 30 35
4.8.Downstream processing
4.7.Biorefinery
4.6.Other bio-based final / high value products
4.5.Fiber technologies
4.4.Biopolymer processing
4.3.Bioprocessing and biotechnology
4.2.Chemical conversion
4.1.Construction and final wood products
3.4.Bioenergy
3.3.Pulping
3.2.Pretreatment technologies
3.1.Wood processing
2.5.Recycled wood and fibers
2.4.Wood supply chain
2.3.Wood properties
2.2.Tree breeding and forest biotechnology
2.1.Forest management
1.4.Non-wood forest products
1.3.Forest ecosystem services
1.2.Sustainability assessment
1.1.Forest inventory and economics
Million Euros
2008-2014 2015-2017
11
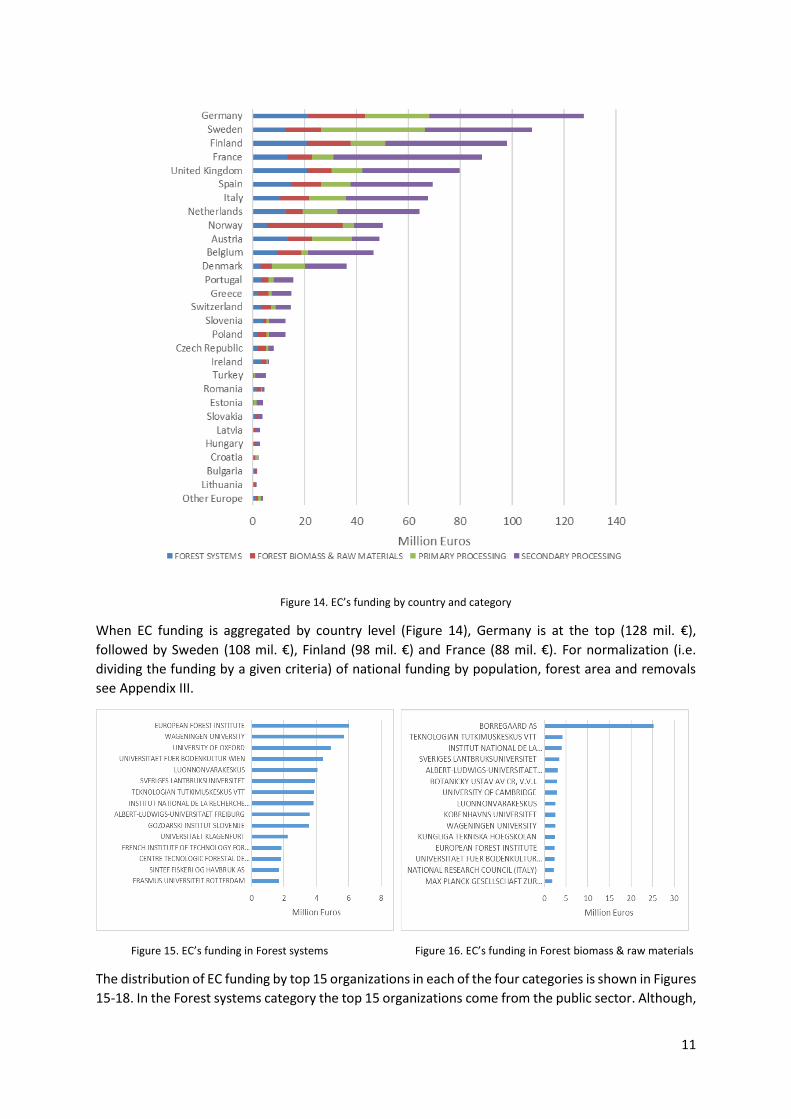
Figure 14. EC’s funding by country and category
When EC funding is aggregated by country level (Figure 14), Germany is at the top (128 mil. €),
followed by Sweden (108 mil. €), Finland (98 mil. €) and France (88 mil. €). For normalization (i.e.
dividing the funding by a given criteria) of national funding by population, forest area and removals
see Appendix III.
Figure 15. EC’s funding in Forest systems Figure 16. EC’s funding in Forest biomass & raw materials
The distribution of EC funding by top 15 organizations in each of the four categories is shown in Figures
15-18. In the Forest systems category the top 15 organizations come from the public sector. Although,

12
several organizations have received higher levels of EC funding (e.g., European Forest Institute,
Wageningen University), the distribution is rather balanced. Similar distribution can be found in the
second stage of the supply chain (Figure 16- Forest biomass & raw materials), but with one important
outlier – Borregaard, a Norwegian company that is on the top of the distribution (25.2 mil. € of EC’s
funding). This is mostly attributed to their coordination of the EXILVA (Flagship demonstration of an
integrated plant towards large scale supply and market assessment of MFC) project.
Figure 17. EC’s funding in Primary processing Figure 18. EC’s funding in Secondary processing
The domination of a single private company at the top of rather uniform funding distribution is again
present in Primary and Secondary processing (Figures 17 and 18). Overall share of EC funding allocated
to private companies is highest in Primary processing (85%), where Swedish biofuels AB received
highest level of EC’s funding (21.7 mil. €), followed by Technical Research Centre of Finland (VTT – 4.3
mil. €) and Fraunhofer Society (3.6 mil. €). The cofunding in Secondary processing is more balanced,
with private companies receiving 35% of the overall funds. CVIM (Compagnie Industrielle de la Matière
Végétale) has received highest level of EC’s funding (18.1 mil. €), mostly due to their role as
coordinators of the 2G BIOPIC (Second Generation Bioethanol sustainable production based on
Organosolv Process at atmospheric Conditions), which focuses on second-generation demonstration
plant for the production of bioethanol from agricultural residues and wood.
To describe collaboration between individual organizations and countries, organization-by-
organization matrices have been constructed for each of the four categories of the supply chain,
where values in the matrices represent number of project collaborations between two organizations.
Country-by-country matrices of collaboration have been constructed by aggregation of organization-
by-organization matrices. Layout of graphs based on country-level matrices is set by latitude and
longitude of individual countries. Layout of graphs depicting cooperation between organizations is
such that those organizations which frequently cooperate with one another are placed close to each
other, while centre of the graph is reserved for organizations which most frequently cooperate with
many other organizations. Private organizations are marked with magenta circles, while all other
organizations and countries are marked with blue squares. Size of the country’s and organizational
label as well as it symbols reflect the level of received EC’s funding. In all visualizations except the ones
that show entire inter-organizational networks, the collaboration ties are scaled both in width and
colour according to the frequency of collaboration. Only graphs for first supply chain category (Forest
systems) are presented in the main text, while all other ones are located in Appendix IV.
13
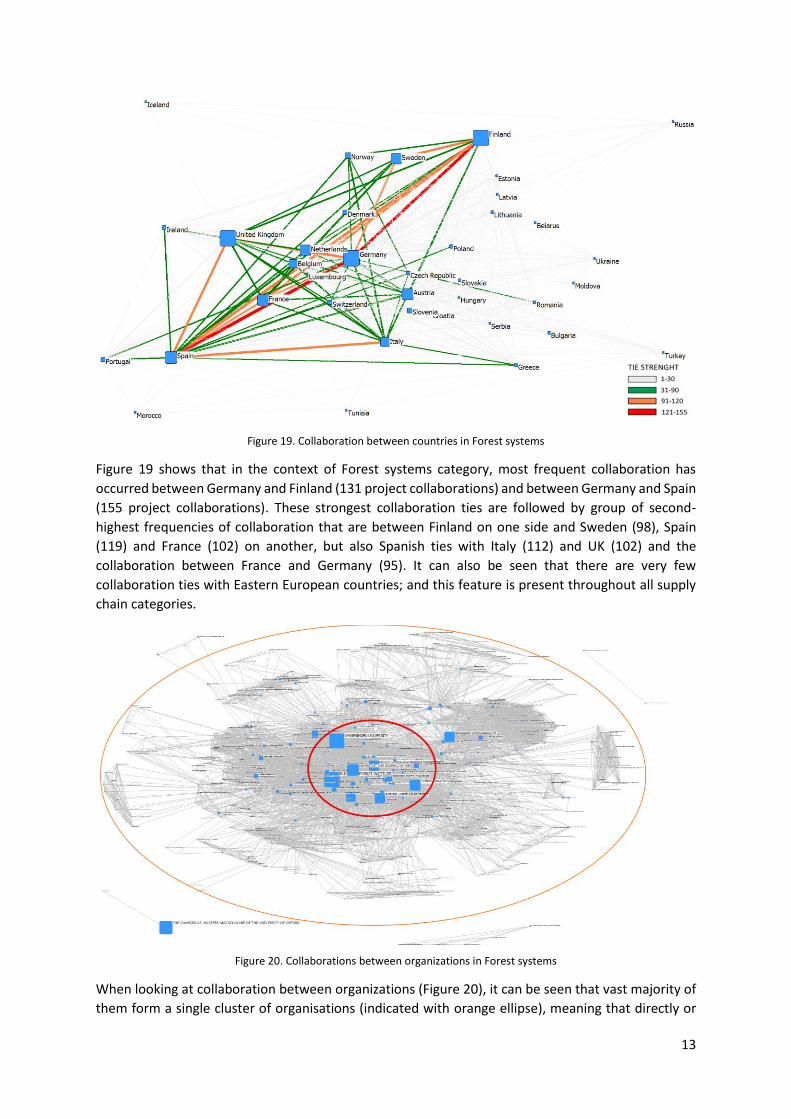
Figure 19. Collaboration between countries in Forest systems
Figure 19 shows that in the context of Forest systems category, most frequent collaboration has
occurred between Germany and Finland (131 project collaborations) and between Germany and Spain
(155 project collaborations). These strongest collaboration ties are followed by group of second-
highest frequencies of collaboration that are between Finland on one side and Sweden (98), Spain
(119) and France (102) on another, but also Spanish ties with Italy (112) and UK (102) and the
collaboration between France and Germany (95). It can also be seen that there are very few
collaboration ties with Eastern European countries; and this feature is present throughout all supply
chain categories.
Figure 20. Collaborations between organizations in Forest systems
When looking at collaboration between organizations (Figure 20), it can be seen that vast majority of
them form a single cluster of organisations (indicated with orange ellipse), meaning that directly or

14
indirectly, almost all sampled organizations have cooperated on the topic of Forest Systems. The only
organization that has received substantial EC’s funding and is isolated from the prevailing group is the
University of Oxford due to their participation in the GEM-TRAIT (The Global Ecosystems Monitoring
and Trait Study: a novel approach to quantifying the role of biodiversity in the functioning and future
of tropical forests) project – which is focused on tropical forests. It can also be seen that centre of the
Figure 20 is occupied by a large number of organizations that have received substantial amounts of
funding, and have frequently collaborated with one another (indicated with red ellipse). That part of
the inter-organizational collaboration network is presented by Figure 21.
Figure 21. Collaboration between central organizations in Forest systems
When looking only at the central cluster of organisations (Figure 21) it can be seen that pairs of
organisations that have most established collaborations are INRA (Institut national de la recherche
agronomique - National Institute of Agricultural Research) and LUKE (Luonnonvarakeskus - Natural
Resources Institute Finland); BOKU (Universität für Bodenkultur Wien - University of Natural
Resources and Life Sciences, Vienna) and LUKE; and European Forest Institute and Wageningen
University. It can also be seen that VTT has unique position, as it is the only organization in main
component that has received substantial EC’s funding, and has not frequently collaborated with any
of the other prominent organizations, but has rather established their own ‘cloud’ of collaborating
organizations. Such kind of analysis has been performed on all four supply-chain categories; where
the summary results are presented in Table 2 and all other visualizations are in Appendix IV.

15
Table 2. Summary of Collaborations between countries and organizations
CATEGORY TYPE OF
NETWORK
PRIMARY TIES
(largest number of collaborations)
SECONDARY TIES
(second-largest number of collaborations)
Countries Germany to Finland and Spain
Finland-Sweden; Finland-Spain; Sweden-
Germany; Finland-France; Spain-Italy;
Spain-UK
Organizations INRA-LUKE EFI-WAU; EFI-BOKU; BOKU-LUKE
Countries Germany to Finland
Finland-Italy; Finland-Sweden; Sweden-
Germany; Germany-Austria; Germany-Italy;
Spain-France; France-Germany; Spain-
Finland
Organizations NRC-INRA; NRC-LUKE EFI-UNF; UNF-BOKU
Countries Germany-Austria Germany-Spain; Netherlands-Finland
Organizations VTT-SLU non academic
Countries Germany-Finland; Germany-
Netherlands; Germany-France
Italy-UK-France-Sweden; Finland-France;
Netherlands-France; Belgium-France
Organizations VTT-UNIHEL; VTT-RISE; RISE-FCBA VTT-Aalto; VTT-FRAUNHOFER; VTT-LUND;
LUND-RISE
On country level, in all four categories of supply-chain classification Germany, Finland and France are
in the centre, followed by Italy, UK, Sweden, Netherlands and Spain. Same cannot be stated for inter-
organizational collaboration networks, as they differ among themselves. The role of established
forestry research organizations in the beginning of supply chain is minor in primary and secondary
processing. VTT that had small, partially separated collaboration network of its own in Forest systems
has come to dominate the collaboration network in later stages of the supply chain. Collaboration
networks in Primary processing differs from all others, as it is fragmented into ten groups of
organizations with no collaborations between them (See Appendix IV). This network is also highly
dominated by private companies, and the only collaboration between research organizations that
stands out is the one between VTT and SLU.
3.3. Comparison of research capacities and research activity
The final step of the analysis is the comparison between research capacities and research activities in
EC’s framework programmes. Topic-specific comparison between the two is presented by Figure 22,
where both capacities and research EC’s funding has been scaled from 0 to 1 (Capacity by topic has
been divided by maximum capacity attributed to a single topic, and funding by topic has been divided
by the maximum funding allocated to a single topic). Funds and capacities of private companies have
not been included in the comparison.

16
Figure 22. Comparison of research capacities and EC’s funding by topic
It can be seen that both distributions of research capacities and EC’s funding are very uneven, and
that the same can be stated on the ratio between the two for individual topics. Highest overall topic-
specific EC funding over the whole observed period is allocated to the Sustainability assessment topic
(1.2), while highest research capacities are present in Pretreatment technologies (3.2). Topics that
have significantly more funding than research capacities are: Sustainability assessment (1.2), Forest
ecosystem services (1.3), Bioenergy (3.4), Construction and final wood products (4.1), Other bio-based
/ high value products (4.6) and Biorefinery (4.7). Topics that have significantly less funding than
research capacities are Forest inventory and economics (1.1), Wood properties (2.3), Wood processing
(3.1), Pretreatment technologies (3.2), Pulping (3.3), Chemical conversion (4.2), Biopolymer
processing (4.4) and Downstream processing (4.8).
Comparison of research capacities and EC’s funding by region is presented in Figure 23.
0 0.1 0.2 0.3 0.4 0.5 0.6 0.7 0.8 0.9 1
4.8.Downstream processing
4.7.Biorefinery
4.6.Other bio-based final / high value products
4.5.Fiber technologies
4.4.Biopolymer processing
4.3.Bioprocessing and biotechnology
4.2.Chemical conversion
4.1.Construction and final wood products
3.4.Bioenergy
3.3.Pulping
3.2.Pretreatment technologies
3.1.Wood processing
2.5.Recycled wood and fibers
2.4.Wood supply chain
2.3.Wood properties
2.2.Tree breeding and forest biotechnology
2.1.Forest management
1.4.Non-wood forest products
1.3.Forest ecosystem services
1.2.Sustainability assessment
1.1.Forest inventory and economics
CAPACITIES COFUNDING

17
Figure 23. Comparison of research capacities and EC’s funding by region
It shows that Southern and Western Europe have balanced research capacities and funding and that
Northern Europe has ‘surplus’ of capacities when compared to its research EC funding. The only
striking finding of the Figure 23 is the very low level of EC’s funding achieved in comparison to their
capacities in Eastern European countries. The ratio of capacities and EC funding by individual supply
chain categories is somewhat balanced, with exceptions of Southern Europe’s low EC’s funding in
Primary processing, and Eastern Europe’s low EC’s funding in Forest biomass and raw materials and
Primary processing. Additional results from research activity mapping are presented in Appendix IV.

18
4. DISCUSSION AND CONCLUSIONS
This report focuses on mapping and analysing research capacities and research activities in the field
of forest bioeconomy in Europe. Although each part of Europe has sizable capacities in each segment
of the supply chain, overall capacities increase from Southern across Eastern and Northern to
Western Europe. On individual level, Northern European countries and organizations have the overall
highest capacities in the field. From mapping of the research capacities, it is evident that they increase
along the supply chain; and same can be stated for research funding. Although overall funding of
research increases from FP7 to H2020, the increase is almost exclusively limited to intermediary steps
of the supply chain. However, given the high share of EC’s funding allocated to private companies in
primary and secondary processing, research organizations get approximately evened-out funding
along the supply chain. When looking at EC’s funding in classical forestry topics, biggest increase in
funding occurred for Sustainability assessment, and biggest decrease was for Forest inventory and
economics. From all individual topics, largest overall funding and EC’s funding was devoted to
Bioenergy.
The definition of forest-bioeconomy is based on previous mapping exercises in the field and on
opinions of five senior researchers. Although there was a high level of consensus, their opinions were
not completely uniform, as not all researchers agreed to include or not forest ecosystem services, land
use policy and forest ergonomics. Only topics listed in two ERIFORE’s mapping exercises had detailed
(textual) explanations, while in others only titles of topics or few key words were included. Only
ERIFORE’s bibliometric review had described the sampling procedure, while no other mapping
exercise has done so. Not all topics and countries were in the scope of all the mapping exercises;
which means that results focused on more frequently listed topics and countries have more validity
than the ones describing capacities in topics and countries that were listed only in a couple of mapping
exercises. Procedure of extracting topic-by-organization capacities from FORESTERRA has produced a
positive discrimination towards capacities of larger organizations. Assessing regional-level results has
to be done with a reference which countries fall in what region; e.g. Baltic states are listed within
Eastern Europe, and France is listed within Western Europe, although it is also encompassed in
FORESTERRA’s assessment of Mediterranean research capacities.
Research activity has been proxied by funding received in FP7, H2020 and several ERA-NETs. Authors
acknowledge that such data frame does not reflect overall research activity in Europe, where there
might be many national and other international research funding sources. Received funding also
produces divergent research activity throughout Europe; e.g. a certain amount of funding that can
support a researcher in Finland for one month can support a same level researcher in Croatia for three
months. Two researchers have independently performed the project sampling and the topic-
categorization procedure, and then cross-validated their results. The overlap in defining the overall
sample was 97%, while the overlap in assigning topics to individual projects was 91%. Defining the
overall sample was not problematic but assigning topics-by-projects was problematic; many projects
contain elements from different topics, and the descriptions of projects were sometimes inadequate
to make the judgement (about 30% of projects was also checked by reading their web-sites). Following
examples demonstrate the problems faced in sampling and categorization procedure. BIOFOAMBARK
project (Bark Valorization into Insulating Foams and Bioenergy – classified in 4.4.Biopolymer
processing) tackles topics of bioenergy, sustainability assessment and supply-chain analysis; but the
primary focus is on use of polymers as foam - building material as substitution to petroleum-based
plastics, that is followed by end-of life conversion into syngas. Another example is ReWoBioRef project
(Mobilization and utilization of recycled wood for lignocellulosic bio-refinery processes – classified in
2.5.Recycled wood and fibres) is also strongly linked to Biorefinery topic (3.7). Previously mentioned

19
project GEM-TRAIT focuses on tropical forests; but as the research is conducted by University of
Oxford and University of Leeds, it is encompassed in the sample. Similar dilemma was with 2G BIOPIC
project that focuses on production of bioethanol from agricultural residues and wood; which was
encompassed in the sample although it is equally rooted in agriculture and forestry.
The large data sets obtained in this study allow for many cross-tabulation options, and some of them
have been presented in the results section. The selection of results was intended to provide an overall
description of research activities and capacities within forest-bioeconomy in Europe, and does not go
in detail of individual countries and topics, nor does it contain explanatory inferential analysis. The
most striking misbalance in project funding is the low level of received EC’s funding compared to high
capacities in Eastern Europe; which indicates that they are not adequately integrated into
international scientific community of the field, a task that leading organizations from Northern and
Western Europe should assist them with. These category-specific linkages across organizations from
different regions of Europe can be found in the section devoted to collaboration analysis. From a
strategic research-planning perspective, the most important finding of the study is that concept of
forest bioeconomy is not really a field of its own (as operationalized in the supply-chain
categorization of topics); almost completely different organizations are active in different segments
of the chain, transitioning from more forestry-oriented organizations such as EFI and BOKU at the
beginning to more technology oriented ones at the end, such as VTT and FCBA. This discontinuity in
the collaboration across topics is also expected, given the fact that the complexity of supply chain
greatly increases along each of its steps, and very different expertise are needed to tackle issues
focused at its beginning and its end. The low level of collaboration between actors in different
categories of topics inhibits innovative research-driven responses to policy challenges that require
mobilization of entire forestry chains and systems (from raw materials to final products end of life).
The analysis performed in this report points to two policy recommendations for the level of EU
research and innovation planning:
1. Support higher involvement of research organizations from Eastern European countries to the
international scientific community within the field of forest bio-economy by emphasizing criterion
of geographical coverage in future research and innovation planning.
2. Design research and innovation calls for projects that thematically cover multiple forest bio-
economy supply-chain categories.

20
Appendix I. Detailed classification of topics
Table 1. Key words and project examples of individual topics
CATEGORY TOPIC KEY WORDS / AREAS Project example
1.1.Forest inventory and
economics
Forest survey, mapping, remote sensing, wood
availability, forest economics, yield..
STRUCCHANGE (Monitoring forest degradation using
terrestrial lidar and satellite images)
1.2.Sustainability
assessment
Sustainability impact assessment, LCA, socio-
economic-environmental trade-offs,
ECOTOOL (Improving Life Cycle analysis tools for sustainability
assessment in forestry, agriculture and environment
technologies)
1.3.Forest ecosystem
services
Biodiversity, recreation, carbon sequestration,
PES….
NEWFOREX (New Ways to Value and Market Forest
Externalities)
1.4.Non-wood forest
products
Berries, mushrooms, medicinal herbs… STAR TREE (Multipurpose trees and non-wood forest products
a challenge and opportunity)
2.1.Forest management Silviculture, harvesting, forest operations, plantation
forestry
EURSDM (Elaboration of advanced-level models for density
management of coniferous and broadleaved even-aged
natural stands and plantations in Europe)
2.2.Tree breeding and
forest biotechnology
Tree breeding, forest genetics, tree improvement,
DNA
PROCOGEN (Promoting a functional and comparative
understanding of the conifer genome- implementing applied
aspects for more productive and adapted forests)
2.3.Wood properties Wood quality, physical, chemical and mechanical
properties
WOVEN (Wood formation under varying environmental
conditions)
2.4.Wood supply chain Wood fuel and biomass supply, forest logistics, ICT, BioRES (Sustainable Regional Supply Chains for Woody
Bioenergy)
2.5.Recycled wood and
fibres
Waste, recycled wood, pulp WPF (From Waste Paper to Furniture)

21
CATEGORY TOPIC KEY WORDS / AREAS Project example
3.1.Wood processing Sawmilling, Wood modification, Processing
techniques, technological aspects of wood
VARMA (Value added by optimal wood raw material allocation
and processing)
3.2.Pretreatment
technologies
Physico-mechanical, chemical and biological
treatment; steam CO2 and ammonia fibre
explosion…
TORCHWOOD (Development of an affordable heat treatment
process for wood)
3.3.Pulping cooking the raw lignocellulos material and pulp
purification
PROVIDES (PROcesses for Value added fibres by Innovative Deep
Eutectic Solvents)
3.4.Bioenergy Thermochemical conversions (torrefaction,
pyrolysis, gasification), pelletizing, production and
usage of biofuels
BIOCHIPFEEDING (Wood chip feeding technology of the future
for small-scale biomass boilers)
4.1.Construction and final
wood products
Usage of wood in construction, furniture,
Conversion, shaping, assembly and finishing of
wood products…
BEST (Building with Environmentally Sustainable Structural
Timber)
4.2.Chemical conversion Manufacturing, testing, screening and evaluation of
new catalysts
BIOXCAT (Bioinspired Catalysts for Commercial Applications)
4.3.Bioprocessing and
biotechnology
enzymatic and whole cell catalysis for conversion of
lignocellulose
FALCON (Fuel and chemicals from lignin through enzymatic and
chemical conversion)
4.4.Biopolymer processing compounding, extrusion, injection moulding,
thermomolding or infusion of thermoplastic and
thermosetting biopolymers
MouldPulp (Development of Durable, Fully Bio-Based
Thermoplastic Composites from Bioplastics and Pulp Fibres for
Injection Moulding Applications)
4.5.Fiber technologies extraction and the synthesis of lignocellulosic fibers
and their transformation into fiber based webs or
textiles
ADCELLPACK (Advanced cellulose packaging)
4.6.Other bio-based final /
high value products
biopharmaceuticals, cellulose-based carbon-fibres
and aerogels..
ReCell (Refined cellulose derivatives for high-value biomedical
products)

22
4.7.Biorefinery Practical and theoretical biorefinery development EUROBIOREF (EUROpean multilevel integrated BIOREFinery
design for sustainable biomass processing)
Table 2. Key words and research areas of each mapping exercise per topic.
1. FOREST SYSTEMS
ERIFORE – survey ERIFORE – Bibliometric INOWAWOOD WoodWisdom SUMFOREST
FORESTERRA
1.1. forest inventory and economics
Forest inventory and wood availability
Forest inventory and wood availability
Marketing and economics
Forest mensuration (topic 5) + Marketing and Economics (topi 7) + T9- Forest labour questions
Forest Inventory; Forest Planning & Inventory; Remote sensing; ; Yield and Economics
1.2. Sustainability assessment
Sustainability assessment tools (environmental, social, economics)
Sustainability assessment tools (environmental, social, economics)
Sustainability T9 - Forest taxation + Afforestation policy T9 - Land use, land-use policy.
Social Forestry
1.3. forest ecosystem services
ecological and social services
1.4. Non-wood forest products
Minor forest products Non-wood forest products
2. FOREST BIOMASS & RAW MATERIALS
2.1. Forest management
Silviculture Silviculture Silviculture + Harvesting + Forest management
Sliviculture + procurement and harvesting
Sliviculture and its subtopics (topics 2) + harvesting and logging (topic 3) + forest management (topic 6) + Work science / forest ergonomics (in topic 3)
Forest Operations; Silviculture; Wood Harvesting;
2.2.Tree breeding and forest biotechnology
Tree breeding and forest biotechnology
Tree breeding and forest biotechnology
Wood formation and breeding Forest Genetics; Forest Genetics & Forest Biotechnology; Seed and Tree Breeding;
2.3. Wood properties
Wood quality assessment and suitability between biomass and processing
Wood quality assessment and suitability between biomass and processing
Physical properties of wood + Mechanical properties + Chemical properties of wood + Quality grading of wood
Raw material properties of wood + material properties of wood and fibres
T8. - Wood and bark: structure and properties T8 - Grading of wood and wood products T8. - Preservative and other treatments to improve the properties of wood. Damage by biological agencies and its control
Wood Technology
2.4. Wood supply chain
Wood supply chain, logistics, transportation
Wood supply chain, logistics, transportation
Forestry wood chain Timberyard practice (handling and storage)

23
2.5.Recycled wood and fibers
Recycled wood and fibers Recycled wood and fibers
3. PRIMARY PROCESSING
3.1.Wood processing
Wood modification + Processing techniques and technological aspects of wood
Processing and manufacturing
3.2.Pretreatment technologies
Pretreatment technologies
3.3.Pulping Pulping T8. Pulp industries Composite materials made wholly or partly from woody matter. Chemical utilization of wood
3.4.Bioenergy Thermochemical conversion Bioenergy / pelletizing Biomass for bioenergy production
4. SECONDARY PROCESSING
4.1. Construction
and final wood products
Production aspects of wood
Construction and building + wood products
T8. - Conversion, shaping, assembly and finishing of wood: general T8. - Timber manufacturing industries and products. Uses of wood as such T8 - Economy in the use of wood. Replacement by competitive materials
Wood products
4.2.Chemical conversion
Chemical conversion
4.3.Bioprocessing and biotechnology
Bioprocessing and biotechnology
Biotechnology
4.4.Biopolymer processing
Biopolymer processing
4.5.Fiber technologies
Fiber technologies fibre products
4.6.Other bio-based final / high value products
Other bio-based final / high value products
other wood-based products
4.7.Biorefinery Also biorefinery mentioned here! –in Deliverables!
Biorefinery
4.8. Downstream processing
Downstream processing

24
Figure 1. Regions of Europe

25
Appendix II. Detailed methodology
In this study an analytical definition of forest bioeconomy is taken-up, where the initial step was to list all topics that
describe forestry and its wider connections to all other sectors encompassed within bioceconomy. These 151 topics
are reviewed in different research capacity mapping exercises; in ERIFORE project (http://erifore.eu/) and its
bibliometric study (see deliverable 1.2), mapping in WOODWISDOM (http://www.woodwisdom.net/), FORESTERRA
(http://www.foresterra.eu/), INNOVAWOOD (http://www.innovawood.com/) and SUMFOREST
(https://www.sumforest.org/) project. This list was then given to five senior researchers in the field, who had a task
to jointly define which specific topics are entailed within the concept of forest bio-economy. Total of 106 topics have
been included in the analytical definition of the concept. In order to group all these topics, a supply-chain type
classification has been developed that entails four categories and 21 topics (Table 1), which to a large extent follows
ERIFORE’s supply chain classification of topics.
After the classification has been designed, all deliverables of the projects mentioned above have been read. If a given
organization has been described as having capacities on a given topic, this instance has been marked with number
one. Initial idea was to simply sum the organizational capacities on a given topic for all such organizations in a country
in order to get country-level capacities on a given topic. It quickly became apparent that this procedure is not
adequate, as not all topics and countries are present in all mapping exercise. Figures 1 and 2 show frequency of topics
and countries across mapping exercises.
Figure 1. Frequency of topics in mapping exercises Figure 2. Frequency of countries in mapping exercises
In order to assess the capacities in forest bio-economy research, a normalization by topic and country has been
performed. The score for a given topic of a single organization ranges from 0 to 1, and represents the share of mapping
exercises in which the topic-capacity has been attributed, with respect to the number of mapping exercises in which
the given topic and country have been present. On example of French National Institute of Agricultural Research (INRA)
– capacity in topic 1.1. (Forest inventory and economics) has been marked in four different mapping exercises. France
was present in all six mapping exercises, while topic 1.1. was present in five of them. This results with INRA having 0.8
points in topic 1.1., i.e. 4/5. On example of Croatian Forest Research Institute (CFRI) – capacity in topic 2.1 (Forest
management) has been marked in two different mapping exercises. Croatia was present in three mapping exercises
and all of them also included topic 2.1. This results with CFRI having 0.67 points in topic 2.1, i.e. 2/3. National capacities
for a given topic have been gained by summing up points for that topic from all organizations in that country. In
FORESTERRA (deliverable 2.4) national research programmes were presented in percentages, while FORESTERRA data
0 1 2 3 4 5 6
4.8.Downstream processing
4.7.Biorefinery
4.6.Other bio-based final /…
4.5.Fiber technologies
4.4.Biopolymer processing
4.3.Bioprocessing and…
4.2.Chemical conversion
4.1.Construction and final…
3.4.Bioenergy
3.3.Pulping
3.2.Pretreatment…
3.1.Wood processing
2.5.Recycled wood and…
2.4.Wood supply chain
2.3.Wood properties
2.2.Tree breeding and…
2.1.Forest management
1.4.Non-wood forest…
1.3.Forest ecosystem…
1.2.Sustainability…
1.1.Forest inventory and…
0 2 4 6
Estonia
Luxemburg
Macedonia
Morocco
Romania
Serbia
Tunisia
Turkey
Croatia
Czech Republic
Hungary
Iceland
Netherlands
Portugal
Sweden
United Kingdom
Belgium
Bulgaria
Denmark
Greece
Ireland
Latvia
Lithuania
Poland
Slovakia
Austria
Finland
Germany
Italy
Norway
Slovenia
Spain
Switzerland
France

26
base on research capacities (http://www.foresterra.eu/tablas/investigacion.php) lists different characteristics of
organizations encompassed in the mapping, such as overall budget, number of permanent staff, number of
publications and projects per year. In order to assign forest bioeconomy topic-specific capacities, percentages of
national research capacities have been multiplied with the number of research organizations in the country. The topic-
specific capacities have been assigned to organizations starting with the one that has highest number of permanent
forestry staff. All results smaller than one are treated as topic-specific research capacity of one organization (i.e. the
one with highest number of permanent staff). Research capacities of organizations from other continents are not
taken into consideration.
Data sets of the CODRIS database that have been taken-up in the analysis are all the projects that have been funded
in the seventh framework programme (FP7) and in the eighth of the Framework Programme for Research and
Technological Development (H2020), as retrieved on 24.5.2017. Main data-types are one to several paragraphs long
project description that summarizes its objectives (column objective), unique project and organization identification
codes, list of organizations in the project consortia and their type, total project funding and EC’s funding by project
partner.
As the sampling frame is too large to be manually reviewed (25607 projects in FP7 and 11070 projects in H2020), semi-
automatic sampling procedure has been developed, where each project description in the data sets has been
compared to the ‘core’ description of the forest bio-economy. First part of the ‘core’ forest bioeconomy description is
the 12-page long description of all the topics contained in the classification developed to map research capacities. This
text is to a large extent based on topic descriptions as designed in the ERIFORE project (see deliverables 1.2, 2.2, 3.2
and 4.2). The second part of the ‘core’ forest bioeconomy description is a 42-page long compilation of all project
abstracts that fit the sample from FP7 and H2020 as listed in the project database of the Forest-based Sector’s
Technology Platform (http://db.forestplatform.org). This combined ‘core’ forest bioeconomy description together
with project objectives of all FP7 and H2020 has been imported to R programming environment, and the two have
been compared with Text Mining package. The ‘core’ forest bioeconomy description was ‘cleaned’ from ‘stop-words’
(e.g. "the", "and", "will", "for", "from", "this", "are", "that", etc.), and then transformed into lemmatized strings (roots
of words, e.g. manage for management, manager, etc.) i.e. ‘key words’ (only nouns and verbs). All string with
frequency 20 and higher have been used in analysis (total of 244). The comparison between the project description is
based on frequency of joint strings (e.g. if only one string appears only once in two projects, than their similarity is 1).
The similarity between ‘core’ forest bioeconomy description and a given project is set by multiplying the frequency of
shared strings with the frequency of that string in the ‘core’ forest bioeconomy description. Example: string ‘forest’ is
mentioned in the 54-page ‘core’ forest bioeconomy description 315 times. Frequency of ‘forest’ in description of
project FORGER (Towards the Sustainable Management of Forest Genetic Resources in Europe) is 9. This makes their
similarity score for string ‘forest’ 2835 (i.e. 315 x 9). Same procedure is done for all 244 strings. Different indexes of
similarity are gained by adding-up similarity scores for similarity of individual strings. For comparison between ‘core’
forest bioeconomy description and all other projects, similarity scores for strings ‘forest’, ‘wood’, top 10 strings, top
50 strings, top 100 strings and all 244 strings have been used. All the projects in FP7 and H2020 were then ranked from
most to least similar according to these indexes in the order as they were written. Project descriptions were then read,
and those which fit to the sample were selected. The review of the project descriptions stopped when 100 successive
projects did not fit the sample. All the FP7 and H2020 project were then re-ordered according to the subsequent index
from highest to the lowest score, excluding the ones that were previously sampled. The same procedure of reviewing
the projects was repeated for all indexes. Bio-Based Industries Joint Undertaking projects are included in the data set.
ERA-NET projects that fit the sample were not included in the data set – but rather all the projects funded within such
ERA-NET were individually reviewed, and if found fitting to the topic of forest bio-economy, were included in the list
of sampled projects. This procedure resulted with 387 sampled projects.
The sampled project descriptions were then compared to the descriptions of individual topics and classified
accordingly. In the CORDIS data set, project partners were named inconsistently across projects – they were named
on different languages, had small differences in typing, marked on different levels of organizational complexity (e.g.
institutes within a single faculty, faculty or university). All organizations listed in the data set were checked for
consistency that same organizational names are used in different projects, and where appropriate, organizations were

27
aggregated to a higher level of complexity. Examples: single Fraunhofer Society is named, which previously was
Institute for Interfacial Engineering and Biotechnology; Institute for Wood Research; Institute for Environmental,
Safety and Energy Technology; Center for Chemical-Biotechnological Processes and Institute for Chemical Technology.
Branches or regional departments of a single organization have been pooled together – e.g. EFI Central European
Regional Office and the EFI Observatory for European Forests are both renamed to EFI. Organizations that have
changed names and/or had mergers are renamed to current organizational name – for example METLA
(Metsäntutkimuslaitos - Finnish Forest Research Institute ) was renamed to LUKE (Luonnonvarakeskus - Natural
Resources Institute Finland), and both University of Joensuu and the University of Kuopio have been renamed to
University of Eastern Finland (which was formed by the merger of the two). Companies and subsidiaries of larger
organizations are renamed to their parent organizations. Examples: Biofuel Technology Center is renamed to Swedish
University of Agricultural Sciences and Laboratoire d'études et de recherche sur le matériau bois is renamed to
University of Lorraine. All companies (incorporated, limited company, limited liability company, corporation limited by
share ownership, etc.) are marked with additional variable. This was already present in CORDIS data base for most FP7
and H2020 project partners, but not for ERA-NET project partners. CORDIS data base contains total project funding
and EC’s funding by project partner. Total funding by project partner is used for ERA-NET projects, and summed up
with partner EC’s funding in other projects to aggregate funding results on national level. All values of total funding
and EC’s funding are expressed as 2017 constant values based on Eurozone’s inflation rates. For third WOODWISDOM
call (2011-2014) only overall budget (18.5 mil. €) is available; and this overall figure was distributed equally among the
projects and their participants. EC’s funding was also not specified for 34 projects listed in the CODRIS data set; only
overall project funding figures were available. For these projects, average EC’s funding rate from all sampled projects
was applied, and the total EC’s funding was then equally distributed among their participants. Descriptive data analysis
has been performed, both for research capacities and research activity as displayed by participation in research
projects. Only minor segment of possible cross-tabulations between available variables have been displayed; and they
have been selected for revealing important characteristics of the data. Analysis of collaboration between countries
and individual organizations is based on procedures of Social Network Analysis (SNA). In this report, SNA is used just
as an exploratory tool, where only degree-distribution effect is taken into consideration, i.e. the number of joint
participations in research projects. The graph visualizations of collaboration between organizations are set in spring-
embedded layout, which allows for quick identification of central and peripherial organizations in the collaboration
network; as those organizations that frequently collaborate are placed close to one another, and ‘central’ (strongly
interconnected to everyone else) organizations are placed in the centre of the graphs.

28
Appendix III. Additional results from the mapping of capacities in forest bioeconomy
Figure 1. Count of organizations by country Figure 2. Count of organizational capacities by country
Figure 3. Capacity of organizations by country in forest systems

29
Figure 4. Capacity of organizations by country in Forest biomass & raw materials
Figure 5. Capacity of organizations by country in Primary processing

30
Figure 6. Capacity of organizations by country in Secondary processing
Figure 7. Capacity of organizations by country in forest systems – map

31
Figure 8. Capacity of organizations by country in Forest biomass & raw materials– map
Figure 9. Capacity of organizations by country in Primary processing– map

32
Figure 10. Capacity of organizations by country in Secondary processing– map
Figure 11. Top 10 organizations in Forest systems

33
Figure 12. Top 10 organizations in Forest biomass & raw materials
Figure 13. Top 10 organizations in Primary processing
Figure 14. Top 10 organizations in Secondary processing

34
Appendix IV. Additional results of from the mapping of research activities in forest bioeconomy
Figure 1. EC’s funding by population and category

35
Figure 2. EC’s funding by country and forest area
Figure 3. EC’s funding by country and removals

36
Figure 4. Number of instances when an organization was a coordinator in a project by country
Figure 5. Collaboration between countries in Forest biomass & raw material

37
Figure 6. Collaboration between organizations in Forest biomass & raw material
Figure 7. Collaboration between organizations in Forest biomass & raw material – zoom to centre

38
Figure 8. Collaboration between countries in Primary processing

39
Figure 9. Collaboration between organizations in Primary processing
Figure 10. Collaboration between organizations in Primary processing – zoom to centre

40
Figure 11. Collaboration between countries in Secondary processing
Figure 12. Collaboration between organizations in Secondary processing

41
Figure 13. Collaboration between organizations in Secondary processing - zoom to centre