synthesis of water quality influences in ports of the
TRANSCRIPT

Synthesis of Water Quality
influences in ports of the
Fitzroy region, Queensland
October 2015
Nicole Flint, Emma Jackson, Scott Wilson, Krista Verlis and John Rolfe
School of Medical and Applied Sciences, and School of Business and Law
CQUniversity Australia

This report should be cited as:
Flint, N., Jackson, E., Wilson, S., Verlis, K., and Rolfe, J. (2015). Synthesis of water quality influences in
ports of the Fitzroy region, Queensland. A report to the Fitzroy Basin Association for the Fitzroy
Water Quality Improvement Plan. CQUniversity Australia, North Rockhampton, Queensland.
This document was prepared by Nicole Flint, Emma Jackson, Scott Wilson, Krista Verlis and John
Rolfe (CQUniversity). The authors thank Amie Anastasi (CQUniversity), Tom Coughlin (Fitzroy Basin
Association) and Gladstone Ports Corporation for reviewing the report. We thank Gordon Dwane
and Megan Ellis (Gladstone Ports Corporation) for their cooperation and contributions, as well as
PCIMP Inc. and several local industries for providing information on their environmental monitoring
programs.
For further information contact:
Dr Nicole Flint
School of Medical and Applied Sciences
CQUniversity Australia
North Rockhampton Campus
Email: [email protected]
Phone: +61 7 4923 2128

Contents
Executive summary ................................................................................................................................. 1
1. Introduction .................................................................................................................................... 3
1.1. Background ............................................................................................................................. 3
2. Background and characterisation of the Port of Gladstone and the Port of Rockhampton .......... 5
2.1. Introduction to the Port of Rockhampton .............................................................................. 5
2.1.1. Port capacity and handling.............................................................................................. 5
2.1.2. Catchment activities for the Port of Rockhampton ........................................................ 7
2.2. Introduction to the Port of Gladstone .................................................................................... 8
2.2.1. Port capacity and handling.............................................................................................. 8
2.2.2. Catchment activities for the Port of Gladstone ............................................................ 13
2.3. Quality Assurance and Environmental Certifications ........................................................... 14
2.4. National and international context of port operations ........................................................ 15
3. Factors influencing port water quality .......................................................................................... 19
3.1. Urban sources ....................................................................................................................... 20
3.2. Catchment sources ............................................................................................................... 20
3.3. Shipping ................................................................................................................................. 21
3.3.1. Ship movements: sediment re-suspension and emissions ........................................... 22
3.3.2. Shipping incidents ......................................................................................................... 22
3.3.3. Marine debris and ship-sourced pollution .................................................................... 27
3.3.4. Discharge of ballast water............................................................................................. 28
3.3.5. Use of anti-fouling paints .............................................................................................. 31
3.4. Ports activities ....................................................................................................................... 32
3.4.1. Maintenance and capital dredging ............................................................................... 32
3.4.2. Wharf facilities .............................................................................................................. 37
3.5. Discharge from port-side industries ..................................................................................... 38
3.5.1. Discharge and emissions ............................................................................................... 38
3.5.2. Recent industrial incidents ............................................................................................ 42
3.5.3. Acid sulfate soils ............................................................................................................ 42
3.6. Ocean sources (of pollution) ................................................................................................. 43
3.7. Marine industries and recreation ......................................................................................... 44
3.7.1. Recreation ..................................................................................................................... 44

3.7.2. Commercial fishing ........................................................................................................ 47
4. Current water quality monitoring and reporting .......................................................................... 48
4.1. Port of Gladstone Monitoring ............................................................................................... 48
4.1.1. Port Curtis Integrated Monitoring Program ................................................................. 48
4.1.2. Gladstone Ports Corporation monitoring ..................................................................... 49
4.1.3. Other industry near-field monitoring ........................................................................... 50
4.1.4. Queensland Government monitoring ........................................................................... 51
4.1.5. Port Curtis Harbour Watch ........................................................................................... 52
4.1.6. Marine debris research ................................................................................................. 53
4.1.7. MangroveWatch ........................................................................................................... 55
4.2. Gladstone Healthy Harbour Partnership .............................................................................. 55
4.3. Port of Rockhampton monitoring ......................................................................................... 57
4.3.1. Gladstone Ports Corporation monitoring ..................................................................... 57
4.3.2. Queensland Government monitoring ........................................................................... 57
4.3.3. MangroveWatch ........................................................................................................... 57
4.4. Fitzroy Partnership for River Health ..................................................................................... 58
4.5. Other programs and studies ................................................................................................. 59
4.5.1. Creek Watch Gladstone ................................................................................................ 59
4.5.2. Other Queensland Government monitoring ................................................................ 59
4.5.3. Marine Monitoring Program ......................................................................................... 59
4.5.4. AIMS monitoring ........................................................................................................... 59
4.5.5. Other studies ................................................................................................................. 60
5. Water quality management .......................................................................................................... 61
5.1. Environmental legislation and agreements .......................................................................... 61
5.1.1. International Agreements ............................................................................................. 62
5.1.2. Australian Government legislation ............................................................................... 64
5.1.3. Queensland Government legislation ............................................................................ 65
5.2. Water Quality Guidelines ...................................................................................................... 67
5.3. GPC environmental management and offsets ...................................................................... 71
6. Discussion and knowledge gaps .................................................................................................... 72
6.1. Discussion .............................................................................................................................. 72
6.2. Knowledge gap identification ............................................................................................... 73
6.3. Conclusion ............................................................................................................................. 78

7. References .................................................................................................................................... 79
Appendix: Supplementary data ............................................................................................................ 88
List of Figures
Figure 1.1: The Fitzroy Region and the boundaries of the Ports of Gladstone and Rockhampton. ....... 3
Figure 2.1 Location and map of the Port of Rockhampton, showing major management boundaries,
road and rail network. ............................................................................................................................ 6
Figure 2.2: Location and map of the Port of Rockhampton, showing major habitats and conservation
boundaries. ............................................................................................................................................. 8
Figure 2.3: Location and map of the Port of Gladstone, showing rail and road link and major
industries. ............................................................................................................................................. 11
Figure 2.4: Map of important wetlands and boundaries of Important Fish Habitat Areas and Dugong
Protection Areas within and adjacent to the Port of Gladstone. ......................................................... 13
Figure 2.5: Top 10 Australian international sea freight ports with highest export value ($ billion)
(Source: BITRE 2014). ............................................................................................................................ 16
Figure 3.1: Factors influencing water quality in the Port of Gladstone and Port of Rockhampton. .... 19
Figure 3.2: The number of incidents and Gladstone compare to the rest of Queensland for reported
years 1996 to 2013 (MSQ). ................................................................................................................... 46
Figure 4.1: Mean beach debris loads found in Gladstone between March 2011 and March 2014. .... 54
Figure 4.2: GHHP 2014 Pilot Report Card environmental grades (Source: GHHP) ............................... 56
Figure 4.3: PSII herbicide ranges for North Keppel site over time (Gallen et al. 2014) ........................ 60
Figure 5.1: Some of the international agreements, Australian Government and Queensland
Government legislation relating to managing water quality, and managing matters that may be
affected by water quality, in the Ports of Gladstone and Rockhampton. ............................................ 62
Figure 5.2: Capricorn and Curtis coast waters as defined for the EVs and WQOs in Schedule 1 of the
EPP Water. Source: Queensland Government Department of Environment and Heritage Protection.
.............................................................................................................................................................. 69
Figure 5.3: Fitzroy River waters as defined for the EVs and WQOs in Schedule 1 of the EPP Water.
Source: Queensland Government Department of Environment and Heritage Protection. ................. 70

List of Tables
Table 2.1: Information on the Port of Gladstone wharves. Source: DTMR 2012a;
www.worldportsource.com; GPC 2012) ............................................................................................... 10
Table 2.2: Proximity of coral reefs and seagrass meadows to maintenance dredging and disposal
activities associated with major ports (adapted from McCook et al. 2015). ........................................ 16
Table 2.3: Comparison of dissolved metal concentrations in Port Cutis in 2011 to other industrialised
harbours and coasts (Source: Angel et al. 2012). ................................................................................. 17
Table 3.1: Contribution of major basins to regional total baseline load for the Fitzroy NRM Region
(Source: Dougall et al. 2014). ................................................................................................................ 21
Table 3.2: Commercial registrations by vessel size for Gladstone Region as of 30 September of
reported years (2008–2014) (data source: MSQ 2015). ....................................................................... 24
Table 3.3: Oil spills and pollution events in the Port of Gladstone reported to MSQ in 2013, ship and
land-based sources (Queensland Government 2014). U = unknown quantity. ................................... 25
Table 3.4: Prosecutions for oil and chemical pollution under Commonwealth and State legislation
from 1997 in Gladstone and Rockhampton locations. Note that Rosslyn Bay Boat Harbour is outside
of the limits of the Port of Rockhampton. ............................................................................................ 27
Table 3.5: Introduced species identified in Port Curtis survey of marine species in March 2000
(source: Lewis et al. 2001). ................................................................................................................... 29
Table 3.6: Species with a moderate to high potential of being introduced to Queensland marine
environments (source: Lewis et al. 2001). ............................................................................................ 30
Table 3.7: Top 10 countries of export from the Port of Gladstone in 2014 by number of vessels. ..... 31
Table 3.8: Countries of export from the Port of Rockhampton in 2014 by number of vessels. ........... 31
Table 3.9: Maintenance dredging annual volumes (m3) in the Port of Gladstone and Port of
Rockhampton (GPC Pers. Comm., 5 August 2015). .............................................................................. 34
Table 3.10: Western Basin Dredging and Disposal Project (WBDDP), dredging volumes approved. EIS
= Queensland Government Environmental Impact Statement; SEWPaC = (then) Australian
Government Department of Sustainability, Environment, Water, Population and Communities.
(Source: GPC Pers. Comm., 5 August 2015). ......................................................................................... 35
Table 3.11: Industrial emissions for Gladstone waters (kg/year) for 2013–14 (Source: NPI search).
................................................................................................................. Error! Bookmark not defined.
Table 3.12: Industrial emissions for Rockhampton waters (kg/year) for 2013–14 (Source: NPI search).
.............................................................................................................................................................. 41
Table 3.13: Debris surveys at Gladstone shoreline locations (Sources: Wilson & Cartraud 2014;
Wilson & Hansler 2014). ....................................................................................................................... 43
Table 3.14: Gladstone region recreational vessel registrations by size class, as of 30 September of
each reported year (Source: MSQ 2015b). ........................................................................................... 45
Table 3.15: The number of incidents for commercial and recreational vessels in Gladstone (Source:
MSQ 2014). ........................................................................................................................................... 45
Table 4.1: Water and sediment quality parameters measured by PCIMP. .......................................... 48
Table 4.2: Summary of water quality monitoring for the Port of Gladstone presented as: number of
sites (frequency per year). “>” means greater than. ............................................................................ 51

Table 4.3: Mean marine debris accumulation rate for the Gladstone Region 2011–2014. ................. 53
Table 4.4: Summary of water quality monitoring for the Port of Rockhampton presented as: number
of sites (frequency per year). “>” means greater than. ........................................................................ 58
Table A.1: Prosecutions for ship sourced garbage pollution Commonwealth and State legislation
from 2007 to 2014 in Gladstone and Rockhampton ............................................................................ 88
Table A.2: Boat ramps and jetties in the Gladstone and Rockhampton regions. Note that this list
includes facilities beyond the limits of the Ports of Gladstone and Rockhampton (Source: MSQ). .... 88
Table A.3: Most important commercial fish species by weight for Gladstone harbour (Grid S30). Data
are for all years 1990–2014 in total (Source: DAF). .............................................................................. 90
Table A.4: Summary of key commercial fishing species (1990–2014) for Rockhampton (Grid R30)
(Source: DAF). ....................................................................................................................................... 90

1
Executive summary
Australia is dependent on its port facilities for international trade. There are 20 ports in Queensland
alone, two of which are within the Fitzroy Basin region. Water quality in ports is influenced by a wide
variety of factors, some of which are unique to shipping and port operations. This synthesis report
focuses on issues relating to water quality in the two Fitzroy region ports — the Port of Gladstone
and the Port of Rockhampton, both managed by Gladstone Ports Corporation (GPC) — as part of the
Water Quality Improvement Plan being developed by the Fitzroy Basin Association (FBA) for the
Fitzroy and coastal catchments, through funding from the Australian Government Reef Programme.
Both of the Fitzroy region’s ports are located in river estuaries, and the Port of Gladstone is also co-
located with a regional city and a large industrial sector. The Port of Rockhampton is located in the
delta of the Fitzroy River, which drains the largest river basin draining into the Great Barrier Reef
(GBR) lagoon. Management, monitoring and assessment of water quality issues therefore has to
occur in a framework where the multiple impacts on water quality of catchment, urban and
industrial footprints interact with impacts from shipping and port operations.
The purpose of this study is to summarise the factors that influence water quality at the two ports
and to synthesise the processes used to monitor and manage these influences. The study provides a
summary of the port maintenance and industrial activities at both ports, identifies and gathers
together data on the variety of factors that could potentially influence water quality in the ports,
describes current water quality monitoring and reporting, and summarises the management and
legislative structures around port water quality. It also provides an analysis of research and
knowledge gaps in the Port of Gladstone and the Port of Rockhampton, developed with input from
representatives of GPC.
Water quality in the Port of Gladstone and Port of Rockhampton may be influenced by a range of
factors including:
• Catchment sources: agricultural and industrial run-off
• Urban sources: stormwater run-off and coastal development
• Shipping: ship movements, dumping of rubbish, discharge of ballast water and anti-fouling
chemicals
• Ports activities: maintenance and capital dredging and wharf/loading facilities
• Discharge from port-side industries: managed emissions and incidents
• Ocean sources: marine debris, and
• Marine industries and recreation: commercial fishing, recreational fishing and boating, and
shore-based recreation.
There are also processes outside of the Fitzroy Water Quality Improvement Plan’s scope that
influence water quality, including impacts of climate change such as ocean acidification, sea
temperature rise, and the likelihood of increased frequency and intensity of tropical storms, storm
surges and overland floods. These are issues that will require inter-governmental action.

2
Given its importance as one of the largest coal export terminals in Australia, and its proximity to the
world heritage-listed GBR, the Port of Gladstone is one of the most intensively monitored and
studied marine areas in Queensland. The Port Curtis Integrated Monitoring Program Inc. (PCIMP) has
been conducting water quality monitoring in the port of Gladstone for almost 10 years. Monitoring
in the Port of Rockhampton is much less comprehensive as it has been far less developed than the
Port of Gladstone. Public reporting on marine environmental health is carried out in the proximity of
both ports, by the Gladstone Healthy Harbour Partnership (GHHP; Gladstone Harbour) and the
Fitzroy Partnership for River Health (FPRH; Fitzroy estuary) and also Reef Plan (for the wider Great
Barrier Reef).
Water quality management in the ports is primarily the responsibility of the Queensland
Government, but all levels of government have some influence and responsibility for aspects of
water quality and factors influencing it, and some aspects are also subject to international
agreements.
Despite these efforts, there remain some gaps in knowledge, including in terms of the relative
contributions of the various sources (and potential sources) of water quality issues. Partly this is
influenced by a mismatch between monitoring the state of the environment at different scales, and
monitoring the change in drivers or pressures producing the change in state. These knowledge gaps
make it difficult to predict the efficacy of proposed management actions aimed at ameliorating
water quality concerns. There is also a lack of pre-industrial baseline water quality data for the Port
of Gladstone; gaps in understanding of the impacts of sea and land disposal of dredge spoil; and a
need for better understanding of how the impacts of climate change will affect resilience of the
marine ecosystems within and around the ports.
Process gaps were identified in terms of cooperative research and data sharing amongst interest
groups, particularly in the Port of Gladstone, which is of interest to a wider variety of agencies and
organisations. Efficiency of monitoring and analysis of water quality and estuarine environments in
the ports could be improved by the development of clearer communication channels or regular
forums. This report provides a synthesis of existing data and it is hoped that this information might
help to frame that communication, and direct research activities, in advance of discussions around a
future Ports Water Quality Improvement Plan for the Fitzroy region.

3
1. Introduction
1.1. Background
The Fitzroy Water Quality Improvement Plan being developed by the Fitzroy Basin Association (FBA)
is supported by studies focusing on specific elements of water quality in the Fitzroy Basin and coastal
catchments (the Fitzroy region). This ports synthesis is one such supporting study; it focuses
specifically on issues related to water quality in the ports of the Fitzroy region.
As an island nation Australia depends heavily on its port facilities for international trade. There are
two ports in the Fitzroy region — the Port of Gladstone (sometimes referred to as Port Curtis or
Gladstone Harbour) and the Port of Rockhampton (often referred to as Port Alma due to its location)
(Figure 1.1). The Port of Gladstone is one of Australia’s major port facilities — it is one of the largest
coal export ports in the country and the fifth largest coal export port in the world. It is heavily
industrialised and eight major industries are located close to the port. The Port of Rockhampton is a
three-berth shipping terminal located to the north of the Port of Gladstone; it currently exports
mostly ammonium nitrate, salt, bulk tallow and military equipment. It is the principal port for
handling Class 1 explosives for eastern Australia. The only port-side industries are evaporative salt
pans.
Figure 1.1: The Fitzroy Region and the boundaries of the Ports of Gladstone and Rockhampton.

4
Water quality in the Ports of Gladstone and Rockhampton is influenced by variety of factors, some of
which are unique from other inshore marine habitats. There are catchment and urban contaminant
sources similar to other inshore areas in the GBR, but also increased industrial activity, ports
maintenance and shipping activities, fishing activities and potential for marine incidents (for
example, oil and freight spills) and marine debris from various anthropogenic sources. Both the Port
of Rockhampton and the Port of Gladstone are located in the estuaries of river basins. This means
that unlike some other Australian ports, such as Abbot Point in north Queensland, water quality in
the two Fitzroy region ports is subject to direct catchment influences and also to variable rainfall
events and flooding.
Both of the ports are operationally managed by GPC and are subject to a variety of state and federal
government legislation. Importantly, the two ports are also adjacent to the Great Barrier Reef
Marine Park (GBRMP) and contained within the Great Barrier Reef World Heritage Area (GBRWHA).
Australia has international obligations for the continuing protection of World Heritage values of the
Reef.
The Port of Gladstone in particular is the subject of a wide variety of water quality research and
assessment processes. The Port Curtis Integrated Monitoring Program (PCIMP) has been monitoring
water quality in the port for almost a decade, and provides water quality monitoring data to its
members. A large amount of ongoing marine environment research has been conducted under
GPC’s Ecosystem Research and Monitoring Program (ERMP) and Biodiversity Offset Strategy (BOS)
since 2011. Research in the Port of Rockhampton is less extensive although there have been
assessments on particular environmental values and a suite of research projects were conducted in
the Fitzroy area by the Cooperative Research Centre for Coastal Zone, Estuary and Waterway
Management from 1999 to 2006. In terms of assessment, the Gladstone Healthy Harbour
Partnership, formed in 2013, published a pilot Report Card in 2014 that scores the health of
Gladstone Harbour (environmental, economic, social and cultural values), underpinned by research
to support the development and implementation of the report card.
Given the amount of research and assessment that is currently underway in the Port of Gladstone,
this report provides a synthesis of current knowledge rather than a full water quality improvement
plan for ports, which would duplicate existing activities. The scope of this report includes influences
on water quality within the Port of Gladstone and the Port of Rockhampton, and water quality issues
that are related to ports but may occur outside of the port limits. Other supporting studies being
conducted under the Fitzroy Water Quality Improvement Plan focus on catchment and urban
influences on water quality, hence these two factors are not addressed in detail in this report. This
report provides a review of available information about the two Fitzroy region ports including:
Background and characterisation of port activities
Factors influencing water quality
Water quality monitoring and reporting, and
Ports water quality management and relevant legislation.

5
The report also provides a discussion of gaps in knowledge and understanding of water quality and
its management in Fitzroy region ports, and extra information that would be required in order to
develop a full Ports Water Quality Improvement Plan.
2. Background and characterisation of the Port of Gladstone
and the Port of Rockhampton
2.1. Introduction to the Port of Rockhampton
2.1.1. Port capacity and handling
The Port of Rockhampton, the deep sea shipping port for the Rockhampton region (often referred to
as Port Alma, which represents the infrastructure locale and the Port Alma Shipping Terminal), is
located approximately 62 km east of Rockhampton (23.585410°S, 150.861915°E) on the southern
edge of the Fitzroy River Delta (see Figure 2.1) and just north of the Tropic of Capricorn. The port
boundary covers a total area of 287 km2. The port is managed by GPC (a statutory Queensland
Government-owned corporation) and has three berths: two for general cargo and one dolphin berth
(that is, not accessible from the shore by truck) for handling bulk liquids. The GPC facility has a 67
hectare block (lot 96) near Bajool. There are three operational berths with design depths of 9.2 m
(GPC 2011). Road access to the port is via one main road, which meets the Bruce Highway at Bajool
(portside of the highway) approximately 26 km from the port (Figure 2.1ure 2.1). The Port of
Rockhampton had a nominated rail corridor that meets the main national rail route at Bajool for
distribution to all points Australia-wide; however, the actual rail line was removed in 1986.
Average tonnage of exports from the Port of Rockhampton between 2008 and 2013 was 126,115
tonnes (t), with an export to import ratio of 1:3 (Ports Australia 2013). In financial year 2013–14
exports totalled 99,421 t. The port is targeted for the import and export of niche market products
including ammonium nitrate, salt, bulk tallow (26,995 t in 2014) and equipment for military exercises
held at Shoalwater Bay, north of Yeppoon. It is the principal designated port for the handling of Class
1 explosives and ammonium nitrate cargoes (59,761 t in 2014) for the east coast of Australia. Ship
loading limits of 8,000 t (or up to 15,000 t with GPC approval) exist for Security Sensitive Ammonium
Nitrate (SSAN) across berths one and two, and for Class 1 explosives of 1500 t over berths one and
two. In 2014, 85 vessels visited the Port of Rockhampton and ammonium nitrate accounted for
approximately 35% of total port throughput in 2014 (GPC 2015). Exports are primarily to other parts
of Australia (50% of tonnage in 2014), Papua New Guinea (10%) and Singapore (14%), but also as far
as Chile (6%). Imports are mainly from other parts of Australia (21% in 2014), Japan (17%) and China
(13%), but as far away as Sweden (3%) (GPC 2015).
Industries adjacent to the Port of Rockhampton are limited, at present, to the CK Life Sciences
(formerly Cheetham Salt Ltd) evaporative salt pans (Cheetham Saltfield, 486 ha and Port Alma

6
Saltfield 377 ha). The salt pans have been identified as important sites for shorebirds and waterbirds
(Houston et al. 2012).
Figure 2.1 Location and map of the Port of Rockhampton, showing major management boundaries,
road and rail network.
In 2013, a concept study and Environmental Impact Statement were undertaken to identify the
potential for the $1.2 billion development in the Port of Rockhampton as a 22 Million tonne (Mt)
deep water coal exporting terminal for Panamax-sized vessels1 at Balaclava Island Balaclava Island
Coal Export Terminal (BICET). The project was suspended in 2013. In order to offset losses of marine
fish habitat in the Port of Gladstone, GPC must protect, in perpetuity, an area of 5330 ha of coastal
land currently within GPC's strategic port land on Balaclava Island within the Port of Rockhampton
boundary. The land is currently being assessed by Queensland Parks and Wildlife Service (QPWS) for
inclusion into Queensland’s declared Fish Habitat Area (FHA) network (with a final decision expected
by 2016) as an extension of the existing Fitzroy River FHA. The Port of Rockhampton lies within the
boundaries of the GBRWHA. The GBRMP boundary stops at the port’s boundary (Figure 2.2).
1 Cargo ships that are the maximum size for passing through the lock chambers of the Panama Canal (320 m long, 33 m wide and 12.5 m deep)

7
The benthic habitats alongside the Port of Rockhampton's wharves and much of the channel
approaches is intertidal and sub-tidal mud, fringed by salt water couch grasslands, mangroves and
salt pans. The site is within the Fitzroy statistical division for fisheries monitoring and the most
commonly caught species is mud crab (Scylla serrata) (Taylor et al. 2012).
2.1.2. Catchment activities for the Port of Rockhampton
The Fitzroy Basin is the largest river basin draining into the GBR lagoon covering an area of
142,665 km2. It has 11 river catchments: Theresa, Connors, Upper Dawson, Lower Dawson, Callide,
Upper Isaac, Lower Isaac, Nogoa, Comet, Mackenzie and Fitzroy. Annual rainfall is highly variable for
the catchment, with El Niño conditions resulting in difficult dry conditions and strong La Niña wet
seasons causing severe flooding. Average annual rainfall across the catchment ranges from 600 mm
to 1000 mm (BOM 2015); however, there is high variability between years. Mean annual flow in the
Fitzroy River for the period 1965 to 2008 amounts to 4.42 x 10⁹ m3 (Yu et al. 2013). Approximately
230,000 people live and work in the basin. The main land use of the catchment is agriculture
(approximately 93% of the landscape, with 86% grazing and 7% arable) contributing up to
$1.2 billion annually to the Queensland economy2. Of the remainder, 5% of the land is used for
forestry, and 1% for urban, mining and feedlots (Queensland Government 2009). Although
representing only a small percentage of the catchment land area, approximately 70% of
Queensland’s coal mines are located here, contributing an estimated $12.6 billion, which is67% of
the gross regional product for the Fitzroy Region (QRC 2015). The Fitzroy Basin has been identified as
major source of pollutants to the GBR lagoon (Packett et al. 2009). The most recent modelled
average annual total suspended sediment (TSS) load for the Fitzroy Basin is 1740 kilo tonnes (kt) per
year, four times the pre-development load estimate; and the Fitzroy is estimated to contribute 23%
of the baseline fine sediment load to the GBR lagoon (Dougall et al. 2014).
2 http://www.fba.org.au/fitzroy-basin/ Accessed June 2015

8
Figure 2.2: Location and map of the Port of Rockhampton, showing major habitats and conservation
boundaries.
2.2. Introduction to the Port of Gladstone
2.2.1. Port capacity and handling
The Port of Gladstone lies approximately 525 km north of Brisbane, directly south-east of the Port of
Rockhampton, in Port Curtis (a natural and protected deep water harbour). The port boundary
covers an area of 548 km2 (including 7 km2 of reclaimed land) and the area below lowest
astronomical tide datum within the GBRWHA.
The port, which is also managed by GPC, is one of the largest coal export ports in Australia and the
fifth largest coal export port in the world. In terms of total throughput it is the second largest port in
Queensland after Hay Point (DTMR 2014). In 2013–14 the port handled more than 97.5 Mt of cargo
(compared to 108.2 Mt at Hay Point). In 2011, approval was granted for three liquefied natural gas
(LNG) processing facilities on Curtis Island, within Port Curtis. Shipments of LNG began in December
2014 and are projected by the resources sector to reach 25 Mt by the end of 20163, which could
3 http://www.couriermail.com.au/business/gladstone-ports-corporation-expects-santos-gas-in-september-quarter-of-2015/story-fnihsps3-1227170411501 Accessed June 2015.

9
make Gladstone the largest port in Queensland. By comparison, Australia shipped 23.9 Mt of LNG
cargoes in 2012–13.
There are 20 operational wharves and six anchorages within the Port of Gladstone. All berths are
capable of handling vessels in excess of 180 m in length, with the berths at RG Tanna Coal Terminal,
Wiggins Island and Curtis LNG Wharves accommodating vessels of approximately 320 m in length.
Design depths range from 11.3 m (for example Auckland Point berths) to 18.8 m (Clinton Coal
Wharves) (DTMR 2012a). In 2012–2013 the port experienced an increase in commercially registered
vessels (generally between 12 and 50 m in length) engaged for commercial purposes, and
commercial ship traffic associated with dredging of the port’s western section, development of the
Wiggins Island Coal Terminal and the transportation of workers and materials to three new LNG
terminals (DTMR 2013b). Since 2014, following the construction of marine infrastructure on Curtis
Island and the engagement of a base fleet of barges and ferries, the numbers of these commercially
registered vessels has reduced significantly.
The Port of Gladstone’s Port Central was designed for containerised and break bulk (non-
containerised) general cargo. Major exports through the Port of Gladstone are coal (GPC activity),
alumina, magnesia, grain, fly ash, scrap metal, cement clinker, ammonium nitrate, limestone, and
grains. The major imports arriving at the Port of Gladstone are bauxite, caustic soda, petroleum
products, liquefied petroleum gas, copper, bunker oil, liquified ammonia, sulfuric acid and
magnetite.
Facilities at the Port of Gladstone include direct rail access from the port to the national rail network.
Table 2.1 shows the main wharves, their size and details of cargoes handled. Currently one shipping
channel (in three sections: Gatcombe, Golding and Wild Cattle channels) runs from South Trees in
the south of the harbour out to the Fairway Buoy at the outer boundary of the port, with a number
of bypass channels associated with Gatcombe, Golding and Clinton channels. In all there are eight
sections of channel (four in the inner harbour and four in the outer harbour). The outer harbour
consists of Boyne, Wild Cattle, Gatcombe and Golding channels. The inner harbour consists of
Auckland, Clinton, Targinie and Jacobs channels. Duplication of the Gatcombe and Golding channels
have been proposed to provide a two-way passage from the outer harbour, around East Banks, to
the western side of Facing Island. The draft Environmental Impact Statement (EIS) guidelines were
released for public comment by the Department of Sustainability, Environment, Water, Population
and Communities (SEWPaC) on 14 January 2013, and are currently being progressed4. The $400
million channel development will be 9.12 km long, have a depth of 16 m and a width of 200 m,
creating an estimated 12 Mm3 of dredged material for disposal.
In addition to bulk freight wharves, the Port of Gladstone also has a marina for charter boats, fishing
boats, the Heron and Curtis Island Ferries and mooring for privately owned yachts. The marina
handles boats up to 27 m in length with a maximum draught of 4 m and there are 320 berths and
4 http://www.statedevelopment.qld.gov.au/assessments-and-approvals/port-gladstone-gatcombe-golding-cutting-channel-duplication-project.html Accessed July 2015.

10
moorings. The sheltered marina was created through a land reclamation project during the 1981–
1982 dredging program. Within the 50 Year Strategic Plan (GPC 2012) for the port and commercial
industries and tenants, there are plans to create a second marina at Boyne Island.
Table 2.1: Information on the Port of Gladstone wharves. Source: DTMR 2012a;
www.worldportsource.com5; GPC 2012)
Location Number of wharves
Design depth (m)
Max Length on Arrival (m)
Main cargos Annual handling (million tonnes)
Auckland Point
4 11.3–11.4 200–238 Magnesia, calcite, break bulk, grain, petroleum products, caustic soda, general cargo and containers, gypsum, magnetite, liquefied petroleum gas, scrap metal, and ammonium nitrate.
1.4
RG Tanna Coal Terminal (Clinton Coal)
4 18.8 315 Coal 70
Wiggins Island Coal export Terminal (WICT)
1 (4 in development)
Coal 27 (84 projected)
Curtis Island 3 LNG 23.9 (projected)
Barney Point Terminal*
1 15 270 Coal, bunker coal, magnesia, limonite, cotton seed
8*
Fishermans landing
4 11.2–12.9 180–250 Bauxite, alumina, caustic soda, cement and cement clinker, fly ash, limestone and liquified ammonia, sulfuric acid
12.5
South Trees 2 12.8 265 Alumina, caustic soda, bunker oil, bauxite, and bunker coal.
13
Boyne Smelter wharf
1 15 230 Aluminium, petroleum coke, liquid pitch, and general break bulk cargo
0.6
*Due to close to coal in 2016–17 in response to the opening of the nearby Wiggins Island Coal Terminal.
A number of major industries depend on the port and are located either on the shores of Port Curtis
or within the adjacent coastal area and connected by road and rail (Figure 2.3)6. These include:
Queensland Curtis Island Liquified Natural Gas project: three processing plants on Curtis
Island
Queensland Alumina Ltd: one of the world’s largest alumina refineries
Rio Tinto Alcan Yarwun: a newer alumina refinery, commencing operations in 2004
5 http://www.worldportsource.com/ports/commerce/AUS_Port_of_Gladstone_490.php Accessed June 2015. 6 http://www.gladstoneregion.info/attractions/industrial-giants/ Accessed April 2015.

11
Boyne Smelters Ltd (BSL): the largest aluminium smelter in Australia
Cement Australia Gladstone: the largest cement plant in Australia
Orica Australia: chlor-alkali, ammonium nitrate (500,000 t per year) and sodium cyanide
plants, and
NRG Gladstone Power Station: Queensland’s largest coal-fired power station.
Figure 2.3: Location and map of the Port of Gladstone, showing rail and road link and major
industries.
The Port Curtis region is a macro-tidal estuarine system. It includes an intricate network of rivers,
creeks, inlets, shoals, mud banks, channels and islands. Due to these physical features, complex
water circulation patterns occur throughout the harbour and are primarily governed by a large
barotropic tidal flow which contributes to high natural sediment loads (Herzfeld et al. 2004). The
mean spring tidal range is 3.2 m (high water tides of 4.8 m and low water down to 0.3 m) and 1.5 m
during neap tides. Tidal currents often reach speeds of 2.5 knots (but can reach 4 knots during
strong winds and spring tides) (Herzfeld et al. 2004). The port experiences easterly to south-easterly
prevailing winds but Facing and Curtis islands protect it from onshore waves and tropical cyclones.
Shallow waters (2 to 3 m in depth) to the south of Facing Island and north of Wild Cattle Island also
protect the area from prevailing winds. The Port of Gladstone is at risk from tropical cyclones
potentially affecting the area during the months of November to April. The estuary has salinities of
30 to 35 parts per thousand (ppt) for most of the year, due to low fresh water inputs. Spatial

12
variability in salinity is due to evaporative losses in shallow sheltered bays and there is temporal
variability following pulses of freshwater input to the system during the wet season and following
storm events (Apte et al. 2005).
The region includes a diversity of marine and coastal habitats including coral reef, seagrass
meadows, mangrove, saltmarsh, salt pans, sand dunes, oyster and rocky reef. The intertidal
wetlands of Port Curtis were last characterised in depth in 2006 by Connolly et al. (2006), using
combined data from Landsat imagery, aerial photography and field observations. Connolly et al.
(2006) identified that 18% of the intertidal area was salt flats without vegetation, saltmarsh (4% of
the intertidal), mangroves (31%), unvegetated mudflats (25%) and seagrass (20%). Mangrove
monitoring has only recently been reinstated and therefore it is difficult to identify trends; however,
regular monitoring of the seagrass extent has identified declines of 50-75% over the past decade
(Bryant et al. 2014). Despite increases in meadow area in 2014, seagrass meadow area and biomass
generally remain below the long-term average following significant declines in 2009–2010 (Carter
et al. 2015). The Port Curtis region also sustains a recreational and professional fishing industry
(trawl, net and trap fisheries) for species such as mud crab (Scylla serrata), banana prawn (Penaeus
merguiensis), barramundi (Lates calcarifer) and sea mullet (Mugil cephalus).
Reflecting its ecosystem value the port boundaries overlap with the Coral Sea, GBRWHA, Dugong
Protection Areas, Boyne Island Conservation Park and various national parks and state forests
(Figure 2.4). GPC is also currently funding a project managed by Queensland Parks and Wildlife
Service (QPWS) to investigate the Calliope River, Gladstone, for its suitability for inclusion into the
declared Fish Habitat Area network. Over the past century, extensive areas (approximately 1,600 ha)
of mangroves, seagrass meadows and salt marshes/salt pans have been reclaimed for infrastructure
at the port and marina, as well as for industrial and urban development (Jones et al. 2005). For
example, dredged spoil from the 1981–1982 dredging campaign was used to reclaim the GPC Marina
and Spinnaker Parklands and in 2011 an extension to the wharves at Fishermans Landing reclaimed
300 ha resulting in the loss of 90 ha of seagrass habitat.
The Port of Gladstone lies within the boundaries of the GBRWHA and is adjacent to the GBRMP and
the Port Curtis Coral Coast (PCCC) regional Traditional Use of Marine Resources Agreement
(TUMRA), which was developed under the Reef Rescue Land and Sea Country Indigenous
Partnerships Program. The PCCC TUMRA area extends from Burrum Heads (south of Bundaberg), to
the mouth of the Fitzroy River and covers the Gooreng Gooreng, Gurang, Tarebilang Bunda and
Bailai people’s 26,386 km2 of Sea Country.

13
Figure 2.4: Map of important wetlands and boundaries of Important Fish Habitat Areas and Dugong
Protection Areas within and adjacent to the Port of Gladstone.
2.2.2. Catchment activities for the Port of Gladstone
The Port of Gladstone climate is a seasonal wet summer, dry winter regime. Compared to the Port of
Rockhampton, freshwater inflow is relatively low. Two main rivers drain into Port Curtis Bay: the
Calliope River and the Boyne River. The Calliope River mouth enters Port Curtis just north of
Gladstone, adjacent to the NRG Power Station. The Calliope catchment is bounded by the Calliope
Range to the west and the Mount Larcom Range to the north and covers 2236 km2 (DNRW 2007).
Mean annual rainfall (from 1920 to 1969) is between 800 and 1000 mm (60% of which falls between
December and March) and annual river discharge estimates are 153,000 ML (Castlehope gauging
station) (C&R Consulting 2005). Over 60% of the basin’s native vegetation has been cleared (C&R
Consulting 2005), primarily for agriculture. The Calliope Basin also encompasses part of the
Gladstone State Development Area (GSDA), a significant industrial land bank established by the
Queensland Government in 1993 to secure a large area of land with ready access to the Port for
large industrial development over a 30- to 50-year timeframe. Land use within the GDSA is governed
by a planning scheme that is controlled by the coordinator-general. Dougall et al. (2014) modelled
average annual loads of TSS released into the GBR region from the Calliope as 44 kt per year, an
estimated 2.8 times higher than pre-development loads (see also Section 3.2 of this report).

14
The Boyne River drains into Port Curtis just south of Gladstone, between Boyne Island and Tannum
Sands. The Boyne River basin, which covers about 2,590 km2, consists of one major river system (the
Boyne River) and a number of tributaries (including Ridler, Degalgil, Marble and Diglum creeks)
(DNRM 2014). Predominant land use within the catchment is agriculture. Approximately 15 km
south-west of the mouth of the Boyne River, the river has been dammed to create a reservoir
(Awoonga Dam), which has a storage volume of approximately 777,000 ML and is owned and
managed by Gladstone Area Water Board (GAWB) to supply urban, industry, power generation and
port facilities (such as parklands) in Gladstone. Average annual rainfall in the Boyne catchment
ranges from 800 to 1,000 mm. Dougall et al. (2014) modelled average annual loads of total
suspended solids (TSS) released into the GBR region from the Boyne as 11 kt per year, which is a 3.7
times increase on estimated pre-development loads. Prior to this Kroon et al. (2012) reported
estimated loads of TSS released into the GBR region from the Boyne as 43 kt per year, 2 kt more
than estimated for pre-European loads. However, no information is provided on the dates the Kroon
et al. (2012) average loads were derived from and therefore comparisons should be made with
caution.
The Port of Gladstone is also influenced by sediment from the Fitzroy Basin to the north and during
intense flood events (for example those experienced in 2011) flood plumes from the Mary-Burnett
River catchments to the south have been identified as contributing to TSS in the region (Devlin et al.
2011). Strong tidal currents operating within the shallow complex environment of the Port of
Gladstone induce regular re-suspension of bottom sediments, which often mask river plume signals
(Petus & Devlin 2012); however, during extreme events river plumes may exceed harbour re-
suspension.
2.3. Quality Assurance and Environmental Certifications
Operation of the Port of Rockhampton and the Port of Gladstone occurs within GPC’s Environmental
Management System (EMS), which is based on the internationally recognised specification for
environmental management, AS/NZSISO14001:2004. External certification of the GPC EMS to
AS/NZSISO14001:2004 was achieved by the port early in 2006. ISO 14001:2004 requirements for an
environmental management system (EMS) are to enable an organisation to develop and implement
a policy and objectives that take into account legal requirements and other requirements to which
the organisation subscribes, and information about significant environmental aspects. It applies to
those environmental aspects that the organisation identifies as those it can control and those it can
influence. It does not itself state specific environmental performance criteria. Section 5 of this report
provides more detail on environmental management structures in the two ports.
Following concerns voiced to UNESCO and the International Union for Conservation of Nature (IUCN)
in 2012 regarding the environmental management and governance of development occurring in the
Port of Gladstone, an independent review was instigated. The review found that the environmental
management and governance were generally comprehensive but identified areas of improvement in
terms of incorporating world heritage status and other environmental protection into port planning

15
in a more singular, comprehensive and consultative way; assessing and addressing cumulative
impacts; and having more meaningful and ongoing stakeholder engagement (including better data
sharing) (SEWPaC 2013). A response to the latter was the establishment, by the Queensland
Government, of the Gladstone Healthy Harbour Partnership (GHHP). More information on harbour
health reporting by GHHP is provided in Section 4 of this report.
2.4. National and international context of port
operations
In terms of cargo throughput, at 98 Mt per annum, the Port of Gladstone ranks fourth in size in
Australia, after Port Hedland (372 Mt), Dampier (178 Mt) and Hay Point (108 Mt) (BITRE 2014).
Figure Figure 2.5 shows the trend in export value for Australia’s top 10 ports based on value of goods
from 2003 to 2013 and illustrates that in 2013 the Port of Gladstone ranked ninth in Australia in
terms of value of exported goods.
Globally, the Port of Gladstone ranks fortieth in terms of tonnage, approximately six-fold smaller
than the largest port (Shanghai: 696 Mt per annum). The Port of Rockhampton does not rank among
the top 100 ports of the world. Australia has 32% of the world coal export share (Indonesia also has
32%), and the Port of Gladstone is the world’s fifth largest coal export port.
Global liquefied gas shipments have increased in Australia, from 514 port calls by LNG (84) and LPG
(430) tankers in Australian Ports in 2003–04, to 974 in 2012–13, just 10 years later (BITRE, 2014).
They were estimated to rise by a further 5% in 2014 (UNCTAD, 2014), alongside a projected increase
in consumption and the discovery of new gas fields worldwide. With shipments of LNG projected to
reach 24 Mt per annum in Gladstone, the growth in the size of the port is assured.
The Port of Gladstone is one of only four major ports to occur within the boundaries of a UNESCO
World Heritage Area (i.e. the GBRWHA). Also within the boundary of the GBRWHA are the major
Ports of Hay Point and Abbot Point, and the smaller ports of Cairns, Townsville and Mackay. Table
2.2 is adapted from Table 4 in the 2015 GBRMPA Dredge Synthesis Report (McCook et al. 2015), and
illustrates that maintenance dredging volumes are lower for the Port of Gladstone than other ports
in the GBRWHA, noting that these figures do not include capital dredging. The amount of coral and
seagrass within 10 km of the port is greater for Gladstone than for the other major ports of Abbot
Point and Hay Point, which are headlands as opposed to sheltered estuaries.

16
Figure 2.5: Top 10 Australian international sea freight ports with highest export value ($ billion)
(Source: BITRE 2014).
Table 2.2: Proximity of coral reefs and seagrass meadows to maintenance dredging and disposal
activities associated with major ports (adapted from McCook et al. 2015).
Location Dredging history (years)
Maintenance dredging
Amount of coral within: Amount of seagrass within:
0-2 km
2-10 km
10-30 km
30-50 km
0-2 km
2-10 km
10-30 km
30-50 km
Cairns ~100 *** - * ** *** ** *** *** ***
Townsville 131 *** *** *** ** ** ** *** *** ***
Abbot Pt 30 * - * ** *** ** ** ** ***
Mackay ~75 * * - ** ** * ** *** ***
Hay Point ~43 ** - * ** *** ** ** ** ***
Gladstone ~100 * * ** ** *** ** *** *** **
Amounts shown are relative to other ports: – nil; * little; ** moderate; *** large amounts.
0
5
10
15
20
25
30
35
40
$ b
illio
n
Financial year
Dampier
Port Hedland
Melbourne
Newcastle
Hay Point
Brisbane
Fremantle
Sydney
Gladstone
Adelaide

17
In 2012 a comparison of dissolved metals in Port Curtis (Port of Gladstone) to other industrialised
harbours in the world was produced by Angel et al. (2012) (Table 2.3). Concentrations of dissolved
cadmium, copper, nickel and zinc were an order of magnitude lower in the Port of Gladstone
compared to the Humber Estuary (United Kingdom) and the Scheldt Estuary (Netherlands) and
comparable with Port Jackson (New South Wales, Australia) for cadmium and nickel (Table 2.3), but
higher than measurements for the New South Wales coast (Eden, Ulladulla, Terrigal, Port Macquarie
and Yamba). It should also be noted that estimated background concentrations of nickel, arsenic and
chromium in Port Curtis sediments appear to be related to local geology with contributions from the
Doonside and Wandilla formations; according to Vincente-Beckett et al. (2006).
Table 2.3: Comparison of dissolved metal concentrations in Port Cutis in 2011 to other
industrialised harbours and coasts (Source: Angel et al. 2012).
Other major ports abroad are situated directly adjacent to the boundaries of World Heritage Areas
(WHAs). For example, the major German ports of Hamburg, Bremen/Bremerhaven and
Wilhelmshaven, the Dutch Eemshaven and the Danish Esbjerg, whilst just outside the Wadden Sea
WHA boundaries, experience similar challenges of managing ecosystem health with port expansion
and large-scale industrialisation (Kabat et al. 2012). The Elbe Estuary, which leads to the Port of
Hamburg (third largest port in Europe, and fifteenth largest in the world) is characterised by strong

18
tidal influence, large and increasing sediment loads (leading to increased dredging), large areas of
valuable wetland ecosystems, industrial development and significant dredging activities7. One major
difference for some of these ports is that sedimentation, and balancing the sediment budget of the
estuaries, is considered an important part of managing the wetland habitats within the area, and
therefore spoil disposal is preferentially carried out within the system (Deltares 2012). In February
2015, the Queensland Government committed to legislate to restrict capital dredging for the
expansion of existing port facilities to within the regulated port limits of Gladstone, Hay
Point/Mackay, Abbot Point and Townsville, and to prohibit the sea-based disposal of capital dredge
material from these sites in the GBRWHA. Removal of dredge material to land may contribute to a
net change in the balance of sediments within the bay.
Similar to the situation in the Ports of Gladstone and Rockhampton, many European ports must
manage water quality issues resulting not only form their own activities but in terms of catchment
activities and those of adjacent industry. Through implementing environmental directives, Europe
has moved towards coordinated and integrated catchment-to-coast management, following the
most novel legislation on ecosystem-based approaches worldwide (Borja et al. 2010). The European
Water Framework Directive (WFD), which was adopted in 2000, changed water management in all
member states of the European Union (EU) fundamentally, putting aquatic ecology at the base of
management decisions. The European Marine Strategy Framework directive was transposed into
national legislations across the European Union in 2010 and enshrines, in a legislative framework,
the ecosystem approach to the management of human activities having an impact on the marine
environment, integrating the concepts of environmental protection and sustainable use. It is the first
EU legislative instrument related to the protection of marine biodiversity, as it contains the explicit
regulatory objective that "biodiversity is maintained by 2020"8.
7 http://www.tide-project.eu Accessed June 2015. 8 Directive 2008/56/EC of the European Parliament ec.europa.eu Accessed June 2015.

19
3. Factors influencing port water quality
The quality of water in industrial ports is influenced by different drivers and pressures than other
coastal marine waters. Port water quality is influenced by a variety of factors including river and
stream inputs (similar to other coastal marine waters); urban run-off and stormwater, which is often
more concentrated around ports; discharge and run-off from port-side industries; fishing and
boating activities; and port-related activities including construction and dredging, shipping
movements, loading and unloading (Figure 3.1). The Port of Gladstone and the Port of Rockhampton
are both influenced by all of these factors, to different degrees. The Port of Gladstone is directly
influenced by the city of Gladstone, whereas the Port of Rockhampton is less directly influenced by
urban inputs, being approximately 50 km downstream of the city of Rockhampton. While the Port of
Gladstone is much more industrialised and busier in terms of shipping movements and construction
activities, the Port of Rockhampton is subject to influence from a much larger catchment area in its
location at the delta of the Fitzroy River.
Figure 3.1: Factors influencing water quality in the Port of Gladstone and Port of Rockhampton.

20
In this section we review the factors influencing water quality in the two ports of the Fitzroy region,
and summarise available data on the level of activity and (where available) quantity of emissions
from each of these factors. Urban sources and catchment sources are both subject to separate
studies being done as part of the Fitzroy Water Quality Improvement Plan as described below, and
are not considered in detail as part of this Ports Synthesis.
3.1. Urban sources
Urban sources that potentially influence port water quality include sediments, nutrients and
contaminants (e.g. metals and petrochemicals) in diffuse stormwater and point source (e.g.
wastewater) discharges; and urban litter that, when expelled into the marine environment, becomes
one of three possible sources of marine debris (the other two being shipping and boating, and ocean
sources).
The quantity of pollution reaching ports from urban environments is a factor of the geographical size
and human population of the urban centre, stormwater and litter management processes, sewage
treatment processes, degree of coastal development, the proximity of the centre to the marine
environment and the extent of buffering environments such as coastal wetlands. An Urban Water
Quality Improvement Scoping Study is being conducted for the Fitzroy Water Quality Improvement
Plan and will gather information about urban water cycle management and water quality monitoring
for the main urban areas in Gladstone Regional Council, Rockhampton City Council and Livingstone
Shire Council local government areas. The study will include a list of priority actions to improve
urban water quality in those urban centres in the Fitzroy region including foundation activities
required to progress urban water quality improvement.
3.2. Catchment sources
Catchment run-off is a major source of sediments, nutrients and pesticides in coastal marine waters
(e.g. Dougall et al. 2005; Kroon et al. 2012; Dougall et al. 2014) including ports. As described in
Section 2 of this report, the Port of Gladstone is directly influenced by run-off draining from the
Calliope and Boyne basins, and is also potentially influenced by the Fitzroy Basin, which drains to the
north and the Baffle, Kolan, Mary and Burnett basins draining to the coast south of Gladstone.
Situated in the mouth of the Fitzroy River, the Port of Rockhampton is strongly influenced by the
quality of water draining from the large Fitzroy Basin. The Styx, Shoalwater and Water Park
catchments all drain to the north of the Port of Rockhampton, and influence surrounding marine
waters but are unlikely to have a significant influence on the port in comparison to the much larger
Fitzroy. As well as anthropogenic land-use influences, water quality running off catchments into the
marine area can also be influenced in part by natural factors such as rainfall and geology (e.g. Bartley
et al. 2012).
Dougall et al. (2014) modelled average annual pollutant loads for the Fitzroy Natural Resource
Management (NRM) Region catchments. Total suspended sediment, nutrients (total nitrogen,

21
dissolved inorganic nitrogen, dissolved organic nitrogen, particulate nitrogen, total phosphorus,
dissolved inorganic phosphorus, dissolved organic phosphorus, particulate phosphorus) and selected
photosynthesis II-inhibiting herbicides (known as PSII herbicides) of atrazine, hexazinone, diuron,
tebuthiuron, ametryn loads were modelled (Table 3.1). Catchment loads are further discussed in the
study Ecologically Relevant Targets for Pollutant Discharge from the Drainage Basins of the Fitzroy
Region, Great Barrier Reef, which is also being conducted through the Fitzroy Water Quality
Improvement Plan.
Table 3.1: Contribution of major basins to regional total baseline load for the Fitzroy NRM Region
(Source: Dougall et al. 2014).
River basin Basin area (km2)
TSS (kt/yr)
TN (t/yr)
DIN (t/yr)
DON (t/yr)
PN (t/yr)
TP (t/yr)
DIP (t/yr)
DOP (t/yr)
PP (t/yr)
PSII (kg/yr)
Styx 3013 68 154 38 56 60 38 8 1 29 22
Shoalwater 3601 53 137 45 66 25 21 9 2 10 14
Waterpark 1836 32 150 54 79 18 19 10 2 6 10
Fitzroy 142552 1740 3688 1106 1548 1035 983 245 50 687 521
Calliope 2241 44 90 23 33 34 27 4 1 21 10
Boyne 2496 11 24 6 9 10 6 1 0 4 2
TOTAL 152727 1948 4244 1272 1790 1181 1093 278 56 759 579
3.3. Shipping
Commercial shipping is a factor influencing water quality, which is unique to port areas and shipping
routes. Currently, the primary shipping activity in both of the Fitzroy ports is multi-cargo import and
export shipping (see also Section 2 of this report). There is also a proposal for P&O cruise ships to
stop in Gladstone on regular tours of Queensland waters. Pollutant sources associated with shipping
activities include:
Ship movements
o propeller wash and berthing settlement (re-suspension of sediments)
o petrochemical emissions
Shipping incidents and grounding, including oil spills, hazardous material spills and waste
Marine debris (dumping/losing garbage at sea)
Discharge of ballast water, and

22
Use of anti-fouling paints.
Activity and emissions data available for the Ports of Gladstone and Rockhampton are detailed
below.
3.3.1. Ship movements: sediment re-suspension and emissions
Shipping movements, propeller wash from large ships and berthing can all potentially result in re-
suspension of sediments from the benthos (Grech et al. 2013). Shipping movements are also
accompanied by engine operation, which results in emissions of petrochemicals and airborne
nitrogen oxide and oxides of sulfur, although current knowledge about ship emissions in Australian
ports is limited (Goldsworthy & Galbally 2011). While there are no specific data quantifying the
impacts on water quality of shipping emissions, the level of shipping activity in a port can give an
indication of the potential level of influence. Shipping activity can be reported as the number of
commercial vessel registrations and the number of ship movements per annum.
The number of commercial vessels registered in Queensland including the Gladstone region9 were
comparable between months and years from Maritime Safety Queensland (MSQ) data from 2008
until July 2013. During that time the peak for the Gladstone region was in 2012 at around 960
vessels (DTMR 2013a; MSQ 2015). Following July 2013, commercial vessel registrations are operating
under different legislation meaning the registration numbers are not comparable with previous
registration numbers from that date onwards. The most common size classes of registered
commercial vessels in the Gladstone region are 3.00 to 4.49 m, 4.50 to 5.99 m and 12.00-14.99 m
(Table 3.2).
Following the completion of major marine construction projects including dredging of the Western
Basin, construction of berths at Wiggins Island and Curtis Island and rationalisation of the
construction fleet operating between the mainland and Curtis Island, the number of commercial
vessels within the Port of Gladstone decreased substantially (GPC Pers. Comm., 31 July 2015). The
quantum of construction traffic is reflected by shipping movements data, which indicate a large
increase during port expansion projects in 2011–12. In 2011–12 shipping movements increased by
514% on 2010–11, with 202,050 movements in 2011–12 in comparison to 32,878 movements in the
previous year (DTMR 2012b).
3.3.2. Shipping incidents
The Australian Maritime Safety Authority (AMSA) and MSQ maintain databases on incidents of
pollution. Quantitative data are publicly available for the reported shipping incidents recorded by
9 MSQ’s operational boundaries for the Gladstone maritime region includes 1868 km of mainland coastline from Double Island Point to St. Lawrence, 1342 km of island coastline and 26,190 km of inland waterways. There are three major trading ports in the region—the Port of Gladstone, the Port of Rockhampton and the Port of Bundaberg, as well as major marinas in Hervey Bay, Bundaberg and Rosslyn Bay which together have berths for approximately 900 vessels (DTMR, 2013a).

23
MSQ per annum (although data are less detailed from 2007 onwards than in earlier years) and the
number of incident prosecutions recorded by AMSA.
Oil discharge refers to any discharges or suspected discharges of oil from a vessel in excess of that
permitted under the International Convention for the Prevention of Pollution From Ships, MARPOL
73/78 (usually 15 ppm oil in water), and oil spills are defined as accidental spills from incidents such
as vessel collisions or groundings, overflowing tanks or burst hoses. The data on oil spills into the
Port of Gladstone between 2009 and 2013 is summarised in Table 3.3. No reports of spills were
recorded for the Port of Rockhampton during the same period. The most significant reported events
by volume were a land-based spill of 1000 L of diesel in 2009, and a ship-based spill of 1500 L of
sewage and grey water in 2012. Small amounts of diesel and hydraulic fluid are the most frequent
spills from both land and ship sources.
Summarised in Table 3.4 are the published records of successful oil and chemical pollution
prosecutions in Gladstone and Rockhampton locations with associated penalty amounts. Major
shipping incidents are listed separately on AMSA’s website and include two oil spills in the vicinity of
the Ports of Gladstone and Rockhampton. In January 2006 a 25 t heavy fuel oil spill occurred in the
Port of Gladstone from the breached hull of a bulk carrier ship (Korean origin, Global Peace), which
was damaged during berthing at the RG Tanner coal loading facility10. Surveys of PAH concentrations
were subsequently conducted and exceedances of Australian and New Zealand Sediment Quality
Guidelines (ANZECC/ARMCANZ 2000) were identified, with very few to no crabholes in the high
intertidal zone compared to a non-impacted control site (Andersen et al. 2008). In February 2010, a
bulk coal carrier (Chinese origin, Shen Neng 1) ran aground on Douglas Shoal in the GBRMP east of
Great Keppel Island, carrying 68,000 t of coal, which it had loaded in the Port of Gladstone11. The
Shen Neng 1 spilled 4 t of fuel oil from a ruptured fuel tank.
10 https://www.amsa.gov.au/environment/major-historical-incidents/Global_Peace/index.asp Accessed June 2015 11 https://www.amsa.gov.au/environment/major-historical-incidents/Shen_Neng1/index.asp Accessed June 2015

24
Table 3.2: Commercial registrations by vessel size for Gladstone Region as of 30 September of
reported years (2008–2014) (data source: MSQ 2015).
Size (m) 2008 2009 2010 2011 2012 2013* 2014*
Up to 2.99 0 0 0 0 0 0 0
3.00-4.49 250 232 214 227 211 164 79
4.50-5.99 181 186 197 206 225 131 16
6.00-7.99 33 32 32 39 43 37 0
8.00-9.99 50 53 49 53 55 43 0
10.00-11.99 73 69 71 78 78 51 2
12.00-14.99 122 111 106 104 101 83 0
15.00-17.99 52 47 52 58 63 49 0
18.00-24.99 84 85 83 84 91 72 0
25.00-34.99 15 14 15 19 32 21 0
>35.00 9 9 12 32 51 22 0
Total 868 838 831 900 950 673 97
* “Note: As of 1 July 2013 the majority of commercial vessels registered in Queensland are now operating under the Marine
Safety (Domestic Commercial Vessel) National Law Act 2012. It is estimated that there are approximately 500 vessels that
will not be subject to the National Law that will remain registered as commercial vessels in Queensland come 30 June 2014.
The remainder of the vessels are those that have a current Queensland commercial registration certificate, which is deemed
to be a Certificate of Operation under the National Law for the transitional period, and will not be renewed in the
Queensland system.” (MSQ 2015a).

25
Table 3.3: Oil spills and pollution events in the Port of Gladstone reported to MSQ in 2013, ship
and land-based sources (Queensland Government 2014). U = unknown quantity.
Date Source Ship type Area Location Oil type Litres
5/01/09 Unknown N/A Port Auckland Creek, Gladstone Sheen U
1/02/09 Unknown N/A Port Gladstone Marina Diesel 20
10/02/09 Ship Commercial Port North Channel, Gladstone Diesel 20
27/02/09 Land N/A Port Walby Creek, Gladstone Diesel 1,000
23/08/09 Unknown N/A Port Mouth of Auckland Creek, Gladstone unknown U
4/01/10 Unknown N/A Port Auckland Creek, Gladstone Diesel U
13/04/10 Unknown N/A Port Gladstone Marina Diesel 10
28/07/10 Unknown N/A Port South Trees West Wharf, Gladstone Diesel U
13/08/10 Land N/A Port South Trees East Wharf, Gladstone HFO 100
11/02/11 Ship Commercial Port Auckland Pt Wharf, Gladstone Diesel 15
11/04/11 Ship Commercial Port North China Bay, Gladstone Hydraulic 20
13/07/11 Unknown Unknown Port Between Q4 and Q6 beacons in Quoin Channel, Gladstone
Sheen N/A
14/07/11 Ship Commercial Port LNG Maritime Offload Facility Curtis Island, Gladstone
Hydraulic 20
23/07/11 Unknown Unknown Port Fishermans Landing (Bechtel Barge Ramp), Gladstone
Hydraulic 5
16/08/11 Ship Commercial Port North Passage Island, Gladstone Engine 10
31/10/11 Land N/A Port GLNG MOF Pioneer Barge Ramp south of China Bay Curtis Island
Coolant 50
2/11/11 Land N/A Port GLNG MOF south of China Bay Curtis Island
Hydraulic U
21/11/11 Ship Commercial Port North Passage, China Bay Hydraulic 50
12/12/11 Ship Commercial Port North Passage Island Channel Hydraulic 10
25/12/11 Ship Commercial Port Curtis Island side of Passage Island Channel
Hydraulic 10
28/03/12 Ship Recreational Port Curtis Island side of Passage Island Channel
Hydraulic U
30/04/12 Ship Commercial Port Jacobs Channel, Curtis Island Sheen U
24/05/12 Ship Commercial Port Curtis Island QCLNG Project: Offload Facility
Hydraulic 2
2/06/12 Ship Commercial Port Curtis Island GLNG Marine Offload Facility
Hydraulic 20
3/06/12 Ship Commercial Port RG Tanna Loadout Facility Diesel 1
4/09/12 Ship Commercial Port limits
Gladstone Harbour Bilge 10
14/07/12 Unknown Unknown Port Limits
Fishermans Landing Diesel 100
10/11/12 Ship Fishing Port limits
Fishermans Finger, Gladstone Diesel 30
2/08/12 Ship Commercial Port limits
Behind Clinton Wharf Hydraulic Fluid 2
5/08/12 Ship Commercial Port limits
North Passage Island, Gladstone Hydraulic Fluid 5
14/10/12 Ship Commercial Port limits
Clinton Wharf Hydraulic Fluid 10
24/11/12 Ship Commercial Port limits
China Bay, Curtis Island Hydraulic Fluid 1
13/08/12 Ship Commercial Port limits
Middle Bank Quoin Anchorage N/A U

26
22/10/12 Ship Commercial Port limits
South Passage Island Sewage & grey water
1500
15/10/12 Land N/A Port limits
GLNG MOF, Gladstone sodium Hypochlorite
100
10/11/12 Ship Fishing Port limits
Fishermans Finger, Gladstone Diesel 30
24/11/12 Ship Commercial Port limits
China Bay Curtis Island Hydraulic Fluid 1
12/05/13 Ship Commercial Port limits
Gladstone Harbour Diesel 0.3
20/06/13 Ship Commercial Port limits
Passage Island Channel, Gladstone Diesel
14/03/13 Land N/A Port limits
Curtis LNG Hydraulic Fluid 25
11/04/13 Land N/A Port limits
Curtis LNG Hydraulic Fluid 1
18/04/13 Land N/A Port limits
Curtis LNG Hydraulic Fluid 0.1
14/05/13 Ship Commercial Port limits
Gladstone Harbour Hydraulic Fluid 0.1
20/06/13 Ship Commercial Port limits
Wiggins Island Coal Terminal Hydraulic Fluid 1
10/06/13 Land N/A Port limits
Curtis LNG Lanolin 1
14/03/13 Land N/A Port limits
Curtis LNG Hydraulic Fluid 25
11/04/13 Land N/A Port limits
Curtis LNG Hydraulic Fluid 1
18/04/13 Land N/A Port limits
Curtis LNG Hydraulic Fluid 0.1
12/05/13 Ship Commercial Port limits
Gladstone Harbour Diesel 0.3
14/05/13 Ship Commercial Port limits
Gladstone Harbour Hydraulic Fluid 0.1
10/06/13 Land N/A Port limits
Curtis LNG Lanolin 1
20/06/13 Ship Commercial Port limits
Wiggins Island Coal Terminal Hydraulic Fluid 1
20/06/13 Ship Commercial Port limits
Passage Island Channel, Gladstone Diesel U
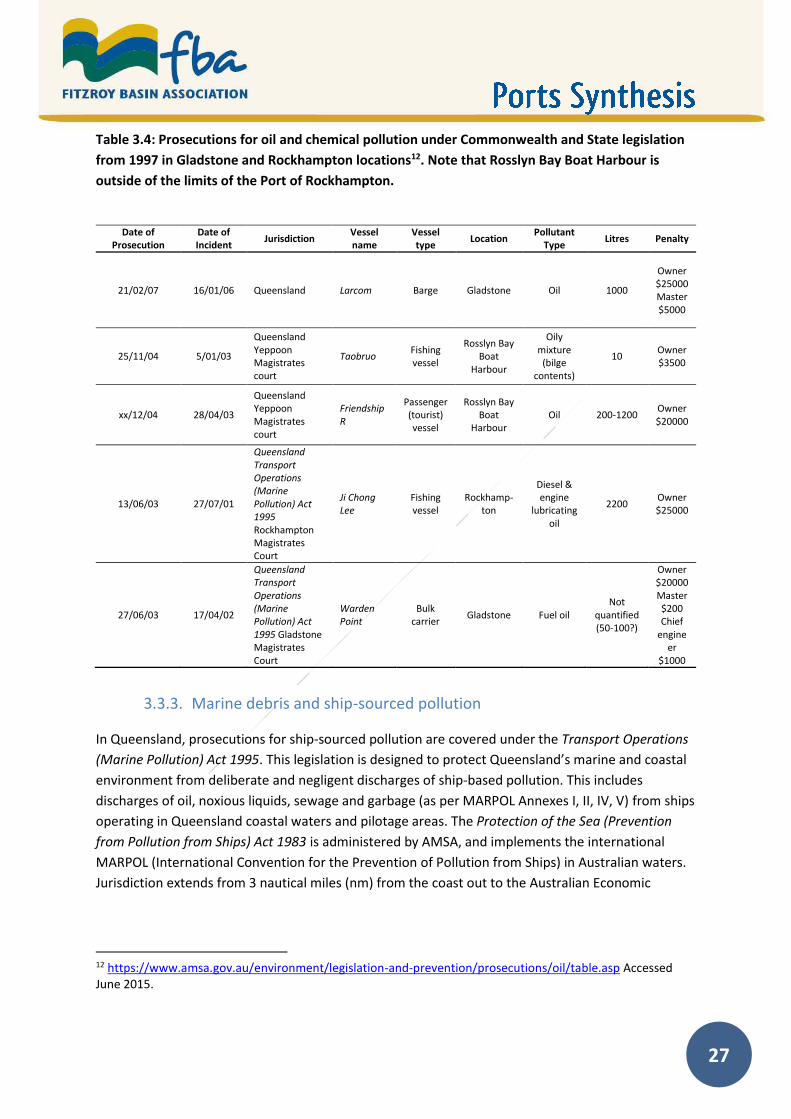
27
Table 3.4: Prosecutions for oil and chemical pollution under Commonwealth and State legislation
from 1997 in Gladstone and Rockhampton locations12. Note that Rosslyn Bay Boat Harbour is
outside of the limits of the Port of Rockhampton.
3.3.3. Marine debris and ship-sourced pollution
In Queensland, prosecutions for ship-sourced pollution are covered under the Transport Operations
(Marine Pollution) Act 1995. This legislation is designed to protect Queensland’s marine and coastal
environment from deliberate and negligent discharges of ship-based pollution. This includes
discharges of oil, noxious liquids, sewage and garbage (as per MARPOL Annexes I, II, IV, V) from ships
operating in Queensland coastal waters and pilotage areas. The Protection of the Sea (Prevention
from Pollution from Ships) Act 1983 is administered by AMSA, and implements the international
MARPOL (International Convention for the Prevention of Pollution from Ships) in Australian waters.
Jurisdiction extends from 3 nautical miles (nm) from the coast out to the Australian Economic
12 https://www.amsa.gov.au/environment/legislation-and-prevention/prosecutions/oil/table.asp Accessed June 2015.
Date of Prosecution
Date of Incident
Jurisdiction Vessel name
Vessel type
Location Pollutant
Type Litres Penalty
21/02/07 16/01/06 Queensland Larcom Barge Gladstone Oil 1000
Owner $25000 Master $5000
25/11/04 5/01/03
Queensland Yeppoon Magistrates court
Taobruo Fishing vessel
Rosslyn Bay Boat
Harbour
Oily mixture
(bilge contents)
10 Owner $3500
xx/12/04 28/04/03
Queensland Yeppoon Magistrates court
Friendship R
Passenger (tourist) vessel
Rosslyn Bay Boat
Harbour Oil 200-1200
Owner $20000
13/06/03 27/07/01
Queensland Transport Operations (Marine Pollution) Act 1995 Rockhampton Magistrates Court
Ji Chong Lee
Fishing vessel
Rockhamp-ton
Diesel & engine
lubricating oil
2200 Owner $25000
27/06/03 17/04/02
Queensland Transport Operations (Marine Pollution) Act 1995 Gladstone Magistrates Court
Warden Point
Bulk carrier
Gladstone Fuel oil Not
quantified (50-100?)
Owner $20000 Master $200 Chief
engineer
$1000

28
Exclusive Zone (200 nm) and applies within 3 nm where the State does not have complementary
legislation.
Publicly available records of prosecutions for ship-sourced garbage pollution are maintained by
AMSA. Thirteen of 22 records were from within or near the GBRMP, and the records from incidents
offshore of the Fitzroy region are provided in the Appendix (see Table A.1). The most recent
incidents offshore of the Fitzroy region were as follows. A Chinese shipping company was fined
$20,000 when a vessel (Panama-registered, Xin Tai Hai) disposed of rubbish overboard
approximately 16 nm off the Port of Gladstone in June 201313; and in June 2012 a Chinese shipping
company was fined $5,000 and the ship master $300, after garbage was dumped from the Hope Star
210 km north-east of Gladstone14. These incidents may not have influenced water quality in the Port
of Gladstone as they occurred offshore.
The broader topic of marine debris is discussed in more detail in Sections 3.6 and 4.1.6.
3.3.4. Discharge of ballast water
The discharge of high-risk ballast water into Australian ports or territorial sea is prohibited, and the
Australian Government’s Australian Ballast Water Management Requirements — Version 5, deems
“salt water from ports and coastal waters outside Australia’s territorial sea to be a ’high-risk’ and
capable of introducing exotic marine pests into Australia”. The following ballast water types are
deemed to be ‘low-risk’:
Fresh potable water sourced from a municipal water supply, with supporting documentation
Ballast water that has been exchanged at an approved location (mid-ocean) by an approved
method
Ballast water of which at least 95% was taken up in mid-ocean, and
Ballast water of which at least 95% was taken up inside Australia’s territorial sea.15
Ballast water taken up within Australian territorial seas or from domestic ports is managed by State
or Territory government agencies. All vessels must have a Ballast Water Management Plan on board
that specifically applies to that vessel and must provide detailed instructions for the ship’s crew on
the safe management of ballast regardless of conditions at sea (DAFF 2011). Ballast water
management is important because ships can carry up to 70,000 t of ballast water, in which
potentially noxious species could be transported, including plankton, larvae of invertebrates and fish
and pathogens (Low 2003).
13 https://www.amsa.gov.au/media/documents/xx112014MediaReleaseGarbageProsecution.pdf Accessed June 2015 14 http://www.gladstoneobserver.com.au/news/hope-star-captain-and-owner-fined-reef-rubbish-tos/1647762/ Accessed June 2015 15 http://www.agriculture.gov.au/biosecurity/avm/vessels/quarantine-concerns/ballast/australian-ballast-water-management-requirements Accessed August 2015

29
Ten introduced marine species were identified in the Port of Gladstone in 2001 (Table 3.5; Lewis et
al. 2001). None of the identified species were invasive species or were of significant concern and all
were thought to be translocated via hull fouling, suggesting that the number of ships and residence
time of ships visiting wharves are important considerations (Lewis et al. 2001).
A number of invasive marine species have the potential to be introduced to Queensland marine
environments (Table 3.6), with the Asian bag mussel (Musculista senhousia) identified as having the
greatest potential to establish in Queensland waters. In their response to the 2014 National Marine
Pest Biosecurity Review, Ports Australia expressed concern that responses to incursions of Asian
green mussel, Asian bag mussel and Caribbean tube worm in 2002, 2007 and 2009 were
uncoordinated and under-resourced (Fryda-Blackwell 2014).
Table 3.5: Introduced species identified in Port Curtis survey of marine species in March 2000
(source: Lewis et al. 2001).
Name Class Probable origin Likely introduction vector
Reported distribution in Australia
Distribution in Port Curtis
Botrylloides leachi Ascidea (sea squirt) North-eastern Atlantic/Europe
Hull fouling/boring, mariculture
NSW, VIC, SA, WA, QLD
Auckland Point, South Trees Wharf
Styela plicata Ascidea (sea squirt) Philippines Hull fouling/boring, mariculture
WA, SA, NSW, VIC, QLD
Wharf pylons throughout Port Curtis
Amathia distans Bryozoa (lace coral) Brazil QLD, WA, SA, VIC
Wharf pylons throughout Port Curtis
Bugula neritina Bryozoa (lace coral) Europe Hull fouling/boring, mariculture
SA, VIC, NSW, WA, QLD
Gladstone Marina, Wharf pylons throughout Port Curtis
Cryptosula pallasiana Bryozoa (lace coral) North Atlantic Hull fouling/boring, mariculture
TAS Wharf pylons throughout Port Curtis
Watersipora subtorquata/acuata
Bryozoa (lace coral) Pacific Hull fouling/boring, mariculture
WA, SA, NSW, VIC, TAS, QLD
Wharf pylons throughout Port Curtis
Zoobotryon verticillatum Bryozoa (lace coral) North Europe Hull fouling/boring, mariculture
Gladstone Marina, Wharf pylons throughout Port Curtis
Obelia longissima Hydrozoa North Atlantic Hull fouling/boring
QLD Wharf pylons throughout Port Curtis
Paracerceis sculpta Isopoda (slater) North American Pacific coast
Hull fouling QLD, WA, VIC, SA, NSW
South Trees Wharf
Alexandrium sp. Auckland Point, Channel Marker S19
No introduced species surveys have been undertaken in the Port of Rockhampton to date, although
a proposal for a survey similar to the Port of Gladstone survey by Lewis et al. (2001) has been
proposed in the past. Macrobenthic studies in the Port of Rockhampton suggest that the likelihood
of any exotic species currently present having a significant ecological impact is low (Curry & Small
2005). Lewis et al. (2001) also recommended continued monitoring to detect target species with
qualitative assessments of wharves, channel markers and dredged spoil grounds annually and a

30
quantitative assessment on a quarterly basis. Routine assessment of hull fouling was also
recommended as this is a primary vector of introductions to ports. The Australian Government
Department of Agriculture is currently finalising the National Marine Pest Biosecurity Review; the
department will then make recommendations to strengthen the national approach to marine
pests16.
The country of origin of ships (and other vessels, including recreational boats and yachts) visiting
ports is relevant to the possibility of marine pest incursions, particularly for ships arriving in light
draft to load at a port for export. Countries of origin of ships arriving for export to the Ports of
Gladstone and Rockhampton are given in Tables 3.7 and 3.8 respectively.
Table 3.6: Species with a moderate to high potential of being introduced to Queensland marine
environments (source: Lewis et al. 2001).
Species recorded from other Australian states Estimated potential to establish
Musculista senhousia High (SE Qld)
Potamorcorbula amurensis Moderate (SE Qld)
Megabalanus rosa Moderate (Qld)
Corophium insidiosum Moderate (Qld)
Neomysis haponica Moderate (SE Qld)
Perna viridis Moderate (Qld)
Zoobotryon verticillatum Moderate (Qld)
Bowerbankia spp. Moderate (Qld)
Sparidentex hasta Moderate to low (SE Qld)
Species not yet recorded in Australia Estimated potential to establish
Cliona vastifera Moderate (Qld)
Perinereis vancuaria tetradenta Moderate (SE Qld)
Hyroides cf. ezoensis Moderate to low (SE Qld)
Pomatoleios krausii Moderate to low (SE Qld)
Chthamalus proteus Moderate to low (SE Qld)
Acartiella sinensis Moderate to low (Qld)
Pseudodiaptomus marinus Moderate to low (Qld)
Chama elatensis Moderate to low (Qld)
Lyrodus pedicellatus Moderate to low (Qld)
16 http://www.agriculture.gov.au/pests-diseases-weeds/marine-pests/review-national-marine-pest-biosecurity Accessed August 2015.

31
Table 3.7: Top 10 countries of export from the Port of Gladstone in 2014 by number of vessels17.
Export Countries Tonnage No. vessels
Japan 11,263,302 119
Australia 1,632,495 96
China 9,029,541 87
India 6,300,532 84
Korea 4,749,629 35
Taiwan 1,619,470 20
Brazil 810,925 11
Russia 404,465 10
Indonesia 238,298 10
Malaysia 247,426 8
Table 3.8: Countries of export from the Port of Rockhampton in 2014 by number of vessels18.
Export Countries Tonnage No. vessels
Australia 24,310 6
Papua New Guinea 6,577 5
Singapore 8,746 4
China 3,080 2
Micronesia 6,617 1
Chile 6,336 1
Taiwan 908 1
Philippines 35 1
3.3.5. Use of anti-fouling paints
Tributyltin (TBT) biocide compounds were introduced in the 1960s to anti-fouling paints to prevent
the attachment of organisms, such as seaweed, barnacles and tube worms to ship hulls. TBT has
since been shown to be universally toxic, causing severe damage to non-target species in the wider
marine environment (Evans et al. 1995). Significant impacts to marine life can occur from
concentrations of only a few nanograms per litre, and desorption of sediment-bound TBT and
leaching from paint chips may delay the decline of TBT in seawater concentrations (Newman &
McIntosh 1991). Following restrictions on TBT use, copper-based biocides have become the
predominant anti-fouling agent; however, the use of copper is now also being restricted or regulated
in some areas due to its potential for toxic effects (Dafforn et al. 2011).
17 https://content1.gpcl.com.au/ViewContent/CargoComparisonsSelection/CargoComparisonsSelection.aspx Accessed April 2015. 18 Ibid.

32
In 1989 the Australian Government introduced legislation for the phase-out of TBT-based anti-
fouling paint; in 1999 Australia’s Oceans Policy committed Australia to ban anti-fouling paints
containing TBT; and in October 2001 the International Maritime Organisation (IMO) adopted the
International Convention on the Control of Harmful Anti-Fouling Systems on Ships (the HAFS
Convention)19. Australia implements the HAFS Convention through the Protection of the Sea
(Harmful Anti-fouling Systems) Act 2006 (see Section 5.1.1. of this report). As the phase-out was part
of a larger IMO mandate, all vessels entering into Australian waters are obliged to not have TBT
paints on their hulls, and the same applies to Australian ships entering international ports, shipyards
or offshore terminals.
The main sources of TBT are commercial shipping and historically, recreational boats. TBT is
expected to be an issue for all large ports, but a 2005 report noted that concentrations in the Port of
Gladstone were expected to decline over the next decade as TBT was phased out worldwide (Apte et
al. 2005).
Imposex, the imposition of male sexual characteristics on female marine snails, occurs as a result of
exposure to TBT even at extremely low concentrations. As a result, imposex occurrence is
considered a sensitive bioindicator of TBT exposure and is an alternative to difficult and expensive
chemical analysis (Andersen 2004). A survey of imposex in Port Curtis was undertaken in 2004, and
showed up to 43% of female snails at any one site being affected by imposex, with prevalence
related to intensity of shipping (Andersen 2004). This was still considered to be a low incidence of
imposex, compared to other Australian studies that have shown up to 100% of snails affected
(Andersen 2004). A follow-up survey conducted in Port Curtis in 2008 showed imposex in 13 of the
17 surveyed sites but the degree and frequency was at low-moderate levels and was not thought to
be a threat to the reproductive capacity of studied species (Wilson 2009). Similar to other studies,
the sites with the greatest imposex were in areas with high to moderate shipping traffic, but the
higher prevalence of dibutyltin than TBT in tissues indicate that sediment sources were more likely
(Wilson 2009).
3.4. Ports activities
3.4.1. Maintenance and capital dredging
Dredging is an important maintenance activity needed to retain channels and berths for
transportation activities and for safe and efficient port operations. GPC must conduct maintenance
dredging to fulfil its operational obligations under the Queensland Transport Infrastructure Act 1994.
GPC undertakes maintenance dredging in the Port of Gladstone in annual campaigns (or more
frequently if required) and disposes of dredge material at the East Banks Sea Disposal Site in
19 http://www.imo.org/en/About/Conventions/ListOfConventions/Pages/International-Convention-on-the-Control-of-Harmful-Anti-fouling-Systems-on-Ships-(AFS).aspx Accessed April 2015.

33
accordance with permits issued under the Australian Environment Protection (Sea Dumping) Act
1981 (GPC 2014b).
GPC’s sea dumping permits and Long Term Monitoring and Management Plan (LTMMP) (GPC 2014b)
manage GPC’s maintenance dredging and sea disposal activities from a Commonwealth perspective
and also satisfy the Queensland Government requirement for a Receiving Environmental
Management Plan as specified in the Environmental Authority that authorises maintenance dredging
activities under the Queensland Environment Protection Act 1994.
Annual maintenance dredge volumes for the period of 2004 to 2013 are provided in Table 3.9. A
total of 63,000 m3 has been dredged from the Port of Rockhampton during this time; and
approximately 1.64 million m3 (Mm3) from the Port of Gladstone. GPC established a Technical
Advisory Consultative Committee (TACC) for the purpose of maintenance dredging consultation in
2000. Membership includes a wide representation of stakeholders including government, industry,
research, Indigenous, conservation and fishing interests.

34
Table 3.9: Maintenance dredging annual volumes (m3) in the Port of Gladstone and Port of
Rockhampton (GPC Pers. Comm., 5 August 2015).
Year Port of Rockhampton Port of Gladstone
2004 0 174,150
2005 0 148,426
2006 0 225,242
2007 0 160,927
2008 0 17,995
2009 23,000 282,000
2010 0 0
2011 40,000 309,000
2012 0 150,000
2013 0 174,150
Dredging is also undertaken during capital projects such as the Western Basin Dredging and Disposal
Project (WBDDP), which increased port access by deepening, widening and creating new shipping
channels to the Western Basin. Approximately 22.5 Mm3 has been dredged to date in the WBDDP, of
an approved 42.3 Mm3 (Queensland Government) / 46 Mm3 (Australian Government) (Table 3.10;
GPC Pers. Comm., 5 August 2015).
As part of the WBDDP, a reclamation area was constructed that allowed for a maximum of 45 Mm3
of spoil to be contained; however, a leak in the bund wall retaining the spoil led to the release of fine
sediments from the dredge spoil into the port. An independent review of the Port of Gladstone was
commissioned by the Australian Government in February 2013, and an addendum to the review was
commissioned on 30 January 2014 to examine the design and construction of the reclamation bund
wall. The Independent Review Panel made 37 findings and 19 recommendations, and found that
aspects of the design and construction of the bund wall were not consistent with industry best
practice. The panel further found that there “is insufficient evidence to attribute motive or, indeed,
overall long-term harm from these deficiencies. In fact, genuine attempts were made by all parties
to reduce impacts on the environment” (DoE, 2014).

35
Table 3.10: Western Basin Dredging and Disposal Project (WBDDP), dredging volumes approved.
EIS = Queensland Government Environmental Impact Statement; SEWPaC = (then) Australian
Government Department of Sustainability, Environment, Water, Population and Communities.
(Source: GPC Pers. Comm., 5 August 2015).
WBDDP EIS WBDDP Supplementary EIS (Dredge volume as at 19 March 2010) Section 4.1.2
WBDDP Supplementary EIS (Maximum Dredge Volume) Section 5.5.1
Queensland Coordinator General’s Approval
SEWPaC Approval
Stage 1A North China Bay LNG Precinct = 16 Mm3
Stage 1A (Curtis Is including APLNG initial Stages) = 22.4 Mm3
Stage 1A (Curtis Channel and MOFs) = 22.4 Mm3
Stage 1A and 1B = 25 Mm3
Stage 1B Fishermans Landing = 6.1 Mm3
Stage 1B (including all stages of GLNG LTD) = 5.3 Mm3
Stage 1B (Fishermans Landing) = 5.6 Mm3
Stage 2, 3 and 4 = 21 Mm3
Stage 2 Laird Point = 4.5 Mm3
Stages 2 and 3 = 10 Mm3
Stage 2 = Laird Point = 4.5 Mm3
Stage 3 Fishermans Landing =5.5 Mm3
Stage 4 (including Hamilton Point and Final LNG development) = 4.6 Mm3
Stage 3 Fishermans Landing Development = 5.5 Mm3
Stage 4 Hamilton Point = 3.9 Mm3
Stage 4 (including Hamilton Point and Final LNG development) = 5.5 Mm3
Total = 36 Mm3 Total = 42.3 Mm3 Total = 45.3 Mm3 Total = 42.3 Mm3 Total = 46 Mm3
Capital dredging and reclamation activities can have negative environmental impacts in terms of
direct loss of inshore habitats (e.g. seagrasses), and sediment and pollutant inputs to the marine
environment. Rates of localised turbidity, sedimentation and deposition from dredging exceed
normal levels and this can lead to alteration of habitat and a loss of organisms and changes in
species composition in an area (Erftemeijer & Lewis 2006). Pollutants (if present) can readily bind to
fine-grained sediments that are often found in ports, and when dredging occurs, the contaminants
may be released and become bioavailable to organisms in the area (Lohrer & Wetz 2003; Erftemeijer
et al. 2012). However, no detectable elevations in metal concentrations were found at capital
dredging sites in the Port of Gladstone in 2011 (Angel et al. 2012) and maintenance dredging sites in
the Port of Gladstone were found to be uncontaminated in sediment quality assessments in 2012
and 2014 (BMT WBM 2014a; cited in GPC 2014b). Guideline exceedances recorded for arsenic (likely

36
from natural sources) and TBT sediment concentrations were further analysed and found unlikely to
result in water quality impacts. The Independent Review of the Port of Gladstone noted that
dredged sediments complied with the requirements of the National Assessment Guidelines for
Dredging 2009 in relation to ocean disposal and stated that water and sediment quality testing
demonstrated that “dredged sediments were not contaminated to levels that would lead to
toxicological effects” (SEWPaC, 2013).
Few data are available on impacts of dredging in the Port of Rockhampton; however, a study
undertaken at Keppel Bay Marina (an enclosed marina located on the Capricorn Coast to the north
of the Port of Rockhampton) examined the effects of maintenance dredging activities through
analysis of water quality, macroinvertebrate assemblages, metal concentrations in sediments and
resident oysters, and coral community health immediately after commencement of dredging and
two weeks after the dredging was completed (Alquezar & Stratford 2007). Significant changes in
water quality, sediment physicochemical parameters and in macrobenthic assemblages were
identified post-dredging at sites at the marina and adjacent locations. No such changes were seen at
the reference location, indicating the impacts were a direct result of dredging and not caused by
seasonal or natural events. It is important to note that while Keppel Bay Marina is an enclosed water
body, the Port of Rockhampton is in a well-flushed estuary and the effects of dredging would vary
between these two different marine environments.
Dredge disposal (whether on land or at sea) also has impacts on water quality. The degree of impact
depends on the quantity disposed, method of disposal, proximity of disposal areas to sensitive
ecosystems, the potential for dispersal of sediments and the sediment qualities (i.e. particle size,
density and contamination) (Erftemeijer & Lewis 2006). Sensitivity of ecosystems is dependent on
their initial condition, resilience and the conditions that they normally experience (Erftemeijer et al.
2012). A 2014 study by consultants BMT WBM identified potential contaminants of concern in
sediments in the Port of Gladstone as: metals and metalloids; polycyclic aromatic hydrocarbons
(PAHs); and organotin compounds (TBT, dibutyltin, monobutyltin — see also Section 3.3.5 of this
report) (BMT 2014; cited in GPC 2014b). Potential pollutant sources were analysed in the same
study, as follows:
Shipping: hydrocarbons (BTEX: benzene, toluene, ethylbenzene, and xylenes; and total
petroleum hydrocarbons); polycyclic aromatic hydrocarbons (PAHs); organotins; product
spillage during import and export (e.g. bauxite, coal, clinker, alumina)
Natural geology: metals, metalloids (e.g. arsenic and nickel) and PAHs
Industrial discharges and run-off: metals, metalloids and organics
Landfills: metals, metalloids and other leachates (only small inactive landfills close to the
coast)
Agriculture and horticulture: herbicides and pesticides — horticulture reduced in recent
years
Urban stormwater discharges: PAHs, metals, metalloids and hydrocarbons, and
Sewage treatment plants: secondary treated water re-used at local industrial sites.

37
Sea disposal of dredge material in the Port of Gladstone occurs at East Banks Sea Disposal Site
(location illustrated in Figure 2.3 of this report) and sea disposal permit details are available in GPC’s
LTMMP (GPC 2014a). While some attention has been given to the impacts of sea disposal of dredge
material in the Australian scientific literature (e.g. Smith & Rule 2001; Grech et al. 2013; Brodie
2014), scientific studies for land disposal of dredge material are lacking. Land reclamation using
dredged marine sediments is not uncommon in Australia and in some areas the need for fill material
is the reason for dredging. Land reclamation is one of several land-based ‘beneficial reuses’ of
dredge material; others include raw construction material, wetland restoration/creation and flood
mitigation (Sheehan & Harrington 2012). The Queensland Government’s inclusion in the Sustainable
Ports Development Bill 201520 of an action to prohibit sea disposal of capital dredge material in the
GBRWHA (see also Section 5.1.3 of this report) means there is likely to be an increased focus on
land-based disposal options and beneficial reuse. Given the potential implications of land disposal
for the coastal environment there is a need for further research in this area.
3.4.2. Wharf facilities
The number of wharf facilities in a port is a direct function of its level of shipping activity. Wharves
can be a source of water quality contamination through spills and wash down during and after
loading and unloading freight (GPC 2014b) and these activities are covered by Environmental
Authorities under the Queensland Environment Protection Act 1994. Studies offshore from the Hay
Point coal terminal showed that PAH concentrations approach the estimates of toxicity for marine
organisms at both inshore and offshore coral reefs, and this was attributed to coal dust from the
terminal (Burns & Brinkman 2011; Burns 2014).
There are 20 operational wharves and six anchorages within the Port of Gladstone (see section 2.2.1
of this report). Quarantine and customs services are available to commercial vessels coming into
port. Garbage disposal and sterilisation services are provided by GPC, and quarantine waste is kept
in sealed bags on board the vessel until time of collection. Collection of tank wash slops, oily bilge
and oily mixtures with chemicals, sewage, or oil sludge is provided by Nationwide Oil Pty Ltd21.
This differs to the smaller Port of Rockhampton, which has only three berths (one of which is a
dolphin berth) and far fewer shipping movements (see also section 2.1.1 of this report). Here, no
pre-organised shipside garbage collection and/or quarantine waste services are available (although
these can be arranged by GPC as required), and the procedures information provided to vessels
coming into port is to retain these materials on board in covered receptacles22. The Australian
20 http://www.statedevelopment.qld.gov.au/industry-development/sustainable-port-development.html Accessed June 2015. 21 http://www.msq.qld.gov.au/Shipping/Port-procedures/Port-procedures-gladstone.aspx Accessed April 2015. 22 http://www.msq.qld.gov.au/Shipping/Port-procedures/Port-procedures/port-alma.aspx Accessed April 2015.

38
Government recently approved live cattle exports from the Port of Rockhampton23 although details
of any required changes to port facilities should these exports commence are not yet available.
3.5. Discharge from port-side industries
Substantial developments have occurred in the Gladstone area over the past century with increased
urbanisation, industrialisation and shipping. As a result, the port is expected to have increased
quantities of inputs from both diffuse and point source discharges transported via air and water
(Apte et al. 2006). Previous studies have attributed natural, industrial and anthropogenic discharge
as sources of elevated trace metal contaminants in the port. As detailed in Section 2 of this report,
the Port of Gladstone is highly industrialised with several important industries occupying port-side
locations. Industrial activity is regulated under Australian and Queensland government legislation,
and Environmental Authorities under the Queensland Environment Protection Act 1994 are needed
to conduct any Environmentally Relevant Activity24.
3.5.1. Discharge and emissions
Metals found in Gladstone Harbour are not thought to be sourced from particulates (air emissions)
(Apte et al. 2005) thus the focus on reported industrial discharge and emissions is on direct water
inputs only in this report. The National Pollution Inventory (NPI) provides a database of emissions
and transfers of toxic substances that are emitted at a local level within Australia. The NPI reports on
93 substances that have been identified as being important as a result of their potential impact on
the health of humans and the environment.
In Gladstone, there were 23 reporting facilities, and 29 in Rockhampton in the 2013–14 reporting
period (it is recognised that by aggregating data by category, some nearby local industries that are
not strictly located on port land are included). In Gladstone in 2013–14, emissions are reported for
five industrial categories (basic non-ferrous metal manufacturing; basic chemical manufacturing;
electricity generation; mineral, metal and chemical wholesaling; and water transport services), with
oil and gas extraction sometimes being a contributor in other years. In Rockhampton, three
industrial categories contributed emissions in the 2013–14 reporting period (electricity generation;
water supply, sewerage and drainage services; and meat and meat product manufacturing).
There were 20 reportable chemical compounds discharged by Gladstone facilities in 2013–14. The
greatest volume of inputs was for fluoride compounds (160,940 kg/yr) (Table 3.11). Similar trends
were seen in previous years, with the basic non-ferrous manufacturing industrial category being the
greatest contributor from 2001 to the current reporting period. Nutrients (total nitrogen, total
phosphorus and ammonia) were the highest rating emissions for Rockhampton. In 2013–14, 15
compounds were discharged into the water from the main industrial categories. Total nitrogen
23 http://www.abc.net.au/news/2015-08-06/cattle-producers-welcome-live-export-plan-for-central-qld/6678886 Accessed August 2015. 24 https://www.business.qld.gov.au/business/running/environment/licences-permits/applying-environmental-authority/environmentally-relevant-activities Accessed August 2015.

39
accounted for the greatest amount of discharge from two industrial categories (water supply,
sewerage and drainage services; and meat and meat product manufacturing) in Rockhampton during
the 2013–14 reporting period (144,957 kg/yr) (Table 3.12).

40
Table 3.11: Industrial emissions for Gladstone waters (kg/year) for 2013–14 (Source: NPI search25).
25 http://www.npi.gov.au/npidata/action/load/browse-search Accessed April 2015.
INDUSTRY A
mm
on
ia (
tota
l)
Be
nze
ne
Cad
miu
m &
co
mp
ou
nd
s
Ch
lori
ne
& c
om
po
un
ds
Ch
rom
ium
(II
I) c
om
po
un
d
Co
bal
t &
co
mp
ou
nd
s
Co
pp
er
& c
om
po
un
ds
Cya
nid
e (
ino
rgan
ic)
com
po
un
ds
Eth
ylb
enze
ne
Flu
ori
de
co
mp
ou
nd
s
Lead
& c
om
po
un
ds
Man
gan
ese
& c
om
po
un
ds
Me
rcu
ry &
co
mp
ou
nd
s
Nic
kel &
co
mp
ou
nd
s
Po
lycy
clic
aro
mat
ic h
ydro
carb
on
s
Tolu
en
e (
me
thyl
-be
nze
ne
)
Tota
l Nit
roge
n
Tota
l Ph
osp
ho
rus
Xyl
en
es (
ind
ivid
ual
or
mix
ed
iso
mer
s)
Zin
c &
co
mp
ou
nd
s
Basic Non-Ferrous Metal Manufacturing [213]
518 353 20 6 363 160940 16 485 0.2 26 0.3 141730 9331 551
Basic Chemical Manufacturing [181]
6321 321 5 18 20 0.06 3 20208 1010 437
Electricity Generation [261]
0 13 8 2 129 3
Mineral, Metal and Chemical Wholesaling [332]
0.004 0.003 0.02 0.01
Water Transport Support Services [521]
0.006 0.001

41
Table 3.12: Industrial emissions for Rockhampton waters (kg/year) for 2013–14 (Source: NPI search26).
INDUSTRY
Am
mo
nia
(to
tal)
Ars
en
ic &
co
mp
ou
nd
s
Bo
ron
& c
om
po
un
ds
Cad
miu
m &
co
mp
ou
nd
s
Ch
lori
ne
& c
om
po
un
ds
Ch
rom
ium
(II
I) c
om
po
un
ds
Ch
rom
ium
(V
I) c
om
po
un
ds
Flu
ori
de
co
mp
ou
nd
s
Lead
& c
om
po
un
ds
Man
gan
ese
& c
om
po
un
ds
Me
rcu
ry &
co
mp
ou
nd
s
Nic
kel &
co
mp
ou
nd
s
Tota
l Nit
roge
n
Tota
l Ph
osp
ho
rus
Zin
c &
com
po
un
ds
Electricity Generation [261] 29 786 0.3 66 3.23 0.2 2,620 2.62 235 0.3 23 35
Water Supply, Sewerage and Drainage Services [281] 52,328 4,321 78,967 30,955
Meat and Meat Product Manufacturing [111] 52,040 65,990 20,380
26 http://www.npi.gov.au/npidata/action/load/browse-search Accessed April 2015.

42
3.5.2. Recent industrial incidents
As well as regulated emissions, industrial incidents occasionally occur and these may potentially
influence water quality in the ports. No recent incidents have been reported in proximity to the Port
of Rockhampton (likely reflecting the lower level of industrialisation of this port); however, several
incidents have been reported for Gladstone.
In November 2012 Orica Australia Pty Ltd was fined $432,000 for releases of cyanide-contaminated
water27. Orica Yarwun is a chemical plant in Gladstone producing ammonium nitrate and sodium
cyanide for the mining industry. The 270 offences recorded included release of contaminants in
excess of license limits, a failure to notify the Department of Environment and Heritage Protection
upon becoming aware of contraventions to section 435(1) of the Environmental Protection Act 1994,
and a failure to test for contaminants prior to releasing effluent.
In November 2013 the alumina refinery Rio Tinto Alcan Yarwun was fined $35,000 for environmental
condition breaches relating to insufficient storage capacity of its red mud dam28.
In recent land-based industrial incidents: in December 2013 Gladstone alumina refinery Queensland
Alumina Ltd (QAL) was fined $125,000 for allowing the release of caustic aerosol spray containing
sodium hydroxide across nearby houses29; and also in December 2013 Streeters Earthmoving Pty Ltd
was fined $45,000 for land-based unauthorised waste oil and diesel spills at Yarwun Quarries near
Gladstone30. An ethylene leak was reported for QCLNG in October 201431, and a recent large caustic
leak also occurred from the QAL refinery in June 201532.
3.5.3. Acid sulfate soils
Acid sulfate soils (ASS) cover 4,650 ha of the Fitzroy-Curtis coast (EPA 2008). When disturbed, ASS
release sulfuric acid, and can lead to low pH and heavy metal mobilisation in coastal waters
(particularly brackish waters) causing degradation of plant communities and killing marine organisms
(EHP 2011).
In the Gladstone area, ASS occur from Tannum Sands to Fishermans Landing, encompassing an area
of 3,471 ha of land (1,466.5 ha with actual acid sulfate soils and 2,004.5 ha potential) (Ross 2004). A
27 http://statements.qld.gov.au/Statement/2012/11/1/orica-penalised-432000-for-releasing-contaminated-water Accessed June 2015. 28 http://statements.qld.gov.au/Statement/2013/11/22/protection-of-turtles-boosted-from-court-imposed-fine Accessed June 2015. 29 http://statements.qld.gov.au/Statement/2013/12/19/qal-fined-125000-for-causing-serious-environmental-harm Accessed June 2015. 30 http://statements.qld.gov.au/Statement/2013/12/18/earthmoving-company-fined-45000-over-waste-oil-and-diesel-spills Accessed June 2015. 31 http://www.gladstoneobserver.com.au/news/workers-stood-down-after-chemical-leak/2423068/ Accessed July 2015. 32 http://www.gladstoneobserver.com.au/news/caustic-leak-qal-investigated/2668096/ Accessed June 2015.

43
further 1,820 ha of disturbed land is thought to contain ASS (Ross 2004). Spoil from the capital and
maintenance dredging programs in the Port of Gladstone could contain Potential Acid Sulfate Soil
(PASS) material, which, if found to be present during pre-dredge testing, would need to be carefully
disposed of to ensure no adverse environmental impacts (Holton 2011). A number of reports have
been undertaken examining various ASS as part of the Western Basin dredging and reclamation
project, and an ASS management plan was developed for this project and ongoing monitoring
(Holton 2011).
3.6. Ocean sources (of pollution)
The primary ocean-based water quality issue in the region relates to marine debris. Marine debris
surveys conducted around Gladstone and Rockhampton indicate debris is not just originating from
local land sources, but also from commercial shipping and from fishing activities (recreational and
commercial) occurring within the area (Table 3.13). Factors such as ocean currents, seasonal wind
patterns and the northerly longshore drift influence the sources and the deposition of debris in the
Gladstone region (Wilson 2013). Recommendations to address this include increased education and
awareness, with targeted campaigns aimed at reducing inputs from the local fishing and boating
enthusiasts and from industry and shipping groups (Wilson & Hansler 2014), in addition to continued
sampling regimes (Wilson & Cartraud 2014). Further details on marine debris monitoring and results
are provided in Section 4 of this report. Other potential sources of ocean-sourced pollution such as
oil, toxicants and ocean acidification are currently not a major issue in the region but should be
monitored going forward.
Table 3.13: Debris surveys at Gladstone shoreline locations (Sources: Wilson & Cartraud 2014;
Wilson & Hansler 2014).
Survey Location Year Item total Weight total (kg)
Mean items/m2
Accumulation rate
Shoreline surveys at popular fishing and boat ramp locations
2013 -2014
7,594 204 0.11 4.2 items/ day
Gladstone Beaches at Chinaman, Fishermans, and Facing Islands, and Rodds Peninsula
2014 23,306 311.7 0.48 -

44
3.7. Marine industries and recreation
Marine industries and recreation, including commercial fishing, game and charter fishing,
recreational fishing and boating, and tourism, have the potential to influence water quality. Impacts
can be as a result of vessel movements/emissions, anti-fouling paints (see also section 3.3.5 of this
report), maritime incidents causing petrochemical spills, garbage disposal and sullage, and
(particularly for commercial fisheries) discarding unwanted fish and fish products. While the
individual impacts of small commercial and recreational vessels are likely to be less than the
individual impacts of very large vessels, the scale of marine industries and recreational boating can,
at times, be high with the potential for significant cumulative impacts. Marinas and slipyards are also
potential sources of water pollution including nutrients, anti-fouling chemicals and petrochemicals.
3.7.1. Recreation
Non-fishing recreation can impact on marine environments including through water quality impacts.
Some impacts of recreational use on the GBR include: localised damage to corals and disturbance to
wildlife, contribution to litter (and consequently marine debris), anchor damage to coral and
seagrass habitats, risks of introducing species through vessel fouling, oil and chemical spills, vessel
sewage discharge, vessel groundings and sinkings (GBRMPA 2014). In 2008 GBRMPA commissioned a
study investigating the direct effect of recreation on water quality in GBRMP (Gregg & Greiner
2008). The study considered only self-guided visits to the marine park that are non-commercial, non-
research and not classed as a tourist visit. The study concluded that a key water quality issue for this
group was the use of 2-stroke carburettor outboard engine-powered vessels. These outboards are
the most polluting marine engines on the market and their use is restricted in some European
countries and in the United States (US), yet in 2007 they made up more than 60% of engine sales in
Australia and are still commonly used by recreational fishers and boaters. The study suggested that
these engines could feasibly cause measurable water quality impacts in areas of high use (for
example near boat ramps, in estuaries and near-shore environments).
While no specific data are available describing emissions from marine industries and recreation in
the Port of Gladstone or the Port of Rockhampton, indicators of activity levels that can be measured
include the number of boat ramps and jetties for use by trailer craft, and marina facilities. There are
more boat ramps within the Port of Gladstone than within the Port of Rockhampton, reflecting the
closer proximity of Gladstone’s port to a regional centre, although there are a number of boat ramps
upstream of the Port of Rockhampton and along the nearby Capricorn Coast (Appendix A).
There is a marina facility in Gladstone, with 320 mooring booths, and the additional pile moorings
located in Auckland Inlet are also managed by the Gladstone Marina. There are additional moorings
in the lower Boyne River. The GPC 50 Year Plan includes a proposal to develop marina facilities close
to the mouth of the Boyne River, with this facility also possibly being used for pilotage access. While
there are no marinas within the limits of the Port of Rockhampton, Keppel Bay Marina is nearby on
the Capricorn Coast, with over 500 berths catering for vessels up to 35 m.

45
A further indicator of recreational boating activity is the number of recreational vessel registrations.
In Queensland, there are about 250,000 recreational vessels registered each year. In 2014, 47,293
vessels were registered in the Gladstone region, and boats between 3.01 to 4.0 m were the most
common size class registered (Table 3.14).
Table 3.14: Gladstone region recreational vessel registrations by size class, as of 30 September of
each reported year (Source: MSQ 2015b).
Size (m) 2008 2009 2010 2011 2012 2013 2014
Up to 3.00 1,293 1,310 1,287 1,244 1,233 1,250 1,225
3.01-4.00 15,910 16,293 16,921 17,105 17,563 17,908 18,113
4.01-4.50 10,117 10,471 10,845 11,103 11,431 11,782 12,173
4.51-5.00 4,690 4,845 4,971 5,027 5,099 5,232 5,300
5.01-6.00 4,752 4,999 5,255 5,448 5,584 5,777 5,846
6.01-8.00 2,139 2,288 2,429 2,565 2,721 2,872 2,905
8.01-10.00 665 686 714 727 732 735 713
10.01-12.00 494 512 529 549 554 561 545
12.01-15.00 355 357 354 365 391 387 392
15.01-18.00 52 58 65 66 64 64 64
18.01-20.00 8 11 9 10 11 11 22
20.01-25.00 5 7 5 5 6 7 13
>25.00 4 3 3 3 3 3 4
Total 40,484 41,840 43,387 44,217 45,392 46,589 47,293
Vessel incidents have the potential to cause stored garbage and toxicants to enter the marine
environment. Records are available for incidents involving recreational and commercial vessels in
Gladstone. Data are freely available for the years 2011 to 2013, with only limited data available for
2008 and 2009 (Table 3.15). The most commonly reported marine vessel incidents in Gladstone in
2013 were unintentional groundings (n=50), collisions with a fixed object (n=39), and collisions
between ships (n=30). Similar to the Queensland-wide data, most incidents in the Gladstone region
occurred in smooth or partially smooth waters. Trend reporting from 1996 to 2012 illustrated a
similar trend of increasing incidents for Gladstone as for the rest of Queensland (Figure 3.1). The
increase in commercial vessel incidents in 2011 to 2013 coincided with construction activities on
Curtis Island and associated construction traffic increases (514% increase from 2010–11 to 2011–12,
see also section 3.3.1).
Table 3.15: The number of incidents for commercial and recreational vessels in Gladstone (Source:
MSQ 2014).
Vessel Type 2008 2009 2011 2012 2013
Commercial vessels 110 239 133
Recreational vessels 71 93 121
Hire & Drive vessels 3 5

46
Commercial fishing vessels
11 26 14
Figure 3.2: The number of incidents and Gladstone compare to the rest of Queensland for reported
years 1996 to 2013 (MSQ33).
Recreational boating (particularly fishing) is a recognised source of marine debris. In 2013, TAngler
bins were introduced to help reduce the amount of recreational fishing debris in the Gladstone
Region marine environment. Monitoring of this initiative has suggested positive environmental
results with 1,472 items weighing 12.3 kg collected from the bins, which equates to approximately
1,000 items/week (Wilson 2014b). Not surprisingly, 70% of items recovered from the bins were
fishing-related items (line, bait bags, tackle), and a corresponding shoreline survey conducted
around the bins found a decrease in fishing-related items in the debris collected from the
surrounding environment (Wilson 2014b). Interestingly, the bins at shore-based fishing sites had
greater usage than those located at boat ramps (Wilson 2014b).
Recreational fishing is a popular activity in both the Port of Gladstone and the Port of Rockhampton,
and a survey recently conducted in Gladstone found a 25% increase in fishing effort over the past six
years, with an estimated 31,000 fishing trips undertaken from key boat ramps from summer 2013 to
spring 2014 (Sawynok et al. 2014). The composition of species caught changed significantly with the
influx of barramundi (Lates calcarifer) from Lake Awoonga when the dam overflowed following an
extreme rainfall event in 2011, although that effect was reduced by 2014 (Sawynok et al. 2014).
33 http://www.msq.qld.gov.au/About-us/Maritime-statistics-and-reports-library.aspx Accessed April 2015.
0
100
200
300
400
500
600
700
800
900
1996
1997
1998
1999
2000
2001
2002
2003
2004
2005
2006
2007
2008
2009
2010
2011
2012
2013
Mar
ine
Inci
de
nts
(n
um
be
r)
Year
Gladstone
Total QLD Regions

47
3.7.2. Commercial fishing
A small but significant commercial fishing industry is based in the Ports of Gladstone and
Rockhampton, including trawl, line, gillnet and crab pot fisheries. Species of highest importance
include mud crabs (Scylla serrata), banana prawns (Penaeus merguiensis), blue threadfin
(Eleutheronema tetradactylum), grey mackerel (Scomberomorus semifasciatus), mullet (Mugil
cephalus/Liza vaigiensis), shark (Carcharhinus spp.) and barramundi (Lates calcarifer) (DAFF 2012).
From 1 November 2015 the Fitzroy River and Capricorn Coast will become a net-free fishing zone34.
The most important commercial species by weight in Gladstone (reporting grid S30) are mud crabs
(2,054.68 kg caught from 1990 to 2014), followed by banana prawns (1,370.19 kg). The most
important commercial fish species by weight for Rockhampton (reporting grid R30) was again mud
crabs (1,457.59 kg caught from 1990 to 2014) (see also Appendix).
Tropical prawn fisheries (otter trawls) generate a higher proportion of bycatch-to-catch than any
other fishing method (Stobutzki et al. 1996). Banana prawns are of particular concern as trawling
occurs during daylight hours in very shallow waters, close to the coast, and bycatch will wash up on
shore causing concern to local tourism operators and recreational fishers as it is highly visible
(Stobutzki et al. 1996). Robins and Courtney (1998) found that on average, only 27% of the total
banana prawn trawl catch was banana prawns (ranging from 4.91% to 41.35% in 35 trawls).
Extrapolating from the 1,370 t of banana prawns caught in Gladstone (Appendix A), a 27% banana
prawn catch rate would imply a total catch of 5,074 t. After subtracting the 1,370 t of prawns and
531 t of scallops retained by fishers, as much as 3,173 t of fish may have been discarded in Gladstone
between 1990 and 2014; an average of 132 t per year. Whether this discard rate has a localised
influence on water quality would depend on discard rates per trip, how much is consumed by birds
and fish when it is discarded, and whether discards are released from trawlers in one area or
gradually while steaming.
Like recreational vessels (section 3.7.1), commercial fishing vessels may also emit toxins including
petrochemicals and anti-fouling chemicals into the marine environment.
34 https://publications.qld.gov.au/dataset/maps-of-final-net-free-fishing-zones-in-queensland/resource/59882c71-b5d4-4235-9680-4d2e256dccf9 Accessed August 2015.

48
4. Current water quality monitoring and reporting
Within the Port of Gladstone and Port of Rockhampton there are number of ongoing or recent
monitoring programs and studies that have examined water quality issues. This section summarises
the monitoring activities that have occurred since 2012 and focuses primarily on regular monitoring
over an extended period in each port.
4.1. Port of Gladstone Monitoring
4.1.1. Port Curtis Integrated Monitoring Program
The Port Curtis Integrated Monitoring Program Inc. (PCIMP) is a partnership of Gladstone industries
and organisations that undertakes ambient far-field water quality monitoring in Port Curtis and
Rodds Bay. PCIMP has been monitoring the health of coastal and marine environments in Port Curtis
since 2005. The current program involves quarterly collection and analysis of physico-chemical and
water analytes at 54 sites around the port quarterly. Sediment analytes are monitored annually and
oysters are also deployed to measure bioaccumulation of metals and fluoride twice per year (Table
4.1).
Table 4.1: Water and sediment quality parameters measured by PCIMP.
Category Parameter
Physical and chemical
pH, dissolved oxygen saturation, temperature, conductivity, turbidity, total suspended solids, euphotic depth, photosynthetically active radiation, oxidation reduction potential
Metals and non-metals in water
Dissolved metals and metalloids in (filtered) water grabs: aluminium, arsenic, cadmium, chromium, cobalt, copper, gallium, iron, lead, manganese, mercury, molybdenum, nickel, selenium, silver, tin, uranium, vanadium and zinc
Total metals and metalloids in water grabs: aluminium, arsenic, cadmium, chromium, cobalt, copper, gallium, iron, lead, manganese, mercury, molybdenum, nickel, selenium, silver, tin, uranium, vanadium and zinc
Non-metal in water grabs: cyanide (free, WAD and total), fluoride
Nutrients in water Chlorophyll a, total phosphorus, orthophosphate, total nitrogen, nitrate – N, ammonia – N, nitrite – N, total organic carbon, dissolved organic carbon
Oyster bioaccumulation
Metals and metalloids in oyster tissue: aluminium, arsenic, cadmium, chromium, cobalt, copper, gallium, iron, lead, manganese, mercury, molybdenum, nickel, selenium, silver, tin, uranium, vanadium and zinc
Oyster shell: fluoride
Sediment quality Metals and metalloids in sediment grabs: aluminium, arsenic, cadmium, chromium, cobalt, copper, gallium, iron, lead, manganese, mercury, molybdenum, nickel, selenium, silver, tin, vanadium and zinc
Nutrients in sediment grabs: total solids, total nitrogen, total kjeldahl nitrogen, total organic carbon
Total fluoride in sediment grabs
Sediment particle size distribution

49
The site data from PCIMP monitoring is grouped into 13 zones, including all major estuaries, inner to
outer harbour locations, and nearby reference areas. The zones were established in collaboration
with EHP and are defined in the EHP Water Quality Objectives and used in the zoning for the
Gladstone Healthy Harbour Partnership report card.
4.1.2. Gladstone Ports Corporation monitoring
As the port operator and the major shoreline landholder in the area, GPC undertakes a number of
water quality monitoring and assessment activities. As discussed in section 3.4.1, GPC has a Long
Term Monitoring and Management Plan (LTMMP) for sea disposal of maintenance dredge material
as part of its Environmental Management System. This plan is a working management document
that seeks to ensure that all reasonable and practicable measures will be implemented to prevent
and/or minimise the likelihood of environmental harm caused by sea dumping activities. These
include routine water quality monitoring such as:
Two sites at the East Banks Sea Disposal Site are sampled for the same parameters
measured by PCIMP, i.e. quarterly water physico-chemical parameters, nutrients and metals;
quarterly oyster deployment for bioaccumulation of metals; twice-yearly sediment metals.
Continuous monitoring of physico-chemical parameters is undertaken at the Boyne, Clinton
and Fishermans Landing wharves.
Photosynthetically active radiation (a measure of sub-surface light) is currently being
monitored continuously at seven locations.
Seven seagrass beds are monitored for extent, composition and condition quarterly, until
2016.
A major recent undertaking was the development and expansion of the facilities in the Western
Basin of the Port of Gladstone. The WBDDP involved the deepening and widening of existing
channels and swing basins as well as the creation of new channels, basins and berths. As a condition
of environmental approval by the (then) SEWPaC, a Port Curtis and Port Alma Ecosystem Research
and Monitoring Program (ERMP) was developed and implemented (see also Section 5 of this report).
The ERMP has funded a variety of marine ecosystem research projects including an assessment of
trends in water quality in Port Curtis and Port Alma. These are only one component of a large array
of water quality studies conducted recently by Queensland Government agencies (see section 4.1.4
below for more detail). The findings from the ERMP funded study by Hale (2013) are summarised
below:
The WBDDP had a dedicated water quality monitoring program with a total of 22 sites (17 of
which are within the Port Curtis study area). The program comprised continuous (15 minute
interval) logging of physico-chemical parameters (temperature, salinity, turbidity, pH and
dissolved oxygen) and light attenuation; as well as monthly samples for nutrient and
contaminant analysis. The program commenced in 2009 and data was provided for the
period November 2009 to September 2012 for physico-chemical logger data and from July
2010 to January 2013 for periodic nutrient and contaminant data.

50
The findings of the water quality monitoring showed that salinity, temperature and dissolved
oxygen are all influenced by climate, and follow seasonal as well as longer term climatic
cycles. Increased rainfall and associated river flow since late 2009 resulted in a trend of
declining salinity in estuary sites and this is reflected in lower median salinity at inshore sites
in Port Curtis during the wet season.
Dissolved oxygen concentrations were lower at inshore sites, compared to those offshore,
perhaps due to increased river influences and organic material in the water column.
However, dissolved oxygen was within water quality guidelines at all sites in Port Curtis.
Suspended sediments within Port Curtis are from two predominant sources: inflows from
the catchment and re-suspension from the seabed either by natural forces of waves and
currents or human intervention. Dredging, increased rainfall and river flows have influenced
water clarity. There is a trend of increased turbidity in the Calliope and Fitzroy rivers since
increased rainfall in late 2009. This affected water clarity in the Port Curtis region. There is
also evidence of increased turbidity associated with dredging in the Western Basin, but
these effects do not extend out into the outer harbour and beyond.
The pH in Port Curtis remained within water quality guideline values. Nutrients in Port Curtis
are strongly influenced by catchment inputs. There is trend of increased nutrients in the
Fitzroy and Calliope estuaries from late 2009 onwards.
Median nutrient concentrations at inshore sites in Port Curtis were higher than those
offshore, reflecting the influence of river discharges. Concentrations of total nitrogen,
ammonium, and orthophosphate were within water quality guidelines. Water quality
guidelines for nitrate-nitrite and total phosphorus were exceeded at some inshore sites.
Chlorophyll a concentrations, however, remained within guideline levels.
One of the major findings was that there is little or no data available for the Port Alma
section of the study area.
4.1.3. Other industry near-field monitoring
A number of industries utilise the waterways and foreshores of the Port of Gladstone. These include
metal and non-metal manufacturing, mineral and metal wholesaling, chemical manufacturing and
power generation. As part of their environmental approvals or conditions to operate, ongoing water
quality monitoring takes place in their near-field environment. Monitoring is undertaken for physico-
chemical parameters, metals, nutrients and other selected parameters depending on the industry.
Table 4.2 summarises the number of sites and frequency of this monitoring as well as all other
relevant programs within the port including PCIMP, GPC monitoring, Queensland Government
monitoring, industry near-field monitoring, community monitoring and ongoing research programs.

51
Table 4.2: Summary of water quality monitoring for the Port of Gladstone presented as: number of
sites (frequency per year). “>” means greater than.
Parameter Far Field - PCIMP
Estuarine - Queensland Government
Near field - Industry Community Research
Physical and chemical parameters
54 (4) 15 (12) >18 (continuous/ hourly/monthly)
4 (4)
Metals – dissolved 54 (4) >18 (12)
Metals – total 54 (4) >18 (12)
Cyanide 54 (4)
Nutrients 54 (4) 4 (12) >18 (12)
Chlorophyll a 54 (4) 15 (12) >12 (12)
Light (PAR*) 54 (4) 7 (continuous)
Fluoride 54 (4) 12 (12)
TOC/DOC* 54 (4) >18 (12)
Major cations/anions
>18 (12)
Sediment analytes 54 (1-2) >18 (1-2)
Sedimentation/TSS* 54 (4) 6 (continuous/ monthly)
Plastics/debris 4 (4) 11 (2)
Biomonitors – oysters
54 (2) 6 (once/quarterly)
Plankton, mangroves, seagrass
>7 (4) 4 (4) 200km(2)
* Abbreviations: PAR = photosynthetically active radiation; TOC = total organic carbon; DOC = dissolved organic carbon; TSS = total suspended solids
4.1.4. Queensland Government monitoring
The Queensland Department of Science, Information Technology and Innovation (DSITI) and its
predecessor organisation (DSITIA) have routinely monitored estuaries within the Gladstone region,
amongst others in the state. Site- or event-specific monitoring is also undertaken ad hoc by the
Department of Environment and Heritage Protection (DEHP). Recent monitoring activities by both
these organisations are described below.
Routine monthly monitoring has been ongoing since 1993 at selected estuarine sites to
provide condition and trend data. There are five sites in the Boyne River estuary (mouth to
Benaraby) and 10 in the Calliope River estuary (mouth to Devils Elbow). Water quality
recorded includes electrical conductivity, temperature, pH, dissolved oxygen, turbidity,
clarity (secchi depth), nutrients (nitrates and phosphates) and chlorophyll a. The Calliope
and Boyne rivers rarely have water quality exceedances above ANZECC water quality trigger
values. These are mostly for turbidity (near the mouth) or dissolved oxygen after high flow.
The Baffle Creek estuary to the south of Agnes Water is also monitored monthly for five sites
as above. Added to this, a monitoring station situated 16 km upstream of the creek mouth
has been recording continuous water quality data since 2012. This station reports at 30
minute intervals for electrical conductivity, temperature, pH, dissolved oxygen, turbidity and

52
chlorophyll a. While outside of the port area and outside of the Fitzroy Basin region, this site
provides important reference water quality condition, both current and historical.
In September 2011, in response to the fish health concerns in Gladstone Harbour, monthly
water and sediment quality monitoring was conducted for 12 months. This included analysis
at sites across the harbour for physico-chemistry, nutrient, metals and metalloids and
chlorophyll a (DEHP, 2012). The findings concluded that water quality on the whole did not
vary from historical records apart from the result of an exceptional wet period in 2011.
Aluminium, arsenic, copper, molybdenum and zinc all exceeded water quality trigger values
at some times but these instances were few and were not likely attributable to fish health
issues. Geographically, aluminium was found to be elevated in South Trees Inlet linked to
inputs from local industry. Turbidity was similarly elevated across the whole harbour and
was positively correlated with manganese, molybdenum and vanadium. These metals,
however, rarely exceeded their respective trigger values.
In response to a significant flooding event from Lake Awoonga and the Boyne River in January 2013
the water quality in the Gladstone waterways was monitored regularly until September 2013.
Physico-chemistry, nutrient, metals and metalloids and chlorophyll a were recorded from up to 52
sites. The major findings were that turbidity and nutrients were elevated throughout the region but
dropped shortly after the pulse. Dissolved aluminium was elevated in the Boyne River and South
Trees Inlet post-flood exceeding the low reliability trigger value (0.5 ug/L). Molybdenum and arsenic
also exceeded respective trigger values briefly in South Trees Inlet. Investigation of the fractions of
aluminium at selected sites found that the Boyne River sites were predominantly in the less
bioavailable colloidal fraction likely from natural catchment sources. The South Trees sites, however,
were higher in low molecular weight fractions linked to other sources (DSITIA 2013).
4.1.5. Port Curtis Harbour Watch
Port Curtis Harbour Watch is a school- and community-based program that monitors marine and
estuarine water and substrate in Gladstone Harbour and the surrounding environment. The program
is facilitated by the Boyne Island Environmental Education Centre. The aims of Harbour Watch are
to:
expose students to the practice of science in contemporary and socially engaged settings
provide opportunities for community members to become involved in assessing the
condition of their local environment
assist in gathering data as a contribution to regional monitoring, evaluation and reporting
strategies, and
promote wider community stewardship and responsibility for the future health of the
harbour and potentially linking with the GHHP.
The program has been operating since April 2014 and records physical, chemical and biological
parameters at selected locations in the harbour. Parameters are recorded at sites outside of that
recorded in PCIMP and include selected nutrients, temperature, pH, dissolved oxygen, conductivity
and turbidity as well as plankton and macrobenthos. Since their official launch, over 1000 students
have participated in Harbour Watch and the program continues to grow annually.

53
4.1.6. Marine debris research
Since 2011, quarterly surveys of marine debris at four beaches within the Port Curtis region (two
harbour and two coast sites) have been undertaken by Conservation Volunteers Australia and
CQUniversity (Wilson & Hansler 2014). The aim was to determine the amounts and types of marine
debris across the region and to document changes over time. This is one of the few areas along the
Queensland coast where quantifiable studies have been conducted.
A total of 20,999 debris items were collected over the three-year study with the amounts of debris
found per m2 rating the region’s coastal beaches as “clean” on the Clean Coast Index (Table 4.3).
Comparatively, data from sites in Keppel Bay were found to have similar levels of debris to the
Gladstone sites but Nine Mile Beach on the Shoalwater Peninsula to the north was classed as “dirty”
due to the localised currents bringing in oceanic debris (Wilson 2012). The amounts of debris within
the Gladstone region can be considered typical for a regional Queensland coastal city.
There was no significant change in debris loads within the Gladstone region (Wilson & Hansler 2014)
across the three-year sample period (Figure 4.1). Plastics made up between 77% to 97% of the total
loads depending on location and time. The most common individual item was plastic fragments,
indicative of the fractionation of plastic that commonly occurs once it enters the marine
environment and highlights the potential risks that local fauna may be exposed to from this type of
debris. The second most prevalent item was rope, which was representative of the high levels of
boating and fishing activities occurring in the region. Water-borne sources were the major source of
debris identified, with land-based sources accounting for approximately a third of the total.
Table 4.3: Mean marine debris accumulation rate for the Gladstone Region 2011–2014.
Year Fishermans Landing
Chinaman Island
Facing Island
Rodds Peninsula
Total
Mean debris (items/m2)
2013/2014 0.09 0.12 0.09 0.12 0.11
2012 0.04 0.08 0.14 0.10 0.09
2011 0.09 0.23 0.17 - 0.16
Shoreline debris surveys and TAngler (fishing line waste) bin assessments were also undertaken within
the Gladstone Region in 2013 (Wilson 2014b; Wilson & Cartraud 2014) as part of GPC’s Biodiversity
Offset Strategy (BOS) — a condition of approval for the WBDDP (see also section 5.3 for further details)
at different locations to those reported above. Fourteen TAngler bins from 10 sites were assessed in
two six-week blocks (winter and summer) and a total of 1,472 items of litter weighing 12.3 kg were
found in the bins over the entire sampling program equating to 123 items at 1.03kg per week. Fishing-
related items (line, tackle, bait bags) were the most common items found in the bins, making up
approximately 70% of all items by number.

54
Figure 4.1: Mean beach debris loads found in Gladstone between March 2011 and March 2014.
To evaluate the success of these bins at reducing shoreline debris loads, 12 sites across the region
were analysed both prior to bin instalment and post-instalment. A total of 23,306 items of litter
weighing 311.67 kg were collected from Gladstone’s estuarine shoreline, equating to 0.48 items and
6.41 g/m2. On the Clean Coast Index of litter loads, this data rates Gladstone as a “moderate” level of
pollution. All shorelines had debris present throughout the study, with sites popular for fishing or
boating recording the most debris. Glass, metal, hard plastics and rope/fishing line were the most
common items found. A decline in overall debris loads and specifically rope and fishing line (although
not statistically significant) was found at sites after the bins had been installed (compared to prior)
and at sites with TAngler Bins present (compared to those without), suggesting that these bins were
partly successful at removing a proportion of this type of debris.
Debris tracking studies using drift cards and satellite trackers have been undertaken with both the
Port of Gladstone and Port Alma regions. In 2012–13, a study by CQUniversity (Wilson 2013), found
coastal outputs from the Gladstone Harbour and Fitzroy River sites influenced the near-shore
beaches immediately to the north of the outputs. This was in line with the prevailing south-easterly
winds and the northerly longshore current. The aspect of the coast in this region also means that
debris from these sources will generally not travel large distances from the source (e.g. up to 50 km)
under low-flow conditions. The debris from offshore shipping berths off Gladstone and the channel
out to the Reef suggest that litter will move north up the coast and land on the northern beaches of
the region (e.g. North Keppel Island, Nine Mile Beach, Five Rocks and the Shoalwater peninsula).
These are distances in excess of 100 km. Despite the location there appeared to be parallel
movements of loggers both near-shore and offshore up the coast.
-500
0
500
1000
1500
2000

55
A more intensive tracker study within the Port of Gladstone was undertaken in 2014 (Wilson 2014a).
The data from both drift cards and satellite trackers indicated that deposition hot spots occur in the
harbour at Barney Point and Parsons Point and on the coast at Lillies/Boyne Beach and Tannum
Sands Beaches, depending on the release points. The majority of cards were reported back within 30
days of release but some cards moved relatively rapidly out of the harbour (less than a day)
reflecting the large tidal fluctuations present in the region. The data also indicates that once debris
reaches the coastal currents the distribution becomes more widespread but follows the
predominantly northward pattern with the longshore current, as documented in the previous study.
4.1.7. MangroveWatch
MangroveWatch is a community-based monitoring program run by James Cook University that
records the condition of mangroves. In March 2015 an ERMP project was launched with support
from Gidarjil Development Corporation. The program will assess 200 km of mangrove shoreline
twice a year.
This Port Curtis and Port Alma project relies primarily on video assessment of shoreline habitats
collected by community volunteers and sent to the hub for analysis. The Shoreline Video Assessment
Method (SVAM) uses qualitative assessments of shoreline habitat, physical condition and human
influence, determined from continuous video recordings of the shoreline and intertidal zone along
coastline/estuary banks. The video is analysed for a number of features that relate to the condition
of the coast. Simultaneous GPS data enables these features to be mapped to give a spatial
representation of shoreline habitats and their condition. These ground surveys are supplemented
with aerial habitat mapping.
4.2. Gladstone Healthy Harbour Partnership
Gladstone Healthy Harbour Partnership (GHHP) is a forum to bring together parties and stakeholders
to maintain and, if necessary, improve the health of Gladstone Harbour. GHHP aims to bring about
efficient, cost-effective, targeted monitoring and research activities focused on GHHP needs and
priorities, and management recommendations and action to avoid any monitoring/research
duplication — including existing industry and research effort to maximise and optimise value of
investment (both time and money) while improving the quality of the data generated from
monitoring and research programs. GHHP is overseen by a Management Committee whilst research
and monitoring is overseen by an Independent Science Panel.
A key aspect of the partnership is the development of a report card for Gladstone Harbour. It seeks
to report on the environmental, social, cultural and economic factors based on harbour zones or
local government boundaries. For the environmental results, the harbour is divided into 13 zones. A
pilot report was released in 2014 with the following overall grades reported:
Environmental – C
Social – C
Economic – B
Cultural – No report

56
Within the 2014 environmental reporting category, data was based upon the following parameters
derived from the PCIMP water quality data set: dissolved oxygen saturation, turbidity, total nitrogen,
total phosphorus, aluminium and copper.
Nine of the 13 Gladstone Harbour zones received an overall environmental score of greater than
0.50 (≥C grade; “satisfactory”). The highest scores for water quality were recorded in the Inner
Harbour (0.74), Outer Harbour (0.69), South Trees Inlet (0.68) and Graham Creek (0.68), while the
estuarine zones of Auckland Inlet (0.41), Boat Creek (0.47), Boyne Estuary (0.47) and Calliope Estuary
(0.48) recorded D (“poor”) grades (Figure 4.2).
Figure 4.2: GHHP 2014 Pilot Report Card environmental grades (Source: GHHP35)
From 2015 the report card will include the following additional environmental indicator groups:
sediment quality, connectivity, habitats (seagrass, mangroves and coral), fish and crab health.
Social health was assessed based upon a community survey of 400 people. Of the three indicator
groups used overall, respondents were satisfied with harbour access, liveability and wellbeing and
harbour usability (all three indicators scored a C; “satisfactory”). For economic health, economic
stimulus received the highest score of 0.87 (A; “very good”) and economic performance and
economic value were both graded B (“good”). The economic stimulus grade reflects the
comparatively high socio-economic status of the Gladstone community and high levels of
employment.
35 http://rc.ghhp.org.au/report-cards Accessed June 2015

57
4.3. Port of Rockhampton monitoring
4.3.1. Gladstone Ports Corporation monitoring
As part of the routine monitoring of the Port of Rockhampton, two sites are monitored quarterly in a
similar program to PCIMP and the two GPC East Banks monitoring sites in the Port of Gladstone.
Parameters measured include physico-chemical parameters, nutrients and metals in water and
sediment, and oysters are deployed quarterly for bioaccumulation of metals (Table 4.4). Benthic
sampling is also being undertaken at both sites in 2015.
4.3.2. Queensland Government monitoring
EHP and lately DSITI routinely monitor the Fitzroy River estuary. This includes the following routine
monthly monitoring (ongoing since 1993) in the Fitzroy River estuary (mouth to the barrage) at
(currently) 13 sites. The following water quality parameters are recorded: electrical conductivity,
temperature, pH, dissolved oxygen, turbidity, clarity (secchi depth), nutrients (nitrates and
phosphates at two sites only) and chlorophyll a. For the Fitzroy River, turbidity is naturally elevated
and as the estuarine portion is longer than 40 km, the Queensland turbidity guideline value does not
apply. Dissolved oxygen only falls below guideline values after high flow events but for the most
part, is within range. Nutrients in the Fitzroy consistently exceed water quality guidelines levels, the
highest closest to the sewage discharge.
4.3.3. MangroveWatch
James Cook University facilitates MangroveWatch surveys for region that include the mangroves in
and around the Port of Rockhampton, the Fitzroy Delta and The Narrows. These are monitored twice
annually using the video assessment technique as described above for the Port of Gladstone under
the GPC ERMP (recorded as research monitoring in Table 4.4).
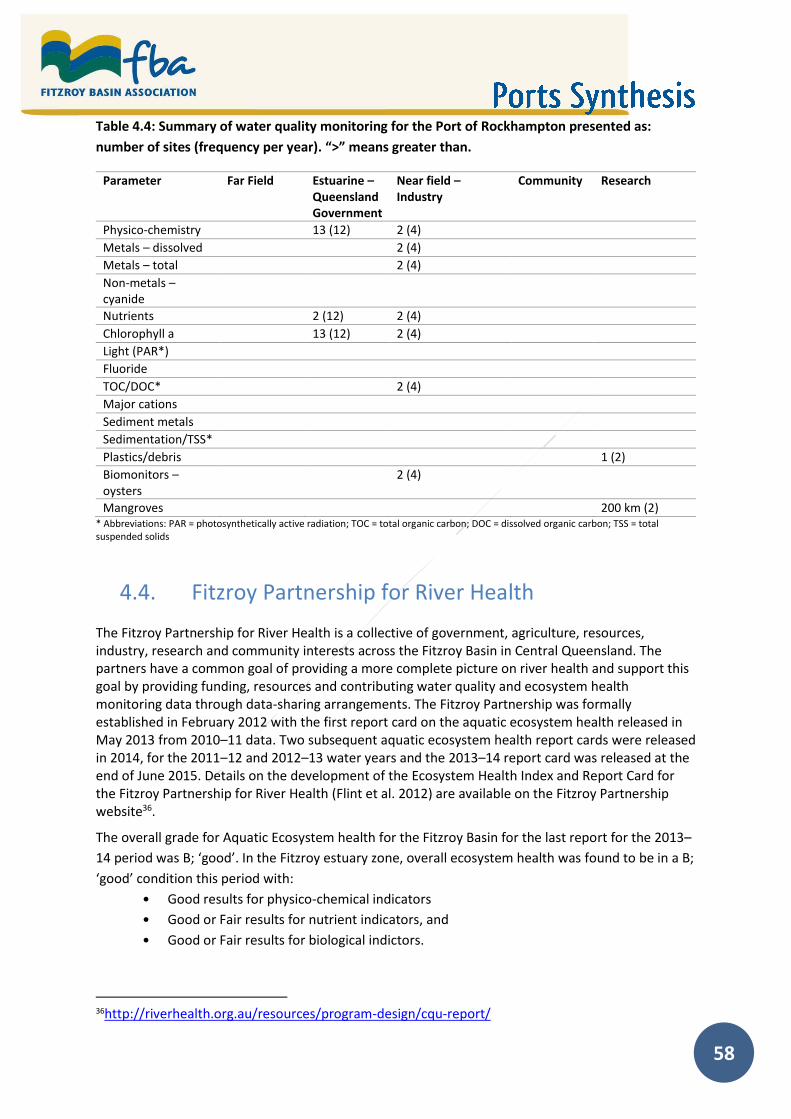
58
Table 4.4: Summary of water quality monitoring for the Port of Rockhampton presented as:
number of sites (frequency per year). “>” means greater than.
Parameter Far Field Estuarine – Queensland Government
Near field – Industry
Community Research
Physico-chemistry 13 (12) 2 (4)
Metals – dissolved 2 (4)
Metals – total 2 (4)
Non-metals –cyanide
Nutrients 2 (12) 2 (4)
Chlorophyll a 13 (12) 2 (4)
Light (PAR*)
Fluoride
TOC/DOC* 2 (4)
Major cations
Sediment metals
Sedimentation/TSS*
Plastics/debris 1 (2)
Biomonitors – oysters
2 (4)
Mangroves 200 km (2) * Abbreviations: PAR = photosynthetically active radiation; TOC = total organic carbon; DOC = dissolved organic carbon; TSS = total suspended solids
4.4. Fitzroy Partnership for River Health
The Fitzroy Partnership for River Health is a collective of government, agriculture, resources, industry, research and community interests across the Fitzroy Basin in Central Queensland. The partners have a common goal of providing a more complete picture on river health and support this goal by providing funding, resources and contributing water quality and ecosystem health monitoring data through data-sharing arrangements. The Fitzroy Partnership was formally established in February 2012 with the first report card on the aquatic ecosystem health released in May 2013 from 2010–11 data. Two subsequent aquatic ecosystem health report cards were released in 2014, for the 2011–12 and 2012–13 water years and the 2013–14 report card was released at the end of June 2015. Details on the development of the Ecosystem Health Index and Report Card for the Fitzroy Partnership for River Health (Flint et al. 2012) are available on the Fitzroy Partnership website36.
The overall grade for Aquatic Ecosystem health for the Fitzroy Basin for the last report for the 2013–
14 period was B; ‘good’. In the Fitzroy estuary zone, overall ecosystem health was found to be in a B;
‘good’ condition this period with:
Good results for physico-chemical indicators
Good or Fair results for nutrient indicators, and
Good or Fair results for biological indictors.
36http://riverhealth.org.au/resources/program-design/cqu-report/

59
The assessment was based on 12 sites (1,259 samples) to determine the overall estuary grade.
4.5. Other programs and studies
There are a number of other programs or studies that fall outside the scope of this report noted
below.
4.5.1. Creek Watch Gladstone
The Gladstone Creek Watch program is a citizen science approach to monitoring local waterways.
The program began in March 2015 and seeks to engage the local community and school groups and
develop a sense of ownership for individual waterways in the region. The program monitors the
Police Creek, and upper Calliope and Boyne river catchments every two weeks. Data on physico-
chemistry, macro-invertebrates and fish are recorded as well as notes on the presence of pest and
weed species. The data and program design is overseen by a technical committee made up of
representatives from government agencies and universities.
4.5.2. Other Queensland Government monitoring
In the freshwater reaches of the catchment the Queensland Government records rainfall and flow
conditions as well as electrical conductivity at some sites. These are managed by the Queensland
Department of Natural Resources and Mines and the Australian Bureau of Meteorology. There are
numerous gauging stations present in the Fitzroy River catchment and a single station at Castlehope
on the Calliope River and one below Awoonga Dam on the Boyne River. Rainfall gauge stations are
present throughout the region.
4.5.3. Marine Monitoring Program
The Great Barrier Reef Marine Park Authority (GBRMPA) is responsible for the Marine Monitoring
Program (MMP) that measures concentrations of dissolved and particulate nutrients (nitrogen,
phosphorus and carbon), chlorophyll, salinity, temperature, suspended solids and pesticides using
various techniques such as satellite remote sensing, automated data loggers, passive samplers and
in situ water sample collection. In the Capricorn and Curtis region most of the monitoring is
undertaken in Keppel Bay (see Figure 4.3, as an example). The MMP is a key component of the Reef
Water Quality Protection Plan (Reef Plan), a joint commitment of the Australian and Queensland
governments. MMP data is combined with paddock and catchment level data to produce an annual
report card on the health of the Reef.
4.5.4. AIMS monitoring
The Australian Institute of Marine Science (AIMS) hosts a number of programs monitoring water
quality in marine and coastal areas that feed into the GBRMPA water quality guidelines for the Great
Barrier Reef. In the near-shore coastal environment, measurement of water column temperature,
salinity, turbidity, nutrient, chlorophyll and suspended sediment concentrations takes place as part
of the MMP. There is also long-term chlorophyll a monitoring in coastal areas within the region and
biological monitoring of inshore reefs. AIMS are also involved in the Great Barrier Reef Ocean

60
Observing System (GBROOS) node of the nation-wide Integrated Marine Observing Scheme (IMOS),
which includes high-frequency and broad-scale reef water quality in the Reef. This includes using
"underway" sensor systems installed on vessels that traverse the Reef. An IMOS radar station at
Tannum Sands provides current flow and condition for the local area.
Figure 4.3: PSII herbicide ranges for North Keppel site over time (Gallen et al. 2014)
4.5.5. Other studies
There are numerous scientific studies that have been undertaken within the Port of Gladstone and
Port of Rockhampton. Most of these have been one-off, short-term or historical studies but provide
baseline or further information on water quality issues in the region and can assist in water quality
improvement. These include:
Environmental Impact Statements from various proponents that may or may not have
eventuated e.g. Fitzroy Terminal Project, BICET, APLNG, QGC, GLNG, WICET, WBDDP,
Channel duplication.
Coastal CRC for Coastal Zone, various Estuary and Water Management reports (1999–2006)
Other Government agency studies e.g. CSIRO metals in water and sediment 2012, EHP Turtle
monitoring, DAFF fish health studies 2011–2012.
Postgraduate theses e.g. Manganese toxicity and oxidation in Port Curtis (Anastasi 2015),
Conservation of dolphins in Capricorn coast (Cagnazzi 2010), Coral reef condition in Keppel
Islands (Jones 2009), Mud crab shell disease (Andersen 2003), Water quality risk assessment
for Port Curtis (Jones 2002).

61
Other research studies e.g. CQUni seagrass research, Southern Cross University dolphin
research, James Cook University seagrass research, ERMP migratory bird, coral and
megafauna studies and ambient noise studies.
Other industry-funded programs e.g. Gas Industry Social and Environmental Research
Alliance (2011–2016) have conducted an integrated study of the Gladstone marine
environment. This study included bio-optical water properties, seagrass distribution and
growth and turtle movements (Babcock et al. 2015).
5. Water quality management
Environmental management in the Ports of Gladstone and Rockhampton is primarily the
responsibility of the Queensland Government, which is also responsible for the management of
catchment activities impacting on water quality, such as land clearing and industrial emissions
(SEWPaC 2013). The Queensland Government has granted GPC the authority to manage port
operations (SEWPaC 2013) and it operates in accordance with an accredited environmental
management system (EMS). The Australian Government also has a role in environmental
management in the ports, relating to the national interest, the protection of matters of National
Environmental Significance and maritime issues such as sea dumping and ballast water.
5.1. Environmental legislation and agreements
Water quality has local, state, national and international implications, and there is water quality
legislation and legislation managing matters that may be impacted by poor water quality at all levels
of government, as well as agreements at the international level. Figure 5.1 summarises some of the
legislation and agreements that are most relevant to water quality issues in the Ports of Gladstone
and Rockhampton. However, there are many more policies and legislative instruments that have
some relevance to water quality management than those described here.

62
Figure 5.1: Some of the international agreements, Australian Government and Queensland
Government legislation relating to managing water quality, and managing matters that may be
affected by water quality, in the Ports of Gladstone and Rockhampton.
5.1.1. International Agreements
The international agreements with highest relevance to the water quality in the Port of Gladstone
and the Port of Rockhampton are:
• MARPOL: The International Convention for the Prevention of Pollution from Ships aims to
prevent and minimise both accidental and operational shipping pollution. It was adopted on
2 November 1973 at the International Maritime Organization. A 1978 protocol was then
adopted following a series of tanker accidents in 1976–77, and as the 1973 protocol hadn’t
yet come into force a combined instrument was created which came into force on 2 October
1983. Since then there have been several further amendments to MARPOL including the
adoption of an Annex in 2005 that focuses on air pollution including setting limits on sulfur
oxide and nitrogen oxide emissions from ship exhausts. As a signatory to MARPOL since
1987, Australia requires ships to report pollution or potential pollution incidents; this is
managed by AMSA (under the Australian Maritime Safety Authority Act 1990)37. The
37 http://www.amsa.gov.au/environment/legislation-and-prevention/amsas-role-in-maritime-environment-issues/ Accessed June 2015.

63
legislation giving effect to MARPOL in Australia includes the Protection of the Sea
(Prevention of Pollution from Ships) Act 198338.
• HAFS Convention: The International Convention on the Control of Harmful Anti-Fouling
Systems on Ships (HAFS Convention) prohibits the use of harmful organotins (including TBT)
in anti-fouling paints used on ships and establishes a mechanism to prevent the potential
future use of other harmful substances in anti-fouling systems. Organotins were prohibited
because of their impacts on non-target marine life. They persist in the water after leaching
from anti-fouling paints, harming the environment and possibly bioaccumulating through
the food chain. Parties to the HAFS Convention are required to “prohibit and/or restrict the
use of harmful anti-fouling systems on ships flying their flag, as well as ships not entitled to
fly their flag but which operate under their authority and all ships that enter a port, shipyard
or offshore terminal of a Party”. Prohibited and controlled anti-fouling systems are listed in
an annex to the Convention, which is updated when necessary39. Australia became a party to
the Convention in 2007 and implements the Convention through the Protection of the Sea
(Harmful Anti-fouling Systems) Act 200640.
• BWM Convention: The International Convention for the Control and Management of Ships’
Ballast Water and Sediments (BWM Convention) was adopted by Australia in 2005. The
convention will enter into force “12 months after 30 States with combined merchant fleets
constituting 35% of the gross tonnage of the world’s merchant shipping have signed”41. It
will require all ships to implement ballast water management plans, carry ballast water
record books and carry out ballast water management procedures to a defined standard.
Australia has applied ballast water management in its waters since 2001. The Australian
Department of Agriculture is currently developing new ballast risk-management legislation
(the Biosecurity Bill 2014).
• London Protocol: The Convention on the Prevention of Marine Pollution by Dumping of
Wastes and Other Matter 1972 (the "London Convention"), in force since 1975, is a global
convention to protect the marine environment from human activities. Its objective is to
“promote the effective control of all sources of marine pollution and to take all practicable
steps to prevent pollution of the sea by dumping of wastes and other matter”42. Currently,
87 States are Parties to the London Convention. The "London Protocol" was agreed in 1996
as a means of modernising and eventually replacing the Convention. Under the London
Protocol all dumping is prohibited, except for possibly acceptable wastes that have been
explicitly permitted (on the ‘reverse list’). There are currently 45 Parties to the Protocol. See
also Environment Protection (Sea Dumping) Act 1981, in section 5.1.2 of this report.
38 https://www.amsa.gov.au/environment/legislation-and-prevention/protection-of-the-sea/index.asp Accessed June 2015. 39 http://www.imo.org/en/About/Conventions/ListOfConventions/Pages/International-Convention-on-the-Control-of-Harmful-Anti-fouling-Systems-on-Ships-(AFS).aspx Accessed August 2015. 40 https://infrastructure.gov.au/maritime/environment/anti_fouling.aspx Accessed August 2015. 41 http://www.amsa.gov.au/environment/legislation-and-prevention/amsas-role-in-maritime-environment-issues Accessed June 2015. 42 http://www.imo.org/en/OurWork/Environment/LCLP/Pages/default.aspx Accessed August 2015.

64
• GBR World Heritage Listing: The GBR was inscribed on the UNESCO World Heritage List in
1981 for its outstanding universal value. Those values could be threatened by water quality
issues and in 2012 the World Heritage Centre and IUCN conducted a reactive monitoring
mission to the GBR to assess the state of the world heritage property, stating in the Mission
Report: “Considering the overarching importance of water quality to the Reef’s health, it is
indispensable that the current level of investment in measures to tackle this threat is
maintained and the recent positive trends are sustained”43. On 29 May 2015, following
consideration by the World Heritage Committee of the state of conservation of the GBR
World Heritage Area, the World Heritage Centre recommended against the GBR being listed
as ‘in danger’. The recommendation was made following Australian and Queensland
government actions to protect the Reef, including $200 million in funding, bans on disposal
of capital dredge material in the World Heritage Area and restrictions on port
development44. The Ports of Gladstone and Rockhampton are both within the World
Heritage Area, and predate its inscription (SEWPaC 2013).
• Bonn Convention: The Convention on the Conservation of Migratory Species of Wild Animals
(Bonn Convention) is an environmental treaty under the United Nations Environment
Program, providing for the conservation and sustainable use of migratory animals and their
habitats45. In Australia, the species listed under the Bonn Convention are automatically listed
under the Environment Protection and Biodiversity Conservation Act 1999 (EPBC Act) as
“migratory species”. Migratory species also includes species listed under the Japan-Australia
Migratory Bird Agreement (JAMBA) and the China-Australia Migratory Bird Agreement
(CAMBA); and any native, migratory species identified in a list established under
international agreements approved by the Minister (e.g. the Republic of Korea-Australia
Migratory Bird Agreement — ROKAMBA)46. Species found in the marine areas of the Fitzroy
region and potentially in the ports include 10 migratory marine bird species, two species of
migratory mammals (dugong and humpback whale) and seven migratory reptiles (e.g.
marine turtles and the saltwater crocodile) (GBRMPA 2013). Water quality can directly
influence the health of some of these species, and can have flow-on impacts through trophic
cascades and behaviour impacts in others.
5.1.2. Australian Government legislation
A variety of Australian Government legislation and policies have relevance to ports and/or marine
water quality. As well as the Australian Maritime Safety Authority Act 1990, Protection of the Sea
(Harmful Anti-fouling Systems) Act 2006, and the Protection of the Sea (Prevention of Pollution from
Ships) Act 1983 described above, the most significant of these include:
• EPBC Act: Administered by the Department of the Environment, the EPBC Act covers matters
including protected species (migratory species as described above, “marine species” and
43 http://whc.unesco.org/document/117104 Accessed August 2015. 44 http://www.environment.gov.au/minister/hunt/2015/mr20150529.html Accessed June 2015. 45 http://www.cms.int/en/legalinstrument/cms Accessed June 2015. 46 http://www.environment.gov.au/cgi-bin/sprat/public/publicshowmigratory.pl Accessed June 2015.

65
“listed threatened species and ecological communities”) and other matters of National
Environment Significance: world heritage properties, national heritage places, wetlands of
international importance (under the Ramsar Convention), Commonwealth marine areas, the
GBRMP, nuclear actions (including uranium mines) and water resources (in relation to coal
seam gas and large coal mining development)47.
• Environment Protection (Sea Dumping) Act 1981: Australia regulates waste at sea under the
Sea Dumping Act, fulfilling its obligations as a signatory to the London Protocol (or
Convention on the Prevention of Marine Pollution by Dumping of Wastes and Other Matter).
The Act most usually applies to dredging operations, the creation of artificial reefs and vessel
dumping48.
• Great Barrier Reef Marine Park Act 1975 (GBRMP Act): The Ports of Gladstone and
Rockhampton are not within, but are in close proximity to the GBRMP, which is managed by
GBRMPA under the GBRMP Act. The GBRMP Act is the primary act relating to the marine
park, and provides for the long-term protection and conservation of the environment,
biodiversity and heritage values of the GBR Region49.
5.1.3. Queensland Government legislation
Similar to Australian Government legislation, there is a variety of State legislation relating to water
quality. The most relevant Queensland Government legislation to the Ports of Gladstone and
Rockhampton includes:
• Environmental Protection Act 1994 (EP Act): The EP Act provides for Environmental
Authorities that allow industrial, resource or intensive agricultural activities with the
potential to release contaminants into the environment to be undertaken50. Port-side
industries in Gladstone and Rockhampton operate under Environmental Authorities and it is
usually the conditions on these authorities that require environmental monitoring be
undertaken (as described in Section 4 of this report).
• Nature Conservation Act 1992: This Act and its subordinate Regulations aim to conserve
nature while allowing for social and cultural values, and ecologically sustainable use. The
Nature Conservation (Wildlife) Regulation 2006 lists 814 plant and animal species that are
threatened in Queensland including a variety of marine species (e.g. sea turtles, crocodiles,
dugong, several species of dolphin and humpback whales)51. Some of these species could be
directly or indirectly impacted by poor marine water quality.
47 http://www.environment.gov.au/epbc/what-is-protected Accessed June 2015. 48 http://www.environment.gov.au/topics/marine/marine-pollution/sea-dumping/sea-dumping-act Accessed June 2015. 49 https://www.comlaw.gov.au/Details/C2015C00168 Accessed June 2015. 50 http://www.ehp.qld.gov.au/management/non-mining/environmental-authority.html Accessed June 2015. 51 https://www.ehp.qld.gov.au/wildlife/threatened-species/index.html Accessed June 2015.

66
• Fisheries Act 1994: The Fisheries Act sets out responsibilities for “economically viable,
socially acceptable and ecologically sustainable development of Queensland’s fisheries
resources”52. The Act and the Fisheries Regulation 2008 provide for the declaration and
management of Fish Habitat Areas. There are several Declared Fish Habitat Areas in
proximity to the Ports of Rockhampton and Gladstone (see Figure 2.4, Section 2 of this
report). A Declared Fish Habitat Area Investigations Program — Central Queensland, funded
by GPC as part of an offsets program, is investigating the declaration of two new Fish Habitat
Areas (Calliope River and Leekes Creek on Great Keppel Island) and the possible expansion of
two existing declared areas (Cawarral Creek and Fitzroy River, both near Rockhampton)53.
Dugong Protection Areas are also declared under the Fisheries Regulation (see Figure 2.4,
Section 2 of this report). Fish stocks (including commercial fish stocks) can potentially be
impacted by marine water quality.
• Sustainable Planning Act 2009: This Act is the overarching legislation for Queensland’s
development and planning, and supersedes the previous Integrated Planning Act 1997. The
Act seeks to achieve ecological sustainability through development management and
planning coordination, including managing the effects of development on the
environment54. A Sustainable Ports Development Bill 2015 was introduced to Queensland
Government on 3 June 2015, to implement key port-related actions of the Reef 2050 Long
Term Sustainability Plan55. The Bill, if passed as legislation would restrict new port
development in and adjoining the GBRWHA, prohibit capital dredging in the World Heritage
Area outside four priority ports (ports of Gladstone, Abbot Point, Hay Point/Mackay and
Townsville), prohibit sea-based disposal of capital dredge spoil in the World Heritage Area,
and mandate that capital dredged material be beneficially reused or disposed on land. The
Queensland Government has committed to protecting the Fitzroy Delta, Keppel Bay and
North Curtis Island, and the Port of Rockhampton is not a priority port56.
• State Development and Public Works Organisation Act 1971 (SDPWO Act): The SDPWO act
provides the Coordinator-General the power to declare a project to be a “significant project”
based on one or more of the following criteria:
o complex approval requirements, including local, State and Australian Government
involvement
o a high level of investment in the state
o potential effects on infrastructure and/or the environment
o provision of substantial employment opportunities, and
o strategic significance to a locality, region or the state.
52 https://www.daf.qld.gov.au/fisheries/consultations-and-legislation/legislation Accessed June 2015. 53 http://www.nprsr.qld.gov.au/managing/habitat-areas/investigations-program-cq.html Accessed June 2015. 54 http://dilgp.qld.gov.au/planning/planning-framework/sustainable-planning-act-2009.html Accessed June 2015. 55 http://www.statedevelopment.qld.gov.au/industry-development/sustainable-port-development.html Accessed June 2015. 56 http://www.statedevelopment.qld.gov.au/industry-development/sustainable-port-development.html Accessed June 2015.

67
The SDPWO Act is used to assess projects that are deemed to be of ‘State significance’ as
well as the State Development Areas57 . Once a project is declared significant an
Environmental Impact Statement (EIS) is usually required to ensure the project’s
environmental, social and economic impacts are appropriately considered. Only the most
important or complex projects are generally declared to be significant projects, signalling
that a robust assessment process is warranted involving whole-of-government coordination.
Under the process, the proponent is required to prepare and lodge an initial advice
statement (IAS). This can lead to the project being declared as ‘significant’. At the same time,
the project is referred to the Australian Government for potential coverage under the EPBC
Act or other statutes. Following these State and Australian government reviews, the terms
of reference for the EIS are drafted and released for public comment. The EIS is then
prepared and submitted to the Coordinator-General, after which it goes through a
government and public review process. To address any issues that might be raised, the
proponent may have to prepare a supplementary EIS. Government agencies then review the
final document, identify any conditions that have to be met, and then project approvals can
be granted.
An independent review of the Port of Gladstone commissioned by the Australian Government
(SEWPaC 2013) also listed the following Queensland legislation as relevant to port operations.
Because of their influence on port activities and development they also have relevance to port water
quality:
• Coastal Protection and Management Act 1995
• Land Act 1994
• Marine Parks Act 2004
• Transport Operations (Marine Pollution) Act 1995
• Vegetation Management Act 1999, and
• Water Act 2000.
5.2. Water Quality Guidelines
Four sets of water quality guidelines apply to water quality in the Ports of Gladstone and
Rockhampton. The guidelines are applied in the order of: most locally relevant guidelines (Water
Quality Objectives; see Section 5.2.1 below), through state-level guidelines (Queensland Water
Quality Guidelines; DERM 2009) to national guidelines (Australian and New Zealand guidelines;
ANZECC/ARMCANZ 2000). There are also specific guidelines that have been developed for the
GBRMP (GBRMPA 2010).
The Queensland Government has recently finalised the Capricorn and Curtis coast region waters —
environmental values (EVs) and water quality objectives (WQOs). The EVs and WQOs are included in
Schedule 1 of the Environment Protection (Water) Policy 2009 (the EPP Water), which identifies
locally relevant values and objectives based on local water quality monitoring data. The WQOs for
57 http://www.statedevelopment.qld.gov.au/laws-and-regulations/state-development-and-public-works-organisation-act.html

68
Capricorn and Curtis coast region waters (Figure 5.2) provide water quality indicator thresholds for
GHHP report card grades58.
Separate EVs and WQOs are in place for the Fitzroy Basin freshwater aquatic ecosystems (divided
into river catchments) and the Fitzroy River and estuary (Figure 5.3). These were finalised in 2011
and are also scheduled in the EPP Water. These WQOs provide some indicator thresholds for FPRH
report card grades in the freshwater catchment and estuary zones (FPRH 2014).
For some parameters (e.g. metals) locally relevant data are not available for the Capricorn and Curtis
coasts or the Fitzroy Basin, and hence WQOs could not be developed. In these cases the State
(Queensland Water Quality Guidelines; DERM 2009) and national (ANZECC Guidelines;
ANZECC/ARMCANZ 2000) water quality guidelines are relevant.
58 EHP Capricorn and Curtis Coast region waters – environmental values and water quality objectives: http://www.westernbasinportdevelopment.com.au/biodiversity-offset-strategy. Accessed April 2015.

69
Figure 5.2: Capricorn and Curtis coast waters as defined for the EVs and WQOs in Schedule 1 of the
EPP Water. Source: Queensland Government Department of Environment and Heritage Protection59.
59 https://www.ehp.qld.gov.au/water/policy/pdf/capricorn-curtis-coast-map.pdf Accessed May 2015.

70
Figure 5.3: Fitzroy River waters as defined for the EVs and WQOs in Schedule 1 of the EPP Water.
Source: Queensland Government Department of Environment and Heritage Protection60.
60 http://www.ehp.qld.gov.au/water/policy/pdf/plans/fitzroy_plan_300811.pdf Accessed May 2015.

71
5.3. GPC environmental management and offsets
Gladstone Ports Corporation operates in accordance with an EMS developed in 2006 and maintained
based on the requirements of AS/NZSISO 14001:2004 (the international specification for
environmental management)61. GPC’s Environmental Commitment is to manage, develop and
operate its ports in a manner which:
“minimises environmental harm and preserves the inherent worth of the environment for
future generations, through the adoption of leading practice environmental management;
ensures continual improvement in its environmental performance; and
ensures compliance with all relevant legislative requirements.” (GPC 2014c)
The objectives are generally achieved through the EMS, and specifically addressed by a series of
commitments including risk identification and management, environmental planning,
documentation of operational procedures to prevent environmental impacts and identification of
appropriate corrective and preventative actions to address environmental non-conformances (GPC
2014c).
For maintenance dredging activities, the “Long Term Monitoring and Management Plan for permit
under the Environment Protection (Sea Dumping) Act 1981 to dispose dredge material at sea:
maintenance dredging” (LTMMP) forms part of GPC’s EMS. The LTMMP is intended as a
management document that ensures compliance with legislation and also environmental best
practice during maintenance dredging and sea disposal of maintenance dredge spoil. It aims to do
this by providing a works management program that implements measures to prevent and/or
minimise the likelihood of environmental harm (GPC 2014b). The LTTMP is approved by State and
Federal government environment departments prior to commencement of works.
The ERMP commenced in 2011 as a condition of approvals for the WBDDP, with an objective to
“provide high level information on the health of Port Curtis and Port Alma ecosystems and observe
and provide advice on any potential impacts caused by the dredging program and practices”62. The
ERMP was developed and implemented by a panel of independent marine experts and has produced
a long series of scientific reports including tier one reviews and monitoring studies63 and tier two
monitoring programs64. Only one of these is directly related to water quality (“Review of Water
Quality Studies”; Hale 2013) although there are several other programs relating to species and
ecosystems that could potentially be impacted by water quality issues, including marine turtle
nesting populations, migratory shorebird populations, coral and benthos.
61 ISO 14000 – Environmental management: http://www.iso.org/iso/home/standards/management-standards/iso14000.htm. Accessed April 2015. 62 GPC Ecosystem Research and Monitoring Program: http://www.westernbasinportdevelopment.com.au/ermp. Accessed April 2015. 63 GPC ERMP Environmental Reports: http://www.westernbasinportdevelopment.com.au/ermp-environmental-reports-tier-1. Accessed April 2015. 64 GPC ERMP Environmental Reports: http://www.westernbasinportdevelopment.com.au/ermp-environmental-reports-tier-2. Accessed April 2015.

72
GPC’s BOS was also a condition of approvals for the WBDDP and was developed in 2013 with the
objective to “provide for long-term conservation of threatened and migratory species, including
their habitats that may be impacted by activities associated with the Western Basin Dredging and
Disposal Project”. The BOS has funded (and continues to fund) a variety of environment projects
including one water quality project (“Identification and development of a water quality
improvement and monitoring program for the major catchments supplying Port Curtis”; Hale 2014)
and others including some that may act to influence, or themselves be influenced by, water quality:
Signage and education
Assessment of marine traffic
Habitat enhancement and restoration actions
Stormwater pollution control
Distribution, maintenance and monitoring of TAngler bins
Coral mapping and restoration
Integrated map of all protected areas and sensitive habitats in the region and the wider
bioregion
Integrated environmentally friendly moorings (EFMs) program
Acquisition of high value ecological land to protect from development
Water quality improvement and monitoring in the Boyne and Calliope Rivers, and
Declared fish habitat area (FHA) investigations in the Central Queensland region.65
6. Discussion and knowledge gaps
6.1. Discussion
The Port of Gladstone and the Port of Rockhampton, while managed under the same frameworks,
are vastly different in scale — with 16 wharves and six main wharf centres, the Port of Gladstone is
one of Queensland’s largest multi-commodity ports, while the Port of Rockhampton is much smaller
with only three wharf facilities. Consequently, the extent of various pressures on water quality and
the level to which they are monitored differs between the two ports.
A similarity between the two ports is their placement within the GBRWHA, a characteristic which is
shared with other large northern Queensland ports including Hay Point, Queensland’s largest port
(by total throughput). The Australian Government’s independent review of the Port of Gladstone
noted that the location of the port within the WHA made environmental management particularly
important because of the potential to contribute to the values of the entire world heritage property
(SEWPaC 2013).
As a result of their estuarine locations, catchment inputs to the Ports of Gladstone and
Rockhampton (see Section 3.2 of this report) are higher than would be the case if they were situated
65 GPC Biodiversity Offset Strategy: http://www.westernbasinportdevelopment.com.au/biodiversity-offset-strategy. Accessed April 2015.

73
on non-estuarine coastline. The Australian Government’s independent review of the Port of
Gladstone highlighted the importance of catchment influences on water quality (SEWPaC 2013). The
influence of the Fitzroy River estuary on water quality in the Port of Rockhampton is higher still, as a
result of the large size and level of catchment modification of the Fitzroy Basin. The influence of the
estuaries complicates the management of port water quality as no one agency has jurisdiction over
all of the various sources, and potential sources, of pollution.
Along with catchment and urban influences, water quality in both the Port of Gladstone and the Port
of Rockhampton is influenced by shipping, ports activities, port-side industries and marine industries
to different extents given the different scales of the two ports (see Section 3 of this report).
Shipping, ports activities and port-side industries are all far more prevalent in the Port of Gladstone
than the Port of Rockhampton. Both ports have recreational fishing activity, but relatively small
commercial fishing fleets in comparison to other Queensland ports such as the Port of Townsville
and the Port of Brisbane. The relative contributions of port-related sources of pollution, in
comparison to catchment, urban, natural resuspension and (to a lesser extent) oceanic sources of
pollution, is not well known or understood in either port.
Aside from the gaps in knowledge (discussed further in Section 6.2 below) there are some process
gaps in the two Fitzroy region ports that may limit effective water quality management. The first of
these is the jurisdictional complexity of water quality management in the ports, as described above
in terms of relative contributions. The second is data availability and data sharing between sectors.
In conducting this study some data were difficult to retrieve, and the report authors are aware of
data that could not be included as they were inaccessible (e.g. details of water quality monitoring
undertaken by some industries, and detailed vessel collision/incident reports post-2007). For the
Port of Gladstone, some duplication of monitoring and research effort was identified between the
various groups — for example social, economic and cultural values in Gladstone Harbour were
recently studied simultaneously by separate projects; and research activities conducted under the
Gas Industry Social and Environmental Research Alliance (GISERA) have similarities to some of the
work conducted under the ERMP.
6.2. Knowledge gap identification
The scale of shipping and industrial activity in the Port of Gladstone, in combination with its
proximity to the GBRWHA, means that it is well monitored in comparison to other stretches of
coastline in regional Queensland. Water quality is comprehensively monitored by PCIMP for far-field
and locally monitored by the port and industries for near-field under the conditions of their
Environmental Authorities, and some monitoring is also conducted by research and community
groups (see Section 4 of this report). Although PCIMP monitoring data have historically not been
publicly available, they are provided to GHHP for analysis and some data are used in the production
of GHHP’s annual report card66. Marine ecosystem research in the port has recently been boosted by
research and monitoring undertaken by GPC as conditions on their environmental approvals through
66 Reports available at: http://rc.ghhp.org.au/

74
the ERMP67 and the BOS68 (described in Section 5 of this report). Additional marine environmental
research is conducted by CQUniversity (including through student research projects), industry
(mostly for specific water quality issues) and GHHP when developing and piloting indicators of
harbour health.
In contrast to the Port of Gladstone, which is one of the most well monitored stretches of water in
Queensland, water quality in the Port of Rockhampton is much less well understood. This is a
reflection of the much lower level of shipping and industry in and around the Port of Rockhampton.
A suite of publications on both Port Curtis and the Fitzroy Delta arose from the Cooperative
Research Centre for Coastal Zone, Estuary and Waterway Management during the early 2000s, and
the recent proposals for coal export terminal development in the Fitzroy Delta included some recent
data collection for environmental impact statements. Aside from these, intermittent issue-focused
research has been conducted by the Queensland Government and by universities. Ongoing
monitoring is limited to several Queensland Government stations and two monitoring sites funded
by GPC. As the Delta of the largest seaward draining river basin on the east coast of Australia and to
the GBRWHA the lack of monitoring in the Fitzroy estuary represents a very significant gap, although
it is recognised that this need is not driven by port activities.
CQUniversity and GPC workshopped knowledge gaps in relation to water quality in the two ports at
a meeting in Gladstone on 5 June 2015. Gaps were characterised by source and issue (Table 6.1) and
were prioritised from 1 (highest) to 3 (lower) priority. The highest priority gaps identified relate to
understanding the relative contributions of all known sources of sediment, nutrients and toxicants
(e.g. pesticides, metals, metalloids, petrochemicals) into port water. This is rated as the highest
priority because without this information it is difficult to predict the potential effectiveness of single-
sectorial management actions designed to improve water quality. Source tracking was hence
highlighted as a research gap at the workshop. The cumulative impact of increasing industrialisation
is also flagged as an important knowledge gap, particularly with the likely increases in flooding,
storm surges and tropical storms with climate change. Little is currently known about the potential
environmental impact of land-based disposal options for dredge material, and this may become
increasingly important in the Port of Gladstone as a result of the Queensland Government’s
Sustainable Ports Development Bill 2015, which includes a prohibition on sea disposal of capital
dredge spoil material in the GBRWHA69.
To produce a full Ports Water Quality Improvement Plan for the Fitzroy, it would be necessary to
have a better understanding of sources and their relative influence on water quality and ecosystem
processes. Completion of current research projects, for example the GHHP stewardship project that
will use a reporting framework to assess the current management of ports and industry sectors,
would also be beneficial and incorporation of these results may significantly reduce the
requirements for completion of a Ports Water Quality Improvement Plan.
67 Reports available at: http://www.westernbasinportdevelopment.com.au/ermp 68 Reports available at: http://www.westernbasinportdevelopment.com.au/biodiversity-offset-strategy 69 http://www.statedevelopment.qld.gov.au/industry-development/sustainable-port-development.html Accessed July 2015.

75
Table 6.1: Knowledge and information gaps on water quality in the Port of Gladstone and the Port of Rockhampton, and ranked priority (1 = highest priority; 2 = medium priority; 3 = lower priority). Filling priority 1 gaps would improve the ability to predict the effectiveness of water quality management actions. Filling priority 2 and 3 gaps would also improve predictions, but are less critical.
Category Issues Knowledge gap to be filled Priority
Catchment Agricultural chemicals
Evaluation / assessment of impact
Impacts on non-coral species and non-reef habitats in ports area (international research but no local data)
1
Urban Development, litter and pollutants
Effectiveness of litter reduction strategies for reducing litter in ports area (some research has commenced)
Hotspot management for litter and pollutants
Habitat loss and degradation caused by urban development and expansion
1
Shipping Oil, litter, pollutants
Cumulative impacts on species / ecosystems and proportionate increase with increasing shipping activity
Impacts of freight transfer spills / emissions (e.g. loading coal onto ships) on reef water quality offshore
1
Ballast water Availability / accessibility of data
2
Biosecurity Invasive species – most important vectors, and regular assessment for establishment (survey recently commenced to identify any invasive species incursions)
2
Sediment resuspension
Potential for fine sediment resuspension by ship movements and berthing
3
Incidents [relates to all boating activities]
Understanding impacts of incidents and ecosystem resilience; and how this differs between high
Proportion of incidents reported
3

76
Category Issues Knowledge gap to be filled Priority
numbers of minor incidents vs. small numbers of major incidents
Industry Pollutant loads Hotspot management
Effects of cumulative industrial impacts (and maximum allowable impacts) on ecosystems and species
Impacts on marine water quality of air-borne pollution
1
Ports development and construction activities
Habitat loss/ degradation
Effects on water quality of coastal habitat removal. Negative feedback loops.
Effects on water quality of remedial actions. Positive feedback loops.
1
Cross harbour boating/ferries
Impact of increased boating movements during construction periods on pollutants (e.g. antifoul, petrochemicals, marine debris)
Potential for fine sediment resuspension by boat movements
2
Dredging Impacts of sea and land based maintenance spoil disposal (and relative contributions)
Spatial maps of erosion/ sedimentation and understanding of the drivers
Local impacts of sedimentation and sediment-bound pollutants, and understanding movement/fate of dredged material
1
Management – industry
Review of individual industry environmental management activities/standards in ports area
Best management practices for port side industry
1
Reclamation of mangroves and wetlands
Extent of impact on habitats (some research through ERMP) and hydrology
Effects of acid sulfate soils
2
Tourism/ recreation
Water quality impacts
Water quality impacts (garbage and toxicants) of non-fishing recreation
Invasive species / hull fouling from international vessels
3
Marine debris and beach
Quantification (baseline research
2

77
Category Issues Knowledge gap to be filled Priority
pollution /boating/urban foreshore footprint
available) and assessing changes following introduction of cruise ships to Gladstone
Design of recreational facilities (eg boat ramps, jetties)
Redesigned for particular qualities (e.g. fish habitat) vs new installations
Hotspots for petrochemical and nutrient pollution from recreational and commercial vessels
3
Fishing Discarded catch
Nutrient inputs Hotspots 2
Oil, litter, pollutants
Quantification and impacts
Hotspots 1
Resuspension of sediments
Potential for fine sediment resuspension by boat movements
Resuspension on trawl grounds from fishing activity
2
Ocean sources (of pollution)
Marine debris Understanding the sources, and proportion of marine debris of various size classes that is collected/ recorded (as a sample of the total volume)
2
Cross-cutting issues
Climate change impacts on ports water quality
Increased flooding with resulting increase in catchment and urban inputs
Increased intensity and possibly increased frequency and intensity of tropical storms Increased frequency of storm surges and resulting issues for outlets
Reduction in ecosystem resilience to other cumulative pressures
1
Baselines of water quality in the two ports
Coral and sediment coring to establish environmental histories and local baselines
1
Nutrients Source tracking Evaluation / assessment of relative contributions of all sources
Relationship between catchment inflows and
1

78
Category Issues Knowledge gap to be filled Priority
nutrient concentrations
Sediments Source/sink tracking including anthropogenic and natural sources
Model validation
Relationship between sediment inputs and metals/nutrients
1
Metals and metalloids
Source tracking 1
6.3. Conclusion
Ports activities and shipping occur directly within the marine environment and some influence on
environmental conditions is unavoidable, although the extent of environmental impacts depends on
a variety of port characteristics including location, size, types of activities conducted, port-side
industry base, shipping volume and local conditions (e.g. geology and hydrography) (Darbra et al.
2005; Gómez et al. 2015). The water quality impacts of ports and shipping combine in coastal
environments with the cumulative impacts of land use pressures (e.g. port-side industries,
agriculture and urban development), other marine uses (e.g. commercial and recreational boating,
tourism) and oceanic and climate influences (e.g. marine debris, ocean acidification and floods).
In Australia, the potential impacts of ports, shipping and industries are closely regulated under a
wide variety of legislation at both the State and Federal levels of government and through
international agreements. This report summarised factors that may influence water quality and the
characteristics of the two ports in the Fitzroy region — the Port of Gladstone and the Port of
Rockhampton — and synthesised information on water quality monitoring and management in
these ports. The study identified a variety of factors with the potential to impact on water quality
and found that while water quality in the Port of Gladstone in particular has been well monitored
and researched, there remain some research and knowledge gaps relating to water quality in the
ports. Addressing these gaps would further improve understanding of port water quality and provide
a stronger information base for decision making to mitigate regional ecosystem-level effects. It is
hoped that this synthesis will help to direct future research and to frame communication to add to
the efficiency of current research and monitoring activities.

79
7. References
Alquezar, R. and Stratford, P. (2007). Rosslyn Bay boat harbour marine audit and assessment of
dredge related impacts. A report to the Fitzroy Basin Association and Queensland Transport. Centre
for Environmental Management, CQUniversity, Gladstone, Queensland.
Anastasi, A. (2015). Ecological Risk Assessment of Manganese in the Subtropical Estuarine Harbour
of Port Curtis, Queensland, Australia. PhD thesis, Central Queensland University, Rockhampton,
Queensland.
Angel, B.M., Jarolimek, C.V., King, J.J., Simpson, S.L., Jung, R.F., and Apte, S.C. (2012). Metals in the
waters and sediments of Port Curtis, Queensland. CSIRO Wealth from Oceans Flagship, Cleveland,
Queensland.
Andersen, L. (2003). A study into the epidemiology of the mud crab (Scylla serrata) shell disease.
Masters thesis, Central Queensland University, Rockhampton, Queensland.
Andersen, L. (2004). Imposex in the city: a survey to monitor the effects of TBT contamination in Port
Curtis, Queensland. Project CP20. Cooperative Research Centre for Coastal Zone, Estuary &
Waterway Management, Technical Report, Technical report No.16. Gladstone, Queensland.
Andersen, L., Melville, F., and Jolley, D. (2008). An assessment of an oil spill in Gladstone, Australia –
impacts on intertidal areas at one month post-spill. Marine Pollution Bulletin 57: 607-615.
ANZECC/ARMCANZ (2000). Australian and New Zealand guidelines for fresh and marine water
quality: Volume 1 – the guidelines. Available at:
http://www.environment.gov.au/water/quality/publications/australian-and-new-zealand-
guidelines-fresh-marine-water-quality-volume-1
Apte, S.C., Duivenvoorden, L., Johnson, R., Jones, M., Revill, A., Simpson, S., Stauber, J.L. and Vicente-
Beckett, V. (2005). Contaminants in Port Curtis: Screening Level Risk Assessment. Cooperative
Research Centre for Coastal Zone, Estuary & Waterway Management, Technical Report No.25.
Gladstone, Queensland.
Apte, S.C., Andersen, L.E., Andrewartha, J.R., Angel, B.M., Shearer, D., Simpson, S.L., Stauber, J.L. &
Vicente-Beckett, V. (2006). Contaminant pathways in Port Curtis: final report. CRC for Coastal Zone,
Estuary and Waterway Management. Gladstone, Queensland.
Bartley, R., Speirs, W.J., Ellis, T.W., and Waters, D.K. (2012). A review of sediment and nutrient
concentration data from Australia for use in catchment water quality models. Marine Pollution
Bulletin 65: 101-116.
BITRE [Bureau of Infrastructure, Transport and Regional Economics]. (2014). Australian sea freight
2012–13, Australian Government, Canberra.

80
Borja, Á., Elliot, M., Carstensen, J., Heiskanen, A.s., and van de Bund, W. (2010). Marine
management – towards an integrated implementation of the European Marine Strategy Framework
and the Water Framework Directives. Marine Pollution Bulletin 60: 2175-2186.
Brodie, J. (2014). Dredging the Great Barrier Reef: Use and misuse of science. Estuarine, Coastal and
Shelf Science 142: 1-3.
Bryant, C.V., Jarvis, J.C., York, P.H., and Rasheed, M.A. (2014). Gladstone Healthy Harbour
Partnership Pilot Report Card: ISP011 Seagrass Final Report – October 2014. Centre for Tropical
Water and Aquatic Ecosystem Research Publication 14/53 James Cook University, Cairns,
Queensland.
Bureau of Meterology [BOM] (2015). Average annual, seasonal and monthly rainfall: Queensland.
Accessed June 2015.
http://www.bom.gov.au/jsp/ncc/climate_averages/rainfall/index.jsp?period=an&area=qd#maps
Burns, K.A. (2014). PAHs in the Great Barrier Reef Lagoon reach potentially toxic levels from coal
port activities. Estuarine Coastal and Shelf Science 144: 39-45.
Burns, K.A., and Brinkman, D.L. (2011). Organic biomarkers to describe the major carbon inputs and
cycling of organic matter in the central Great Barrier Reef region. Estuarine Coastal and Shelf Science
93: 132-141.
Cagnazzi, D. (2010). Conservation status of Australian snubfin, Orcaella heinsohni and the Indo-
pacific humpback dolphin, Sousa chinensis, in the Capricorn coast, Central Queensland. PhD thesis,
Southern Cross University, Lismore, New South Wales.
C&R Consulting. (2005). Calliope River Basin Draft Water Resource Plan Ecological Assessment
Report. Report to Department of Natural Resources and Mines, Queensland.
Carter, A.B., Davies, J.D., Bryant, C.V., Jarvis, J.C., McKenna, S.A. and Rasheed, M.A. (2015). Seagrasses in Port Curtis and Rodds Bay 2014: Annual long‐term monitoring, biannual Western Basin, and updated baseline survey, Centre for Tropical Water & Aquatic Ecosystem Research (TropWATER) Publication 15/06, James Cook University, Cairns, Queensland. Connolly, R.M., Currie, D.R., Danaher, K.F., Dunning, M., Melzer, A., Platten, J.R., Shearer, D.,
Stratford, P.J., Teasdale, P.R., and Vandergragt, M. (2006). Intertidal wetlands of Port Curtis.
Ecological patterns and processes and their implications. Technical Report 43. CRC for Coastal Zone,
Estuary and Waterway Management, Gladstone, Queensland.
Curry, D., and Small, K. (2005). Macrobenthic community structure in the Fitzroy River Estuary,
Queensland. In: Nobel, B, Bell, A, Verwey, & Tilden, J (eds), Fitzroy in focus: coastal science for the
Fitzroy region. Cooperative Research Centre for Coastal Zone, Estuary and Waterway Management,
Indooroopilly, Queensland.
DAFF [Australian Department of Agriculture Fisheries and Forestry] (2011). Australian Ballast Water
Management Requirements, version 5. Seaports Program. Australian Government, Canberra.

81
DAFF [Queensland Department of Agriculture Fisheries and Forestry]. (2012). Commercial catch of
key species Gladstone (2006-2011). Queensland Government, Brisbane, Queensland. Available at:
https://www.daf.qld.gov.au/__data/assets/pdf_file/0017/52505/gladstone-catch-report-
20April12.pdf
Dafforn, K.A., Lewis, J.A. and Johnston, E.L. (2011). Antifouling strategies: History and regulation,
ecological impacts and mitigation. Marine Pollution Bulletin 62: 453-465.
Darbra, R.M., Ronza, A., Stojanovic, T.A., Wooldridge, C., and Casal, J. (2015). A procedure for
identifying significant environmental aspects in sea ports. Marine Pollution Bulletin 50: 866-874.
DEHP [Department of Environment and Heritage Protection] (2012). Analysis of Water Quality in
Relation to Fish Health in Gladstone Harbour and Waterways September 2011 – September 2012.
Queensland Government, Brisbane, Queensland.
DERM [Department of Environment and Resource Management] (2009). Queensland Water Quality
Guidelines. Queensland Government, Brisbane, Queensland.
Devlin, M., Wenger, A., Waterhouse, J., Romero, J., Abbott, B., Bainbridge, Z. and Lewis, S. (2011).
Reef Rescue Marine Monitoring Program: Flood Plume Monitoring Annual Report Incorporating
results from the Extreme Weather Incident Response program, ACTFR REPORT 11/x. James Cook
University, Townsville, Queensland.
DNRM [Department of Natural Resources and Mines] (2014). Boyne River Basin Water Resource Plan
and Resource Operations Plan. Consultation Report January 2014, Queensland Government,
Brisbane, Queensland. Available online at:
https://www.dnrm.qld.gov.au/__data/assets/pdf_file/0005/123674/boyne-consultation-report.pdf
DNRW [Department of Natural Resources and Water] (2007). Calliope River Basin water resource
plan consultation report. Queensland Government, Brisbane, Queensland. Available at:
https://www.dnrm.qld.gov.au/__data/assets/pdf_file/0003/109065/calliope-wrp-consultation.pdf
Dougall, C., McCloskey, G.L., Ellis, R., Shaw, M., Waters, D., and Carroll, C. (2014). Modelling
reductions of pollutant loads due to improved management practices in the Great Barrier Reef
catchments – Fitzroy NRM region, Technical Report, Volume 6. Queensland Department of Natural
Resources and Mines, Rockhampton, Queensland.
Dougall, C., Packett, R., Carroll, C. (2005). Application of the SedNet model in partnership with the
Fitzroy Basin community. In: Zerger, A., Argent, R.M. (Eds.), MODSIM 2005 International Congress on
Modelling and Simulation. Modelling and Simulation Society of Australia and New Zealand,
December 2005.
DSITIA [Department of Science, Information Technology, Innovations and the Arts] (2013). Post-flood
Water Quality Monitoring in Gladstone Harbour and Waterways. Queensland Government, Brisbane,
Queensland.
DTMR [Department of Transport and Main Roads] (2012a). Port Procedures and information for
Shipping Port of Gladstone. Queensland Government.

82
DTMR [Department of Transport and main Roads] (2012b). Annual Report 2011-12, Volume 1 of 2.
Queensland Government.
DTMR [Department of Transport and Main Roads] (2013a). Queensland’s Maritime Regions,
December 2013. Available at:
http://www.msq.qld.gov.au/~/media/msqinternet/msqfiles/home/about%20us/right%20to%20infor
mation/queenslandmaritimeregions.pdf Accessed June 2015.
DTMR [Department of Transport and Main Roads] (2013b). Standard for Marine Construction
Activities in Gladstone Harbour. Queensland Government.
DTMR [Department of Transport and Main Roads] (2014). Trade Statistics for Queensland Ports for
the five years ending 30 June 2013. Queensland Government.
EHP [Department of Environment and Heritage Protection] (2011). State of the Environment
Queensland 2011. Queensland Government, Brisbane, Queensland.
EPA [Environmental Protection Agency] (2008). State of the Environment Queensland 2007.
Queensland Government, Brisbane, Queensland.
Erftemeijer, P.L.A., Riegl, B., Hoeksema, B.W., Todd, P.A. (2012). Environmental impacts of dredging
and other sediment disturbances on corals: A review. Marine Pollution Bulletin 64: 1737-1765.
Erftemeijer, P.L.A., and Lewis, R.R. (2006). Environmental impacts of dredging on seagrasses: A
review. Marine Pollution Bulletin 52: 1553-1572.
Evans, S.M., Leksono, T. & McKinnell, P.D. (1995). Tributyltin pollution: a diminishing problem
following legislation limiting the use of TBT-based anti-fouling paints. Marine Pollution Bulletin 30:
14-21.
FPRH [Fitzroy Partnership for River Health] (2014). The Partnership Program Design for the
Development of Report Cards. Phase 2, Version 3. Fitzroy Partnership for River Health, Rockhampton,
Queensland.
Fryda-Blackwell, S. (2014). Ports Australia response to the Marine Pest Biosecurity System Issue
Paper. Available at: http://www.agriculture.gov.au/SiteCollectionDocuments/animal-plant-
health/pests-diseases-weeds/marine-pests/submissions/11-ports.docx
Gallen, C., Devlin, M., Thompson, K., Paxman, C., Mueller, J. (2014). Pesticide monitoring in inshore
waters of the Great Barrier Reef using both time-integrated and event monitoring techniques (2013 -
2014). The National Research Centre for Environmental Toxicology, The University of Queensland,
Brisbane, Queensland.
GBRMPA [Great Barrier Reef Marine Park Authority] (2010). Water Quality Guidelines for the Great
Barrier Reef Marine Park, Townsville, Queensland.
GBRMPA [Great Barrier Reef Marine Park Authority] (2013). Fitzroy basin assessment: Fitzroy Basin
Association Natural Regional Management, Townsville, Queensland.

83
GBRMPA [Great Barrier Reef Marine Park Authority] (2014). Great Barrier Reef Outlook Report 2014,
Townsville, Queensland.
Goldsworthy, L. and Galbally, I.E. (2011). Ship engine exhaust emissions in waters around Australia -
an overview. Air Quality and Climate Change, 45: 24-32.
Gómez, A.G., Ondiviela, B., Puente, A. and Juanes, J.A. (2015). Environmental risk assessment of
water quality in harbor areas: A new methodology applied to European ports. Journal of
Environmental Management 155: 77-88.
GPC [Gladstone Port Corporation] (2011a). Port Alma Shipping Terminal Port Information Handbook
2010. Gladstone, Queensland. Available at:
http://www.gpcl.com.au/Portals/0/pdf/Handbook/Port_Alma_Info_Handbook_2011.pdf
GPC [Gladstone Port Corporation] (2011b). Port of Gladstone Information Handbook 2011.
Gladstone, Queensland. Available at:
http://www.gpcl.com.au/Portals/0/pdf/Handbook/Port_of_Gladstone_Information_Handbook_Nov
ember_2011.pdf
GPC [Gladstone Port Corporation] (2012). 50 year strategic plan for Gladstone Ports Corporation.
Gladstone, Queensland. Available at:
http://www.gpcl.com.au/Portals/0/pdf/50%20yr%20plan/GPC_50yr_strategic_plan_2012_update.p
df
GPC [Gladstone Port Corporation] (2014a). Annual Report 2013-14. Available at:
http://www.gpcl.com.au/Pages/Annual-Report.aspx
GPC [Gladstone Port Corporation] (2014b). Long term monitoring and management plan for permit
under the Environment Protection (Sea Dumping) Act 1981 to dispose of dredge material at sea.
Maintenance dredging. Gladstone Ports Corporation, Gladstone, Queensland.
GPC [Gladstone Port Corporation] (2014c). Our Environmental Commitment. Craig Doyle, Chief
Executive Officer, January 2014. Available at: http://www.gpcl.com.au/environment
GPC [Gladstone Ports Corporation] (2015). Origin & Destination of Cargoes: Totals for Financial Year
2014. Accessed May 2015. Available at:
https://content1.gpcl.com.au/ViewContent/CargoComparisonsSelection/CargoOriginDestination.asp
x?View=P&Durat=F&Key=2014
Grech, A., Bos, M., Brodie, J., Coles, R., Dale, A., Gilbert, R., Hamann, M., Marsh, H., Neil, K., Pressey,
R.L., Rasheed, M.A., Sheaves, M., and Smith, A. (2013). Guiding principles for the improved
governance of port and shipping impacts on the Great Barrier Reef. Marine Pollution Bulletin 75: 8-
20.
Gregg, D., and Greiner, R. (2008). The direct impact of recreation on water quality in the Great
Barrier Reef Marine Park. Report prepared for the Great Barrier Reef Marine Park Authority. River
Consulting, Townsville, Queensland.

84
Hale, J. (2013). CA120020: Review of water quality studies. Gladstone Ports Corporation ERMP
report. Aquatic Ecology Consulting.
Hale, J. and Box, P. (2014). Identification and development of a water quality improvement and
monitoring program for the major catchments supplying Port Curtis. A report for Gladstone Ports
Corporation’s Biodiversity Offset Strategy.
Herzfeld, M., Parslow, J., Andrewartha, J., Sakov, P., and Webster, I. (2004). Hydrodynamic Modelling
of the Port Curtis Region. Technical Report No.7. Cooperative Research Centre for Coastal Zone,
Estuary and Waterway Management, Brisbane, Queensland.
Holton, (2011). Acid sulphate soil management plan western basin dredging and offshore/onshore
disposal project, Gladstone, Queensland. (Report no: 10524_ASSMP_REH5F.docx). Gilbert and
Sutherland. Robina, Queensland.
Houston, W., Black, R., Elder, R., Black, L., & Segal, R. (2012). Conservation value of solar salt ponds
in coastal tropical eastern Australia to waterbirds and migratory shorebirds. Pacific Conservation
Biology 18: 100-122.
Jones, M-A. (2002). Assessing the risk from chemical contaminants in the Port Curtis Estuary,
Australia. Masters thesis, Central Queensland University, Rockhampton, Queensland.
Jones, M.A., Stauber, J., Apte, S., Simpson, S., Vicente-Beckett, V., Johnson, R., and Duivenvoorden,
L.J. (2005). A risk assessment approach to contaminants in Port Curtis, Queensland, Australia.
Marine Pollution Bulletin 51: 448-458.
Jones, A. (2009). Physiological Trade-offs to Thermal Acclimation by Symbiont Community Change in
the Reef Coral Acropora millepora. PhD thesis, Central Queensland University, Rockhampton,
Queensland.
Kabat, P., Bazelmans, J., van Dijk, J., Herman, P.M.J., van Oijen, T., Pejrup, M., Reise, K., Speelman,
H., and Wolff, W.J. (2012). The Wadden Sea Region: Towards a science for sustainable development.
Ocean & Coastal Management 68: 4-17.
Kroon, F.J., Kuhnert, P.M., Henderson, B.L., Wilkinson, S.N., Kinsey-Henderson, A., Abbott, B., Brodie,
J.E. & Turner, R.D.R. (2012). River loads of suspended solids, nitrogen, phosphorus and herbicides
delivered to the Great Barrier Reef lagoon. Marine Pollution Bulletin 65: 167-181.
Lewis, J.A. and Gillham, A.C. (2007). Antifouling paint patch trial project – Final report. Report for
Australian Government Department of Defence and the Australian Shipowners Association. Available
at: http://asa.com.au/wp-content/uploads/Paint-patch-trials-Final-Report.pdf
Lewis, S., Hewitt, C., and Melzer, A. (2001). Port survey for introduced marine species Port Curtis –
Final report. Centre for Environmental Management Centre for Land and Water Resource
Management. CQUniversity, Gladstone, Queensland.
Lohrer, A.M. and Wetz, J.J. (2003). Dredging-induced nutrient release from sediments to the water
column in a southeastern saltmarsh tidal creek. Marine Pollution Bulletin 46: 1156-1163.

85
Low, T. (2003). Ballast invaders: the problem and response. Prepared for Invasive Species Council.
McCook, L.J., Schaffelke, B., Apte, S.C., Brinkman, R., Brodie, J., Erftemeijer, P., Eyre, B., Hoogerwerf,
F., Irvine, I., Jones, R., King, B., Marsh, H., Masini, R., Morton, R., Pitcher, R., Rasheed, M., Sheaves,
M., Symonds, A., Warne, M.St.J. (2015). Synthesis of current knowledge of the biophysical impacts of
dredging and disposal on the Great Barrier Reef: Report of an Independent Panel of Experts, Great
Barrier Reef Marine Park Authority, Townsville, Queensland.
MSQ [Marine Safety Queensland] (2014). Marine incident annual reports (Years 2001-2013).
Available online: http://www.msq.qld.gov.au/About-us/Marine-incident-annual-reports.aspx
Accessed May 2015.
MSQ [Maritime Safety Queensland] (2015a). Registered commercial vessels, Queensland, by region
and length. Available at:
http://www.msq.qld.gov.au/~/media/msqinternet/msqfiles/home/about%20us/right%20to%20infor
mation/published%20information/lists%20and%20registers/commercialregistration.pdf Accessed
March 2015.
MSQ [Maritime Safety Queensland] (2015b). Registered recreational vessels, Queensland, by region
and length. Available at:
http://www.msq.qld.gov.au/~/media/msqinternet/msqfiles/home/about%20us/right%20to%20infor
mation/published%20information/lists%20and%20registers/recreationalregistration.pdf Accessed
March 2015.
Newman, M.C., and McIntosh, A.W. (Eds.) (1991). Metal ecotoxicology concepts and applications.
Lewis Publishers Inc. Chelsea, Michigan.
Packett, R., Dougall, C., Rohde, K. & Noble, R. (2009). Agricultural lands are hot-spots for annual
runoff polluting the southern Great Barrier Reef lagoon. Marine Pollution Bulletin 58: 976-986.
Petus, C., and Devlin, M. (2012). Using satellite maps to document the extent of sediment plumes
associated with dredging activity in Gladstone Port's western basin. Catchment to Reef Research
Group, James Cook University, Townsville, Queensland.
Ports Australia (2015). Trade statistics for 2012/2013. Accessed June 2015. Available at:
http://www.portsaustralia.com.au/aus-ports-industry/trade-statistics/
Queensland Government (2009). Queensland Land Use Mapping Program. Available at:
https://www.dnrm.qld.gov.au/
Queensland Government (2014). Summary of oil spills and other marine pollution events reported to
Maritime Safety Queensland from 2002 to 2013. Available at:
https://data.qld.gov.au/dataset/marine-oil-spills-data/resource/280b7e6e-61b5-4502-b365-
96bafea2950a Accessed May 2015.
QRC [Queensland Resources Council] (2015). Economic Contribution for Fitzroy Region. Accessed
August 2015. Available at: https://www.qrc.org.au/01_cms/details.asp?ID=3466
86
Robins, J.B. and Courtney, A.J. (1998). Status report on bycatch within the Queensland trawl fishery.
In: C. Buxton and S. Eayrs. (Eds.), Establishing meaningful targets for bycatch reduction in Australian
fisheries (pp. 24-45). Hobart: Australian Society for Fish Biology Workshop Proceedings, 22-24
September 1998.
Ross, D.J. (2004). Acid sulphate soils Tannum Sands – Gladstone area Central Queensland Coast.
(Report no: QNRM04285). Department of Natural Resources and Mines, Rockhampton, Queensland.
Sawynok, B., Platten, J., Parsons, W., and Sawynok, S. (2014). Gladfish: Gladstone recreational fishing
project. Assessing trends in Recreational Fishing in Gladstone Harbour and Adjacent Waterways.
InfoFish Australia, Rockhampton, Queensland.
SEWPaC [Department of Sustainability, Environment, Water, Population and Communities] (2013).
Independent Review of the Port of Gladstone: Report on Findings. Australian Government, Canberra,
Available at: http://www.environment.gov.au/system/files/resources/ae7cbcf9-2963-47d7-9029-
3aa1a065db51/files/gladstone-review-initial-report.pdf
Sheehan, C. and Harrington, J. (2012). Management of dredge material in the Republic of Ireland – A
Review. Waste Management 32: 1031-1044.
Smith, S.D.A, and Rule, M.J. (2001). The effects of dredge-spoil dumping on a shallow water soft-
sediment community in the Solitary Islands Marine Park, NSW, Australia. Marine Pollution Bulletin
42: 1040-1047.
Stobutzki, I., Blaber, Brewer, D., Fry, G., Heales, D., Jones, P., Miller, M., Miller, D., Salini, J., Van der
Velde, T., Wang, Y-G. and Wassenberg, T. (1996). Ecological sustainability of bycatch and biodiversity
in prawn trawl fisheries. CSIRO, Cleveland, Queensland.
Taylor S., Webley, J., and McInnes, K. (2012). 2010 Statewide Recreational Fishing Survey,
Department of Agriculture, Fisheries and Forestry (DAFF), Brisbane, Queensland.
Tourism Research Australia. (2014). SGBR Regional snapshot year ending June 2014. Available at:
http://www.gladstoneregion.info/Portals/3/Business%20Centre/Tourism%20Services/SGBR%20Regi
onal%20Snapshot%20June%202014.pdf
UK Marine Special Areas of Conservation (2001). TBT-based antifouling paints. Copper-based
antifouling paints. Available at: http://www.ukmarinesac.org.uk/activities/ports/ph4_3_1.htm
UNCTAD (2014). Review of Maritime Transport 2014. UNITED NATIONS PUBLICATION
(UNCTAD/RMT/2014).
Vincente-Beckett, V., Shearer, D., Munksgaard, N., Hancock, G., and Morrison, H. (2006). Metal and
polycyclic aromatic hydrocarbon contaminants in benthic sediments of Port Curtis. Cooperative
Research Centre for Coastal Zone, Estuary and Waterway Management.
Wilson, S.P. (2009). Status of Imposex from tributyltin contamination in Port Curtis. Centre for
Environmental Management, CQUniversity, Gladstone, Queensland.

87
Wilson, S.P. (2013) Marine debris tracking on the Capricorn Coast region. Report to Greening
Australia. CQUniversity, Marine Debris Research Lab, Gladstone, Queensland.
Wilson, S.P. (2014a). Gladstone Region debris tracking study. Gladstone Ports Corporation
Biodiversity Offset Strategy Report. CQUniversity, Marine Debris Research Lab, Gladstone,
Queensland.
Wilson, S.P. (2014b). Gladstone Region TAngler Bin assessments. Gladstone Ports Corporation
Biodiversity Offset Strategy Report. CQUniversity, Marine Debris Research Lab, Gladstone,
Queensland.
Wilson, S.P. and Cartraud, A. (2014). Gladstone region shoreline debris survey final report. School of
Medical and Applied Sciences, CQUniversity, Gladstone, Queensland.
Wilson, S.P. and Hansler, M. (2014). Gladstone catchment care marine debris - Final report for
2013/2014. School of Medical and Applied Sciences, CQUniversity, Gladstone, Queensland.
Yu, B., Joo, M. And Caroll, C. (2013). Land use and water quality trends of the Fitzroy River, Australia.
In: Berit Arheimer et al. (eds). Understanding Freshwater Quality Problems in a Changing World,
Proceedings of H04, IAHS-IAPSO-IASPEI Assembly. International Association for Hydrological
Sciences. Available at:
http://www98.griffith.edu.au/dspace/bitstream/handle/10072/58668/88048_1.pdf?sequence=1

88
Appendix: Supplementary data
Table A.1: Prosecutions for ship sourced garbage pollution Commonwealth and State legislation
from 2007 to 2014 in Gladstone and Rockhampton70
Table A.2: Boat ramps and jetties in the Gladstone and Rockhampton regions. Note that this list
includes facilities beyond the limits of the Ports of Gladstone and Rockhampton (Source: MSQ71).
Facility Location Type Lanes/berth
Gladstone
Tannum Sands, Boat Ramp Road Boat ramp 1
Tannum Sands, Blackwell Street (Ibis park) Boat ramp 1
Boyne Island, Alexander Street Boat ramp 1
Boyne Island, Wyndham Road (David Bray Park) Boat ramp 3
Toolooa, Gladstone - Benaraby Road Boat ramp 2
Gladstone, Morgan Street Boat ramp 2
Gladstone, Goondoon Street Boat ramp 3
Gladstone, Hanson Road Boat ramp 4
70 https://www.amsa.gov.au/environment/legislation-and-prevention/prosecutions/garbage/table.asp Accessed March 2015 71 http://www.msq.qld.gov.au/~/media/msqinternet/msqfiles/home/waterways/boating%20infrastructure/boating%20facilities/pdf_boatramp_central_qld.pdf Accessed April 2015.
Date of Prosecution
Date of Incident
Jurisdiction Vessel name
Vessel type Flag Location Type of garbage Penalty
18/11/14 13/06/13 Townsville Magistrates Court
Xin Tai Hai
Bulk Carrier Panama ~16 nm from the Port of Gladstone
Plastic, garbage and food waste.
Owner: $20,000 Master: $6,000 Both convicted
15/11/12 29/06/12 Commonwealth, S26F(3) of the Protection of the Sea (Prevention of Pollution from Ships) Act 1983. Cairns Magistrates Court
Hope Star
Bulk Carrier Panama QLD waters within nearest land and GBRMP. 22.30º S 153.00º E
Garbage Owner: $5,000 Master: $300 Both convicted
23/05/07 24/3/06 to 7/4/06
Commonwealth Gladstone Magistrates court S26F(3)
Azul Libero Bulk carrier Singapore QLD waters within nearest land and GBRMP ~4 nm off the coast.
Food waste Owner: $5,000 Master: $1,200
5/12/06 28/09/04 Commonwealth Rockhampton Magistrates Court
Loch Maree Bulk carrier Hong Kong
QLD waters within nearest land, ~15 nm from coast
Food waste Owner: $6,000 Master: $500

89
Curtis Island, Wyndham Avenue Boat ramp 1
Calliope River, Bruce Highway Boat ramp 1
The Narrows, south of Ramsay Crossing Boat ramp 1
The Narrows, Ramsay Crossing Boat ramp 1
Gladstone Marina* Boat ramp 5
Rockhampton
Port Alma, Port Alma Road Boat ramp 2
Rockhampton, Derby Street Jetty
Rockhampton, Larcombe Street Boat ramp 2
Rockhampton, via Huet Street (Ski Gardens) Boat ramp 2
Rockhampton, Reaney Street Boat ramp 2
Nerimbera, St Christopher’s Chapel Road Boat ramp 2
Keppel Sands, Limpus Avenue (upstream) Boat ramp 1
Keppel Sands, Limpus Avenue (downstream) Boat ramp 1
Keppel Sands, Taylor Street Boat ramp 2
Coorooman Creek, Svendsen Road Boat ramp 2
Emu Park, Hill Street Boat ramp 1
Mulambin, Yeppoon-Emu Park Road Boat ramp 1
Rosslyn Bay, Vin E. Jones Drive Wharf
Rosslyn Bay, Vin E. Jones Drive Jetty
Rosslyn Bay, Vin E. Jones Drive (commercial jetty #2) Jetty
Rosslyn Bay, Vin E. Jones Drive (Lay-up maintenance jetty #1) Jetty
Rosslyn Bay, Anchor Drive (southern) Boat ramp 4
Rosslyn Bay, Breakwater Drive (western) Boat ramp 4
Yeppoon, Emu Park Road (Fig Tree Creek) Boat ramp 1
Corbetts Landing, Corbetts Landing Road Boat ramp 1
* Not listed by MSQ (constructed in 2011, MSQ data are from 2009)

90
Table A.3: Most important commercial fish species by weight for Gladstone harbour (Grid S30).
Data are for all years 1990–2014 in total (Source: DAF72).
Species Fishing Method
Licences Days Weight (t)
Crab – mud Pot 179 58,005 2,054.68
Prawn - banana Otter trawl
117 7,413 1,370.19
Scallop - saucer Otter trawl
275 5,675 531.44
Barramundi Net 84 4,715 493.11
Mullet - unspecified Net 128 7,082 384.97
Shark - whaler unspecified
Net 48 3,098 372.16
Mackerel - grey Net 50 2,422 351.17
Threadfin - blue Net 131 8,485 245.46
Shark - unspecified Net 106 4,416 234.23
Total for key sp. 101,311 6,037.42
Table A.4: Summary of key commercial fishing species (1990–2014) for Rockhampton (Grid R30)
(Source: DAF73).
72 Query results for grid region S30 for commercial fishing effort. Retrieved from http://qfish.daff.qld.gov.au/Query/ViewResults?CubeId=7&PredefinedQueryId=2d38a533-02cb-41a5-88d7-46700c7ee480&ViewKind=Pivot May 2015. 73 Query results for grid region R30 for commercial fishing effort Port Alma. Retrieved from
http://qfish.daff.qld.gov.au/Query/ViewResults?CubeId=7&PredefinedQueryId=107accd9-edf6-4611-acfd-
2c1e7b92eef3&ViewKind=Pivot May 2015.
Species Fishing Method
Licences Days Weight (t)
Crab – mud Pot 165 56,205 1,457.59
Prawn – banana Beam trawl 53 16,905 638.10
Barramundi Net 102 10,974 449.94
Threadfin – blue Net 141 7,235 295.21
Threadfin – king Net 139 12,481 470.70
Total for key sp. 103,800 3,311.54
