synthesis of novel targeted drug delivery systems for cancer therapy
TRANSCRIPT

Dublin Institute of TechnologyARROW@DIT
Masters Science
2008-05-01
Synthesis of Novel Targeted Drug DeliverySystems for Cancer TherapyAntonio ClementiDublin Institute of Technology
Follow this and additional works at: http://arrow.dit.ie/scienmas
Part of the Pharmacy and Pharmaceutical Sciences Commons
This Theses, Masters is brought to you for free and open access by theScience at ARROW@DIT. It has been accepted for inclusion in Masters byan authorized administrator of ARROW@DIT. For more information,please contact [email protected], [email protected],[email protected].
This work is licensed under a Creative Commons Attribution-Noncommercial-Share Alike 3.0 License
Recommended CitationClementi, A. (2008). Synthesis of Novel Targeted Drug Delivery Systems for Cancer Therapy. Masters dissertation. Dublin Institute ofTechnology. doi:10.21427/D7J02X

Science
Masters
Dublin Institute of Technology Year
Synthesis of Novel Targeted Drug
Delivery Systems for Cancer Therapy
Antonio ClementiDublin Institute of Technology
This paper is posted at ARROW@DIT.
http://arrow.dit.ie/scienmas/58

— Use Licence —
Attribution-NonCommercial-ShareAlike 1.0
You are free:
• to copy, distribute, display, and perform the work
• to make derivative works
Under the following conditions:
• Attribution.You must give the original author credit.
• Non-Commercial.You may not use this work for commercial purposes.
• Share Alike.If you alter, transform, or build upon this work, you may distribute theresulting work only under a license identical to this one.
For any reuse or distribution, you must make clear to others the license termsof this work. Any of these conditions can be waived if you get permission fromthe author.
Your fair use and other rights are in no way affected by the above.
This work is licensed under the Creative Commons Attribution-NonCommercial-ShareAlike License. To view a copy of this license, visit:
• URL (human-readable summary):http://creativecommons.org/licenses/by-nc-sa/1.0/
• URL (legal code):http://creativecommons.org/worldwide/uk/translated-license
D·I ·T • • :z:
Synthesis of Novel Targeted Drug Delivery
Systems for Cancer Therapy
By
Antonio Clementi
A Thesis Submitted to the Dublin Institute of Technology, for the Degree of Master of Philosophy.
Supervised by Dr. Christine M. O' Connor Dr. Mary McNamara Dr. Antonino Mazzaglia
Prof. Maria Chiara A versa
School of Chemical and Pharmaceutical Sciences Dublin Institute of Technology Kevin Street, Dublin 8, Ireland.
Institute ofNanostructured Materials (lSMN-CNR) and
Department of Organic and Biological Chemistry University of Messina
Salita Sperone 31, 98166 Villaggio S. Agata (ME), Italy.
May 2008

Abstract
One of the most important goals of pharmaceutical science is local izing the
pharmacological activity of the drug at the site of action. Drug delivery systems
- are. molecular tools which without undesired interaction at other sites target a
specific drug receptor. In this work a· novel folate-cyclodextrin conjugate was
synthesised for potential use as a drug delivery system in cancer therapy. Folate
was directly covalently bound to an amino derivative of p-Cyclodextrin with a
view to decreasing the polydispersity of the carrier system. Ultimately the
cyclodextrin cavity will be used to transport drugs to the site of action.
This study also describes the structural characterisation of the novel folate-
cyclodextrin conjugate using a range of techniques including electronic,
vibrational, NMR, MALDI-MS and ESI-MS spectroscopies, all of which provided
evidence that the folate moiety was bound to the cyclodextrin through an amide
linkage.
HPLC analysis was employed to study the purity of the conjugate prepared and
provided evidence of the formation of a and y structural isomers. The
photostability of the conjugate was assessed using electronic spectroscopy and the
formation of particles was detected by light scattering. Preliminary biological •
evaluation of the tumour targeting device was carried out using HeLa cells and no
evidences of cytotoxicity are recorded.

Acknowledgements
Thanks to Dr Christine M. O'Connor for her precious support during this project
and for her exceptional human talent. Thanks to Dr Mary McNamara for her
guidance and suggesting the most pragmatic way to understand things (just not for
science).
Thanks to Dr Antonino Mazzaglia for his help through daily talks. His enthusiasm
and life energy have been very important. Prof Maria Chiara Aversa always gave
great support during organic synthesis and allowed me to work in the best
cond itions.
Thanks to all academic staff at the School of Chemical and Pharmaceutical
Sciences in DIT, especially to Dr Sarah Rawe, Dr Michael Seery and Dr Claire.
McDonnell for their contributions to the project. I would also like to remember Dr
John Fox, Dr Barry Foley and Dr Declan McCormack. Thanks to the technical
staff, Mr Martin Kitson and Ms Annette Callaghan.
I would like to thank Dr Hugh 1. Byrne, Ms Louisa Hartnett, and Ms Anne
Shanahan of the Focas Institute, DIT.
Thanks to Aversa's team for help during the time spent on organic synthesis: Dr
Anna Barattucci and Dr Grazie Cafeo for their contributions to NMR spectra, Prof
Placido Giannetto for his suggestions during the lab work and Prof Paola
Bonaccorsi. Dr Gianluca Battaglia for his help during the synthetic job.
Thanks to Dr Rosanna Stancanelli, Dr Marta Guardo and Dr Carmela Cannava for
HPLC.
III

Thanks Dr Maria Teresa Sciortino and Dr Maria Giuffre for the biological tests. I
like remember Rita Calheiros Cruz (University of Coimbra) for nice talks on
biological experiments.
Thanks to Dr Domenico Garozzo's team (ICTP-CNR Catania) and Dr Alessandro
Giuffrida (University of Catania) for mass spectra, Dr Carmelo Corsaro and Dr
Spooren Jeroen for high resolution NMR spectra (700 MHz).
Thanks also to Prof Luigi Monsu Scolaro and his staff, especially Dr Giovanna De
Luca.
And finally, all graduates and postgraduate members of the MSA lab, Aversa's
team (Lab 49) and Monsu's team.
IV

Dedication
To my family
to Valeria
and Nanni.
v
"Science can purify religion from error and superstition. Religion can purify science
from idolatry and false absolutes ..
Karol Wojtyla

List of Abbreviations
AMP
br
.Bn
CD
CDEn
CDEn-FA
CDTs
CE
/)
D20
DDS
DHF
DMF
DMSO
DNA
En
ESI
EtOH
FA
FR
Aminopterine
Broad
1,4-Diaminobutane
Cyclodextrin
6-Deoxy-6-[ 1-(2-Amino )Ethylamino )-[3-Cyclodextrin
6-Deoxy-6-[I-(2-Amino )Ethylamino )-[3-Cyclodextrin and folic
acid conjugate
6-0-Monotosyl-6-Deoxy-[3-Cyclodextrin
Capillary Electrophoresis
Chemical Shift
Deuterium Oxide.
Drug Delivery System
Dihydrofolic acid
Dimethylformamide
Dimethylsulphoxide
Deoxyribonucleic Acid
1,2-Diaminoethane
Electron Spray Ionisation
Ethanol
Folic Acid
Folate Receptor
VII

g
Glu
HPLC
FT-IR
M
MALDI
MeOH
MP
mRNA
MS
MTHF
MTX
NMR
PDA
PEG
PEl
PDT
PTT
Rr
RT-PCR
S
T
t,
THF
Graft
Glutamic Acid
High Perfonnance Liquid Chromatography
Fourier Transform Infrared
Medium/multiplet
Matrix-Assisted Laser Desorption/Ionization
Methanol
Melting Point
Messenger Ribonucleic Acid
Mass Spectrometry
Methyltetrahydrofolate
Methotrexate
Nuclear Magnetic Resonance
Photodiode array
Polyethylene glycol
Polyethyleneimine
Photodynamic Therapy
Photothermic Therapy
Retention Factor
Reverse Transcriptase Polymerase Chain Reaction
Strong/singlet
Triplet
Retention time
Tertahydrofolate
VIII

TLC Thin layer chromatography
Ts Tosylate
TTP Tetraphenylporphyrin
UV Ultra violet
V Variable
VIS Visible
W Weak
IX
Table of Contents
ABSTRACT ........................................................................................................................................... 1
DECLARATION ........•.........•........•......................••..........................•...............••....•..•......................... II
. ACKNOWLEDGEMENTS ........................................................•..•••.•....•.•....•..................................• 111
DEDICATION .....•.........................•.......•...............••........................................••.............•....•......•....•.•.. v
LIST OF ABBREVIATIONS ..................•...•.......•••....•...•.......•.•................................................•..... VII
TABLE OF FIGURES ..............•.••..•..•.......•.•............•....•..•••..................................•.......•...........•.... Xlll
TABLE OF REAGENTS ........•..•..•........•.•.......•..••••....................................................................... XVII
INTRODUCTION ......................••....•.....•....•....•..•••.......................................••.....••.....•••..•••................. I
I. I. Discovery of Cyclodextrins ............................................ . . ............ 2
l. 2. Chemical Structure .. ...................................................................................................... 2
I. 3. Physico-Chemical Properties ....
f. 4. Inclusion Compounds ..
l. 5. Functionalised (:yclodextrins ................ ..
l. 6. Monosubstitution ofCyclodextrins
I. 7. Drug Delivery Systems ..................... .
. ....... 3
.... ................. 4
. ........................................ 5
...................................... ~ ................................ 7
. ...................................................... 8
. ......................... 9 1. 8. Cyclodextrins as Drng Carriers ..
I. 9. Folic Acid as a Targeting Agent .. . ................................................ .............................. 10
I. 10. Folic Acid Conjugates .. ................................................................... . ......................... . 12
/. II. Aims and Objectives of This Work . ............................................................................... 13
SYNTHESIS AND CHARACTERISATION OF CYCLODEXTRIN DERIVATIVES .........••... 15
2. J. Introduction .. ........................... 16
2. 2. Instrumentation ....... . . .. 20
x

2. 3. Synthesis ...................................... . . ........................................ 22
2.3. I. SYNTHESIS OF 6-0-MONOTOSYL-6-DEOXY-,8-CYCLODEXTRIN (CDTs) ..................... 22
DETAILED SPECTRA ARE REPORTED IN THE ApPENDIX SECTION.2. 3. 2. SYNTHESIS OF 6-DEOXY-6-
[1-(2-AMINO)-ETHYLAMINOH-CYCLODEXTRIN (CD EN) ........................................................... 23
2.3.2. SYNTHESIS OF 6-DEOXY-6-[1-(2-AMINO)-ETHYLAMINO]-Jl-CYCLODEXTRIN (CDEN) ..... 24
.. 2.3.3. SYNTHESIS OF CDEN-FA CONJUGATE ........................................................................... 25
2. 4. Discussion.. . ...... ...... .......... .... .. ........ 27
PHOTOSTABILITY STUDIES ........................................................................................................ 42
3. I. Photostability of Folic Acid ... .. ............ 43
3. 2. Chromatographic and Spectroscopic Study . .......................... . .. ......... 44
3. 3. Experimental ..... . ........... 45
3. 4. Results and Discussion on HPLC. ............. . ............. ... ................ .. .. 47
3. 5. Results and Discussion on Photodegradation Test .. . ................................................ 53
BIOLOGICAL EVALUATION ........................................................................................................ 57
.f. I. Introduction ..
4. 2. Experimental ....
4. 3. Results and Discussion
. ................. 58
. ............. 59
.............. 60
CONCLUSION AND FUTURE WORK .......................................................................................... 63
5. I. Final Overview of Results .. .. ............................ 64
5. 2. Future Work. .... .. ............ 64
APPENDIX ......................................................................................................................................... 67
A. 'H-NMR spectra .. . ................................................................................... ~
B. "C-NMR spectra .. ..72
C. COSY spectra .. .76
D. ROESY spectra ............................... .................... ............................ .. .............. 77
_E. TOCSY SPECTRA ................................................................................................................... 78
XI
F. FTIR spectra .... . . . ....•. 79
G. Mass Spectra ..... 84
H. Poster ... . ....................................... 87
BIBLIOGRAPHY ............................................................................................................ .................. 88
XII
Table of Figures
Figure 1. Most common cyclodextrin structures ......................................................... 2
Figure 2. Toroidal geometry ofCDsw ........................................................................ 3
Figure 3. Fonnation of the inclusion complex of cyclodextrin with a small guest
molecule ....................................................................................................................... 5
Figure 4. Methods for the selective modification ofcyclodextrins in a specific
hydroxyl group.19 ......................................................................................................... 6
Figure 5. Reaction Scheme for the 6-0-mono-6-deoxy-6-tosyl-~-cyclodextrin
synthesis. I I ....•••..••.•.....••.•••......••....•.•.••....•••.••••••..........•.•..••...•....••.••..•••........................ 7
Figure 6. Example of a drug-carrier conjugate or liposome reaching the target cell so
the d rug reaches the surface of its target cell. 22 .......................................................... 9
Figure 7. Mode of penetration enhancement by CDs in drug delivery to cell
mem brane. 25 •.•.......•••••••••••.••...........••.........................................•................................ 10
Figure 8. Overview offolic acid and its metabolic derivatives. 28 •....••...................... II
Figure 9. Competitive antagonists of folic acid where AMP is aminopterine and
MTX is methotrexate ................................................................................................. 12
Figu re 10. Synthesis of 6-0-Monotosyl-6-Deoxy-r.J-cyciodextrin (COTs) ................ 23
Figure II. Preparation of 6-Deoxy-6-[ 1-(2-Amino )-Ethylamino j-r.J-Cyclodextrin
(CDEn) ....................................................................................................................... 24
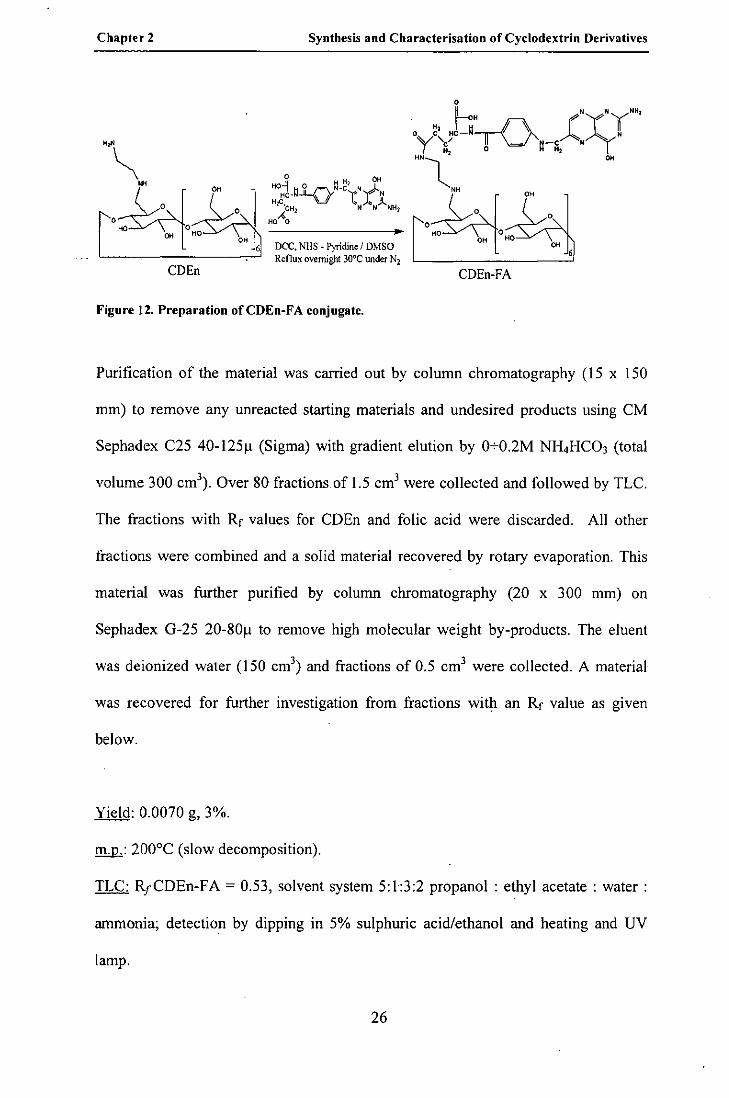
Figure 12. Preparation of CDEn-FA conjugate .......................................................... 26
Figure 14. Numbering of substituents on the CD derivatives: a) COTs; b) CDEn; c)
CDEnFA .................... : ................................................................................................ 28
XIII

Figure 15. Structure illustrating details of the hydroxyl groups (OH-2 and OH-3)
which participate in the formation of intramolecular bonds.9 .................................... 31
Figure 16, IH-NMR (700 Mhz) of CD En-FA in 0 20 ................................................ 33
Figure 17. ROESY spectra of CD En-FA in 020 ....................................................... 35
Figure 18. Absorption spectra oflO·5 M folic acid after 0, 20, 40 and 60 min ofUVA
exposure at pH 7. 81 •...........••••••.•••......•...•..••••••........•.•••••••..•••....••.........•..•••••..•........••• 43
Figure 19. Schematic diagram ofHPLC system ....................................................... .45
Figure 20. Schematic diagram of a Photodiode Array Detector ................................ 46
Figure 21. Chromatogram of the COEn-FA - mobile PBS: ACN 8:92 vlv; flow 0.5
mUmin ....................................................................................................................... 48
Figure 22. UV-VIS spectrum of first compound from HLPC showing maximum
absorbance at 275 nm ........................................................ : ........................................ 49
Figure 23. UV-VIS spectrum of second compound from HPLC with maximum
absorbance at 198 nm, 285 nm and 365 nm ............................................................... 50
Figure 24. UV-VIS spectrum of third compound from HPLC with maximum
absorbance at 197 nm, 285 nm and 365 nm ............................................................... 50
Figure 25. UV-VIS spectrum of fourth compound from HPLC with maximum
absorbance at 275 nm and 365 nm ............................................................................. 51
Figure 26. UV-VIS spectrum of fifth compound from HPLC with maximum
absorbance at 198 nm, 285 nm and 365 nm ............................................................... 51
Figure 27. UV-VIS spectra of Folic Acid, COEn and COEn-FA in PBS solution .... 52
Figure 28. UV -Vis spectra Photostability of FA (160 ~M in Phosphate Buffer
Solution, IO mM, pH= 7.40) over a 5 hour period. The arrows show isosbestic point.
.................................................................................................................................... 54
XIV
Figure 29. UV-Vis spectra of CDEn-FA (500 ~M in Phosphate Buffer Solution, 10
mM, pH= 7.40) over a 5 hour period. The arrows show weak isosbestic points ....... 55
Figure 30. Trypan blue molecule. liS ..••.••.•••.........•.••••......••..••••.....•..............•..••.••...••• 59
Figure 34. HeLa cells treated with FA 3: 10 (control) in according to the procedure
decrypted ......................................................................................... , .......................... 61
Figure 35. Detail of the folic acid aromatic unit coordination to Ni2+. 128 ................. 65
Figure 36. IH-NMR spectrum of ~-Cyclodextrin in DMSO ...................................... 68
Figure 37. lH-NMR spectrum of 6-0-Monotosyl-6-Deoxy-~-cyclodextrin (CDTs) in
DMSO ........................................................................................................................ 69
Figure 38. 1 H-NMR spectrum of 6-Deoxy-6-[I-(2-Amino )-Ethylamino l-~-
Cyclodextrin (CDEn) in D20 ..................................................................................... 70
Figure 39. IH-NMR spectrum of Folate Conjugate (CDEn-FA) in D20 ................... 71
Figure 40. 13C_NMR spectrum of~-Cyclodextrin in DMSO .......... , .......................... 72
Figure 41. 1lC-NMR spectrum of 6-o-Monotosyl-6-Deoxy-~-Cyclodextrin (CDTs)
in DMSO ..................................................................................................................... 73
Figure 42. 13C-NMR spectrum of 6-Deoxy-6-[1-(2-Amino)-Ethylaminol-~-
Cyclodextrin (CDEn) in D20 ..................................................................................... 74
Figure 43. 1lC-NMR spectrum of Folate Conjugate (CDEn-FA) in D20 .................. 75
Figure 44. COSY spectrum of Folate Conjugate (CDEn-FA) in D20 ....................... 76
Figure 45. ROESY spectrum of Folate Conjugate (CDEn-FA) in D20 .................... 77
Figure 46. TOCSY spectrum of Folate Conjugate (CDEn-FA) in D20 .................... 78
Figure 47. IR Spectrum of ~-Cyclodextrin in nujol. .................................................. 79
Figure 48. IR Spectrum of 6-0-Monotosyl-6-Deoxy-~-Cyclodextrin (CDTs) in nujol.
................................................................................................................................... 80
xv

Figure 49. IR Spectrum of 6-Deoxy-6-[I-(2-Amino)-EthylaminoJ-p-Cyclodextrin
(CDEn) in nujol. ......................................................................................................... 81
Figure 50. IR Spectrum of Folate Conjugate (CDEn-FA) in nujol... ......................... 82
Figure 51. IR Spectrum of Folic Acid (FA) in nujol... ............................................... 83
Figure 52. ESI Mass Spectrum of 6-Deoxy-6-[I-(2-Amino)-EthylaminoJ-p-
Cyclodextrin (CDEn) .................................................................................................. 84
Figure 53. ESI Mass Spectrum of Folate Conjugate (CDEn-FA) .............................. 85
Figure 54. MALDI Mass Spectrum of Folate Conjugate (CDEn-FA) ....................... 86
XVI

Table of Reagents
REAGENT PURITY SUPPLIER
Acetone extra pure (Sigma-Aldrich)
____ Ammonia 30% (Sigma-Aldrich)
Ammonium Hydrogen Carbonate 99% (Aldrich)
f)-CycJodextrin 99% (Xian Hong Chang)
Chloridric Acid concentrated (Fluka)
Deuterium Oxide 99 Atom D% (Cambridge Inc.)
1,2 - Diaminoethane 99% (Sigma-Aldrich)
N,N' - Dicyclohexylcarbodiimide 99% (Sigma-Aldrich)
N,N - Dimethylformamide 99.8% (A.C.S. reagent)
Dimethylsulphoxide anhydrous 99.9% (Lab-Scan)
Ethyl acetate 98% (Sigma)
Ethanol 99.9% (J.T. Baker)
Folic Acid dihydrate 97% (Sigma-Aldrich)
N-Hydroxysuccinimide 98% (Sigma-Aldrich)
Methanol 99% (Sigma-Aldrich)
Methylsulphoxide-D6 99.9 Atom D % (Sigma-Aldrich)
2-Propanol Chroma. Grade (Sigma-Aldrich)
Pyridine ACS (Sigma-Aldrich)
Sodium Hydroxide 98% (Sigma)
Sulphuric Acid ACS (Sigma)
XVII
p-Toluenesulphonyl chloride
Water
98%
HPLC 99.9%
XVlII
(Aldrich)
(Aldrich).

Chapter 1
Introduction

Chapter 1 Introduction
1. 1. Discovery of Cyclodextrins
Cyclodextrins (CDs) are a family of cyclic oligosaccharides obtained from
starch by enzymatic degradation. They were discovered in 1891 by Villiers,l and
isolated in 1903 by Schardinger2 In the 1930s, Freudenberg et al. postulated the
cycli~. ~tructure of CDs from a crystalline fraction of degraded starch. 3. 4, 5, 6 Later,
in 1953, these researchers registered the first patent involving CDs which was related
to their use in drug formulations 7
1. 2. Chemical Structure
Cyclodextrins consist of a(l,4)-linked D(+)glucopyranose units. The most
common cyclodextrins are fJ.-, [3- and y-CD having 6, 7 and 8 glucose units
respectively, as shown in figure I, The Greek letter denotes the number of glucose
units. &
o O~OH ~OH HO
HO HO~v"i o
HO~~ OH HO~H HO~OH HO 0
._ L~OH doH ~oJ:f- ,
OH HO
1 (0.c0)
frOH ~OH
HO OH H~~H H~O OH 0 o OH
HO H)j0 OH OH
HO ~o OH~O'b 0 ~o OH
HO 0 OH HO
2 (~·CD)
Figure I. Most common cyclodextrin structures.9
The topology can be represented as a toroid with the larger and the smaller
openings exposing secondary (OH-2 and OH-3) and primary (OH-6) hydroxyl groups
2

Chapter I Introduction
respectively. The interior of the toroid is lined by H-3, H-5 and H-6 hydrogens and
glycosidic oxygens. The cavity is chiral and is considerably less hydrophilic than an
aqueous environment and thus CDs are able to host hydrophobic molecules. The
exterior is sufficiently hydrophilic to impart to cyc\odextrins water solubility. The
toroidal geometry of cyc\odextrins is shown in figure 2.]0
Primary Hydroxyl Faev OH
Secondary Hydroxyl FacfI!
Figu re 2. Toroidal geometry of CDs,to
I. 3. Physico-Chemical Properties
The physical properties of cyc\odextrins are shown in Table 1.1. The increase in
diameter from a to y reflects· the increase in the number of glucopyranose units. It can
be seen that the solubility of the cyclodextrins varies in an irregular manner.]] The
relatively low solubility of j3-CD provided an early reason for its modification. Its
annulus is of a size particularly suitable for the inclusion of drug molecules and a more
soluble modified form would yield drug complexes with a wide range of applications.
3

Chapter I Introduction
Table 1. Physical Properties of a-CD, P-CD and y_CD."' II
Property a-CD P-CD y-CD
Num her of glucopyranose units 6 7 8
Molecular weight (anhydrous) 972.85 1134.99 1297.14
Solubility in H20 (g per 100 cm3) 14.5 1.85 23.2
Annular diameter measured from 4.7 6.0 7.5
C5 hydrogens, A
Partial molar volumes, cm3mor l 611.4 703.8 801.2
[a]D at 25°C + 150.5 +162.5 +177.4
pKa at 25°C 12.33 12.20 12.08
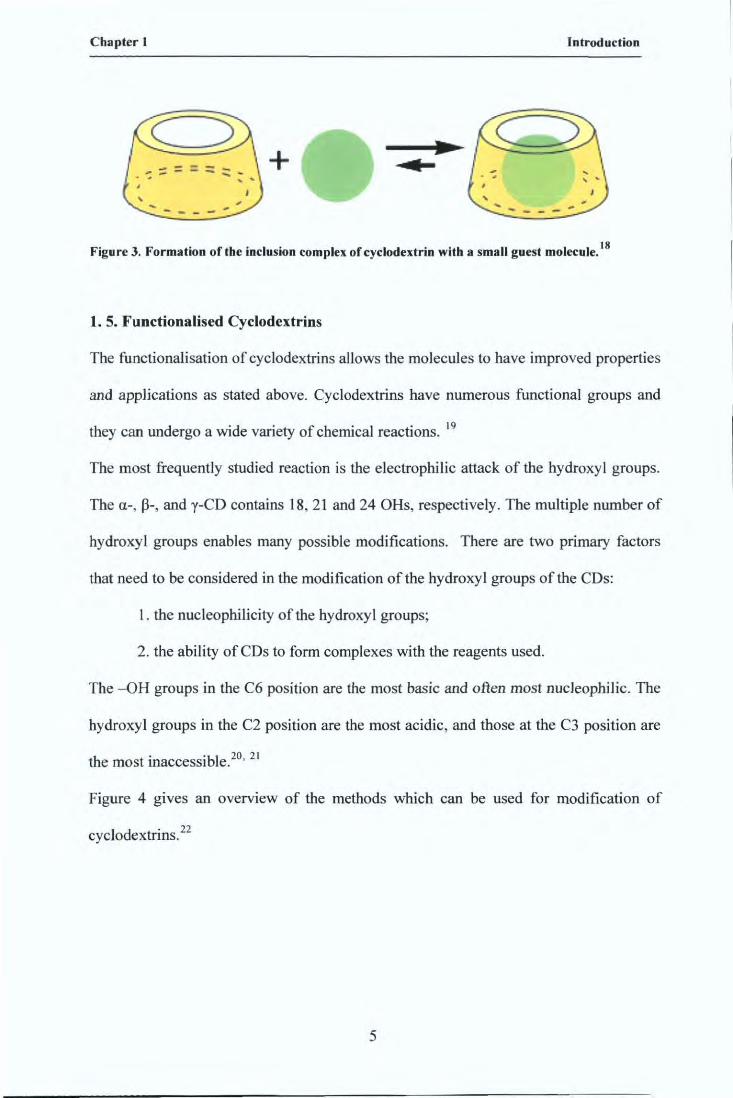
1..4. Inclusion Compounds
Due to the structural features of CDs, they are able to form host-guest
inclusion complexes with hydrophobic molecules possessing the appropriate size and
shape as shown in figure 3. Since the inner surface of the cyclodextrin is more
hydrophobic, hydrated cyclodextrins represent a high-energy state that can readily
include hydrophobic guest molecules in their cavities. Inclusion compounds can be
formed with a wide range of inorganic and organic molecules and have found many
industrial applications. One application is in drug delivery whereby using inclusion
complexes it is possible to control the release rate of drugs. 13 CDs have also been
used widely as stabilizing and solubilizing systems, enzyme models, catalysts,
stationary and mobile phase additives for chiral and isomeric separations, 14. 15. 16 in
environmental processes for water purification, and so on.17
4
Chapter I Introduction
+ "' - --' .... - - - -
Figu re 3. Formation of the inclusion complex of cyclodextrin with a small guest molecule. 18
I. 5. Functionalised Cyclodextrins
The functionalisation of cyclodextrins allows the molecules to have improved properties
and applications as stated above. Cyclodextrins have numerous functional groups and
they can undergo a wide variety of chemical reactions. 19
The most frequently studied reaction is the electrophilic attack of the hydroxyl groups.
The a-, 13-, and y-CD contains 18,21 and 24 OHs, respectively. The multiple number of
hydroxyl groups enables many possible modifications. There are two primary factors
that need to be considered in the modification of the hydroxyl groups of the CDs:
I. the nucleophilicity of the hydroxyl groups;
2. the ability of CDs to form complexes with the reagents used.
The -OH groups in the C6 position are the most basic and often most nucleophilic. The
hydroxyl groups in the C2 position are the most acidic, and those at the C3 position are
the most inaccessible. 2o, 21
Figure 4 gives an overview of the methods which can be used for modification of
I d . 22 cyc 0 extnns.
5

Chapter 1 Introduction
1·11<lfIllBI reac1iWy. _ base (e.g. P)'f.dine) 6-modjfied CD
II· roversed r~ SInlIlg base (~) ----------- 2-modified CD t:::====:==j/ /'" Iwt a n0lMlll11j>1e>fI1g _phil.
Y 1I1-.-!Ion Y1aCQ'nj)loi:f~ u~e • CQ'nj)lelring ~
~ IV -pr!JICCl2'j)O$lIiQn, lJlI' base
any eledrOllIlile
V· protect 6-positioo. _ bas.
-2-,3· or 6 modified CD or a mixture of the three
I 6·modified CD
3-modified CD or 2 modified CD
Figure 4. Methods for the selective modification of cyclodextrins in a specific hydroxyl group.22
The tenn mono-substituted derivative usually refers to one substituent per
cyclodextrin ring whereas the tenn di or tri-substituted CD refers to two or three
substituents per glucopyranose unit. CDs with a given substituent present on a
particular position of all the glucopyranose units are generally known as per-
substituted CDs.
There are two common ways III which the CD hydroxyls groups can be
functionalized:
1, monofunctionalization - functionalizing of only one hydroxyl group.
2. per-functionalization - functionalizing of an entire set of hydroxyl groups,
Although di- and tri-functionalizations exist, they have not been well investigated
and are difficult to perfonn, Monofunctionalization of the CDs have, however, been
well studied in the functionalization of these starch derivatives. 23. 24
Substitution can be occur by directly through alkylation, acylation and sulfonation.
Alternatively, sulfonates, halides and related species may be prepared as
6
Cbapter I Introduction
intermediates for the subsequent introduction of other substituents through
nucleophilic displacement. Oxidation of the hydroxyl groups of the CDs produces
aldehydes and ketones while reactions with acid chlorides. 25
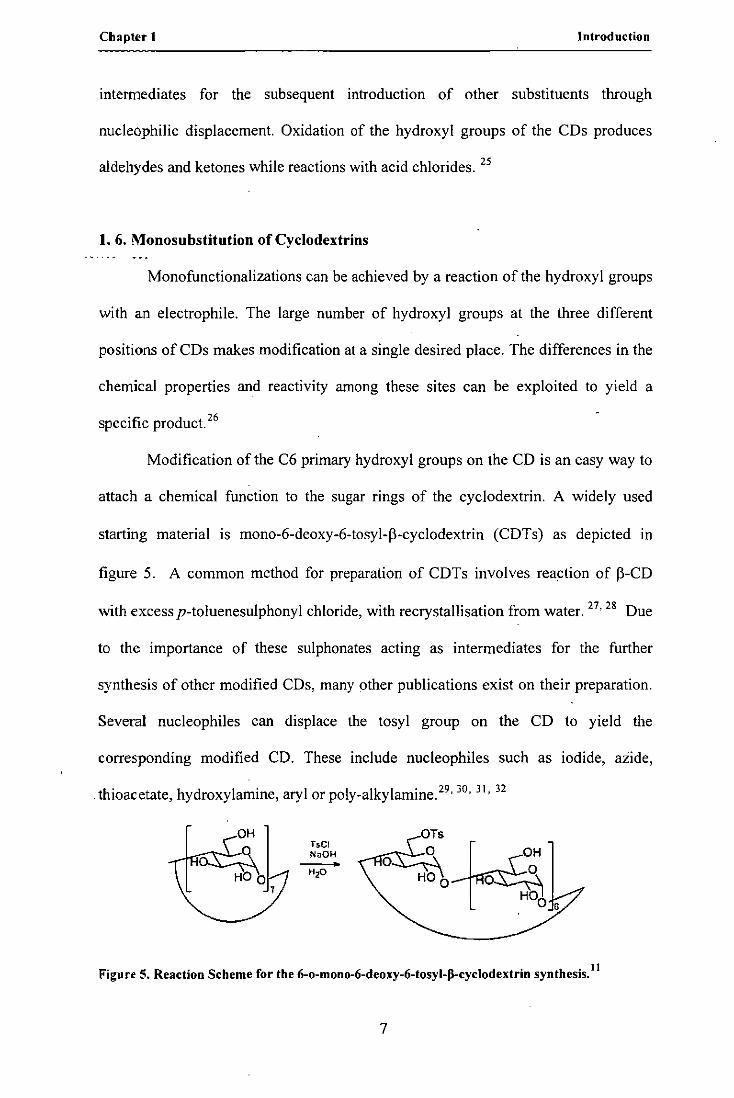
I. 6. Monosubstitution of CycIodextrins
Monofunctionalizations can be achieved by a reaction of the hydroxyl groups
with an electrophile. The large number of hydroxyl groups at the three different
positions of CDs makes modification at a single desired place. The differences in the
chemical properties and reactivity among these sites can be exploited to yield a
specific product26
Modification of the C6 primary hydroxyl groups on the CD is an easy way to
attach a chemical function to the sugar rings of the cyclodextrin. A widely used
starting material is mono-6-deoxy-6-tosyl-f3-cyclodextrin (CDTs) as depicted in
figure 5. A common method for preparation of CDTs involves reaction of f3-CD
with excess p-toluenesulphonyl chloride, with recrystallisation from water. 27,28 Due
to the importance of these sulphonates acting as intermediates for the further
synthesis of other modified CDs, many other publications exist on their preparation.
Several nucleophiles can displace the tosyl group on the CD to yield the
corresponding modified CD. These include nucleophiles such as iodide, aiide,
. thioacetate, hydroxylamine, aryl or poly-alkylamine. 29,30, 31, 32
hel NilOH --H,o
OTs
°4H
HO 0 o HOO G
Figu re 5. Reaction Scheme for the 6-o-mono-6-deoxy-6-tosyl-Jl-cyclodextrin synthesis, II
7
Cbapter 1 Introduction
[n this work CDTs is used to synthesise an amino CD which is then used to form a
conjugate with folic acid as a potential drug delivery system.
Although very few 2-monosybstituted CDs derivatives are known, mono-2-tosyl p-
CD has been synthesized using several strategies. m-nitrophenyl tosylate reacts with
CD in a DMF/aqueous buffer at pH lOin a low yield. This reaction proceeds via
complex formation to transfer the tosyl group to the 2-position. 33
Monosubstitution at the 3-position is complicated by the fact that the hydroxyl
groups at this position. are most inaccessible and thus less reactive compared to the
highly accessible ones (C-2 and C-6 hydroxyl groups). Most modifications of the C-3
OHs proceeds via the synthesis of manno-mono-2,3-epoxy CD. 34. 35
1. 7. Drug Delivery Systems
One of the most important goals of pharmaceutical sCience is localizing the
pharmacological activity of the drug at the site of action. Drug delivery involves
diagnostic and therapeutic application. Drug delivery systems (DDS) are molecular
tools which without undesired interactions at other sites target a specific drug receptor.
Any aberrant toxicity would be avoided and only the desired therapeutic gain would be
produced36 These molecular systems can also offer controlled drug release37
Advanced drug delivery systems include a targeting moiety and supplementary active
ingredients including the carrier and drug. 38 DDS are made from a variety of organic
and inorganic compounds such as polymers, lipids (liposomes, nanoemulsions, and
solid-lipid nanoparticles), self-assembling amphiphilic molecules, dendrimers and
inorganic nanocrystals39, 40, 41 Delivery of the drug-carrier system to the target site
8

Chapter 1 Introduction
does not however mean that an adequate amount of the free drug will be available at the
actual target due to the fact that there are many additional processes that need to take
place, These processes include drug release, endocytosis, transport of the drug across
the cell membrane, drug-receptor binding, lysosome uptake, nuclear targeting, drug
release and drug elimination as shown in Figure 6. 42, 43
Drug and liposome
o Drug release
o o
o Enclosomes
0°
°
Cell membrane
Release
~~ ~
Golgi ~ Lysosome
Elimination
Figure 6. Example of a drug....,arrier conjugate or liposome reaching the target cell so the drug
reaches the surface of its target cell. 29
1. 8. Cyclodextrins as Drug Carriers
Many drugs form inclusion complexes with cyclodextrins, and the properties
of these complexes are usually markedly different from that of the pure drug or pure
cyclodextrin,30 CDs improve the solubilization and stabilization of drugs and they
can be potent drug carriers for immediate and delayed delivery, CDs and their
9

Chapter 1 Introduction
derivatives, especially amphiphilic CDs, also increase drug permeability by direct
action on mucosal membranes and enhance drug absorption imci!or bioavailability.44 .
An equilibrium is established between the drug-CD inclusion complex and the free
drug which allows delivery of poorly soluble drugs. One of the mechanisms
proposed in literature is shown in figure 7 and shows that the drug can be absorbed
by the biological membrane directly from the inclusion complex or following
dissociation of the complex. 45
Figure 7. Mode of penetration enhancement by CDs in drug delivery to cell membrane."
1. 9. Folic Acid as a Targeting Agent
Folic acid (FA) has been developed as a cancer targeting agent and is
recognized by tumour cells due to their folate receptors (FR).46 High expression of
FRs has been frequently observed in many types of human cancers such as ovarian,
endometrial, colorectal, breast, lung, renal cell carcinomas, brain metastases derived
from epithelial cancers and neuroendocrine carcinomas. Quantitative studies by Real
Time Reverse Transcriptase Polymerase Chain Reaction (RT-PCR) confirm elevated
10

Chapter 1 Introduction
levels of FR in choriocarcinomas, meningiomas, uterine sarcomas, osteosarcomas,
non-Hodgkin's lymphomas and preomyelocytic leukemias. 36• 37
Folic acid is a water soluble vitamin and is a' fundamental molecule for basic
metabolism. It is needed for the production and maintenance of cells and is required
for the synthesis of DNA bases which are in turn needed for DNA replication. In vivo
folic acid (pteroy-L-glutamic acid, BlO vitamin) is reduced to 7,8-dihydrofolate
(DHF), which is subsequently reduced to 5,6,7,8-tetrahydrofolate (THF) by
dihydrofolate reductase. THF is converted to methy lene-THF which is then reduced
to 5-methyl-5,6,7,8-tetrahydrofolate (5-MTHF). 38 The structures of some of these
metabolites are given in figure 8.47 Folate deficiency which is seen as an absence of
methylene-THF results in the inhibition of the generation of red blood cells and
therefore anemia.
f\,,,~ ~ root]
5: ~::-U-C-NH-fH "NrCH1 «('lI,l, N .... 4 s-"':::. I
I; I : COOH ~I s"":::
H,N N N
FoUe add (FA)
5c1 H \~-~-Glu
h ~.~ N'" I *H-I H
HlN~N ~ II
11
5,~.7,8-Te'r.hydrofollc add (I'lIF) 5-MClhyI-5,6,7,8-telt'llhydrofollc aeld (5-MTHF)
Figure 8. Overview offolic acid and its metabolic derivatives. 38
On the other hand in cancer therapies inihibition of cell growth is favourable. Folate
antagonists such as aminopterine (AMP) and methotrexate (MTX) (figure 9) hamper
11

Chapter 1 Introduction
normal cellular replication and DNA synthesis. It seems that this results came from
the inhibition' of the enzyme dihydrofolate reductase. Indeed MTX has been in use
for more than 50 years to treat many cancers and autoimmune diseases. 47
Figure 9. Competitive antagonists of folic acid where AMP is aminopterine and MTX is
methotrexate.
Therefore folate, its metabolites or its antagonists may be suitable agents for anti-
cancer therapies. In this work folate conjugated to CD is proposed as an agent to
target tumour cells over expressing folate receptors.
1. 10. Folic Acid Conjugates
Folic acid receptors can be direct targets, involving antagonist drugs, or
indirect targeting tools for delivery involving competitive drugs. This explains the
several strategies used for folate conjugation. The conjugation of folic acid to
therapeutic agents including alkylating agents, taxols, platinum compounds, and
fluorouracil has been investigated. 40. 41. 48
Folic acid has also been conjugated to polyethyleneglycol (PEG) to successfully
deliver a wide variety of compounds including chemotherapeutic agents,
I· I'd h . . I d d d' 42 49 50 51 52 53 o Igonuc eo!! es, p otosensltlzers, po ymers an en nmers. . . . . .
A p-Cyclodextrin-polyethyleneglycol-folic acid conjugate (CD-PEG-FA) has been
produced from the reaction between CD-PEG-NH2 and FA. CD-PEG-NH2 was
12

Chaplet t Introduction
obtained through the intermediate CDTs and CD-PEG. 54 The conjugate with folic
acid was proposed as an active tumour targeting molecule. 55. 56. 57 Another conjugate
folate-PEG-folate-graft-polyethyleneimine (FPF-g-PEI) has also been reported and
is described in the literature as a potential gene carrier. 58 Recently synthetic
procedures for the production of nanoparticies of FA conjugates have been
reported.42
L 11. Aims and Objectives of This Work
The aim of this work is the developmerit of new vehicles as drug delivery
systems for cancer therapy applications.46 The synthetic strategy followed is based
on the production of a hew cyclodextrin-folate conjugate (CDEn-FA) which involves
reaction between an ethylenediamine modified CD and folic acid. Similar molecules
have been reported by Caliceti at a1. using a polymer spacer (PEG) between the p
cyclodextrin and the folate 54 However in the work presented here FA will be
directly bound to CDEn in an attempt to eliminate the polydispersity observed in
CDs modified with macromolecular species such as PEG. In this way we will design
a molecular system with a controlled number of binding sites (i.e. targeting moiety,
CD >:avity, metal coordination sites) and with properties of recognition towards
receptor proteins. CDEn-F A can then be exploited for the intracellular delivery of
organic and inorganic drugs or for the delivery of photo sensitizers or metal
nanoparticles for use in Photodynamic Therapy (PDT) of tumours.
The objectives of this work are thus to:
• Synthesise CD En-FA.
13

Chapter 1 Introduction
• Characterise all products and reagents using a range of techniques including
electronic, vibrational, NMR, MALDI-MS aud ESI-MS spectroscopies.
• Investigate the photostability of CD En-FA.
• Evaluate the biological properties of CDEn-F A.
14

Chapter 2
Synthesis and Characterisation of Cyclodextrin Derivatives

Chapter 2 Synthesis and Characterisation of Cyclodextrin Derivatives
2. 1. Introduction
As mentioned in Chapter 1 the syntheses of CD derivatives carried out in this
work are based on well known reactions of ~-CD. 59, 60
6-0-(p-Tosyl)-~-Cyclodexrin (CDTs) IS a common and extensively
inve~tigated precursor of many cyclodextrin derivatives made from the reaction
between p-Tosyl Chloride and ~-CD in aqueous NaOa. 11,61,62,63,60 The reaction is
carried out at 4 DC with stirring overnight with a preliminary filtration step to remove
the excess of umeacted chemicals64 Reverse phase chromatography can be used to
puri.(y the material. 65
6-(2-Aminoethyl)amino-6-deoxy-~-Cyclodextrin (CD En) can be obtained
from the CDTs on reaction with an excess of ethylendiamine. 66, 67, 68,69, 70, 71, 72, 7J
After reflux at 75 DC for 4 hours, the cooled product can be precipitated from acetone
and recrystallised from a water-methanol mixture. 74
There are no reports in the literature of methods for the preparation of a
derivative with folate directly connected to CD. Caliceti et al. reported a method for
the preparation of a FA-PEG-CD product. The procedure involved the synthesis of
CD-PEG-NH2 by reaction of monotosyI-~-cyclodextrin with excess of 700 Da
diamino-PEG. The second step involved the synthesis of CD-PEG-FA by reaction of
CD-PEG-NH2 with folic acid. However the polyethylene glycol linkage gave
polydispersity to the material. 54 A similar synthetic route was presented in the
preparation of the folate-poly(ethylene glycol)-poly(L-lysine) conjugate (FOL-PEG
PLL). It is a derivative for gene delivery applications, and its preparation involved a
peptide bond between the carboxyl function of the folic acid and the terminal amine
group. 50
16
Chapter 2 Synthesis and Characterisation ofCyclodextrin Derivatives
The most important technique used to investigate CDs and their derivatives is
Nuclear Magnetic Resonance (NMR) spectroscopy. Fluorescence, UV-vis
spectroscopy, calorimetry, etc. can playa role in measuring complexation energetics
with CDs, but usually provide only very indirect and qualititative information about
inclusion modes and geometries. NMR spectroscopy has become the most important
method for structural elucidation of CD, for controlling the intricate synthetic
modifications of the CDs by modem preparative methods. 9
The NMR experiment exploits the magnetic properties of nuclei to provide
information on molecular structure. Only atoms with spin nuclear quantum numbers
different than zero can show magnetic properties. Common magnetic nuclei are IH,
IlC, 15N, 19F, 29Si and lip. When a strong magnetic field of strength Bo is turned on
along a direction designated as the z axis, the energies of the nuclei are affected so
that there is a group of nuclei aligned in the +z (Bo) direction and another group
aligned in the opposite direction -z ie the energy levels split. The difference in
energy of this representation is LlE = y h Bo / 21t, where y is the gyromagnetic ratio
and h is Planck's constant. Therefore the frequency U = (y / 21t) B075 The signal of
resonance for each atom depends on the local environment. So, for example, a
hydrogen of the methyl group will give a different response than a hydrogen of the
hydroxyl group from the same molecule. The NMR scale is set up by reference to the
tetramethylsilane (TMS) peak at zero Hz. The chemical shift 0 (ppm) is the common
unit used in NMR spectroscopy and is the difference between the frequency of the
reference line divided by the reference frequency: 0 = 106 . (U-Uref)/Uref. 76
Light can be described in terms of photons or as an electromagnetic wave.
The Beer-Lambert law is used to describe the absorption of the light such that A =
17

Chapter 2 Synthesis and Characterisation of Cyclodextrin Derivatives
EcI, where A is the absorbance, c is the concentration of sample in units of molarity, I
is the pathlength in centimeters and E is the molar extinction coefficient (mOrl dm3
em-I). On the absorption oflight there is a change in the system from the ground state
to the excited state. This transition depends on the wavelength of light used and so
_~le.ctr9.nic transitions occur in the UV -VIS range, whereas vibrational transitions
occur in the infrared range.
The infrared region (IR or MIR) extends from 4000 cm- I (2.5 ~m) to 400 cm-I
(25 ~m). IR spectroscopy is a rapid, sensitive, easy to handle technique providing
many different sampling methods for gases, liquids and solids and it is possible to
obtain both qualitative and quantitative information. The standard format of an IR
spectrum is transmittance [%T] versus wavenumber [cm- I], where transmittance is
the ratio of the intensity of transmitted light to the intensity of the incident light.
With organic compounds, characteristic vibrations of the various functional groups
occur usually between 4000 and 1500 em-I. 77
Electronic transitions occur in the UV -VIS range and so adsorption of
radiation in this range excites an electron from the highest occupied molecular orbital
(HOMO) to the lowest unoccupied molecular orbital (LUMO). The visible region
corresponds to 400-800 nm whereas the ultraviolet region is beyond the visible in the
200-400 nm range. The spectra are often described as bands rather than peaks and the
wavelength at an absorption maximum is referred to as the lemax of the band. From
this information it is' possible to estimate the molar extinction coefficient of a
material according to the Beer-Lambert law. 78 In this work electronic spectroscopy
is used to study the stability offolic acid and its derivative.
18
Chapter 2 Synthesis and Characterisation ofCyclodextrin Derivatives
Mass spectral analyses involve the formation of gaseous ions from an analyte
and subsequent measurement of the mass-to-charge ratio (mlz) of these ions. The
mass spectrometer separates the ions generated upon ionization according to their
mass-ta-charge ratio (or a related property) to give a graph of ion abundance versus
____ ~~: _'?!'hen Electrospray Ionization Mass Spectroscopy (ESI-MS) is used, a strong
electric field is applied to the capillary carrying the analyte solution and the spray is
produced at atmospheric pressure. Spraying under these ,conditions produces highly
charged droplets whose charge is determined by the polarity of the field applied to
the capillary. Desolvation of the droplets is aided by a counter-current flow of warm
nitrogen gas. 79
Matrix-Assisted Laser Desorption/Ionisation-Time Of Flight Mass
Spectrometry (MALDI-TOF MS) is a technique in which a co-precipitate of an UV
light absorbing matrix and a molecule is irradiated by a nanosecond laser pulse. Most
of the laser energy is absorbed by the matrix, which prevents unwanted
fragmentation of the molecule. The ionized molecules are accelerated in an electric
field and enter the flight tube. During the flight in this tube, different molecules are
separated according to their mass-to-charge ratio and reach the detector at different
times. In this way each molecule yields a distinct signal. 80 The matrix consists of
crystalline materials such as 3,5-dimethoxy-4-hydroxycinnamic acid (sinapinic acid),
a-cyano-4-hydroxycinnamic acid (alpha-cyano or alpha-matrix) and 2,5-
dihydroxybenzoic acid (DHB). A solution of one of these is prepared often in a
mixture of water and an organic solvent such as acetonit~ile (ACN) or ethanol.
Trifluoroacetic acid (TFA) may also be added. 81
19
Synthesis and Characterisation ofCyclodextrin Derivatives
The method is used for detection and characterization of molecules with molecular
mass~s between 400 and 350,000 Da. It is a very sensitive method, which allows the
detection of low quantities of sample with an accuracy of 0.1 - 0.01 %. 82,8) ES! is
best suited for analysis of monodispersed molecules because of complications arising
__ Jro_m __ ~e formation of multiply charged ions. Alternatively, MALDI-TOF MS is
ide~lIy suited for characterizing polydispersed oligomers. 84
2. 2. Instrumentation
All reactions were monitored by thin layer chromatography (TLC) carried out
on precoated silica-gel 60F 254 plates (E. Merck, ref. # 5554). UV detection was
used employing a CN-6T VIlber Lourmiat UV lamp at 365 nm (6 W) and 254 nm (6
W).
Melting points were measured uSing the Stuart melting point SM P3
apparatus.
NMR spectra were recorded with an AM 300 Brucker spectrometer and a
Varian Mercury 300 Spectrometer. lH NMR spectra were recorded at 300 MHz and
I3C NMR spectra at 75.5 MHz. A Bruker Avance spectrometer was used for high
resolution spectra, operating at the 700 MHz lH resonance frequency and 175 MHz
I3C resonance frequency. Samples were dissolved in D20 or DMSO. The lH NMR
reference peaks were the water peak, which gave a signal at 4.76 ppm, and the
DMSO peak at 2.50 ppm. The 13C NMR reference was 1,4-Dioxane as an internal
standard, which gave a signal at 67.19 ppm. Solutions were typically from 1 to 12
mmo! dm-). All spectra were recorded at room temperature.
20
Chapter 2 Synthesis and Characterisation of Cyclodextrin Derivatives
Infrared spectra were recorded with the Perkin-Elmer Spectrum BX FT-IR
spectrometer. The Spectrum BX can operate in ratio, single-beam or interferogram
modes. The optical system gives data collection over a total range of 7800 to 100
em'!, with a maximum resolution of I cm· l Several mid infrared detectors are
available. DTGS (Deuterated Triglycine Sulphate) or LiTaO] (lithium tantalite)
detectors are standard and there is also the option of using MCT (Mercury Cadmium
Telluride) or PAS (photoacoustic) detectors. The electronics system is based on the
Motorola 68340 Integrated Processor. The instrument is connected to a PC and
controlled using the Spectrum. Spectra were recorded of solid samples as KBr discs
or Nujol mulls over the range of 4000-400 cm'! with background correction.
Electronic spectra were measured using a Hewlett Packard 8453 UV -VIS
spectrophotometer. The HP 8453 spectrophotometer is a single beam,
microprocessor-controlled UV -Visible spectrophotometer with collimating optics.
The detector is a diode-array (1024 photodiodes), with a spectral range from 190 to
1100 nm, a resolution of 2 nm and a slit width of 1 um. The light source for the UV
region is a deuterium lamp with a shine-through aperture. The lamp emits over the
190 nm to approximately 800 nm wavelength range. The light source for the visible
and short wave near-infrared (SWNIR) wavelength range is a low-noise tungsten
lamp. This lamp emits light over the 370 nm to 1100 nm wavelength range. There is
a temperature control unit also available with peltier technology. The instrument is
connected to a PC with HP UV-Visible software. Quartz cells of 1 cm and 4 mm
were employed for the measurements. All spectra were recorded at room temperature
with solutions of 10.4 mol dm·].
21

Chapter2 Synthesis and Characterisation of Cyclodextrin Derivatives
Electrospray ionisation mass spectrometry (ESI-MS) was used for the
characterisation and purity determination of the samples. The instrument used was a
Thermo LXQ linear trap, with potential full scan at nuzzle of 4.5 kV, flow 5 ilL/min
and sheath gas nitrogen at 20 a.u. (arbitrary unit). The system can be used to
_. determine molecular masses in the range 50 - 100000 Da, with an accuracy of 20
ppm. The samples were introduced into the mass spectrometer in solution and
ionised at atmospheric pressure. Solutions of 10-4 mol dm-] were used.
MALDI-TOF analyses were performed on a Rerseptive (Framingham, MA)
Voyager STR instrument equipped with delayed extraction technology. Ions were
formed by a pulsed UV laser beam (nitrogen laser, 337 nm) and accelerated through
24 kV. Samples were diluted in CHCiJ and mixed I: 1 v/v with the matrix solution
obtained by dissolving 2,5-dihydroxybenzoic acid (DHB) in CH]OH/O.I %
trifluoJoacetic acidlCH]CN (1: I: 1 by volume) at a concentration of 30 mg/mL.
Exactly 1 ilL of this mixture was deposited onto a stainless steel 100 sample MALDI
plate and allowed to dry at room teinperature before running the spectra in the
positive polarity.
2. 3_ Synthesis
2.3. I. Synthesis of 6-o-Monotosyl-6-Deoxy-~-Cyc1odextrin (CDTs)
~-cyclodextrin (10.01 g, 7.61 mmol) was dissolved in NaOH (100 cm], 0.4
M) at 0°_ 4°C to which was added p-toluenesulphonyl chloride (3.00 g, 15.79
mmol). The mixture was vigorously stirred for 4 - 5 hours at constant temperature.
The mixture was filtered to remove the excess p-toluenesulphonyl chloride and the
pH was reduced to.6.5 by addition of 1M HC!. A precipitate formed in the solution
22

Ch.ptu 2 Synthesis and Characterisation ofCyclodextrin Derivatives
which was then left at 4°C for 24 hours. The product was recovered by filtration,
washed with acetone and recrystallised from water. The material was dried under
vacuum at 60°C for at least 4 hours. 11.61,62.63.60,64
OH OTS
+ o
H3C-o-~ ~-CI - II
o • + Hel
O.4MNaOH
~-CD TsCl CDTs
Figure 10. Synthesis of 6-o-Monotosyl-6-Deoxy-~-cyclodextrin (COTs).
Yield: 1.86 g, 18% (literature value 17%).64
m.p.: 179°C with slow decomposition (literature value 179°C with slow decomp.).64
TLC: R/ COTs = 0.7, solvent system 7:5:5:4 ethylacetate:ethanol:water:ammonium
sulphate; detection by dipping in 5% sulphuric acid/ethanol and heating. Analysis of
the product showed no parent CD present at an R/ofO.l-0.5.
Rr COTs = 0.49, solvent system 7:5:5:1 ethylacetate:ethanol:water:ammonia 30%;
detection by dipping in 5% sulphuric acid/ethanol and heating. Analysis of the
product showed no parent CD present at an R/of 0.38.
IH-NMR (OM SO) t5 (ppm): 7.74 (d), 7.42 (d), 5.77 (br), 5.71 (br), 4.83 (m,), 4.49
(br), 3.63 (br), 3.56 (br), 3.49 (br), 3.45 (br), 3.30 (br), 2.42 (s).
BC NMR CDMSO) t5 (PpmU44.86, 132.68, 129.93, 127.62, 101.96, 81.52, 73.09,
72.75,72.45,68.02,60.04,21.27.
FT-IR (Nujol) u (cm·I): 2943 (s), 2902 (s), 2848 (s), 2727 (w), 2360 (w), 1653 (m),
1463 (s), 1377 (s), 1158 (m), 1028 (m), 837 (w), 721 (w), 668 (m), 579 (w), 442 (s).
Detail cd spectra are reported in the Appendix Section.
23

Chaptor 2 Synthesis and Characterisation of Cyclodextrin Derivatives
2.3.2. Synthesis of 6-Deoxy-6-[1-(2-Amino)-EthyJamino)-[3-Cyclodextrin
(CDEn)
COTs (9.64 g, 6.73 mmol) was dissolved in 1,2-diaminoethane (50 cm3, 0.75
mol) and refluxed with vigorous stirring under nitrogen for 24 hours at 70°C. The
.... mixture. was then concentrated under vacuum and gave a light yellow viscous oil.
The oil was dissolved in a minimum volume of water-methanol 3: I (100 cm\ The
solution was added to acetone at ·15°C obtained by mixing with liquid nitrogen. A
white precipitate formed. The product was recovered by filtration and purified over a
porous ceramic plate overnight. It was recrystallised from water and dried at 60°C
for 4 hours. 66.67.68.69,70,71,72,73,74
OTS
•
I3-CD eDEn'
~NH2 NH
+ TsOH
Figure 11. Preparation of6·Deoxy·6·[I·(2·Amino)·Ethylaminol·~·Cyciodextrin (CDEn).
Yield: 6.25 g, 68% (literature value 65%). 73
!!lj2,: 230°C with slow decomposition (value is not present in literature).
TLC: RI CDEn = 0.65; solvent system 5:3:4:1 methanol : chloroform: water:
ammonia; detection by dipping in 5% sulphuric acid/ethanol and heating. Analysis
of the product showed no parent COTs present at an R,rofO.92 or En at an R/ofO.53.
24
Chapter 2 Synthesis and Characterisation of Cyclodextrin Derivatives
Rr CDEn =0.19 solvent system 7:7:5:4 ethyl acetate : 2-propanol : concentrated
ammonium hydroxide: water; detection by dipping in 5% sulphuric acid/ethanol and
heating.
'H NMR (D,O) 0 (ppm): 4.93 (br), 3.76 (br), 3.71 (br), 3.50 (br), 3.47 (br), 3.41 (br),
2.(j5 .(~.r), 2.54 (br), 2.06 (br).
BC NMR (D,O) 0 (ppm): 105.10, 104.08,86.62,84.40,75.59,74.55,74.27,73.85,
68.34,62.76,52.30,48.02,42.03.
, FTIR (Nujol) u (em"): 3735 (w), 2918 (s), 2852 (s), 2360 (w), 1653 (m), 1559 (w),
1456 (8),1377 (s), 1156 (m), 1032 (m), 501 (w).
UV-VlS, A~ (run): 210.
ESI Mass Spectra: mlz = 1177.6 (M+H+t.
Detailed spectra are reported in the Appendix Section.
2.3.3. Synthesis of CD En-FA Conjugate
CD En (0.2000 g, 0.15 mmol) was dissolved in a minimum volume of
pyridine (15 cm\ Folic acid (0.033Q g, 0.07 mmol) and N-hydroxysuccinimide
(0.0350 g, 0.31 mmo!) were dissolved in DMSO (10 cml) and added to the CDEn
solution. Dicyclohexylcarbodiimide (0.0630 g, 0.31 mmol) was added. The solution
was stirred in the dark overnight under nitrogen at 20°C. The solution was then
warmed to 45°C for two hours and was added to acetone (50 cml) at -20°C. The
·precipitate which formed was left to stand overnight. About 0.1 g of crude product
(maximum yield 0.24 g) was recovered by filtration and washed with acetone,
acetonitrile and diethylether.
25
Coapter 2 Synthesis and Characterisation of Cyclodextrin Derivatives
H~\
o~o~ [0"0 OH ;;,,~ 6 DCC, NHS - !')Tid;ne I DMSO
L __ ------,-.::l Reflux overnight 30°C under N2
•
CDEn CDEn-FA
Figure 12, Preparation of CD En-FA conjugate,
Purification of the material was carried out by column chromatography (15 x ISO
mm) to remove any unreacted starting materials and undesired products using CM
Sephadex C25 40-125J.l (Sigma) with gradient elution by 0+0,2M NH4HCO) (total
volume 300 cm\ Over SO fractions of 1.5 em) were collected and followed by TLC,
The fractions with Rr values for CDEn and folic acid were discarded. All other
fractions were combined and a solid material recovered by rotary evaporation, This
material was further purified by column chromatography (20 x 300 mm) on
Sephadex 0-25 20-S0J.l to remove high molecular weight by-products, The eluent
was deionized water (150 cm)) and fractions of 0,5 cm) were collected. A material
was recovered for further investigation from fractions with an Rr value as given
below.
Yield: 0.0070 g, 3%.
m.p,: 200°C (slow decomposition).
TLC: RfCDEn-FA = 0,53, solvent system 5:1:3:2 propanol: ethyl acetate: water:
ammonia; detection by dipping in 5% sulphuric acid/ethanol and heating and UV
lamp.
26

Chapter 2 Synthesis and Characterisation ofCyclodextrin Derivatives
RfCDEn-FA = 0.58 solvent system 5:3:1 propanol: water: ammonia; detection by
dipping in 5% sulphuric acid/ethanol and heating and UV lamp .
. IH NMR (D,O) 15 (ppm): 8.65 (s), 7.70 (d), 6.67 (d), 4.97 (br), 4.54 (m), 3.94 (s),
3.77 (br), 3.70 (br), 3. 60 (br), 3.53 (br), 3.45 (br), 2.6~ (br), 2.23 (br), 2.08 (br), 1.87
(br). "
DC NMR (0,02 15 (ppm): 181.46, 178.07, 167.94, 163.04, 150.92, 146.96, 144.98,
129.13, 115.26, 112.70, 101.98, 83.33, 81.00, 75.87, 73.31, 71.79, 68.30, 60.02,
55.71,49.19,45.81,35.67, 33.80,28.11.
FTIR (Nujol) u (cm'\ 3851 (w), 3735 (w), 3687 (w), 3583 (m), 2920 (s), 2853 (s),
2726 (m), 2360 (w), 1652 (m), 1462 (s), 1377 (s), 1155 (m), 1031 (m), 721 (s),470
(s).
UV-VIS, Amax (nm): 194,281,354,
ESI Mass spectra: mlz = 1600.7.
MALDI zlm: 1602.6 (M+2Htt.
Detailed spectra are reported in the Appendix Section.
2. 4. Discussion
In this section NMR shifts are assigned following the numbering system
reported in Figure 13 and Figure 14.
27

Chapter 2 Synthesis and Characterisation of Cyclodextrin Derivatives
R
~!)
<.0 Q
(~)
".., 0 0
HO OH HO (\) OH
'v HO
(0
HO
HO 4
Figure 13. Numbering of CD derivative.
°u' . II -; - .@ VVV'O-S ~ ;, CH
II ~ u@ 3
o (~". ~ ~ ~
a)
b)
Figure 14. Numbering ofsubstituents on the CD derivatives: a) COTs; b) CDEn; c) CDEnFA.
28

Chapter Z Synthesis and Characterisation of Cyclodextrin Derivatives
A data summary of 'H-NMR measurements is reported on the following Table 2 and an
overview of the "C-NMR analysis is reported on
Ta ble 3 and 4.
29

Chapler 2 Synthesis and Cbaraeterisation of Cyelodextrin Derivatives
Table 2.18 NMR , petlrostopie data for II-CD and all CD Derivatives.
Sample Hl(~) Hl H3 H4 HS H6 082 0H3 OH6 H7 H8 H9 810 811 HIl 813 HI4 HIS 816 HI9 H2O Hl2 Hl3 HlS Hl7 Hl8
!lCD' 4.82 3.28 3.57 3.3 1 3.53 3.62 5.73 5.68 4.46
COTs' 4.83 3.30 3.56 3.45 3.49 3.63 5.77 5.71 4.49 7.74 7.42 2.42
COEn 4.93 3.47 3.71 3.4 1 3.50 3.76 2.06 2.65 2.54
COEn-FA 4.97 3.53 3.70 3.45 3.60 3.77 2.08 2.65 2.23 1.87 3.94 7.70 6.67 4.54 8.65
• Samples were dissolved in DMSO-c4 solvent. Others sample were dissolved in D,O solvent.
30
Chapter 2 Synthesis and Characterisation of Cyclodextrin Derivatives
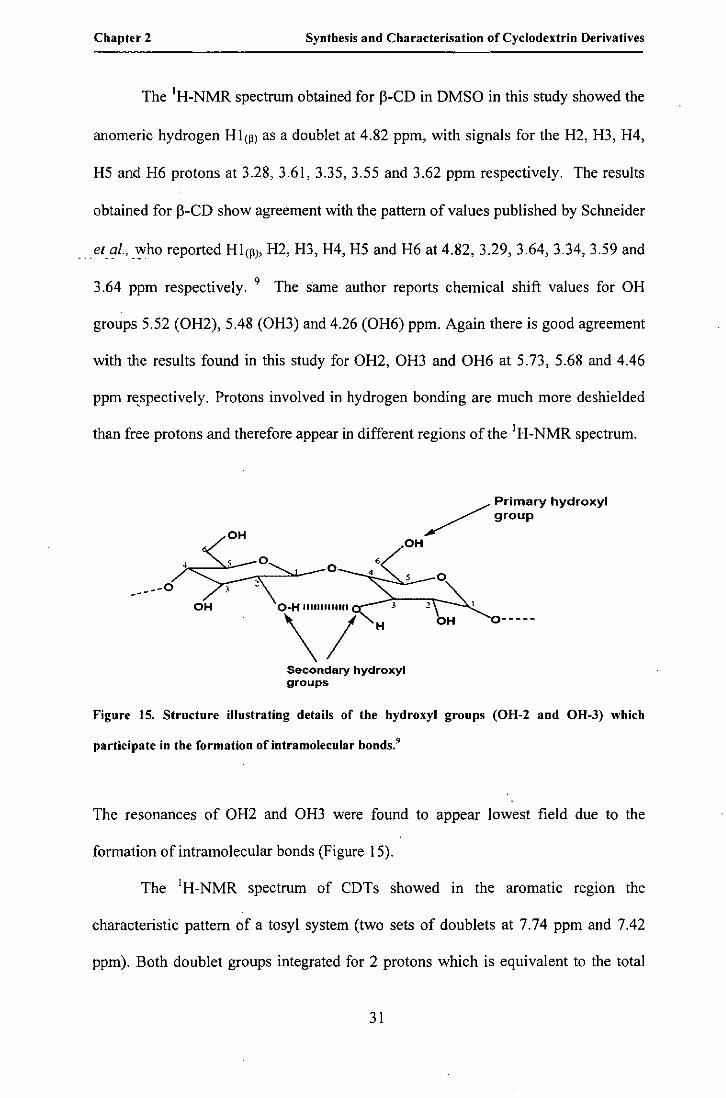
The IH-NMR spectrum obtained for P-CD in DMSO in this study showed the
anomeric hydrogen H I(~) as a doublet at 4.82 ppm, with signals for the H2, H3, H4,
H5 and H6 protons at 3.28, 3.61, 3.35, 3.55 and 3.62 ppm respectively. The results
obtained for P-CD show agreement with the pattern of values published by Schneider
el aI., who reported HI(~), H2, H3, H4, H5 and H6 at 4.82,3.29,3.64,3.34,3.59 and -- - - - -- .
3.64 ppm respectively. 9 The same author reports chemical shift values for OH
groups 5.52 (OH2), 5.48 (OH3) and 4.26 (OH6) ppm. Again there is good agreement
with the results found in this study for OH2, OH3 and OH6 at 5.73, 5.68 and 4.46
ppm re,spectively. Protons involved in hydrogen bonding are much more de shielded
than free protons and therefore appear in different regions of the IH-NMR spectrum.
OH
6
Secondary hydroxyl groups
/ Primary hydroxyl ~ group
0-----
Figure 15. Structure illustrating details of the hydroxyl groups (OH-2 and OH-3) which
participate in the formation of intramolecular bonds"
The resonances of OH2 and OH3 were found to appear lowest field due to the
formation of intramolecular bonds (Figure IS).
The IH-NMR spectrum of CDTs showed III the aromatic regIOn the
characteristic pattern of a tosyl system (two sets of doublets at 7.74 ppm and 7.42
ppm). Both doublet groups integrated for 2 protons which is equivalent to the total
31
Chapter 2 Synthesis and Characterisation of Cyclodextrin Derivatives
number of protons (four) available in the aromatic ring of the tosyl group. The same
values are reported in the literature. 64 A singlet found at 2.42 ppm was ascribed to
the three methyl protons of the tosyl group. The 6-hydroxyl substitution was also
confirmed by the decrease in the integration of the peaks at 4.49-4.52 ppm from 7.74
.... to. 7.4;2. .. These results also compare favourably with the literature.65 The IH-NMR
spectrum of CD En does not show any tosyl group signals which suggests successful
amination· of CDTs through nucleophilic substitution by the diaminoethane group.
The anomeric proton has a chemical shift of 4.93 ppm and signals at 2.65 and 2.54
ppm show the presence of methylene hydrongens (H8, H9) from the diaminoethane
group. The signal for HI has been reported at 4.90 or 5.l0 ppm and the signal for H8
has been reported in the range 2.70-2.90 ppm. 68,74,85 The results found in this work
show good agreement with the literature.
The conjugate CDEn-F A gives a spectrum as shown in Figure 16.
32

Chapt .. Z Synthesis and Characterisation of Cyclodextrin Derivatives
H-3, H-6,
H-8
H·25a H-19a H-20a H-l
H-23· ~ H-2Sy j, H-l9y LH-2Oy H-14 i ,/ 'V ,
~ , y IV Y I Y Y ~,yy Y V yy Y ~ N N ~ ~ t " • ~ '0' • e" e ill :... i:I "- 8 ~ ~~~ ~ ~~~ ~ . - ~ 8
LiiiU'''j,',liliJU,Uij,ih'iililiiUj,Llb'ilI"ii'jiiiilUiliilliUllImiiiUlj,mmUtUllpu,nIULli'rJilliiilimll'IiUUlllilltllliiIliIUUlijilmillllli"jimti,lIllil'i'IllU"'t,II'lililiiillillllj,UllUllilll'jU"mlillii'jlUllli
8.50 8.00 7.50 7.00 6.50 6.00 5.50' 5.00 4.50 4.00 3.50 3.00 2.50 2.00 1.50 1.00 0.50 ppm (tl)
Figure 16. 'H-NMR (700 Mhz) of CD En-FA in 0,0.
There are no reports in the literature of the synthesis of CD En-FA and therefore-there
are no spectroscopic data available. Bonechi et al. 86 published.a paper on an NMR
investigation of folic acid and reported chemical shift values for the aromatic protons
H25, H19, H20 at 8.75, 7.75 and 6.74 ppm respectively. 87, 88 The 'H-NMR
spectrum of CDEn-FA reported here does show signals in the region 8.7-6.5 ppm
which can be assigned to these aromatic protons. However there are three signals for
each aromatic proton. This suggested that the folic acid moiety is present in three
different configurations and that FA is probably bonded to CDEn through both
carboxylic functions generating y and a conjugates and there may also be some
impurity offree FA.
33

Chapter 2 Synthesis and Characterisation of Cyclodextrin Derivatives
This is further supported by looking at the signal for the anomeric hydrogen HI at
-5 ppm which integrates for 14 protons and suggests the presence of two CD
molecules. Integration of the peaks in the region 4 - 3 ppm assigned to the protons
H5, H3, H4, H2 and H6 of CD also suggest two CD units .
.. F.urthe.r .. evidence for the presence of u and y conjugates was found using ROESY
spectroscopy and Figure 17 shows the spectra obtained. It was possible to assign
respectively H19u, Hl9y and H20u, H20y by correlation of the signals belonging to
the same carboxylic acid groups of both conjugates. It was also possible to show that
. the phenyl group of the folate moiety can interact with the CD cavity by correlation
of the peaks assigned to Hl9 and H20 of FA (6.59 and 7.51 ppm respectively) and
the peaks assigned to the hydrogens of the CD cavity. However deep inclusion of "
the FA group within the cavity can be excluded since no cross-peak between the
proton of pterine ring (H25 at 8.65 ppm) and the CD cavity was detected. It may be
possible that formation of a supramolecular adduct between CDEn-F A and unbound
FA (free) has formed.
34

Chapter 2
••• •
5 .•
••• ••• .,. 7 .•
1.'
a.o·
Synthesis and Characterisation of Cyclodextrin Derivatives
Hi9UJr H19y , H20u
jU.H20V
,
'®:,'®" " ' I ,. , '
o ·0 o
••
Hi9'u,H20u', " i?l " . .. ,', . .;, • , • ,. '@~~!'Hi9Vi82bN':4 . . ,. ' _ .... -.
\
H20y H20u
H19y
H19a'
Figure 17. ROESY spectra of CD En· FA in D,O.
35

Chapter 2
Table 3. JJC NMR spectroscopic data for Jl-CD and all CD derivatives (C I-C6).
Sample CI C2 C3 C4 CS C6
CD' 102.20 72.64 72.02 81.70 73.23 60.36
COTs'
CDEn
CDEn-FA
10 1.96 72.78 72.45 81.52 73.Q9 60.04
105. 10 74.55 73.85
10 1.98 73.3 1 71.79
84.40
81.00
75.59
75.87
62.76
60.02
C I'
104.08
10 1.98
C2' C3' C4' CS' C6'
68.02
74.27 86.62 68.34 48.02
83.33 68.30 45.8 1
• Samples were dissolved in DMSO-do solvent. Others sample were dissolved in D,O solvent.
36
Synthesis and Characterisation of Cyclodeltrin Derivatives

Cbapter2 Synthesis and Characterisation ofCyciodextrin Derivatives
Table 4. BC NMR spectroscopic data for II-CD and all CD derivatives (C7-C29).
Sample C7 C8 C9 CIO Cll Cl2 C13 Cl4 CIS Cl6 Cl7 Cl8 C19 C20 C21 cn C23 C24 C2S C26 C27 C28 C29
CDTs' 132.68 127.62 129.93 144.86 21.27
CDEn 52.30 42.03
CDEn-FA 49.19 35.67 178.D7 33.81 28.11 55.71 181.46 163.04 115.26 129.13 112.70 150.92 45.81 146.96 144.98 167.94
, Samples were dissolved in OMSO-d, solvent. Others sample were dissolved in 0 ,0 solvent.
37
Chapter 2 Synthesis and Characterisation ofCyclodextrin Derivatives
The spectrum of ~-cyclodextrin shows a signal for the highly deshielded anomeric
CI at 102.20 ppm and a signal for the highly shielded C6 atom at 60.36 ppm. Signals
for the atoms C2 and C3 as well as C5 are located in the region 72 ppm to 73 ppm.
The signal assigned to C4 is clearly separated from other signals and is found at
81. 70 ppm. Schneider et a19, reported the chemical shifts of C I and C6 at 102.58
ppm and 61.17 ppm respectively which agrees reasonably well with results reported
here. For the atoms C2, C3, C4 and C5, Schneider et al. 9 recorded values of 72.67,
73.89, 81.94, 72.89 ppm respectively. From this study chemical shifts at 72.75,
72.45,81.52 and 73.09, can be similarly assigned.
The spectrum of CDTs shows a signal for the CI atom at 101.96 ppm. Chemical
shifts for C6 and C6' can be observed at 60.04 and 68.02 ppm respectively. For the
atoms C2, C3, C4 and C5, literature 9 data are 7l.l, 73.1, 82.4 and 74.1 ppm
respectively. For the atoms C2 and C3, Petter et al,64 reportedsignals·in the range
from 73.3 to 71.4 ppm. In this study signals for the atoms C2, C3, C4 and C5 are
74.55, 73.85, 84.40 and 75.59 ppm respectively are observed and they fit the
literature data trend. Signals for the aromatic carbon atoms of the tosyl group can be
seen in the range 127 to 145 ppm. The peak for the methyl substituent CII is at
21.24 ppm. Schneider et al9 found peaks at 101.08 ppm assigned to CI, 81.00 ppm
assigned to C4, 72.30 ppm assigned to C5 and 68.60 ppm assigned to C6' all of
which are in agreement with the experimental data recorded here.
The spectrum of CDEn shows chemical shifts values for the Cl atom at 105.10 and
at 104.08 ppm for the Cl' atom. The resonance of the substituted carbon atom (C6')
which appears at 68.02 ppm in the spectrum of CDTs was greatly shifted to 48.02
ppm. The C6' carbon atom bonded to the tosyl group in CDTs is much more
38
Chapter 2 Synthesis and Characterisation ofCyc/odextrin Derivatives
de shielded than when this atom is bonded to the amine group in the CDEn. This fact
constituted evidence that the successful replacement of the tosyl group by the amine
group occurred. The carbon atoms C2, C3, C4 and C5 gave in the spectrum of CD En
signals in similar position to those observed in the spectrum of CDTs. Additional
.. signal~.were detected at 52.30 ppm and 42.03 ppm, which were assigned to C8 and
C9 of the diaminoethane group respectively. These results are in good agreement
with those reported by Potter et al. 89 and Fernandez et al. 85•
The J3C-NMR spectrum of CDEn-FA has not been reported previously and
assignments are based on data reported for folic acid. 86 It is evident that there is a
change of chemical shift for the CI atom from 105 ppm in CDEn to 102 ppm in
CD En-FA. For the atoms C2, C3, C4, C5 and C6 the observed values are similar to
those of CDEn.
Assignment of peaks in the region 120 - 180 ppm was not possible due to weak
signals and therefore. a poor signal to noise ratio. Peaks at 49.19 and 35.67 ppm can
be assigned to C8 and C9 respectively. The decrease in frequency can be explained
in terms of a new charge distribution caused by formation of a peptide bond. The
CH2- groups C12, CI3 and C23 are detected at 33.80, 28.11 and 45.81 ppm
respectively. Chemical shifts are detected at 30.4, 26.1 and 45.9 ppm respectively.
The aromatic carbons C18, C19, C20 and C21 gave signals at ]]'5.26, 129.13, 112.70
and 150.92 can be assigned to atoms of folic acid. For folic acid, Bonechi et al. 86
reported signals at 121.3, 129.0, 111.2 and 150.8 ppm, which are in good agreement
with results obtained for CDEn'-FA.Atoms of the petirinic group C25, C26, C27 and
C28 gave signals at 146.96, 144.98, 150.92 and 167.94 ppm respectively. Folic acid
86 gives chemical shift values for these atoms at 148.6, 153.8, 156.2 and 161.3 ppm.
39

ClJapter2 Sy.nthesis and Characterisation of Cyclodextrin Derivatives
Table 5 shows the IR frequencies obtained for ~-CO and all derivatives with
assignments90
Table 5. FTIR Absorption Frequencies (em") ~-CD and its Derivatives,
2895 2902 " "
2727 2727 2726 -OH stretch
2847 2848 2852 2853 -CH2- symmetric stretch
1653 1653 1653 1653 OH- bending
1559 N-H bending vibrations
1463 1463 1456 1462 -CH2- scissor mode
1377 1377 1377 1377 -CH2- symmetric bend
1156 1158 1156 1155 Secondary and tertiary alcohol modes
1028 1028 1032 1031 C-O stretching (cyclic alcohols)
837 Para-Oisubstituted Benzene mode
721 721 721 Rocking
The spectrum of COTs shows a peak at 837 cm" which can be assigned to
vibrations of the paradisubstituted benzene ring of the tosyl group.
The spectrum of CDEn shows a signal at 1559 cm" assigned to the N-H bending
vibration.
40

Chapter 2 Synthesis and Characterisation of Cyc\odextrin Derivatives
These results suggest successful synthesis of CDTs and CDEn.
The spectrum of CDEn-FA does not show peaks assigned to previous intermediates.
Electronic spectroscopy was used for spectroscopic comparison of CDEn and
CDEn-FA. The spectrum of CDEn shows Amax at 210 run. The spectrum of the
cOJ}jug~te shows new bands at 194,281 and 354 run. Off et at' reported absorption
peaks for the folic acid at 280 and 350 run which agrees reasonably well with the
bands recorded here and suggests the presence of a folic acid moiety in the
conjugate.
The mass spectrum (ESI-MS) of CDEn gave confirmation of the molecular
weight from the peak' [M+H+t at 1177.6 mlz. The spectrum shows an additional
base peak at 1219.6 mlz [M+H+t possibly caused by !be presence of a diamine ~
derivative such as CDEn2.
MALDI and ESI-MS spectra of !be conjugate CDEn-FA are given in appendix O.
These spectra confirm the formation of !be conjugated product with signals assigned
to CDEnFA+H+ and CDEnFA+2H+ observed at mlz 1600.7 and 1602.6 respectively.
41

Chapter 3
Photostability Studies
Chapter 3 Photostability Studies
3. 1. Photostability of Folic Acid
Previous studies on folic acid have shown that on heating for 10 hours at pH
4-12 the stability decreased with decreasing pH. 92 Photodegradation of folic acid
(FA) by ultraviolet radiation is a well-documented photochemical reaction. FA is a
photosensitive compound that undergoes photolysis by UV. The photodegradation of
. F A is divided into three phases leading to the formation of specific photoproducts
such as p-aminobenzoyl-L-glutamic acid, 6-formylpterin and pterin-6-carboxylic
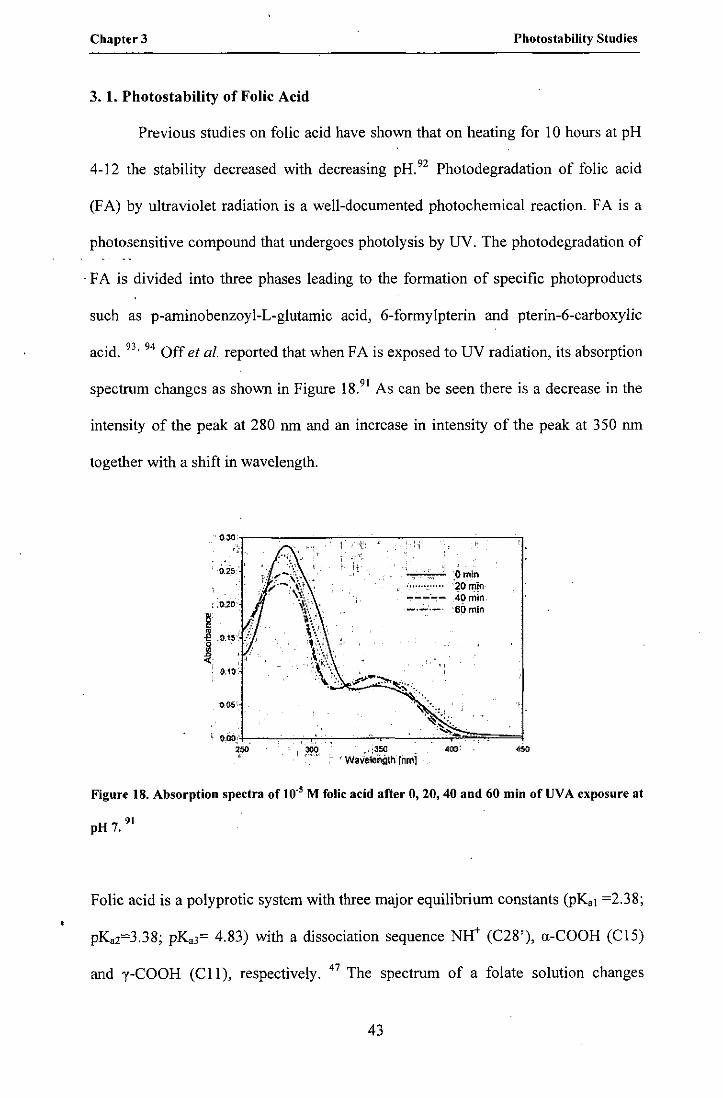
acid. 93. 94 Off et al. reported that when FA is exposed to UV radiation, its absorption
spectrum changes as shown in Figure 18.91 As can be seen there is a decrease in the
intensity of the peak at 280 nm and an increase in intensity of the peak at 350 nm
together with a shift in wavelength.
" O.3D',---,--~-,--..---,.---..---c-c-----,-----,
, 0.25
i :0.20
~ ./! .• .15"
B <;
(ut)' ,
Omin '"20 min
---.~- ~o min, 8Dmin
.' '3_~ , _ , W'_ll!lth [nm] ,
'" .
'00'
Figure 18. Absorption spectra of 10" M folic acid after 0, 20, 40 and 60 min of UV A exposure at
pH 7. 91
Folic acid is a polyprotic system with three major equilibrium constants (PK,I =2.38;
pK,2=3.38; pKa3= 4,83) with a dissociation sequence NW (C28'), a-COOH (CIS)
and y-COOH (CII), respectively. 47 The spectrum of a folate solution changes
43
Chapt .. 3 Photostability Studies
significantly with irradiation time in the presence of O2 at different pH values. In
acid media spectra are almost indistinguishable while in alkaline media spectra are
very different. When the irradiated solutions of folate (pH 10 .;. 11) are stored in the
dark, further changes can also be observed. 95
3. 2. Chromatographic and Spectroscopic Study
The CDEn-FA conjugate was evaluated by High-performance liquid \
chromatography (or high pressure. liquid chromatography) (HPLC) and UV-VIS
analyses to gain an understanding ofthe stability and the purity of the product.
HPLC is a column chromatography used frequently in biochemistry and /
analytical chemistry to separate, identify, and quantifY compounds. 96 The mixture to
be separated is transferred to a column with a solvent or a solvent mixture
(eluent/mobile phase). The column is a tube, in most cases of stainless steel, filled
with the stationary phase. The separation occurs on the' column. Under optimal
conditions the components to be separated pass through the stationary phase at
different rates and leave the column after different times. The components (the
solutes) are registered by a detector. This information is passed on to the data
evaluation unit and the output is a chromatogram. The number of peaks is equal to
the number of separated components in the sample, and the area is proportional to the
amount. HPLC equipment consists at least of an eluent delivery system (pump), an
injector, a column, a detector and a data evaluation system. 97
44
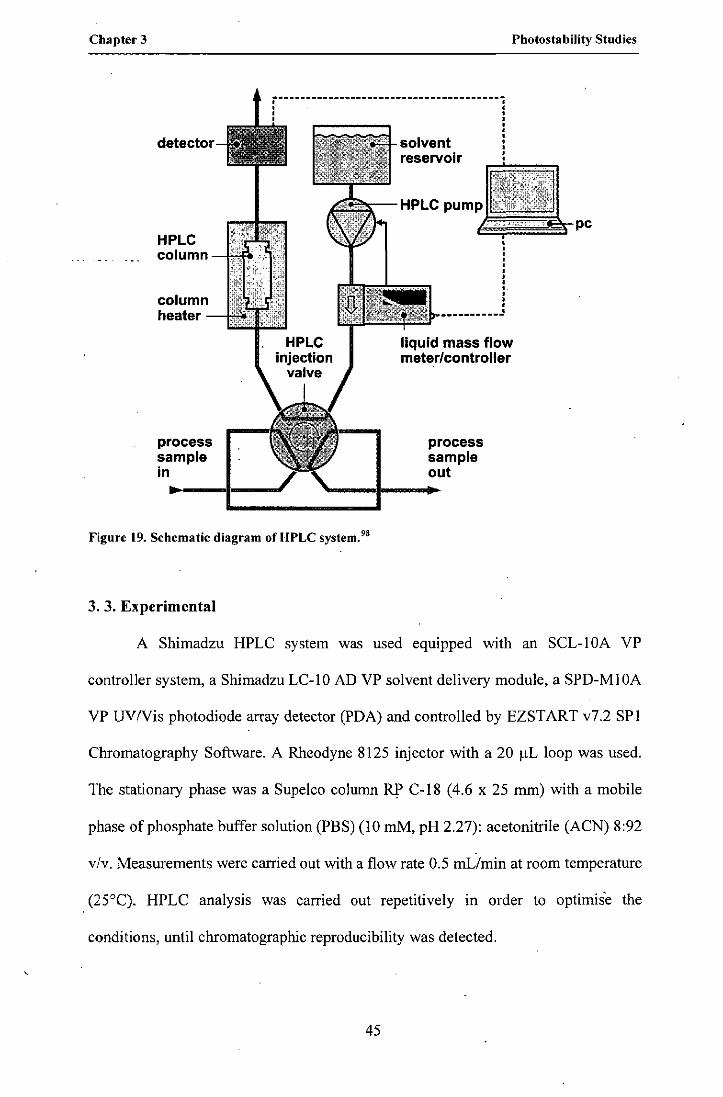
Chapter 3
HPLC col um n --\,;rl:RI
column heater
process sample in
Figure 19. Schematic diagram of HPLC system."
3. 3. Experimental
Photostability Studies
reservoir
liquid mass flow meter/controller
process sample out
A Shimadzu HPLC system was used equipped with an SCL-IOA VP
controller system, a Shimadzu LC-IO AD VP solvent delivery module, a SPD-MIOA
VP UVNis photodiode array detector (PDA) and controlled by EZSTART v7.2 SPI
Chromatography Software. A Rheodyne 8125 injector with a 20 ilL loop was used.
The stationary phase was a Supe1co column RP C-J8 (4.6 x 25 rnm) with a mobile
phase of phosphate buffer solution (PBS) (10 mM, pH 2.27): acetonitrile (ACN) 8:92
v/v. Measurements were carried out with a flow rate 0.5 mLiminat room temperature
(2S0C). HPLC analysis was carried out repetitively in order to optimis'e the
conditions, until chromatographic reproducibility was detected.
45
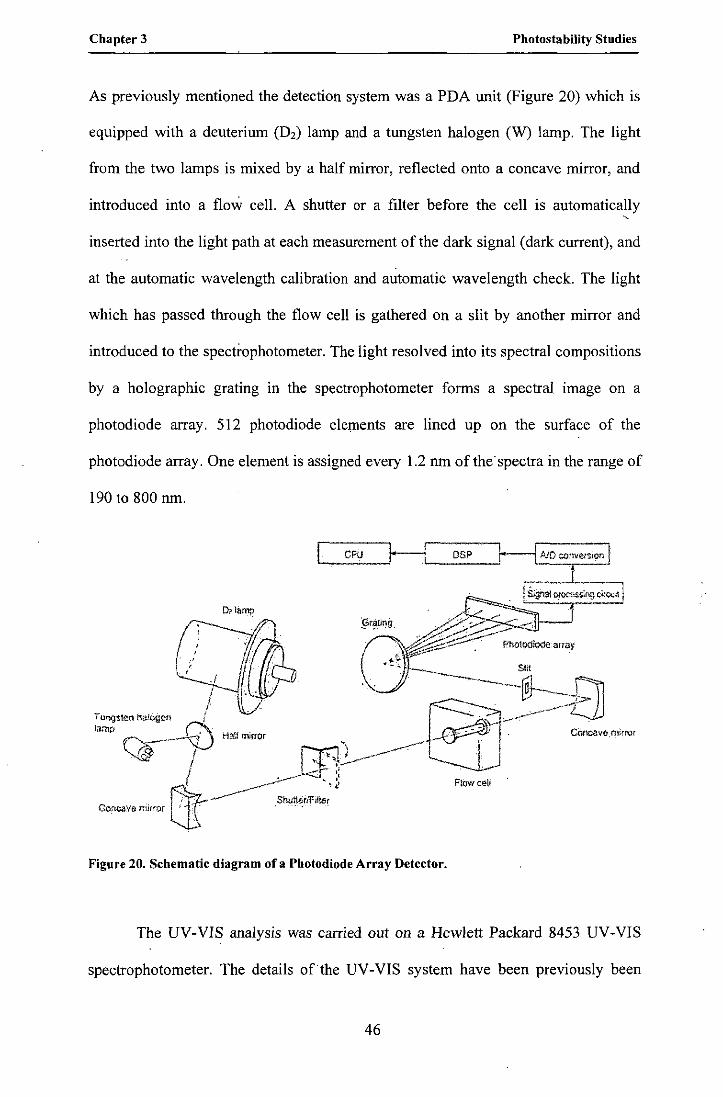
Chapter 3 Photostability Studies
As previously mentioned the detection system was a PDA unit (Figure 20) which is
equipped with a deuterium (D2) lamp and a tungsten halogen (W) lamp. The light
from the two lamps is mixed by a half mirror, reflected onto a concave mirror, and
introduced into a flow cell. A shutter or a filter before the cell is automatically ,
inserted into the light path at each measurement of the dark signal (dark current), and
at the automatic wavelength calibration and automatic wavelength check. The light
which has passed through the flow cell is gathered on a slit by another mirror and
introduced to the spectrophotometer. The light resolved into its spectral compositions
by a holographic grating in the spectrophotometer forms a spectral image on a
photodiode array. 512 photodiode elements are lined up on the surface of the
photodiode array. One element is assigned every 1.2 nm of the' spectra in the range of
190 to 800 nm.
I CPU HL.1 _D_SP_-,
Flowceh
Figure 20. Schematic diagram of a Pbotodiode Array Detector.
The UV-VIS analysis was carried out on a Hewlett Packard 8453 UV-VIS
spectrophotometer. The details of the UV-VIS system have been previously been
46

Chapter 3 Photostability Studies
described in Chapter' 2. CDEn-F A was studied to evaluate its stability after
irradiation by a UV NIS light source at physiological pH. Samples of folic acid (500
flM in PBS 10 mM, pH=7.00) and the conjugate (160 fiM in Millipore purified
water) were irradiated with a halogen lamp (15 W) at room temperature for 5 hours
with stirring. The irradiating beam was filtered through a I cm glass cell filled with
water to remove the IR and UV component. During the investigation UV -VIS spectra
were recorded to monitor any change of electronic spectra due to irradiation.
3. 4. Results and Discussion on HPLC.
A HPLC study of folic acid as reference was not carried out since the elution
conditions which must be used for successful resolution of the CDEn-FA conjugate
cannot be applied to solutions of folic acid. In the literature, many researchers
studied folic acid by ion-pairing HPLC in very polar solvent systems. 99, 100,101, 102.
103. 104, 105, 106, 107, 108 Folates have also been investigated by HPLC using a prevalent
ratio of organic solvent systems or a gradient elution method at different pH values. .';.
109, liD, 111,112,113 The results obtained in this study for CDEn-FA are shown in
Figure 21.
47

Chapter3
10,
1'01.,2$$ !"1M
-, n"irradIato eon pH 2.27 • PoeN nnifiadlato eon pH 2;27,. ACN.dat
1:
J
0+-----"----......;
o 2 4 1'utnut'@I'£
Photostability Studies
20
10
0
6 8 10
Figure 21. Chromatogram of the CDEn-FA - mobile PBS: ACN 8:92 v/v; flow 0.5 mL/min.
The chromatogram shows two main peaks at 2.78 (peak 1) and 3.22 (peak 2) minutes
and a minor peak at·3.80 (peak 3) minutes. Two overlapping peaks were detected at.·,;
4.38 (peak 4) and 4.96 (peak 5) minutes. These results are summarised in Table 6 t,
below.
Table 6. HPLC results for CDEn-Fa at two different flow rates with an injection volume of 10
ilL and detection at 285 nm ..
Flow Peak 1 Pea~2 Peak 3 Peak 4 Peak 5 Sample
[mLimin] tR [min) tR (min] tR (min] tR [min] tR [min]
CDEn-FA 0,700 2,74 3,21 3,81 4,40 5,00
CDEn-FA 0,300 4,40 5,00 5,52 5,87 6,83
The HPLC study of CDEn-FA gave satisfactory reproducibility in terms of
retention time. The first peak was well resolved with a tR at 2.7 minutes. A second
well resolved peak was located at 3.2 minutes. Peak number 3 is very low in terms of
intensity (tR= 3.8 minutes). Peak number 4 (tR=4.3 minutes) is easily detected and
there is also a broad peak (number 5) with tR= 5.0 minutes. However the presence of
48

Cbaptet3 Photostability Studies
five peaks in the chromatogram suggests that the material is impure or it may have
degraded.
In an attempt to identiJY each component obtained on separation of CDEn
UV -Vis spectra were obtained of each product exiting the HPLC column and results
are given in Figure 22 to Figure 26. Spectra were also obtained of FA, CDEn and
CDEn-FA and are shown in Figure 27 below and results are summarised in Table 7.
30 ~ .. ~ ~ ~ ~2" 7-.J:ti,n~-~ ~~~ ~ .... :~ ~ .......... ~ ._~.:.::. ~_~ .. __ .. _ .,_* ~' .. ,.M
·1 ~ ~- ,Or ir~adjato con p~ ?.21'e ACN : : · ,. . . . , ·1 , •
• , '"t. •
20 '~ -~'w-"-r'~ '+---------+---------+---.------j------- ! • I I
• •. I 1 , . ; \ ,
10 ~ - -~-j--.. ------- .. --:-- --------~- ------ -- -~- -----• I, j .' . , , . · . , . , j " j • • , I . I • •
I , • •
0- ~ .. ~ .. -~ ... ': .. w;....-"w "
, " , ,
.. 10 t .... ~ .... ~ ."~":"~M"~_"~ "'_). __ .... ~,. ~~w_: .. ___ .. _ ~_ .. ~1_.~ .... _ 200 300 460 500 600
nm
, _ ... ; .. #._-- ... -.. 20 ,
, , , o
---,--------- ',10
700 SOO
Figure 22. UV-VIS spectrum of first compound from HLPC showing maximum absorbance at
275 nm.
49

Chapter 3 Photostability Studies
:t .,A;n .. ~ ..... -", ~ - _:~ ...... ~ .. ~ '-" '" ..: .... - ~ - ..... ~ .... ~ .. irf,.dialo eon pH 2.27. ACU ,
, , ~;".~M~~~~~~~:_~ __ ~_"K~~~ _________ ~;. M __ M_~~_{. __ ~ ___ ~~ __ 20
10
o
. . .. to !.-~- .. --- •• _f __ ~ ___ .. ___ .. ' _____ .. ___ ~_' __ • _______ j_ ---~ ____ ! __________ .10
300 400 61)0 700
nm
Figure 23. UV-VIS spectrum of second compound from HPLC with maximum absorbance at
198 nm, 285 nm and 365 nm.
30 ~ ----MS. a;.(Ain----- .. -~-:_---------~---~------~-------- __ ;---- .. ----- 3D • -- nr ir~adialO con pfl2.Z7. ACU :
, f f • I !
10 ~ -~-"""'''''''r ':""''' ~.,.", .... ..{---",,,,,,,- """"~--~-" ~ "' ...... ~- -_ .......... ., .. t .. ~ _ .. ", ... - "' .. b10
o':~~~l ' . : o
. J 1 • , ,
·10 ,
200
_t __ .. __ "_.,.,, .. I .. _ .. __ ........... ,1 ..... ____ ~_ ..... ~ ............ ,.":'" .. !--- ~_ .... ___ .10
300 400 ~OO 61)0 700 800
nm
Figure 24. UV-VIS spectrum of third compound from HPLC with maximum absorbance at 197
nm, 285 nm and 365 nm.
50
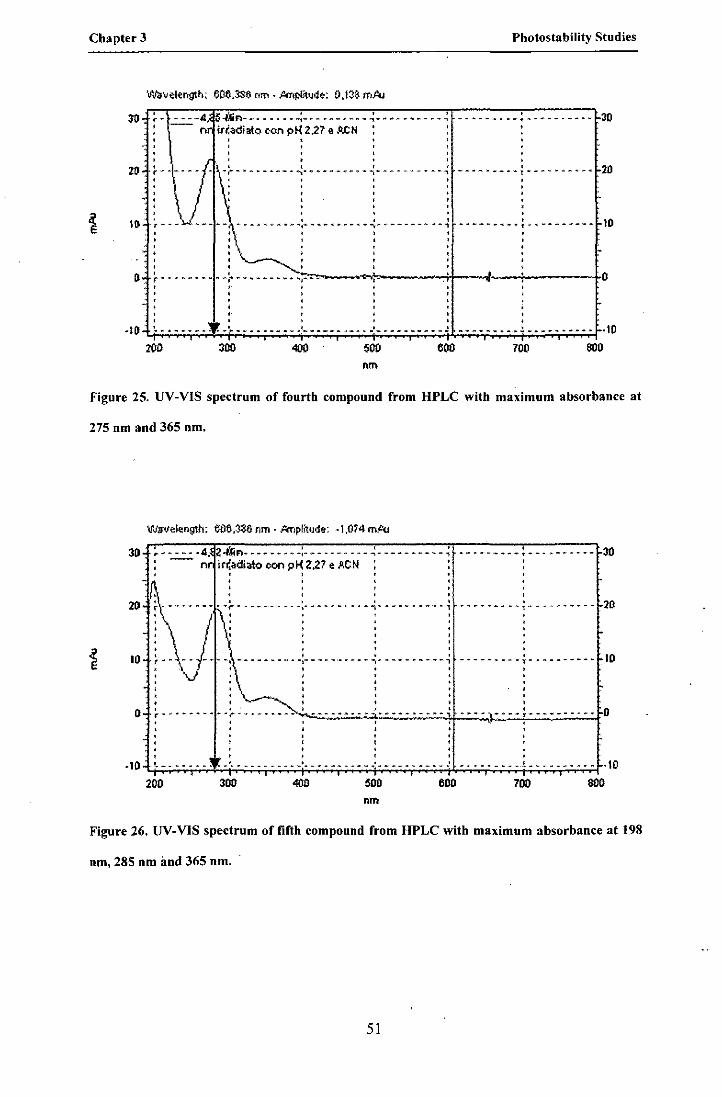
Chapter 3 Photostability Studies
~~ --~-4. $-iciFJ--------~: ... ----~----~- .... -- .. ----~ • -- nr i,i..cia!o con pH 2.27. ACN • . . ,
: ~--/ : : ; :
l0. .. \!".L..1...] t I , • • I I • • •
• • , I • , I , I I
---------:----------b10 .
20
, . . o ~-~-~~-·~-~r~·~~~,,~~~:,~,'~-~-------~~----------~1r----~----;------------1cO · ,
-10 !. .. ,. ~ ........ , .... ' .... ~ ...... B .... ~ _,_ ~ w _ .... ~ _ ~ _ .. ' _ ........ ,. ~ ~ .... .l ---------,---------- -10 200 500 700 SOO
nm
Figure 25, UV-VIS spectrum of fourth compound from HPLC with maximum absorbance at
275 om and 365 om.
WlIve1enlllh: 665,3$6 run - Pmplitude; -1.074 mJ.'<.o
30 ~ .. -....:..:..: .. 4. 2-itiFl---- .. ~-~-:------~---...:----------~ i'~adiato con pH 2.27 e ACN
. ---------~--.-------
, ,
10 10 , , , ,
--.------.~---------,-----.----, ---------,----------
• , . --- -,,~.- .. ~ .... --- .... --"; o · . r" ~ ----- .... -l-~~ ------. , .
-10 !.------- ---------!---------- ·10
200 300 500 600 700 SOO nm
Figure 26. UV-VIS spectrum of fifth compound from HPLC with maximum absorbance at 198
om. 285 om aod 365 nm.
51

Chapter 3 Photostability Stodies
3.5
3.0
2.5 --CDEn 500 uM (PBS)
--:- -------- FA 500 uM (PBS)
'" 2.0 ai -- -- -- -- - CDEn-FA (PBS) --(J) al 1.5 <{
1.0
0.5 '. -
250 300 350 400 450 500 550 600 650 700
nm Figure 27. UV-VIS spectra of Folic Acid, CDEn and CDEn-FA in PBS solntion.
The electronic spectrum of CDEn-F A shows bands centered at 262 and 365
run respectively and it should be very similar to the spectrum of FA because the
CDEn can not shows a UV -Vis spectra for the absence of chromophor groups.
The bands can be assigned to the electronic transitions in the pteridine moiety and
the phenyl ring respectively. 114
Table 7. Peak assignment oftbe CDEn-Fa cbromatogram.
CDEn FA Peak 1 Peak 2 Peak 3 Peak 4 PeakS
A,.., (nm! 210 196 olfscale 198 197 olfscale 198 A,.., (nm! 220 215 220 A,.., [nm! 281 275 285 285 275 285 A,.., [nm( 352 365 365 365 365
52

Chapter 3 Photostability Studies
From the results obtained it is very difficult to reach any conclusive
assignments. Both CDEn and FA absorb in the 200 to 220 nm region and therefore it
is not possible to determine which peak in the chromatogram corresponds to CDEn
or FA or the conjugate CDEn-F A. Also, in this region could be happen some solvent
absorption effects like peak I and 4, where there are off scale absorption phenomena.
However peak 5 can be tentatively assigned to the conjugate. The spectrum shows
clearly absorption features of both CDEn and FA. In particular the absorption at 198
nm consistent with the presence of FA should be noted. Of all five spectra recorded
only those associated with peaks 3 and 5 in the chromatogram show this absorption
but the intensity is too weak for the spectrum of peak 3.
Peak I in the chromatogram can possibly be assigned to some metabolite of
FA since there is no absorption in the region above 300 nm which would be expected
for FA itself. This peak can also not be assigned to CDEn since the cyclodextrin
derivative does not absorb in this region.
It is difficult to determine the origin of peaks 2, 3 and 4 in the chromatogram , ..
since all three show absorption features of both FA and CDEn. Further analysis is
required eg via LC-MS experiments to determine the structure of the compounds
giving rise to these peaks in the chromatogram.
3. 5. Results and Discussion on Photodegradation Test.
Photodegradation tests were carried out on samples by recording UV -VIS spectra
every hour. Figure 28 and Figure 29 show the spectra obtained over the UV -VIS
range of 200 - 700 nm.
53
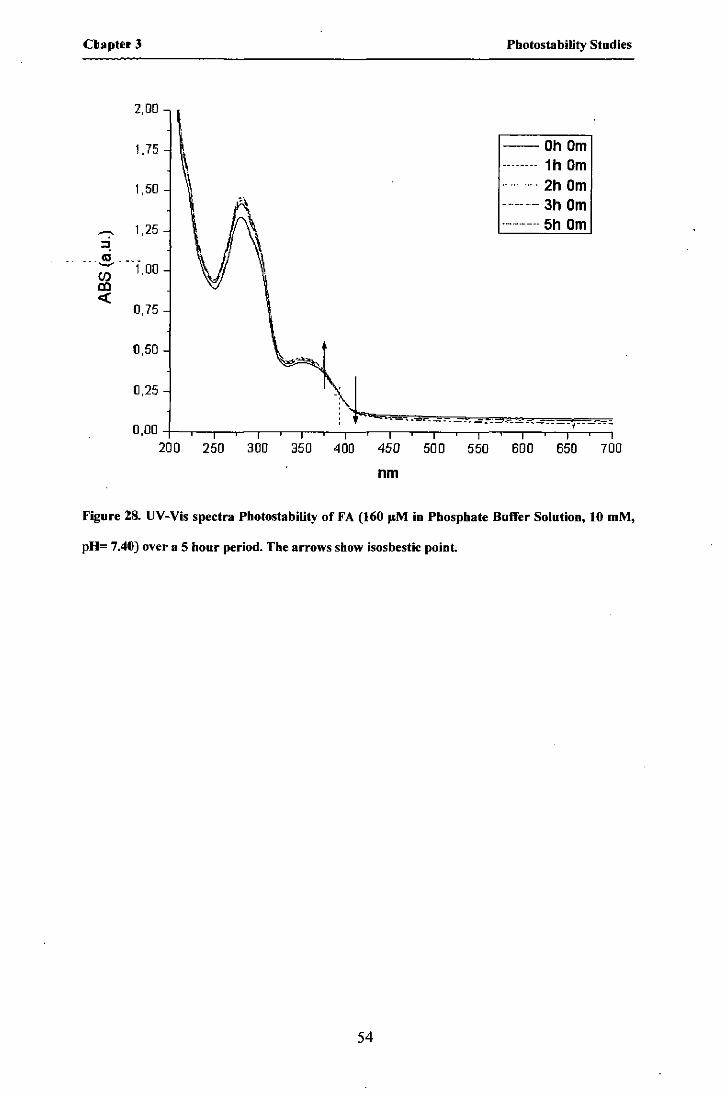
Cllaptu 3
2,00
1,75
1 ,50
'""':' 1 ,25 ~ _ _ (II ___ _
'U) 1,00 £XI «
0,75
0,50
0,25
250 300 350 400 450 500
nm
Photostability Studies
--Oh Om -------- 1 h Om ......... 2h Om ------ 3h Om --------- 5h Om
550 600 650 700
Figure Zs. UV-Vis spectra Photostability of FA (160 I'M in Phosphate Buffer Solution, 10 mM,
pH= 7.41l) over a 5 hour period. Tbe arrows sbow isosbestic point.
54

Clta(Jt •• 3 Pbotostability Studies
2,00 --OhOm
1.75 -------- 1h Om -- -- ---- 2h Om
1,50 ---- --- 5h Om
-"':' 1,25 V \ :l ni
- .. -.- -(00
\ en m «
0,75
0,50
0,25
o ,DO -l---'---'---'---.-~r-r---o--=;::::;::::::;::::::;:::::;:==r==:;:=;==;:==j2:::;::=; 200 250 300 350 400 450 500 550 600 650 700
nm
Figure 29. UV-Vis spectra of CDEn-FA (500 11M in Pbospbate Buffer Solution, 10 mM, pH=
7.40) over 85 bour period. Tbe arrows sbow weak isosbestic points.
In this study the electronic spectrum of FA shows significant changes after exposure
to a visible light source over a 5 hour period. There are increases in intensity of the
band centred at 281 run. There is also an increase in intensity together with a slight
decrease in wavelength of the band centered at 352 run. This may seem at first
glance to contradict the work of Off et al. 91 who reported a decrease in the intensity
of the peak at 280 run. However these workers exposed FA to UV radiation and in
our work no UV component was used.
The spectrum of CDEn-F A does not show significant changes, in terms of
absorbance and wavelength shifts, after irradiation experiments using the visible light
source. As shown in Figure 29, the band at 265 run undergoes only a very small
increase in intensity after I h of irradiation. No change was registered for the band
55
Chapter 3 Photostability Studies
centered at 360 run. These results suggest that FA is photodegradable. However
stability has been very much improved in the conjugate material CDEn-F A which
may be important if the material is to be used as a drug delivery agent.
56
Chapter 4
Biological Evaluation

Ch.pter 4 Biological Evaluation
4. 1. Introduction
The biological study was required in order to evaluate the performance of
the new folate conjugate "in vitro". The design of this conjugate is based on a
potential application in drug delivery for cancer pathology and therefore the
biocompatibility becomes a predominant factor.
Many researchers reported studies on cytotoxicity and uptake of drug
delivery systems based on folate receptors. 115, 116, 117, 118, 119 To understand the
cytotoxic effect of the CDEn-F A product in a human cancer cell line HeLa cells were
used, HeLa cells are an immortal cell line derived from uterine cervical cancer cells
and are used in medical research. 120 These cells are models of a human cancer cell
with high transfection capacity and have a reliable and constant over-expression of
the folate receptor. 121 They contain a membrane folate-binding protein (FBP) which
is invol ved in the uptake of free folate. 122 HeLa cells have also been used to study
inorganic nanostructured-folates. 123
Cytology evaluation is the analysis of cells under a microscope. Cellular
changes are used for the diagnosis of disease, to study the cellular anatomy, function
and chemistry. 124 Trypan blue is a standard assay used in the measurement of the
viability of cells. It is a reliable and fast test. Trypan blue, a diazo dye shown in
Figure 30, is a vital stain used to selectively colour dead tissues or cells blue. Living
cells or tissues with intact cell membranes are not coloured. Since cells are very
selective in the compounds that pass through the membrane, in a viable cell Trypan
blue is not absorbed. However, it traverses the membrane in a dead cell. Hence, dead
cells are shown as a distinctive blue colour under a microscope. 125
58

Chapter4
H03S
N=N
SOsH
Figure 50. Trypan blue molecule.'"
Biological Evaluation
S03H
H03S· .
HOEST 33342 is useful for monitoring cell death by apoptosis.1 26 Apoptosis and
necrosis are two major processes by which cells die. Apoptosis is an active,
genetically regulated disassembly of the cell from within. Disassembly creates
changes in the phospholipid content of the cytoplasmic membrane outer layer.
Necrosis normally results from a severe cellular disruption. 127
4. 2. Experimental
HeLa cells were obtained from the American-Type Culture (A TC) collection
and propagated at 1:6 ratio using Dulbecco's modification of Eagle's minimal
essential medium supplemented with 10% new born calf serum, 100 fl/mL of
penicillin and 100 flg/mL of streptomycin, at 37 DC, in 5% CO2 atmosphere. The
cells were incubated for 24 hours.
The percentage of cell death was evaluated by microscopy in a Burker chamber,
using the trypan blue exclusion standard assay. In a 24-well plate the cell solution
was transferred with a density of 1.5 x 10⁵ celis/welL
The procedure used for was as follows:
I. 0.5 ml of a suitable cell suspension (dilute cells in complete medium
without serum to an approximate concentration of I x 105 to 2 x 10⁵ cells per
ml) were placed in a screw cap test tube.
59

Chapter 4 Biological Evaluation
2. 0.1 ml of 0.4% Trypan Blue Stain was added and mixed thoroughly.
3. The solution was allowed to stand for 5 min at 30°C.
4. The hemocytometer was filled for cell counting.
5. The cells were studied under a microscope, to observe if the non-viable cells
were stained and the viable cells excluded the stain. 128
HeLa cells were treated for 3 hours with CDEn-F A (10.4 M) and FA (10.4 M in ratios
of 2: I 0 and 3: \0 and afterwards they were collected and layered on poly Iysinated
slides. After 10 min, the cells were stained with HOECHST 33342 fluorescent DNA
binding dye at 50 mM/mL (Sigma) and analyzed (objectives 40x) by using a
rhodamine filter (red emission) and a DAPI filter (blue emission) on a Biomed
fluorescence microscope (Leitz, Wetzlar, Germany).
4. 3. Results and Discussion
The following visuals (Figure 31 to Figure 34) were obtained from the
microscopy analysis of CDEnF A and FA as control at different ratios using Rhodamine
filter (A), DAPI filter (B) and a combination of images is shown in C.
60
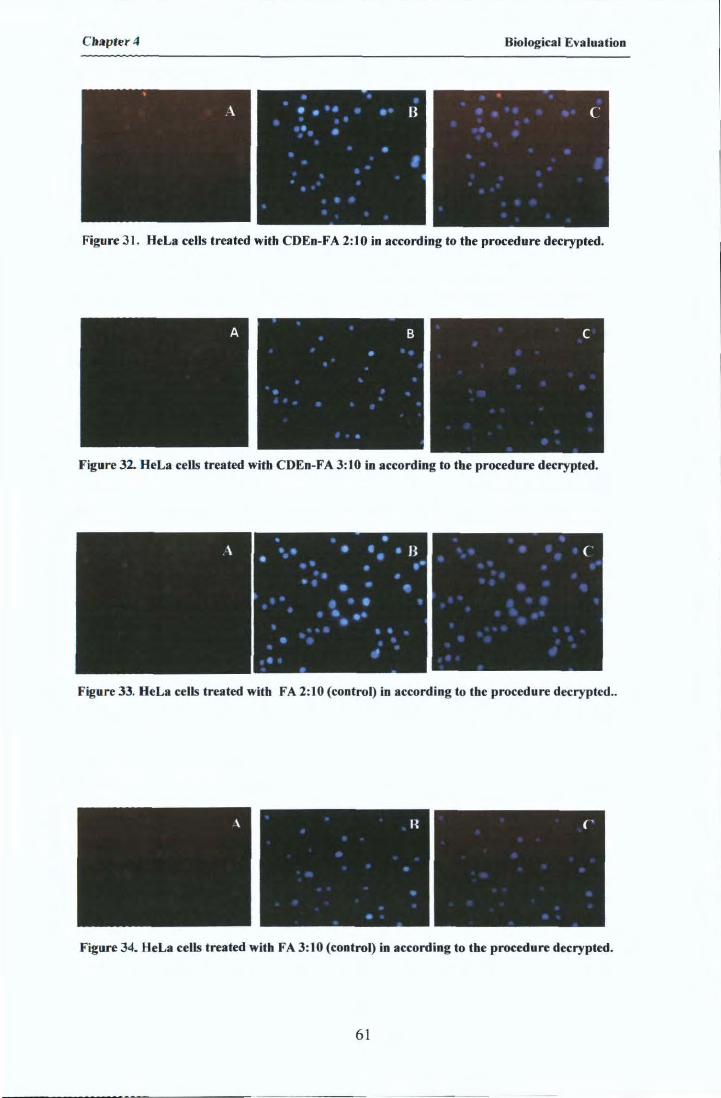
Chapter 4 Biological Evaluation
I'igure 31. HeLa cells treated with CDEn-1' A 2: lOin according to the procedure decrypted.
Figure 32. HeLa cells treated with CD En-FA 3: lOin according to tbe procedure decrypted.
Figure 33. HeLa cells treated witb FA 2:10 (control) in according to tbe procedure decrypted ..
Figure 34_ HeL. cells treated witb FA 3: 10 (control) in ateording to tbe procedure decrypted.
61
Chapter 4 Biological Evaluation
During preliminary biological testing, HeLa cells were not affected when they were
treated with eDEn-FA. The images produced when using the Rhodamine filter (A)
for eDEn-FA and FA at all ratios studied showed a diffuse background confirming
that both compounds were not located specifically in a cellular region. This was also
supported by combining the images (e) and no red spots were detected. The
conjugate seams have a better performance on the folate receptor recognition than
free folic acid.
When using the DAPI filter (B) for eDEn-FA and FA at all ratios studied no damage
to the nucleic cell or no change in the morphology was observed. These results
suggest a very low cytotoxicity for eDEn-FA. This encourages further
experimentation on cell systems to develop CDEn-F A as a drug delivery system.
62

Chapter 5
Conclusion and Future Work
Chap'" 5 Conclusion and Future Work
5. 1. Final Overview of Results
A new material CDEn-FA was synthesized and characterized using NMR, IR
and Mass Spectroscopy.
From the results obtained it is clear that two structural isomers ((l- and y-) of CDEn
FA were synthesized. Another adduct between conjugate and free FA was detected
and was not removed after the purification process.
HPLC studies gave further support to the spectroscopy results and also
suggest the presence of CDEn-F A and a further adduct.
Exposure of the new material to visible radiation showed that it is substantially more
photostable than free FA at physiological pH values.
A preliminary biological evaluation of the cyclodextrin-folate conjugate was carried
out to understand its effect on HeLa cell lines. No evidence of toxicity are observed.
At this stage there are no evidence that the material can cross the cell wall.
The photostability tests and the biological evaluation results encourage· further
studies on this material for applications in drug delivery systems for cancer therapy
or diagnosis.
5.2. Future Work
The first goal of any future work is the separation of the two isomeric forms
of CDEn-FA possibly by a preparative HPLC method. In this way trace products
may be removed and the (l and y isomers of CD En-FA separated. Investigation of the
material by NMR diffusion and Light Scattering experiments will give further
information on its aggregation properties by competitive complexation with
64

ChapterS Conclusion and Future Work
adarnantanol. 129 Further biological tests and drug solubility properties will also be
considered in future investigations. 130
Protonation and metal complexation equilibria can be investigated by Capillary
Electrophoresis and potentiometric titration studies. 131. 132
The coordination properties of the conjugate towards different transition metal ions,
such as ruthenium Ill, 134, 135 and platinum will be studied. 136, 137 Folic acid has
been shown to form a coordination complex with nickel, the structure of which is
shown below. 138
Figure 35, Detail ofthe folic acid aromatic unit coordination to Ni'+. 138
In this work it was shown that CDEn-FA could not cross the cell membrane cell. It
was localized at cell wall. Therefore there is a need to study different functionalised
CDs with more affinity for biological membranes which may help delivery into the
cytoplasm region. 28, 139, 140, 141 Amphiphilic molecules incorporating other CD
derivatives and porphyrin systems will be studied with a view to developing a system
which can successfully delivery drugs into the cells. Such versatility of the CDEn-F A
can then be exploited for intracellular delivery of photosensitisers in photodynamic
65

Chapter 5 Conclusion and Future Work
therapy of tumours, organic and inorganic drugs used in conventional anticancer
therapy, metal nanoparticles.
66
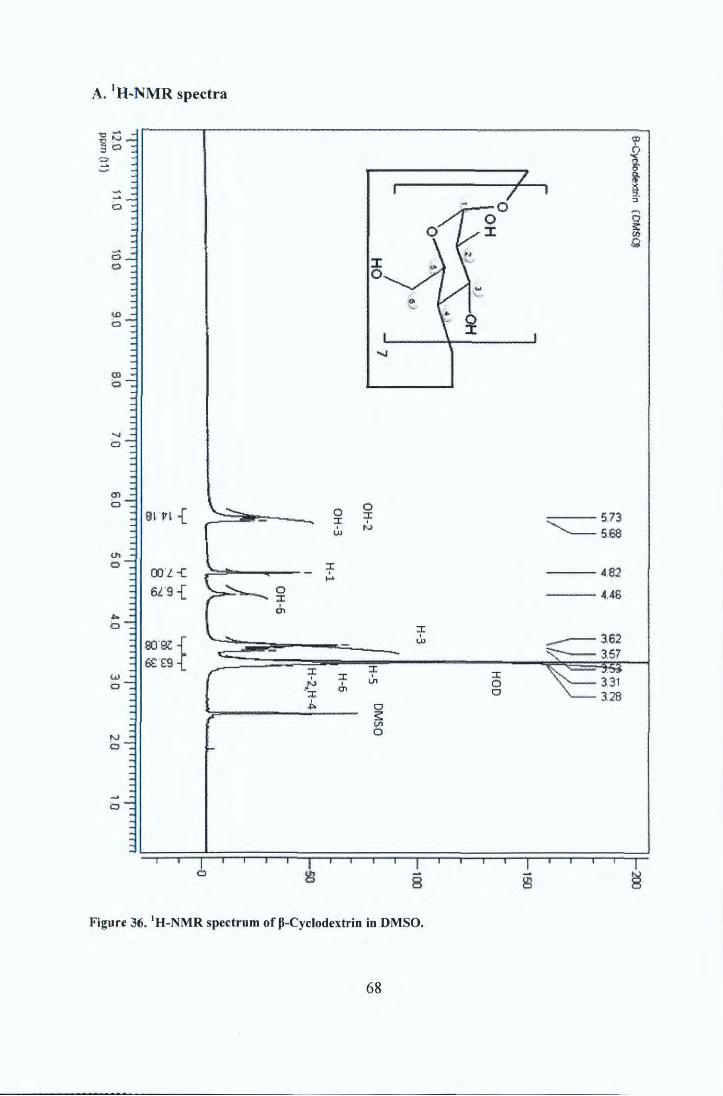
A. 'H-NMR spectra
::: a
Ci o
U)
b
en o
'" o
.. b
w o
b
.: :
: : .:
: : : .: : : : c
.: : c
~
-:, : --
-
: :
-: : -
-= -
--: : :
-= -: : : -
.... 8~ ' v~ { -
(Xl'L 'i:
>-'---- ~ 6L9{ , '"
eo!ll~ &n~
'-
i I I I i I o
I
;;r; , ~ J"
I IS
I
~cf o/v~ ..
:I: .. ~ ~
o~ V w .. , ..
~
• ~
I \ ...,
0 0 ;;r; ;;r; , u, '"
;;r; ,:.
;;r;
- u,
;;r; ;;r; ;;r; '" , 0 '" 0
0
~ 0
I i I i I i i i , 8
Figure 36. 'H-NMR spectrum ofP-Cyciodextrin in DMSO.
68
'P ()
/ I I g, ,
~
" ;:
'" Q
I
"--- 5,73 5,68
4.82
446
__ 162 ~3.57
~131 3.28
I , , , ,
I § E!
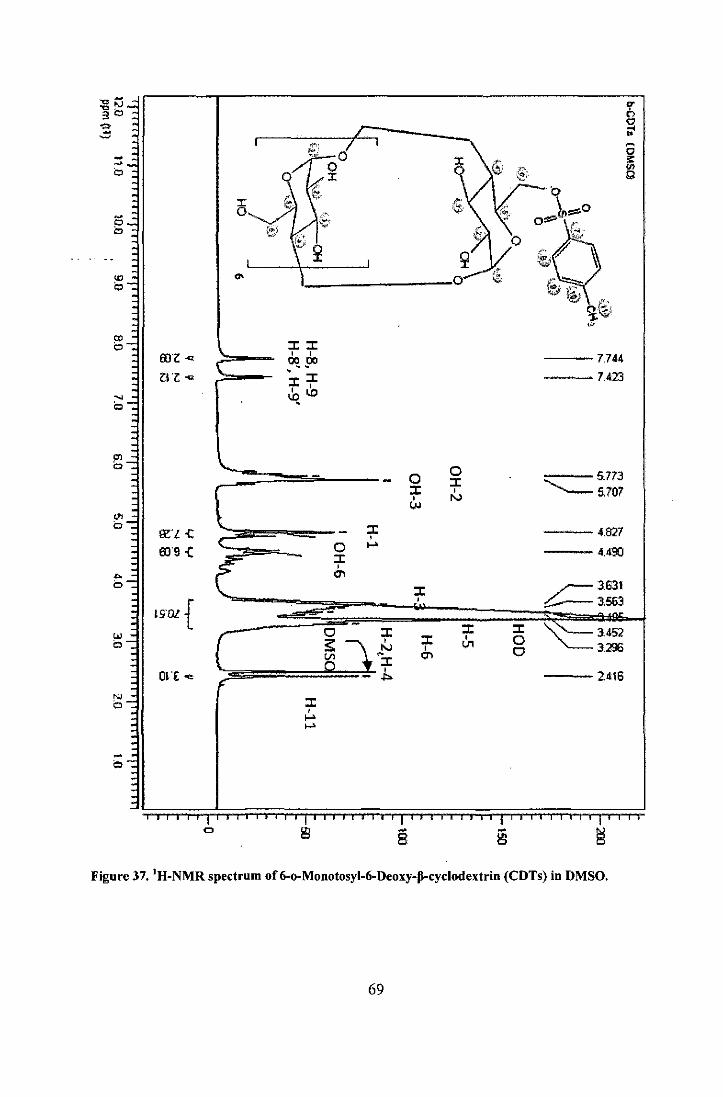
",-",r-.> 3'"
"'" -~ --<:>
g
~
~
" <:>
!"
""
'" b
... b
w b
;:;
b
fIrZ "" zrz ...
I£'l -C EO'9 -(
I9"OL {
art ..,
i I I C>
:r 0
i i
:I::I: , , CX!.!X' , :I::I: ~.o
0 :I: , (,JJ
:I: , 0 I-'
::z: , 0\
:I: ,
:I: , :I: N I ~ CI'I :I:
- J:,.
::z: , I-' I-'
iii iii ii' I I t l
!!l 8
0 :I: , N
:I: :I: , 0 U'1 0
iii "
I' ,
er;"It 'lY q.€i
,.
---7.744
---7.423
,--5.773 5,707
4,627
4.490
.-C- 3,631 ~3,563
~3452 3,296
2,416
i It' 1
~
Figure 37. 'H-NMR spectrum of6-o-Monotosyl-6-DeoxY-II-cyclodextrin (COTs) in DMSO.
69

.., .., 3",
~8 '" 2l '" 81 '" ~ '" ~ '" 8
.. l'; .. ~ .. 8 w B 98 ~£ w ~ w l'; w ~ w 8 '" cn{ B '" ~ '" s
~ -8 C>
B
o
J C>
o I
c I 1
o
::r: , ,1I1
::r: , .!'J
J
§
::r: , ....
•
::r: , ,w ::r: ,
,C1'I
<r o o m ,
--- 4.930
__ 3.764
"'" 3.731 3.715 ~3.501 ~3.468 ~;::
3.292 --289J
2.665 2544
--- 2.D58
---1000
Figure 38. 'H-NMR spectrum of 6-Deoxy-6-11-(2-Amino)-Ethylaminol-~-Cyclodextrin (CDEn)
in D,O.
70
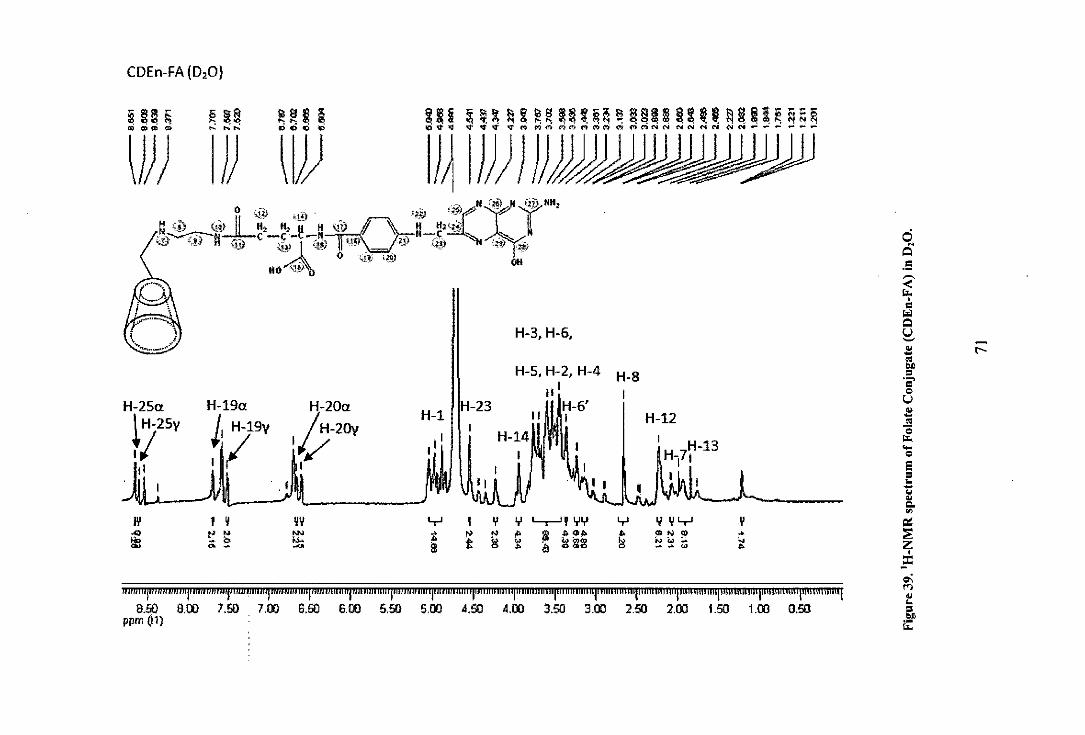
CDEn-FA (D,O)
0 N
Q
.S ~ ..: '" , = fOi
H-3, H-6, Q U ~ -.. t---..
H-5, H-2, H-4 H-8 "I
H-25a H-19a H-20a H-23 H-6' l H-2SV JI H-l9y H-l I H-12
[H-2OV H-14 .1 1,/ IV II I
.. " ·S " u .. -oS
" '" ... " E " ... .. .. '" '" 1'1 I i VV Y I Y Y '-r-'I W Y If YY Y ~ .., " .. "" ~ i ... ,.
~ ...... .. ~!Y9> ~
ii: :. ., OJ.. .. i! :.: ~g\ll ~ N ~_
~ .. - ~ !l _.w :; Z , :z: 0;
IWill "!JJJhII 1m ml' Imi lliii "'I' ilffiiiiilJl1 """Wi filii mil i1iiiil1il jill ifJllIiliI"iiJ iiiill'il ijfliillil ilIl i 'I'ii ill II iiii "Ilfili/ill Ii i lilll i hll iii! iIIJII/1ii Ii Iii 1111' ; II Ii iii! I h1t'llihl1ii ""I iilii ""li!li ,mUM hlilll\iI \\U !hIIi I 8.50 8.00 ].50 ].00 6.50 6.00 5.50 5.00 A.50 4.00 3.50 3.00 2.51) 2.00 1.50 1.00 0.51)
ppm (\1)
,., .. ... " .. r.;:
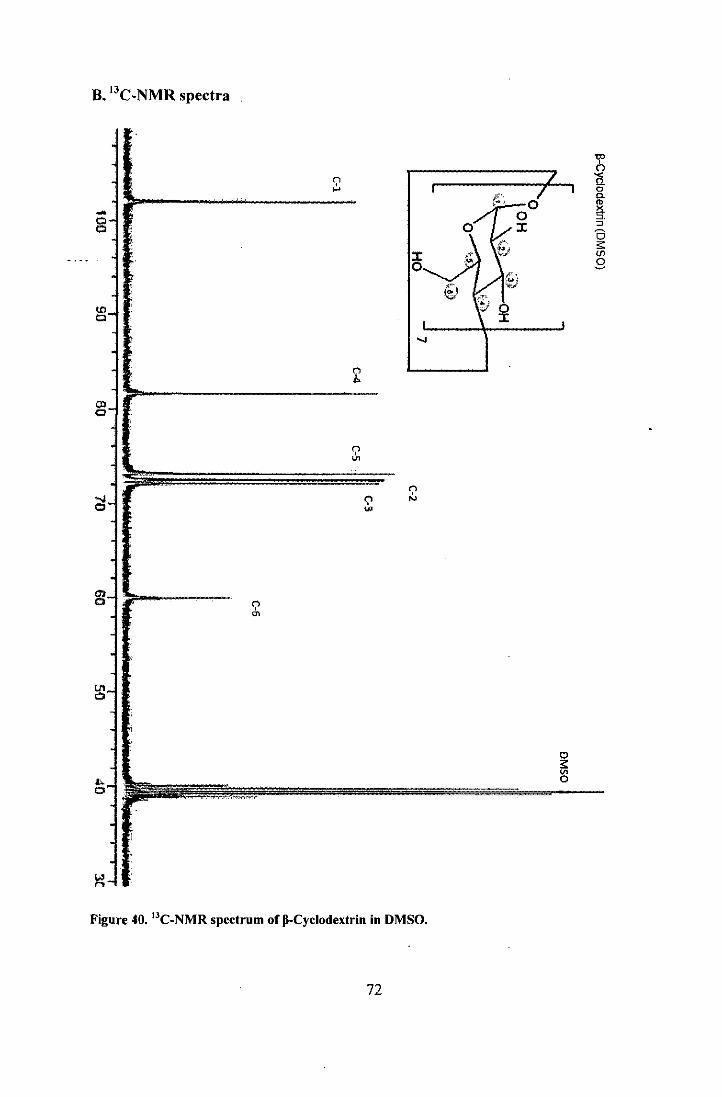
B. lJC·NMR spectra
... 8
~ Ol 0
Q V>
c;>
~ c;> .... '"
Figure 40. I3C-NMR spectrum of )l-Cyclodextrin in DMSO.
72
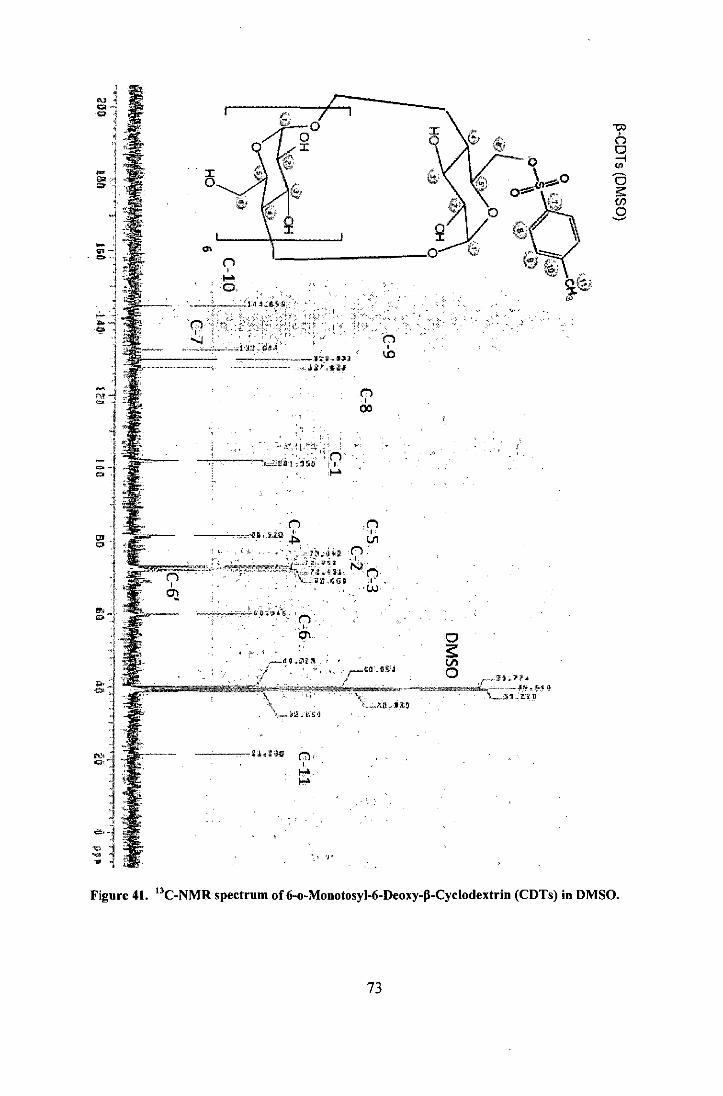
·', j
, I.'
("") , O,l
:-
.' 'j"
. ,
("") ., 00
-
o s: VI o
j ,
Figure 41. I3C_NMR spectrum of 6-o-Monotosyl-6-Deoxy-p-Cyclodextrin (CDTs) in DMSO.
73
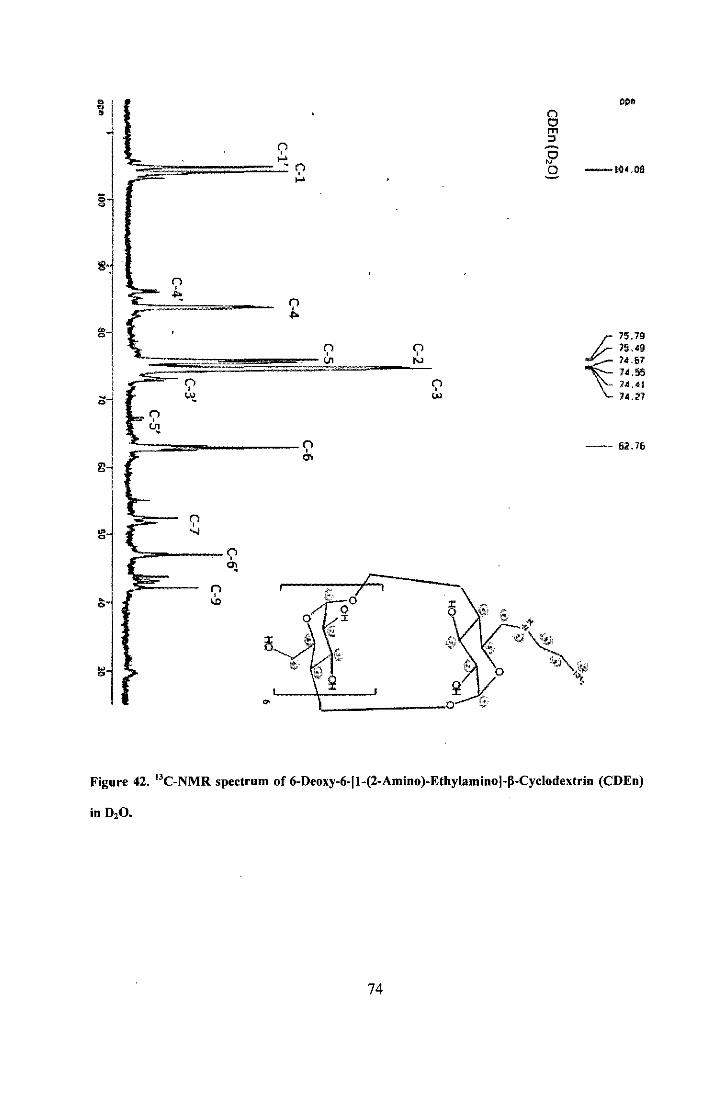
ill l ..l (') , .... - (') , ....
g
;:==-----Q <To
>""""----Q CIl
(') 0 m :l -::? 0
'-__ ---10
00-
-10'.08
r 15.79 .I/:. 15.<9
~ 1'.67 7A.55 74,41 14,21
-- 62.76
Figure 42. I3C-NMR spectrum of 6-Deoxy-6-ll-(2-Amino)-EthyJaminol-p-Cyclodextrin (CDEn)
74
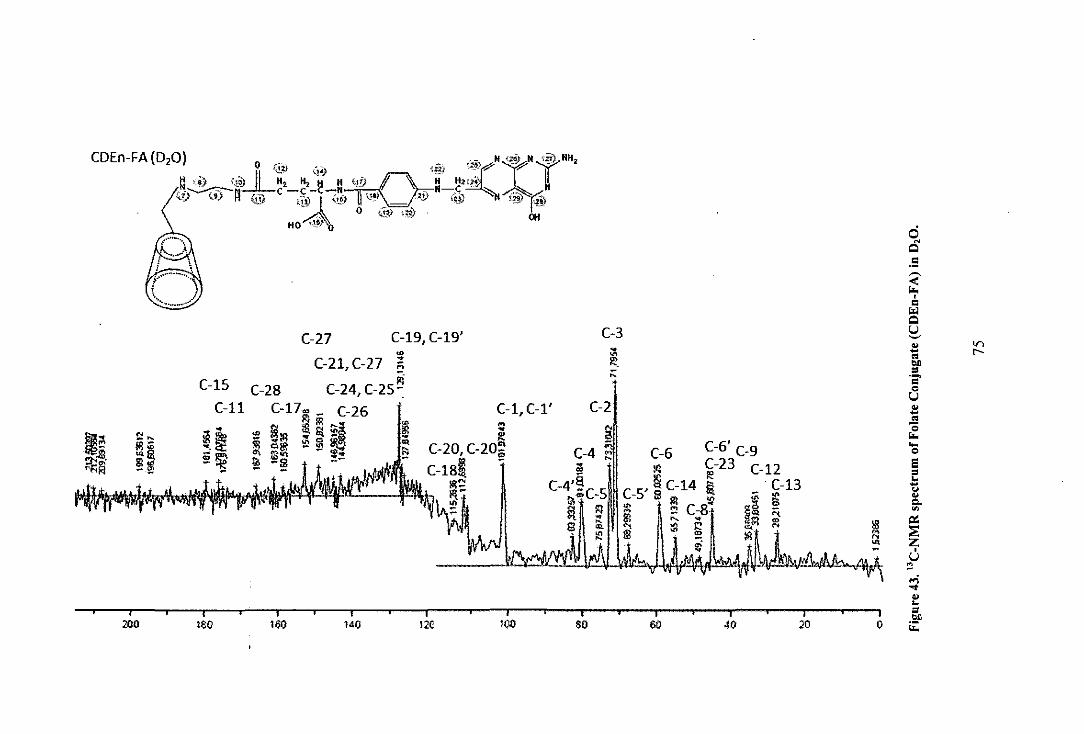
i 2£)0
(-27 (-19, (-19' ~
(-21, (-27 ~
(-15 (-28 (-24, (-2S~ (-11 (-17~ _ (-26
l!) III • :e ~:Il ~ SI ~ m ~~ ~f.6~ 0\ mll\ - ~ .. Ii; -Ii! --- -
i 100
i 140
I l:ro
(-3
~ ;::
(-1, (-1' (-2
100 I
$0
(-6' (-9
(-12
40
. (-13
a '" m N
I ]0
1 o
ci N
Q .S ~ ..: .... , c
"" Q U ~ .. <r> ~ t-.. OJ)
= .~
c '" U .. ~ .. '0 .... ... '" E = ... ~
" .. ... '" g:: ~ z , u ~
,...; ... .. .. = OJ)
..:
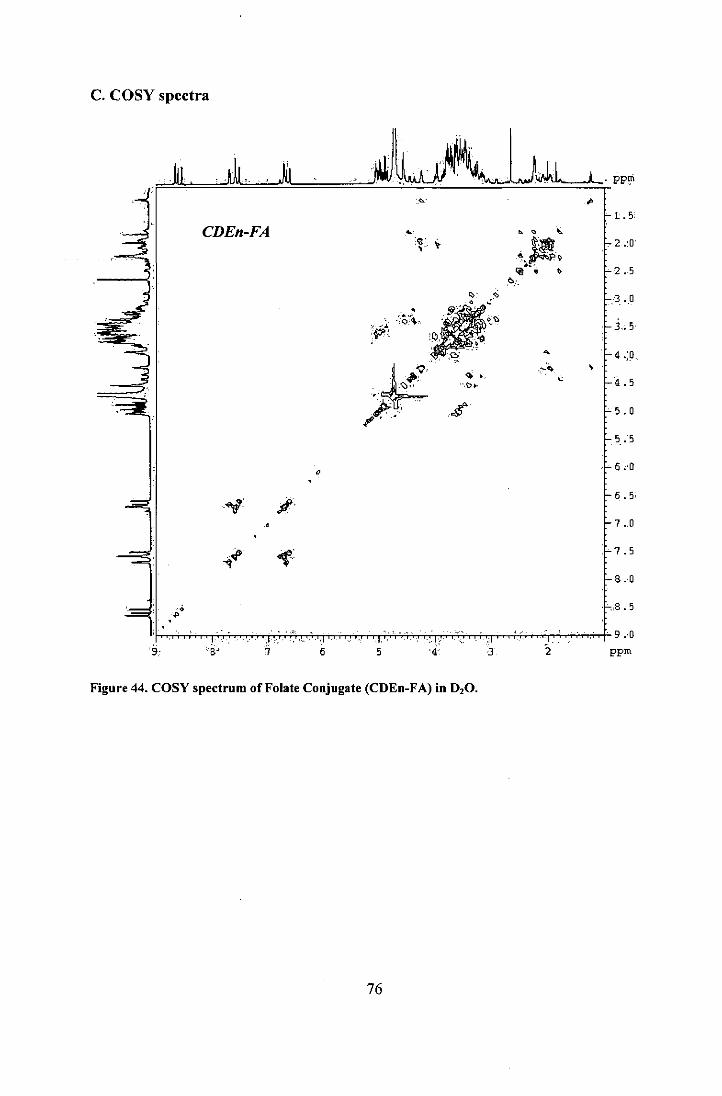
C. COSy spectra
pp~
'.,::". ~
1.5
eDEn-FA 2.0
2.5
'3 • .0
3.,5
4.:0 , 4.5
5.0
5,.5
0 6 .. 0
~. If'· . '
6.5,
7 .. 0
.:l l' 7.5
S .0
• ,.8.5 . ~
9.,0 '.
9. ·s· i 6 5 '4 ,3 2 ppm
Figure 44. COSY spectrum of Folate Conjugate (CDEn-FA) in 0,0.
76
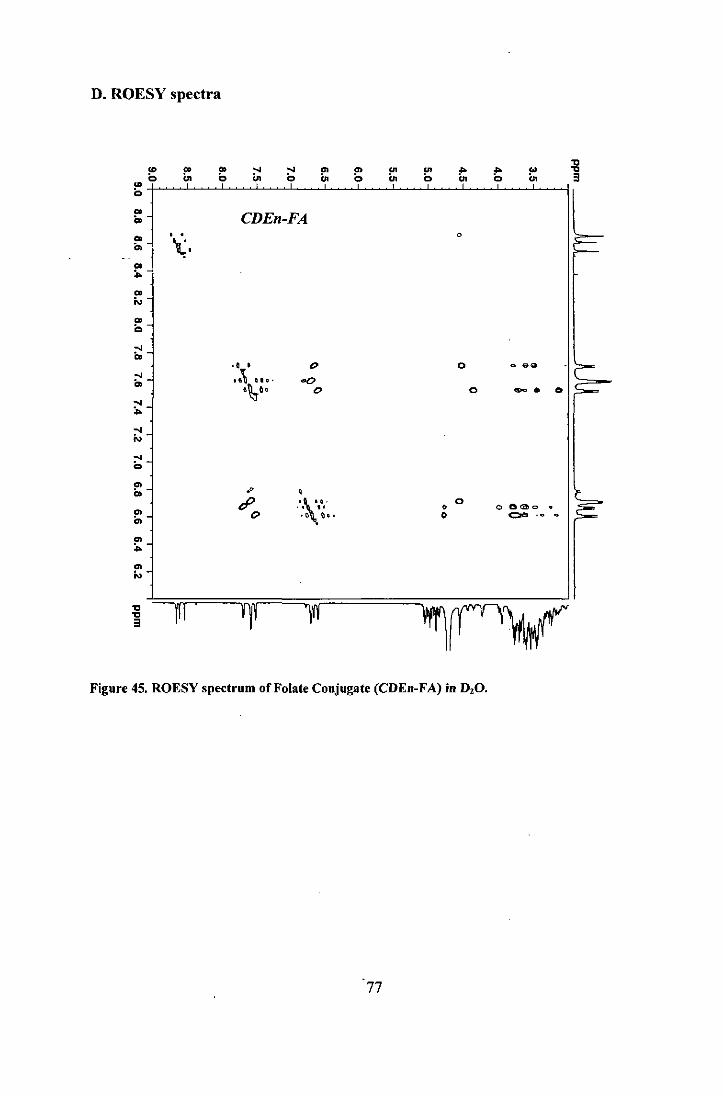
D. ROESY spectra
" !" !» !» =-' =-' .. .. '" '" ~ t; .. " 0 '" 0 '" 0 '" " '" " '" '" 3 .. " ..
eDEn-FA i» .. • \ . 0
'" .. .. .. N .. " b:
•• • '" 0 • sa .... I~ Ito· <>0 '" II~DO 0 0 ..... <> .... .. .... N
=" 0
... i» .P •
cP .~. 0 .. . . 'I • o D<:i:Ilo . '"
0 o() • a ~. • 00> -• . .. .. .. N
" pi YI!l '\11 ~r'V " 3
Figure 45. ROESY spectrum of Folate Conjugate (CDEn-FA) in ~O.
77

E. TOCSY spectra
'" ~
'g ~ '" '"
..., '" ... til \0
" ;g .. ~
'" '" 0 .. ."",: -J. .,
~
'" " " 4- " '" '" ... " '" ". '" ?'-'" -~-0 - - -'" ,; = • '" -.
moo
'" ., -" ".
" . ... .
UI ,
'"' 0
0_ 0
IV -~-• .. a •
'" .. "Q ~~ ., • • " 0 o " ....
UI •
~ ~I ~ 1
Figure 46. TOCSY spectrum of Folate Conjugate (CDEn-FA) in D,O.
78

F. FTIR spectra
%T
.j>. 0 Ol o
ex:> o
~
o o g ~ __ ~ __ ~L-__ ~ __ -L __ ~ ____ L-__ ~ __ ~~ __ ~~
0 3
!.
o
w U1 o o
w o o o
'" U1 0 0
'" 0 0 0
~
U1 0 0
o o o
U1 o o
~
m w
Figure 47. IR Spectrum of p-Cyclodextrin in nujol.
79
~ ~ ~ c
;; ~ w
C" I
() o ..-.. ::J s:::: ~.
Q.. '-"

C')
3 !..
%T
-I'> 0 Ol o
co o
~
o o g -t ____ ~ __ _L ____ ~ __ _L ____ ~ __ _L ____ ~ __ ~ ____ ~ __ ~
o
w U1 o o
w 0 0 0
~ U1 0 0
~ 0 0 0
~
U1 o o
~
o o o
U1 o o
~ ~
-~ ~c m ~
m
r;;
Figure 48. IR Spectrum of 6-o-Monotosyl-6-Deoxy-p-Cyclodextrin (CDTs) in nujol.
80
0-I
() 0 --l (/)
..-.. ::J c: ~.
0 '-"

[-- b-CDEn (nujol) I oS ~
100 ., = II!! ~
Q
0«Lf 11 N \1\. I 66-B'S(]11 U
2360 ~
= °C -" .. lDJ2 I
"Q
80 -l T 0 1456 <:i ...
U , ... , 0" = Os
r ..
60
1 >. ..c -I- ~ ,.I-0
'#. = Os -...: 00 291B ,
40 -I ~ -... 'oC , ... " 0 ..
Q , 'oC
20 -l ... 0
I: = .. -... .. Q.
'" 0 I I I I I I I J i:I: I -
4000 3500 3000 2500 2000 1500 1000 500 .,; .... " -1 .. "5 = em o!!!' o~ = '- =

b-CDEn-FA!
lE1652
""'O3'~ 80
12'
! 60
"5 .~
= = .9 ~
I-< ~ •
~ = N ~ 00
0 Q
40 1J11 U ~
1 .. -.-OJ)
= .~ = 0 U
U62 .. -20 1 .-'0 ~ ... 0
,0 e = ...
29;~'53 -" .. Q,
0 '" ~ -4000 3500 3000 2500 2000 1500 1000 500 .,; OIl ..
-1 ... = em OJ)
~

-- FA (nujol) I 100
3551
80 m
1695 2126
60 I-~ 'i M 0 00
.~
" c
40 1311 .s
j <' '-~
-0 ." -< .~
20 111.63 "0 '-... " E
296' " .. 2691 -" " Co
0 '" IX -4000 3~00 3000 2500 2000 1500 1000 500 ,..;
III
" .. .1 " .. em ~
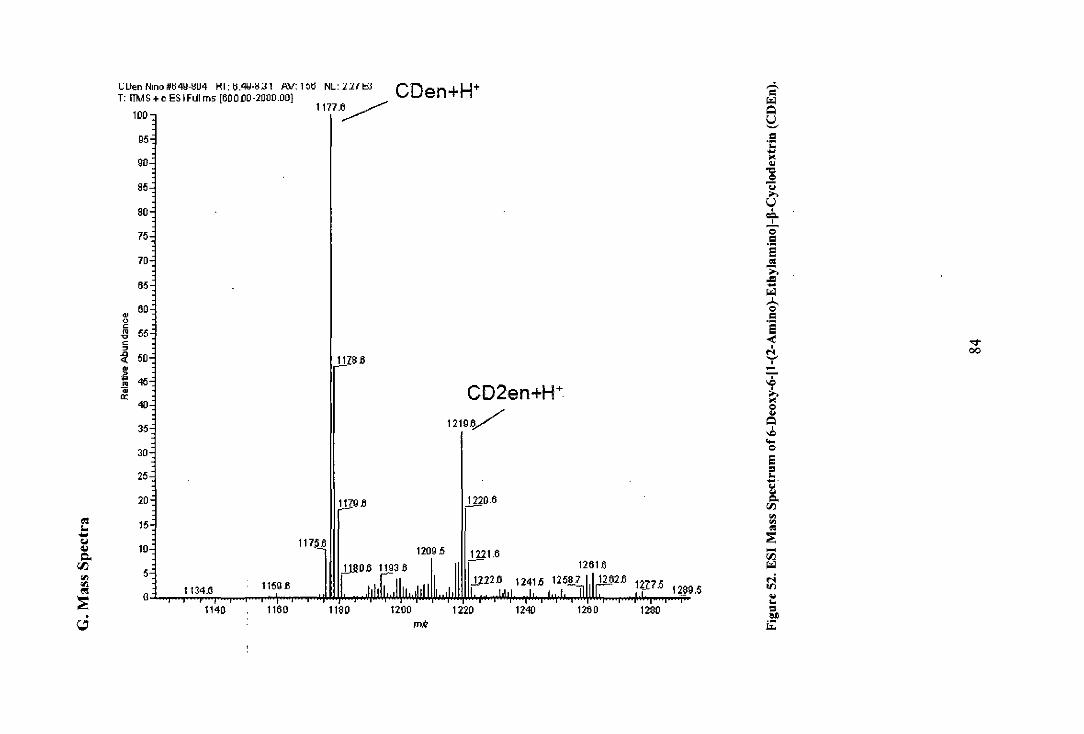
.. .. ... '" .. Q.
r:I:J ., ., .. :t 0
CUen Nino ;¥tj%l-8U4 HI: tj,%I-8,:n AV: 1 t1tj NL: 'l.1{ 'r::!J T: iTMS+c ESIFulms [600DO-2000.00J
100 1177.~
~ 0 0 N ~ 0 , ~ ~ p
-\1 0:
95
90
85
80
75
70
65
60
55
50
46
<W
35
30
25
20
15
10
5
0
11ZS5
11 9~
117H
1134.6 1159~
1140 1160 1180
CDen+H+ A = ~ Q U ~
c 0;: ~
" " "C ..5: " ;... U • = • "0 09 e oS ;...
'" ~ ~ • ~
" = °5 -< .;-• t!- OO
• --h >. "
CD2en+H+ " " Q •
1219~ "" ... " e = .. ~.
" " Co
'" .!n0.6
'" '" .. :; -'" ~ 12095 1ll1.6
1261~
N OIl
" 12415 12l? 5
I~M .. = .. 1200 1220 12<W 1260 1280 mil iZ

L:Uent-A L ti'1tj·::;4 HI: U.o!J·1.L1 AY. ~\:I NL: 11~t:::l CDenFA T: ITMS .. c ES I Flil ms [IOOODO·2000DO]
100 1117.6
95
90
85
80
75 1600.7
70
65 A -<
1601.7 ~ , 60 = ~ ~ 0 Q c
~ 55 U ~ c ~ ~ .. V")
il 50 - 00 .. ~ 117SB ..
= .Ii: 45 .~ = 0; 0 0: U 40 ..
1389.4 -35 .!l!
0 ~
30 ... 0
E 25 = ..
16U.7 -10752 1383.8 '"' 20 13903 .. '" 9.6 '" 15 lQS2.6 ~ ~
1241.7 1623~ ..
10 14JO.4 ~ -'" 5 ~
..; 1ll.llV 141J3~ 1706.4 .,..
D " .. 1100 1200 1300 1400 1500 1600 1700 =
mk .ilI' ~

% Intensity
Figure 54. MALDI Mass Spectrum of Folate Conjugate (CDEn-FA).
86
s: » r o s: (j)
() o m ::J
I
~
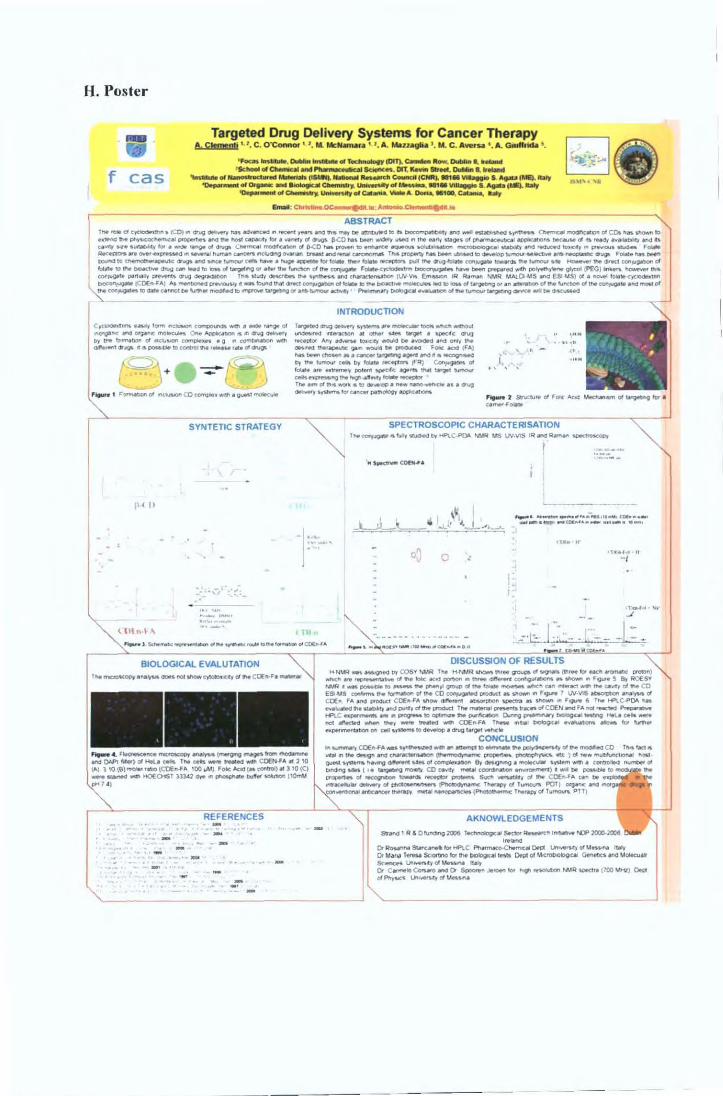
H. Poster
Targeted Drug Delivery Systems for Cancer Therapy A C"",,nti I.l, C. O'Connor· '. fA. MtfNmllr ;l I '. A.. Mau~ I. M. C . ... Wfy ' . A. Geuftrid,t t.
'~","",*" ONIIM 1IMIhIM .. ,........." (OIT). c:.......1IWW. """*" .. II ..... f cas
• 1c: ...... a-.IaI ... ""'" llial~. on;"- ...... 0IIIIIiIII1..,.... ""'*""_ ..................... IlueQ. ......... ~ .. c:...catcc:NIII .. ~.~ • . ~f.." .. 1y
-0..-_ .,0.....-: MIl ........ a-.ttIf", UllkwUtyflll ............. ..,..... • . "--IUE) • ..., 1O.f*---"~ ~~01~ ~A.o.-. .too.c-. .., . ..
1_~CI~.fCOl .. ""CI-'~_ec .. __ ",_" • ....,t._"'''''' :; eell. ___ ~.)"'tI'NtM a..mc.~."co.~ .. ,,-.. •• _".~~_IN_~kII''4~,oI''''II<O,..._.....:Ie/y_'' I'''''IIf~ot~~OOft5~ .. oI.""",,,,,,IltIII)o_'''' coo~..., •• .-.IItr , .... -"roue 01 ar.rgo. C ... moc.ol mD<Iflta_ 0111<0 I'IH ~ "'.......-. ___ mo~I "'-" __ -.:cy ... ___ F_ ~_"",,-,,--,,_ql~_ft~-....g _____ ............ T ... POC*t¥ __ ......., .. ~~ __ ~_-~C1:'9 F_IIH_
toIIfIOlO ___ ~ • ..., __ t"_.",,_Iot .... _..,...~ 1IIIIIrr..~_~_"''''I'''''''''_ ~_~fdC#l,l/Ol,"",d ........ "'rr.. _ ""'0 tan .. <110 lDMoI~ 01 1ft< h frunc-. d IfIto ~ ~oIM~ ~_ ........... '-" __ ..:I"'" ~ glycol (PEG) -... ~ ". COIIlUgII" I)I"hlllyl>'_'''''CI~1lOft T""Mwctr<lil'tC<ClftN • ...-__ ~(wv .. ~ IA ~ .... rNA MAl.[;"'oIs_eSl.u$)oI.-"foItlt-qC~tIII'O
"-;'';;90~iC,-.~~':''':::~I;:'''~~~..:::::'"'::'-=-~~~':'''''~~::=:''''r._~oI_ ........ _moud
GI't __ t..wy lorm .. cIuooDrI c __ .. _,~ 01
oftOfV6""'_~o;~o...~ .... ~~ .,.,. .,.. ~_ 01 tIdJ.- C<JmClInH .. g .. ~ .w.h
."....,dr4 ... pou.CIIe .. (_"._ .... ""~
SYNTETIC STRATEGY
., .... -.-
INTRODucnON l~lInIOdII~.,-,...~,~ ......... _ .-.0 otIII .. ..:IOOII iIII _ "'" IAtQI'I • W)ldc: drug ..udor .... 1 __ IOU>I'r _ be • .....-a . "<1 ~ .... .... ___ ~'"'_be~ r*_ IFA)
..... _~ ... ~a.f9IIIne~_ •• ~ Dr' IN -.. t-" Dr ..,... _~""' If""J eon,..p* 01 1oIaI .... eoY_iI' ""*"" IPfC4o: .... _ IM'IJIi __ c.- •• ~IN"'9' ... ""'Y,..,..~ , T"'" .... oIlf> ... ....,... ... .....ap._~u.drug ~ ......... ..,.c.o_~~.,p.c._
I ....
, - ."
~""l ~ .. d FOIIC;.o.e.a ~ .... dgogooMgkw . ~ ..... ~ ... "
SPECTROSCOPIC CHARACTERISATION T","~"~II_I>tHPLC.P()l NUR MS (H-VlS IR_"_" ~
_. _ _ .... .. - _ ... _HIlo ... _ _ _ • ...,. _ cmtof ... _ .... _~ .. _
I~
o .'
..... ."......"""" ... _'-_ .. CO(ro.f .. ._-::L=.. .;;~:.. - -I BJOLOGICAl EVAlUTATIOH
T ... ~.~_noI_~dld .... COEn-F ..........
. ...; -
oeSCUSSION OF RESULTS H-JNR ..... .......,..., IW cosY NMA ,,,. H~ ~ IN .. ~ d ~ r-.,. Iot .. " .. cmatc: ~) ~ ___ d ... IoIC_~ .. _oe_~ .. _ .. F.,....S &t'AOEsY _._~IO_ .. _wt_d_~_ .......... .,."_IIOt ___ ,r:J .... CO
ESI-US a:mn... .... ~ of .... CD ~ Cln>dua .. ~ .. F.,.... 1 W-IIIS ~ _:,... d can ,,,.rod '""""" COE" F" oI'I<M< ~ _lIlo:>fl ~ .. ..- .. F90'" ThO l-f'l.C-POo. ..... ..... ~ ... ~ ..... pW"'.d .... r;:rodlC:t n.~~_r:JCOEN_F"_""'~_ HPl.C _ . .... ~ .. ~ .. ~ 000""ll~~1~ ~~uto __ _ ~_I!>ro' ___ CDE...,," T"- .... ,~ ...... __ loffl.o1r>tof
__ bOn 011 e.-~ IO~' drug taIQII-...rwc"
CONCLUSION
AKNOWLEOGEMENTS
s._, "'Otu~2'IXMI T~IIS1'ct:lt~ft'_/>CPlOOO-XD!I ,Or~su..c_""t-IPlC ~.0rI:I ~oIlo1_ ItItv CrMa,,' l ...... ~torlM~_ DotClIoI~ ~""'W06lQ.l" S<-_ UI __ '01 ............ rt.t, r> c-lDCorwro _ Or ~ ~too ..... ~ I'AIR ~ (700~) OI(C
oIPro~~oI"" ......
Bibliography
1 A. Villiers. Com pt. Rend Acad Sci., Paris 112, 536 (1891).
2 F. Schardinger. Z. Untersuch. Nahr. u Genussm. 6, 865 (1903).
J K. Freudenberg and W. Rapp. Ber. Dtsch. Chem. Ges. 69,2041 (1936).
4 K. Freudenberg, H. Boppel and M. Meyer-Delius. Naturwissenschafien 26, 123
(1938).
5 K. Freudenberg and M. Meyer-Delius. Ber. Dtsch. Chem. Ges. 71, 1596 (1938).
6 K. Freudenberg, G. Blomquist, L. Ewald and K. Soff. Ber. Dtsch. Chem. Ges. 69,
1258 (1936).
7 K. Freudenberg, F. Cramer and H. Plieninger. German Patent, 895-769 (1953).
8 S. Tian, P. Forgo and V. T. D'Souza. Tetrahedron Lett. 37 (46),8309 (1996).
9 H. 1. Schneider, F. Hacket and Volker Rudiger. Chem. Rev. 98, 1755-1785 (1998).
10 S.E. Brown, J.H. Coates, D.R. Coglan, C.J. Easton, SJ. van Eyk, W. Janoski, A.
Lepore, S.F. Lincoln, Y. Luo, B.L. May, D.S. Schiesser, P. Wang and M.L. Williams.
Aust. J Chem. 46, 953 (1993).
11 N. Zhong, H.S. Byun and R. Bittman. Tetrahedron Lett. 39, 2919 (1998).
12 B. Brady, N. Lynam, T. 0' Sullivan, C. Ahem and R. Darcy. Org. Syn. 77, 220
(2000).
13 H.S Byun, N. Zhong and R. Bittman. Org. Syn. 77,225 (1999).
14 B. Brady, N. Lynam, T. O'Sullivan, C. Ahern and R. Darcy. Organic Syntheses 10,
p.686 (2004).
88

15 R. Breslow. Pure&Appl. Chem., 66, No.8, pp. 1573-1582 (1994).
16 J. Szejtli. Pure Appl. Chem. 76, No. 10, pp. 1825-1845 (2004).
17 N. Bodor and P. Buchwuld. Phumacol. Ther. 76, 1-3, pp. 1-27 (1997).
18 P. Chandna, M. Saad, Y Wang, E. Ber, J. Khandare, A. A. Vetcher, V. A.
Soldatenkov and T. Minko. Molecular Pharmaceutics 4, 5, 668-678 (2007).
19 J. Szejtli. Clyclodextrin Technology, Kluver Academy Publishers (1998).
20 C. J. Easton, S. F. Lincoln. Modified Cyclodextrins: Scaffolds and Templates for
Supramolecular Chemistry, Imperial College Press (2000).
21 G. Wenz, H. Thomas. Carbohydrate Res. 322,153 (1999)
22 A. R. Khan, P. Forgo, K. J. Stine and V. T. D'Souza. Chem. Rev. 98, 1977-1996
(1998).
23 C. T. Rao, J. Pitha. Carbohydrate Res. 210, 209 (1999).
24 W. Saenger. Angew. Chem. Int. Ed. Engl. 19,344 (1980).
25 K. Teranishi. Tetrahedron 59, 2519 (2003).
26 M. Bender, 1. Komiyana. Cyclodextrion Chemistry, Springer, New York (1978).
27 A. Mazzaglia, N. Angelini, R. Darcy, R. Donohue, D. Lombardo, N. Micali, V.
Villari, M. T. Sciortino,1. Monsu Scolaro. Chem. Eur. J 9, 5762 (2003).
28 S. Sortino, A. Mazzaglia, 1. Monsu Scolaro, F. Marino Merlo, V. Valveri, M. T.
Sciortino. Biomaterials 27, 4256 (2006).
29 K. Petrak. Drug Discovery Today 10, Number 23/24 (2005).
30 Encyclopedia of controled drug delivery, John Wiley & Sons, New York 1999,
volume 1, pp. 283
89

JI R. Challa, A. Ahuja, J.Ali, and RK. Khar. AAPS PharmSciTech 6, 2, Article 43
(2005).
32 T. Loftsson, E. Stefansson. Drug Dev Ind Pharm. 23, 473-481 (1997).
33 D. Rong., V. T. Souza. Tetrahedron Lett. 21,4275 (1990).
34 K. Fujita, S. Nagamura, T. lmoto. Tetrahedron Lett. 25, 5673 (1984).
35 M. Kojima, F. Toda, K. Hattori. Tetrahedron Lett. 21,2721 (1980).
36 J. Sudimack, R J. Lee: Advanced Drug Delivery Reviews 41, 147-162 (2000).
37 M. Hidaka and T. Kanematsu: Journal Of Bioactive and Compatible Polymers 21,
591-602 (2006).
38 A. Gliszczynska-Swiglo and M. Muzolf. J. Agric. Food Chem. 55, 8237-8242
(2007).
39 J. R. Bertino Cancer Research 23, 1286-1306, (1963).
401. Juillerat-Jeanneret, F. Schmitt. Medicinal Research Reviews 27, 4, 574-590 (2007).
41 D. Chandrasekar, R. Sistla, F. J. Ahmad, R. K. Khar, P. V. Diwan. Journal of
Biomedical Materials Research Part A 10, 1002-1009 (2007).
42 B. Stella, S.Arpicco, M. T. Peracchia, D. DesmaeLe, J. Hoebeke, M. Renoir, J.
D'angelo, 1. Cattel, P. Couvreur. Journal Of Pharmaceutical Sciences 89, 11, 1452-
1464 (2000).
43 Y. Suna, Y. Penga, Y. Chenb, A. J. Shuklaa. Advanced Drug Delivery Reviews 55,
1201-1215 (2003).
44 R Challa, A. Ahuja, J. Ali, and RK. Khar. AAPS PharmSciTech 6 (2), Article 43
(2005).
90

45 F. Hirayama, K. Uekama. Advanced Drug Delivery Reviews 36,125-141 (1999).
46 L J. Majoros, T. P. Thomas, C. B. Mehta and J. R. Baker Jr .. J Med. Chem. 48, 5892-
5899 (2005).
47 Z. Szakacs and B. NoszaL Electrophoresis 27, 3399-3409 (2006).
48 C. P. Leamon, L Pastan and P. Low. The Journal Of Biological Chemistry 268, 33,
25,24847-24854 (1993).
49 W. Zhou, X. Yuan, A Wilson, L. Yang, M. Mokotoff, B. Pitt and S. Li. Biocorifugate
Chem. 13, 1220-1225 (2002).
50 K. C. Cho, S. H. Kim, 1. H. Jeong and T. G. Park. Macromo!' Biosci. 5, 512-519
(2005).
51 1. A. Reddy, D. Dean, M. D. Kennedy and P. S. Low. Journal of Pharmaceutical
Sciences 88, 11,343-350 (1999).
~ , C. J. Sunderland, M. Steiert, 1. E. Talmadge, A M. Derfus and S., E. Barr. Drug
Development Research 67, 70-93 (2006).
53 R. J. Lee and P. S. Low. Biochimica et Biophysica Acta 1233,134-144 (1995).
54 P. Caliceti, S. Salmaso, A. Semenzato,T. Carofiglio, R. Fomasier, M. Fermeglia, M.
Ferrone and S. PricL Bioconjugate Chem. 14, 899-908 (2003).
55 S. Salmaso, A. Semenzato and P. Caliceti. Bioconjugate Chem. 15, 997-1004 (2004).
56 S. Wang, R. J. Lee, C. 1. Mathias, M. A. Green and P. S. Low. Bioconjugate Chem. 7,
56-62 (1996).
57 S. Wang, 1. Luo, D. A Lantrip, D. J. Waters, C. 1. Mathias, M. A. Green, P. 1. Fuchs
and P. S. Low. Bioconjugate Chem. 8,673-679 (1997).
91

58 J. M. Benns, R. r. Mahato and S. W. Kim. Journal a/Controlled Release 79, 255-269
(2002).
59 F. Hacket, S. Simova and H. J. Schneider. J Phys. Org. Chern. 14, 159-170 (2001).
60 A. Cuzzola, L. Panelli, A. Raffaelli, G. Uccello-Barretta, F. Balzanoa and P.
Salvatori. Carbohydrate Research 341, 2126-2130 (2006).
61 J. L. Atwood and J. M. Lehn. Comprehensive Supramolecular Chemistry, Eds., Vol.
3, Cyclodextrins, Szejtli J., Osa T., Eds., Pergamon: Oxford U,K(1996).
62 KA Martin and A. W. Czarnik. Tetrahedron Lett. 35,6781-6781 (1994).
63 N. Zhong, H. S. Byun and R. Bittman. Tetrahedron Lett. 39,2919-2925 (1998).
64 R. C. Petter, J. S. Salek, C. T. Sikorski, G. Kumaravel and F. T. Lin. J Am. Chern.
SOc. 112,3860-3868 (1990).
65 R. P. Bonomo, V. Cucinotta, F. D'Alessandro, G. Impellizzeri, G. Maccarrone, Gi
Vecchio and E. Rizzarelli. Inarg. Chern. 30, 2708-2713 (1991).
66 H. J. Schneider and F. Xiao. J Chern. Soc. Perkin Trans. 2, 387-391 (1992).
67 B. Di Blasio, S. Galdiero, M. Saviano, C. Pedone, E. Benedetti, E. Rizzarelli, S.
Pedotti, G. Vecchio and W. A. Gibbons. Carbohydrate Research 282, 41-52 (1996).
68 B. Wu, Q. Wang, Q. Liu, J. Xie and L. Yun. Electrophoresis 26, 1013-1017 (2005).
69 B. Wu, Q. Wang, L. Guo, R. Shen, J. Xie, L. Yun and B. Zhong. Analytica Chirnica
Acta 558, 80-85 (2006).
70 V. Cucinotta, F. D'Alessandro, G.lmpellizzeri and G. Vecchio. J. Chern. Soc., Chern.
Cornmun. 1, 1743-1745 (1992).
92
71 R. Corradini, A. Dossena, G. Impellizzeri, G. Maccarrone, R. Marchelli, E. Rizzarelli,
G. Sartor and G. Vecchio. JAm. Chem. Soc. 116, 10267-10274 (1994).
72 B. L. May, S. D. Kean, C. 1. Easton and S. F. Lincoln. J Chem. Soc., Perkin Trans. 1,
3]57-3160 (1997).
73 T. Aoyagi, A. Nakamura, H. Ikeda, T. Ikeda, H. Mihara and A. Deno. Anal. Chem.
69,659-663 (1997).
74 Y. Y. Liu, X. D. Fan and L. Gao. Macromol. Biosci. 3,715-719 (2003).
751. B. Lamber and E. P. Mazzola. Nuclear Magnetic Resonance Spectroscopy. Pearson
Education Inc. New Jersey 1994, pp. 1-5
76 R. B. Silverstein and F. X. Webster. Spectrometri Identification of Organic
Compound. Wiley, Sixth Ed. New York 1991, pp. 152-153.
77 G. Gauglitz and T. Vo-Dinh. Handbook of Spectroscopy. WlLEY-VCH Verlag
GmbH & Co. KGaA, Weinheim, 2003, pp. 39-44.
78 F. A. Carey. Organic Chemistry. Fourth Edition. McGraw-Hill Companies 2001, pp.
522-526.
79 G. Montaudo and R. Lattimer. Mass spectrometry of polymers. CRC Press, New
York, 2002, pp. 17-32.
80 J. Roboz, Mass Spectrometry Instrumentation And Techniques, Ed. Intersience
Publisher, New York, pp-65-75 (1968).
81 http://en.wikipedia.org/wikiIMALDI, on March 2008
82 A. Kraj, T. Dylagl, A. Gorecka-Drzazga, S. Bargiel, J Dziuban and J Silberring. Acta
Bfochimfca Polonica 50, 783-787 (2003).
93
83 Watson, J. L. Introduction to Mass spectrometry, Lippencott-Raven, New York,
1997, 3rd ed.
84 J. D. Reed, C. G. Krueger and M. M. Vestiing. Phytochemistry 66, 2248-2263
(2005).
85 M. Fernandez, A. Fragoso, R. Caob and R. Villalonga. Journal of Molecular
Catalysis B: Enzymatic 21,133-141 (2003).
86 C. Bonechi, A. Donati, R. Lampariello, S. Martini, M.P. Picchi, M. Ricci and C.
Rossi. Spectrochimica Acta Part A 60, 1411-1419 (2004).
87 Y. Bae, W. D. Jang, N. Nishiyama, S. Fukushima and K. Kataoka. Mol. BioSyst. 1,
242-250 (2005).
88 http://riodbOl.ibase.aist.go.jp/sdbs/cgi-binlcreindex.cgi?lanw=eng, Spectral Database
for Organic Compounds, SDBS, on December 2007
89 C. F. Potter, N. R. Russell and M. McNamara. Journal of Inclusion Phenomena and
Macrocyclic Chemistry 56, 395-403 (2006).
90 B. S. Furniss, A. 1. Hannaford, P. W. G. Smith and A. R. Tatchell. Vogel's Textbook
ofPratrical Organic Chemistry. Longman Group Edition, Essex 1989.
91 M. K. Off, A. E. Steindal, A. C. Porojnicu, A. Juzeniene, A. Vorobey, A. Johnsson
and J. Moan. Journal of Photochemistry and Photobiology B: Biology 80, 47-55
(2005).
92 M. T. Nguyen, Indr.awati and M. Hendrickx. J Agric. Food Chem. 51, 3352-3357
(2003).
94

93 M. Der-Petrossian,M. Fodinger, R. Knobler, H. Honigsmimn and F. Trautinger.
British Journal of Dermatology 156 pp117-121 (2007).
94 M. Jamil Akhtar, M. Ataullah Khan and I. Ahmad. Journal of Pharmaceutical and
Biomedical Analysis 25, 269-275 (1999).
95 AH. Thomas, G. Suarez, F. M. Cabrerizo, F. S. Garcia Einschlag, R. Martino, C.
Baiocchi, E. Pramauro and A L. Capparelli. Helvetica Chimica Acta 85, 2300-2315
(2002).
96 http://en.wikipedia.org/wiki/HPLC, on February 2008
97 S. Kromidas. Pratical Problem solving in HPLC. Wiley-VCH, Weinheim 2000, p.5-6
98 http://emeraldinsight.comllnsightIViewContentServlet?Filename=Publishedl
EmeraldFullTextArticlel Articles/0870250 I 05.html, on November 2008
99 S. D. Wilson and Donald W. Horne. Biochemistry 80, pp. 6500-6504 (1983).
100 E. S. Osseyi, R. L. Wehling and J. A Albrecht. Journal of Chromatography A 826,
235-240 (1998).
101 U. Holler, C. Brodhag, A. Knobel, P. Hofmarm and V. Spitzer. Journal of
Pharmaceutical and Biomedical Analysis 31,151-158 (2003).
102 J. Alaburda, A. P. de Almeida, L. Shundo, V. Ruvieri and M. Sabino. Journal of
Food Composition and Analysis 21,336-342 (2008).
103 M. Jamil Akhtar, M. Ataullah Khan and Iqbal Ahmad. Journal of Pharmaceutical
and Biomedical Analysis 16, 95-99 (1997).
104 R. Amidzic, Z. Jasminabrboric, O. Cudina and S. Vladimirov. J Serb. Chern. Soc.
70, 10, 1229-1235 (2005).
95
105 R. Poo-Prieto, D. B. Haytowitz, J. M. Holden, G. Rogers, S. F. Choumenkovitch, P.
F. Jacques and J. Selhub. The Journal o/Nutrition 136, 3079-3083 (2006).
106 S. Ruggeria, L. T. Vahteristo, A. Aguzzi, P. Finglas and E. Carnevale. Journal 0/
Chromatography A 855, 237-245 (1999). - ...
107 C. M. Pfeiffer, L. M. Rogers and J. F. Gregory III. J. Agric. Food Chem. 45, 407-413
(J 997).
108 R. F. Doherty and G. R. Beecher. J. Agric. Food Chem. 51,354-361 (2003).
109 A. Gabizon, A. T. Horowitz, D. Goren, D. Tzemach, F. Mandelbaum-Shavit, M. M.
Qazen and S. Zalipsky. Bioconjugate Chem. 10,289-298 (1999).
110 A. Bettio, M. Honer, C. Muller, M. Bruhlmeier, U. Muller, R. Schibli, V. Groehn, A
P. Schubiger, and S. M. Ametamey. J Nucl Med 47,1153-1160 (2006).
III J. Fan, L. E. Pope, K. S. Vitols, and F. M. Huennekens. Biochemistry 30,4573-4580
(1991).
112 S. Wang, J. Luo, D. A. Lantrip, D. J. Waters, C. J. Mathias, M.A Green, P. L. Fuchs
and P. S. Low. Bioconjugate Chem. 8,673-679 (1997).
113 P. Caliceti, S. Salmaso, A Semenzato, T. Carofiglio, R. Fomasier, M Fermeglia, M.
Ferrone, S. Pricl. Bioconjugate Chem. 14, 899-908 (2003).
114 F. M. Cabrerizo, M. L. Dantola, AH. Thomas, C. Lorente, AM. Braun, E. Oliveros
and A. L. Capparelli. Chemistry & Biodiversity 1,1800-1811 (2004).
115 E. K. Park, S. Y. Kim, S. B. Lee and Y. M. Lee. Journal o/Controlled Release 109,
1-3,158-168, (2005).
96
116 Y. Zhang, L. Guo, R. W. Roeske and H. N. Jayaram. Analytical Biochemistry 332, 1,
168-117 (2004).
117 Q. Zhang, G. Xiang, Y. Zhang, K. Yang, W. Fan, J. Lin, F. Zeng and 1. Wu. J Pharm
Sci. 95, 10,2266-75 (2006) . . "
118 C. Sun, R. Sze and M. Zhang. J Biomed Mater Res A. 78,3,550-7 (2006).
119 S. F. Atkinson, T. Bettinger, L. W. Seymour, J. P. Behr and C. M. Ward. J BioI
Chem. 276,30,27930-5 (2001).
120 http://en.wikipedia.org/wikilHeLa, on December 2007.
121 F. Sonvico, C. Dubemet, V. Marsaud, M. Appel, H. Chacun, B. Stella, M. Renoir, P.
Colombo and P. Couvreur. Journal Of Drug Delivery Science And Technology 15, 6,
407 -410 (2005).
122 C. P. Leamon and Philip S. Low. J Biochem. 291,855-860 (1993)
123 S. Mohapatra, S. K. Mallick, T.K. Maiti, S. K. Ghosh and P. Pramanik.
Nanotechnology 18,385102 (2007).
124 http://en.wikipedia.org/wiki/Cytology, on December 2007.
125 http://en.wikipedia.org/wiki/Trypan blue, on January 2008
126 F. Belloc, P. Dumain, M.R. Boisseau, C. Jalloustre, J. Reiffers, P. Bernard and F.
Lacombe. Cytometry 17,59-65 (1994).
127 S. Allen, J. Sotos, M. J. Sylte and C. J. Czuprynski. Clinical And Diagnostic
Laboratory Immunology 8, 2, 460-464 (2001).
128 R. Freshney. Culture of Animal Cells: A Manual of Basic Technique, p.ll7, Alan R.
Liss, Inc., New York. (1987).
97
129 S. Rozou, S. Michaleas and E. Antoniadou-Vyza. Journal o/Chromatography A 1-
2, 1087, 86-94 (2005).
1)0 R. Stancanelli, A. Mazzaglia, S. Tommasini, M. L. Calabro, V. Villari, M. Guardo,
P. Ficarra and R. Ficarra. Journal o/Pharmaceutical and Biomedical Analysis 44,980-
.984 (2007).
1)1 V. Cucinotta, A. GiuffridaA, G. Grasso, G. Maccarrone, A. Mazzaglia and G.
Vecchio. Fresenius J Anal Chem. 370 (4), 363-366 (2001).
132 R. P. Bonomoa, G. Maccarronea, E. Rizzarelli and G. Vecchio. Inorganica Chimica
Acta 339,455-460 (2002).
IJJ W. R. Browne, C. M. O'Connor, C. Villani and J. G. Vos. Inorg. Chem. 40,5461-
5464 (2001).
134 W. R. Browne, N. M. O'Boyle, W. Henry, A. L. Guckian, S. Horn, T. Fett, C. M.
O'Connor, M. Duati, L. De Cola, C. G. Coates, K. L. Ronayne, J. J. McGarvey and J.
G. Vos. J. Am. Chern. Soc. 127,1229-1241 (2005).
135 S. Fanni, T. E. Keyes, C. M. O'Connor, H. Hughes, R. Wang and J. G. Vos.
Coordination Chemistry Reviews 208, 77-86 (2000).
136 L. Monsi! Scolaro,A. Mazzaglia, A. Romeoa and.R. Romeo. Journal 0/ Inorganic
Biochemistry 91,237-245 (2002).
137 L. Monsi! Scolaro, A. Mazzaglia, A. Romeo, M. R. Plutino, M. Castriciano and R.
Romeo. Inorganica Chimica Acta 330, 189-196 (2002).
138 A. Thomas, E. Wolcan, M. R. Fealiza and A. L. Capparelli. Transition Met.
Chem.22, 541-544 (1997).
98
139 A. Mazzaglia, B. 1. Ravoo, R. Darcy, P. Gambadauro and F. Mallamace. Langmuir
18, 1945-1948 (2002).
140 D. Lombardo, A. Longo, R. Darcy and A. Mazzaglia. Langmuir 20, 1057-1064
(2004).
141 S. McNicholas, A. Rencurosi, L. Lay, A. Mazzaglia, L. Sturiale, M. Perez and R.
Darcy. Biomacromolecules 8,1851-1857 (2007).
99