synthesis, infra-red, cp/mas-nmr characterization, structural study and electrical properties of the...
TRANSCRIPT
Journal of Molecular Structure 1049 (2013) 48–58
Contents lists available at SciVerse ScienceDirect
Journal of Molecular Structure
journal homepage: www.elsevier .com/locate /molstruc
Synthesis, Infra-red, CP/MAS-NMR characterization, structural studyand electrical properties of the bis(4-amino-2-chloropyridinium)tetrachlorozincate (II) monohydrate
0022-2860/$ - see front matter � 2013 Elsevier B.V. All rights reserved.http://dx.doi.org/10.1016/j.molstruc.2013.06.003
⇑ Corresponding author. Tel.: +216 96068315.E-mail address: [email protected] (R. Zouari).
Najla Karâa, Besma Hamdi, Abdelhamid Ben Salah, Ridha Zouari ⇑Laboratoire des Sciences des Matériaux et de l’Environnement, Faculté des Sciences de SFAX, Université de Sfax, PB 1171-3000 SFAX, Tunisia
h i g h l i g h t s
� Synthesis of a new organic inorganic material.� Study by physic–chemical analysis.� Interesting dielectric study.
a r t i c l e i n f o
Article history:Received 7 April 2013Received in revised form 1 June 2013Accepted 3 June 2013Available online 10 June 2013
Keywords:Organic–inorganic hybridX-ray diffractionPyridineInfrared spectroscopyNMRImpedance spectroscopy
a b s t r a c t
Single crystals of the new ionic salt bis(4-amino-2-chloropyridinium) tetrachlorozincate (II) monohy-drate, (C5H6N2Cl)2 ZnCl4�H2O, were grown by slow evaporation from aqueous solution at room temper-ature. The compound was characterized by IR, thermal analysis (TGA-DSC), single crystal X-raydiffraction, CP/MAS-NMR and impedance spectroscopy. The structure (4-amino-2-chloropyridinium)2
ZnCl4�H2O, [(CAP)2ZnCl4�H2O], consists of isolated H2O, isolated [ZnCl4]2� tetrahedral anions and 4-amino-2-chloropyridinium [C5H6N2Cl] + cations, CAP, which are connected together via N–H� � �Cl, N–H� � �O ((N: pyridinium) and (N: amine)), O–H� � �Cl and C–H� � �Cl hydrogen bonds. Cation–cation, offset-face-to-face interactions (p�p stacking) between identical antiparallel CAP (aromatic–aromatic), inwhich they may be effective in the stabilization of the crystal structure. Solid state CP/MAS-NMR spectrashowed five isotropic resonances, 13C, confirming the solid state structure determined by X-ray diffrac-tion. Impedance spectroscopy study, reported for a single crystal, revealed that the conduction in thematerial was due to a hopping process. This work aims to reveal the thermal properties of a new zinc(II) based organic–inorganic hybrid and the conductivity properties that these compounds exhibit.
� 2013 Elsevier B.V. All rights reserved.
1. Introduction
Design and synthesis of organic–inorganic hybrid solids basedon the concept of crystal engineering have attracted much atten-tion in organic–inorganic hybrid materials and supramolecularchemistry because of their magnetic, electronic and optical proper-ties as well as the possibility of turning both coordination geome-try and functional properties by variation of organic componentsand metal ions [1–7]. Crystallizing of azoaromatic molecules bear-ing bifunctional sites along with the transition metals is, in general,a simple strategy to the generation of transition metal salts withdesired stacking structures and non-covalent interactions amongcomponents. The research in the field of organic–inorganic hybridmaterials with pyridine and its derivatives as templating agents
has led to the preparation of some materials with interesting phys-ical properties [8–10]. The Zinc complexes exhibits a wide range ofcoordination numbers and geometries (tetrahedral [11], trigonalbipyramidal [12] and octahedral [13]) because of the closed shelland relatively large coordination distances of Zn(II).
In furtherance of previous work [14,15] on hybrid compoundscontaining metal (II) halide anions with pyridinium substituted cat-ions, herein we describe the crystallization of (4-amino-2-chloro-pyridinium)2 tetrachlorozincate (II) monohydrate, (C5H6N2Cl)2
ZnCl4�H2O, along with its crystal packing analyses. We haveperformed X-ray diffraction measurements providing us with infor-mation about the complete crystal structure at room temperatureof the new compound. This structural study is accompanied byspectroscopy and calorimetric and CP/MAS-NMR measurementsand the conductivity properties that these compounds exhibit.

N. Karâa et al. / Journal of Molecular Structure 1049 (2013) 48–58 49
2. Experimental section
2.1. Synthesis of [CAP]2 ZnCl4�H2O Compound
The first step of the synthesis of the material was the prepara-tion of 4-amino-2-chloropyridiniumchloride ([CAP]+, Cl�) solutionwas formed by addition of an aqueous solution of 38% HCl (8 ml)to 4-amino-2-chloropyridine (C5H5N2Cl) (2.33 mmol). The driedprecipitates were then washed with diethyl ether in order to re-move unreacted substances. The next step was the formation ofthe desired compounds: stoichiometric 2:1 amounts of ([CAP]+,Cl�) and ZnCl2 (1.165 mmol) were dissolved. After several weeks,colorless plate-shaped crystals were obtained by evaporation atroom temperature. A single crystal suitable for X-ray diffractionanalysis was selected and studied.
Table 1Summary of crystal data, intensity measurements and refinement parameters for[CAP]2 ZnCl4�H2O crystal.
Crystal dataEmpirical formula (NH2C5H3ClNH)2
ZnCl4�H2OFormula weight 48,434 (g/mol)Crystal system TriclinicSpace group P-1Hall symbol �P1
Unit cell dimensions
2.2. Instrumentations
2.2.1. IR and Raman measurementsThe Infrared spectrum was recorded in the range 400–
4000 cm�1 with a ‘‘Nicole Impact 410 FT-IR’’ spectrophotometerusing a sample dispersed in spectroscopically pure KBr pellets.The pellets were prepared by mixing 15 mg of powder sample with300 mg of KBr (The KBr dried at 110 �C) and compressing thewhole into a disk. The heating of the [(CAP)2ZnCl4�H2O], pellet inthe temperature range 298–425 K; with a heating rate of10 K min�1, was performed in an air-atmosphere Spectac heatingcell. A thermocouple Eurotherm Regler was used for the tempera-ture measurements. The Raman spectra of polycrystalline sampleswas recorded between 4000 and 50 cm�1 employing LABRAMHR800 triple monochromator instrument using the 514.5 nm linespectra-physics argon ion laser.
a (Å) 7.135(9)b (Å) 8.0993(12)c (Å) 16.924(2)c (�) 74.686(8)�Volume (Å3) 931.5(2)Z 2Dcalc (mg m�3) 1.720Absorption coefficient (mm�1) 2.182F(000) 484Crystal dimensions (mm) 0.40 � 0.23 � 0.18Crystal color Prism, colorlessh Range for data collection (�) 2.3–20.3
2.2.2. Calorimetric measurementsDSC measurement was performed from 300 to 450 K on a NET-
ZSCH apparatus (Model 204 Phoenix) at a heating rate of5 K min�1. The thermal analyses (TGA) were made on a Perkin El-mer Pyris 6 TGA thermogravimetric analyser. Calorimetric mea-surements were performed between 298 and 423 K on a MettlerToledo DSC 822e calorimeter with a heating rate of 5 K min�1
and a sensitivity of 200 lV mW�1.
Data collectionReflections collected 8436Independent reflections 4694 [Rint = 0.0184]Reflections with I > 2r(I) 3694
h = �9 ? 9Limiting indices k = �10 ? 10
l = �22 ? 22CCD area detector diffractometer Radiationsource: fine-focus sealedtube Graphite u and x scans Absorptioncorrection: multi-scanNorth, Phillips & Mathews (1968)
Tmin = 0.425,Tmax = 0.531
hmax = 28.36�,hmin = 1.22�
RefinementRefinement method Full-matrix least-
squares on F2
R[F2 > 2r(F2)] 0.0531wR(F2) 0.123
2.2.3. Spectroscopic measurementThe CP/MAS-NMR experiments were performed at room tem-
perature on a Bruker MSL 300 spectrometer operating at75.48 MHz for 13C. The powdered sample was packed in a 4 mmdiameter rotor and allowed to rotate at speeds up to 10 kHz in aDoty MAS probehead. During the whole acquisition time, the spin-ning rate of the rotor was locked to the required value thanks tothe Bruker pneumatic unit which controls both bearing and driveinlet nitrogen pressures. The spectra were acquired by the use ofcross-polarization for proton with 5 ms contact time. All chemicalshifts (d) are given with respect to tetramethylsilane, according tothe IUPAC convention, i.e. shielding corresponds to negative val-ues. Spectrum simulation was performed by using Bruker WINFITsoftware [16]. The chemical synthesis is reproducible, and the for-mula of the material is determined by structural refinement.
Goodness-of-fit on F2 S = 1.25Data/restraints/parameters 1589/0/97
Primary atom site location: structure-invariant direct methods; Secondary atomsite location: difference Fourier map.Hydrogen site location: inferred from neighboring sites H-atom parametersconstrained.w = 1/[r2(Fo2) + (0.1175P)2 + 0.0000P] where P = (Fo2 + 2Fc2)/3(D/r)max < 0.001Extinction correction: SHELXL.
2.2.4. Electrical measurementsThe electrical measurements were performed using a two elec-
trode configuration on polycrystalline samples. The polycrystallinesample was pressed into pellets of 8 mm diameter and 0.9 mmthickness. Electrical impedances were measured in a frequencyranging from 209 Hz to 5 MHz with the TEGAM 3550 ALF
automatic bridge monitored by a microcomputer between 391and 423 K.
2.3. Crystal chemistry
The chemical analysis of zinc and chloride atoms performedaccording to confirm the formula determined by structural refine-ment [17]. The density of this compound was measured at roomtemperature. The average value of density measured (Dm =2.07(2) g cm�3) is in agreement with that calculated(Dx = 2.089 g cm�3).
2.4. Single-crystal X-ray diffraction
A suitable single crystal of the complex was glued to a cactusneedle mounted on a four-circle Bruker AXS CCD area detector dif-fractometer for data collection. Unit cell parameters were refinedusing sets of 780 reflections in the range 2.5 < h < 21.20�. Thecrystal data of the complex was collected at 292(2) K. Intensitydata were collected in the x � 2h scan mode using graphite
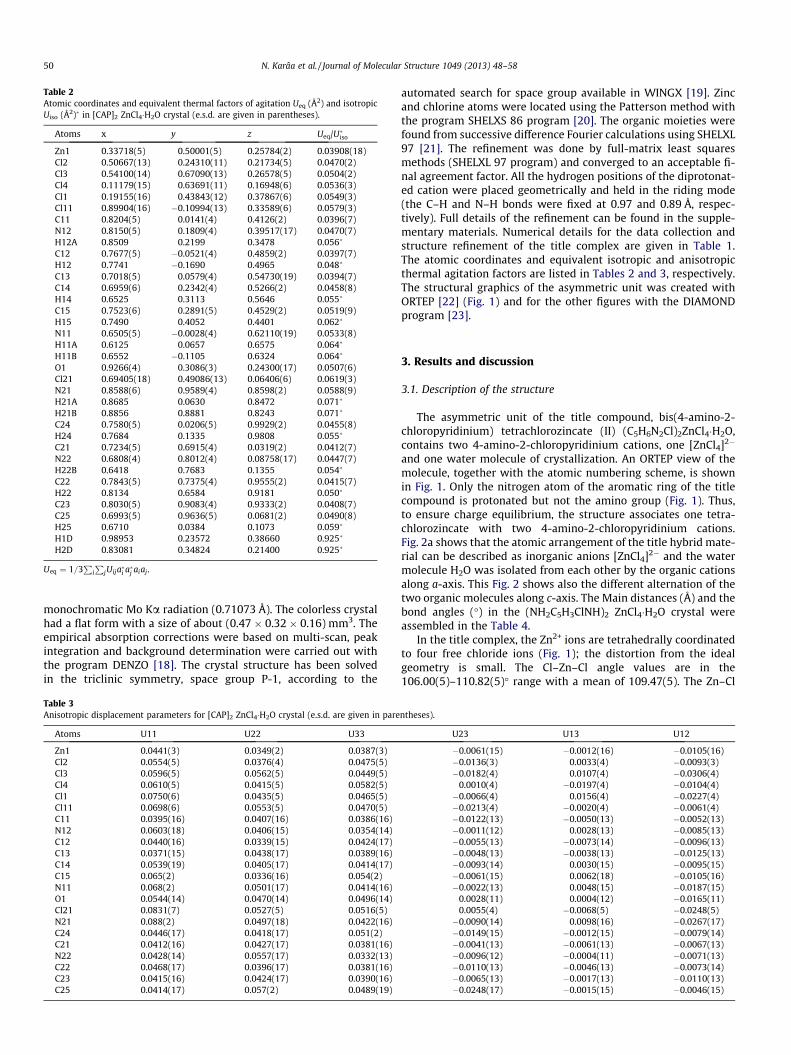
Table 2Atomic coordinates and equivalent thermal factors of agitation Ueq (Å2) and isotropicUiso (Å2)� in [CAP]2 ZnCl4�H2O crystal (e.s.d. are given in parentheses).
Atoms x y z Ueq/U�iso
Zn1 0.33718(5) 0.50001(5) 0.25784(2) 0.03908(18)Cl2 0.50667(13) 0.24310(11) 0.21734(5) 0.0470(2)Cl3 0.54100(14) 0.67090(13) 0.26578(5) 0.0504(2)Cl4 0.11179(15) 0.63691(11) 0.16948(6) 0.0536(3)Cl1 0.19155(16) 0.43843(12) 0.37867(6) 0.0549(3)Cl11 0.89904(16) �0.10994(13) 0.33589(6) 0.0579(3)C11 0.8204(5) 0.0141(4) 0.4126(2) 0.0396(7)N12 0.8150(5) 0.1809(4) 0.39517(17) 0.0470(7)H12A 0.8509 0.2199 0.3478 0.056�
C12 0.7677(5) �0.0521(4) 0.4859(2) 0.0397(7)H12 0.7741 �0.1690 0.4965 0.048�
C13 0.7018(5) 0.0579(4) 0.54730(19) 0.0394(7)C14 0.6959(6) 0.2342(4) 0.5266(2) 0.0458(8)H14 0.6525 0.3113 0.5646 0.055�
C15 0.7523(6) 0.2891(5) 0.4529(2) 0.0519(9)H15 0.7490 0.4052 0.4401 0.062�
N11 0.6505(5) �0.0028(4) 0.62110(19) 0.0533(8)H11A 0.6125 0.0657 0.6575 0.064�
H11B 0.6552 �0.1105 0.6324 0.064�
O1 0.9266(4) 0.3086(3) 0.24300(17) 0.0507(6)Cl21 0.69405(18) 0.49086(13) 0.06406(6) 0.0619(3)N21 0.8588(6) 0.9589(4) 0.8598(2) 0.0588(9)H21A 0.8685 0.0630 0.8472 0.071�
H21B 0.8856 0.8881 0.8243 0.071�
C24 0.7580(5) 0.0206(5) 0.9929(2) 0.0455(8)H24 0.7684 0.1335 0.9808 0.055�
C21 0.7234(5) 0.6915(4) 0.0319(2) 0.0412(7)N22 0.6808(4) 0.8012(4) 0.08758(17) 0.0447(7)H22B 0.6418 0.7683 0.1355 0.054�
C22 0.7843(5) 0.7375(4) 0.9555(2) 0.0415(7)H22 0.8134 0.6584 0.9181 0.050�
C23 0.8030(5) 0.9083(4) 0.9333(2) 0.0408(7)C25 0.6993(5) 0.9636(5) 0.0681(2) 0.0490(8)H25 0.6710 0.0384 0.1073 0.059�
H1D 0.98953 0.23572 0.38660 0.925�
H2D 0.83081 0.34824 0.21400 0.925�
Ueq ¼ 1=3P
iP
jUija�i a�j aiaj .
50 N. Karâa et al. / Journal of Molecular Structure 1049 (2013) 48–58
monochromatic Mo Ka radiation (0.71073 Å). The colorless crystalhad a flat form with a size of about (0.47 � 0.32 � 0.16) mm3. Theempirical absorption corrections were based on multi-scan, peakintegration and background determination were carried out withthe program DENZO [18]. The crystal structure has been solvedin the triclinic symmetry, space group P-1, according to the
Table 3Anisotropic displacement parameters for [CAP]2 ZnCl4�H2O crystal (e.s.d. are given in pare
Atoms U11 U22 U33
Zn1 0.0441(3) 0.0349(2) 0.0387(3)Cl2 0.0554(5) 0.0376(4) 0.0475(5)Cl3 0.0596(5) 0.0562(5) 0.0449(5)Cl4 0.0610(5) 0.0415(5) 0.0582(5)Cl1 0.0750(6) 0.0435(5) 0.0465(5)Cl11 0.0698(6) 0.0553(5) 0.0470(5)C11 0.0395(16) 0.0407(16) 0.0386(16)N12 0.0603(18) 0.0406(15) 0.0354(14)C12 0.0440(16) 0.0339(15) 0.0424(17)C13 0.0371(15) 0.0438(17) 0.0389(16)C14 0.0539(19) 0.0405(17) 0.0414(17)C15 0.065(2) 0.0336(16) 0.054(2)N11 0.068(2) 0.0501(17) 0.0414(16)O1 0.0544(14) 0.0470(14) 0.0496(14)Cl21 0.0831(7) 0.0527(5) 0.0516(5)N21 0.088(2) 0.0497(18) 0.0422(16)C24 0.0446(17) 0.0418(17) 0.051(2)C21 0.0412(16) 0.0427(17) 0.0381(16)N22 0.0428(14) 0.0557(17) 0.0332(13)C22 0.0468(17) 0.0396(17) 0.0381(16)C23 0.0415(16) 0.0424(17) 0.0390(16)C25 0.0414(17) 0.057(2) 0.0489(19)
automated search for space group available in WINGX [19]. Zincand chlorine atoms were located using the Patterson method withthe program SHELXS 86 program [20]. The organic moieties werefound from successive difference Fourier calculations using SHELXL97 [21]. The refinement was done by full-matrix least squaresmethods (SHELXL 97 program) and converged to an acceptable fi-nal agreement factor. All the hydrogen positions of the diprotonat-ed cation were placed geometrically and held in the riding mode(the C–H and N–H bonds were fixed at 0.97 and 0.89 Å, respec-tively). Full details of the refinement can be found in the supple-mentary materials. Numerical details for the data collection andstructure refinement of the title complex are given in Table 1.The atomic coordinates and equivalent isotropic and anisotropicthermal agitation factors are listed in Tables 2 and 3, respectively.The structural graphics of the asymmetric unit was created withORTEP [22] (Fig. 1) and for the other figures with the DIAMONDprogram [23].
3. Results and discussion
3.1. Description of the structure
The asymmetric unit of the title compound, bis(4-amino-2-chloropyridinium) tetrachlorozincate (II) (C5H6N2Cl)2ZnCl4�H2O,contains two 4-amino-2-chloropyridinium cations, one [ZnCl4]2�
and one water molecule of crystallization. An ORTEP view of themolecule, together with the atomic numbering scheme, is shownin Fig. 1. Only the nitrogen atom of the aromatic ring of the titlecompound is protonated but not the amino group (Fig. 1). Thus,to ensure charge equilibrium, the structure associates one tetra-chlorozincate with two 4-amino-2-chloropyridinium cations.Fig. 2a shows that the atomic arrangement of the title hybrid mate-rial can be described as inorganic anions [ZnCl4]2� and the watermolecule H2O was isolated from each other by the organic cationsalong a-axis. This Fig. 2 shows also the different alternation of thetwo organic molecules along c-axis. The Main distances (Å) and thebond angles (�) in the (NH2C5H3ClNH)2 ZnCl4�H2O crystal wereassembled in the Table 4.
In the title complex, the Zn2+ ions are tetrahedrally coordinatedto four free chloride ions (Fig. 1); the distortion from the idealgeometry is small. The Cl–Zn–Cl angle values are in the106.00(5)–110.82(5)� range with a mean of 109.47(5). The Zn–Cl
ntheses).
U23 U13 U12
�0.0061(15) �0.0012(16) �0.0105(16)�0.0136(3) 0.0033(4) �0.0093(3)�0.0182(4) 0.0107(4) �0.0306(4)
0.0010(4) �0.0197(4) �0.0104(4)�0.0066(4) 0.0156(4) �0.0227(4)�0.0213(4) �0.0020(4) �0.0061(4)�0.0122(13) �0.0050(13) �0.0052(13)�0.0011(12) 0.0028(13) �0.0085(13)�0.0055(13) �0.0073(14) �0.0096(13)�0.0048(13) �0.0038(13) �0.0125(13)�0.0093(14) 0.0030(15) �0.0095(15)�0.0061(15) 0.0062(18) �0.0105(16)�0.0022(13) 0.0048(15) �0.0187(15)
0.0028(11) 0.0004(12) �0.0165(11)0.0055(4) �0.0068(5) �0.0248(5)�0.0090(14) 0.0098(16) �0.0267(17)�0.0149(15) �0.0012(15) �0.0079(14)�0.0041(13) �0.0061(13) �0.0067(13)�0.0096(12) �0.0004(11) �0.0071(13)�0.0110(13) �0.0046(13) �0.0073(14)�0.0065(13) �0.0017(13) �0.0110(13)�0.0248(17) �0.0015(15) �0.0046(15)

Fig. 1. The asymmetric unit in the [CAP]2 ZnCl4�H2O compound. Ellipsoid repre-sented at 50% probability level; only hydrogen atoms are not labeled.
Fig. 2. Packing diagram showing the alternation between different en
N. Karâa et al. / Journal of Molecular Structure 1049 (2013) 48–58 51
distances vary between 2.2497(14) and 2.2806(14) Å with a meanof 2.2678(14) Å (Table 4).
The different entities are held together by columbic attractionand multiple hydrogen bonds. The organic cations are linked tothe inorganic layers by N–H���Cl and C–H���Cl hydrogen bonds(Fig. 3, Table 5). The coordinated intermolecular in the solid stateare held together with N–H� � �Cl, N–H� � �O ((N: pyridinium) and(N: amine)), O–H� � �Cl and C–H� � �Cl hydrogen bonds. There is aweak p–p stacking interaction between neighboring aromaticrings of the cations with the centroid–centroid distance of3.635(2) Å (Fig. 4). This p-stacking interaction between pyridiniumcations is lighter than the one in bis(2-amino-5-methylpyridinium)tetrachlorozincate where the longest distance between the cen-troids is 3.54 Å [24].
However, previous study shows that a pyridinium cation alwayspossesses an expanded angle of C–N–C (Table 4) in comparisonwith the parent pyridine [25]. It is interesting to note that the Clatom of the organic cation, Cl21, is participating in the hydrogenbonding network by only one hydrogen bonds O–H� � �Cl21 = 2.73(5) Å.
Coordinated chlorine ions (Cl3) bond with two H cations via N–H� � �Cl to form infinite neutral zig-zag chains, which are crosslinked by crystalline water forming two-dimensional corrugatedstructure via O–H� � �Cl (H� � �Cl = 2.30(2) Å) with Cl2.
3.2. Infrared and Raman spectroscopy
Fig. 5 shows the superposition of the Infrared and Raman spec-trum of the product [CAP]2ZnCl4�H2O performed at room tempera-ture between 4000–400 cm�1 and 4000–50 cm�1 respectively. Anattempt to assign vibrational frequencies of groups of the organiccation is performed on the database literature [26–31]. The at-tempt of attribution is indicated in Table 6.
tities at (a) a-axis and (b) b-axis in [CAP]2 ZnCl4�H2O compound.

Table 4Main distances (Å) and bond angles (�) in the [CAP]2 ZnCl4�H2O crystal (e.s.d. are given in parentheses).
Distances (Å) Angles (�)
Tetrahedron [ZnCl4]2�
Zn1–Cl1 2.2502(9)Zn1–Cl2 2.2675(9)Zn1–Cl3 2.2812(9) Cl1–Zn1–Cl2 106.00(3)Zn1–Cl4 2.2719(10) Cl1–Zn1–Cl3 110.86(4)Cl1–Cl2 3.608(5) Cl1–Zn1–Cl4 110.66(4)Cl1–Cl3 3.732(5) Cl2–Zn1–Cl4 109.76(4)Cl1–Cl4 3.719(5) Cl2–Zn1–Cl3 110.73(4)Cl2–Cl3 3.743(5) Cl4–Zn1–Cl3 108.81(4)Cl2–Cl4 3.713(5)Cl3–Cl4 3.703(5)
Distances (Å) Angle (Å)
Water moleculeO1–H1D 0.8600 H1D–O1–H2D 104.00O1–H2D 0.8500
Distances (ÅA0
) Angles (�) Distances (ÅA0
) Angles (�)
1st Organic molecule 2nd Organic moleculeC11–C12–C13 119.2(2) C21–C22–C23 119.4(2)
C11–C12 1.351(3) C12–C13–C14 117.5(2) C21–C22 1.360(3) C22–C23–C24 117.0(2)C12–C13 1.430(3) C13–C14–C15 120.0(2) C22–C23 1.412(3) C23–C24–C25 119.6(2)C13–C14 1.406(3) N11–C13–C12 121.2(2) C23–C24 1.421(3) N21–C23–C22 121.7(2)C14–C15 1.344(4) N11–C13–C14 121.3(2) C24–C25 1.355(4) N21–C23–C24 121.3(2)N11–C13 1.319(3) N12–C11–C12 122.0(2) N21–C23 1.313(3) N22–C21–C22 121.9(2)N12–C11 1.346(3) N12–C15–C14 121.5(2) N22–C21 1.334(3) N22–C25–C24 121.6(2)N12–C15 1.367(3) C11–N12–C15 119.8(2) N22–C25 1.340(3) C21–N22–C25 120.4(2)Cl11–C11 1.709(4) Cl11–C11–C12 122.05(19) Cl21–C21 1.704(4) Cl21–C21–C22 122.49(18)
Cl11–C11–N12 115.94(17) Cl21–C21–N22 115.57(17)
Fig. 3. Packing diagram showing the two orientations of the cations in [CAP]2 ZnCl4�H2O. Dotted lines represent hydrogen bonds.
52 N. Karâa et al. / Journal of Molecular Structure 1049 (2013) 48–58
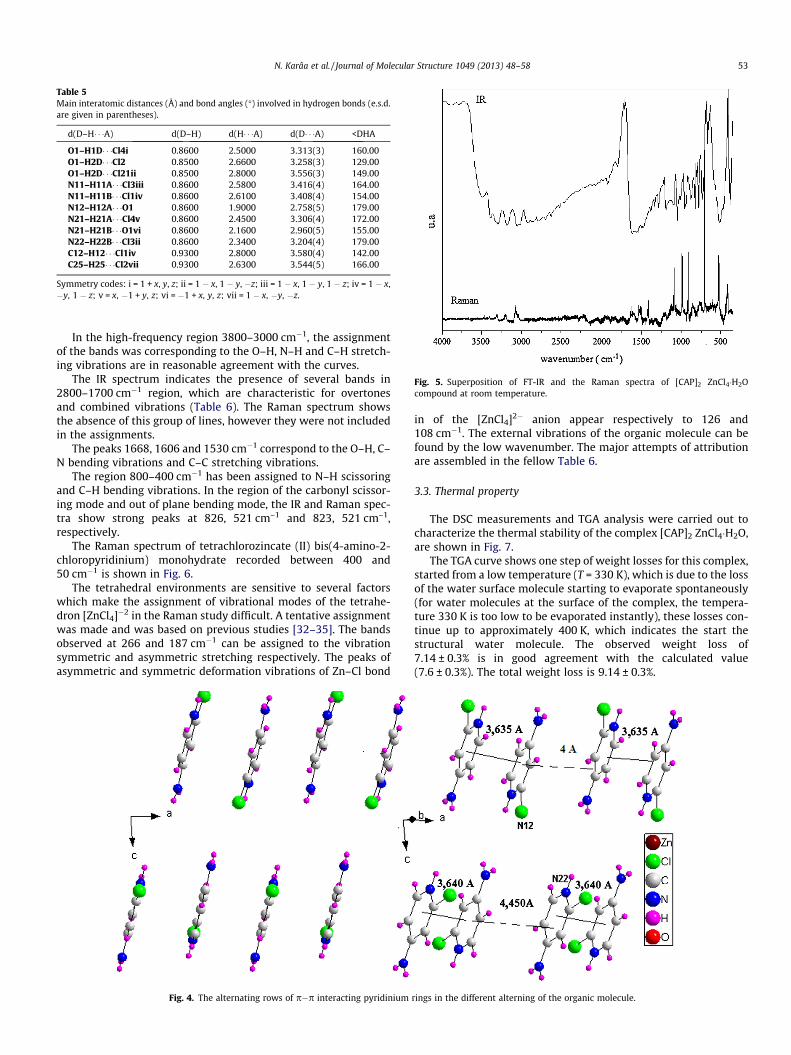
Table 5Main interatomic distances (Å) and bond angles (�) involved in hydrogen bonds (e.s.d.are given in parentheses).
d(D–H� � �A) d(D–H) d(H� � �A) d(D� � �A) <DHA
O1–H1D� � �Cl4i 0.8600 2.5000 3.313(3) 160.00O1–H2D� � �Cl2 0.8500 2.6600 3.258(3) 129.00O1–H2D� � �Cl21ii 0.8500 2.8000 3.556(3) 149.00N11–H11A� � �Cl3iii 0.8600 2.5800 3.416(4) 164.00N11–H11B� � �Cl1iv 0.8600 2.6100 3.408(4) 154.00N12–H12A� � �O1 0.8600 1.9000 2.758(5) 179.00N21–H21A� � �Cl4v 0.8600 2.4500 3.306(4) 172.00N21–H21B� � �O1vi 0.8600 2.1600 2.960(5) 155.00N22–H22B� � �Cl3ii 0.8600 2.3400 3.204(4) 179.00C12–H12� � �Cl1iv 0.9300 2.8000 3.580(4) 142.00C25–H25� � �Cl2vii 0.9300 2.6300 3.544(5) 166.00
Symmetry codes: i = 1 + x, y, z; ii = 1 � x, 1 � y, �z; iii = 1 � x, 1 � y, 1 � z; iv = 1 � x,�y, 1 � z; v = x, �1 + y, z; vi = �1 + x, y, z; vii = 1 � x, �y, �z.
Fig. 5. Superposition of FT-IR and the Raman spectra of [CAP]2 ZnCl4�H2Ocompound at room temperature.
N. Karâa et al. / Journal of Molecular Structure 1049 (2013) 48–58 53
In the high-frequency region 3800–3000 cm�1, the assignmentof the bands was corresponding to the O–H, N–H and C–H stretch-ing vibrations are in reasonable agreement with the curves.
The IR spectrum indicates the presence of several bands in2800–1700 cm�1 region, which are characteristic for overtonesand combined vibrations (Table 6). The Raman spectrum showsthe absence of this group of lines, however they were not includedin the assignments.
The peaks 1668, 1606 and 1530 cm�1 correspond to the O–H, C–N bending vibrations and C–C stretching vibrations.
The region 800–400 cm�1 has been assigned to N–H scissoringand C–H bending vibrations. In the region of the carbonyl scissor-ing mode and out of plane bending mode, the IR and Raman spec-tra show strong peaks at 826, 521 cm–1 and 823, 521 cm–1,respectively.
The Raman spectrum of tetrachlorozincate (II) bis(4-amino-2-chloropyridinium) monohydrate recorded between 400 and50 cm�1 is shown in Fig. 6.
The tetrahedral environments are sensitive to several factorswhich make the assignment of vibrational modes of the tetrahe-dron [ZnCl4]�2 in the Raman study difficult. A tentative assignmentwas made and was based on previous studies [32–35]. The bandsobserved at 266 and 187 cm�1 can be assigned to the vibrationsymmetric and asymmetric stretching respectively. The peaks ofasymmetric and symmetric deformation vibrations of Zn–Cl bond
Fig. 4. The alternating rows of p�p interacting pyridinium
in of the [ZnCl4]2� anion appear respectively to 126 and108 cm�1. The external vibrations of the organic molecule can befound by the low wavenumber. The major attempts of attributionare assembled in the fellow Table 6.
3.3. Thermal property
The DSC measurements and TGA analysis were carried out tocharacterize the thermal stability of the complex [CAP]2 ZnCl4�H2O,are shown in Fig. 7.
The TGA curve shows one step of weight losses for this complex,started from a low temperature (T = 330 K), which is due to the lossof the water surface molecule starting to evaporate spontaneously(for water molecules at the surface of the complex, the tempera-ture 330 K is too low to be evaporated instantly), these losses con-tinue up to approximately 400 K, which indicates the start thestructural water molecule. The observed weight loss of7.14 ± 0.3% is in good agreement with the calculated value(7.6 ± 0.3%). The total weight loss is 9.14 ± 0.3%.
rings in the different alterning of the organic molecule.
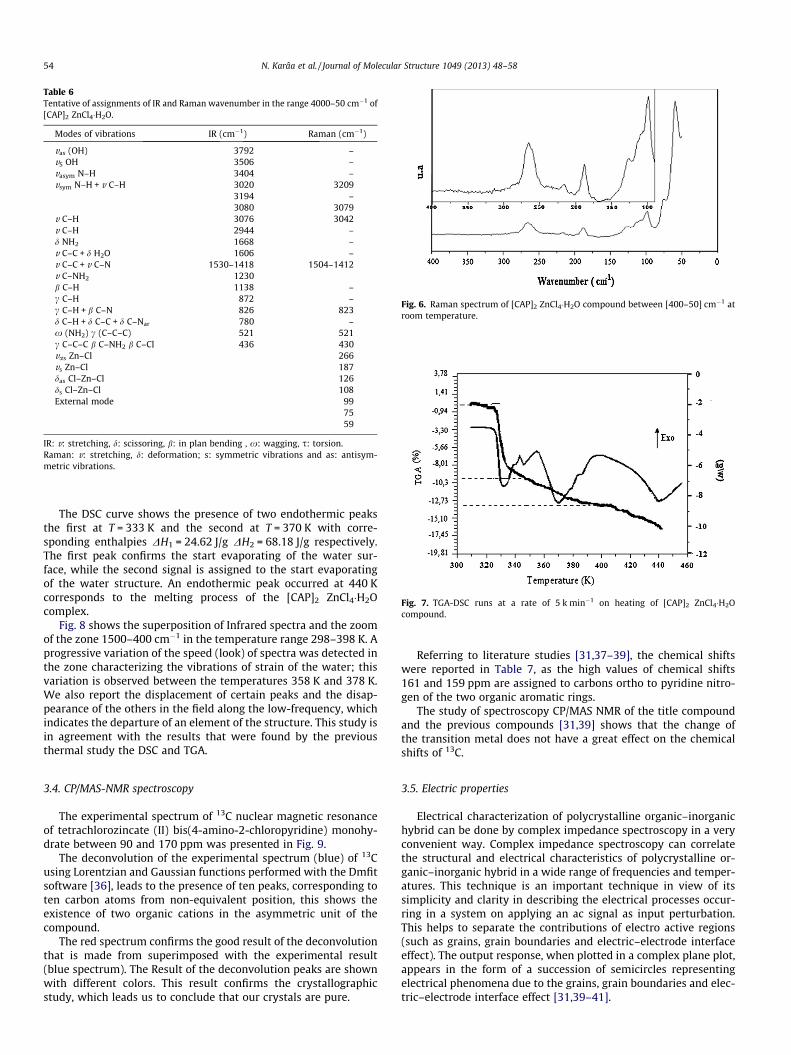
Table 6Tentative of assignments of IR and Raman wavenumber in the range 4000–50 cm�1 of[CAP]2 ZnCl4�H2O.
Modes of vibrations IR (cm�1) Raman (cm�1)
vas (OH) 3792 –vS OH 3506 –vasym N–H 3404 –vsym N–H + v C–H 3020 3209
3194 –3080 3079
v C–H 3076 3042v C–H 2944 –d NH2 1668 –v C–C + d H2O 1606 –v C–C + v C–N 1530–1418 1504–1412v C–NH2 1230b C–H 1138 –c C–H 872 –c C–H + b C–N 826 823d C–H + d C–C + d C–Nar 780 –x (NH2) c (C–C–C) 521 521c C–C–C b C–NH2 b C–Cl 436 430vas Zn–Cl 266vs Zn–Cl 187das Cl–Zn–Cl 126ds Cl–Zn–Cl 108External mode 99
7559
IR: v: stretching, d: scissoring, b: in plan bending , x: wagging, s: torsion.Raman: v: stretching, d: deformation; s: symmetric vibrations and as: antisym-metric vibrations.
Fig. 6. Raman spectrum of [CAP]2 ZnCl4�H2O compound between [400–50] cm�1 atroom temperature.
Fig. 7. TGA-DSC runs at a rate of 5 k min�1 on heating of [CAP]2 ZnCl4�H2Ocompound.
54 N. Karâa et al. / Journal of Molecular Structure 1049 (2013) 48–58
The DSC curve shows the presence of two endothermic peaksthe first at T = 333 K and the second at T = 370 K with corre-sponding enthalpies DH1 = 24.62 J/g DH2 = 68.18 J/g respectively.The first peak confirms the start evaporating of the water sur-face, while the second signal is assigned to the start evaporatingof the water structure. An endothermic peak occurred at 440 Kcorresponds to the melting process of the [CAP]2 ZnCl4�H2Ocomplex.
Fig. 8 shows the superposition of Infrared spectra and the zoomof the zone 1500–400 cm�1 in the temperature range 298–398 K. Aprogressive variation of the speed (look) of spectra was detected inthe zone characterizing the vibrations of strain of the water; thisvariation is observed between the temperatures 358 K and 378 K.We also report the displacement of certain peaks and the disap-pearance of the others in the field along the low-frequency, whichindicates the departure of an element of the structure. This study isin agreement with the results that were found by the previousthermal study the DSC and TGA.
3.4. CP/MAS-NMR spectroscopy
The experimental spectrum of 13C nuclear magnetic resonanceof tetrachlorozincate (II) bis(4-amino-2-chloropyridine) monohy-drate between 90 and 170 ppm was presented in Fig. 9.
The deconvolution of the experimental spectrum (blue) of 13Cusing Lorentzian and Gaussian functions performed with the Dmfitsoftware [36], leads to the presence of ten peaks, corresponding toten carbon atoms from non-equivalent position, this shows theexistence of two organic cations in the asymmetric unit of thecompound.
The red spectrum confirms the good result of the deconvolutionthat is made from superimposed with the experimental result(blue spectrum). The Result of the deconvolution peaks are shownwith different colors. This result confirms the crystallographicstudy, which leads us to conclude that our crystals are pure.
Referring to literature studies [31,37–39], the chemical shiftswere reported in Table 7, as the high values of chemical shifts161 and 159 ppm are assigned to carbons ortho to pyridine nitro-gen of the two organic aromatic rings.
The study of spectroscopy CP/MAS NMR of the title compoundand the previous compounds [31,39] shows that the change ofthe transition metal does not have a great effect on the chemicalshifts of 13C.
3.5. Electric properties
Electrical characterization of polycrystalline organic–inorganichybrid can be done by complex impedance spectroscopy in a veryconvenient way. Complex impedance spectroscopy can correlatethe structural and electrical characteristics of polycrystalline or-ganic–inorganic hybrid in a wide range of frequencies and temper-atures. This technique is an important technique in view of itssimplicity and clarity in describing the electrical processes occur-ring in a system on applying an ac signal as input perturbation.This helps to separate the contributions of electro active regions(such as grains, grain boundaries and electric–electrode interfaceeffect). The output response, when plotted in a complex plane plot,appears in the form of a succession of semicircles representingelectrical phenomena due to the grains, grain boundaries and elec-tric–electrode interface effect [31,39–41].
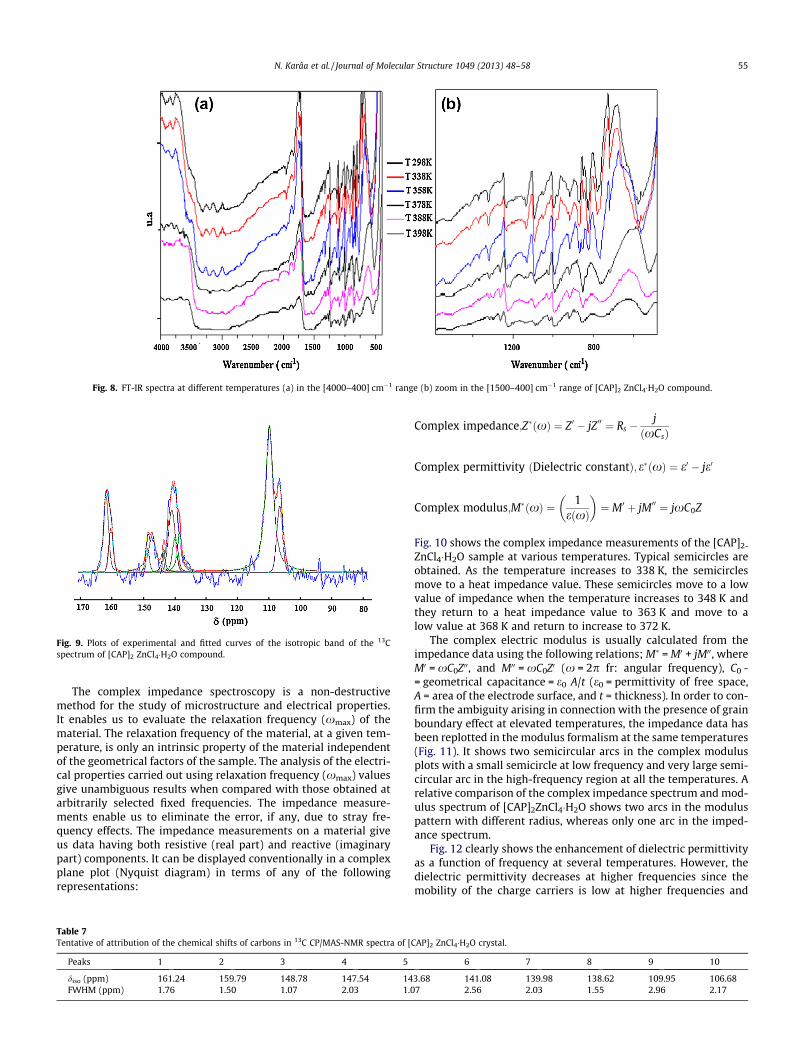
Fig. 8. FT-IR spectra at different temperatures (a) in the [4000–400] cm�1 range (b) zoom in the [1500–400] cm�1 range of [CAP]2 ZnCl4�H2O compound.
Fig. 9. Plots of experimental and fitted curves of the isotropic band of the 13Cspectrum of [CAP]2 ZnCl4�H2O compound.
N. Karâa et al. / Journal of Molecular Structure 1049 (2013) 48–58 55
The complex impedance spectroscopy is a non-destructivemethod for the study of microstructure and electrical properties.It enables us to evaluate the relaxation frequency (xmax) of thematerial. The relaxation frequency of the material, at a given tem-perature, is only an intrinsic property of the material independentof the geometrical factors of the sample. The analysis of the electri-cal properties carried out using relaxation frequency (xmax) valuesgive unambiguous results when compared with those obtained atarbitrarily selected fixed frequencies. The impedance measure-ments enable us to eliminate the error, if any, due to stray fre-quency effects. The impedance measurements on a material giveus data having both resistive (real part) and reactive (imaginarypart) components. It can be displayed conventionally in a complexplane plot (Nyquist diagram) in terms of any of the followingrepresentations:
Table 7Tentative of attribution of the chemical shifts of carbons in 13C CP/MAS-NMR spectra of [C
Peaks 1 2 3 4 5
diso (ppm) 161.24 159.79 148.78 147.54 14FWHM (ppm) 1.76 1.50 1.07 2.03 1.0
Complex impedance;Z�ðxÞ ¼ Z0 � jZ00 ¼ Rs �j
ðxCsÞ
Complex permittivity ðDielectric constantÞ; e�ðxÞ ¼ e0 � je0
Complex modulus;M�ðxÞ ¼ 1eðxÞ
� �¼ M0 þ jM00 ¼ jxC0Z
Fig. 10 shows the complex impedance measurements of the [CAP]2-
ZnCl4�H2O sample at various temperatures. Typical semicircles areobtained. As the temperature increases to 338 K, the semicirclesmove to a heat impedance value. These semicircles move to a lowvalue of impedance when the temperature increases to 348 K andthey return to a heat impedance value to 363 K and move to alow value at 368 K and return to increase to 372 K.
The complex electric modulus is usually calculated from theimpedance data using the following relations; M� = M0 + jM00, whereM0 = xC0Z00, and M00 = xC0Z0 (x = 2p fr: angular frequency), C0 -= geometrical capacitance = e0 A/t (e0 = permittivity of free space,A = area of the electrode surface, and t = thickness). In order to con-firm the ambiguity arising in connection with the presence of grainboundary effect at elevated temperatures, the impedance data hasbeen replotted in the modulus formalism at the same temperatures(Fig. 11). It shows two semicircular arcs in the complex modulusplots with a small semicircle at low frequency and very large semi-circular arc in the high-frequency region at all the temperatures. Arelative comparison of the complex impedance spectrum and mod-ulus spectrum of [CAP]2ZnCl4�H2O shows two arcs in the moduluspattern with different radius, whereas only one arc in the imped-ance spectrum.
Fig. 12 clearly shows the enhancement of dielectric permittivityas a function of frequency at several temperatures. However, thedielectric permittivity decreases at higher frequencies since themobility of the charge carriers is low at higher frequencies and
AP]2 ZnCl4�H2O crystal.
6 7 8 9 10
3.68 141.08 139.98 138.62 109.95 106.687 2.56 2.03 1.55 2.96 2.17
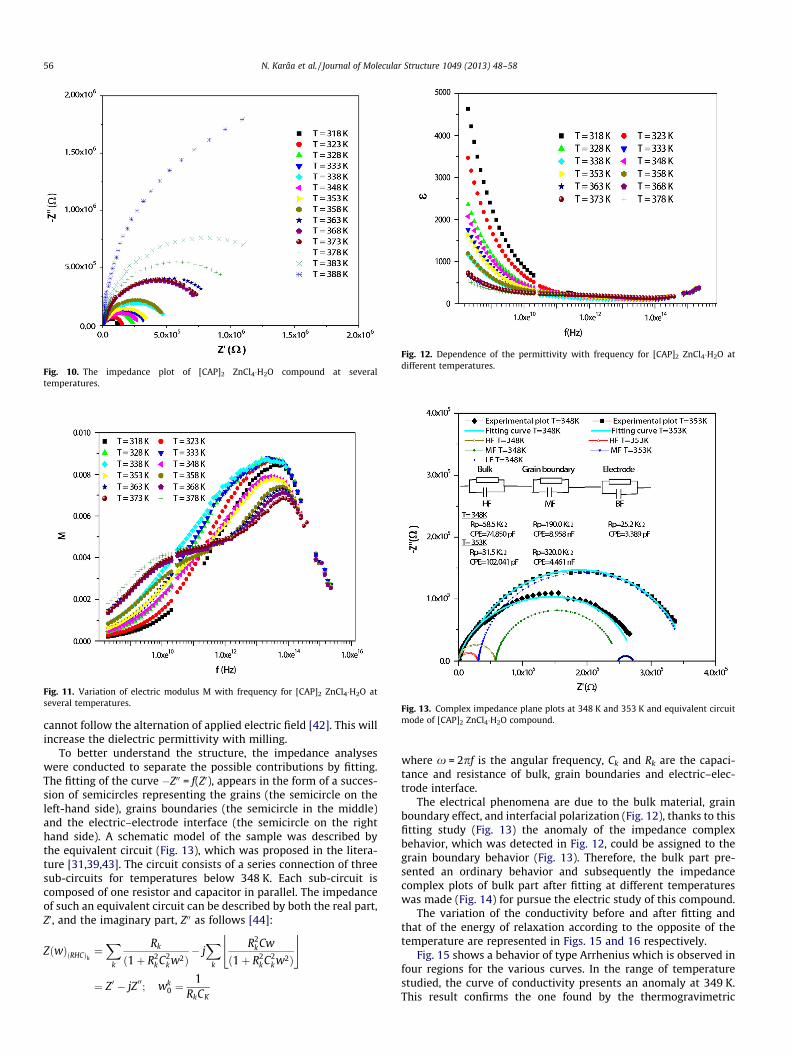
Fig. 10. The impedance plot of [CAP]2 ZnCl4�H2O compound at severaltemperatures.
Fig. 11. Variation of electric modulus M with frequency for [CAP]2 ZnCl4�H2O atseveral temperatures.
Fig. 12. Dependence of the permittivity with frequency for [CAP]2 ZnCl4�H2O atdifferent temperatures.
Fig. 13. Complex impedance plane plots at 348 K and 353 K and equivalent circuitmode of [CAP]2 ZnCl4�H2O compound.
56 N. Karâa et al. / Journal of Molecular Structure 1049 (2013) 48–58
cannot follow the alternation of applied electric field [42]. This willincrease the dielectric permittivity with milling.
To better understand the structure, the impedance analyseswere conducted to separate the possible contributions by fitting.The fitting of the curve �Z00 = f(Z0), appears in the form of a succes-sion of semicircles representing the grains (the semicircle on theleft-hand side), grains boundaries (the semicircle in the middle)and the electric–electrode interface (the semicircle on the righthand side). A schematic model of the sample was described bythe equivalent circuit (Fig. 13), which was proposed in the litera-ture [31,39,43]. The circuit consists of a series connection of threesub-circuits for temperatures below 348 K. Each sub-circuit iscomposed of one resistor and capacitor in parallel. The impedanceof such an equivalent circuit can be described by both the real part,Z0, and the imaginary part, Z00 as follows [44]:
ZðwÞðRHCÞk¼X
k
Rk
ð1þ R2k C2
kw2Þ� jX
k
R2k Cw
ð1þ R2k C2
k w2Þ
$ %
¼ Z0 � jZ00; wk0 ¼
1RkCK
where x = 2pf is the angular frequency, Ck and Rk are the capaci-tance and resistance of bulk, grain boundaries and electric–elec-trode interface.
The electrical phenomena are due to the bulk material, grainboundary effect, and interfacial polarization (Fig. 12), thanks to thisfitting study (Fig. 13) the anomaly of the impedance complexbehavior, which was detected in Fig. 12, could be assigned to thegrain boundary behavior (Fig. 13). Therefore, the bulk part pre-sented an ordinary behavior and subsequently the impedancecomplex plots of bulk part after fitting at different temperatureswas made (Fig. 14) for pursue the electric study of this compound.
The variation of the conductivity before and after fitting andthat of the energy of relaxation according to the opposite of thetemperature are represented in Figs. 15 and 16 respectively.
Fig. 15 shows a behavior of type Arrhenius which is observed infour regions for the various curves. In the range of temperaturestudied, the curve of conductivity presents an anomaly at 349 K.This result confirms the one found by the thermogravimetric
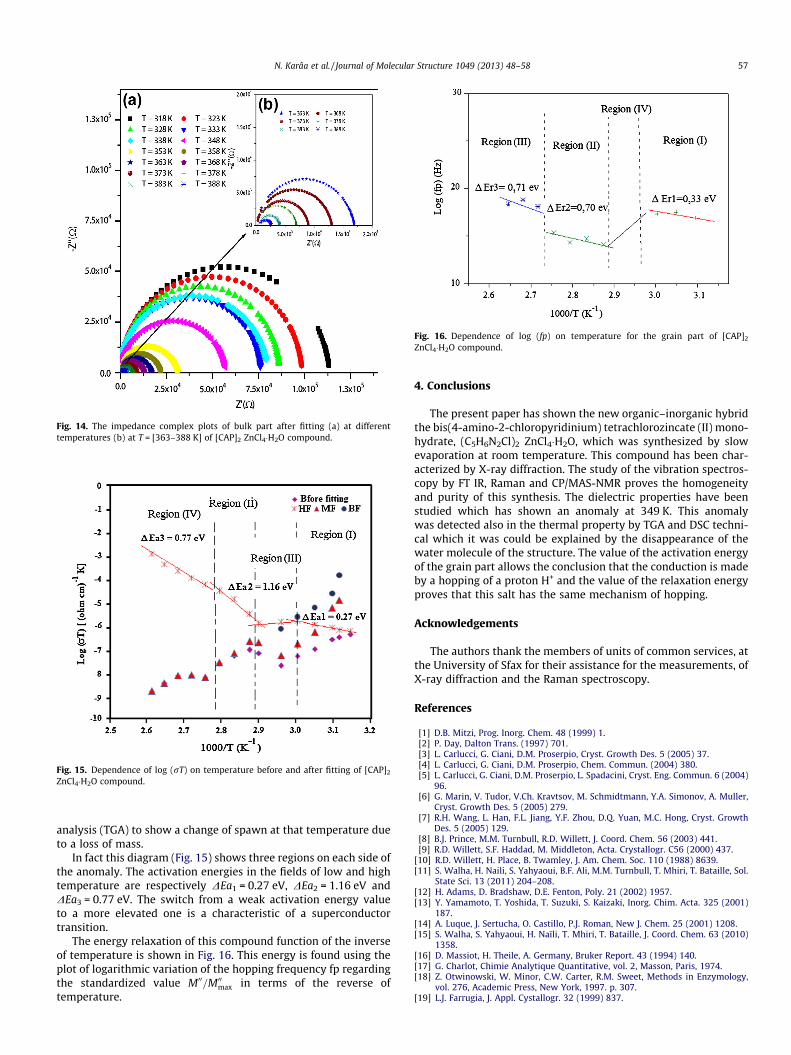
Fig. 14. The impedance complex plots of bulk part after fitting (a) at differenttemperatures (b) at T = [363–388 K] of [CAP]2 ZnCl4�H2O compound.
Fig. 15. Dependence of log (rT) on temperature before and after fitting of [CAP]2
ZnCl4�H2O compound.
Fig. 16. Dependence of log (fp) on temperature for the grain part of [CAP]2
ZnCl4�H2O compound.
N. Karâa et al. / Journal of Molecular Structure 1049 (2013) 48–58 57
analysis (TGA) to show a change of spawn at that temperature dueto a loss of mass.
In fact this diagram (Fig. 15) shows three regions on each side ofthe anomaly. The activation energies in the fields of low and hightemperature are respectively DEa1 = 0.27 eV, DEa2 = 1.16 eV andDEa3 = 0.77 eV. The switch from a weak activation energy valueto a more elevated one is a characteristic of a superconductortransition.
The energy relaxation of this compound function of the inverseof temperature is shown in Fig. 16. This energy is found using theplot of logarithmic variation of the hopping frequency fp regardingthe standardized value M00=M00
max in terms of the reverse oftemperature.
4. Conclusions
The present paper has shown the new organic–inorganic hybridthe bis(4-amino-2-chloropyridinium) tetrachlorozincate (II) mono-hydrate, (C5H6N2Cl)2 ZnCl4�H2O, which was synthesized by slowevaporation at room temperature. This compound has been char-acterized by X-ray diffraction. The study of the vibration spectros-copy by FT IR, Raman and CP/MAS-NMR proves the homogeneityand purity of this synthesis. The dielectric properties have beenstudied which has shown an anomaly at 349 K. This anomalywas detected also in the thermal property by TGA and DSC techni-cal which it was could be explained by the disappearance of thewater molecule of the structure. The value of the activation energyof the grain part allows the conclusion that the conduction is madeby a hopping of a proton H+ and the value of the relaxation energyproves that this salt has the same mechanism of hopping.
Acknowledgements
The authors thank the members of units of common services, atthe University of Sfax for their assistance for the measurements, ofX-ray diffraction and the Raman spectroscopy.
References
[1] D.B. Mitzi, Prog. Inorg. Chem. 48 (1999) 1.[2] P. Day, Dalton Trans. (1997) 701.[3] L. Carlucci, G. Ciani, D.M. Proserpio, Cryst. Growth Des. 5 (2005) 37.[4] L. Carlucci, G. Ciani, D.M. Proserpio, Chem. Commun. (2004) 380.[5] L. Carlucci, G. Ciani, D.M. Proserpio, L. Spadacini, Cryst. Eng. Commun. 6 (2004)
96.[6] G. Marin, V. Tudor, V.Ch. Kravtsov, M. Schmidtmann, Y.A. Simonov, A. Muller,
Cryst. Growth Des. 5 (2005) 279.[7] R.H. Wang, L. Han, F.L. Jiang, Y.F. Zhou, D.Q. Yuan, M.C. Hong, Cryst. Growth
Des. 5 (2005) 129.[8] B.J. Prince, M.M. Turnbull, R.D. Willett, J. Coord. Chem. 56 (2003) 441.[9] R.D. Willett, S.F. Haddad, M. Middleton, Acta. Crystallogr. C56 (2000) 437.
[10] R.D. Willett, H. Place, B. Twamley, J. Am. Chem. Soc. 110 (1988) 8639.[11] S. Walha, H. Naili, S. Yahyaoui, B.F. Ali, M.M. Turnbull, T. Mhiri, T. Bataille, Sol.
State Sci. 13 (2011) 204–208.[12] H. Adams, D. Bradshaw, D.E. Fenton, Poly. 21 (2002) 1957.[13] Y. Yamamoto, T. Yoshida, T. Suzuki, S. Kaizaki, Inorg. Chim. Acta. 325 (2001)
187.[14] A. Luque, J. Sertucha, O. Castillo, P.J. Roman, New J. Chem. 25 (2001) 1208.[15] S. Walha, S. Yahyaoui, H. Naïli, T. Mhiri, T. Bataille, J. Coord. Chem. 63 (2010)
1358.[16] D. Massiot, H. Theile, A. Germany, Bruker Report. 43 (1994) 140.[17] G. Charlot, Chimie Analytique Quantitative, vol. 2, Masson, Paris, 1974.[18] Z. Otwinowski, W. Minor, C.W. Carter, R.M. Sweet, Methods in Enzymology,
vol. 276, Academic Press, New York, 1997. p. 307.[19] L.J. Farrugia, J. Appl. Cystallogr. 32 (1999) 837.

58 N. Karâa et al. / Journal of Molecular Structure 1049 (2013) 48–58
[20] G.M. Sheldrick, SHELXS-86, Program for Crystal Structure Solution, Universityof Göttingen, Germany, 1986.
[21] G.M. Sheldrick, SHELXL-97, Program for Crystal Structure Refinement,University of Göttingen, Germany, 1997.
[22] L.J. Farrugia, J. Appl Cryst. 30 (1997) 565.[23] K. Brandenburg, Diamond Version2.0 Impact Gbr, Bonn, Germany, 1998.[24] A.S. Albrecht, C.P. Landee, M.M. Turnbull, J. Chem. Crystallogr. 33 (2003) 269.[25] Z.M. Jin, Y.J. Pan, M.L. Hu, S.J. Liang, Chem. Crystallogr. 31 (2001) 191.[26] M. Kurt, M. Yurdakul, S. Yurdakul, J. Mol. Struct. 711 (2004) 25.[27] N. Sundaraganesan, B. Anand, B. Dominic Joshua, Spectrochim. Acta A. 64
(2006) 586.[28] R. Kefi, C. Ben NASR, F. Lefebre, A. Durif, Inorg. Chimi. Acta. 358 (2005) 4075.[29] S. Tepavitcharova, D. Havicek, I. Nemec, P. Vojtisek, D. Rabadjieva, J. Plocek, J.
Mol. Struct. 918 (2009) 55.[30] N. Sundaraganesan, B. Dominic Joshua, M. Rajamoorthy, C.H. Gangadhar, Ind. J.
Pure. Appl. Phys. 45 (2007) 969.[31] N. Karâa, B. Hamdi, A. Oueslati, A. Ben Salah, R. Zouari, J. Inorg. Organomet.
Polym. 20 (2010) 746.[32] A. Ben Rhaiem, F. Hlel, K. Guidara, M. Gargouri, Spectrochim. Acta A. 66 (2007)
1107.
[33] D.M. Adams, P.J. Lock, J. Chem. Soc. A. 620 (1967).[34] M.E. ChaconVillalba, G. Echeverrıa, P.J. Aymonino, E.L. Varetti, J. Chem.
Crystallogr. 41 (2011) 508.[35] J.S. Avery, C.D. Burbridge, D.M.L. Goodgame, Spectrochim. Acta A. 24 (1968)
1721.[36] D. Massiot, F. Fayon, M. Capron, I. King’s Le Calve, B. Alonso, J.O. Durand, B.
Bujoli, Z. Gan, G. Hoatson, Magn. Reson. Chem. 40 (2002) 70.[37] E. Quiroz-Castro, S. Bernès, N. Barba-Behrens, R. Tapia-Benavides, R. Contreras,
He. Nöth, Polyhedron 19 (2000) 1479.[38] K. Chruszcz, M. Baranska, K. Czarniecki, B. Boduszek, L.M. Proniewicz, J. Mol.
Struct. 648 (2003) 215.[39] N. Karâa, B. Hamdi, A. Ben Salah, R. Zouari, J. Mol. Struct. 1013 (2012) 168.[40] J.R. Macdonald, Impedance Spectroscopy: Emphasizing Solid-State Material
and Systems, Wiley, New York, 1987 (Chapters 2 and 4).[41] B.H. Venkataraman, K.B.R. Varma, J. Mater. Sci. 38 (2003) 4895.[42] A.M. Abdeen, J. Magn. Magn. Mater. 192 (1999) 121.[43] N. Hannachi, K. Guidara, A. Bulou, F. Hlel, Mater. Res. Bull. 45 (2010) 1754.[44] D.C. Sinclair, A.R. West, J. Appl. Phys. 66 (1989) 3850.