synthesis, characterization, and stability test of silver...
TRANSCRIPT
Synthesis, Characterization and Stability Test of
Silver Nanoparticles in Ecotoxicology Media
By
Mila Tejamaya
A thesis submitted to
The University of Birmingham
for the degree of
Doctor of Philosophy
Division of Environmental Health and Risk Management
School of Geography, Earth and Environmental Sciences
The University of Birmingham, UK
September 2013
University of Birmingham Research Archive
e-theses repository This unpublished thesis/dissertation is copyright of the author and/or third parties. The intellectual property rights of the author or third parties in respect of this work are as defined by The Copyright Designs and Patents Act 1988 or as modified by any successor legislation. Any use made of information contained in this thesis/dissertation must be in accordance with that legislation and must be properly acknowledged. Further distribution or reproduction in any format is prohibited without the permission of the copyright holder.
ii
Abstract
Currently silver nanoparticle (AgNP) is the most widely used NP due to its
broad antimicrobial activity. Not less than 383 out of 1628 nanotechnology products
contains AgNPs. Due to the substantial increase of AgNP commercialization, AgNP
exposure to the environment become apparent. Potential hazard of AgNP to the
environment, however, is largely unknown. Lack of NP characterization data in most
of (eco)toxicology study, transformation of NPs in the test media and environment,
etc. have challenged the attempt of presenting NP dose and toxic outcome.
Therefore more control over NP ecotoxicology study need to be done to be able to
draw a conclusion of NP dose-response relationship.
This study was aimed to synthesis a stable, fully characterized and tightly
constrained PVP-capped AgNPs via bottom-up method. Modification of Mulfinger et
al. (2007) synthesis protocol have been successful in generating spherical and
monodisperse PVP-capped AgNPs. The average core size was 10-12 nm,
hydrodynamic size = 27-29 nm, ζ= 12-15 mVA, and excellent stability in OECD
Daphnia media and its variant (IS= 8.88 mM – 10.84 mM), and also in Algae media
(IS= 8.02 mM).
Another straightforward and promising synthesis method of PVP-capped
AgNPs was developed via ligand-exchanged (indirect method) from a monodisperse
citrate-capped AgNPs. 2 mL of 30 g/L PVP10 suspension(aq) was adequate for recap
50 mL 11 ppm citrate-capped AgNPs without any effect into core AgNPs properties
and improved AgNPs stability over OECD Daphnia Magna sp. media. Other
polymers such as PEG-SH, Fulvic acid and Tween-80 polymers was also tried to
recap citrate-coated AgNPs. There were no size and shape alterations as fuvic acid
iii
replaced citrate coating, while PEG-SH and Tween-80 polymer did. All polymers,
nevertheless improved the AgNPs stability in ecotoxicology media.
The stability of citrate; PEG-SH; and PVP-capped AgNPs due to incubation in
several ecotoxicology media with variation in media ionic strength/concentration and
composition was examined. The stability was evaluated in terms of SPR (λmax and
peak width), size, and shape stability. It was seen that PVP polymer showed a better
stabilization effect than citrate and PEG-SH. In most of media, SPR extinction and
size enlargement were found at greater extent for electrostatically capped AgNPs,
citrate-capped AgNPs than sterically capped AgNPs. In algae media, nonetheless
the SPR extinction of PEG-SH capped AgNPs was higher than citrate-capped
AgNPs, potentially because of lower divalent cation content in algae media that
caused lesser effect to citrate-capped AgNPs. Shape transformation was seen for
AgNPs after incubated in media without chloride (nitrate and sulphate media),
especiallay in concentrated media. Thus type of capping agent; media ionic strength
and chemical composition determined the behavior and stability of AgNPs in
ecotoxicology media.
iv
Acknowledgements
I would like to express my deepest gratitude to my supervisor, Prof. Jamie R Lead, for giving
me the opportunity to be one of his students in University of Birmingham. Because of his
expertise, brilliant ideas and full support have made this thesis possible. I also would like to
thank Prof. Kevin Chipman and Prof. Mark Viant for the encouraging discussion and
introducing me to the Bioscience and daphnia world.
I would never have been doing this program without the financial support from the
Directorate of Higher Education of Republic of Indonesia (DIKTI). Thank you for letting my
dream come true. Thank you very much to my colleague in University of Indonesia, Ibu Daly,
Mas Derriansyah and Mbak Galuh Puri for supporting me for the last 4 years. To Dean of
School of Public Health, Pak Bambang Wispriyono PhD and his staffs, thank you very much
for all the support and advices. To my colleague at Department of Occupational Health and
Safety, all the support, advices and motivation are highly appreciated, especially Bu Fatma
Lestari for her full and continuous support, Pak Doni Hikmat for backing me up for all the
works in Dept.K3 , and Baiduri for sharing tears and laugh, Terimakasih banyaak…
My GEES Nanogroup, who always there to help me out with any lab and data problems,
thank you so much. Especially to Yusuf Nur for sharing the skills, knowledge, faith, and
coffee. All the moment we share together in the lab, office, masjid and Costa are
unforgettable. Christine, my bestest advisor, for listening to my laments about work and
family and checking my grammatical errors, thanks Mum. Special thanks also to Marie,
Isabella and Laura for sharing the synthesis protocols and particles. Indrani, my thoughtful
friend, many thanks for your advices. Willam Ho, thanks for taking me around the beautiful
places in Birmingham. Paula Cole, Ruth Merrifield, Sue Cumberland, and Mohammed
Baalousha for helping me out with instrumentation. Bjorn, my bestes mentor, thank you very

v
much for all effort that you have been given to me, with the AFM in particular. Thanks to
other member of GEES Nanogroup for discussion and support.
Thanks to the people that teach me with the outstanding and complicated instrumentations,
Theresa Morris for the TEM, and Steve Baker for the ICP-MS.
To 325 night-clubbers: Awwal, Issac, Soph Ia, Indrani and Marie (again), thanks for
accompanying me to stay up late in the office and work even harder during weekend. Thank
you so much, I‘m gonna miss you all…
My family in UK, especially the member of Pengajian Asy-syifa and Forum Jumat, you help
me to be istiqamah and remember Allah, Alhamdulillah… Special thanks to the lovely family
of Bu Lina dan Uwa Undang, Mbak Lia and Pak Amet, Uni Mila and Brother Richard, Mbak
Tini and Pak Riza, Mbak Tutik and Mas Pras, Mbak Laksmi and Mas Yulian, Teh Yossi and
Brother Alex, Kak Rin and Brother Mohammad, Mbak Tyas, Mbak Een, Mas Hijrah and
Mbak Lia Imran, I love you all… Thanks for all of support, dhua and advices.
To my dearest family, for the unconditional love and support, Mama, Papa, Ibu, Keluarga
Uwa Mela, Uwa Nia, Mang Asep, adikku Bibi Hani and Om Teguh, without your support all
this things are impossible. I love you all and may Allah rewards you for all the things you
have given to me, your support, love, especially your dhua for me…
Last but not least, to my beautiful and bestest family, ayah Erik Ridwan, aa Fauzan Ridwan,
Kaka Nadya Ridwan, your endless and infinite love and support , also our togetherness in
Birmingham and Indonesia, have made this achievement never been easier. With all of my
heart, I love you all unconditionally…forever and ever
Finally, I hope this thesis is useful for anyone who read this and especially for my students.
vi
Table of content
Abstract ................................................................................................. ii
Acknowledgements ............................................................................. iv
List of Figures ...................................................................................... xi
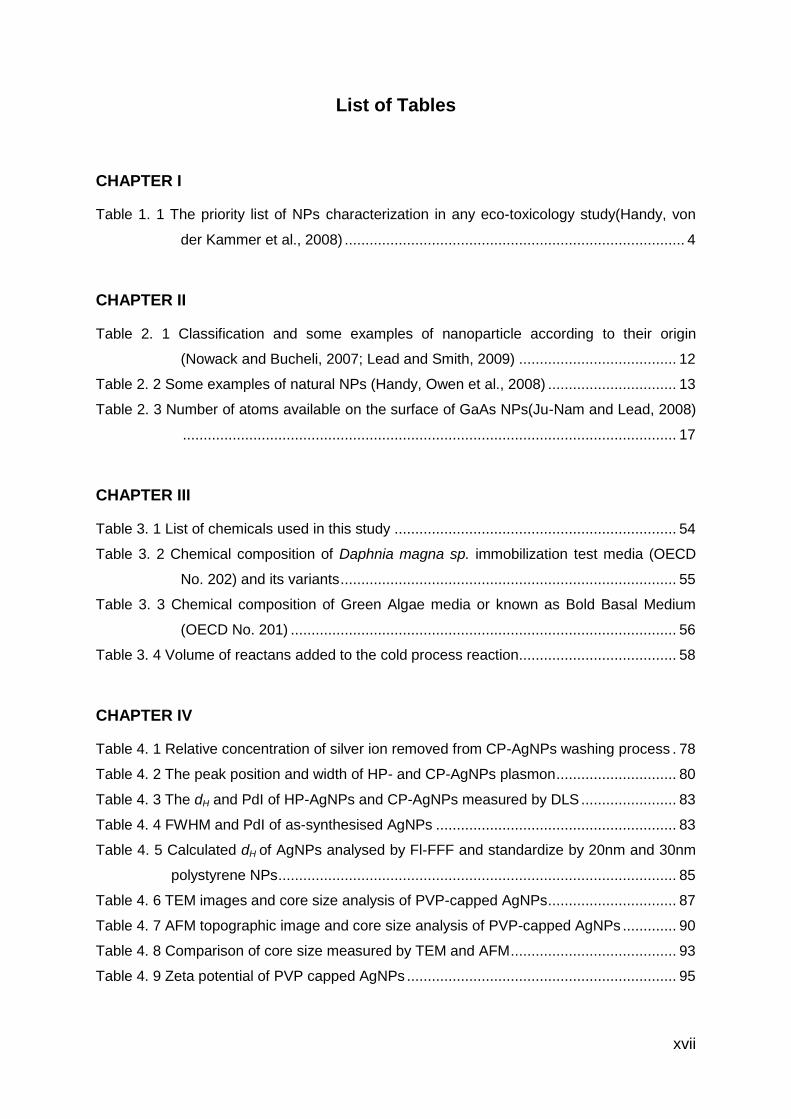
List of Tables ..................................................................................... xvii
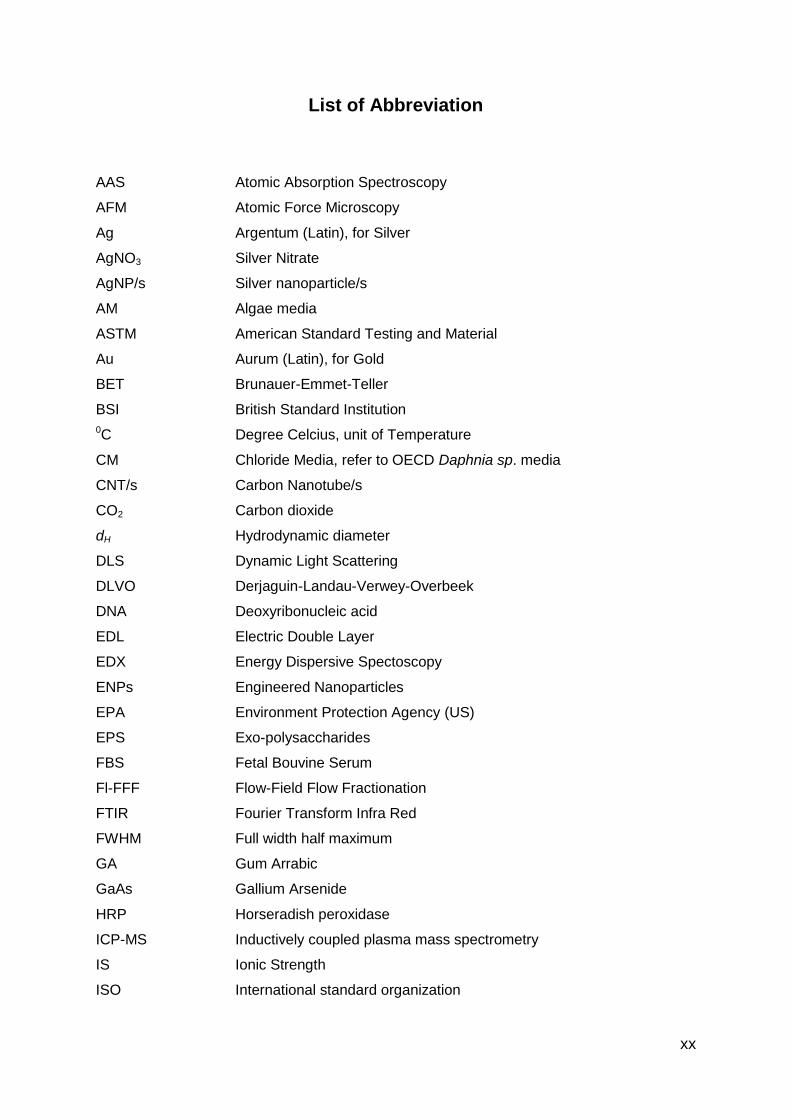
List of Abbreviation ............................................................................ xx
CHAPTER I ............................................................................................ 1
INTRODUCTION .................................................................................... 1
1.1. Overview ....................................................................................................... 1
1.2. The aim, objectives and hypothesis of this study .......................................... 5
1.3. Structure of the thesis ................................................................................... 6
CHAPTER II ........................................................................................... 8
BACKGROUND ..................................................................................... 8
2.1. History of nanotechnology ................................................................................ 8
2.2. Definition of Nanomaterials .............................................................................. 9
2.3. Classification of nanoparticles ........................................................................ 12
2.3.1. Natural nanoparticles ............................................................................... 12
2.3.2. Incidental or unintentional NPs ............................................................. 13
2.3.3. Engineered or manufactured NPs ........................................................ 14
2.4. Properties of nanoparticle ........................................................................... 15
2.4.1. Specific surface area (SSA) ..................................................................... 16
2.4.2. Quantum effect of NPs ......................................................................... 19
2.5. Transformation of NPs ................................................................................ 21
2.5.1. Chemical transformation .......................................................................... 22
2.5.2. Physical transformation or aggregation ................................................ 26
2.5.3. Biological transformation ...................................................................... 33
2.6. Synthesis method of nanoparticles ............................................................. 34
2.7. Characterization of nanoparticles ................................................................ 35
vii
2.7.1. Size ...................................................................................................... 36
2.7.1.1 Dynamic Light Scattering .......................................................................................... 37
2.7.1.2 Flow-Field Flow Fractionation ................................................................................... 38
2.7.1.3 Transmission Electron Microscopy ........................................................................... 39
2.7.1.4. Atomic Force Microscopy (AFM) ................................................................................. 41
2.7.2. Elemental analysis ................................................................................ 43
2.7.2.1. UV-Vis spectroscopy ............................................................................................. 43
2.7.2.2. Energy dispersive X-Ray Spectroscopy .................................................................. 45
2.7.3. Surface Charge measurement .............................................................. 47
2.7.4. Surface area measurement ....................................................................................... 48
2.7.5. Concentration measurement ................................................................ 48
2.8. Reasons for choosing silver nanoparticles .................................................. 48
2.9. Summary ..................................................................................................... 52
CHAPTER III ........................................................................................ 53
METHODOLOGY ................................................................................. 53
3.1. Introduction ................................................................................................. 53
3.2. Materials and Equipments ........................................................................... 54
3.2.1. Materials ............................................................................................... 54
3.2.2. Ultrapure water ..................................................................................... 55
3.2.3. Media .................................................................................................... 55
3.2.4. Treatment to filter paper, glass ware and plastic ware ......................... 56
3.3. Synthesis of PVP-capped AgNPs by the hot process ................................. 57
3.4. Synthesis of PVP-capped AgNPs by the cold process ................................ 57
3.5. Replacing citrate with polymer .................................................................... 59
3.6. Clean-up of polymer-capped AgNPs ........................................................... 59
3.7. Characterization .......................................................................................... 61
3.7.1. Surface Plasmon resonance with UV-Vis spectrometer ....................... 61
3.7.2. Size distribution by dynamic light scattering ......................................... 62
3.7.3. pH measurement .................................................................................. 62
3.7.4. Zeta potential ........................................................................................ 62
3.7.5. Flow field flow fractionation ................................................................... 63
3.7.6. TEM and AFM sample preparation .......................................................... 63
viii
3.7.7. AgNPs core size and shape characterization by Transmission Electron
Microscopy (TEM) and single particle elemental analysis by Energy Dispersive
X-Ray (EDX) Spectroscopy ............................................................................... 64
3.8. Stability study of AgNPs in eco-toxicology media ........................................ 66
3.9. Preliminary dissolution study of PVP capped AgNPs .................................. 67
3.9.1. Silver ion separation by ultrafiltration .................................................... 67
3.9.2. Dissolution study with dialysis .............................................................. 68
3.9.3. Inductively coupled plasma-mass spectrometry ................................... 69
CHAPTER IV ........................................................................................ 70
SYNTHESIS AND CHARACTERIZATION OF PVP-CAPPED SILVER
NANOPARTICLES ............................................................................... 70
Summary ............................................................................................................... 70
4.1. Introduction ................................................................................................... 71
4.2. Aims and objectives ...................................................................................... 73
4.3. Methodology .................................................................................................. 73
4.4. Results and discussion .................................................................................. 73
4.4.1. Operationalizing the synthesis ................................................................. 73
4.4.2. Sample washing ...................................................................................... 77
4.4.3. Characterization....................................................................................... 79
4.4.3.1. SPR characteristics ....................................................................................................... 79
4.4.3.2. Hydrodynamic diameter (dH) and size distribution by DLS and Fl-FFF ........................ 81
4.4.3.3. Core size by TEM and AFM .......................................................................................... 86
4.4.3.4. Elemental analysis by EDX ........................................................................................... 94
4.4.3.5. Zeta potential ............................................................................................................... 95
4.4.4. Summary of characterization result ......................................................... 96
4.4.5. Sizes ratio and polydispersity indices ...................................................... 97
4.4.6. Preliminary solubility study of AgNPs in pristine suspension and
ecotoxicology media .......................................................................................... 99
4.4.6.1. Dissolution in pristine suspension, a preliminary study ............................................ 100
4.4.6.2. Dissolution of AgNPs in CM-1 and NM-1 ................................................................... 104
4.4.6.3. Dissolution of AgNPs in CM-10 .................................................................................. 110
4.5. Conclusion ................................................................................................... 112
ix
CHAPTER V ....................................................................................... 114
THE EFFECT OF LIGAND-EXCHANGE ON NANOPARTICLE
CHARACTERISTICS AND STABILITY .............................................. 114
Chapter summary ............................................................................................... 114
5.1. Introduction ............................................................................................... 115
5.2. Aim and objectives .................................................................................... 117
5.3. Results and discussion ............................................................................. 118
5.3.1. SPR Characteristics ........................................................................... 119
5.3.2. TEM core size and measurement and shape factor analysis ............. 123
5.3.3. DLS size measurement ...................................................................... 129
5.3.4. Fl-FFF Size measurement .................................................................. 134
5.3.5. Zeta potential result ............................................................................ 136
5.3.6. Comparison between size measurement result .................................. 136
5.3.7. SPR Stability of AgNPs in electrolyte media ....................................... 137
5.4. Conclusion ................................................................................................ 142
CHAPTER VI ...................................................................................... 144
STABILITY OF SILVER NANOPARTICLES IN ECOTOXICOLOGY
MEDIA ................................................................................................ 144
Chapter Summary ............................................................................................... 144
6.1. Introduction ............................................................................................... 145
6.2. Aims and Objectives ................................................................................. 147
6.3. Methodology.............................................................................................. 147
6.4. Result ........................................................................................................ 148
6.4.1. Behaviour of citrate-capped AgNPs in CM, NM and SM .................... 148
6.4.2. Behaviour of PEG-capped AgNPs in CM-1; NM-1 and SM-1 ............. 161
6.4.3. Behaviour of PVP-capped AgNPs in CM, NM and SM ....................... 173
6.4.4. Behaviour of citrate-, PEG-, and PVP-capped AgNPs in algae media 183
6.5. Discussion ................................................................................................. 192
6.5.1. The influence of capping agent into the stability and behaviour of AgNPs
192
6.5.2. Ionic strength dependence of stability and behaviour of AgNPs ......... 194
x
6.5.3. Media composition dependence of stability and behaviour of AgNPs 195
6.6. Conclusion ................................................................................................ 197
CHAPTER VII ..................................................................................... 198
DISCUSSION, CONCLUSION AND FURTHER WORK ..................... 198
7.1. Discussion and Conclusion .......................................................................... 198
7.2. Further works ............................................................................................... 200
Special acknowledgment ................................................................. 202
LIST OF REFERENCES ..................................................................... 203
APPENDIX A ...................................................................................... 228
APPENDIX B ...................................................................................... 232
xi
List of Figures
CHAPTER I
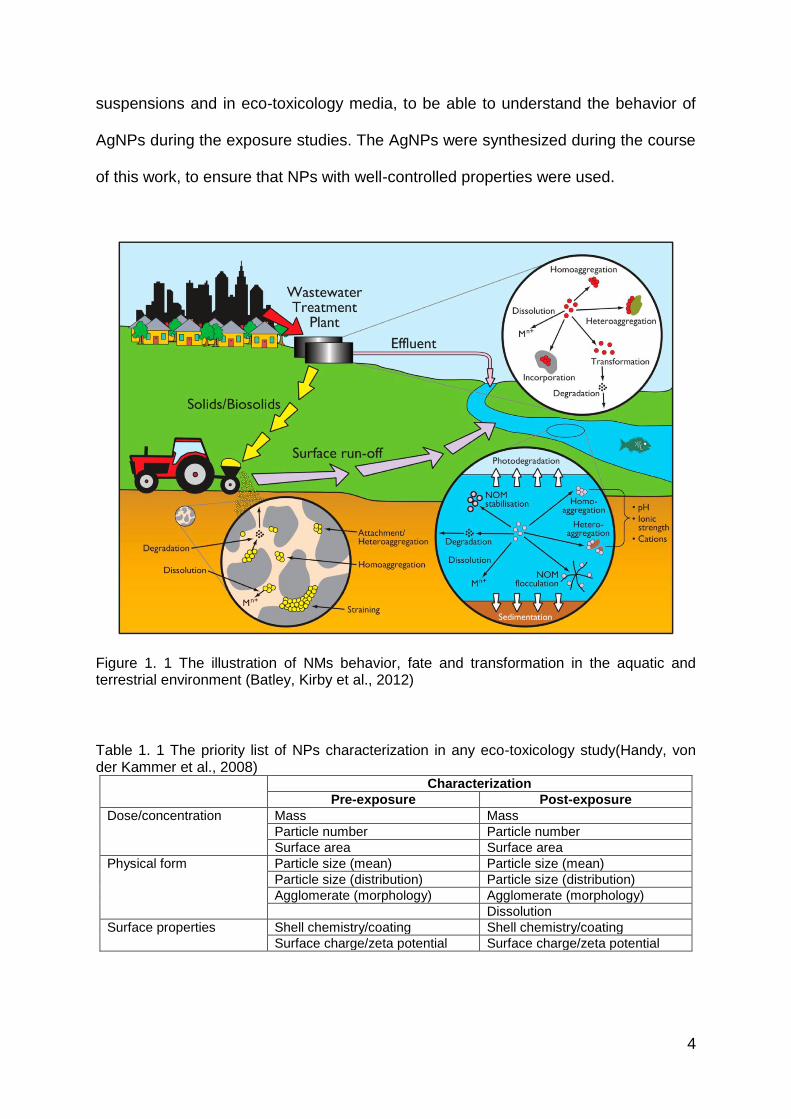
Figure 1. 1 The illustration of NMs behavior, fate and transformation in the aquatic and
terrestrial environment (Batley, Kirby et al., 2012) ............................................ 4
CHAPTER II
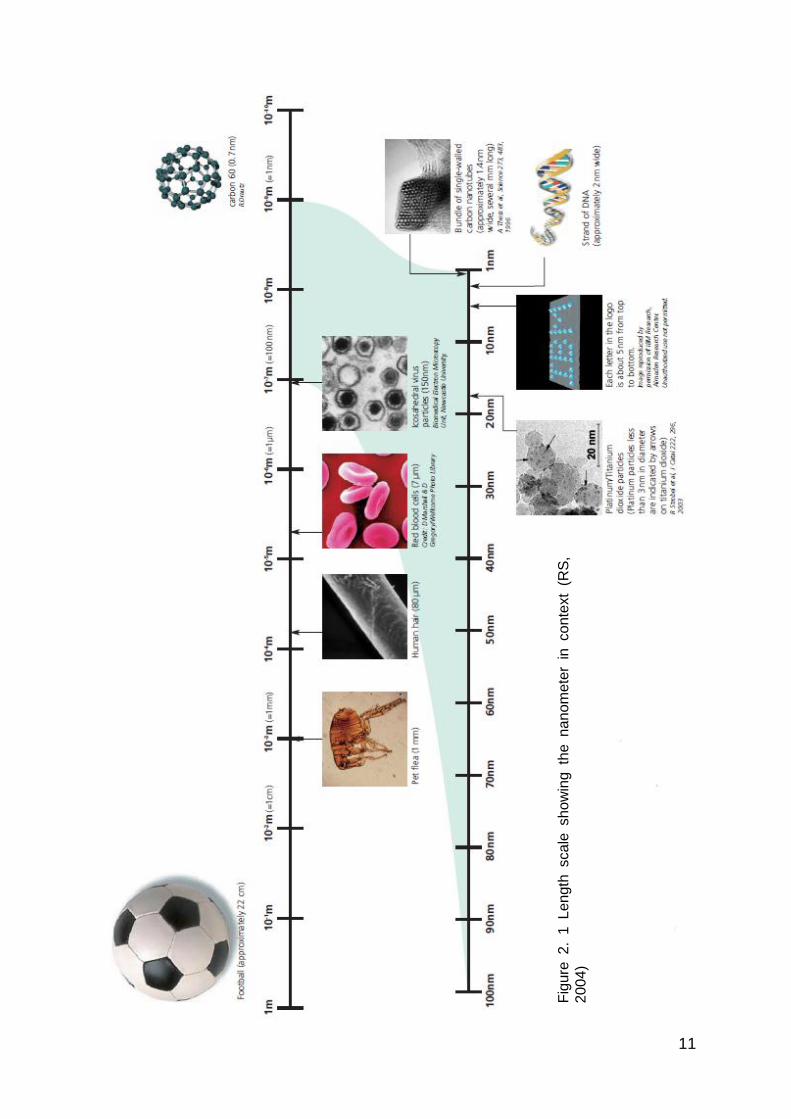
Figure 2. 1 Length scale showing the nanometer in context (RS, 2004) .............................. 11
Figure 2. 2 Classification of Engineered Nanoparticles (ENPs)(Ju-Nam and Lead, 2008;
Klaine, Alvarez et al., 2008) ............................................................................ 14
Figure 2. 3 (a) Surface area per volume of NPs as a function of NPs size (Shvedova et al.,
2012); (b) Surface area of silica NPs according to particle sizes (Rahman and
Padavettan, 2012) .......................................................................................... 16
Figure 2. 4 Size dependence of band-gap energy(Taylor et al., 2002) ................................ 19
Figure 2. 5 The interaction between electric field oscillation of radiation and free electron
oscillation (Kelly, Coronado et al., 2002) ......................................................... 20
Figure 2. 6 Some examples of NPs chemical transformation: (a) AgNPs dissolution due to
oxidation (Liu and Hurt, 2010); (b) Cd2+ dissolution from CdSe quantum dot
(Derfus et al., 2003); (c) ROS production of SWCNTs photoreduction(Chen and
Jafvert, 2011). (d) dynamic redox reaction of AgNPs. ..................................... 24
Figure 2. 7 Three collision mechanism and aggregation rate coefficient of 1 µm particles,
with diameter dp, temperature 120C, particle density 2.6 g mL-1 and share rate
35 s-1. The figure represents domination of perikinetik aggregation in smaller
particle sizes and ortokinetic aggregation for particle larger than 1 µm (Handy,
von der Kammer et al., 2008) ......................................................................... 27
Figure 2. 8 Schematic diagram of the variation of free energy with particle separation
according to DLVO theory. The net energy is given by the sum of the double
layer repulsion and the van der Waals attractive forces that the particles
experience as they approach one another (downloaded from
http://www.ncl.ac.uk/dental/oralbiol/oralenv/tutorials/electrostatic.htm on 21st
august 2014) .................................................................................................. 29
Figure 2. 9 Dispersion state of nanoparticles and the forces acting on each state(Baun et al.,
2008) .............................................................................................................. 30
Figure 2. 10 Stabilization of NPs: (a) electrostatic, and (b) steric stabilization(Christian et al.,
2008) .............................................................................................................. 31
Figure 2. 11 Top-down and bottom-up methods (Powers, Brown et al., 2006). ................... 35
xii
Figure 2. 12 Hydrodynamic size of a steric capped particle (downloaded from
http://www.malverninstruments.fr/labfre/technology/dynamic_light_scattering/dy
namic_light_scattering.htm) ............................................................................ 37
Figure 2. 13 Fractionation of NPs sample with two size distributions by as-Fl-FFF
(downloaded from http://www.field-flow-fractionation.com/field-flow-
fractionation.htm on the 7th August 2013) ...................................................... 39
Figure 2. 14 The layout of TEM instrument (downloaded from
http://www.udel.edu/biology/Wags/histopage/illuspage/lec1/mIcroscopyppt.htm)
....................................................................................................................... 40
Figure 2. 15 Variation of shape factors value (Wilkinson and Lead, 2007) .......................... 41
Figure 2. 16 Force- displacement curve (Jalili and Laxminarayana, 2004) .......................... 42
Figure 2. 17 Different SPR for different silver nanoparticle shape and size (Wiley, Im et al.,
2006) .............................................................................................................. 45
Figure 2. 18 Interaction between electrons and specimen in electron microscopy(Rochow
and Tucker, 1994) .......................................................................................... 46
Figure 2. 19 The number of nanomaterial products categorized by its major component
(http://www.nanotechproject.org/cpi/about/analysis/ ,downloaded 31st March
2014). ............................................................................................................. 50
CHAPTER III
Figure 3. 1 PVP capped AgNPs was synthesised with hot process ..................................... 57
Figure 3. 2 PVP capped AgNPs were synthesised with cold process .................................. 58
Figure 3. 3 The set-up of diafiltration cell............................................................................. 61
Figure 3. 4 Dissolution study by using dialysis method ........................................................ 69
CHAPTER IV
Figure 4. 1 PVP capped AgNPs generated from: (a) Hot process; and (b) Cold Process .... 74
Figure 4. 2 Illustration of PVP molecule – metal ion interaction in metal NPs synthesis
(Hoppe, Lazzari et al., 2006)........................................................................... 74
Figure 4. 3 Formation of silver ion-PVP complex (Zhang, Zhao et al., 1996) ....................... 75
Figure 4. 4 Formation of PVP capped AgNPs (Zhang, Zhao et al., 1996) ............................ 75
Figure 4. 5 Action of borohydride ion as the electrostatic capping agent of synthesized
AgNPs generated by cold process (Mulfinger, Solomon et al., 2007).............. 76
Figure 4. 6 (a) SPR comparison of AgNPs without and with two different volume of 0.3% m/v
(5% and 15% v/v), (b) normalized of SPR peak at (a) .................................... 77
xiii
Figure 4. 7 The relative concentration of silver ion in the ultra-filtrate removed from the CP-
AgNPs during NPs washing by ultrafiltration tabulate relative to total
concentration. ................................................................................................. 78
Figure 4. 8 The SPR of PVP capped AgNPs generated from hot process (HP-AgNPs) ...... 79
Figure 4. 9 SPR of PVP capped AgNPs generated by cold process with various reactant
ratio and reaction condition ............................................................................. 80
Figure 4. 10 Size distribution by Intensity of AgNPs from hot process and cold process
measured by DLS ........................................................................................... 82
Figure 4. 11 dH size of HP-AgNPs analysed by Fl-FFF ........................................................ 84
Figure 4. 12 dH size of CP-AgNPs analysed by Fl-FFF ........................................................ 84
Figure 4. 13 EDX spectrum of (a) single particles, and (b) clumps of particles from CP5
sample, and (c) backgorund ........................................................................... 94
Figure 4. 14 Linear correlation between the ratio of dH-DLS/dTEM and PdI value .............. 98
Figure 4. 15 Linear correlation between the ratio of dTEM/dAFM with PdI value ...................... 98
Figure 4. 16 The amount of Ag+ inside the dialysis bag over time. The dialysis bags were
immersed into (a) AgNPs-CM1 suspension, (b) AgNPs-NM1 suspension and
the sample was removed at particular sampling time. The initial and final [Ag]total
concentration in the external suspension of (a) was 420.24 ppb; and 169.70
ppb, respectively; and (b) was 586.10 ppb; 124.4 ppb, respectively ............. 104
Figure 4. 17 TEM image and EDX spectrum of CP5-AgNPs after incubated in CM-1 for 21
days.............................................................................................................. 106
Figure 4. 18 TEM images and EDX spectrum of CP5-AgNPs after incubated in NM-1 for 21
days.............................................................................................................. 107
Figure 4. 19 Size distribution of CP5 in stock suspension (grey) and after 21 days incubation
in CM-1 (red) and NM-1(blue) ....................................................................... 107
Figure 4. 20 Shape factor of CP5 in stock suspension (grey) and after 21 days incubation in
CM-1 (red) and NM-1(blue) .......................................................................... 108
Figure 4. 21 The solubility of CP5-AgNPs in CM-10 within 625 hours ............................... 110
Figure 4. 22 Suggested three dissolution phases of AgNPs and media-Ag+ interaction during
incubation in CM-10 ...................................................................................... 111
Figure 4. 23 The PVP-capped AgNPs methods via cold process ...................................... 112
CHAPTER V
Figure 5. 1 Outline of some possible application of ligand protected NPs (Templeton,
Wuelfing et al., 1999) .................................................................................... 116
xiv
Figure 5. 2 The normalised SPR of citrate-capped AgNPs and polymer-capped AgNPs
generated by re-capping the citrate-capped AgNPs ...................................... 120
Figure 5. 3 Illustration of schematic model of steric capped NP(Sun, Gray et al., 2011) .... 121
Figure 5. 4 TEM images and size distribution of (a) citrate; (b) PEG-SH; (c) PVP; (d) Fulvic
acid; and (e) Tween-80 capped AgNPs ........................................................ 126
Figure 5. 5 Illustration of nuchleophiles and AgNPs interaction which lead to dissolution of
AgNPs. ......................................................................................................... 128
Figure 5. 6 Size distribution (by intensity) of AgNPs with different capping agent, analysed by
DLS .............................................................................................................. 130
Figure 5. 7 Possible attachment mode of polymer onto the NPs surface (a) trail, loop and
train, (b) surface-anchored polymer brushes (Araki, 2013) ........................... 133
Figure 5. 8 Thiolated-polymer capped Gold NPs(Daniel and Astruc, 2004) ....................... 133
Figure 5. 9 The dH distributions fractogram by Fl-FFF of AgNPs with different capping agents
..................................................................................................................... 135
Figure 5. 10 The SPR of AgNPs with different capping agent in CM-1 within 21 days of
incubation (a) citrate-capped AgNPs; (b) PEG-SH capped AgNPs; (c) PVP-
capped AgNPs; (d) FA-capped AgNPs; (e) Tween-capped AgNPs .............. 139
Figure 5. 11 The SPR extinction of citrate capped AgNPs in CM-1 ................................... 140
Figure 5. 12 Comparison of Amax changes of steric-capped AgNPs in full strength OECD
media within 21 days (error bar was less than 0.01) ..................................... 140
Figure 5. 13 Dispersion of AgNPs after re-capping by fulvic acid ...................................... 141
CHAPTER VI
Figure 6. 1 Colour changes of citrate-coated AgNPs in different media (from left to right: CM-
10; CM-1; NM-10; NM-1; SM-10 and SM-1). a immediately after media addition;
b after 24 hours. ............................................................................................ 148
Figure 6. 2 The colour loss and appearance of sediment after citrate-capped AgNPs
incubated in concentrated media for 24 hrs (from left to right: CM-1; NM-1 and
SM-1) ........................................................................................................... 149
Figure 6. 3 The SPR of citrate-capped AgNPs after 2 hours of incubation in concentrated
media, compared to the SPR of control ........................................................ 149
Figure 6. 4 The kinetics of absorbance decrease of citrate-capped AgNPs at λmax=392nm
during the first hour in concentrated media ................................................... 150
Figure 6. 5 The SPR of citrate-capped AgNPs in dilute media after 2 hours of incubation
compare with the SPR of the control............................................................. 151
Figure 6. 6 The SPR stability of citrate capped AgNPs in various media within 21 days .... 153
xv
Figure 6. 7 Size distribution of citrate-capped AgNPs in (a) concentrated media; and (b)
dilute media; after 24hrs incubation, compared to the control; and measured by
DLS. ............................................................................................................. 155
Figure 6. 8 Size distribution by intensity of citrate-capped AgNPs in (a) CM-10; (b) NM-10;
and (c) SM-10 within 21 days incubation ...................................................... 157
Figure 6. 9 The ζ of citrate capped AgNPs incubated in various media measured at 0; 7 and
21 days ......................................................................................................... 157
Figure 6. 10 TEM images of citrate-capped AgNPs in diluted media: (a) and (b) in CM-10
after 21 days; (c) and (d) in NM-10 after 2 weeks; (e) and (f) in NM-10 after 21
days; (g) and (h) in SM-10 after 2 weeks; and (i) and (j) in SM-10 after 21 days
..................................................................................................................... 161
Figure 6. 11 Kinetics (At/A0) of PEG capped AgNPs in concentrated media within the first 5
minutes of incubation. ................................................................................... 162
Figure 6. 12 The SPR of PEG-capped AgNPs in (a) various dilute media; and (b) various
concentrated media measured after 2 hours incubation. ............................... 162
Figure 6. 13 The SPR of PEG-capped AgNPs in various media during 21 days incubation
..................................................................................................................... 164
Figure 6. 14 Size distribution of PEG-capped AgNPs after 24 hrs incubation in (a)
concentrated media and (b) dilute media ...................................................... 166
Figure 6. 15 z-average of PEG-capped AgNPs in different media within 21 days .............. 167
Figure 6. 16 Size distribution by intensity of PEG-capped AgNPs in different media within 21
days.............................................................................................................. 169
Figure 6. 17 The ζ of PEG-capped AgNPs in different media measured at incubation day =
0; 7; and 21 days .......................................................................................... 170
Figure 6. 18 TEM images of PEG-capped AgNPs after 21 days in (a) CM-10; (b) CM-1; (c)
NM-10; (d) NM-1; (e) SM-10 and (f) SM-1. ................................................... 172
Figure 6. 19 PVP-capped AgNPs in different media preserved the yellow characteristic
colour within 21 days study period. ............................................................... 173
Figure 6. 20 The SPR behaviour of PVP-capped AgNPs in: (a) dilute and (b) concentrated
media after 24hrs of incubation. .................................................................... 174
Figure 6. 21 The SPR behaviour of PVP capped AgNPs in variety of media during 21 days of
incubation ..................................................................................................... 176
Figure 6. 22 The size distribution by intensity of PVP-capped AgNPs in (a) concentrated
media; and (b) dilute media, after 24hrs incubation measured by DLS ......... 178
Figure 6. 23 The z average of PVP-capped AgNPs in variety of media within 21 days study
period. .......................................................................................................... 178
xvi
Figure 6. 24 Size distribution by intensity of PVP-capped AgNPs in different media within 21
days.............................................................................................................. 180
Figure 6. 25 The ζ of PVP-capped AgNPs in variety of media within 21 days ................... 181
Figure 6. 26 TEM images of PVP-capped AgNPs in (a) CM-10; (b) CM-1; (c) NM-10; (d) NM-
1; (e) SM-10 and (f) SM-1 ............................................................................. 183
Figure 6. 27 The SPR of (a) citrate-; (b) PEG-; and (c) PVP-capped AgNPs in algae media
monitored within 72 hours incubation. ........................................................... 184
Figure 6. 28 Size distribution of citrate, PEG and PVP capped AgNPs incubated in algae
media up to 72 hours .................................................................................... 186
Figure 6. 29 The fractogram of citrate-; PEG- and PVP-capped AgNPs after 72hrs incubation
in algae media .............................................................................................. 188
Figure 6. 30 TEM images of citrate-, PEG- and PVP-capped AgNPs controls (a,c,e) and after
72hrs incubation in algae media (b,d,f) ......................................................... 190
Figure 6. 31 The comparison of size distribution comparison of control and 72hrs algae
media-AgNPs suspension: (a)citrate-, (b) PEG- and (c) PVP-capped AgNPs191
xvii
List of Tables
CHAPTER I
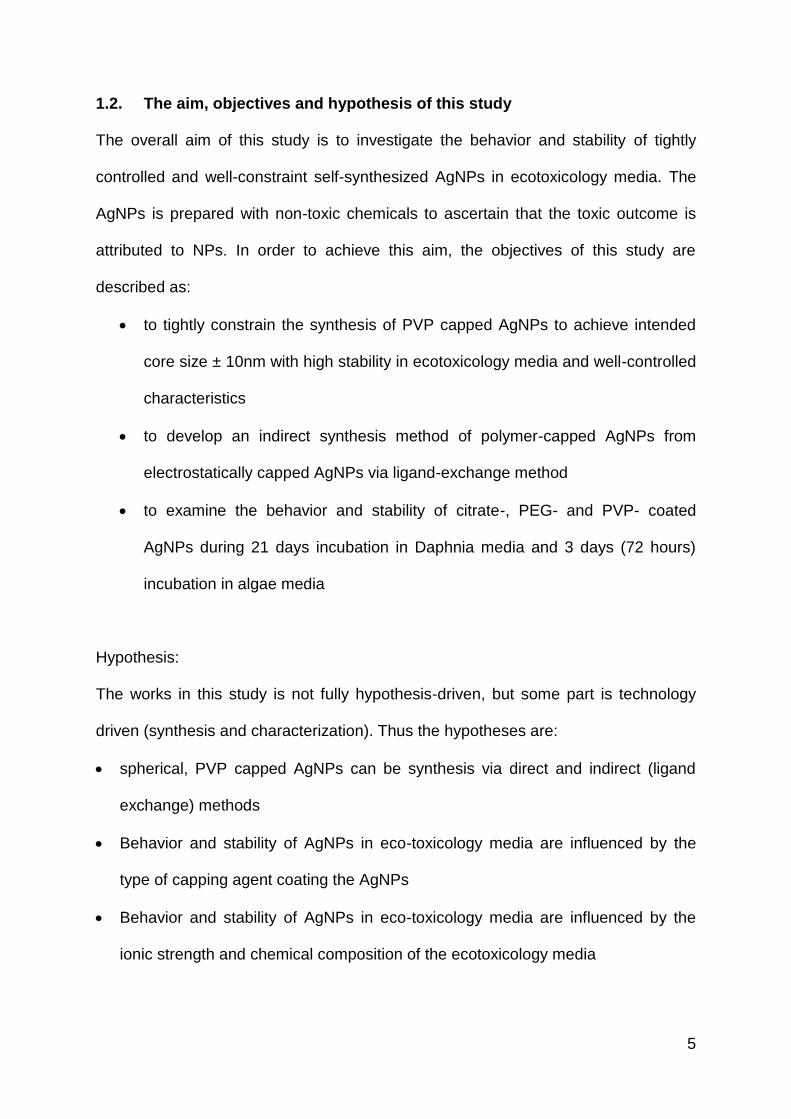
Table 1. 1 The priority list of NPs characterization in any eco-toxicology study(Handy, von
der Kammer et al., 2008) .................................................................................. 4
CHAPTER II
Table 2. 1 Classification and some examples of nanoparticle according to their origin
(Nowack and Bucheli, 2007; Lead and Smith, 2009) ...................................... 12
Table 2. 2 Some examples of natural NPs (Handy, Owen et al., 2008) ............................... 13
Table 2. 3 Number of atoms available on the surface of GaAs NPs(Ju-Nam and Lead, 2008)
....................................................................................................................... 17
CHAPTER III
Table 3. 1 List of chemicals used in this study .................................................................... 54
Table 3. 2 Chemical composition of Daphnia magna sp. immobilization test media (OECD
No. 202) and its variants ................................................................................. 55
Table 3. 3 Chemical composition of Green Algae media or known as Bold Basal Medium
(OECD No. 201) ............................................................................................. 56
Table 3. 4 Volume of reactans added to the cold process reaction...................................... 58
CHAPTER IV
Table 4. 1 Relative concentration of silver ion removed from CP-AgNPs washing process . 78
Table 4. 2 The peak position and width of HP- and CP-AgNPs plasmon ............................. 80
Table 4. 3 The dH and PdI of HP-AgNPs and CP-AgNPs measured by DLS ....................... 83
Table 4. 4 FWHM and PdI of as-synthesised AgNPs .......................................................... 83
Table 4. 5 Calculated dH of AgNPs analysed by Fl-FFF and standardize by 20nm and 30nm
polystyrene NPs ................................................................................................ 85
Table 4. 6 TEM images and core size analysis of PVP-capped AgNPs ............................... 87
Table 4. 7 AFM topographic image and core size analysis of PVP-capped AgNPs ............. 90
Table 4. 8 Comparison of core size measured by TEM and AFM ........................................ 93
Table 4. 9 Zeta potential of PVP capped AgNPs ................................................................. 95
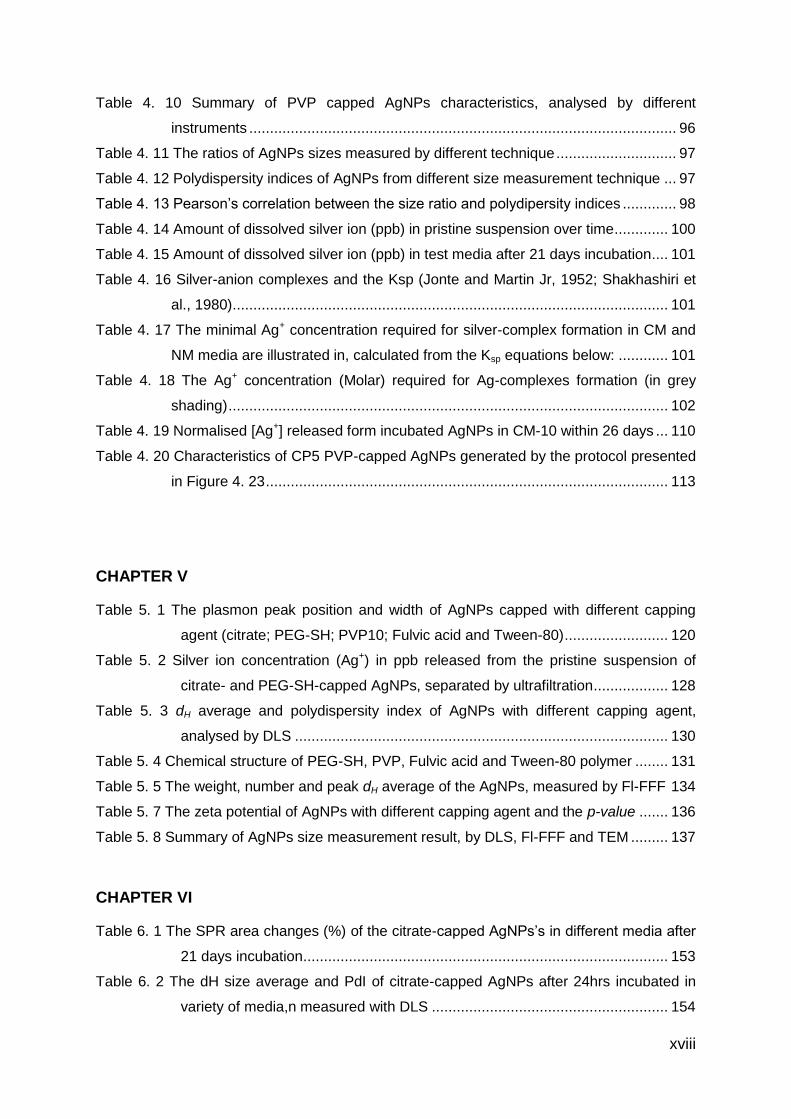
xviii
Table 4. 10 Summary of PVP capped AgNPs characteristics, analysed by different
instruments ....................................................................................................... 96
Table 4. 11 The ratios of AgNPs sizes measured by different technique ............................. 97
Table 4. 12 Polydispersity indices of AgNPs from different size measurement technique ... 97
Table 4. 13 Pearson‘s correlation between the size ratio and polydipersity indices ............. 98
Table 4. 14 Amount of dissolved silver ion (ppb) in pristine suspension over time ............. 100
Table 4. 15 Amount of dissolved silver ion (ppb) in test media after 21 days incubation .... 101
Table 4. 16 Silver-anion complexes and the Ksp (Jonte and Martin Jr, 1952; Shakhashiri et
al., 1980) ......................................................................................................... 101
Table 4. 17 The minimal Ag+ concentration required for silver-complex formation in CM and
NM media are illustrated in, calculated from the Ksp equations below: ............ 101
Table 4. 18 The Ag+ concentration (Molar) required for Ag-complexes formation (in grey
shading) .......................................................................................................... 102
Table 4. 19 Normalised [Ag+] released form incubated AgNPs in CM-10 within 26 days ... 110
Table 4. 20 Characteristics of CP5 PVP-capped AgNPs generated by the protocol presented
in Figure 4. 23 ................................................................................................. 113
CHAPTER V
Table 5. 1 The plasmon peak position and width of AgNPs capped with different capping
agent (citrate; PEG-SH; PVP10; Fulvic acid and Tween-80) ......................... 120
Table 5. 2 Silver ion concentration (Ag+) in ppb released from the pristine suspension of
citrate- and PEG-SH-capped AgNPs, separated by ultrafiltration .................. 128
Table 5. 3 dH average and polydispersity index of AgNPs with different capping agent,
analysed by DLS .......................................................................................... 130
Table 5. 4 Chemical structure of PEG-SH, PVP, Fulvic acid and Tween-80 polymer ........ 131
Table 5. 5 The weight, number and peak dH average of the AgNPs, measured by Fl-FFF 134
Table 5. 7 The zeta potential of AgNPs with different capping agent and the p-value ....... 136
Table 5. 8 Summary of AgNPs size measurement result, by DLS, Fl-FFF and TEM ......... 137
CHAPTER VI
Table 6. 1 The SPR area changes (%) of the citrate-capped AgNPs‘s in different media after
21 days incubation ........................................................................................ 153
Table 6. 2 The dH size average and PdI of citrate-capped AgNPs after 24hrs incubated in
variety of media,n measured with DLS ......................................................... 154
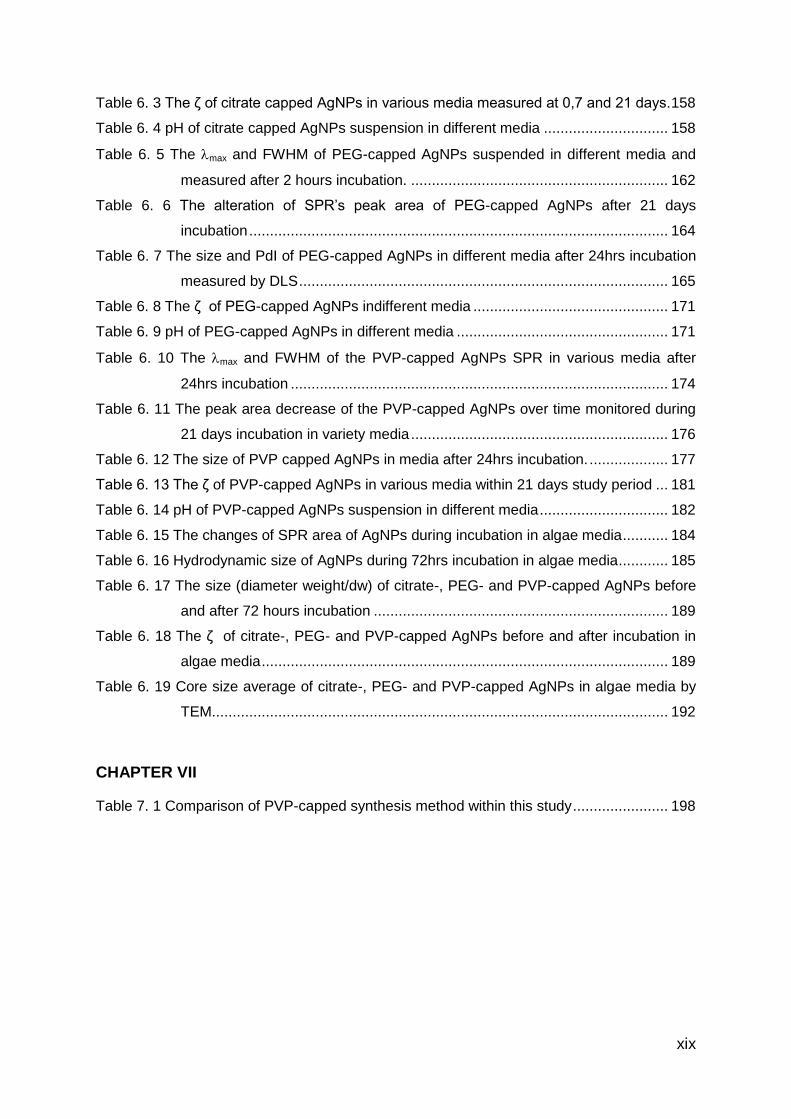
xix
Table 6. 3 The ζ of citrate capped AgNPs in various media measured at 0,7 and 21 days. 158
Table 6. 4 pH of citrate capped AgNPs suspension in different media .............................. 158
Table 6. 5 The max and FWHM of PEG-capped AgNPs suspended in different media and
measured after 2 hours incubation. .............................................................. 162
Table 6. 6 The alteration of SPR‘s peak area of PEG-capped AgNPs after 21 days
incubation ..................................................................................................... 164
Table 6. 7 The size and PdI of PEG-capped AgNPs in different media after 24hrs incubation
measured by DLS ......................................................................................... 165
Table 6. 8 The ζ of PEG-capped AgNPs indifferent media ............................................... 171
Table 6. 9 pH of PEG-capped AgNPs in different media ................................................... 171
Table 6. 10 The max and FWHM of the PVP-capped AgNPs SPR in various media after
24hrs incubation ........................................................................................... 174
Table 6. 11 The peak area decrease of the PVP-capped AgNPs over time monitored during
21 days incubation in variety media .............................................................. 176
Table 6. 12 The size of PVP capped AgNPs in media after 24hrs incubation. ................... 177
Table 6. 13 The ζ of PVP-capped AgNPs in various media within 21 days study period ... 181
Table 6. 14 pH of PVP-capped AgNPs suspension in different media ............................... 182
Table 6. 15 The changes of SPR area of AgNPs during incubation in algae media ........... 184
Table 6. 16 Hydrodynamic size of AgNPs during 72hrs incubation in algae media ............ 185
Table 6. 17 The size (diameter weight/dw) of citrate-, PEG- and PVP-capped AgNPs before
and after 72 hours incubation ....................................................................... 189
Table 6. 18 The ζ of citrate-, PEG- and PVP-capped AgNPs before and after incubation in
algae media .................................................................................................. 189
Table 6. 19 Core size average of citrate-, PEG- and PVP-capped AgNPs in algae media by
TEM.............................................................................................................. 192
CHAPTER VII
Table 7. 1 Comparison of PVP-capped synthesis method within this study ....................... 198
xx
List of Abbreviation
AAS Atomic Absorption Spectroscopy
AFM Atomic Force Microscopy
Ag Argentum (Latin), for Silver
AgNO3 Silver Nitrate
AgNP/s Silver nanoparticle/s
AM Algae media
ASTM American Standard Testing and Material
Au Aurum (Latin), for Gold
BET Brunauer-Emmet-Teller
BSI British Standard Institution
0C Degree Celcius, unit of Temperature
CM Chloride Media, refer to OECD Daphnia sp. media
CNT/s Carbon Nanotube/s
CO2 Carbon dioxide
dH Hydrodynamic diameter
DLS Dynamic Light Scattering
DLVO Derjaguin-Landau-Verwey-Overbeek
DNA Deoxyribonucleic acid
EDL Electric Double Layer
EDX Energy Dispersive Spectoscopy
ENPs Engineered Nanoparticles
EPA Environment Protection Agency (US)
EPS Exo-polysaccharides
FBS Fetal Bouvine Serum
Fl-FFF Flow-Field Flow Fractionation
FTIR Fourier Transform Infra Red
FWHM Full width half maximum
GA Gum Arrabic
GaAs Gallium Arsenide
HRP Horseradish peroxidase
ICP-MS Inductively coupled plasma mass spectrometry
IS Ionic Strength
ISO International standard organization
xxi
KDa Kilo Dalton, is unit of mass. However Dalton is sometimes used
to represent pore size, where 1KDa~ ±1 nm
kV
LC50
Kilo Volt
Lethal concentration-50, is the concentration where 50% of
population was killed
λ Lamda (Latin) for wavelength
mM Milli Molar
MWCO Molecular Weight cut-off, where 90% of molecules larger than
the pore size retained by the membrane
NaCl Sodium Chloride
NM/s Nanomaterial/s or Nitrate media (depends on context)
NOM Natural organic material
nm nanometer
NP/s Nanoparticle/s
NTA Nanoparticle Tracking Analysis
OECD Organization for Economic Cooperation and Development
PAH Polyaromatic hydrocarbon
PAS Publicly Available Specification
PdI Polydispersity Index
PEC Predicted environmental concentration
PEG-SH Thiolated-polyethylene glycol
pH Potential of hydrogen, a measure for acidity
PNEC Predicted no effect concentration
PVP Polyvynilpyrrolidone
rpm Rotation per minute
RQ Risk quotient
S/SA Specific/Surface area
SiO2 Silicon dioxide
SM Sulfate media
SPR Surface Plasmon resonance
TEM Transmission Electron Microscopy
THF Tetrahydrofuran
TiO2 Titanium dioxide
UFPs Ultrafine Particles
UV-Vis Ultraviolet-vissible
WWTP Waste water treatment plant
1
CHAPTER I
INTRODUCTION
1.1. Overview
Nanoscience and nanotechnology have been successful in creating different
types of nanomaterials (NMs), material with at least one dimension of the order of
100 nm or less (BSI, 2005). The novel mechanical, optical, electronic and magnetic
properties exhibited by NMs over their corresponding bulk materials stimulates the
interest in NMs. Inert substances such as gold for instance, will exhibit reactive
properties when it is downsized to the nanoscale (Daniel and Astruc, 2004). Carbon
nanotubes (CNTs), having the same chemical composition with brittle carbon
compounds, show unique mechanical properties including a high tensile elastic
modulus, flexibility and low density(Coleman et al., 2006). These distinctive
properties may arise in part from the significant increase in the high surface-to-
volume ratio as the particle size falls to the nanoscale and the domination of
quantum effects on the properties of NMs (Owens and Poole Jr, 2008).
A number of methods of synthesizing NMs has been developed and can be
grouped into top-down (physical methods), bottom-up (chemical methods) and
biological methods (Wang and Xia, 2004; Ju-Nam and Lead, 2008; Christian, 2009;
Tolaymat et al., 2010). The top-down method synthesizes NMs from the bulk
material via inert-gas evaporation, laser ablation, sputtering, mechanical grinding
and milling, etc. In contrast, the bottom-up method produces NMs from very small
building blocks of materials such as atoms and molecules by the implementation of a
wet chemical method. Through nucleation and growth processes, the small particles
can be built-up into a more complex cluster (Ju-Nam and Lead, 2008; Lee, 2008).
2
Recently, exploration of the biological method has commenced for bio-synthesis of
NMs, but the poorer control over NMs size by bio-methods mean that there are fewer
application where this method is adopted.
The promising novel properties and well-developed synthesis technology of
NMs have accelerated the production and utilization of NMs in many consumer
products. Silver nanoparticles (AgNPs) are particularly widely used as AgNPs exhibit
wide-range antimicrobial properties. According to Woodrow Wilson Centre study,
313 out of 1317 nano-products contain AgNPs, and this figure has increased by
more than ten times within five years (PEN, 2013). This rapid increase of AgNP
commercialization raises concern over its potential release to the environment and
the consequent adverse effects (Nowack and Bucheli, 2007; Ju-Nam and Lead,
2008). Therefore the risk from NMs, as a function of exposure and the hazards,
needs to be assessed either by an exposure-driven or a hazard-driven approach to
prevent deleterious effect both on human and environmental health (Baalousha and
Lead, 2007; Pettitt and Lead, 2013).
The release of AgNPs to the environment from washing machines, textiles,
and paint containing AgNPs has been demonstrated (Benn and Westerhoff, 2008;
Geranio et al., 2009; Kaegi et al., 2010; Farkas et al., 2011) with significant
speciation alteration due to chemical reactions with the detergent and bleaching
agent, and also effect of mechanical stresses from the washing machine (Impellitteri
et al., 2009). Number of (eco)toxicology findings has also been reported (Fabrega et
al., 2011; Batley et al., 2012), however, establishing an association between NP
characteristics and the observed toxic effect was unsuccessful due to the lack of
characterization data of most of the NPs used (Foss Hansen et al., 2007). Better
3
characterization of NPs in (eco)toxicology studies is very important as there may or
may not be a relationship between NPs characteristics and toxic outcome.
NPs are also very reactive and dynamically transformed due to their
interaction with biotic and abiotic components of the media. Thus undefined NP
behavior during exposure in most (eco)toxicology studies complicates the dose-
response relationship (Fabrega, Luoma et al., 2011). These complication is caused
by concentration changes during incubation due to aggregation, dissolution, phase
transformation, etc that lead to material losses (Figure 1.1) (Franklin et al., 2007;
Navarro et al., 2008; Batley, Kirby et al., 2012; Levard et al., 2012; Lorenz et al.,
2012; Lowry et al., 2012). Variation in characteristics of NMs between syntheses
batches have to be controlled to obtain a consistent hazard identification result.
Therefore a number of attempts has to be made to improve the course of NM hazard
investigation: controlling synthesis processes to obtain consistent NM properties,
fully characterizing the NMs, and examining the behavior of NPs in the media that
the NMs are exposed to, especially within eco-toxicology studies in which oral dosing
of NPs occurs (Crane et al., 2008).
Various lists of physico-chemical characteristics of NPs relevant to
ecotoxicology studies have been proposed (Crane, Handy et al., 2008; Warheit,
2008; Scown et al., 2010) and the priorities according to Pettitt and Lead (2013) are
presented in Table 1.1. The incubation conditions such as the media chemical
composition, pH, total ion and divalent ion content, organic matter and ionic strength
also needs to be reported (Handy et al., 2008).
This study, as part of larger eco-toxicology study that investigates the toxic
effect of silver nanoparticle (AgNPs) with different capping agents on Daphnia
magna sp., examines the physico-chemical characteristics of AgNPs in pristine
4
suspensions and in eco-toxicology media, to be able to understand the behavior of
AgNPs during the exposure studies. The AgNPs were synthesized during the course
of this work, to ensure that NPs with well-controlled properties were used.
Figure 1. 1 The illustration of NMs behavior, fate and transformation in the aquatic and terrestrial environment (Batley, Kirby et al., 2012)
Table 1. 1 The priority list of NPs characterization in any eco-toxicology study(Handy, von der Kammer et al., 2008)
Characterization
Pre-exposure Post-exposure
Dose/concentration Mass Mass
Particle number Particle number
Surface area Surface area
Physical form Particle size (mean) Particle size (mean)
Particle size (distribution) Particle size (distribution)
Agglomerate (morphology) Agglomerate (morphology)
Dissolution
Surface properties Shell chemistry/coating Shell chemistry/coating
Surface charge/zeta potential Surface charge/zeta potential
5
1.2. The aim, objectives and hypothesis of this study
The overall aim of this study is to investigate the behavior and stability of tightly
controlled and well-constraint self-synthesized AgNPs in ecotoxicology media. The
AgNPs is prepared with non-toxic chemicals to ascertain that the toxic outcome is
attributed to NPs. In order to achieve this aim, the objectives of this study are
described as:
to tightly constrain the synthesis of PVP capped AgNPs to achieve intended
core size ± 10nm with high stability in ecotoxicology media and well-controlled
characteristics
to develop an indirect synthesis method of polymer-capped AgNPs from
electrostatically capped AgNPs via ligand-exchange method
to examine the behavior and stability of citrate-, PEG- and PVP- coated
AgNPs during 21 days incubation in Daphnia media and 3 days (72 hours)
incubation in algae media
Hypothesis:
The works in this study is not fully hypothesis-driven, but some part is technology
driven (synthesis and characterization). Thus the hypotheses are:
spherical, PVP capped AgNPs can be synthesis via direct and indirect (ligand
exchange) methods
Behavior and stability of AgNPs in eco-toxicology media are influenced by the
type of capping agent coating the AgNPs
Behavior and stability of AgNPs in eco-toxicology media are influenced by the
ionic strength and chemical composition of the ecotoxicology media
6
1.3. Structure of the thesis
This thesis is comprised of eight chapters covering the issues described below:
Chapter 1 is an introduction chapter which describes the general overview of NMs
synthesis, production, exposure, hazards, and the corresponding risk assessments.
The uncertainty of eco(toxicology) studies is reviewed in term of hazard identification
and some suggestions to overcome the uncertainties are discussed. The aim,
objectives and hypotheses of this study are presented.
Chapter 2 is the background chapter which explains about the NPs definition,
classification, properties, transformation, synthesis, chracaterization and the reasons
of choosing silver nNPs in this study.
Chapter 3 describes the practical methods implemented in this study, including
descriptions of material and equipment used, the AgNPs synthesis methods,
instrumentations and sample preparation for characterization purposes, and the
methods adopted for the stability studies.
Chapter 4 presents and discusses the characteristics of AgNPs generated from the
hot and the cold processes. The results from initial dissolution studies of PVP-
capped AgNPs in different media performed by different techniques will also be
presented.
Chapter 5 presents and discusses the synthesis of polymer-capped AgNPs from
electrostatically-stabilised NPs via a ligand-exchange method. Characteristics of
AgNPs before and after ligand-exchange will be presented and compared.
Chapter 6 presents and discusses the behavior of AgNPs in different eco-toxicology
media. Three different types of NPs were prepared with different capping
agents.The OECD Daphnia magna immobilization media and variants, and algae
media were used for stability test of the AgNPs.
7
Chapter 7 is the summary and conclusions of this study. Some recommendations for
future work are also presented.
Appendix A presents the ionic strength calculation of the media used in this study
Appendix B shows some TEM images of AgNPs after incubated in ecotoxicology
media
8
CHAPTER II
BACKGROUND
2.1. History of nanotechnology
Although the term ―nanotechnology‖ was coined later by the Japanese
scientist Norio Taniguchi (1974)(RS, 2004), the concept of nanotechnology was
originally introduced by the physicist Richard P. Feynman in his lecture ―There‘s
plenty of room at the bottom‖, given at the American Physical Society meeting in
1959 (Wang et al., 1999). Feynman set out the idea of manipulating and controlling
materials by exploiting the laws of physics to produce materials at a very small scale.
Feynman also described the potential of his application to the sciences (biology and
chemistry) and predicted a range of application for example printing a book on the
head of a pin, miniaturising the computers and machinery, and emphasized the
importance of improving the electron microscopy for analysing very tiny
materials(Wang, Xu et al., 1999).
Since 2001 nanotechnology has moved toward commercialization from
research and development in the laboratory, and the value of nanotechnology
products globally is forecast to grow from € 200 billion in 2009 into € 2 trillion in
2015 (EU, 2013). This emphasises that nanotechnology is expected to have a
substantial impact into world economics.
Due to the range of applications of nanomaterials in different products, the
potential for exposure and consequent risk to humans and the environment raises
concerns. Since NMs show unique properties, their fate and behaviour in the
environment and also the toxic effect following NPs exposure might be different from
conventional chemical equivalent (Luoma, 2008). Therefore the growth of
9
nanotechnology has also stimulated the development of sciences exploiting the
benefits and assessing the risk of nanoproducts such as nanoscience,
nanomedicine, nano(eco)toxicology, etc (Curtis et al., 2006).
2.2. Definition of Nanomaterials
More than a 1,600 of nano-containing consumer products have been
commersialised and are available in the market (PEN, 2013) and many more are
waiting in the pipeline. A practicable and unambiguous definition of nanomaterials,
however has not been agreed upon (Kreyling 2010) as different stakeholders have
different points of view, for example, nanoengineers and nanotoxicologists focus the
definition on the effect of NMs, and legislators need a reasonably simple definition
with a clear-cut limit (Lidén, 2011). A consistent definition is also required for
providing sufficient information to consumers, to promote consistency in the
interpretation by producers, users and regulators, and for notification purposes if
materials need closer inspection (Bleeker et al., 2013).
Even though the definition of NPs as material with size range 1-100nm has
been widely used (BSI, 2005), other definitions have also been suggested. Figure
2.1 shows the length of the nanometer compared to other objects. In pharmaceutics,
based on their biogenic properties the NP was defined as polymeric NPs in size
range 10-1000nm, designed for carrying drugs (Oberdörster et al., 1994; Shi et al.,
2013). The evidence of novel properties is also suggested as the criterion in defining
metal and metal oxide NPs rather than the size alone, and 30nm has been proposed
as the threshold size of NPs due to the appearance of novel properties at this size
and smaller (Auffan et al., 2009). Some flexibility of the size threshold is also needed
10
in (eco)toxicology studies because the interest is in the evidence of novel toxic effect
rather than size threshold only (Handy et al., 2008).
Recently, the Joint Research Centre (JRC) of the European Commission has
published a recommendation for nanomaterial as (Rauscher et al., 2014):
“natural, incidental or manufactured material containing particles, in an unbound state or as
an aggregate or as agglomerate and where, for 50% or more of the particles in the number
size distribution, one or more external dimensions is in the size range 1nm-100 nm.
In specific cases where warranted by concerns for the environment, health, safety or
competitiveness the number size distribution threshold of 50% may be replaced by a
threshold between 1% and 50%”
Another issue arise. For practical application of the definition stated above,
guidance on the size measurement method for a number-based size distribution is
required as different methods give different dimensions (hydrodynamic,
aerodynamic, core diameter, etc) (Bleeker, de Jong et al., 2013). Following the
publication of the NMs definition, European Food Safety Authority (EFSA)
recommends to use of at least two different techniques for NMs characterization and
states that one of them should be an electron microscopy method (EFSA, 2011). For
scientific purposes, especially for (eco)toxicology studies in which the knowledge
about which characteristics of NMs can be attributed to toxic response is still largely
unknown, multi-method characterization is recommended (Domingos et al., 2009).
11
Fig
ure
2
. 1 L
en
gth
sca
le sh
ow
ing th
e n
an
om
ete
r in
co
nte
xt
(RS
,
2004
)
12
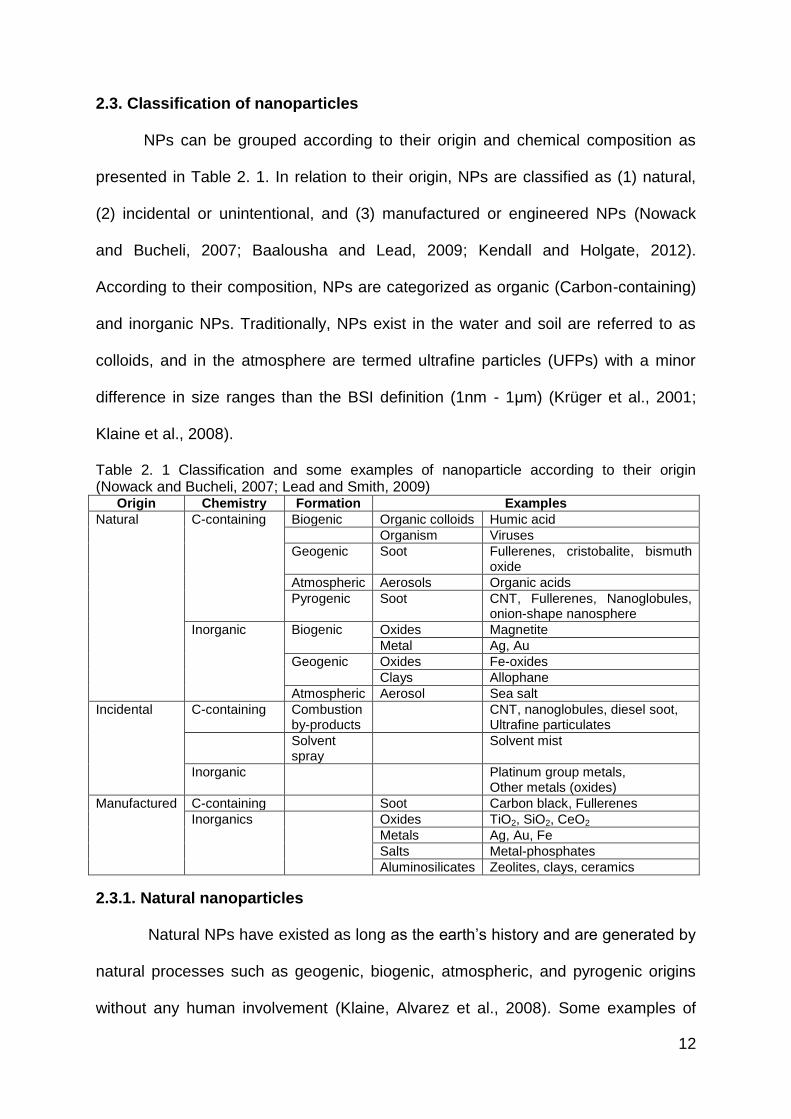
2.3. Classification of nanoparticles
NPs can be grouped according to their origin and chemical composition as
presented in Table 2. 1. In relation to their origin, NPs are classified as (1) natural,
(2) incidental or unintentional, and (3) manufactured or engineered NPs (Nowack
and Bucheli, 2007; Baalousha and Lead, 2009; Kendall and Holgate, 2012).
According to their composition, NPs are categorized as organic (Carbon-containing)
and inorganic NPs. Traditionally, NPs exist in the water and soil are referred to as
colloids, and in the atmosphere are termed ultrafine particles (UFPs) with a minor
difference in size ranges than the BSI definition (1nm - 1μm) (Krüger et al., 2001;
Klaine et al., 2008).
Table 2. 1 Classification and some examples of nanoparticle according to their origin (Nowack and Bucheli, 2007; Lead and Smith, 2009)
Origin Chemistry Formation Examples
Natural C-containing Biogenic Organic colloids Humic acid
Organism Viruses
Geogenic Soot Fullerenes, cristobalite, bismuth oxide
Atmospheric Aerosols Organic acids
Pyrogenic Soot CNT, Fullerenes, Nanoglobules, onion-shape nanosphere
Inorganic Biogenic Oxides Magnetite
Metal Ag, Au
Geogenic Oxides Fe-oxides
Clays Allophane
Atmospheric Aerosol Sea salt
Incidental C-containing Combustion by-products
CNT, nanoglobules, diesel soot, Ultrafine particulates
Solvent spray
Solvent mist
Inorganic Platinum group metals, Other metals (oxides)
Manufactured C-containing Soot Carbon black, Fullerenes
Inorganics Oxides TiO2, SiO2, CeO2
Metals Ag, Au, Fe
Salts Metal-phosphates
Aluminosilicates Zeolites, clays, ceramics
2.3.1. Natural nanoparticles
Natural NPs have existed as long as the earth‘s history and are generated by
natural processes such as geogenic, biogenic, atmospheric, and pyrogenic origins
without any human involvement (Klaine, Alvarez et al., 2008). Some examples of
13
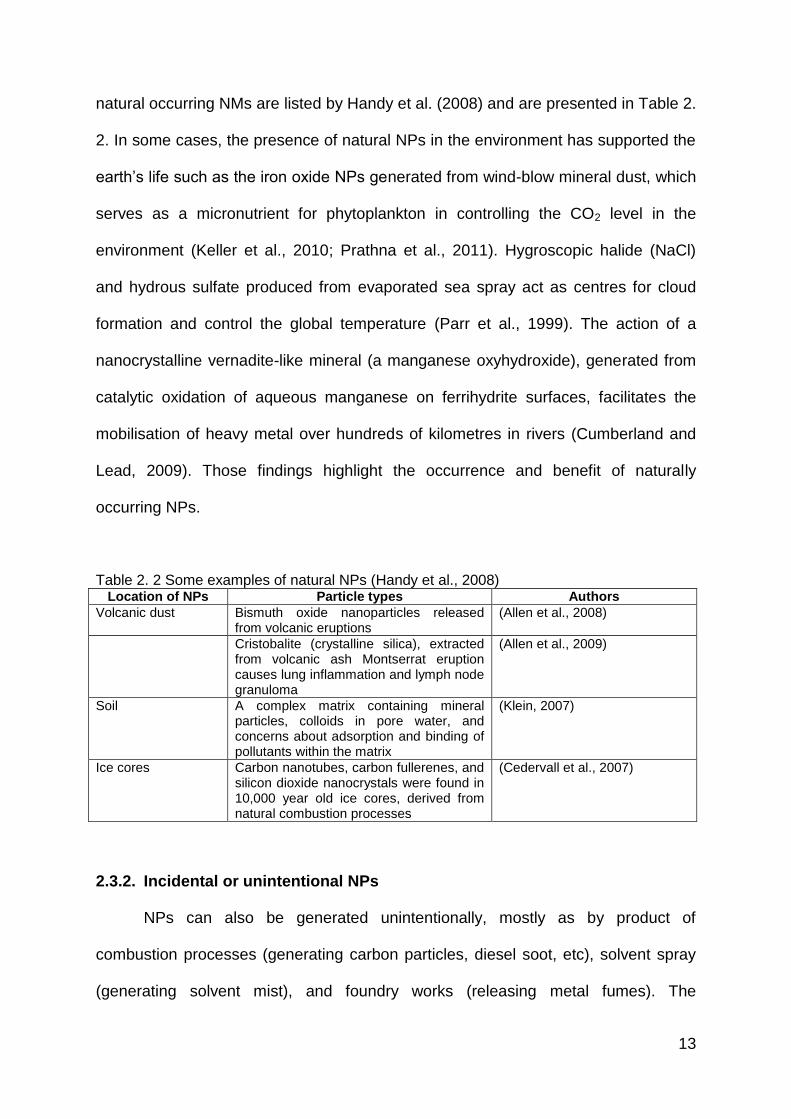
natural occurring NMs are listed by Handy et al. (2008) and are presented in Table 2.
2. In some cases, the presence of natural NPs in the environment has supported the
earth‘s life such as the iron oxide NPs generated from wind-blow mineral dust, which
serves as a micronutrient for phytoplankton in controlling the CO2 level in the
environment (Keller et al., 2010; Prathna et al., 2011). Hygroscopic halide (NaCl)
and hydrous sulfate produced from evaporated sea spray act as centres for cloud
formation and control the global temperature (Parr et al., 1999). The action of a
nanocrystalline vernadite-like mineral (a manganese oxyhydroxide), generated from
catalytic oxidation of aqueous manganese on ferrihydrite surfaces, facilitates the
mobilisation of heavy metal over hundreds of kilometres in rivers (Cumberland and
Lead, 2009). Those findings highlight the occurrence and benefit of naturally
occurring NPs.
Table 2. 2 Some examples of natural NPs (Handy et al., 2008) Location of NPs Particle types Authors
Volcanic dust Bismuth oxide nanoparticles released from volcanic eruptions
(Allen et al., 2008)
Cristobalite (crystalline silica), extracted from volcanic ash Montserrat eruption causes lung inflammation and lymph node granuloma
(Allen et al., 2009)
Soil A complex matrix containing mineral particles, colloids in pore water, and concerns about adsorption and binding of pollutants within the matrix
(Klein, 2007)
Ice cores Carbon nanotubes, carbon fullerenes, and silicon dioxide nanocrystals were found in 10,000 year old ice cores, derived from natural combustion processes
(Cedervall et al., 2007)
2.3.2. Incidental or unintentional NPs
NPs can also be generated unintentionally, mostly as by product of
combustion processes (generating carbon particles, diesel soot, etc), solvent spray
(generating solvent mist), and foundry works (releasing metal fumes). The
14
automotive catalytic converters were found to release platinum and rhodium NPs
unintentionally with traffic density and driving speed as the factors controlling their
concentration level (Levard, Hotze et al., 2012; Lowry et al., 2012).
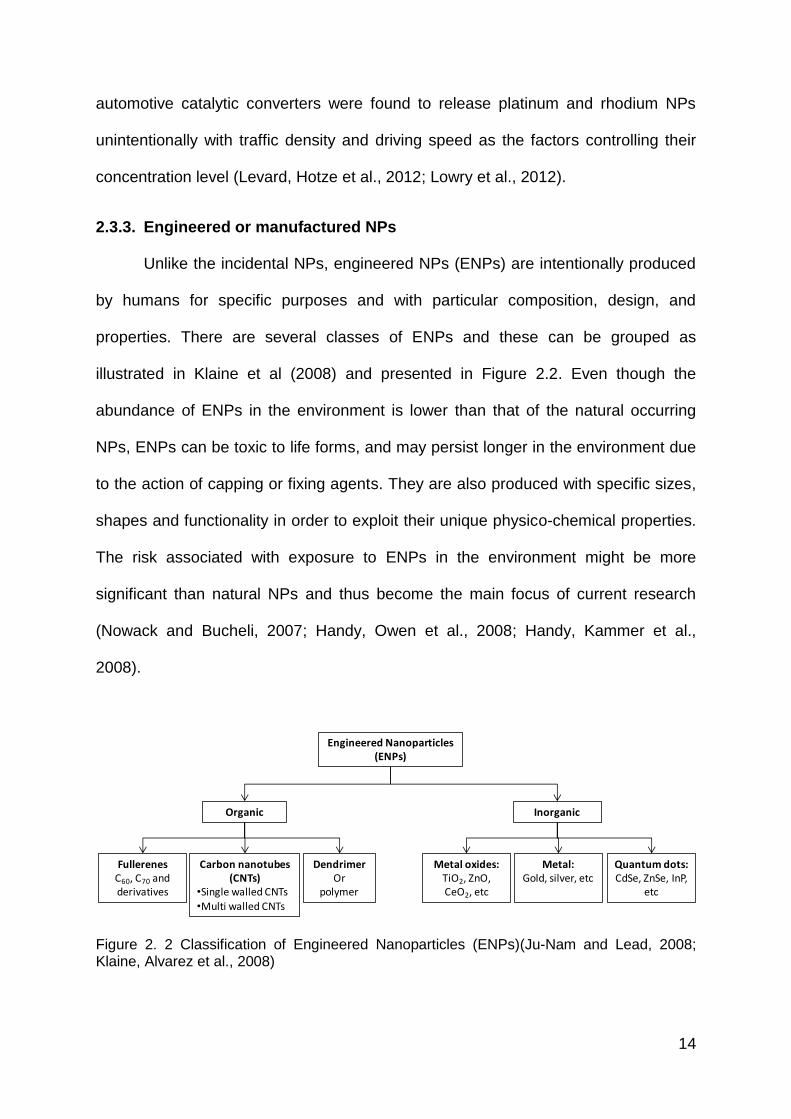
2.3.3. Engineered or manufactured NPs
Unlike the incidental NPs, engineered NPs (ENPs) are intentionally produced
by humans for specific purposes and with particular composition, design, and
properties. There are several classes of ENPs and these can be grouped as
illustrated in Klaine et al (2008) and presented in Figure 2.2. Even though the
abundance of ENPs in the environment is lower than that of the natural occurring
NPs, ENPs can be toxic to life forms, and may persist longer in the environment due
to the action of capping or fixing agents. They are also produced with specific sizes,
shapes and functionality in order to exploit their unique physico-chemical properties.
The risk associated with exposure to ENPs in the environment might be more
significant than natural NPs and thus become the main focus of current research
(Nowack and Bucheli, 2007; Handy, Owen et al., 2008; Handy, Kammer et al.,
2008).
Figure 2. 2 Classification of Engineered Nanoparticles (ENPs)(Ju-Nam and Lead, 2008; Klaine, Alvarez et al., 2008)
Engineered Nanoparticles(ENPs)
Organic Inorganic
FullerenesC60, C70 and derivatives
Carbon nanotubes(CNTs)
•Single walled CNTs•Multi walled CNTs
DendrimerOr
polymer
Metal oxides:TiO2, ZnO, CeO2, etc
Metal:Gold, silver, etc
Quantum dots:CdSe, ZnSe, InP,
etc
15
2.4. Properties of nanoparticle
Scaling down material dimensions into the nanoscale may alter both physical
and chemical properties of materials. The yellow colour of bulk gold material turns
into deep-red colour when the gold size approach the nanoscale as has been
recorded in the well-known work of Faraday in 1857 (Kelly et al., 2003; Daniel and
Astruc, 2004). The absorbance of AuNPs at λ=520nm, generated by the interaction
of the collective oscillation of free electrons on the NP surface and its interaction with
incoming light termed as Surface Plasmon Resonance (SPR) can be used for
AuNPs characterization (Kelly, Coronado et al., 2003; Lee, 2008; Vollath, 2008) and
will be further discussed in section 2.7.2.1. Inert gold material turns chemically
reactive when it is downsized according to the surprising discovery of Haruta et al.
(1989). They observed catalytic reactivity of AuNPs supported on Co3O4.Fe2O3 for
CO and H2 oxidation, methanol combustion, NO reduction, etc (Haruta et al., 1989;
Haruta, 1997; 2004) and the reaction rate depends on AuNPs size (Tsunoyama et
al., 2005). Other novel optical, electronic, magnetic and biological properties of NPs
have also been revealed (Daniel and Astruc, 2004; El-Sayed, 2004). Therefore size
does matter in exploiting unique properties of materials.
There are at least two elementary consequences of reducing the size that
drive the appearance of nanoparticles novel properties. They are the high ratio of
surface area to volume and the domination of quantum effect (RS, 2004). The
following paragraph will discuss the way that those two factors are driving the novel
properties of NPs.
16
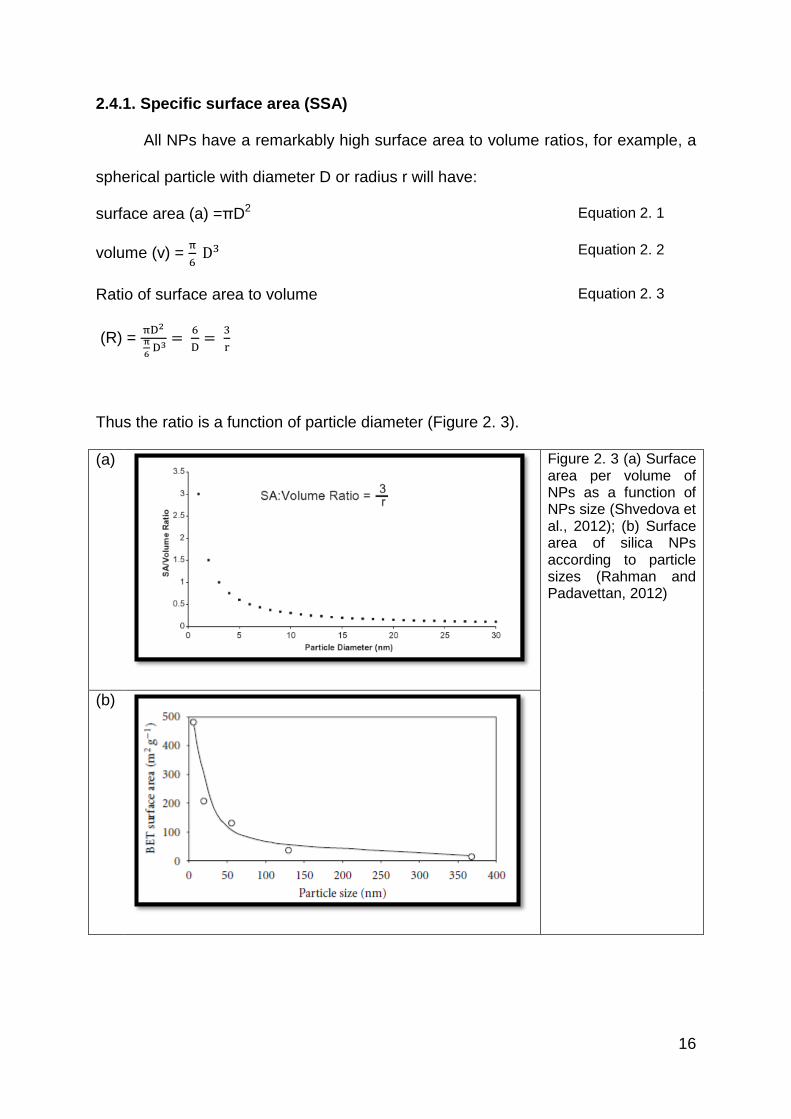
2.4.1. Specific surface area (SSA)
All NPs have a remarkably high surface area to volume ratios, for example, a
spherical particle with diameter D or radius r will have:
surface area (a) =πD2 Equation 2. 1
volume (v) =
Equation 2. 2
Ratio of surface area to volume
(R) =
Equation 2. 3
Thus the ratio is a function of particle diameter (Figure 2. 3).
(a)
Figure 2. 3 (a) Surface area per volume of NPs as a function of NPs size (Shvedova et al., 2012); (b) Surface area of silica NPs according to particle sizes (Rahman and Padavettan, 2012)
(b)
17
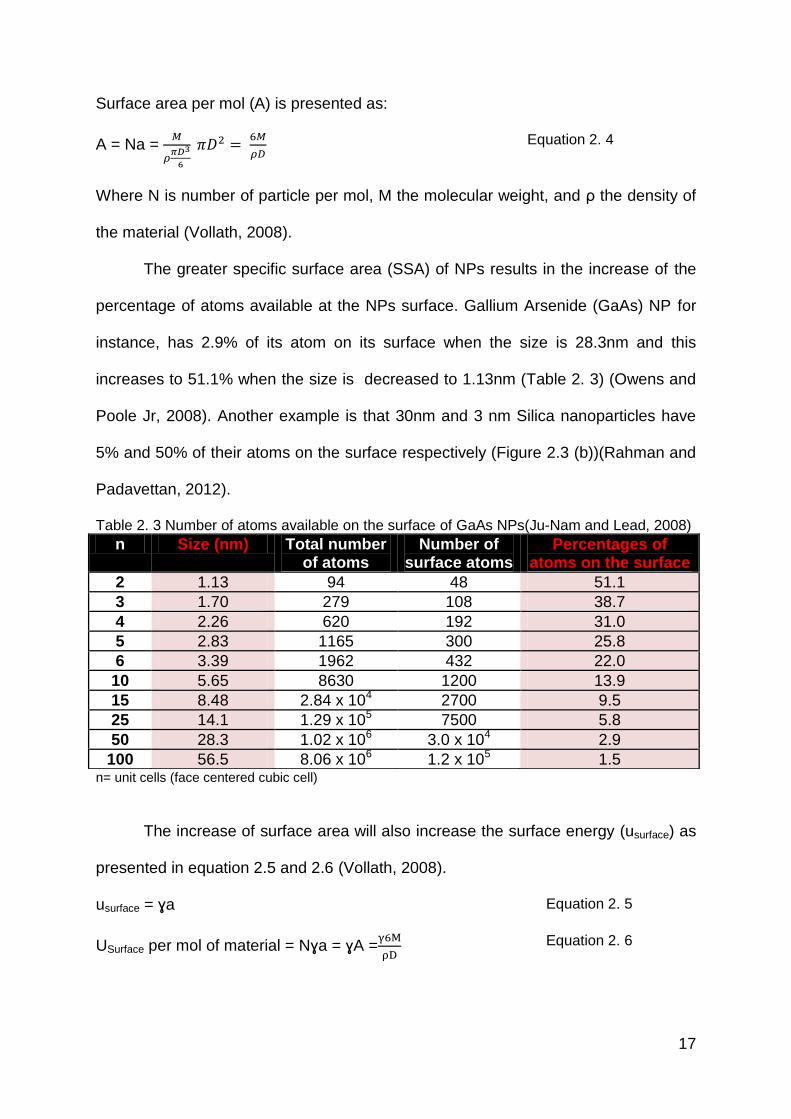
Surface area per mol (A) is presented as:
A = Na =
Equation 2. 4
Where N is number of particle per mol, M the molecular weight, and ρ the density of
the material (Vollath, 2008).
The greater specific surface area (SSA) of NPs results in the increase of the
percentage of atoms available at the NPs surface. Gallium Arsenide (GaAs) NP for
instance, has 2.9% of its atom on its surface when the size is 28.3nm and this
increases to 51.1% when the size is decreased to 1.13nm (Table 2. 3) (Owens and
Poole Jr, 2008). Another example is that 30nm and 3 nm Silica nanoparticles have
5% and 50% of their atoms on the surface respectively (Figure 2.3 (b))(Rahman and
Padavettan, 2012).
Table 2. 3 Number of atoms available on the surface of GaAs NPs(Ju-Nam and Lead, 2008)
n= unit cells (face centered cubic cell)
The increase of surface area will also increase the surface energy (usurface) as
presented in equation 2.5 and 2.6 (Vollath, 2008).
usurface = ɣa Equation 2. 5
USurface per mol of material = Nɣa = ɣA =
Equation 2. 6
n Size (nm) Total number of atoms
Number of surface atoms
Percentages of atoms on the surface
2 1.13 94 48 51.1
3 1.70 279 108 38.7
4 2.26 620 192 31.0
5 2.83 1165 300 25.8
6 3.39 1962 432 22.0
10 5.65 8630 1200 13.9
15 8.48 2.84 x 10⁴ 2700 9.5
25 14.1 1.29 x 10⁵ 7500 5.8
50 28.3 1.02 x 10⁶ 3.0 x 10⁴ 2.9
100 56.5 8.06 x 10⁶ 1.2 x 10⁵ 1.5
18
Equation 2.6 states that the surface energy per mole increase as the particle size
decrease, hence for NPs reducing the size of particle will have dramatic effect to the
surface energy.
Since NP growth and catalytic reactions occur at the surface of material, the
increase of surface energy due to scaling down the size of material will enhance
those two processes. The aggregation or growth rate of smaller particles is higher
than larger particles as shown by a syudy of hematite (He et al., 2008) where the
decrease of surface energy was the driving force for aggregation. Further discussion
of aggregation will be presented in section 2.5.2. Catalytic properties of AuNPs as
discussed earlier, are imparted by size and surface energy effects (Lopez and
Nørskov, 2002; Daniel and Astruc, 2004). Other nanoparticles such as Palladium,
ceria and Pt3Co also showed size-dependent catalytic properties (Zhang et al., 2003;
Zhou et al., 2006; Wang et al., 2009).
The increase of surface area in crystalline solids will also enhance the
mechanical properties of materials as the greater interface area within the materials
is able to arrest the propagation of defects caused by stresses (RS, 2004; Meyers et
al., 2006; Casals et al., 2011). For example, the hardness value (H) of nitride
compounds such as TiN/NbN and TiN/ZrN film with ~180 layers (monolayer
thickness ~ 10nm) is about 70-80 GPa, similar to that of diamond, due to the
interface boundaries and lattice mismatch occurrence (Hu et al., 2011). The
dependence of hardness to the particle size is found to follow Hall-Petch relationship
(equation 2.7)(Meyers, Mishra et al., 2006).
Equation 2. 7
Where H(L): is hardness of NPs size; H0 is hardness friction stress in the absence of
grain boundaries; A is a constant and L is grain size.
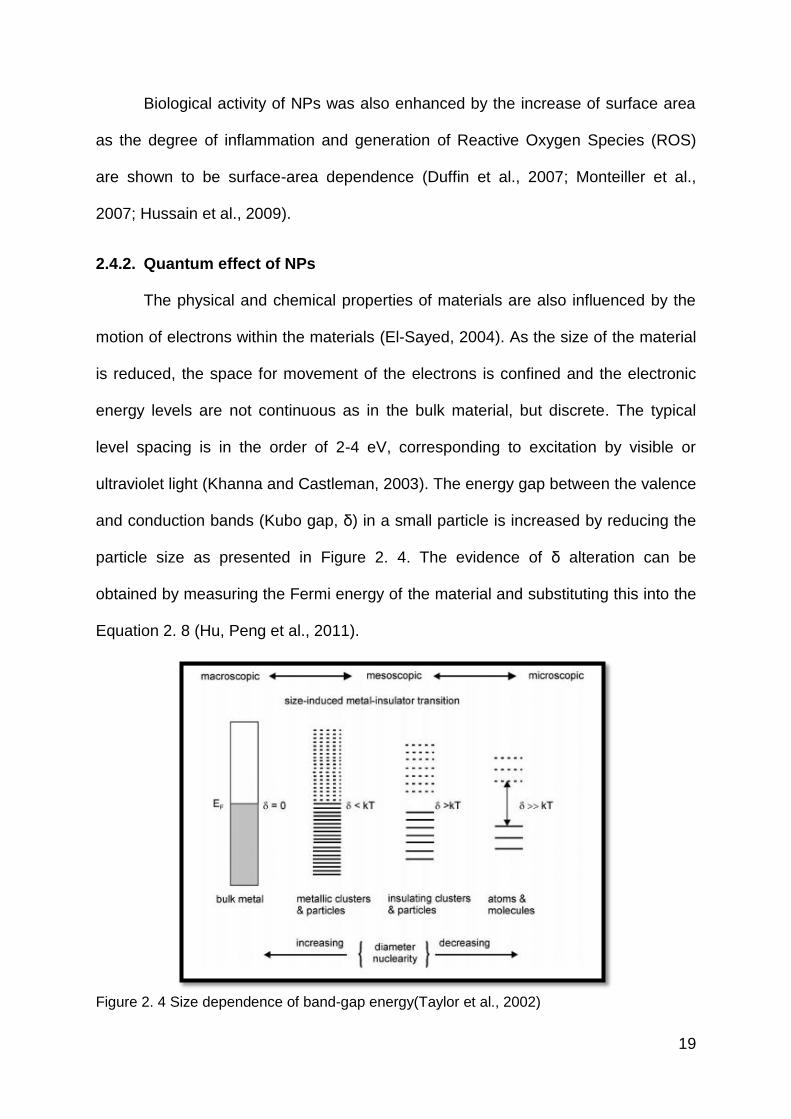
19
Biological activity of NPs was also enhanced by the increase of surface area
as the degree of inflammation and generation of Reactive Oxygen Species (ROS)
are shown to be surface-area dependence (Duffin et al., 2007; Monteiller et al.,
2007; Hussain et al., 2009).
2.4.2. Quantum effect of NPs
The physical and chemical properties of materials are also influenced by the
motion of electrons within the materials (El-Sayed, 2004). As the size of the material
is reduced, the space for movement of the electrons is confined and the electronic
energy levels are not continuous as in the bulk material, but discrete. The typical
level spacing is in the order of 2-4 eV, corresponding to excitation by visible or
ultraviolet light (Khanna and Castleman, 2003). The energy gap between the valence
and conduction bands (Kubo gap, δ) in a small particle is increased by reducing the
particle size as presented in Figure 2. 4. The evidence of δ alteration can be
obtained by measuring the Fermi energy of the material and substituting this into the
Equation 2. 8 (Hu, Peng et al., 2011).
Figure 2. 4 Size dependence of band-gap energy(Taylor et al., 2002)
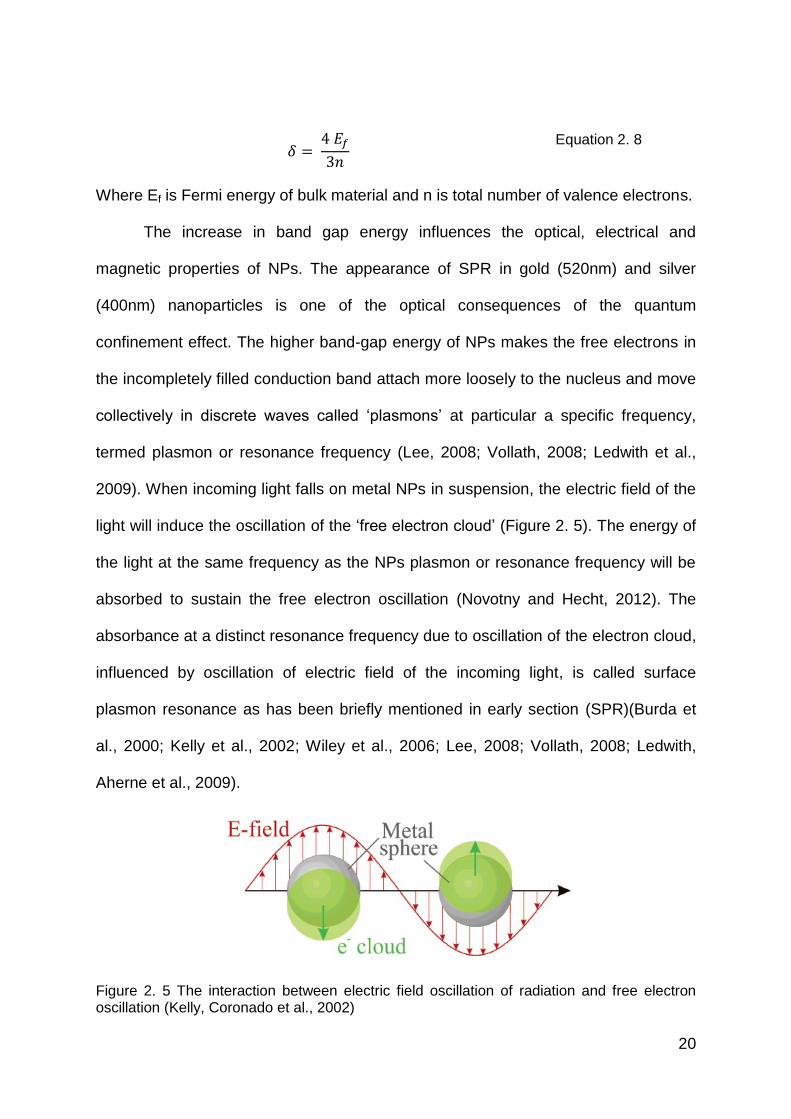
20
Equation 2. 8
Where Ef is Fermi energy of bulk material and n is total number of valence electrons.
The increase in band gap energy influences the optical, electrical and
magnetic properties of NPs. The appearance of SPR in gold (520nm) and silver
(400nm) nanoparticles is one of the optical consequences of the quantum
confinement effect. The higher band-gap energy of NPs makes the free electrons in
the incompletely filled conduction band attach more loosely to the nucleus and move
collectively in discrete waves called ‗plasmons‘ at particular a specific frequency,
termed plasmon or resonance frequency (Lee, 2008; Vollath, 2008; Ledwith et al.,
2009). When incoming light falls on metal NPs in suspension, the electric field of the
light will induce the oscillation of the ‗free electron cloud‘ (Figure 2. 5). The energy of
the light at the same frequency as the NPs plasmon or resonance frequency will be
absorbed to sustain the free electron oscillation (Novotny and Hecht, 2012). The
absorbance at a distinct resonance frequency due to oscillation of the electron cloud,
influenced by oscillation of electric field of the incoming light, is called surface
plasmon resonance as has been briefly mentioned in early section (SPR)(Burda et
al., 2000; Kelly et al., 2002; Wiley et al., 2006; Lee, 2008; Vollath, 2008; Ledwith,
Aherne et al., 2009).
Figure 2. 5 The interaction between electric field oscillation of radiation and free electron oscillation (Kelly, Coronado et al., 2002)
21
Quantum confinement of nanoparticles also enhances the electrical
conduction of NMs (Rao et al., 2002; Mak et al., 2009; Hu, Peng et al., 2011). The
mechanism of conduction changes from diffusive to ballistics when the dimension of
NPs reach the mean free path length of electrons and the conductance in NMs is no
longer influenced the by type and geometry of the materials as in the case for the
bulk material (Vollath, 2008).
Conductance of bulk wire
Equation 2. 9
Conductance of nanowire
Equation 2. 10
Where δ is electrical conductivity (material-dependent property), L length of wire, A
cross-section, e charge of electron, m active mode in wire and h plank constant.
Another important effect of down-sizing material is the enhancement of
paramagnetic and ferromagnetic properties. Superparamagnetism and
superferromagnetism of materials has been observed when the size of material is
scalled down, such as shown by Ni-NPs embedded in SiO2 (Fonseca et al., 2002). In
fact, diamagnetic material such as gold shows size-dependent ferromagnetic
properties (Hori et al., 2004). This enhancement of magnetic properties with
decreasing size is due to the presence of single magnetic domains in a small size
range of particles and can be exploited for developing highly sensitive sensor
devices and high-density data-storage applications (Andrievski, 2009).
2.5. Transformation of NPs
Due to their high surface area, surface energy, and surface atom availability,
NPs are very reactive to the immediate environment. Both biotic and abiotic
components of the media, and also the ambient atmospheric environment have
22
shown to influence the stability and behavior of NPs (Elechiguerra et al., 2005; Bone
et al., 2012; Unrine et al., 2012) . Stability of NPs in terms of size, shape, dispersion
state, chemical composition and speciation stability, and the behavior of NPs such
as aggregation and dissolution determine the NPs fate in the environment and the
toxic effect following their exposure to organisms (Thomas et al., 1999; Crane,
Handy et al., 2008; Handy, Kammer et al., 2008; Hassellov et al., 2008; EU, 2013).
Thus understanding the types, rate and the magnitude of NPs transformation, which
might be different from the reactivity of the corresponding bulk materials is very
important in order to understand the NPs persistency, bioavailability/biouptake,
reactivity and toxicity (Lowry, Gregory et al., 2012).
Lowry et al. (2012) categorized the nanomaterials transformation as chemical,
physical and biological transformations in the environment. In the following section,
those three processes will be discussed.
2.5.1. Chemical transformation
The chemical properties of NPs in the environment can be altered due to
oxidation, reduction, dissolution, sulfidation, photo-reactivity, adsorption, etc. Even
though the rate of reaction is largely unknown, but the occurrence of chemical
transformation has been presented in number of studies. The release of ions such as
Ag+ from Ag0 (Figure 2. 6 (a)) (Kittler et al., 2010; Liu and Hurt, 2010), Zn2+ from ZnO
NPs and Cd2+ from TOPO-capped CdSe quantum dots (Figure 2. 6 (b)) due to
oxidation was presented in various studies and rendered the material toxic to
organisms (Franklin et al., 2007; Navarro et al., 2008; Kittler, Greulich et al., 2010;
Yang et al., 2011). Oxidising environments such as natural water, atmospheric
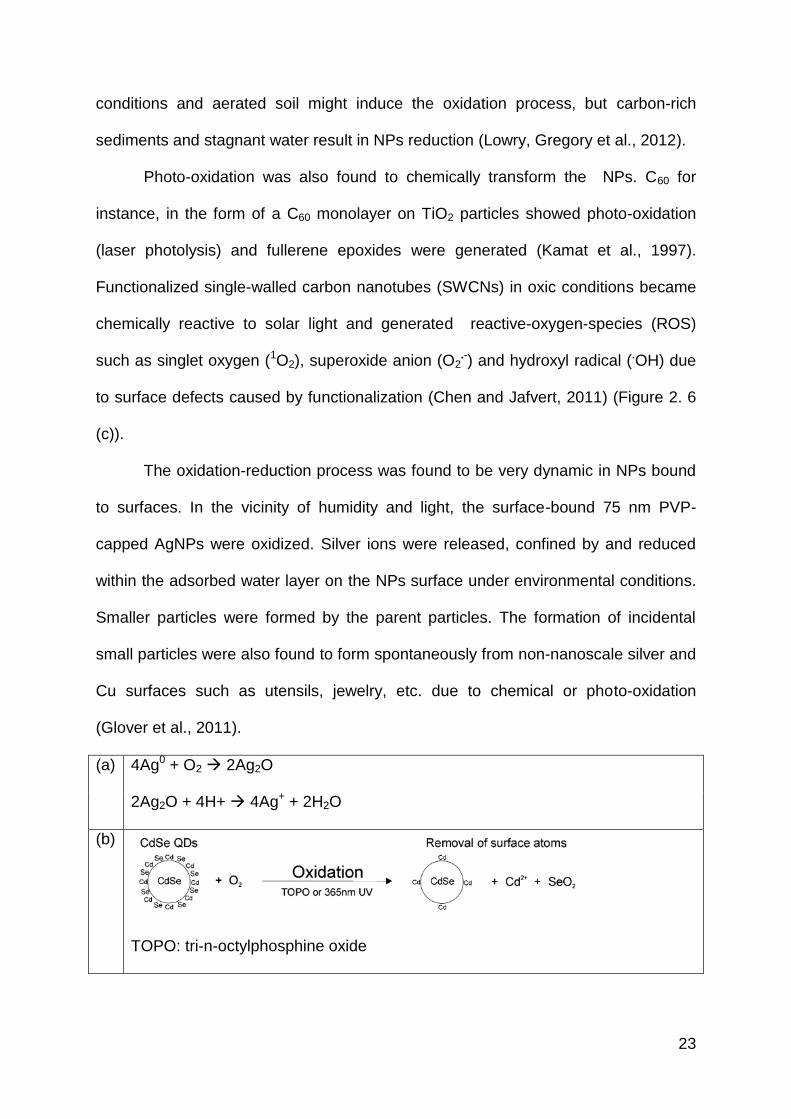
23
conditions and aerated soil might induce the oxidation process, but carbon-rich
sediments and stagnant water result in NPs reduction (Lowry, Gregory et al., 2012).
Photo-oxidation was also found to chemically transform the NPs. C60 for
instance, in the form of a C60 monolayer on TiO2 particles showed photo-oxidation
(laser photolysis) and fullerene epoxides were generated (Kamat et al., 1997).
Functionalized single-walled carbon nanotubes (SWCNs) in oxic conditions became
chemically reactive to solar light and generated reactive-oxygen-species (ROS)
such as singlet oxygen (1O2), superoxide anion (O2.-) and hydroxyl radical (.OH) due
to surface defects caused by functionalization (Chen and Jafvert, 2011) (Figure 2. 6
(c)).
The oxidation-reduction process was found to be very dynamic in NPs bound
to surfaces. In the vicinity of humidity and light, the surface-bound 75 nm PVP-
capped AgNPs were oxidized. Silver ions were released, confined by and reduced
within the adsorbed water layer on the NPs surface under environmental conditions.
Smaller particles were formed by the parent particles. The formation of incidental
small particles were also found to form spontaneously from non-nanoscale silver and
Cu surfaces such as utensils, jewelry, etc. due to chemical or photo-oxidation
(Glover et al., 2011).
(a) 4Ag0 + O2 2Ag2O
2Ag2O + 4H+ 4Ag+ + 2H2O
(b)
TOPO: tri-n-octylphosphine oxide
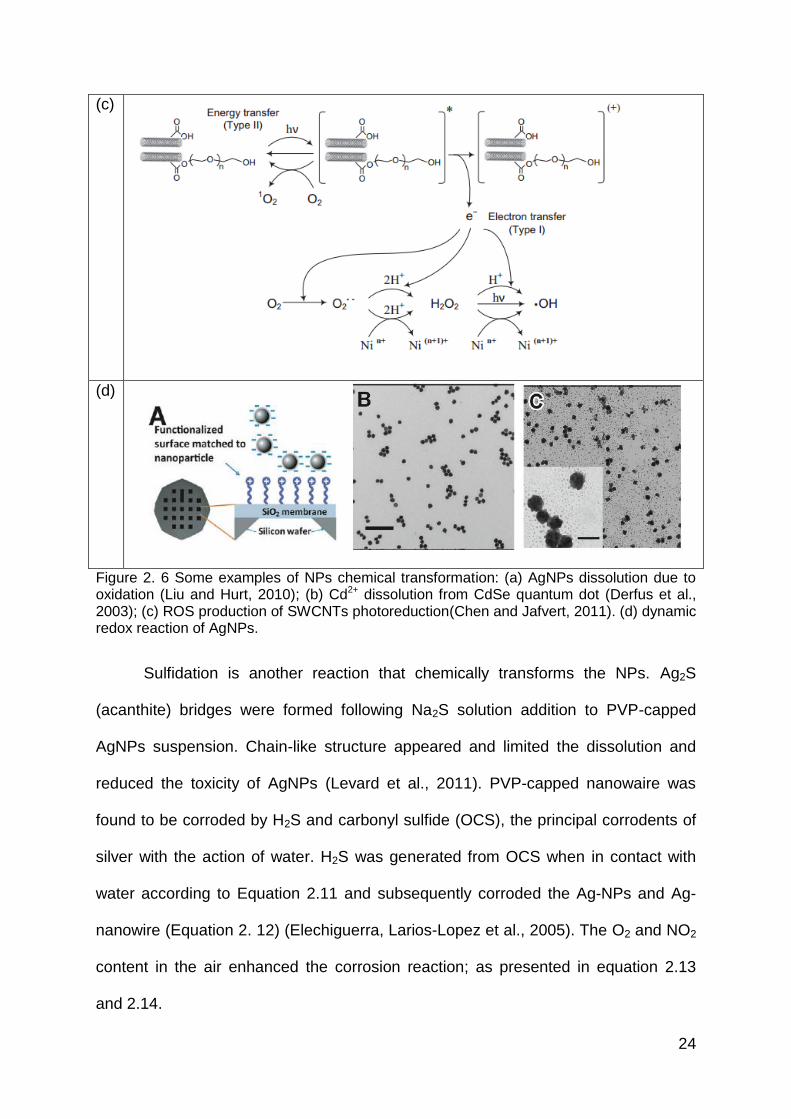
24
(c)
(d)
Figure 2. 6 Some examples of NPs chemical transformation: (a) AgNPs dissolution due to oxidation (Liu and Hurt, 2010); (b) Cd2+ dissolution from CdSe quantum dot (Derfus et al., 2003); (c) ROS production of SWCNTs photoreduction(Chen and Jafvert, 2011). (d) dynamic redox reaction of AgNPs.
Sulfidation is another reaction that chemically transforms the NPs. Ag2S
(acanthite) bridges were formed following Na2S solution addition to PVP-capped
AgNPs suspension. Chain-like structure appeared and limited the dissolution and
reduced the toxicity of AgNPs (Levard et al., 2011). PVP-capped nanowaire was
found to be corroded by H2S and carbonyl sulfide (OCS), the principal corrodents of
silver with the action of water. H2S was generated from OCS when in contact with
water according to Equation 2.11 and subsequently corroded the Ag-NPs and Ag-
nanowire (Equation 2. 12) (Elechiguerra, Larios-Lopez et al., 2005). The O2 and NO2
content in the air enhanced the corrosion reaction; as presented in equation 2.13
and 2.14.
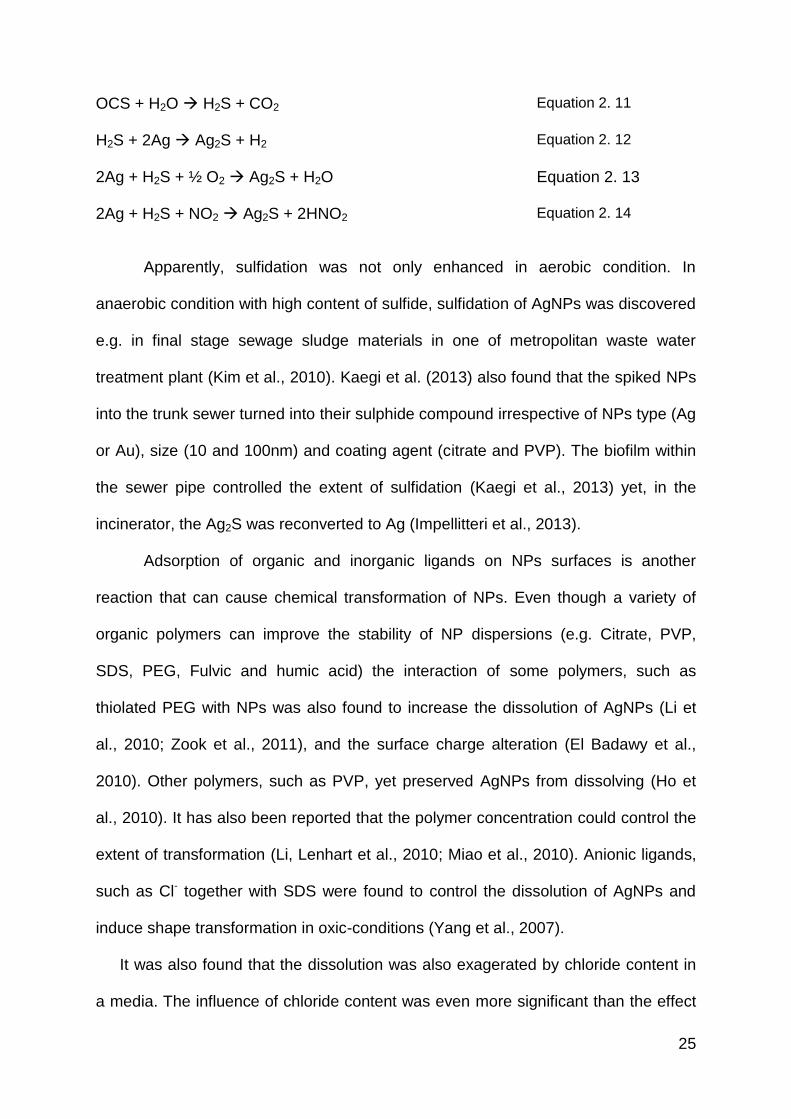
25
OCS + H2O H2S + CO2 Equation 2. 11
H2S + 2Ag Ag2S + H2 Equation 2. 12
2Ag + H2S + ½ O2 Ag2S + H2O Equation 2. 13
2Ag + H2S + NO2 Ag2S + 2HNO2 Equation 2. 14
Apparently, sulfidation was not only enhanced in aerobic condition. In
anaerobic condition with high content of sulfide, sulfidation of AgNPs was discovered
e.g. in final stage sewage sludge materials in one of metropolitan waste water
treatment plant (Kim et al., 2010). Kaegi et al. (2013) also found that the spiked NPs
into the trunk sewer turned into their sulphide compound irrespective of NPs type (Ag
or Au), size (10 and 100nm) and coating agent (citrate and PVP). The biofilm within
the sewer pipe controlled the extent of sulfidation (Kaegi et al., 2013) yet, in the
incinerator, the Ag2S was reconverted to Ag (Impellitteri et al., 2013).
Adsorption of organic and inorganic ligands on NPs surfaces is another
reaction that can cause chemical transformation of NPs. Even though a variety of
organic polymers can improve the stability of NP dispersions (e.g. Citrate, PVP,
SDS, PEG, Fulvic and humic acid) the interaction of some polymers, such as
thiolated PEG with NPs was also found to increase the dissolution of AgNPs (Li et
al., 2010; Zook et al., 2011), and the surface charge alteration (El Badawy et al.,
2010). Other polymers, such as PVP, yet preserved AgNPs from dissolving (Ho et
al., 2010). It has also been reported that the polymer concentration could control the
extent of transformation (Li, Lenhart et al., 2010; Miao et al., 2010). Anionic ligands,
such as Cl- together with SDS were found to control the dissolution of AgNPs and
induce shape transformation in oxic-conditions (Yang et al., 2007).
It was also found that the dissolution was also exagerated by chloride content in
a media. The influence of chloride content was even more significant than the effect
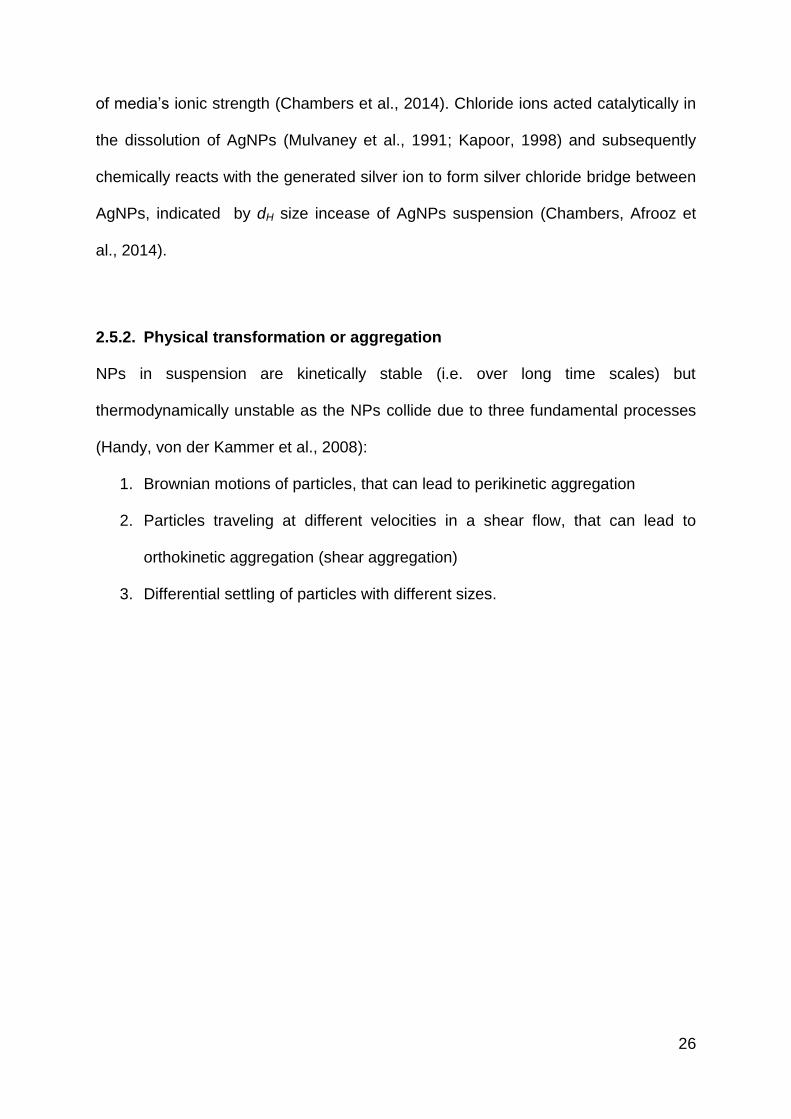
26
of media‘s ionic strength (Chambers et al., 2014). Chloride ions acted catalytically in
the dissolution of AgNPs (Mulvaney et al., 1991; Kapoor, 1998) and subsequently
chemically reacts with the generated silver ion to form silver chloride bridge between
AgNPs, indicated by dH size incease of AgNPs suspension (Chambers, Afrooz et
al., 2014).
2.5.2. Physical transformation or aggregation
NPs in suspension are kinetically stable (i.e. over long time scales) but
thermodynamically unstable as the NPs collide due to three fundamental processes
(Handy, von der Kammer et al., 2008):
1. Brownian motions of particles, that can lead to perikinetic aggregation
2. Particles traveling at different velocities in a shear flow, that can lead to
orthokinetic aggregation (shear aggregation)
3. Differential settling of particles with different sizes.
27
Figure 2. 7 Three collision mechanism and aggregation rate coefficient of 1 µm particles, with diameter dp, temperature 120C, particle density 2.6 g mL-1 and share rate 35 s-1. The figure represents domination of perikinetik aggregation in smaller particle sizes and ortokinetic aggregation for particle larger than 1 µm (Handy, von der Kammer et al., 2008)
Elimelech and O‘melia (1990) have shown that collision efficiency (α) or sticking
probability represents the fraction of collisions that are successful in making an
attachment, and is presented as:
Equation 2. 15
Where η is the actual dimensionless deposition rate of particles and η0 is the
dimensionless deposition rate under barrier-less interaction(Elimelech and O'Melia,
1990).
In a stable dispersion, the collision efficiency is < 1 and the collisions do not
stick the particles together. According to Derjaguin-Landau and Verwey-Overbeek
(DLVO) theory of colloid stability, the stabilization originates from forces between
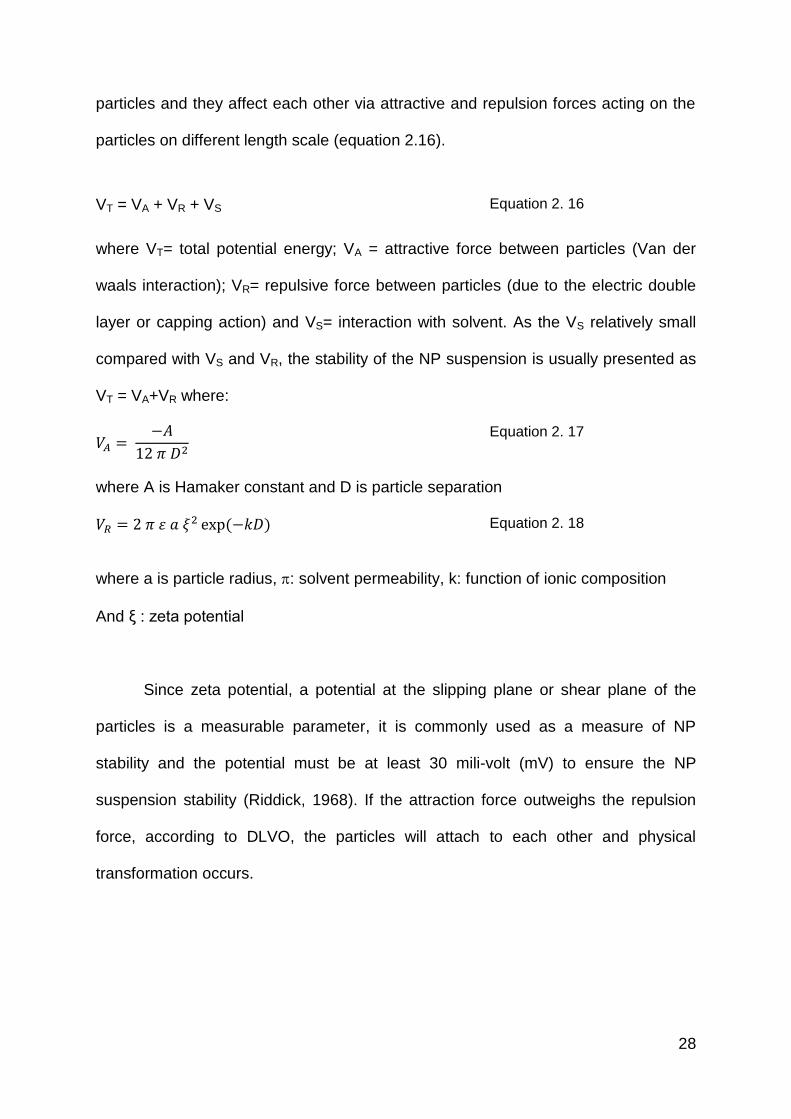
28
particles and they affect each other via attractive and repulsion forces acting on the
particles on different length scale (equation 2.16).
VT = VA + VR + VS Equation 2. 16
where VT= total potential energy; VA = attractive force between particles (Van der
waals interaction); VR= repulsive force between particles (due to the electric double
layer or capping action) and VS= interaction with solvent. As the VS relatively small
compared with VS and VR, the stability of the NP suspension is usually presented as
VT = VA+VR where:
Equation 2. 17
where A is Hamaker constant and D is particle separation
Equation 2. 18
where a is particle radius, : solvent permeability, k: function of ionic composition
And ξ : zeta potential
Since zeta potential, a potential at the slipping plane or shear plane of the
particles is a measurable parameter, it is commonly used as a measure of NP
stability and the potential must be at least 30 mili-volt (mV) to ensure the NP
suspension stability (Riddick, 1968). If the attraction force outweighs the repulsion
force, according to DLVO, the particles will attach to each other and physical
transformation occurs.
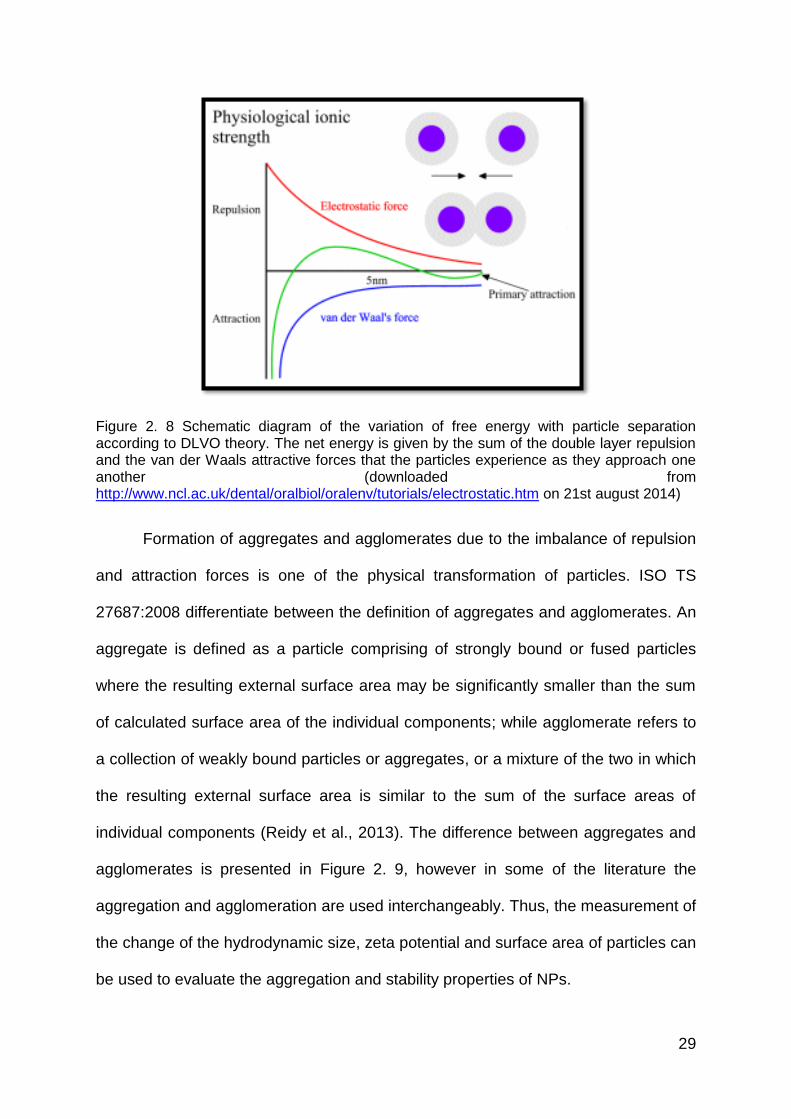
29
Figure 2. 8 Schematic diagram of the variation of free energy with particle separation according to DLVO theory. The net energy is given by the sum of the double layer repulsion and the van der Waals attractive forces that the particles experience as they approach one another (downloaded from http://www.ncl.ac.uk/dental/oralbiol/oralenv/tutorials/electrostatic.htm on 21st august 2014)
Formation of aggregates and agglomerates due to the imbalance of repulsion
and attraction forces is one of the physical transformation of particles. ISO TS
27687:2008 differentiate between the definition of aggregates and agglomerates. An
aggregate is defined as a particle comprising of strongly bound or fused particles
where the resulting external surface area may be significantly smaller than the sum
of calculated surface area of the individual components; while agglomerate refers to
a collection of weakly bound particles or aggregates, or a mixture of the two in which
the resulting external surface area is similar to the sum of the surface areas of
individual components (Reidy et al., 2013). The difference between aggregates and
agglomerates is presented in Figure 2. 9, however in some of the literature the
aggregation and agglomeration are used interchangeably. Thus, the measurement of
the change of the hydrodynamic size, zeta potential and surface area of particles can
be used to evaluate the aggregation and stability properties of NPs.
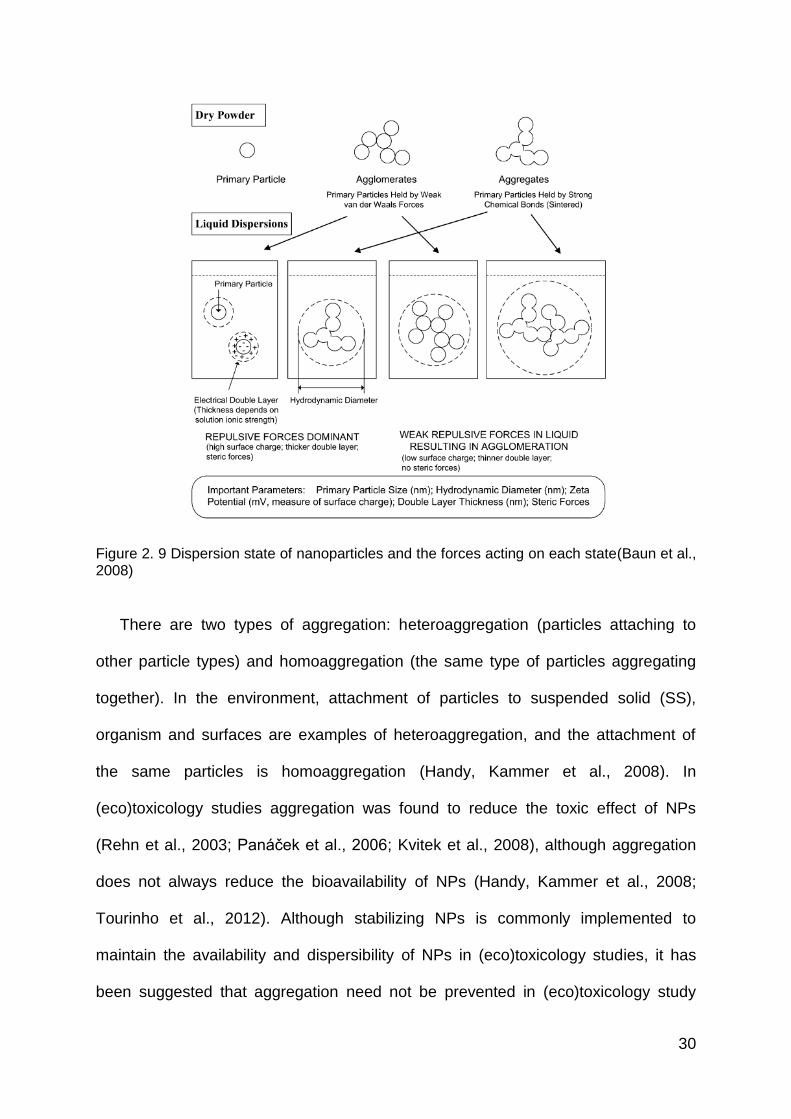
30
Figure 2. 9 Dispersion state of nanoparticles and the forces acting on each state(Baun et al., 2008)
There are two types of aggregation: heteroaggregation (particles attaching to
other particle types) and homoaggregation (the same type of particles aggregating
together). In the environment, attachment of particles to suspended solid (SS),
organism and surfaces are examples of heteroaggregation, and the attachment of
the same particles is homoaggregation (Handy, Kammer et al., 2008). In
(eco)toxicology studies aggregation was found to reduce the toxic effect of NPs
(Rehn et al., 2003; Pan ek et al., 2006; Kvitek et al., 2008), although aggregation
does not always reduce the bioavailability of NPs (Handy, Kammer et al., 2008;
Tourinho et al., 2012). Although stabilizing NPs is commonly implemented to
maintain the availability and dispersibility of NPs in (eco)toxicology studies, it has
been suggested that aggregation need not be prevented in (eco)toxicology study
31
because it will occur during NPs exposure in the environment (Baun, Hartmann et
al., 2008).
Providing a barrier to the close approach of two particles, either by addition of
charged material (to generate an electrostatic double layer (EDL) surrounding the
particles) or polymer and surfactants (tethering a relatively long molecules on the
particle surface) have been widely implemented to improve the stability of NPs
(Figure 2.10). While steric stabilization is relatively insensitive to the ionic content of
the media, the thickness of the EDL layer of electrostatically-capped NPs will be
influenced by the media ionic content (Debye- Hϋckel approximation).
(a) (b)
Figure 2. 10 Stabilization of NPs: (a) electrostatic, and (b) steric stabilization(Christian et al., 2008)
According to the Debye-Hϋckel approximation, the thickness of EDL
( ⁄ depends on the temperature and the bulk electrolyte
concentration as presented in (Equation 6. 2)(Hunter, 1986) :
Κ= √
x √ (meter)-1
Equation 2. 19
where K is Debye-Hϋckel parameter, F is Faraday‘s constant (96,485 C.mol-1), I is
ionic strength, ε0 is permittivity of a vacuum (8.85 x 10⁻¹² farad.m-1), εr is dielectric
constant of solution, R is gas constant (8.31 J.K-1.mol-1) and T is temperature (K). At
32
250C in water (εr at 250C = 78.57), than the K = 3.288 √ (nm-1), shows that the EDL
(~ ⁄ is only influenced by media‘s ionic strength where
I =
∑
Equation 2. 20
where ci is ionic concentration and zi is the ionic charge.
Therefore the stability of EDL-coated NPs is partly influenced by the ionic strength
(Cumberland and Lead, 2009; French et al., 2009; Badawy et al., 2010).
Other factors both biotic (plant, animal, exudates, etc) and abiotic (pH, light)
have also been shown to influence stability of NPs and cause
aggregation/disaggregation. The release of dissolved organic material (DOM) from
plants in a microcosm stabilized PVP-capped AgNPs while in a microcosm without
plants the AgNPs aggregated. However DOM was found to oxidize and dissolve
Gum arrabic (GA)-capped AgNPs (Unrine, Colman et al., 2012). Algal exopolymeric
exudates (EPS=exo-polyssacharide) were found to bind the TiO2 and reduce the
particles bioavailability and toxicity (Hartmann et al., 2010; Dalai et al., 2013).
Irradiation of artificial light and sunlight induced fragmentation of NPs, which
was subsequently followed by fusion of particles to form agglomerates as was
presented by Cheng et al (2011). Both PVP- and gum Arabic-capped AgNPs have
been physically transformed by formation of larger particles due to irradiation.
Alteration of the available surface area and the morphology of AgNPs (as indicated
by loss of SPR and larger particle size by TEM) after 4 days of sunlight exposure
has been shown to reduce the toxicity of NPs (Cheng et al., 2011; Li et al., 2011).
Re-precipitation and shape transformation following NP dissolution has been
observed as another type of physical transformation (Yang, Zhang et al., 2007; An et
al., 2008). Yang et al. (2007) showed the formation of triangular plate AgNPs due to
33
the O2/Cl- corrosion effect to nano spherical SDS-capped AgNPs. An et al. (2008)
found that Cl- etched the triangular NPs and formed discal AgNPs. These shape
transformations might alter the toxicity of AgNPs since shape has been found to
influence the NPs toxicity (Handy, Kammer et al., 2008).
2.5.3. Biological transformation
Physical and chemical reactions between the NPs surface and biological
components (protein, membrane, phospholipid, DNA, organelles, etc) have been
presented in various studies of the bio-nano interface. This interaction will not only
change the physico-chemical properties of NPs but also the properties of the
biological materials. Novel cryptic peptide epitopes, for instance, were released from
the protein in contact with NPs and this caused a change the protein function to
some extent (Cedervall, Lynch et al., 2007; Klein, 2007). Formation of soft and hard
coronas on NPs surfaces, resulted from competitive absorption of proteins onto the
NPs surface, and was found to decrease the reactive oxygen production and lesser
its toxic effect (Casals, Pfaller et al., 2011).
NPs degradation within the biological environment is another important
transformation that needs to be considered. Graphene oxide and CNTs toxicity was
found to be mitigated by fetal bouvine serum (FBS) and horseradish peroxidase
(HRP) enzyme respectively showing the potential degradation of NPs in biological
environments (Allen, Kichambare et al., 2008; Allen, Kotchey et al., 2009; Hu, Peng
et al., 2011). However current knowledge of NPs biotransformation within biological
system leaves many questions that need to be addressed (Treuel and Nienhaus,
2012).
34
Due to active transformation of NPs in the environment, full characterization of
NPs in ecotoxicology studies needs to be performed for both the pristine NPs and
after exposure to the media used in the studies.
2.6. Synthesis method of nanoparticles
Due to the observation of NPs‘s novel properties and their promising
application in many sectors, numerous synthesis protocols have been examined
extensively and can be grouped into top-down and bottom-up methods as illustrated
in Figure 2. 11 (RS, 2004; Wang and Xia, 2004; Ju-Nam and Lead, 2008; Christian,
2009). The former method produces NPs from their bulk material. By implementing
physical processes such as grinding and milling (Tsuzuki and McCormick, 2004),
laser ablation (Mafune et al., 2000; Dolgaev et al., 2002), DC arc thermal (Shinde et
al., 2009), etc, macro scale materials are mechanically broken-down into nanosize
particles. Nanoscale patterned material can also be produced using some of these
methods, and this type of material can be further used as a mold for NPs large scale
production (Christian, 2009).
On the other hand, bottom-up methods produce NPs from very small building
blocks of material such as ion, atoms and molecules by implementing wet chemical,
self-assembly and positional assembly processes (RS, 2004). Through reduction,
nucleation and growth process, the ions can be built-up into a more complex clusters
of NPs, by wet chemical methods (Powers et al., 2006; Ju-Nam and Lead, 2008;
Lee, 2008).
Top-down methods have been known as versatile strategies for producing NPs
in industrial scale (Skandan and Singhal, 2006). Nonetheless, they are less favored
by the scientific community. Physically breaking-up bulk materials into smaller nano-
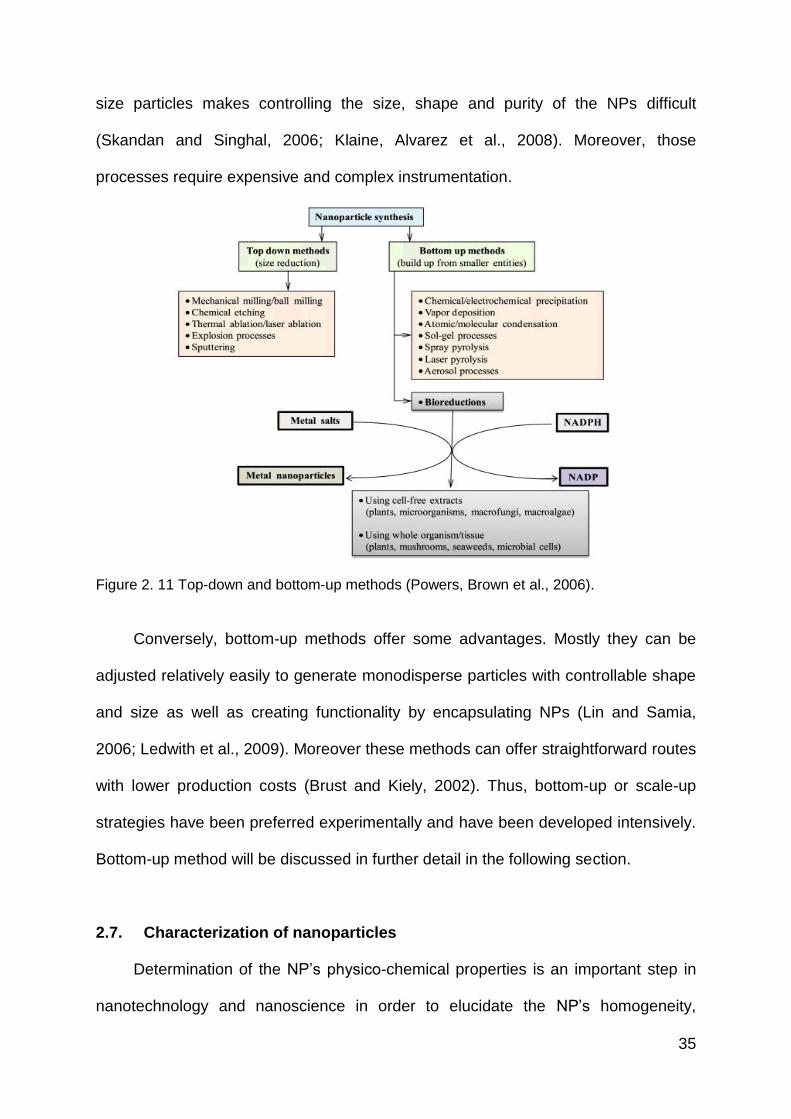
35
size particles makes controlling the size, shape and purity of the NPs difficult
(Skandan and Singhal, 2006; Klaine, Alvarez et al., 2008). Moreover, those
processes require expensive and complex instrumentation.
Figure 2. 11 Top-down and bottom-up methods (Powers, Brown et al., 2006).
Conversely, bottom-up methods offer some advantages. Mostly they can be
adjusted relatively easily to generate monodisperse particles with controllable shape
and size as well as creating functionality by encapsulating NPs (Lin and Samia,
2006; Ledwith et al., 2009). Moreover these methods can offer straightforward routes
with lower production costs (Brust and Kiely, 2002). Thus, bottom-up or scale-up
strategies have been preferred experimentally and have been developed intensively.
Bottom-up method will be discussed in further detail in the following section.
2.7. Characterization of nanoparticles
Determination of the NP‘s physico-chemical properties is an important step in
nanotechnology and nanoscience in order to elucidate the NP‘s homogeneity,
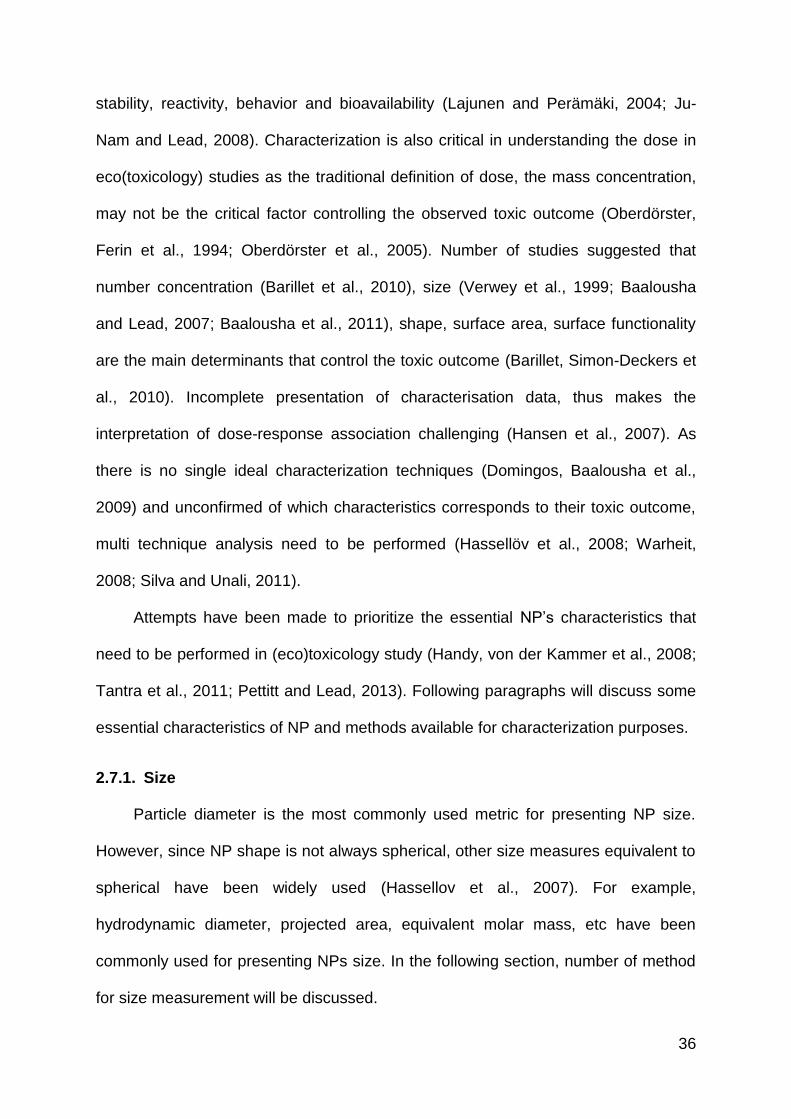
36
stability, reactivity, behavior and bioavailability (Lajunen and Perämäki, 2004; Ju-
Nam and Lead, 2008). Characterization is also critical in understanding the dose in
eco(toxicology) studies as the traditional definition of dose, the mass concentration,
may not be the critical factor controlling the observed toxic outcome (Oberdörster,
Ferin et al., 1994; Oberdörster et al., 2005). Number of studies suggested that
number concentration (Barillet et al., 2010), size (Verwey et al., 1999; Baalousha
and Lead, 2007; Baalousha et al., 2011), shape, surface area, surface functionality
are the main determinants that control the toxic outcome (Barillet, Simon-Deckers et
al., 2010). Incomplete presentation of characterisation data, thus makes the
interpretation of dose-response association challenging (Hansen et al., 2007). As
there is no single ideal characterization techniques (Domingos, Baalousha et al.,
2009) and unconfirmed of which characteristics corresponds to their toxic outcome,
multi technique analysis need to be performed (Hassellöv et al., 2008; Warheit,
2008; Silva and Unali, 2011).
Attempts have been made to prioritize the essential NP‘s characteristics that
need to be performed in (eco)toxicology study (Handy, von der Kammer et al., 2008;
Tantra et al., 2011; Pettitt and Lead, 2013). Following paragraphs will discuss some
essential characteristics of NP and methods available for characterization purposes.
2.7.1. Size
Particle diameter is the most commonly used metric for presenting NP size.
However, since NP shape is not always spherical, other size measures equivalent to
spherical have been widely used (Hassellov et al., 2007). For example,
hydrodynamic diameter, projected area, equivalent molar mass, etc have been
commonly used for presenting NPs size. In the following section, number of method
for size measurement will be discussed.
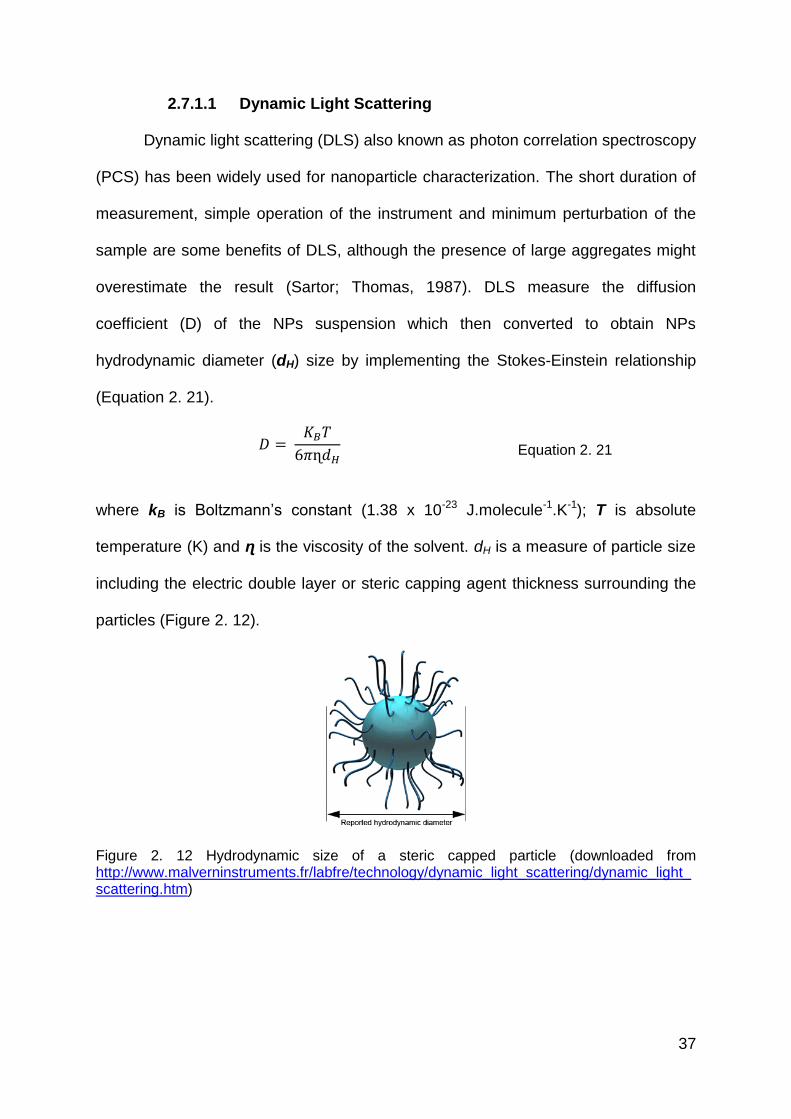
37
2.7.1.1 Dynamic Light Scattering
Dynamic light scattering (DLS) also known as photon correlation spectroscopy
(PCS) has been widely used for nanoparticle characterization. The short duration of
measurement, simple operation of the instrument and minimum perturbation of the
sample are some benefits of DLS, although the presence of large aggregates might
overestimate the result (Sartor; Thomas, 1987). DLS measure the diffusion
coefficient (D) of the NPs suspension which then converted to obtain NPs
hydrodynamic diameter (dH) size by implementing the Stokes-Einstein relationship
(Equation 2. 21).
Equation 2. 21
where kB is Boltzmann‘s constant (1.38 x 10⁻²³ J.molecule-1.K-1); T is absolute
temperature (K) and ɳ is the viscosity of the solvent. dH is a measure of particle size
including the electric double layer or steric capping agent thickness surrounding the
particles (Figure 2. 12).
Figure 2. 12 Hydrodynamic size of a steric capped particle (downloaded from http://www.malverninstruments.fr/labfre/technology/dynamic_light_scattering/dynamic_light_scattering.htm)
38
2.7.1.2 Flow-Field Flow Fractionation
Field-flow fractionation (FFF) is an elution technique, developed for the first
time in the 1960s by the work of J. Calvin Giddings and co-workers. Although FFF is
a relatively new technique, it has been widely used for environmental studies
(colloids and macromolecules) (Baalousha and Lead, 2007; Alasonati et al., 2010;
Stolpe et al., 2010) as well as NP separation and characterization (Baalousha et al.,
2011; Poda et al., 2011; Gigault et al., 2012). The FFF ability in separating species in
greater size ranges (10-3 to 102 m); can be coupled with other instrumentations for
physical and chemical characterization; fast separation; ready fraction collection for
further analysis; and gentleness in separating delicate species (Giddings, 1993;
Hassellov et al., 2007) are some benefits offered by Fl-FFF. NPs-membrane
interaction, however makes the attempt of finding a perfect flow rate for the
instrument is difficult.
FFF utilizes the nature of viscous flow in ribbon-like (narrow) channel for
separation (Figure 2. 13) (Williams et al., 1996; Hassellov, von der Kammer et al.,
2007). The laminar flow of the suspension in the channel retards the motion of
particle close to the wall relative to the particle in the flow section further away from
the wall. By employing an external field perpendicular to the channel flow, the
particles are pushed down to the accumulation wall. Particles with higher diffusivity
(smaller particle) will diffuse back to the channel due to concentration gradient,
entering the least retarded area of the laminar flow, so the particles are selectively
separated. The magnitude and type of the field, channel dimensions, interaction
between particles and the field, particle-solvent diffusion coefficient, are factors
governing the particle elution rate in the FFF (Williams, Moon et al., 1996).
39
Figure 2. 13 Fractionation of NPs sample with two size distributions by as-Fl-FFF (downloaded from http://www.field-flow-fractionation.com/field-flow-fractionation.htm on the 7th August 2013)
2.7.1.3 Transmission Electron Microscopy
In NPs characterization, TEM has been widely used for imaging purposes
(aimed for visualization of the synthesized NPs and NPs interaction with organism),
size and shape characterization, etc (Hassellöv, Readman et al., 2008; Fabrega et
al., 2009; Fabrega et al., 2011; MacCuspie et al., 2011; Silva et al., 2011). Another
important application of TEM is single particle elemental analysis of an object
whenever the TEM is complimented by spectroscopy detector/s (Kim, Park et al.,
2010).
In general, the TEM consists of electron gun, series of focusing and
magnifying lenses, sample stage and fluorescence screen or monitor for
visualization (Figure 2. 14). A hot filament of Tungsten (T 2500-3000 K) and
Lanthanum hexaborides (LaB6, T 1400-2000 K) are some examples of electron gun,
with accelerated voltage 30 kV-1,000kV or more. An ultra high vacuum needs to be
applied to the interior of TEM to avoid the collision of electron with molecules within
the air. The condensing coil(s) focus the electron beam on a small area of specimen
(2-3 μm) placed in the specimen stage.
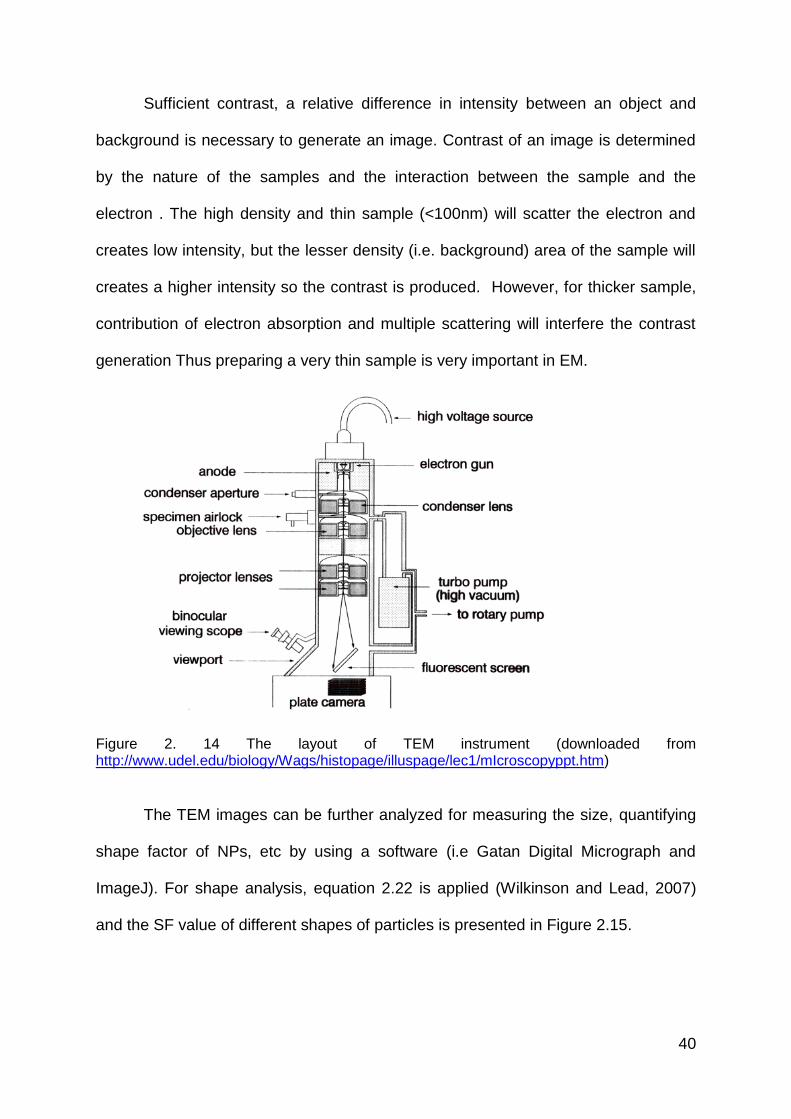
40
Sufficient contrast, a relative difference in intensity between an object and
background is necessary to generate an image. Contrast of an image is determined
by the nature of the samples and the interaction between the sample and the
electron . The high density and thin sample (<100nm) will scatter the electron and
creates low intensity, but the lesser density (i.e. background) area of the sample will
creates a higher intensity so the contrast is produced. However, for thicker sample,
contribution of electron absorption and multiple scattering will interfere the contrast
generation Thus preparing a very thin sample is very important in EM.
Figure 2. 14 The layout of TEM instrument (downloaded from http://www.udel.edu/biology/Wags/histopage/illuspage/lec1/mIcroscopyppt.htm)
The TEM images can be further analyzed for measuring the size, quantifying
shape factor of NPs, etc by using a software (i.e Gatan Digital Micrograph and
ImageJ). For shape analysis, equation 2.22 is applied (Wilkinson and Lead, 2007)
and the SF value of different shapes of particles is presented in Figure 2.15.
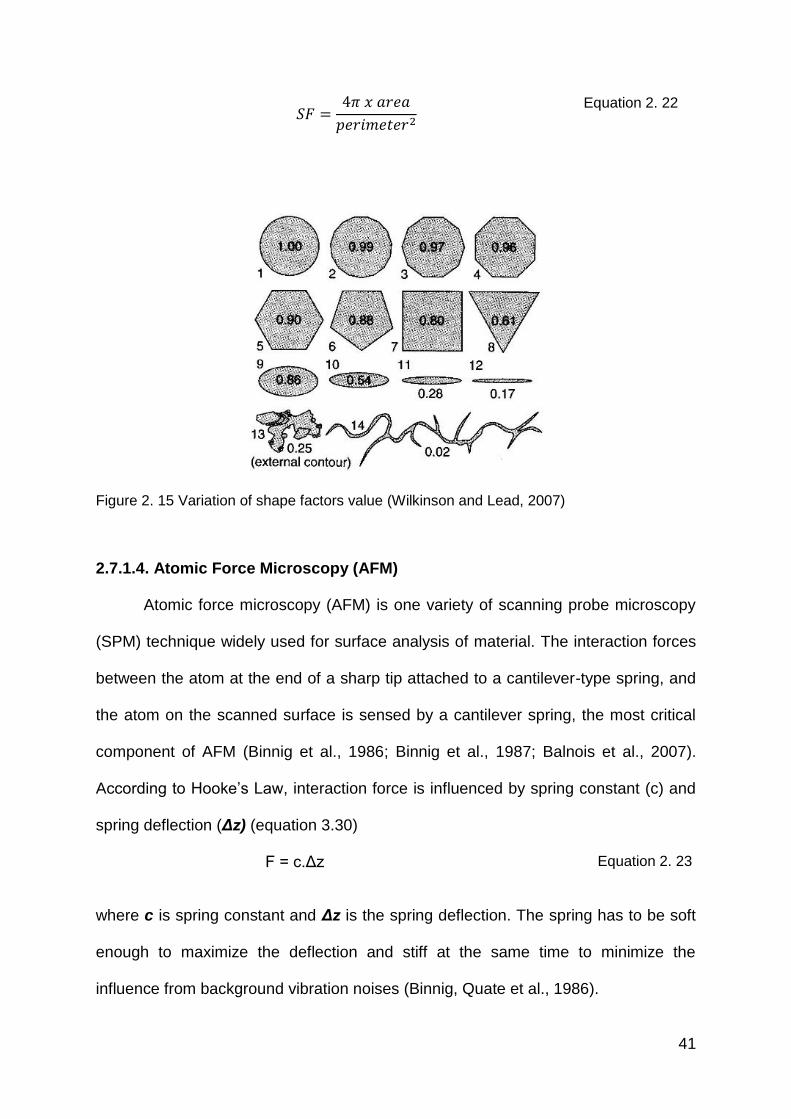
41
Equation 2. 22
Figure 2. 15 Variation of shape factors value (Wilkinson and Lead, 2007)
2.7.1.4. Atomic Force Microscopy (AFM)
Atomic force microscopy (AFM) is one variety of scanning probe microscopy
(SPM) technique widely used for surface analysis of material. The interaction forces
between the atom at the end of a sharp tip attached to a cantilever-type spring, and
the atom on the scanned surface is sensed by a cantilever spring, the most critical
component of AFM (Binnig et al., 1986; Binnig et al., 1987; Balnois et al., 2007).
According to Hooke‘s Law, interaction force is influenced by spring constant (c) and
spring deflection (Δz) (equation 3.30)
F = c.Δz Equation 2. 23
where c is spring constant and Δz is the spring deflection. The spring has to be soft
enough to maximize the deflection and stiff at the same time to minimize the
influence from background vibration noises (Binnig, Quate et al., 1986).
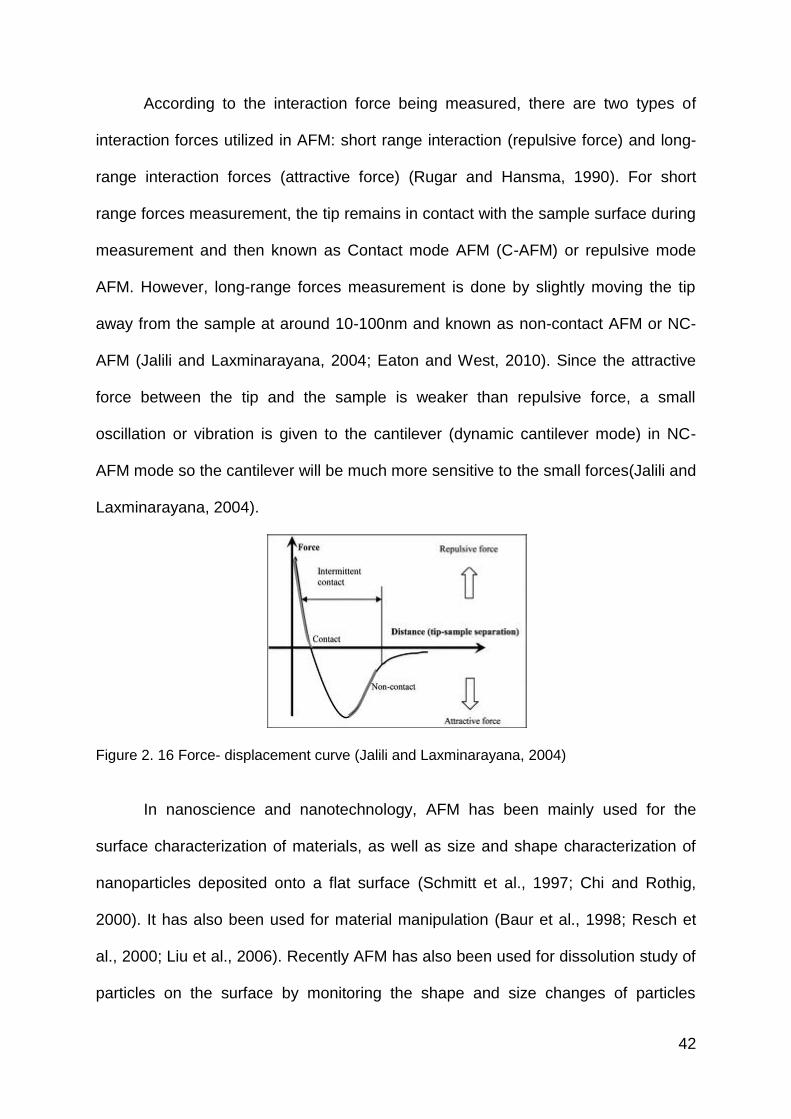
42
According to the interaction force being measured, there are two types of
interaction forces utilized in AFM: short range interaction (repulsive force) and long-
range interaction forces (attractive force) (Rugar and Hansma, 1990). For short
range forces measurement, the tip remains in contact with the sample surface during
measurement and then known as Contact mode AFM (C-AFM) or repulsive mode
AFM. However, long-range forces measurement is done by slightly moving the tip
away from the sample at around 10-100nm and known as non-contact AFM or NC-
AFM (Jalili and Laxminarayana, 2004; Eaton and West, 2010). Since the attractive
force between the tip and the sample is weaker than repulsive force, a small
oscillation or vibration is given to the cantilever (dynamic cantilever mode) in NC-
AFM mode so the cantilever will be much more sensitive to the small forces(Jalili and
Laxminarayana, 2004).
Figure 2. 16 Force- displacement curve (Jalili and Laxminarayana, 2004)
In nanoscience and nanotechnology, AFM has been mainly used for the
surface characterization of materials, as well as size and shape characterization of
nanoparticles deposited onto a flat surface (Schmitt et al., 1997; Chi and Rothig,
2000). It has also been used for material manipulation (Baur et al., 1998; Resch et
al., 2000; Liu et al., 2006). Recently AFM has also been used for dissolution study of
particles on the surface by monitoring the shape and size changes of particles
43
attached to a surface (Kent and Vikesland, 2011). Due to the ability of AFM to
analyse many different materials, it has extremely rapidly been developed and
commercialized. AFM provides topography image and height size of NPs adsorbed
on a surface, and aggregation state of the samples, however it has poor lateral
accuracy and need a high skill for operating the instrument.
2.7.2. Elemental analysis
There are two methods available for analyzing the elemental composition of NP
sample, bulk sample analysis by UV-Vis spectrometry and single NP analysis by
Energy Dispersive X-Ray Spectroscopy (EDX).
2.7.2.1. UV-Vis spectroscopy
Some metals show unique optical properties by absorbing a characteristics
wavelength at visible region which is not exhibited by their corresponding bulk metal
material. Noble metal such as silver and gold for example, absorb wavelength at
400nm and 520nm respectively, manifested as yellow and red color separately as
has been recognized since 17th century by working of Faraday(Faraday, 1857). The
origin of the unique optical properties of metal NPs is due to surface plasmon
resonance (SPR) of NPs as has been discussed in section 2.4.2.
Theoretical approaches and experimental results have shown that the SPR of
NPs is influenced by many factors such as size, size distribution and shape of NPs,
and the dielectric constant at the NP surface (Slistan-Grijalva et al., 2005;
MacCuspie, 2011). If the size of NPs increase, the band-gap energy between
conduction and valence band decrease and as consequence the SPR will be red
shifted (Slistan-Grijalva, Herrera-Urbina et al., 2005; Smitha et al., 2008) (Equation
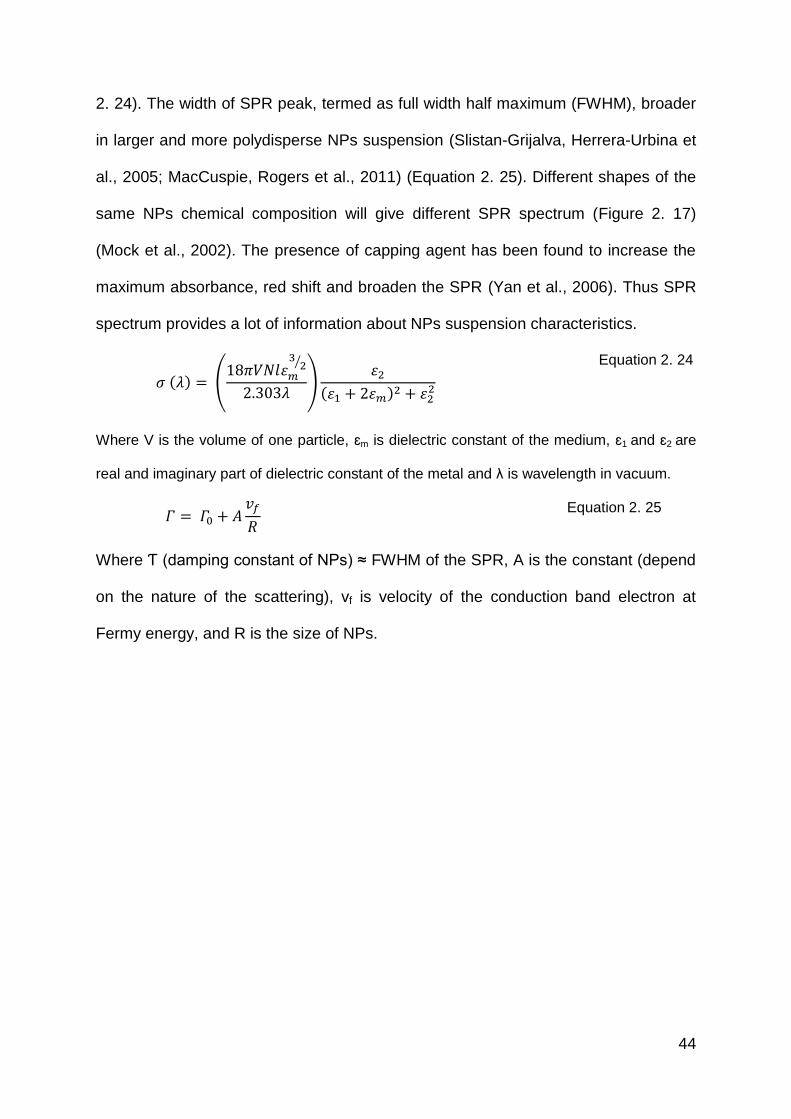
44
2. 24). The width of SPR peak, termed as full width half maximum (FWHM), broader
in larger and more polydisperse NPs suspension (Slistan-Grijalva, Herrera-Urbina et
al., 2005; MacCuspie, Rogers et al., 2011) (Equation 2. 25). Different shapes of the
same NPs chemical composition will give different SPR spectrum (Figure 2. 17)
(Mock et al., 2002). The presence of capping agent has been found to increase the
maximum absorbance, red shift and broaden the SPR (Yan et al., 2006). Thus SPR
spectrum provides a lot of information about NPs suspension characteristics.
(
⁄
)
Equation 2. 24
Where V is the volume of one particle, ɛm is dielectric constant of the medium, ɛ1 and ɛ2 are
real and imaginary part of dielectric constant of the metal and λ is wavelength in vacuum.
Equation 2. 25
Where Ƭ (damping constant of NPs) ≈ FWHM of the SPR, A is the constant (depend
on the nature of the scattering), vf is velocity of the conduction band electron at
Fermy energy, and R is the size of NPs.
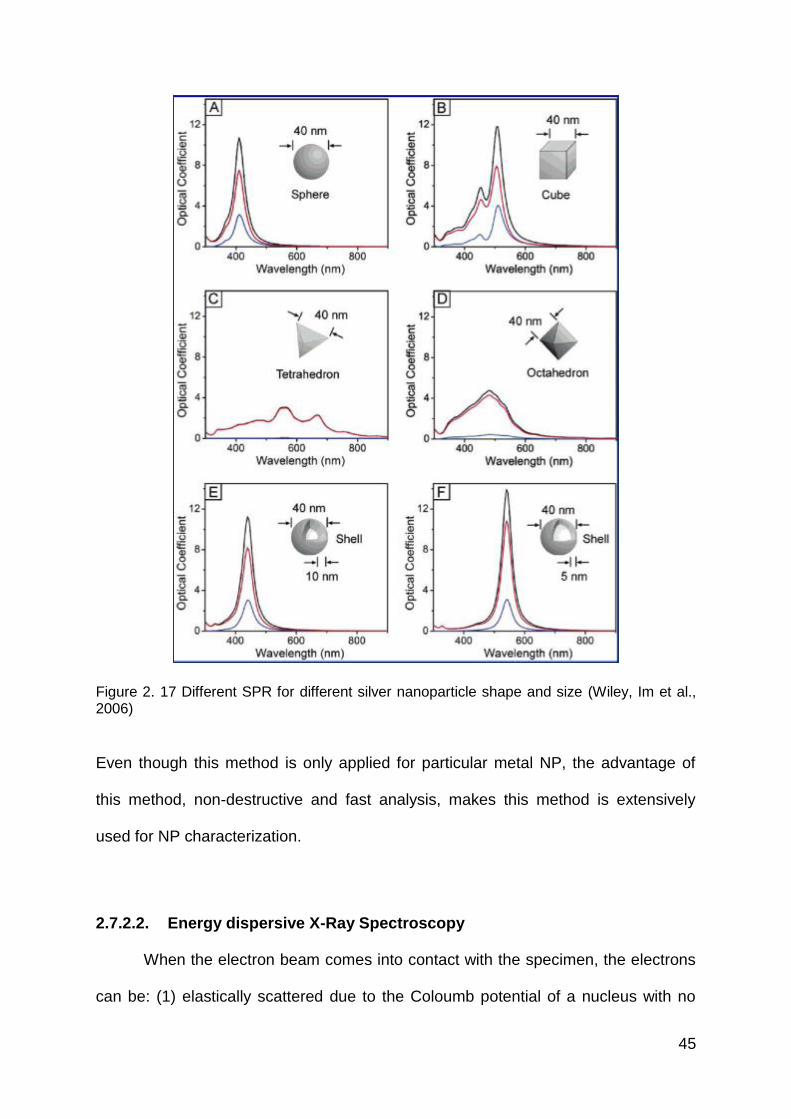
45
Figure 2. 17 Different SPR for different silver nanoparticle shape and size (Wiley, Im et al., 2006)
Even though this method is only applied for particular metal NP, the advantage of
this method, non-destructive and fast analysis, makes this method is extensively
used for NP characterization.
2.7.2.2. Energy dispersive X-Ray Spectroscopy
When the electron beam comes into contact with the specimen, the electrons
can be: (1) elastically scattered due to the Coloumb potential of a nucleus with no
46
energy loss of the electron; (2) inelastically scattered when the electron excite or
ionize inner-shell of the atom/s of the specimen (Figure 2. 18) (Reimer, 1997;
Vollath, 2008).
The elastically scattered electron is more localized and contributes to the
image contrast and thus is exploited for imaging purposes. On the other hand, the
inelastically scattered electrons are less localized and do not contribute to the
imaging process. These electrons, however, provide the information about chemical
content of an object because the electron energy loss and emitted excitation energy
of the object is fingerprint of the element of the object and can be used for qualitative
chemical analysis. Energy dispersive X-ray spectroscopy (EDX) for example,
analyze the X-ray emission from the specimen for single particle elemental analysis
purposes. By combining an EDX detector into the TEM, more information can be
derived from this technique and TEM becomes a more powerful for NPs
characterization purposes (Reed, 1993; Reimer, 1997).
Figure 2. 18 Interaction between electrons and specimen in electron microscopy(Rochow and Tucker, 1994)
A thin specimen
Incident electron beam
Backscattered electrons
Secondary electrons
Characteristics X-ray photons
Bremsstrahlung(X-ray continuum)
Visible light
Transmitted electrons
Elastically scattered electrons
Inelastically scattered electrons
Some electrons are absorbed
47
2.7.3. Surface Charge measurement
When NPs are suspended in a media, the NPs can acquire charge due to
ionization of functional groups (protonation or de-protonation), adsorption of solvated
ions to the charge-neutral NPs surfaces and ion exchange where higher valence
ions replace lower-valence ions bound to the surface; lattice defect; and other
reaction equilibria (Derjaguin, 1989; Kirby and Jr, 2004). Surface charge is an
important characteristic of NPs and has a major influence into NPs fate and
behavior. However measuring surface charge directly is difficult. Zeta potential,
potential at slipping plane or surface of hydrodynamic shear or shear plane, in which
the ions and particle inside the plane form a stable entity and move along together
due to Brownian motion (Hunter, 1986) can be measured by electrophoresis and
used for estimating the surface charge of NPs. The electrophoretic mobility (UE-
electric-field driven particle mobility) of NPs can be converted into zeta potential ( )
by using Henry equation (Equation 2. 26).
Equation 2. 26
where ε is dielectric constant; η is viscosity of the media; is zeta potential and f(ka)
is Henry‘s function. The value of henry‘s function refer is 1.5 (for particle larger than
0.2 microns dispersed in salt containing media with concentration more than 10-3
molar, according to Smoluchowski approximation) or 1.0 (for small particle in low
dielectric constant media, according to Huckel approximation) (Malvern). If the
close to zero, the repulsive force between particles is reduced and the particles are
allowed to come into contact and start to aggregated.
48
2.7.4. Surface area measurement
The Brunauer, Emmett, Teller (BET) method has been widely used for
measuring specific surface area of solid material, and shown to be useful for
measuring NPs surface area (Hassellov, von der Kammer et al., 2007). By letting the
Nitrogen (N2) gas to occupy the surface of NPs, the amount of adsorbed N2 onto NP
surface can be calculated to measure the area of NP. Since the N2 are very small
adsorbate molecules, degree of aggregation gives minor effect into measurement
(Powers, Brown et al., 2006). This method shows high precision and direct measure
the surface area, but artifacts and NPs morphology changes due to sample
preparation would give a false result (Hassellöv, Readman et al., 2008).
2.7.5. Concentration measurement
Nanoparticle concentration in a suspension can be measured by using Atomic
Absorption Spectroscopy (AAS) and Inductively coupled plasma-mass spectrometry
(ICP-MS). Since ICP-MS has a lower detection limit (limit detection 1-10 ng.L-1) than
AAS, it has been widely used for NPs elemental characterization and quantification.
ICP-MS also can analyze multi-element at the same time with a wide range of
linearity. Another advantage of ICP-MS is its possibility to be coupled with other
separation techniques such as chromatography (liquid chromatography and HPLC)
and FFF (Taylor, Garbarino et al., 2002). One limitation of ICP-MS is this instrument
can only measure metal.
2.8. Reasons for choosing silver nanoparticles
Silver (Ag) is a rare element (67th in abundance among the elements) with
atomic weight of 47. It has been known as an environmental hazard and has been
49
classified as one of the priority pollutants since 1977, even though the history of
human life has been closely related to silver for about 7000 years. In the 18th
century, for example, silver was used in medication (as eye drops, antibiotic,
disinfectant, etc) due to its antibacterial properties. However, toxic, persistent and
bioaccumulation properties of silver, especially in the environment, meant that it was
necessary to control silver usage and exposure (Hwang et al., 2007; Luoma, 2008;
EPA, 2013).
Recently, exploiting the novel properties of material nanoscience and
nanotechnology, nanosilver (AgNPs) has been introduced to the market. Although
nanosize silver shows unique optical, electrical, magnetic and theurapetic properties,
most of AgNPs applications use silver‘s antimicrobial properties (Elechiguerra et al.,
2005; Lu et al., 2008; Luoma, 2008; Jo et al., 2009; Panacek et al., 2009; Rejeski,
2009), as has been exploited in the conventional silver form.
Recently, more than three hundred consumer products containing AgNPs
have been marketed and making nanosilver or silver nanoparticles (AgNPs) the most
rapidly growing classes of nanoproducts (Figure 2. 19) (Fauss, 2008; Rejeski, 2009).
Because AgNPs have been commercialised, the exposure of humans and the
environment to these materials is bound to occur. Thus the hazard identification and
exposure evaluation of AgNPs need to be performed immediately.
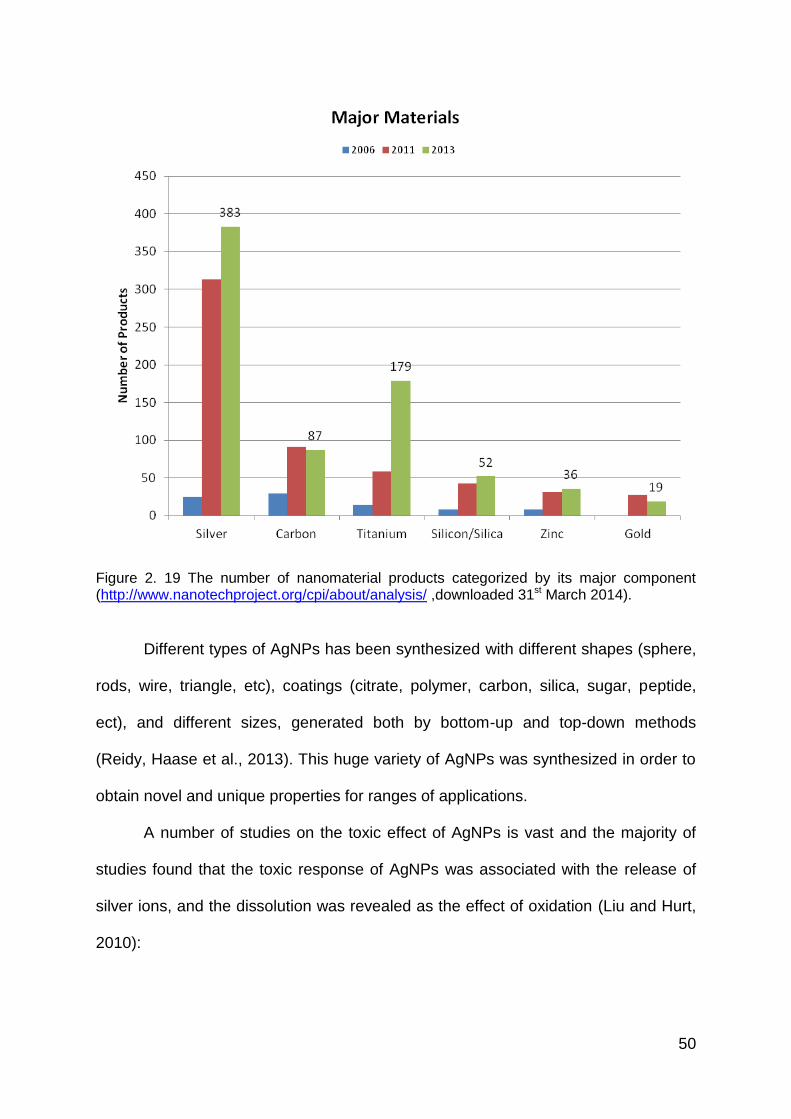
50
Figure 2. 19 The number of nanomaterial products categorized by its major component (http://www.nanotechproject.org/cpi/about/analysis/ ,downloaded 31st March 2014).
Different types of AgNPs has been synthesized with different shapes (sphere,
rods, wire, triangle, etc), coatings (citrate, polymer, carbon, silica, sugar, peptide,
ect), and different sizes, generated both by bottom-up and top-down methods
(Reidy, Haase et al., 2013). This huge variety of AgNPs was synthesized in order to
obtain novel and unique properties for ranges of applications.
A number of studies on the toxic effect of AgNPs is vast and the majority of
studies found that the toxic response of AgNPs was associated with the release of
silver ions, and the dissolution was revealed as the effect of oxidation (Liu and Hurt,
2010):
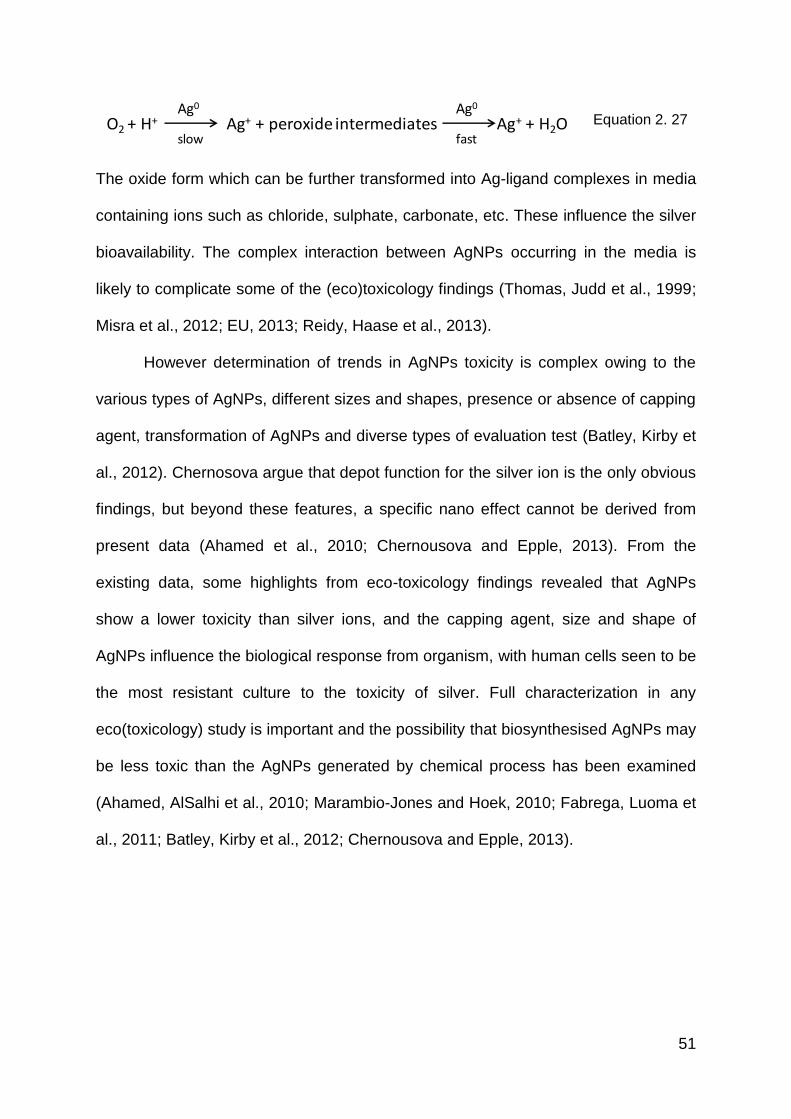
51
Equation 2. 27
The oxide form which can be further transformed into Ag-ligand complexes in media
containing ions such as chloride, sulphate, carbonate, etc. These influence the silver
bioavailability. The complex interaction between AgNPs occurring in the media is
likely to complicate some of the (eco)toxicology findings (Thomas, Judd et al., 1999;
Misra et al., 2012; EU, 2013; Reidy, Haase et al., 2013).
However determination of trends in AgNPs toxicity is complex owing to the
various types of AgNPs, different sizes and shapes, presence or absence of capping
agent, transformation of AgNPs and diverse types of evaluation test (Batley, Kirby et
al., 2012). Chernosova argue that depot function for the silver ion is the only obvious
findings, but beyond these features, a specific nano effect cannot be derived from
present data (Ahamed et al., 2010; Chernousova and Epple, 2013). From the
existing data, some highlights from eco-toxicology findings revealed that AgNPs
show a lower toxicity than silver ions, and the capping agent, size and shape of
AgNPs influence the biological response from organism, with human cells seen to be
the most resistant culture to the toxicity of silver. Full characterization in any
eco(toxicology) study is important and the possibility that biosynthesised AgNPs may
be less toxic than the AgNPs generated by chemical process has been examined
(Ahamed, AlSalhi et al., 2010; Marambio-Jones and Hoek, 2010; Fabrega, Luoma et
al., 2011; Batley, Kirby et al., 2012; Chernousova and Epple, 2013).
O2 + H+ Ag+ + peroxide intermediates Ag+ + H2O Ag0
slow fast
Ag0
52
2.9. Summary
Development of nanotechnology and nanoscience have increased the
production of engineered nanoparticles significantly as well as the potential of their
exposure to the environment. AgNPs has been reported as the most widely used NP
in different types of product due to its wide microbial activity. Even though the
concentration of engineered NPs in the environment is less than natural NP, their
size, shape, composition and functionalization might be different with natural NPs in
which the nature has not be adapt to and pose diverse risk to the environment.
Large specific surface area and unique properties due to quantum effect of
NPs will influence NP fate and behavior in the environment. Chemical, physical and
biological transformation of NP in various media and environment have been
reported. Thus aggregation, dissolution, re-precipitation and other transformation of
NPs need to be anticipated and evaluated in any (eco)toxicology study as they might
influence the ―real dose‖ exposing the organisms or cells. Therefore, more NP
eco(toxicology) studies need to be performed with recommendations of fuller
characterization of the NPs properties before, during and after exposure studies.
53
CHAPTER III
METHODOLOGY
3.1. Introduction
This chapter illustrates the practical methodology that was performed for this
study. In general, three main activities covered by this study, which were: (1)
synthesis and characterization of PVP-capped AgNPs, (2) ligand-exchange of
citrate-capped AgNPs by different polymers, and (3) stability assessment of citrate-,
PVP- and PEG-capped AgNPs in ecotoxicology media. This study was part of larger
study that examines the ecotoxicity of AgNPs into Daphnia magna sp.
The PVP-capped AgNPs, in this study, were synthesized according to two
protocols, termed the hot process and the cold process, modified from Hoppe and
Mulfinger method (Hoppe et al., 2006; Mulfinger et al., 2007). Changes of precursor
and PVP concentration ratio to the Hoppe method and PVP addition into Mulfinger
method were applied in this study. The characteristics of the generated PVP-capped
AgNPs by the two processes are presented in Chapter 4. PVP-capped AgNPs were
also synthesised from citrate-capped AgNPs via ligand-exchange. Given the success
of the PVP replacement of citrate, further investigation of the replacement of citrate
with other capping agents (PEG-SH, fulvic acid and Tween-80) was investigated.
The method of ligand-exchange is presented in this chapter and the characterization
results of polymer-capped AgNPs compared to the original citrate-capped AgNPs
are presented in Chapter 5.
The stability of citrate-, PVP-, and PEG-capped AgNPs toward aggregation in
the OECD Daphnia magna sp. and Green Algae media (Bold Basal Medium) were
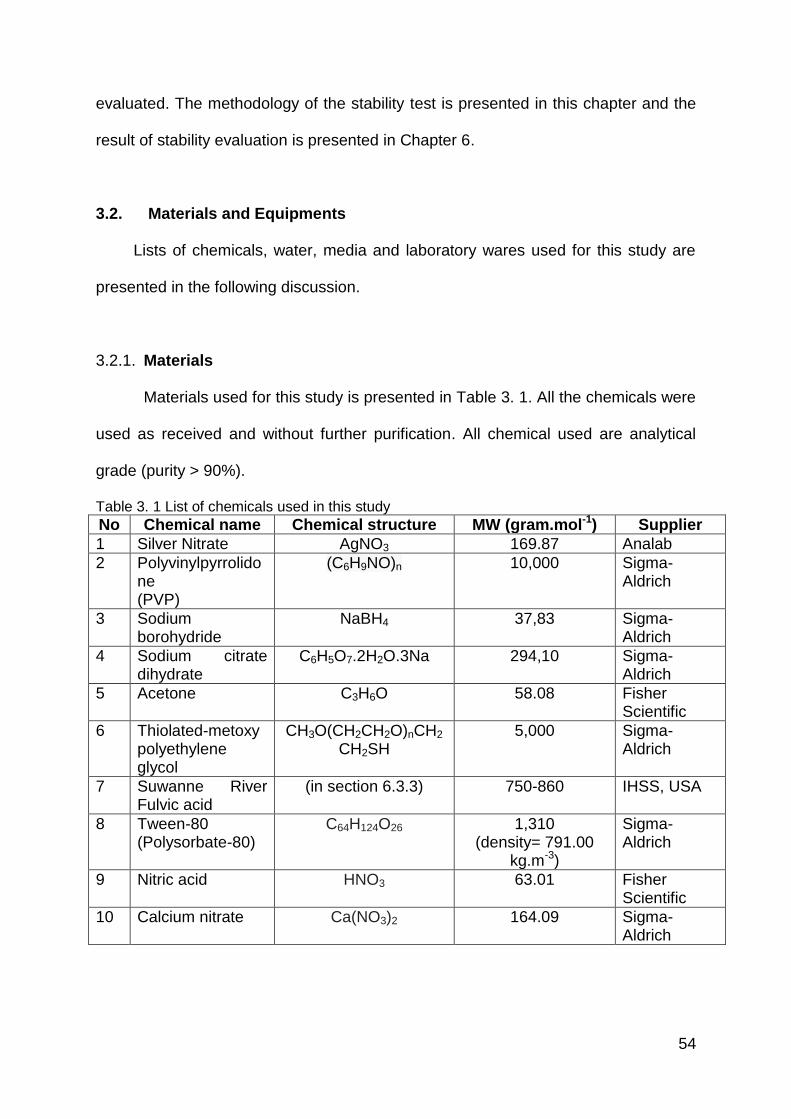
54
evaluated. The methodology of the stability test is presented in this chapter and the
result of stability evaluation is presented in Chapter 6.
3.2. Materials and Equipments
Lists of chemicals, water, media and laboratory wares used for this study are
presented in the following discussion.
3.2.1. Materials
Materials used for this study is presented in Table 3. 1. All the chemicals were
used as received and without further purification. All chemical used are analytical
grade (purity > 90%).
Table 3. 1 List of chemicals used in this study
No Chemical name Chemical structure MW (gram.mol-1) Supplier
1 Silver Nitrate AgNO3 169.87 Analab
2 Polyvinylpyrrolidone (PVP)
(C6H9NO)n 10,000 Sigma-Aldrich
3 Sodium borohydride
NaBH4 37,83 Sigma-Aldrich
4 Sodium citrate dihydrate
C6H5O7.2H2O.3Na 294,10 Sigma-Aldrich
5 Acetone C3H6O 58.08
Fisher Scientific
6 Thiolated-metoxy polyethylene glycol
CH3O(CH2CH2O)nCH2
CH2SH 5,000 Sigma-
Aldrich
7 Suwanne River Fulvic acid
(in section 6.3.3) 750-860 IHSS, USA
8 Tween-80 (Polysorbate-80)
C64H124O26 1,310 (density= 791.00
kg.m-3)
Sigma-Aldrich
9 Nitric acid HNO3 63.01 Fisher Scientific
10 Calcium nitrate Ca(NO3)2 164.09 Sigma-Aldrich
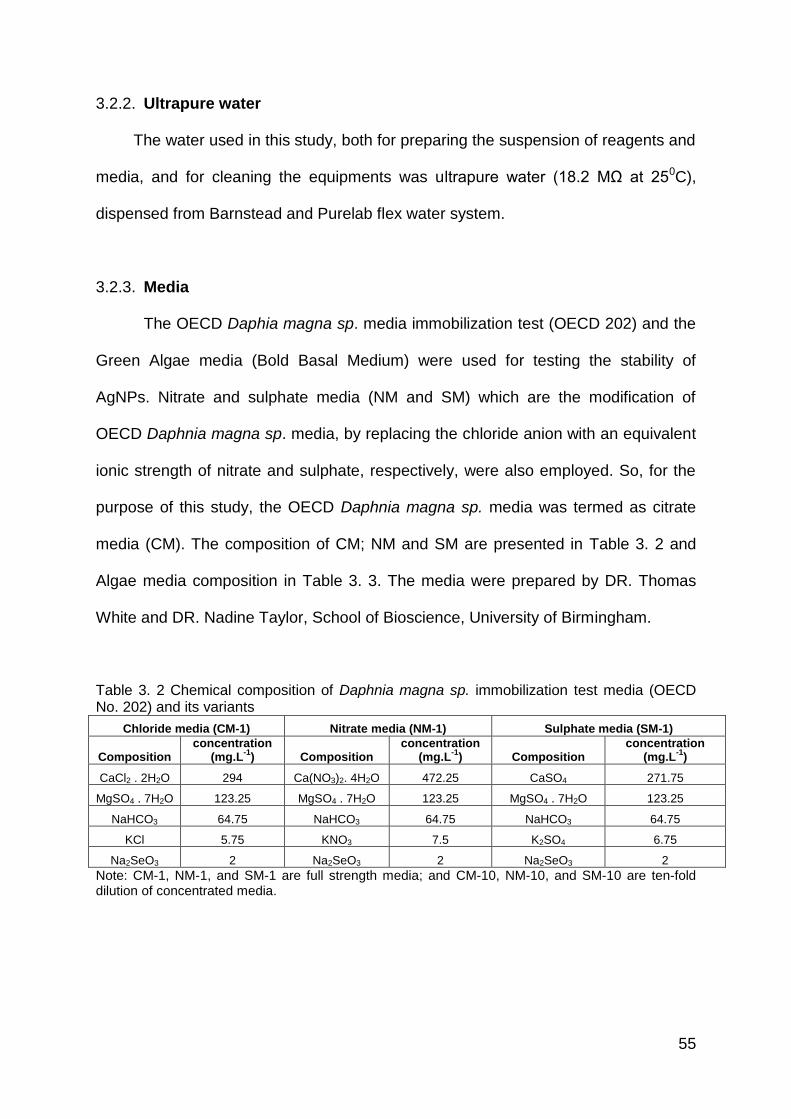
55
3.2.2. Ultrapure water
The water used in this study, both for preparing the suspension of reagents and
media, and for cleaning the equipments was ultrapure water (18.2 MΩ at 250C),
dispensed from Barnstead and Purelab flex water system.
3.2.3. Media
The OECD Daphia magna sp. media immobilization test (OECD 202) and the
Green Algae media (Bold Basal Medium) were used for testing the stability of
AgNPs. Nitrate and sulphate media (NM and SM) which are the modification of
OECD Daphnia magna sp. media, by replacing the chloride anion with an equivalent
ionic strength of nitrate and sulphate, respectively, were also employed. So, for the
purpose of this study, the OECD Daphnia magna sp. media was termed as citrate
media (CM). The composition of CM; NM and SM are presented in Table 3. 2 and
Algae media composition in Table 3. 3. The media were prepared by DR. Thomas
White and DR. Nadine Taylor, School of Bioscience, University of Birmingham.
Table 3. 2 Chemical composition of Daphnia magna sp. immobilization test media (OECD No. 202) and its variants
Chloride media (CM-1) Nitrate media (NM-1) Sulphate media (SM-1)
Composition concentration
(mg.L-1
) Composition concentration
(mg.L-1
) Composition concentration
(mg.L-1
)
CaCl2 . 2H2O 294 Ca(NO3)2. 4H2O 472.25 CaSO4 271.75
MgSO4 . 7H2O 123.25 MgSO4 . 7H2O 123.25 MgSO4 . 7H2O 123.25
NaHCO3 64.75 NaHCO3 64.75 NaHCO3 64.75
KCl 5.75 KNO3 7.5 K2SO4 6.75
Na2SeO3 2 Na2SeO3 2 Na2SeO3 2
Note: CM-1, NM-1, and SM-1 are full strength media; and CM-10, NM-10, and SM-10 are ten-fold dilution of concentrated media.
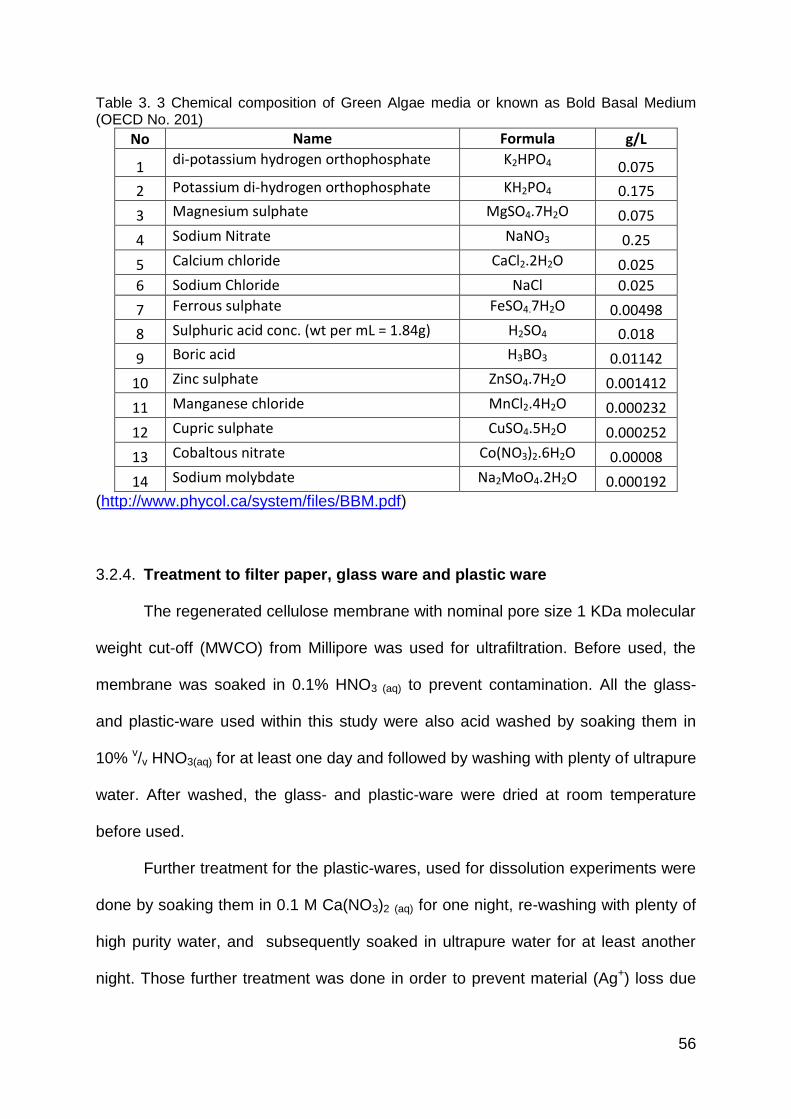
56
Table 3. 3 Chemical composition of Green Algae media or known as Bold Basal Medium (OECD No. 201)
No Name Formula g/L
1 di-potassium hydrogen orthophosphate K2HPO4 0.075
2 Potassium di-hydrogen orthophosphate KH2PO4 0.175
3 Magnesium sulphate MgSO4.7H2O 0.075
4 Sodium Nitrate NaNO3 0.25
5 Calcium chloride CaCl2.2H2O 0.025
6 Sodium Chloride NaCl 0.025
7 Ferrous sulphate FeSO4.7H2O 0.00498
8 Sulphuric acid conc. (wt per mL = 1.84g) H2SO4 0.018
9 Boric acid H3BO3 0.01142
10 Zinc sulphate ZnSO4.7H2O 0.001412
11 Manganese chloride MnCl2.4H2O 0.000232
12 Cupric sulphate CuSO4.5H2O 0.000252
13 Cobaltous nitrate Co(NO3)2.6H2O 0.00008
14 Sodium molybdate Na2MoO4.2H2O 0.000192 (http://www.phycol.ca/system/files/BBM.pdf)
3.2.4. Treatment to filter paper, glass ware and plastic ware
The regenerated cellulose membrane with nominal pore size 1 KDa molecular
weight cut-off (MWCO) from Millipore was used for ultrafiltration. Before used, the
membrane was soaked in 0.1% HNO3 (aq) to prevent contamination. All the glass-
and plastic-ware used within this study were also acid washed by soaking them in
10% v/v HNO3(aq) for at least one day and followed by washing with plenty of ultrapure
water. After washed, the glass- and plastic-ware were dried at room temperature
before used.
Further treatment for the plastic-wares, used for dissolution experiments were
done by soaking them in 0.1 M Ca(NO3)2 (aq) for one night, re-washing with plenty of
high purity water, and subsequently soaked in ultrapure water for at least another
night. Those further treatment was done in order to prevent material (Ag+) loss due
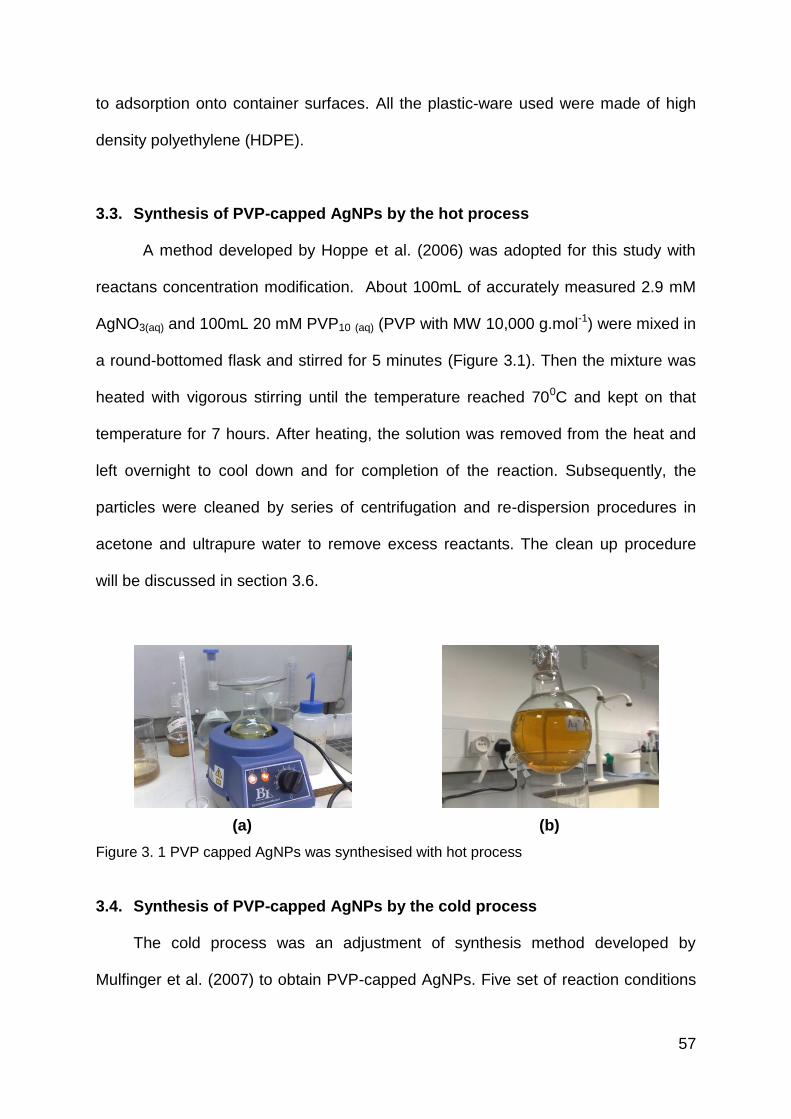
57
to adsorption onto container surfaces. All the plastic-ware used were made of high
density polyethylene (HDPE).
3.3. Synthesis of PVP-capped AgNPs by the hot process
A method developed by Hoppe et al. (2006) was adopted for this study with
reactans concentration modification. About 100mL of accurately measured 2.9 mM
AgNO3(aq) and 100mL 20 mM PVP10 (aq) (PVP with MW 10,000 g.mol-1) were mixed in
a round-bottomed flask and stirred for 5 minutes (Figure 3.1). Then the mixture was
heated with vigorous stirring until the temperature reached 700C and kept on that
temperature for 7 hours. After heating, the solution was removed from the heat and
left overnight to cool down and for completion of the reaction. Subsequently, the
particles were cleaned by series of centrifugation and re-dispersion procedures in
acetone and ultrapure water to remove excess reactants. The clean up procedure
will be discussed in section 3.6.
(a)
(b)
Figure 3. 1 PVP capped AgNPs was synthesised with hot process
3.4. Synthesis of PVP-capped AgNPs by the cold process
The cold process was an adjustment of synthesis method developed by
Mulfinger et al. (2007) to obtain PVP-capped AgNPs. Five set of reaction conditions
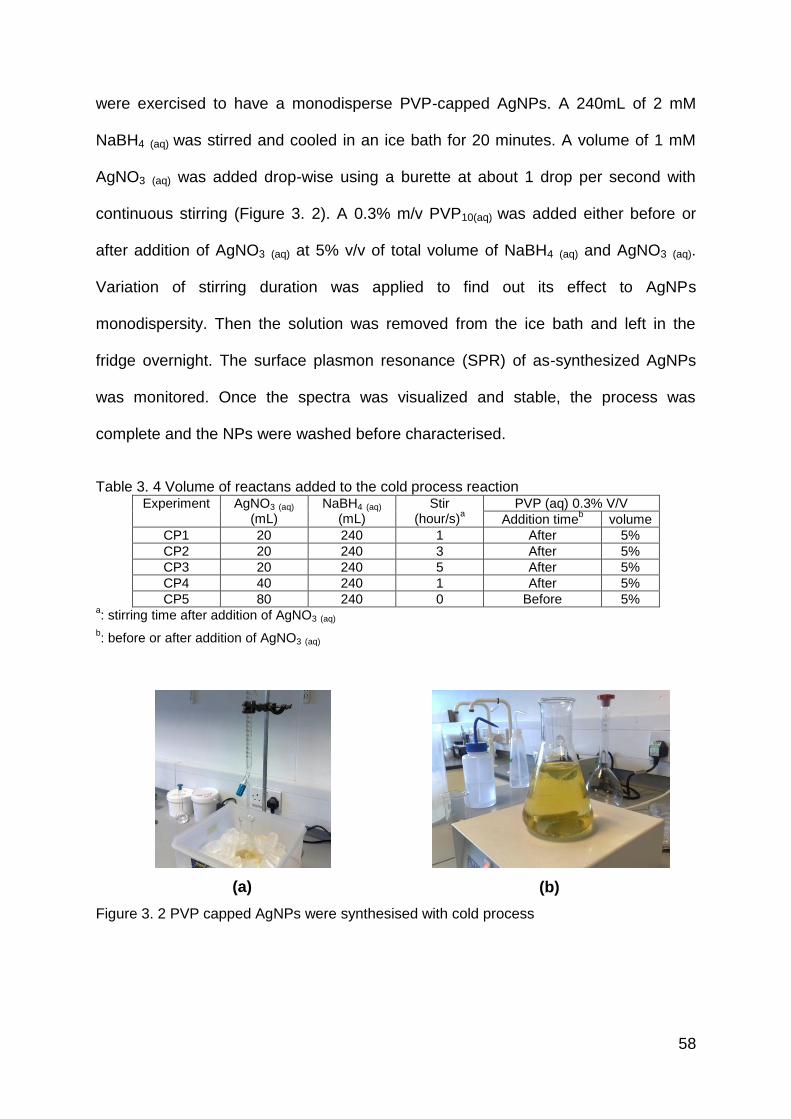
58
were exercised to have a monodisperse PVP-capped AgNPs. A 240mL of 2 mM
NaBH4 (aq) was stirred and cooled in an ice bath for 20 minutes. A volume of 1 mM
AgNO3 (aq) was added drop-wise using a burette at about 1 drop per second with
continuous stirring (Figure 3. 2). A 0.3% m/v PVP10(aq) was added either before or
after addition of AgNO3 (aq) at 5% v/v of total volume of NaBH4 (aq) and AgNO3 (aq).
Variation of stirring duration was applied to find out its effect to AgNPs
monodispersity. Then the solution was removed from the ice bath and left in the
fridge overnight. The surface plasmon resonance (SPR) of as-synthesized AgNPs
was monitored. Once the spectra was visualized and stable, the process was
complete and the NPs were washed before characterised.
Table 3. 4 Volume of reactans added to the cold process reaction
Experiment AgNO3 (aq) (mL)
NaBH4 (aq)
(mL) Stir
(hour/s)a
PVP (aq) 0.3% V/V
Addition timeb volume
CP1 20 240 1 After 5%
CP2 20 240 3 After 5%
CP3 20 240 5 After 5%
CP4 40 240 1 After 5%
CP5 80 240 0 Before 5% a: stirring time after addition of AgNO3 (aq)
b: before or after addition of AgNO3 (aq)
(a)
(b)
Figure 3. 2 PVP capped AgNPs were synthesised with cold process
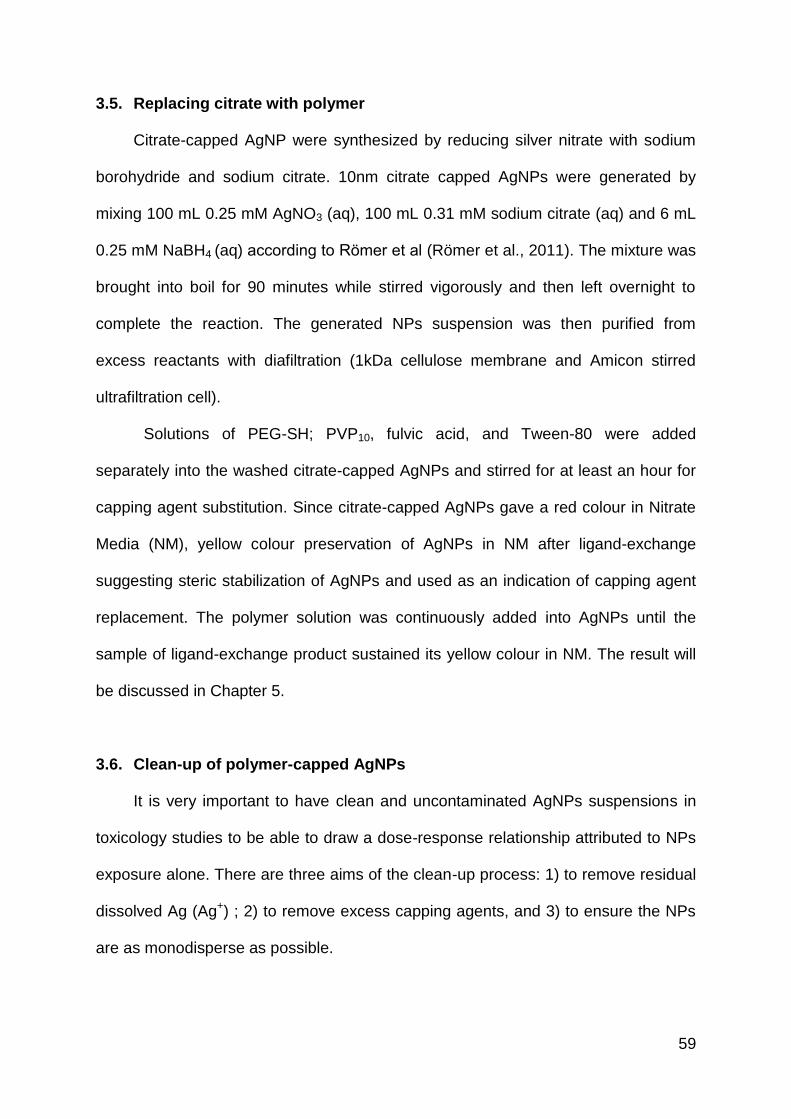
59
3.5. Replacing citrate with polymer
Citrate-capped AgNP were synthesized by reducing silver nitrate with sodium
borohydride and sodium citrate. 10nm citrate capped AgNPs were generated by
mixing 100 mL 0.25 mM AgNO3 (aq), 100 mL 0.31 mM sodium citrate (aq) and 6 mL
0.25 mM NaBH4 (aq) according to Rӧmer et al (Römer et al., 2011). The mixture was
brought into boil for 90 minutes while stirred vigorously and then left overnight to
complete the reaction. The generated NPs suspension was then purified from
excess reactants with diafiltration (1kDa cellulose membrane and Amicon stirred
ultrafiltration cell).
Solutions of PEG-SH; PVP10, fulvic acid, and Tween-80 were added
separately into the washed citrate-capped AgNPs and stirred for at least an hour for
capping agent substitution. Since citrate-capped AgNPs gave a red colour in Nitrate
Media (NM), yellow colour preservation of AgNPs in NM after ligand-exchange
suggesting steric stabilization of AgNPs and used as an indication of capping agent
replacement. The polymer solution was continuously added into AgNPs until the
sample of ligand-exchange product sustained its yellow colour in NM. The result will
be discussed in Chapter 5.
3.6. Clean-up of polymer-capped AgNPs
It is very important to have clean and uncontaminated AgNPs suspensions in
toxicology studies to be able to draw a dose-response relationship attributed to NPs
exposure alone. There are three aims of the clean-up process: 1) to remove residual
dissolved Ag (Ag+) ; 2) to remove excess capping agents, and 3) to ensure the NPs
are as monodisperse as possible.
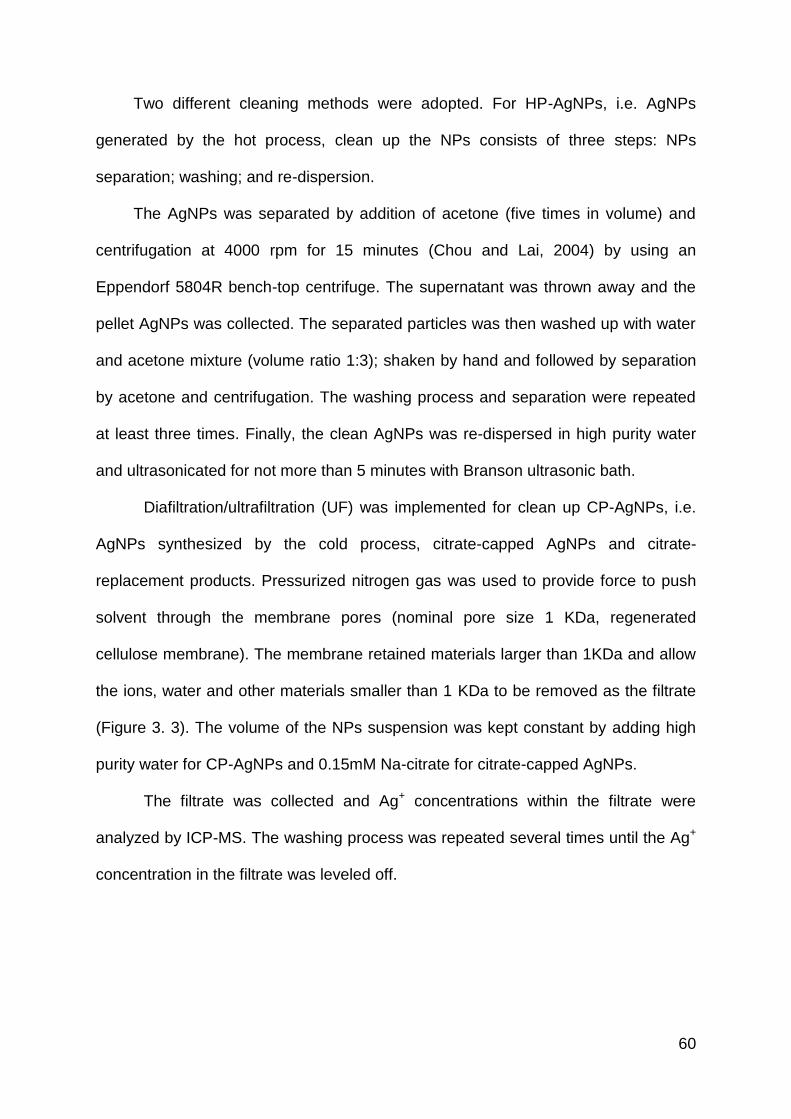
60
Two different cleaning methods were adopted. For HP-AgNPs, i.e. AgNPs
generated by the hot process, clean up the NPs consists of three steps: NPs
separation; washing; and re-dispersion.
The AgNPs was separated by addition of acetone (five times in volume) and
centrifugation at 4000 rpm for 15 minutes (Chou and Lai, 2004) by using an
Eppendorf 5804R bench-top centrifuge. The supernatant was thrown away and the
pellet AgNPs was collected. The separated particles was then washed up with water
and acetone mixture (volume ratio 1:3); shaken by hand and followed by separation
by acetone and centrifugation. The washing process and separation were repeated
at least three times. Finally, the clean AgNPs was re-dispersed in high purity water
and ultrasonicated for not more than 5 minutes with Branson ultrasonic bath.
Diafiltration/ultrafiltration (UF) was implemented for clean up CP-AgNPs, i.e.
AgNPs synthesized by the cold process, citrate-capped AgNPs and citrate-
replacement products. Pressurized nitrogen gas was used to provide force to push
solvent through the membrane pores (nominal pore size 1 KDa, regenerated
cellulose membrane). The membrane retained materials larger than 1KDa and allow
the ions, water and other materials smaller than 1 KDa to be removed as the filtrate
(Figure 3. 3). The volume of the NPs suspension was kept constant by adding high
purity water for CP-AgNPs and 0.15mM Na-citrate for citrate-capped AgNPs.
The filtrate was collected and Ag+ concentrations within the filtrate were
analyzed by ICP-MS. The washing process was repeated several times until the Ag+
concentration in the filtrate was leveled off.
61
Figure 3. 3 The set-up of diafiltration cell
3.7. Characterization
A number of methodologies were employed for characterizing the size,
shape, and chemical composition of AgNPs and will be discussed in the following
section. The characterization however was done to single batch of AgNPs sample
due to the technical complexity and equipment restriction.
3.7.1. Surface Plasmon resonance with UV-Vis spectrometer
Qualitative analysis of AgNPs SPR both in pristine suspension and in
ecotoxicology media was analysed by Jenway 6800 UV-Vis spectrophotometer, with
a tungsten halogen and deuterium lamps as the light source and scanning
wavelength ranges from 190 - 1100nm. The absorbance was scanned between 200-
800nm with a 1 cm disposable plastic cuvette. The qualitative characterization of
AgNPs with UV-Vis spectrophotometer was used for:
(1) Chemical identification of as-synthesized AgNPs as AgNPs absorbs the UV-Vis
wavelength at around 400nm.
(2) SPR comparison between citrate-capped AgNPs and its ligand-exchange
products (PEG-, PVP-, fulvic acid and Tween-80 capped AgNPs).
62
(3) Analysing the AgNPs stability in eco-toxicology media
3.7.2. Size distribution by dynamic light scattering
The DLS Zetasizer nanoseries nano-ZS from Malvern Instrument UK was
used for hydrodynamic diameter and PdI characterization of AgNPs both in pristine
suspension and in ecotoxicology media. Size and polydispersity index (PdI) stability
of AgNPs during incubation in ecotoxicology media was monitored over 21 days (in
CM, NM and SM, both concentrate and dilution media) and 3 days (in algae media).
With a 4mV He-Ne laser source, wavelength 633nm and avalanche photodiode as
the detector, the instrument can measure the particle at size range 1-1,000 nm. The
measurement was done at temperature 200C. By using a disposable plastic cuvette,
a 1mL sample was loaded and measured for ten times and ten runs for each
measurement. There was no sample preparation before the measurement.
3.7.3. pH measurement
The pH of the suspension was measured by Orion 3 star pH meter which
was calibrated with standard pH 4; 7 and 10 each time before measurement.
3.7.4. Zeta potential
In this study, zeta potential of AgNPs both in pristine suspension and in
ecotoxicology media were measured by Laser Doppler Velocimetry in zetasiers
nano-ZS from Malvern Instrument UK at temperature 250C. A laser was used as the
source of light and was split into incident and reference beam. The incident beam
passes through the sample cell and the attenuated scattered light at angle 170 was
detected by a detector. When an electric field is applied, the particles will be moving
toward the electrodes and creates a fluctuation of the scattered light. The intensity of
63
fluctuating scattered light will be converted to particle speed and then further
computed into zeta potential.
3.7.5. Flow field flow fractionation
In this study, an Assymetric-FlFFF Postnova Analytics AF2000 MT coupled by
UV-Vis and multi angle light scattering (MALS) detector were used for size (dH)
characterization of NPs suspended as pristine suspension and in ecotoxicology
media. Dilute salt solution (10mM NaNO3) was used as the carrier liquid with a 1kD
molecular weight cut-off regenerated cellulose membrane was used for filtering the
cross-flow out. The channel-flow rate was set constantly at 1mL/min, and the cross-
flow rate was adjusted manually to have the best resolution between void peak and
sample‘s peak (ranges from 0.3 to 1.5 mL/min). 10 minutes focusing time was set for
all the experiment. The volume of sample injected into the instrument was between
0.5 – 1.5mL, depend on the concentration of the sample.
For size quantification, polystyrene NPs standard from Duke scientific with
known size (20±2; 40±2 and 60±2nm) were used as the standard. The retention time
of the sample was compared with the standard to obtain the size of the NPs.
3.7.6. TEM and AFM sample preparation
In this study, TEM samples were prepared by a drop deposition technique. A
drop of suspension was placed onto a 300 mesh copper grid, fully covered with
carbon film (Agar scientific). After 2 hours (nearly dry), the grid was then washed
with drops of ultrapure water and let the grid to dry for another hour. Within the same
day the prepared specimens were analyzed by TEM to avoid the risk of physical and
chemical changes of the sample.
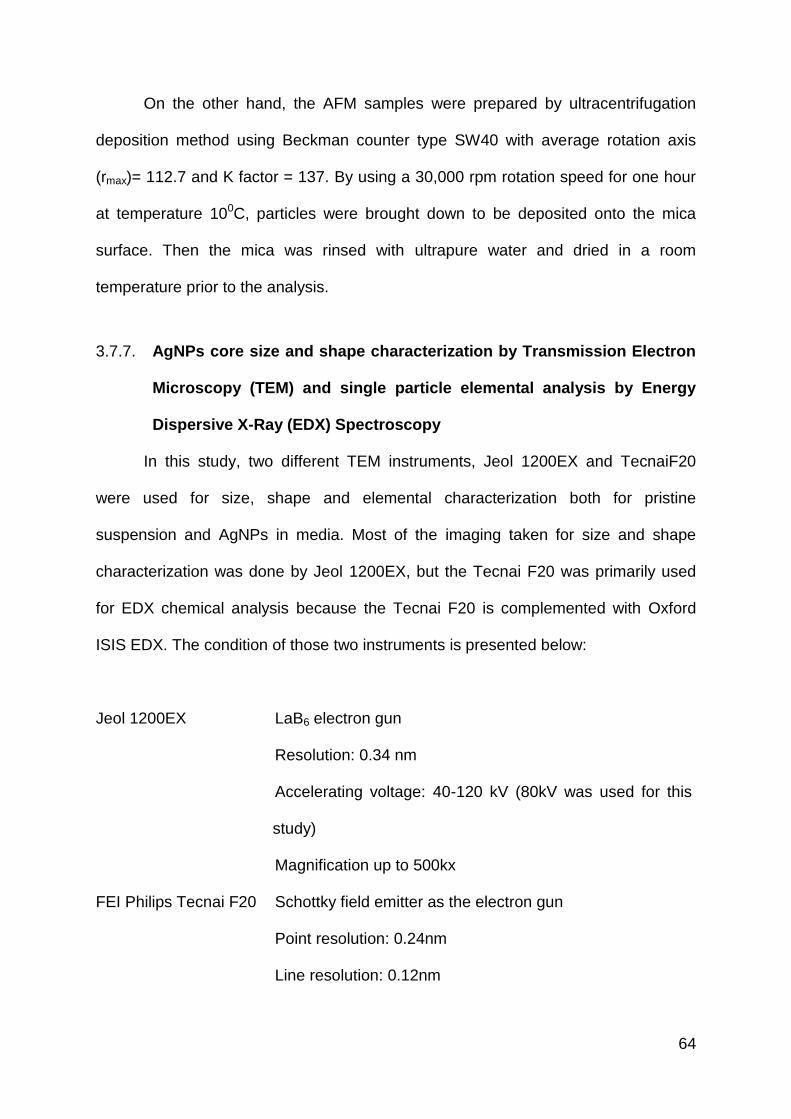
64
On the other hand, the AFM samples were prepared by ultracentrifugation
deposition method using Beckman counter type SW40 with average rotation axis
(rmax)= 112.7 and K factor = 137. By using a 30,000 rpm rotation speed for one hour
at temperature 100C, particles were brought down to be deposited onto the mica
surface. Then the mica was rinsed with ultrapure water and dried in a room
temperature prior to the analysis.
3.7.7. AgNPs core size and shape characterization by Transmission Electron
Microscopy (TEM) and single particle elemental analysis by Energy
Dispersive X-Ray (EDX) Spectroscopy
In this study, two different TEM instruments, Jeol 1200EX and TecnaiF20
were used for size, shape and elemental characterization both for pristine
suspension and AgNPs in media. Most of the imaging taken for size and shape
characterization was done by Jeol 1200EX, but the Tecnai F20 was primarily used
for EDX chemical analysis because the Tecnai F20 is complemented with Oxford
ISIS EDX. The condition of those two instruments is presented below:
Jeol 1200EX LaB6 electron gun
Resolution: 0.34 nm
Accelerating voltage: 40-120 kV (80kV was used for this
study)
Magnification up to 500kx
FEI Philips Tecnai F20 Schottky field emitter as the electron gun
Point resolution: 0.24nm
Line resolution: 0.12nm
65
Accelerating voltage: 200kV
Equipped with Oxford ISIS EDX and Gatan digiPEELS
detectors
Magnification: 30x -1280 kx
The images were taken and analyzed with Gatan DigitalMicrograph and
ImageJ software. The size of NPs were averaged from at least 100 NPs from each
grid, but the shape factor were calculated from about 50 Nps.
3.7.8. Size and shape characterization by Atomic Force Microscopy (AFM)
In this study, AFM was used for core size analysis of AgNPs in pristine
suspension. The XE-100 PSIA from Park system was used and operated by non
contact mode by using a silicon cantilever (PPP-NCHR, tip radius < 10nm).
Decoupled and motorized XY scanner moves the sample and the Z scanner drives
the probe for sample imaging and measurement. Super luminescent diode (830 nm)
with low coherency was used for cantilever deflection detection. Maximum sample
size of 100 mm x 100 mm, 20 mm thick, up to 500 g, 780x magnification and 1 µm
optical resolution are offered by this instrument. The microscope was kept in an
acoustic foam box to reduce the background effect of noise and vibration on the
imaging acquisition process.
Several softwares were employed. XEC and XEP were used for data
acquisition and data visualization of the sample, and XEI software was used for
image processing and analysis. The size of NPs was averaged from at least 100
NPs by implementing the XEI system.
66
3.8. Stability study of AgNPs in eco-toxicology media
The stability of citrate-, PVP- and PEG-capped AgNPs in full strength and ten-
fold dilution of CM; NM, and SM, and in full strength of algae media (AM) was
assessed because this study is part of ecotoxicology study of AgNPs into Daphnia
magna. The use of ten-fold dilution media was suggested for ecotoxicology study as
NPs, especially electrostatic-capped NPs was unstable in high ionic strength media
and apparently no significant negative effect induced by diluting media by 10% to
organisms (Gubbins et al., 2011; Römer, White et al., 2011; Park et al., 2013). Thus
both concentrated and 10-fold dilution media was used in this stability test.
For incubation purposes, a clean AgNPs were mixed with the media at volume
ratio 1:4 to have AgNPs concentration at ± 4 ppm. This concentration was chosen
because it lies within range of LC50 of AgNPs ecotoxicity findings (<7 ppm) (de Lima
et al., 2012) and can be clearly detected by instrumentation, especially UV-Vis
spectrometry.
Four replicates of each suspension were prepared and stored in acid washed
HDPE plastic vials. The incubation time of AgNPs in daphnia sp. media and its
variants (NM and SM) was 21 days, and 3 days in algae media according to OECD
standard ecotoxicology test (OECD, 2002; 2004). Since the aim of this study was to
examine the capping-agent and media effect into the AgNPs stability, the
confounding factor such as light and organism (Freitas and Müller, 1998; Cheng et
al., 2011) were controlled by performing the experiment in the absence of light and
organism. Characteristics of AgNPs during and after incubation media were
assessed by multi-method characterization techniques as presented earlier.
67
Dissolution of AgNPs in full strength and diluted OECD daphnia media (CM-1
and CM-10 respectively), and full strength and diluted nitrate media (NM-1 and NM-
10) were assessed and will be described further in following paragraph.
3.9. Preliminary dissolution study of PVP capped AgNPs
The release of silver ion from pristine AgNPs suspension during storage (at 7
and 10 days storage) and during incubation in ecotoxicology media was quantified.
The experiments were done in HDPE plastic containers as silver ion adsorptivity into
borosilica glass was found to be high (West et al., 1966; Struempler, 1973). A 1 to 4
volume ratio of AgNPs suspension to the media were prepared and stored in an acid
washed HDPE plastic bottle. The AgNPs-media mixture was kept for 21 days in
temperature and light controlled room, having the same condition with Daphnia sp.
exposure condition set-up with temperature 18-190C and 18 hours light and 6 hours
dark (OECD, 2004).
The concentration of released silver ion were measured by performing two
steps of work: ion species separation and concentration measurement. Two methods
of ion separation used in this study were ultrafiltration and dialysis, and concentration
measurement by Inductively Coupled Plasma-Mass Spectrometry (ICP-MS).
3.9.1. Silver ion separation by ultrafiltration
Silver ion released from PVP-capped AgNPs, both during storage and after 21
days incubation in ecotoxicology media was quantified. The set-up of ultrafiltration
instrumentation was presented in section 3.6. and Figure 3. 3. A 10 mL of AgNPs
sample, both pristine and incubation AgNPs was ultra-filtered with 1KDa (MWCO)
regenerated cellulose membrane under N2 pressurised gas to have a 5mL filtrate
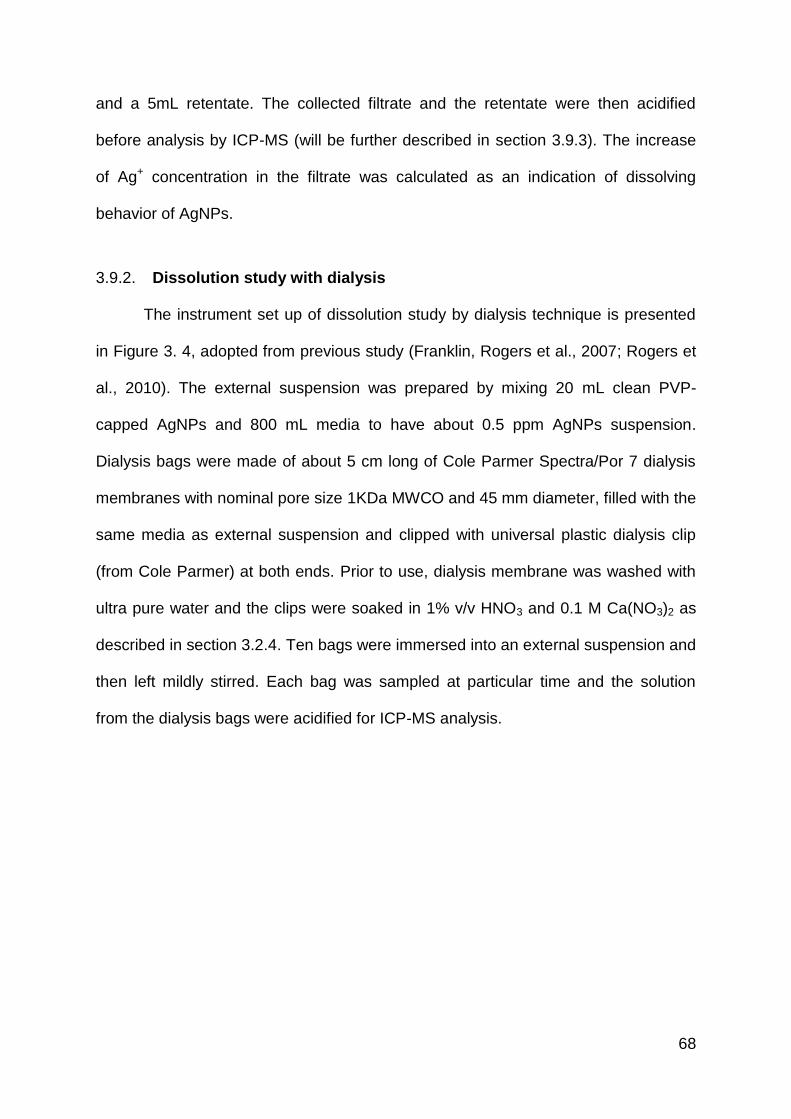
68
and a 5mL retentate. The collected filtrate and the retentate were then acidified
before analysis by ICP-MS (will be further described in section 3.9.3). The increase
of Ag+ concentration in the filtrate was calculated as an indication of dissolving
behavior of AgNPs.
3.9.2. Dissolution study with dialysis
The instrument set up of dissolution study by dialysis technique is presented
in Figure 3. 4, adopted from previous study (Franklin, Rogers et al., 2007; Rogers et
al., 2010). The external suspension was prepared by mixing 20 mL clean PVP-
capped AgNPs and 800 mL media to have about 0.5 ppm AgNPs suspension.
Dialysis bags were made of about 5 cm long of Cole Parmer Spectra/Por 7 dialysis
membranes with nominal pore size 1KDa MWCO and 45 mm diameter, filled with the
same media as external suspension and clipped with universal plastic dialysis clip
(from Cole Parmer) at both ends. Prior to use, dialysis membrane was washed with
ultra pure water and the clips were soaked in 1% v/v HNO3 and 0.1 M Ca(NO3)2 as
described in section 3.2.4. Ten bags were immersed into an external suspension and
then left mildly stirred. Each bag was sampled at particular time and the solution
from the dialysis bags were acidified for ICP-MS analysis.
69
Figure 3. 4 Dissolution study by using dialysis method
3.9.3. Inductively coupled plasma-mass spectrometry
In this study, the Agilent 7500 ICP-MS instrument were employed for AgNPs
and silver ion (Ag+) concentration measurement. High frequency quadrupole (3MHz)
was used for ion separation after the beam passed through an octopole collision or
reaction cell where the helium gas removed the polyatomic ion interferences.
All the samples were acidified prior to ICP-MS analysis. The AgNPs samples
were acid digested by adding concentrate HNO3 to have 20% v/v acid concentration
within the sample and then shaken it for at least 2 hours until the yellow colour of
AgNPs disappeared. Then the suspensions were ten-fold diluted with ultrapure water
to have 2% v/v acid concentration in the sample before ICP-MS analysis. For ion
samples, however, the samples were acidified by HNO3 to have 2%v/v acid in the
sample. All of the ICP-MS samples were kept in the acid washed and Ca(NO3)2
treated HDPE plastic bottles prior to the analysis. All the measurement and data
analysis were done by Dr. Stephen Baker, University of Birmingham UK.
External suspension (AgNPs + media)
Dialysis bag (media only)
Un-tighten cap
Magnetic stirrer
70
CHAPTER IV
SYNTHESIS AND CHARACTERIZATION OF PVP-CAPPED SILVER
NANOPARTICLES
Summary
This study examined two existing protocols for the synthesis of PVP-capped
AgNPs, termed hot process and cold process. In the hot process, the PVP polymer
was used to reduce the silver ion and to cap the generated AgNPs. In the cold
process, NaBH4 was used as the reducing agent, and the PVP polymer was added
to replace the electrostatic layer of BH4- ion surrounding the AgNPs, providing
stability to the AgNPs. One set of reaction conditions was used for the hot process,
and five conditions for cold process. The characteristics of the synthesized AgNPs,
such as UV-Vis absorbance, dH, core size, zeta potential, and shape factor were
evaluated. It was shown that the cold process generated more monodisperse NPs
than the hot process, and addition of PVP polymer prior to the nucleation process
gave a better PdI value of NP generated by cold process. Preliminary solubility
measurements showed that the amount of released ‗dissolved‘ Ag from AgNPs
incubated in chloride containing media was lower than in nitrate containing media,
possibly due to formation of Ag-Cl complexation and subsequent precipitation.
71
4.1. Introduction
A number of methods have been developed for AgNPs synthesis, classified as
top-down or bottom-up methods. Other biological methods have also been used and
all methods can utilize ‗green synthesis‘ principles. The bottom-up synthesis
approach is the most widely implemented method according to 200 reviewed
publications (Tolaymat, El Badawy et al., 2010). It was revealed that most of the
AgNPs were synthesized from AgNO3 as the main precursor (83%), using NaBH4 as
reducing agent (≈23%), citrate (27%) and PVP (18%) as the main capping agents,
and water as the solvent (80%). Generally, the synthesized AgNPs were spherical
and less than 20nm in diameter (Tolaymat, El Badawy et al., 2010).
Other reducing agents which have been used to synthesize AgNPs including
hydroquinone (Patakfalvi et al., 2007), hydrazine hydrate (Zhang et al., 1996), and
ethylene glycol (Ducamp-Sanguesa et al., 1992; Silvert et al., 1997). Some polymers
such as Polyvinylpirrolydone (PVP), polyethylene glycol (PEG) and polyvinyl alcohol
(PVA) have also been used both as the reducing agent and the stabilizer
concurrently (Porel et al., 2004; Hoppe, Lazzari et al., 2006; Popa et al., 2007). A
strong reducing agent such as NaBH4 may lead to a fast reduction and nucleation
process, which then produces small monodispersed AgNPs (Patakfalvi, Papp et al.,
2007). With a weaker reducing agent, such as a polymer however, a slower reaction
occurs, so the NPs growth can be controlled for generating particular shapes and
sizes (Washio et al., 2006; Patakfalvi, Papp et al., 2007).
PVP-capped AgNPs in particular has been synthesized by number of method,
such as electrochemical (Yin et al., 2003), ɣ-irradiation (Huang et al., 1996; Shin et
al., 2004), with and without heating (Mulfinger, Solomon et al., 2007) and generated
different shapes of AgNPs such as triangular(Washio, Xiong et al., 2006), nano-wire,
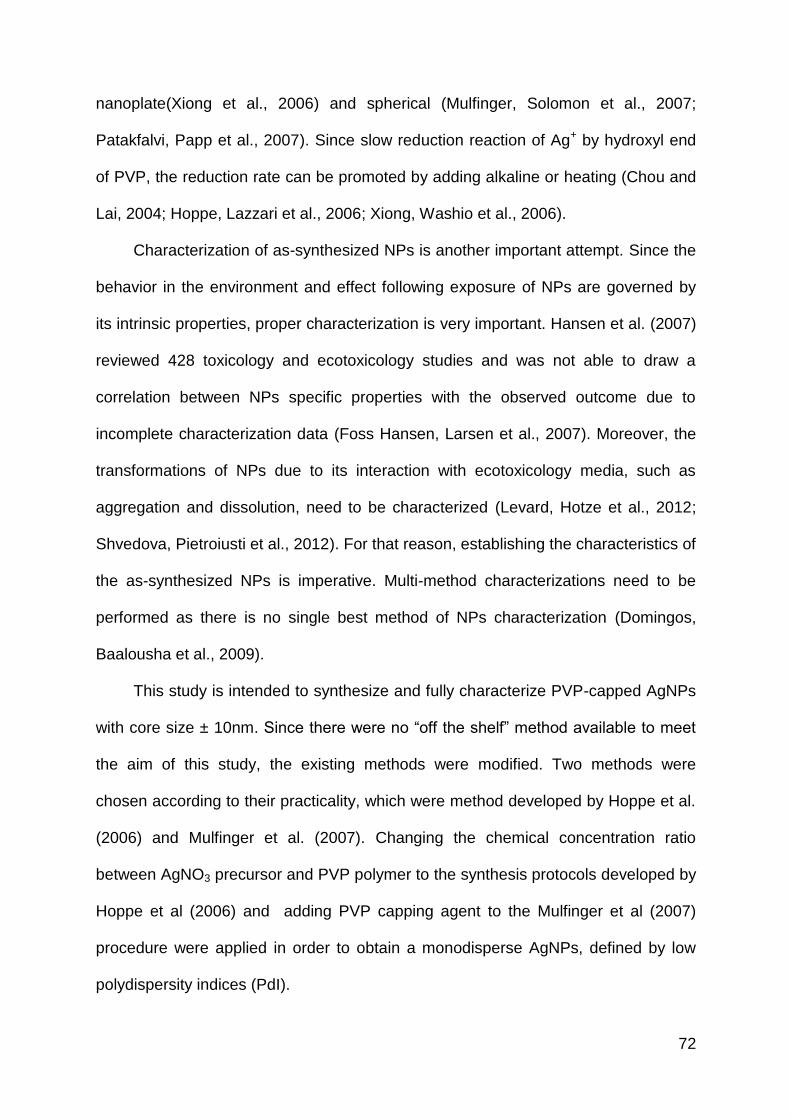
72
nanoplate(Xiong et al., 2006) and spherical (Mulfinger, Solomon et al., 2007;
Patakfalvi, Papp et al., 2007). Since slow reduction reaction of Ag+ by hydroxyl end
of PVP, the reduction rate can be promoted by adding alkaline or heating (Chou and
Lai, 2004; Hoppe, Lazzari et al., 2006; Xiong, Washio et al., 2006).
Characterization of as-synthesized NPs is another important attempt. Since the
behavior in the environment and effect following exposure of NPs are governed by
its intrinsic properties, proper characterization is very important. Hansen et al. (2007)
reviewed 428 toxicology and ecotoxicology studies and was not able to draw a
correlation between NPs specific properties with the observed outcome due to
incomplete characterization data (Foss Hansen, Larsen et al., 2007). Moreover, the
transformations of NPs due to its interaction with ecotoxicology media, such as
aggregation and dissolution, need to be characterized (Levard, Hotze et al., 2012;
Shvedova, Pietroiusti et al., 2012). For that reason, establishing the characteristics of
the as-synthesized NPs is imperative. Multi-method characterizations need to be
performed as there is no single best method of NPs characterization (Domingos,
Baalousha et al., 2009).
This study is intended to synthesize and fully characterize PVP-capped AgNPs
with core size ± 10nm. Since there were no ―off the shelf‖ method available to meet
the aim of this study, the existing methods were modified. Two methods were
chosen according to their practicality, which were method developed by Hoppe et al.
(2006) and Mulfinger et al. (2007). Changing the chemical concentration ratio
between AgNO3 precursor and PVP polymer to the synthesis protocols developed by
Hoppe et al (2006) and adding PVP capping agent to the Mulfinger et al (2007)
procedure were applied in order to obtain a monodisperse AgNPs, defined by low
polydispersity indices (PdI).
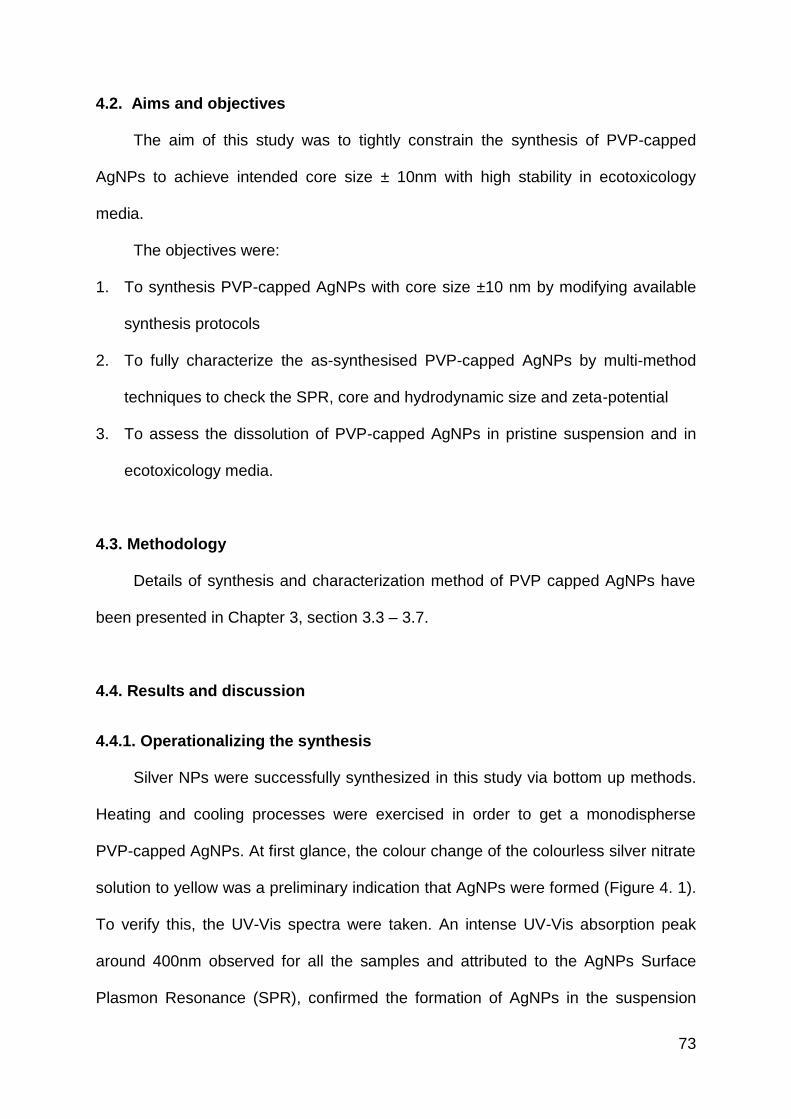
73
4.2. Aims and objectives
The aim of this study was to tightly constrain the synthesis of PVP-capped
AgNPs to achieve intended core size ± 10nm with high stability in ecotoxicology
media.
The objectives were:
1. To synthesis PVP-capped AgNPs with core size ±10 nm by modifying available
synthesis protocols
2. To fully characterize the as-synthesised PVP-capped AgNPs by multi-method
techniques to check the SPR, core and hydrodynamic size and zeta-potential
3. To assess the dissolution of PVP-capped AgNPs in pristine suspension and in
ecotoxicology media.
4.3. Methodology
Details of synthesis and characterization method of PVP capped AgNPs have
been presented in Chapter 3, section 3.3 – 3.7.
4.4. Results and discussion
4.4.1. Operationalizing the synthesis
Silver NPs were successfully synthesized in this study via bottom up methods.
Heating and cooling processes were exercised in order to get a monodispherse
PVP-capped AgNPs. At first glance, the colour change of the colourless silver nitrate
solution to yellow was a preliminary indication that AgNPs were formed (Figure 4. 1).
To verify this, the UV-Vis spectra were taken. An intense UV-Vis absorption peak
around 400nm observed for all the samples and attributed to the AgNPs Surface
Plasmon Resonance (SPR), confirmed the formation of AgNPs in the suspension
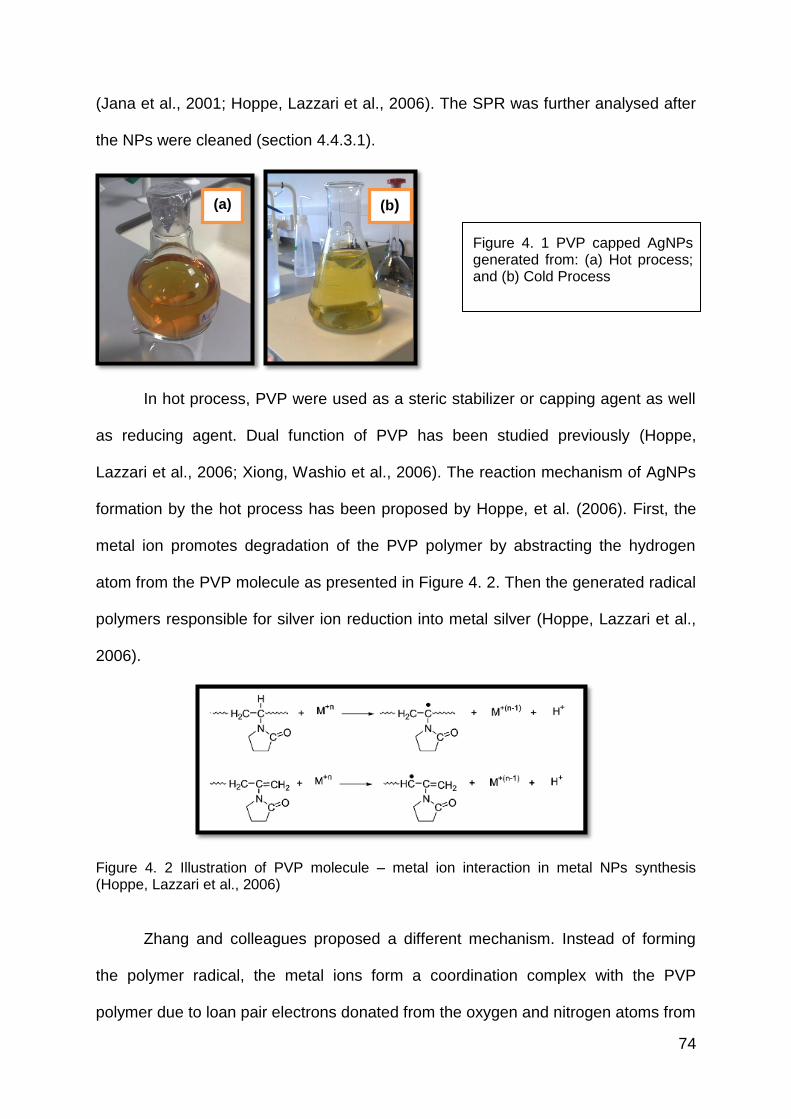
74
(Jana et al., 2001; Hoppe, Lazzari et al., 2006). The SPR was further analysed after
the NPs were cleaned (section 4.4.3.1).
In hot process, PVP were used as a steric stabilizer or capping agent as well
as reducing agent. Dual function of PVP has been studied previously (Hoppe,
Lazzari et al., 2006; Xiong, Washio et al., 2006). The reaction mechanism of AgNPs
formation by the hot process has been proposed by Hoppe, et al. (2006). First, the
metal ion promotes degradation of the PVP polymer by abstracting the hydrogen
atom from the PVP molecule as presented in Figure 4. 2. Then the generated radical
polymers responsible for silver ion reduction into metal silver (Hoppe, Lazzari et al.,
2006).
Figure 4. 2 Illustration of PVP molecule – metal ion interaction in metal NPs synthesis (Hoppe, Lazzari et al., 2006)
Zhang and colleagues proposed a different mechanism. Instead of forming
the polymer radical, the metal ions form a coordination complex with the PVP
polymer due to loan pair electrons donated from the oxygen and nitrogen atoms from
(a) (b)
Figure 4. 1 PVP capped AgNPs generated from: (a) Hot process; and (b) Cold Process
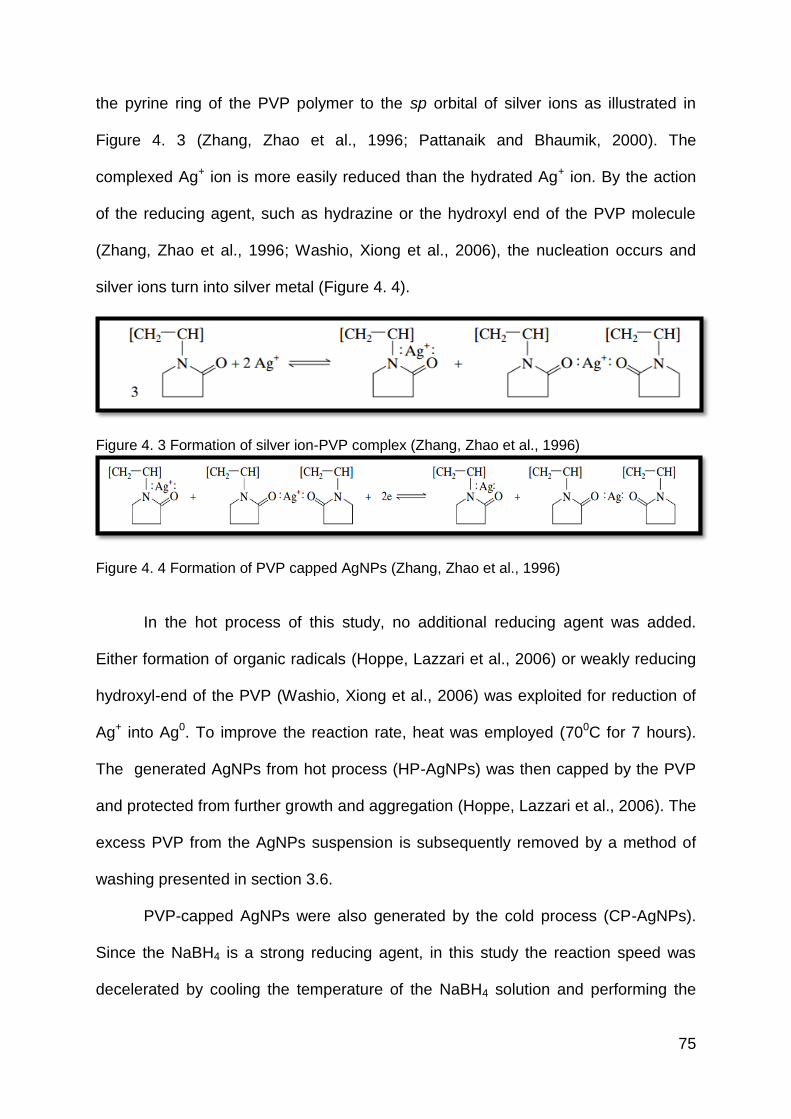
75
the pyrine ring of the PVP polymer to the sp orbital of silver ions as illustrated in
Figure 4. 3 (Zhang, Zhao et al., 1996; Pattanaik and Bhaumik, 2000). The
complexed Ag+ ion is more easily reduced than the hydrated Ag+ ion. By the action
of the reducing agent, such as hydrazine or the hydroxyl end of the PVP molecule
(Zhang, Zhao et al., 1996; Washio, Xiong et al., 2006), the nucleation occurs and
silver ions turn into silver metal (Figure 4. 4).
Figure 4. 3 Formation of silver ion-PVP complex (Zhang, Zhao et al., 1996)
Figure 4. 4 Formation of PVP capped AgNPs (Zhang, Zhao et al., 1996)
In the hot process of this study, no additional reducing agent was added.
Either formation of organic radicals (Hoppe, Lazzari et al., 2006) or weakly reducing
hydroxyl-end of the PVP (Washio, Xiong et al., 2006) was exploited for reduction of
Ag+ into Ag0. To improve the reaction rate, heat was employed (700C for 7 hours).
The generated AgNPs from hot process (HP-AgNPs) was then capped by the PVP
and protected from further growth and aggregation (Hoppe, Lazzari et al., 2006). The
excess PVP from the AgNPs suspension is subsequently removed by a method of
washing presented in section 3.6.
PVP-capped AgNPs were also generated by the cold process (CP-AgNPs).
Since the NaBH4 is a strong reducing agent, in this study the reaction speed was
decelerated by cooling the temperature of the NaBH4 solution and performing the
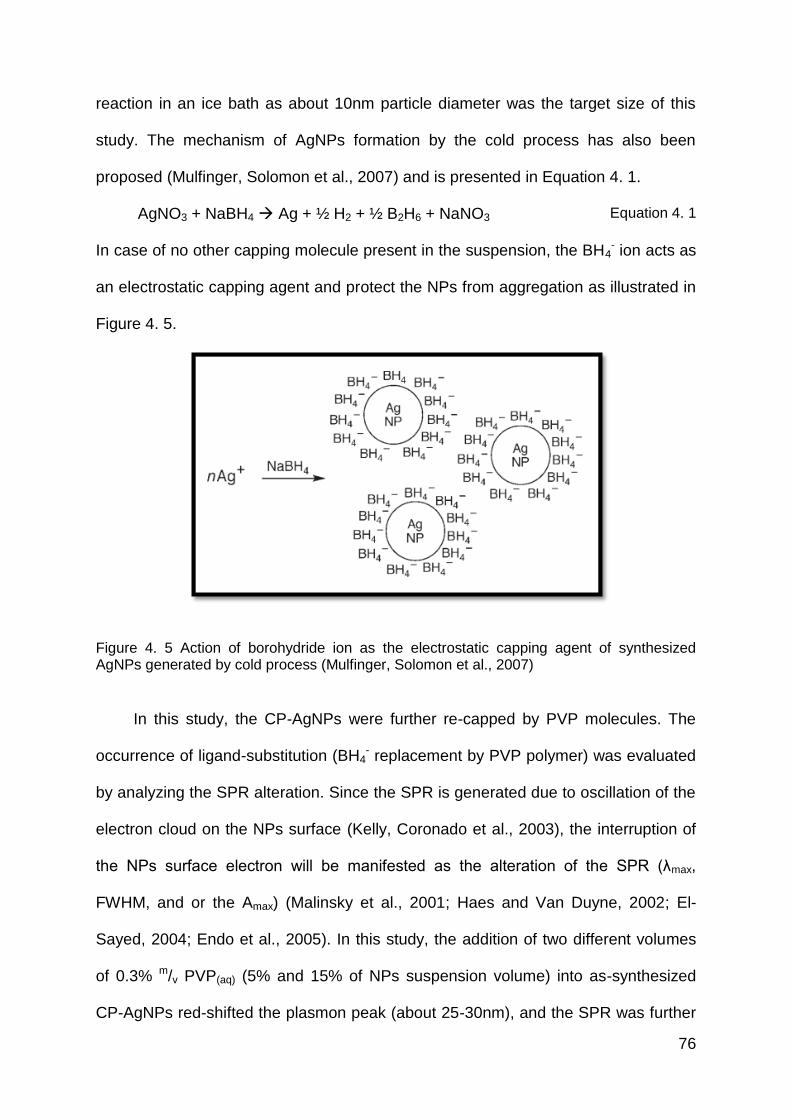
76
reaction in an ice bath as about 10nm particle diameter was the target size of this
study. The mechanism of AgNPs formation by the cold process has also been
proposed (Mulfinger, Solomon et al., 2007) and is presented in Equation 4. 1.
AgNO3 + NaBH4 Ag + ½ H2 + ½ B2H6 + NaNO3 Equation 4. 1
In case of no other capping molecule present in the suspension, the BH4- ion acts as
an electrostatic capping agent and protect the NPs from aggregation as illustrated in
Figure 4. 5.
Figure 4. 5 Action of borohydride ion as the electrostatic capping agent of synthesized AgNPs generated by cold process (Mulfinger, Solomon et al., 2007)
In this study, the CP-AgNPs were further re-capped by PVP molecules. The
occurrence of ligand-substitution (BH4- replacement by PVP polymer) was evaluated
by analyzing the SPR alteration. Since the SPR is generated due to oscillation of the
electron cloud on the NPs surface (Kelly, Coronado et al., 2003), the interruption of
the NPs surface electron will be manifested as the alteration of the SPR (λmax,
FWHM, and or the Amax) (Malinsky et al., 2001; Haes and Van Duyne, 2002; El-
Sayed, 2004; Endo et al., 2005). In this study, the addition of two different volumes
of 0.3% m/v PVP(aq) (5% and 15% of NPs suspension volume) into as-synthesized
CP-AgNPs red-shifted the plasmon peak (about 25-30nm), and the SPR was further
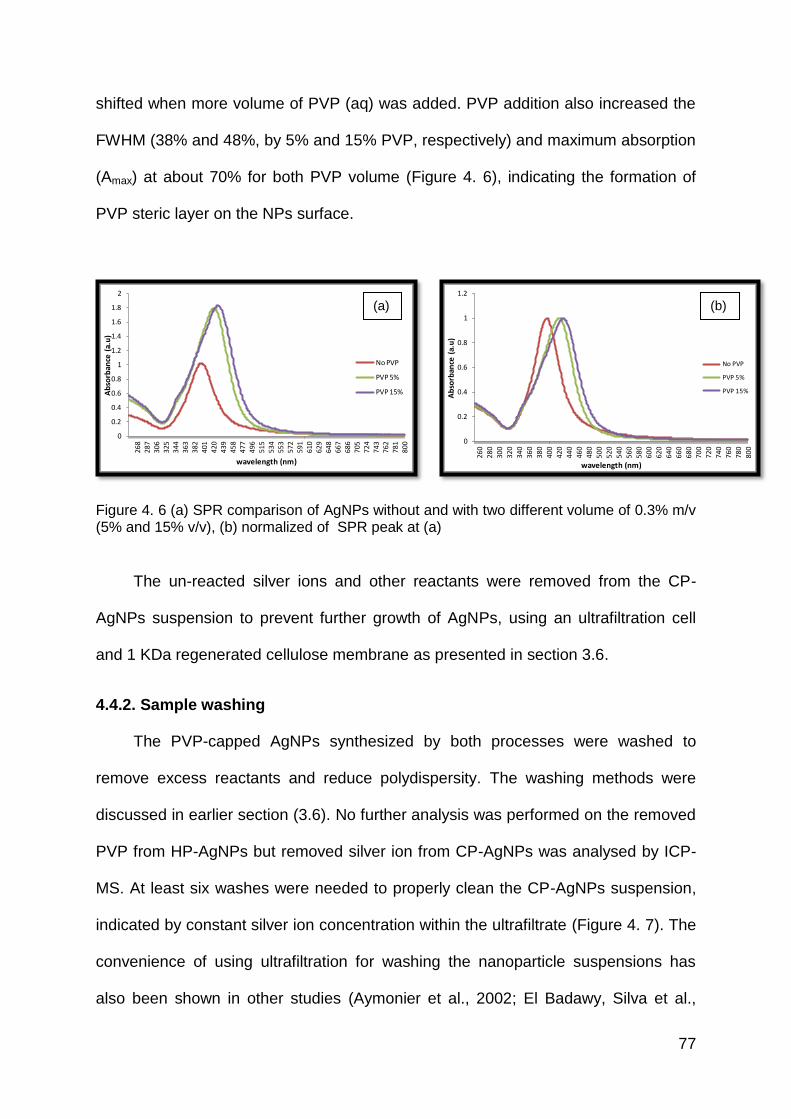
77
shifted when more volume of PVP (aq) was added. PVP addition also increased the
FWHM (38% and 48%, by 5% and 15% PVP, respectively) and maximum absorption
(Amax) at about 70% for both PVP volume (Figure 4. 6), indicating the formation of
PVP steric layer on the NPs surface.
Figure 4. 6 (a) SPR comparison of AgNPs without and with two different volume of 0.3% m/v (5% and 15% v/v), (b) normalized of SPR peak at (a)
The un-reacted silver ions and other reactants were removed from the CP-
AgNPs suspension to prevent further growth of AgNPs, using an ultrafiltration cell
and 1 KDa regenerated cellulose membrane as presented in section 3.6.
4.4.2. Sample washing
The PVP-capped AgNPs synthesized by both processes were washed to
remove excess reactants and reduce polydispersity. The washing methods were
discussed in earlier section (3.6). No further analysis was performed on the removed
PVP from HP-AgNPs but removed silver ion from CP-AgNPs was analysed by ICP-
MS. At least six washes were needed to properly clean the CP-AgNPs suspension,
indicated by constant silver ion concentration within the ultrafiltrate (Figure 4. 7). The
convenience of using ultrafiltration for washing the nanoparticle suspensions has
also been shown in other studies (Aymonier et al., 2002; El Badawy, Silva et al.,
0
0.2
0.4
0.6
0.8
1
1.2
1.4
1.6
1.8
2
80
07
81
76
27
43
72
47
05
68
66
67
64
86
29
61
05
91
57
25
53
53
45
15
49
64
77
45
84
39
42
04
01
38
23
63
34
43
25
30
62
87
26
8
Ab
sorb
ance
(a.
u)
wavelength (nm)
No PVP
PVP 5%
PVP 15%
0
0.2
0.4
0.6
0.8
1
1.2
80
0
78
0
76
0
74
0
72
0
70
0
68
0
66
0
64
0
62
0
60
0
58
0
56
0
54
0
52
0
50
0
48
0
46
0
44
0
42
0
40
0
38
0
36
0
34
0
32
0
30
0
28
0
26
0
Ab
sorb
ance
(a.
u)
wavelength (nm)
No PVP
PVP 5%
PVP 15%
(a) (b)
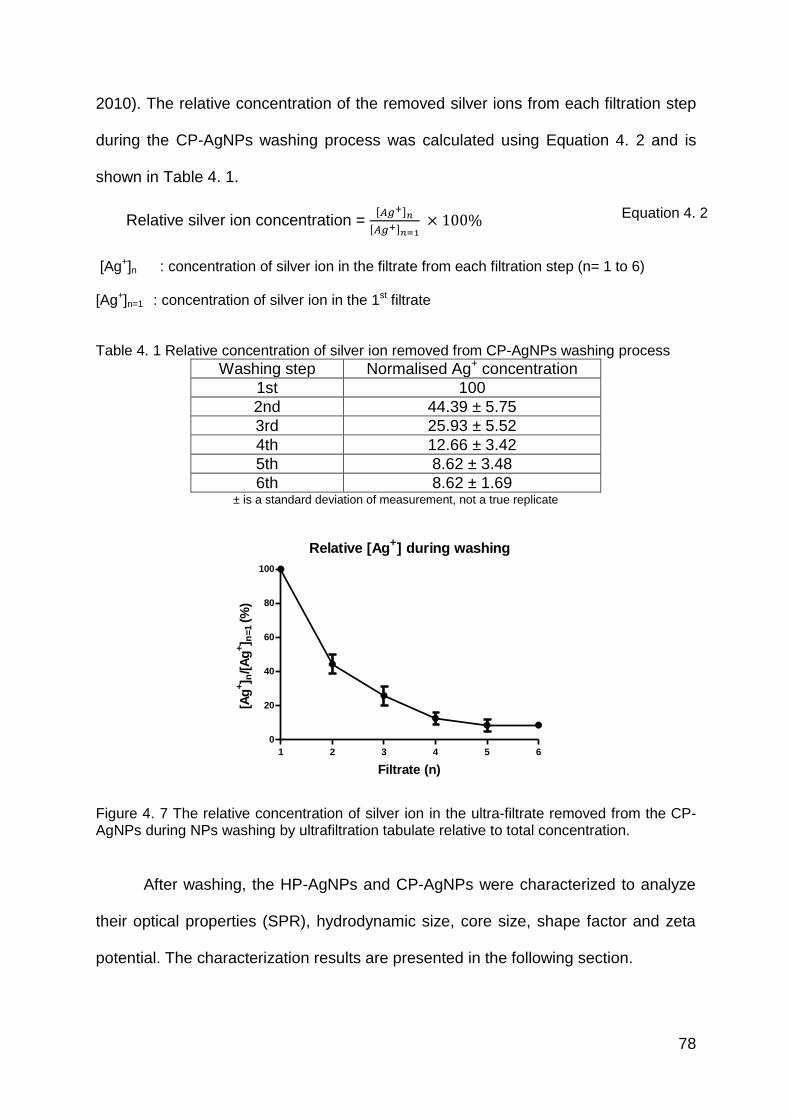
78
2010). The relative concentration of the removed silver ions from each filtration step
during the CP-AgNPs washing process was calculated using Equation 4. 2 and is
shown in Table 4. 1.
Relative silver ion concentration = [ ]
[ ]
Equation 4. 2
[Ag+]n : concentration of silver ion in the filtrate from each filtration step (n= 1 to 6)
[Ag+]n=1 : concentration of silver ion in the 1st filtrate
Table 4. 1 Relative concentration of silver ion removed from CP-AgNPs washing process
Washing step Normalised Ag+ concentration
1st 100
2nd 44.39 ± 5.75
3rd 25.93 ± 5.52
4th 12.66 ± 3.42
5th 8.62 ± 3.48
6th 8.62 ± 1.69 ± is a standard deviation of measurement, not a true replicate
Relative [Ag+] during washing
1 2 3 4 5 6
0
20
40
60
80
100
Filtrate (n)
[Ag
+] n
/[A
g+] n
=1
(%)
Figure 4. 7 The relative concentration of silver ion in the ultra-filtrate removed from the CP-AgNPs during NPs washing by ultrafiltration tabulate relative to total concentration.
After washing, the HP-AgNPs and CP-AgNPs were characterized to analyze
their optical properties (SPR), hydrodynamic size, core size, shape factor and zeta
potential. The characterization results are presented in the following section.
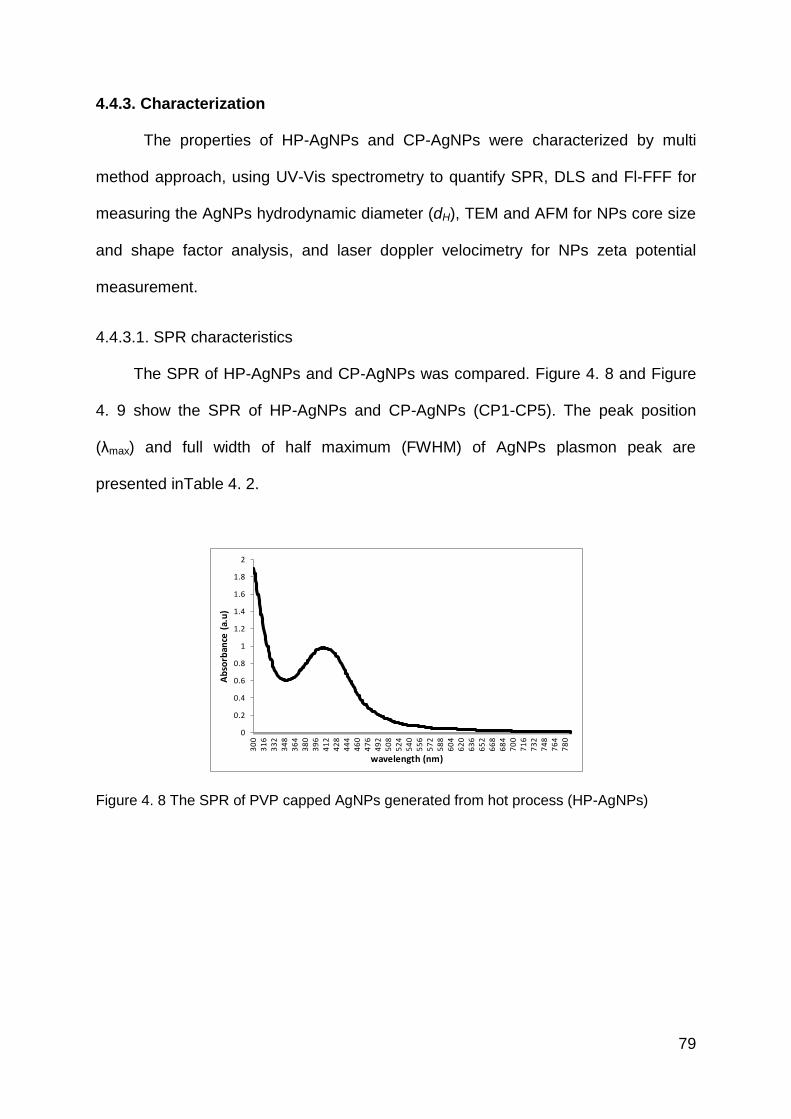
79
4.4.3. Characterization
The properties of HP-AgNPs and CP-AgNPs were characterized by multi
method approach, using UV-Vis spectrometry to quantify SPR, DLS and Fl-FFF for
measuring the AgNPs hydrodynamic diameter (dH), TEM and AFM for NPs core size
and shape factor analysis, and laser doppler velocimetry for NPs zeta potential
measurement.
4.4.3.1. SPR characteristics
The SPR of HP-AgNPs and CP-AgNPs was compared. Figure 4. 8 and Figure
4. 9 show the SPR of HP-AgNPs and CP-AgNPs (CP1-CP5). The peak position
(λmax) and full width of half maximum (FWHM) of AgNPs plasmon peak are
presented inTable 4. 2.
Figure 4. 8 The SPR of PVP capped AgNPs generated from hot process (HP-AgNPs)
0
0.2
0.4
0.6
0.8
1
1.2
1.4
1.6
1.8
2
30
03
16
33
23
48
36
43
80
39
64
12
42
84
44
46
04
76
49
25
08
52
45
40
55
65
72
58
86
04
62
06
36
65
26
68
68
47
00
71
67
32
74
87
64
78
0
Ab
sorb
ance
(a.
u)
wavelength (nm)
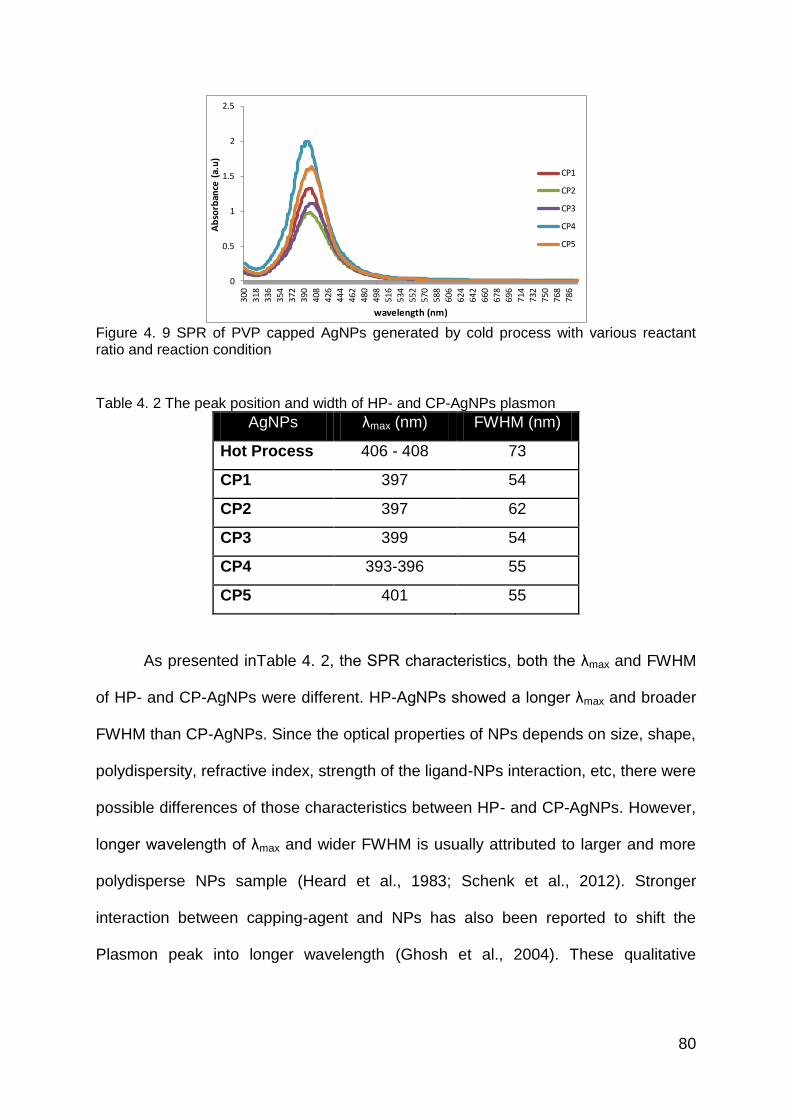
80
Figure 4. 9 SPR of PVP capped AgNPs generated by cold process with various reactant ratio and reaction condition
Table 4. 2 The peak position and width of HP- and CP-AgNPs plasmon
AgNPs λmax (nm) FWHM (nm)
Hot Process 406 - 408 73
CP1 397 54
CP2 397 62
CP3 399 54
CP4 393-396 55
CP5 401 55
As presented inTable 4. 2, the SPR characteristics, both the λmax and FWHM
of HP- and CP-AgNPs were different. HP-AgNPs showed a longer λmax and broader
FWHM than CP-AgNPs. Since the optical properties of NPs depends on size, shape,
polydispersity, refractive index, strength of the ligand-NPs interaction, etc, there were
possible differences of those characteristics between HP- and CP-AgNPs. However,
longer wavelength of λmax and wider FWHM is usually attributed to larger and more
polydisperse NPs sample (Heard et al., 1983; Schenk et al., 2012). Stronger
interaction between capping-agent and NPs has also been reported to shift the
Plasmon peak into longer wavelength (Ghosh et al., 2004). These qualitative
0
0.5
1
1.5
2
2.5
300
318
336
354
372
390
408
426
444
462
480
498
516
534
552
570
588
606
624
642
660
678
696
714
732
750
768
786
Ab
sorb
ance
(a.
u)
wavelength (nm)
CP1
CP2
CP3
CP4
CP5
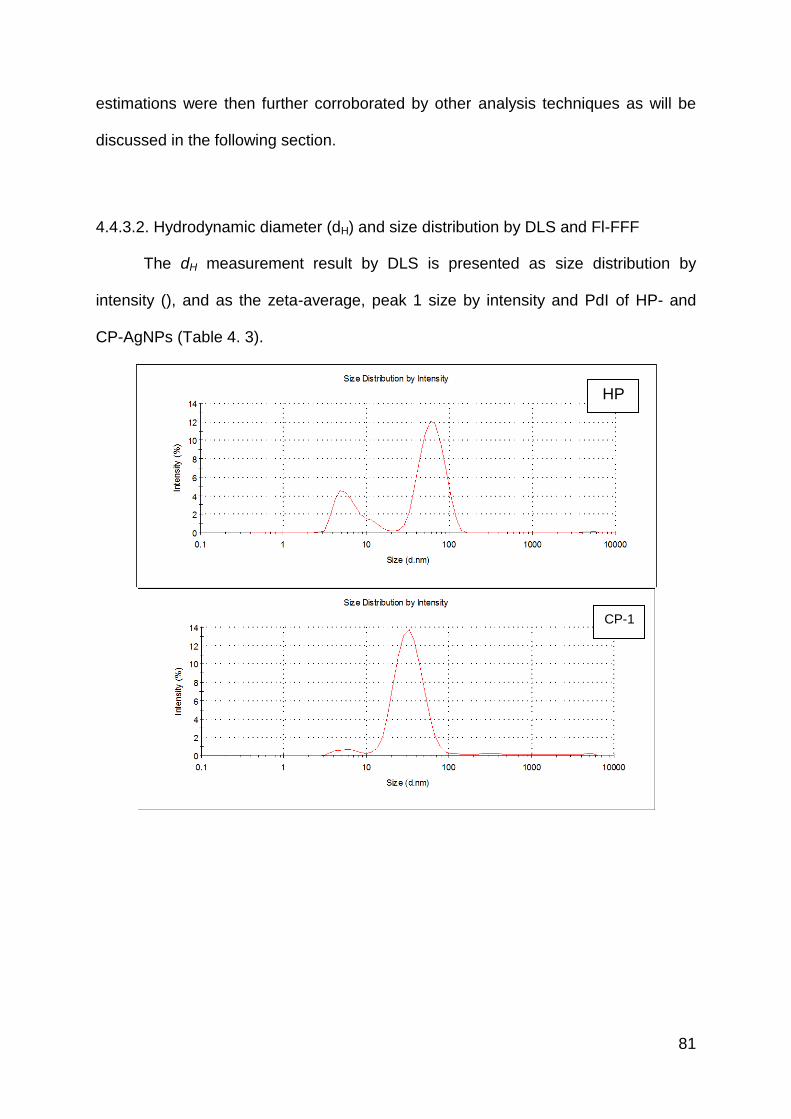
81
estimations were then further corroborated by other analysis techniques as will be
discussed in the following section.
4.4.3.2. Hydrodynamic diameter (dH) and size distribution by DLS and Fl-FFF
The dH measurement result by DLS is presented as size distribution by
intensity (), and as the zeta-average, peak 1 size by intensity and PdI of HP- and
CP-AgNPs (Table 4. 3).
CP-1
HP
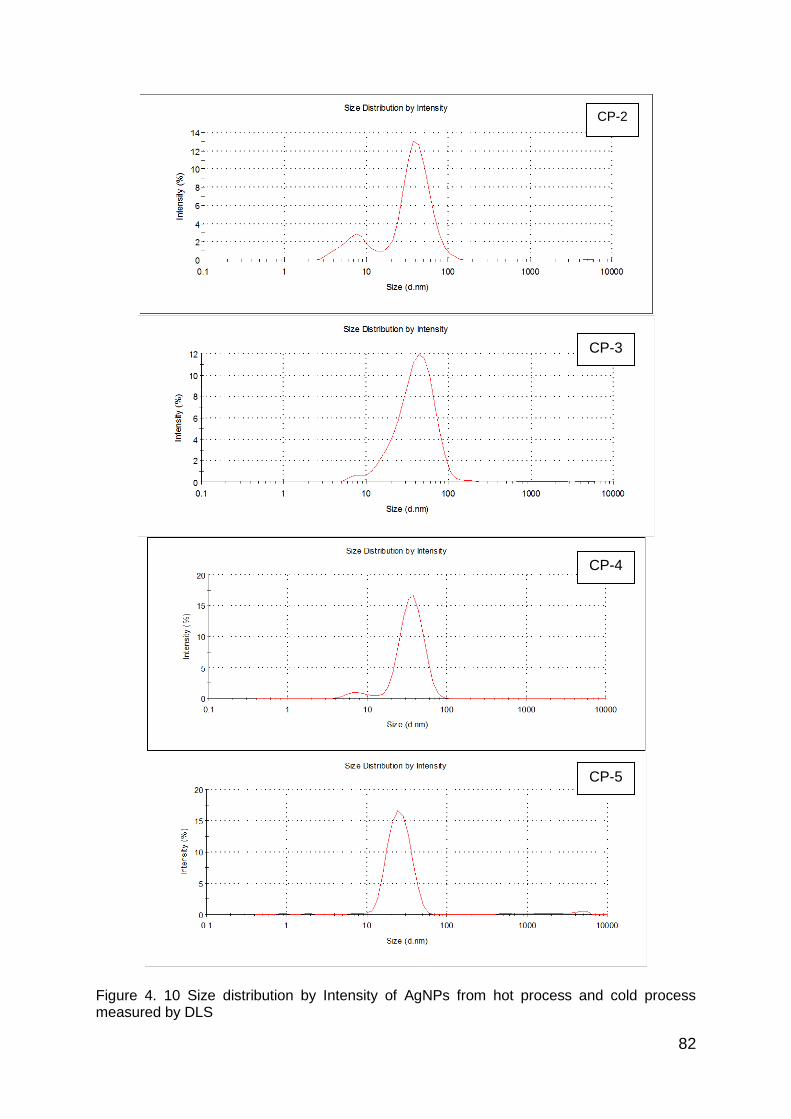
82
Figure 4. 10 Size distribution by Intensity of AgNPs from hot process and cold process measured by DLS
CP-4 CP
CPCP-3
CP-2
CP-4
CP-3
CP-5
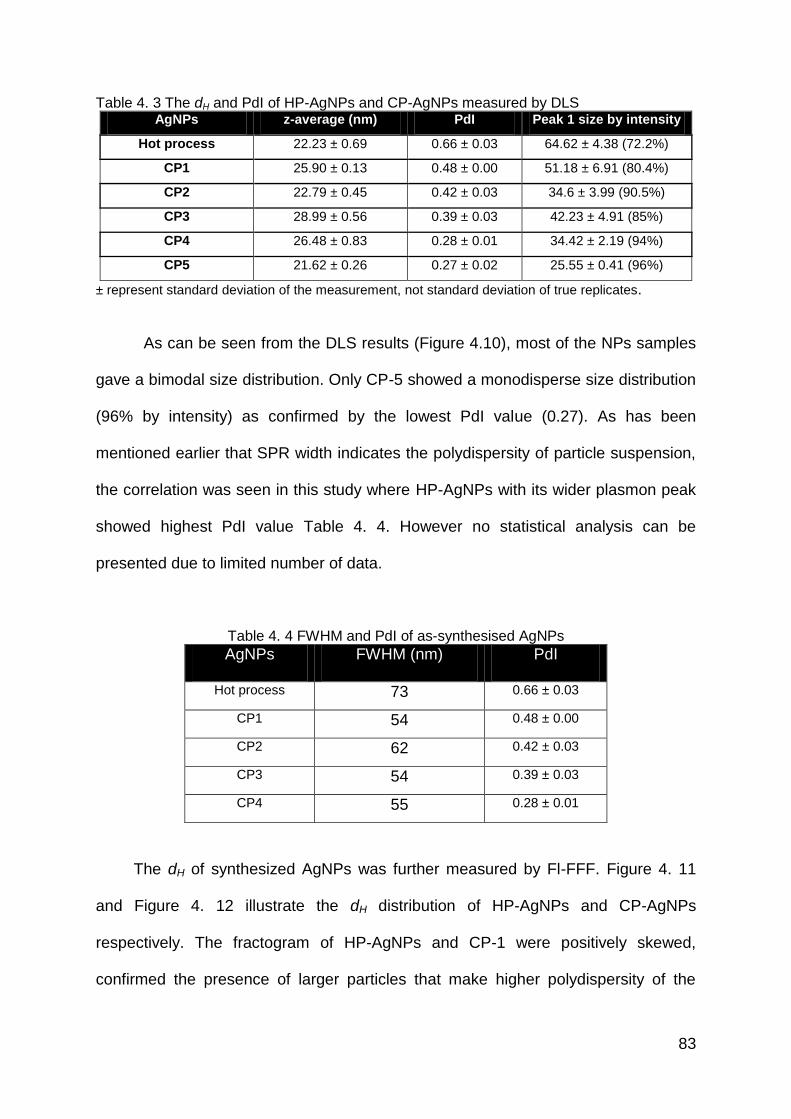
83
Table 4. 3 The dH and PdI of HP-AgNPs and CP-AgNPs measured by DLS AgNPs z-average (nm) PdI Peak 1 size by intensity
Hot process 22.23 ± 0.69 0.66 ± 0.03 64.62 ± 4.38 (72.2%)
CP1 25.90 ± 0.13 0.48 ± 0.00 51.18 ± 6.91 (80.4%)
CP2 22.79 ± 0.45 0.42 ± 0.03 34.6 ± 3.99 (90.5%)
CP3 28.99 ± 0.56 0.39 ± 0.03 42.23 ± 4.91 (85%)
CP4 26.48 ± 0.83 0.28 ± 0.01 34.42 ± 2.19 (94%)
CP5 21.62 ± 0.26 0.27 ± 0.02 25.55 ± 0.41 (96%)
± represent standard deviation of the measurement, not standard deviation of true replicates.
As can be seen from the DLS results (Figure 4.10), most of the NPs samples
gave a bimodal size distribution. Only CP-5 showed a monodisperse size distribution
(96% by intensity) as confirmed by the lowest PdI value (0.27). As has been
mentioned earlier that SPR width indicates the polydispersity of particle suspension,
the correlation was seen in this study where HP-AgNPs with its wider plasmon peak
showed highest PdI value Table 4. 4. However no statistical analysis can be
presented due to limited number of data.
Table 4. 4 FWHM and PdI of as-synthesised AgNPs
AgNPs FWHM (nm) PdI
Hot process 73 0.66 ± 0.03
CP1 54 0.48 ± 0.00
CP2 62 0.42 ± 0.03
CP3 54 0.39 ± 0.03
CP4 55 0.28 ± 0.01
The dH of synthesized AgNPs was further measured by Fl-FFF. Figure 4. 11
and Figure 4. 12 illustrate the dH distribution of HP-AgNPs and CP-AgNPs
respectively. The fractogram of HP-AgNPs and CP-1 were positively skewed,
confirmed the presence of larger particles that make higher polydispersity of the
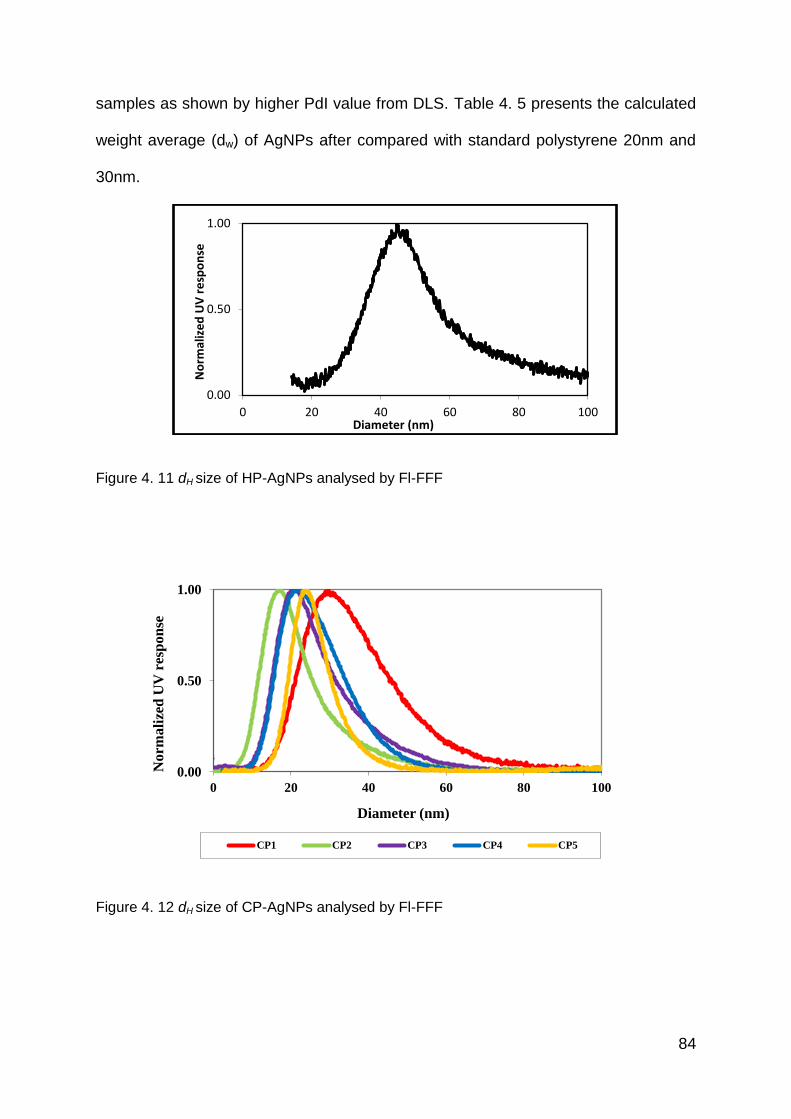
84
samples as shown by higher PdI value from DLS. Table 4. 5 presents the calculated
weight average (dw) of AgNPs after compared with standard polystyrene 20nm and
30nm.
Figure 4. 11 dH size of HP-AgNPs analysed by Fl-FFF
Figure 4. 12 dH size of CP-AgNPs analysed by Fl-FFF
0.00
0.50
1.00
0 20 40 60 80 100
No
rmal
ize
d U
V r
esp
on
se
Diameter (nm)
0.00
0.50
1.00
0 20 40 60 80 100
Norm
ali
zed
UV
res
pon
se
Diameter (nm)
CP1 CP2 CP3 CP4 CP5
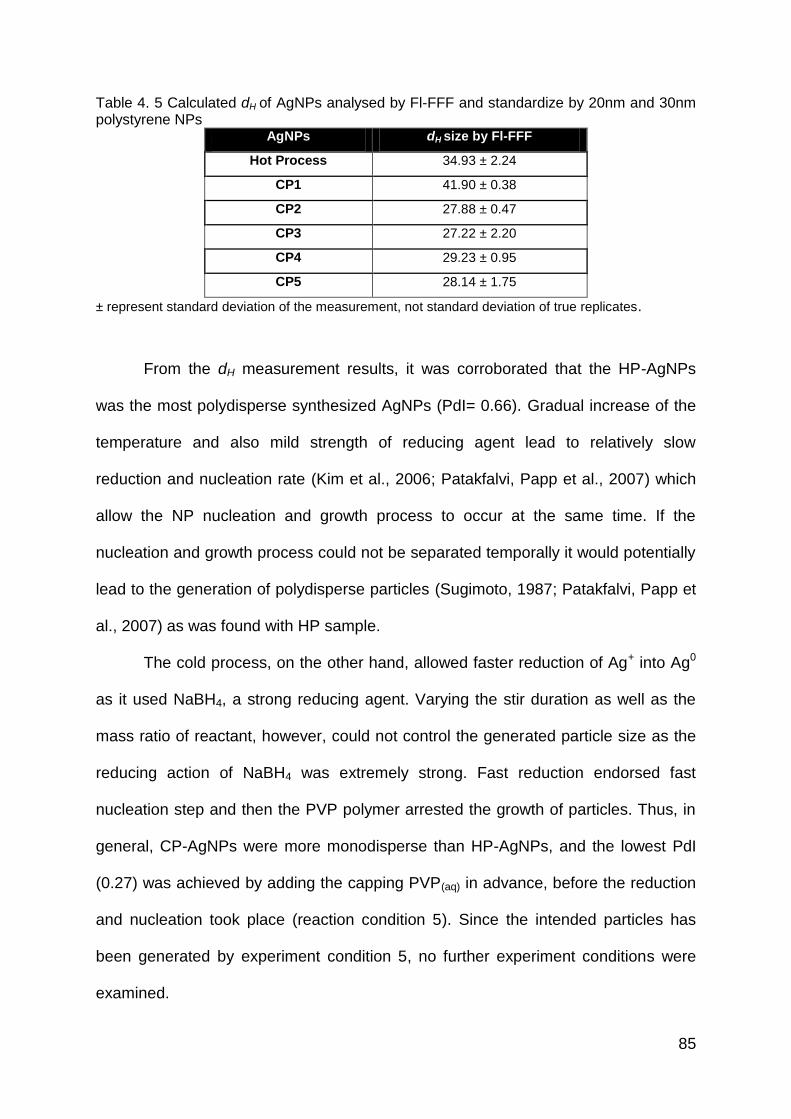
85
Table 4. 5 Calculated dH of AgNPs analysed by Fl-FFF and standardize by 20nm and 30nm polystyrene NPs
AgNPs dH size by Fl-FFF
Hot Process 34.93 ± 2.24
CP1 41.90 ± 0.38
CP2 27.88 ± 0.47
CP3 27.22 ± 2.20
CP4 29.23 ± 0.95
CP5 28.14 ± 1.75
± represent standard deviation of the measurement, not standard deviation of true replicates.
From the dH measurement results, it was corroborated that the HP-AgNPs
was the most polydisperse synthesized AgNPs (PdI= 0.66). Gradual increase of the
temperature and also mild strength of reducing agent lead to relatively slow
reduction and nucleation rate (Kim et al., 2006; Patakfalvi, Papp et al., 2007) which
allow the NP nucleation and growth process to occur at the same time. If the
nucleation and growth process could not be separated temporally it would potentially
lead to the generation of polydisperse particles (Sugimoto, 1987; Patakfalvi, Papp et
al., 2007) as was found with HP sample.
The cold process, on the other hand, allowed faster reduction of Ag+ into Ag0
as it used NaBH4, a strong reducing agent. Varying the stir duration as well as the
mass ratio of reactant, however, could not control the generated particle size as the
reducing action of NaBH4 was extremely strong. Fast reduction endorsed fast
nucleation step and then the PVP polymer arrested the growth of particles. Thus, in
general, CP-AgNPs were more monodisperse than HP-AgNPs, and the lowest PdI
(0.27) was achieved by adding the capping PVP(aq) in advance, before the reduction
and nucleation took place (reaction condition 5). Since the intended particles has
been generated by experiment condition 5, no further experiment conditions were
examined.
86
4.4.3.3. Core size by TEM and AFM
The core sizes of HP- and CP-AgNPs were analysed by TEM and AFM. The
TEM micrographs of HP- and CP-AgNPs were taken and the size and shape factor
were analysed by using Gatan Digital Micrograph and ImageJ software. The core
size was then averaged from > 100 particles and the shape factor from > 50 NPs,
and the results are presented in Table 4. 6.
The topographic images of AgNPs adsorbed onto a mica surface were taken
using AFM. The core size (height) of AgNPs was measured using XEI software from
at least 100 particles, apart from CP2 (only 53 particles) and the result is presented
in Table 4. 7.
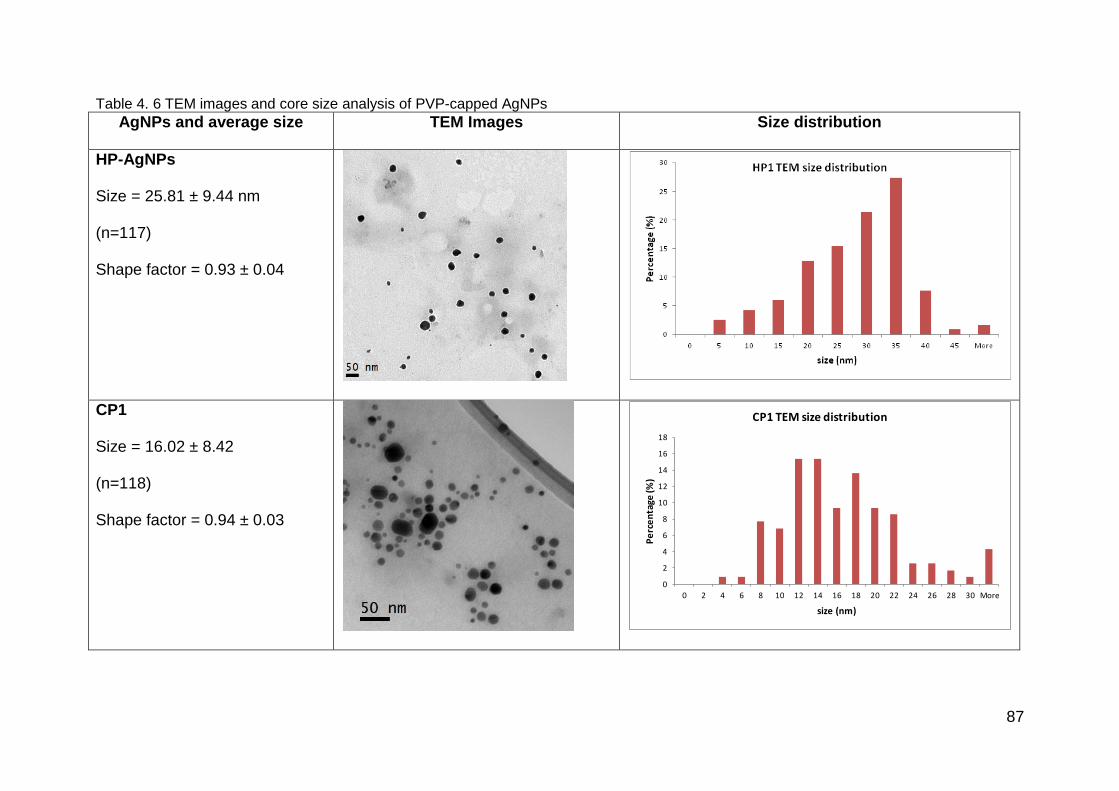
87
Table 4. 6 TEM images and core size analysis of PVP-capped AgNPs
AgNPs and average size TEM Images Size distribution
HP-AgNPs
Size = 25.81 ± 9.44 nm
(n=117)
Shape factor = 0.93 ± 0.04
CP1
Size = 16.02 ± 8.42
(n=118)
Shape factor = 0.94 ± 0.03
0
2
4
6
8
10
12
14
16
18
0 2 4 6 8 10 12 14 16 18 20 22 24 26 28 30 More
Pe
rce
nta
ge (%
)
size (nm)
CP1 TEM size distribution
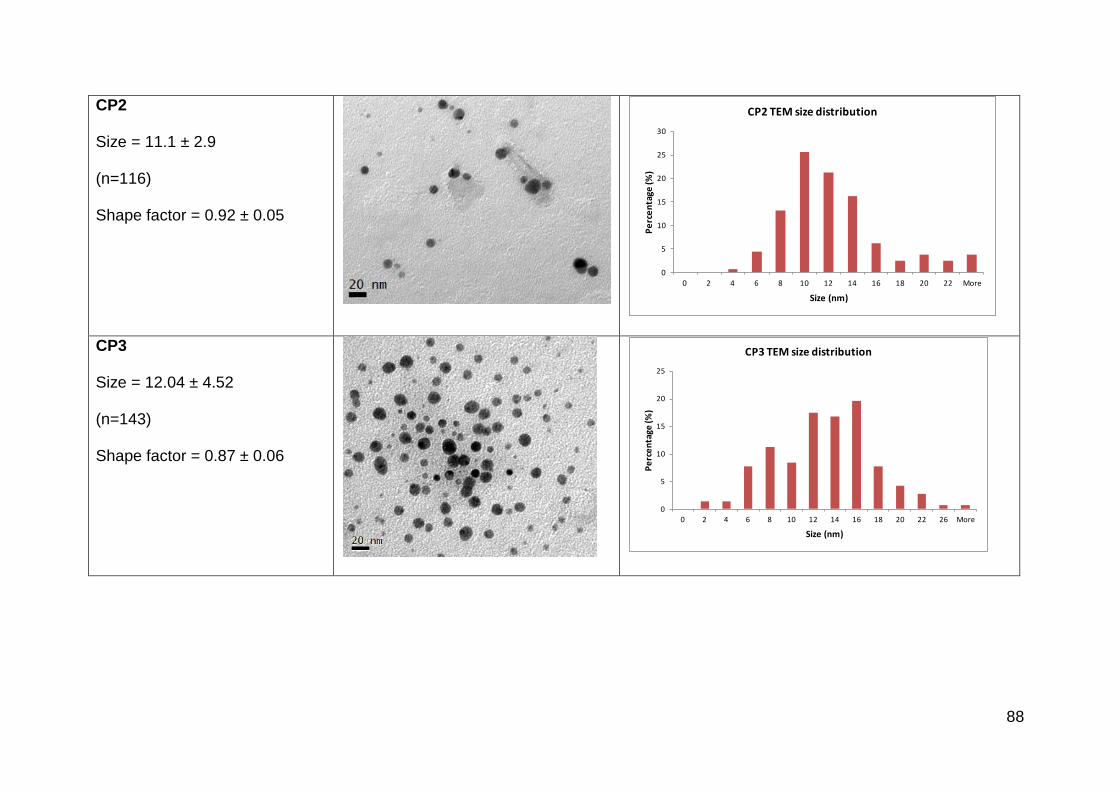
88
CP2
Size = 11.1 ± 2.9
(n=116)
Shape factor = 0.92 ± 0.05
CP3
Size = 12.04 ± 4.52
(n=143)
Shape factor = 0.87 ± 0.06
0
5
10
15
20
25
30
0 2 4 6 8 10 12 14 16 18 20 22 More
Pe
rce
nta
ge (%
)
Size (nm)
CP2 TEM size distribution
0
5
10
15
20
25
0 2 4 6 8 10 12 14 16 18 20 22 26 More
Pe
rce
nta
ge (%
)
Size (nm)
CP3 TEM size distribution
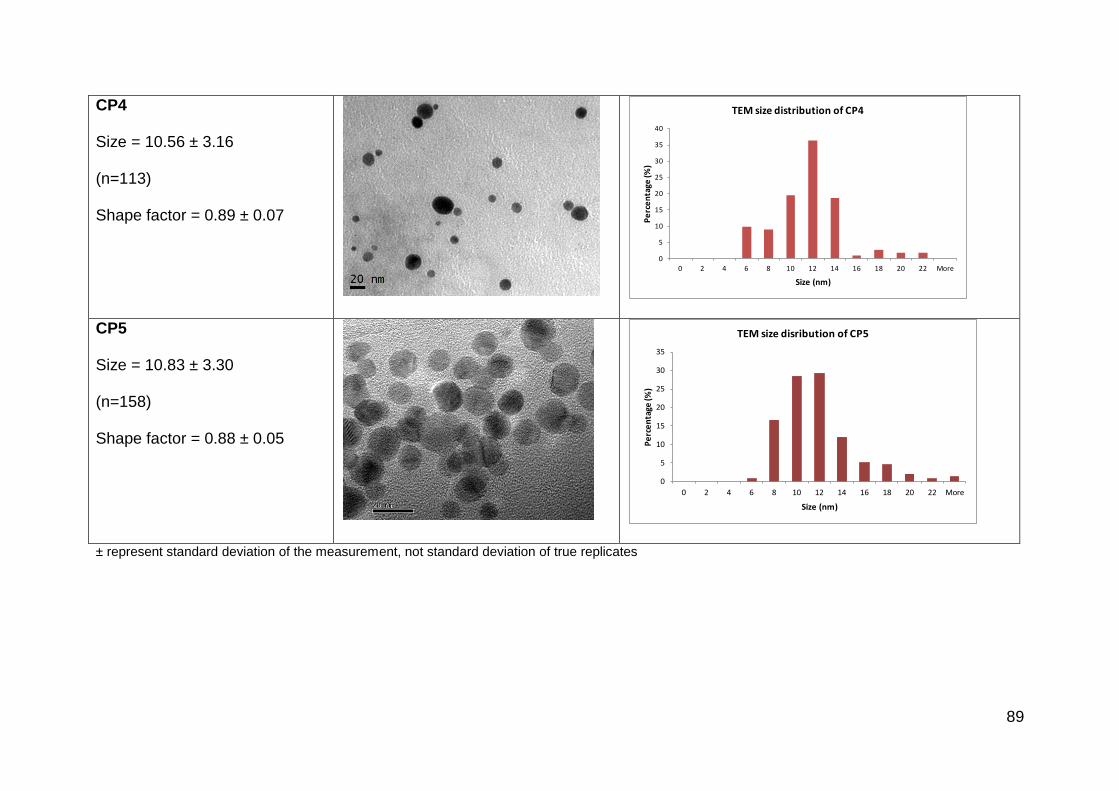
89
CP4
Size = 10.56 ± 3.16
(n=113)
Shape factor = 0.89 ± 0.07
CP5
Size = 10.83 ± 3.30
(n=158)
Shape factor = 0.88 ± 0.05
± represent standard deviation of the measurement, not standard deviation of true replicates
0
5
10
15
20
25
30
35
40
0 2 4 6 8 10 12 14 16 18 20 22 More
Pe
rce
nta
ge (%
)
Size (nm)
TEM size distribution of CP4
0
5
10
15
20
25
30
35
0 2 4 6 8 10 12 14 16 18 20 22 More
Pe
rce
nta
ge (%
)
Size (nm)
TEM size disribution of CP5
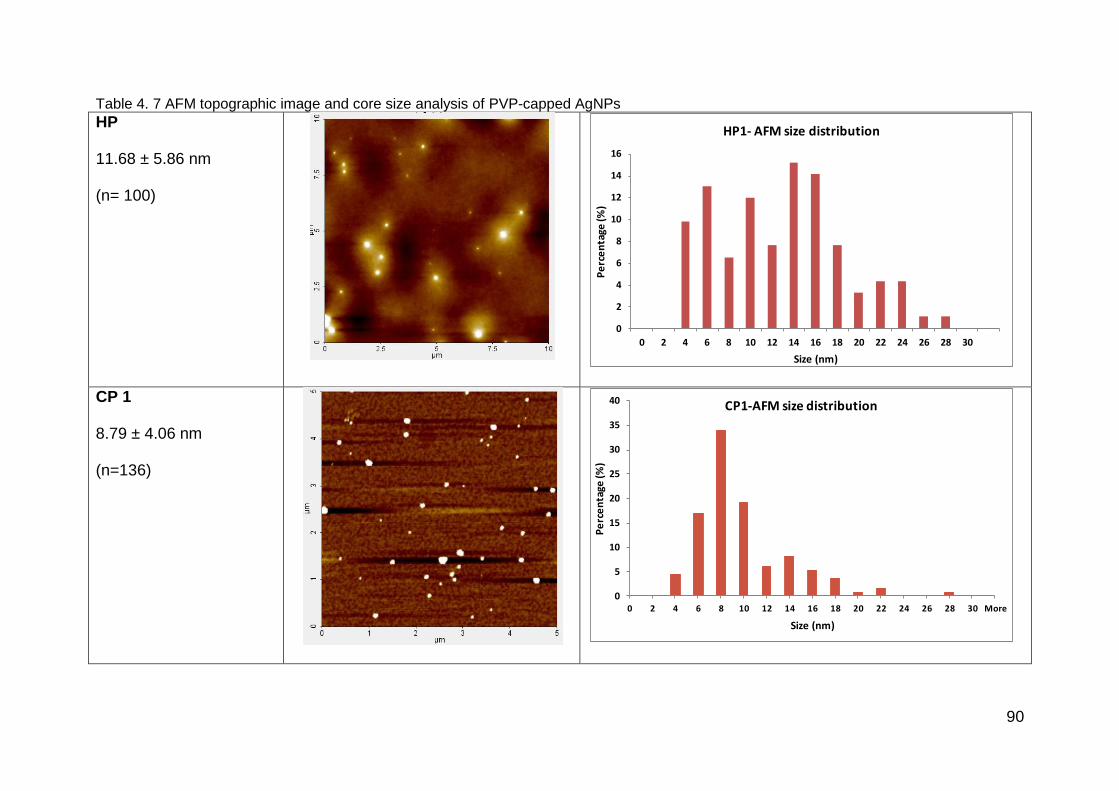
90
Table 4. 7 AFM topographic image and core size analysis of PVP-capped AgNPs
HP
11.68 ± 5.86 nm
(n= 100)
CP 1
8.79 ± 4.06 nm
(n=136)
0
2
4
6
8
10
12
14
16
0 2 4 6 8 10 12 14 16 18 20 22 24 26 28 30
Pe
rce
nta
ge (%
)
Size (nm)
HP1- AFM size distribution
0
5
10
15
20
25
30
35
40
0 2 4 6 8 10 12 14 16 18 20 22 24 26 28 30 MoreP
erc
en
tage
(%)
Size (nm)
CP1-AFM size distribution
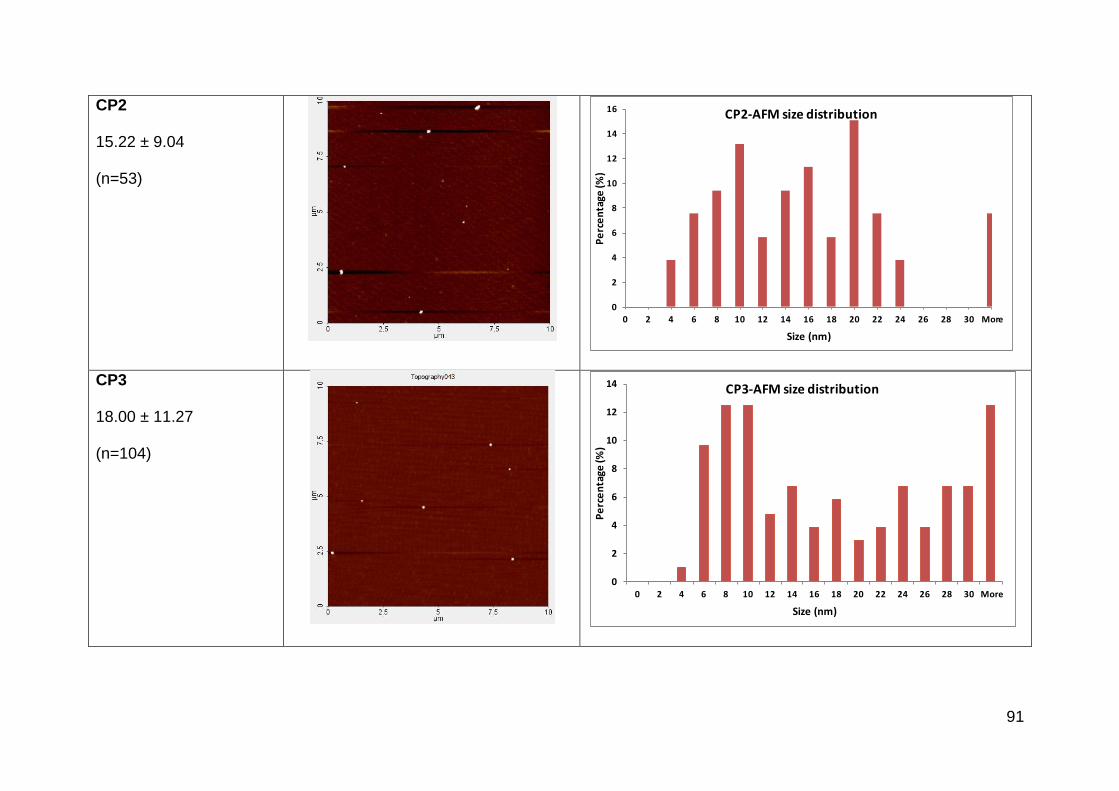
91
CP2
15.22 ± 9.04
(n=53)
CP3
18.00 ± 11.27
(n=104)
0
2
4
6
8
10
12
14
16
0 2 4 6 8 10 12 14 16 18 20 22 24 26 28 30 More
Pe
rce
nta
ge (%
)
Size (nm)
CP2-AFM size distribution
0
2
4
6
8
10
12
14
0 2 4 6 8 10 12 14 16 18 20 22 24 26 28 30 MoreP
erc
en
tage
(%)
Size (nm)
CP3-AFM size distribution
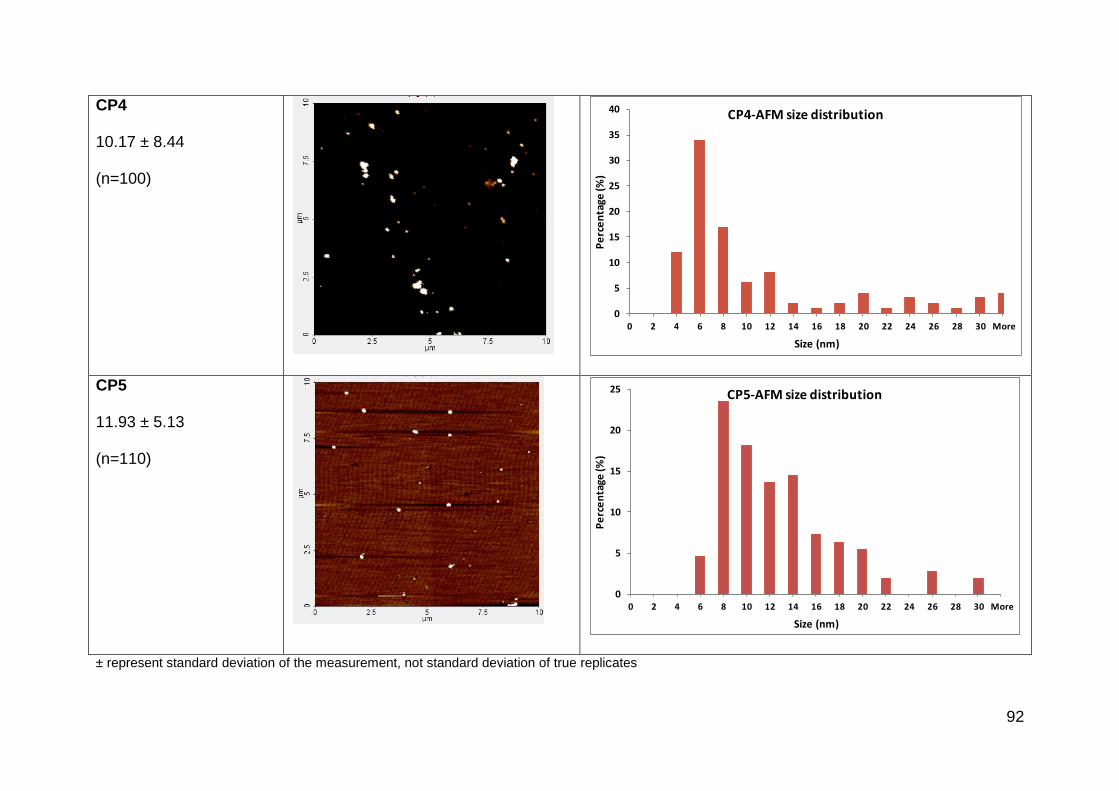
92
CP4
10.17 ± 8.44
(n=100)
CP5
11.93 ± 5.13
(n=110)
± represent standard deviation of the measurement, not standard deviation of true replicates
0
5
10
15
20
25
30
35
40
0 2 4 6 8 10 12 14 16 18 20 22 24 26 28 30 More
Pe
rce
nta
ge (%
)
Size (nm)
CP4-AFM size distribution
0
5
10
15
20
25
0 2 4 6 8 10 12 14 16 18 20 22 24 26 28 30 MoreP
erc
en
tage
(%)
Size (nm)
CP5-AFM size distribution
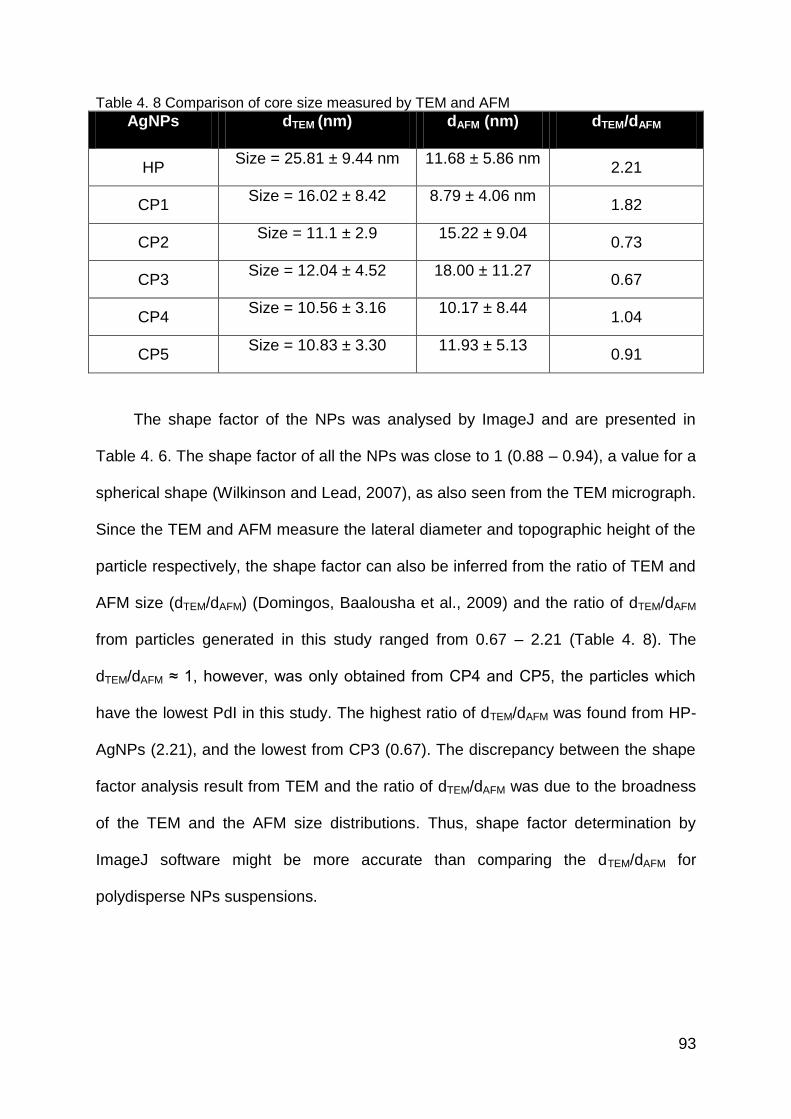
93
Table 4. 8 Comparison of core size measured by TEM and AFM
AgNPs dTEM (nm) dAFM (nm) dTEM/dAFM
HP Size = 25.81 ± 9.44 nm 11.68 ± 5.86 nm
2.21
CP1 Size = 16.02 ± 8.42 8.79 ± 4.06 nm
1.82
CP2 Size = 11.1 ± 2.9 15.22 ± 9.04
0.73
CP3 Size = 12.04 ± 4.52 18.00 ± 11.27
0.67
CP4 Size = 10.56 ± 3.16 10.17 ± 8.44
1.04
CP5 Size = 10.83 ± 3.30 11.93 ± 5.13
0.91
The shape factor of the NPs was analysed by ImageJ and are presented in
Table 4. 6. The shape factor of all the NPs was close to 1 (0.88 – 0.94), a value for a
spherical shape (Wilkinson and Lead, 2007), as also seen from the TEM micrograph.
Since the TEM and AFM measure the lateral diameter and topographic height of the
particle respectively, the shape factor can also be inferred from the ratio of TEM and
AFM size (dTEM/dAFM) (Domingos, Baalousha et al., 2009) and the ratio of dTEM/dAFM
from particles generated in this study ranged from 0.67 – 2.21 (Table 4. 8). The
dTEM/dAFM ≈ 1, however, was only obtained from CP4 and CP5, the particles which
have the lowest PdI in this study. The highest ratio of dTEM/dAFM was found from HP-
AgNPs (2.21), and the lowest from CP3 (0.67). The discrepancy between the shape
factor analysis result from TEM and the ratio of dTEM/dAFM was due to the broadness
of the TEM and the AFM size distributions. Thus, shape factor determination by
ImageJ software might be more accurate than comparing the dTEM/dAFM for
polydisperse NPs suspensions.
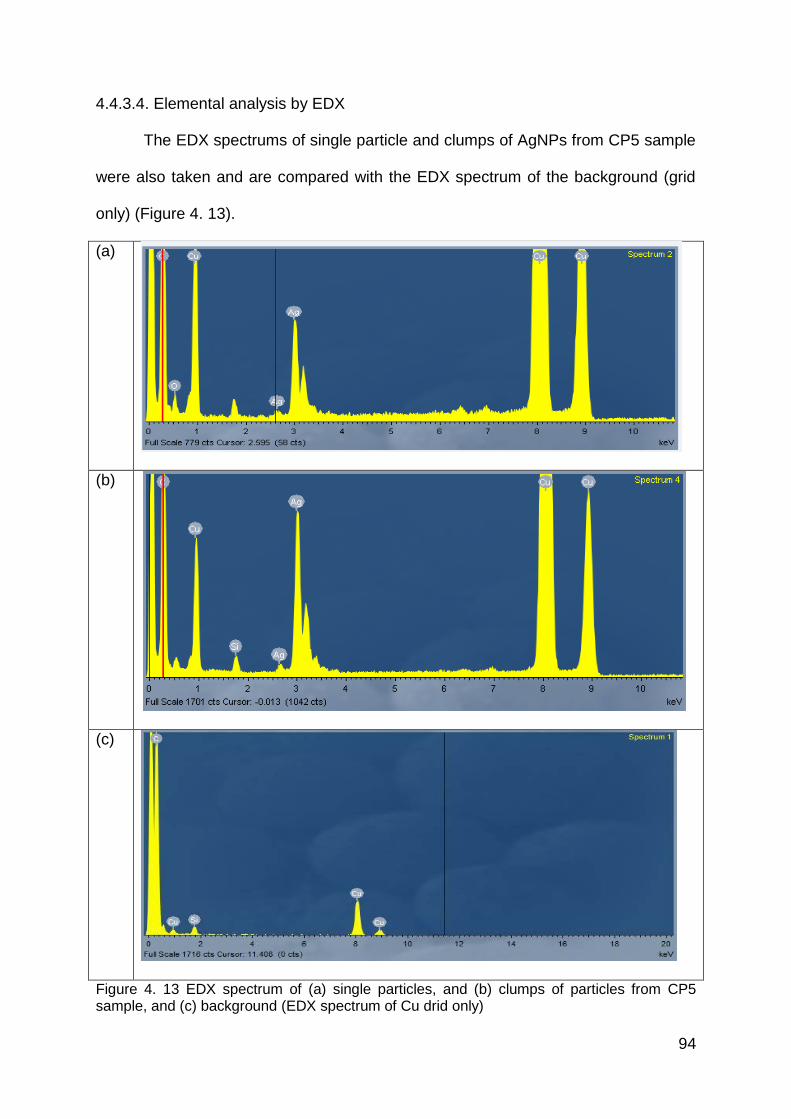
94
4.4.3.4. Elemental analysis by EDX
The EDX spectrums of single particle and clumps of AgNPs from CP5 sample
were also taken and are compared with the EDX spectrum of the background (grid
only) (Figure 4. 13).
(a)
(b)
(c)
Figure 4. 13 EDX spectrum of (a) single particles, and (b) clumps of particles from CP5 sample, and (c) background (EDX spectrum of Cu drid only)
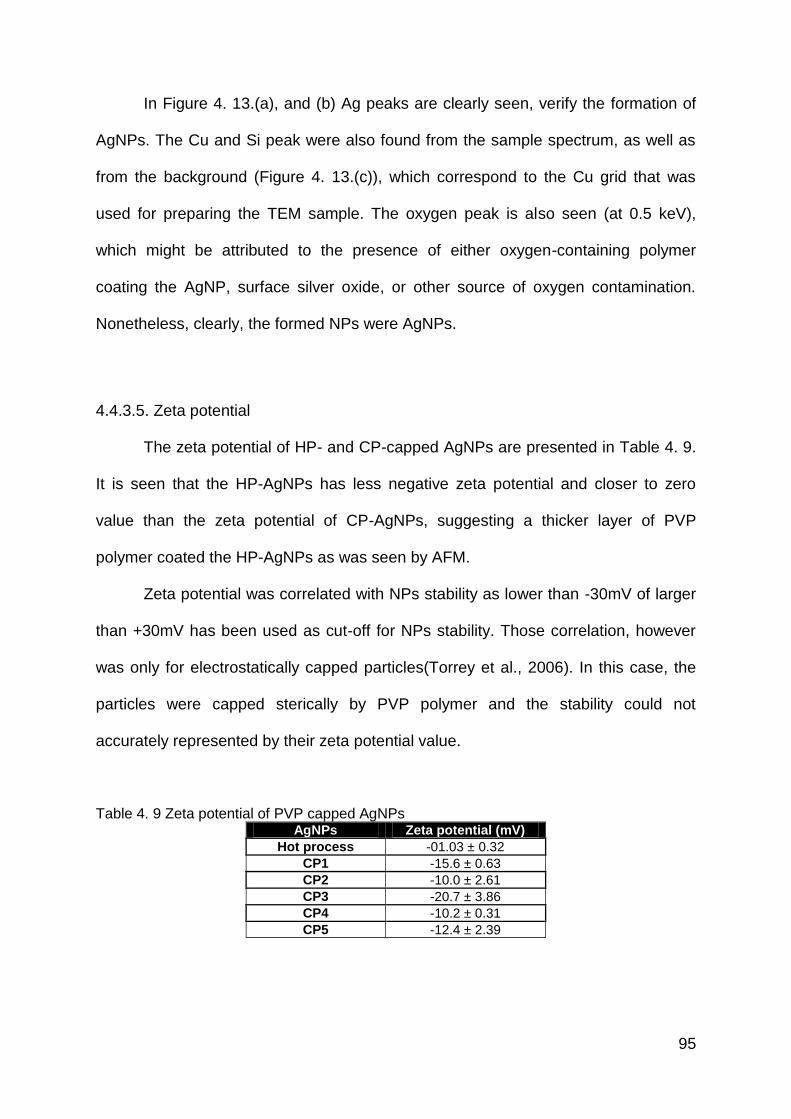
95
In Figure 4. 13.(a), and (b) Ag peaks are clearly seen, verify the formation of
AgNPs. The Cu and Si peak were also found from the sample spectrum, as well as
from the background (Figure 4. 13.(c)), which correspond to the Cu grid that was
used for preparing the TEM sample. The oxygen peak is also seen (at 0.5 keV),
which might be attributed to the presence of either oxygen-containing polymer
coating the AgNP, surface silver oxide, or other source of oxygen contamination.
Nonetheless, clearly, the formed NPs were AgNPs.
4.4.3.5. Zeta potential
The zeta potential of HP- and CP-capped AgNPs are presented in Table 4. 9.
It is seen that the HP-AgNPs has less negative zeta potential and closer to zero
value than the zeta potential of CP-AgNPs, suggesting a thicker layer of PVP
polymer coated the HP-AgNPs as was seen by AFM.
Zeta potential was correlated with NPs stability as lower than -30mV of larger
than +30mV has been used as cut-off for NPs stability. Those correlation, however
was only for electrostatically capped particles(Torrey et al., 2006). In this case, the
particles were capped sterically by PVP polymer and the stability could not
accurately represented by their zeta potential value.
Table 4. 9 Zeta potential of PVP capped AgNPs AgNPs Zeta potential (mV)
Hot process -01.03 ± 0.32
CP1 -15.6 ± 0.63
CP2 -10.0 ± 2.61
CP3 -20.7 ± 3.86
CP4 -10.2 ± 0.31
CP5 -12.4 ± 2.39
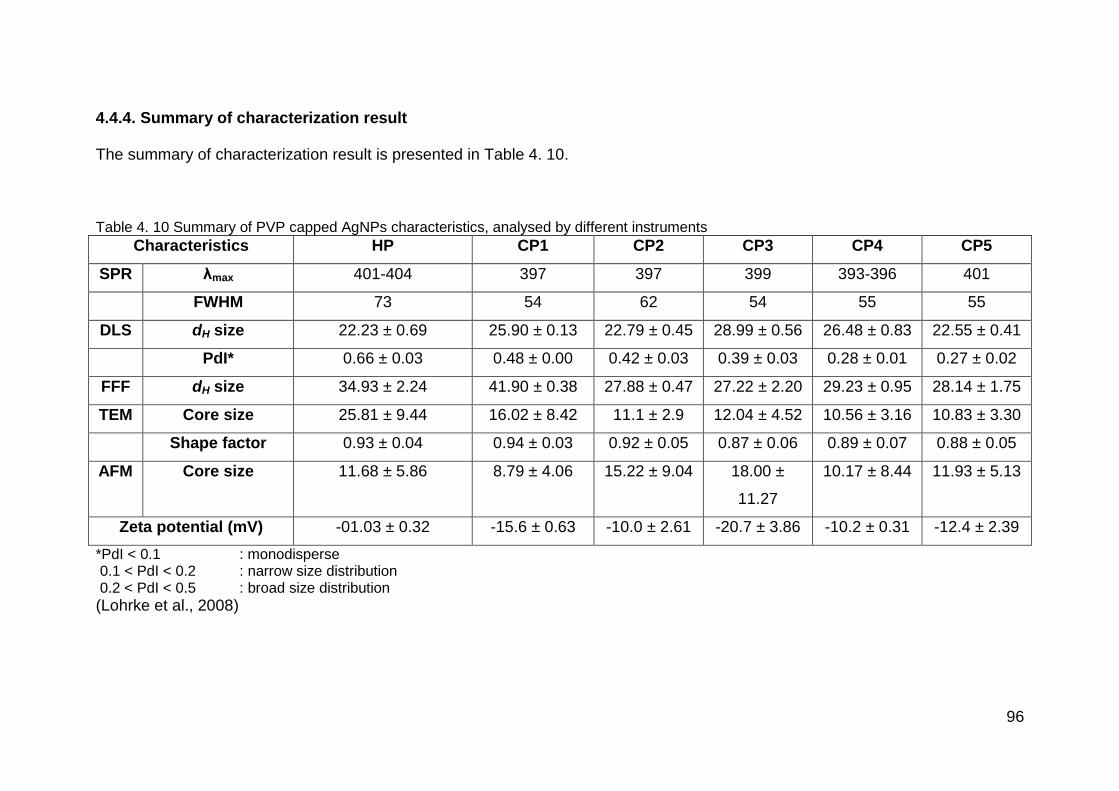
96
4.4.4. Summary of characterization result
The summary of characterization result is presented in Table 4. 10.
Table 4. 10 Summary of PVP capped AgNPs characteristics, analysed by different instruments
Characteristics HP CP1 CP2 CP3 CP4 CP5
SPR λmax 401-404 397 397 399 393-396 401
FWHM 73 54 62 54 55 55
DLS dH size 22.23 ± 0.69 25.90 ± 0.13 22.79 ± 0.45 28.99 ± 0.56 26.48 ± 0.83 22.55 ± 0.41
PdI* 0.66 ± 0.03 0.48 ± 0.00 0.42 ± 0.03 0.39 ± 0.03 0.28 ± 0.01 0.27 ± 0.02
FFF dH size 34.93 ± 2.24 41.90 ± 0.38 27.88 ± 0.47 27.22 ± 2.20 29.23 ± 0.95 28.14 ± 1.75
TEM Core size 25.81 ± 9.44 16.02 ± 8.42 11.1 ± 2.9 12.04 ± 4.52 10.56 ± 3.16 10.83 ± 3.30
Shape factor 0.93 ± 0.04 0.94 ± 0.03 0.92 ± 0.05 0.87 ± 0.06 0.89 ± 0.07 0.88 ± 0.05
AFM Core size 11.68 ± 5.86 8.79 ± 4.06 15.22 ± 9.04 18.00 ±
11.27
10.17 ± 8.44 11.93 ± 5.13
Zeta potential (mV) -01.03 ± 0.32 -15.6 ± 0.63 -10.0 ± 2.61 -20.7 ± 3.86 -10.2 ± 0.31 -12.4 ± 2.39
*PdI < 0.1 : monodisperse 0.1 < PdI < 0.2 : narrow size distribution 0.2 < PdI < 0.5 : broad size distribution
(Lohrke et al., 2008)
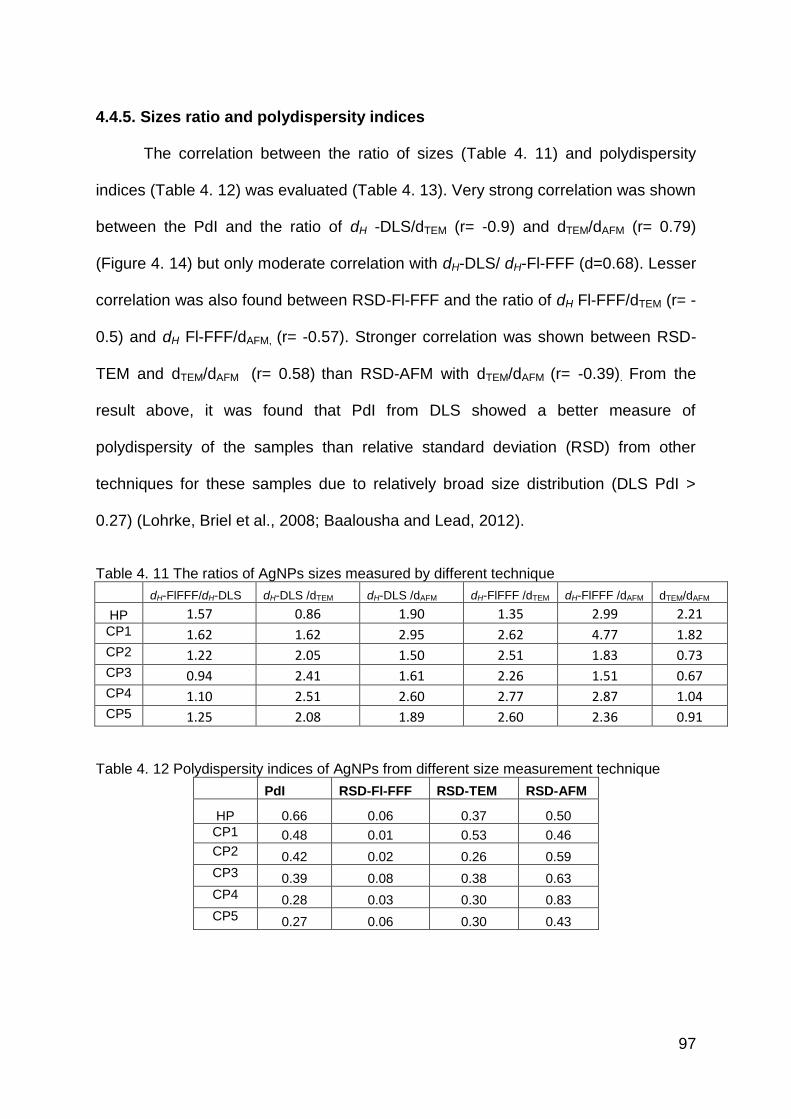
97
4.4.5. Sizes ratio and polydispersity indices
The correlation between the ratio of sizes (Table 4. 11) and polydispersity
indices (Table 4. 12) was evaluated (Table 4. 13). Very strong correlation was shown
between the PdI and the ratio of dH -DLS/dTEM (r= -0.9) and dTEM/dAFM (r= 0.79)
(Figure 4. 14) but only moderate correlation with dH-DLS/ dH-Fl-FFF (d=0.68). Lesser
correlation was also found between RSD-Fl-FFF and the ratio of dH Fl-FFF/dTEM (r= -
0.5) and dH Fl-FFF/dAFM, (r= -0.57). Stronger correlation was shown between RSD-
TEM and dTEM/dAFM (r= 0.58) than RSD-AFM with dTEM/dAFM (r= -0.39). From the
result above, it was found that PdI from DLS showed a better measure of
polydispersity of the samples than relative standard deviation (RSD) from other
techniques for these samples due to relatively broad size distribution (DLS PdI >
0.27) (Lohrke, Briel et al., 2008; Baalousha and Lead, 2012).
Table 4. 11 The ratios of AgNPs sizes measured by different technique
dH-FlFFF/dH-DLS dH-DLS /dTEM dH-DLS /dAFM dH-FlFFF /dTEM dH-FlFFF /dAFM dTEM/dAFM
HP 1.57 0.86 1.90 1.35 2.99 2.21 CP1 1.62 1.62 2.95 2.62 4.77 1.82 CP2 1.22 2.05 1.50 2.51 1.83 0.73 CP3 0.94 2.41 1.61 2.26 1.51 0.67 CP4 1.10 2.51 2.60 2.77 2.87 1.04 CP5 1.25 2.08 1.89 2.60 2.36 0.91
Table 4. 12 Polydispersity indices of AgNPs from different size measurement technique
PdI RSD-Fl-FFF RSD-TEM RSD-AFM
HP 0.66 0.06 0.37 0.50
CP1 0.48 0.01 0.53 0.46
CP2 0.42 0.02 0.26 0.59
CP3 0.39 0.08 0.38 0.63
CP4 0.28 0.03 0.30 0.83
CP5 0.27 0.06 0.30 0.43
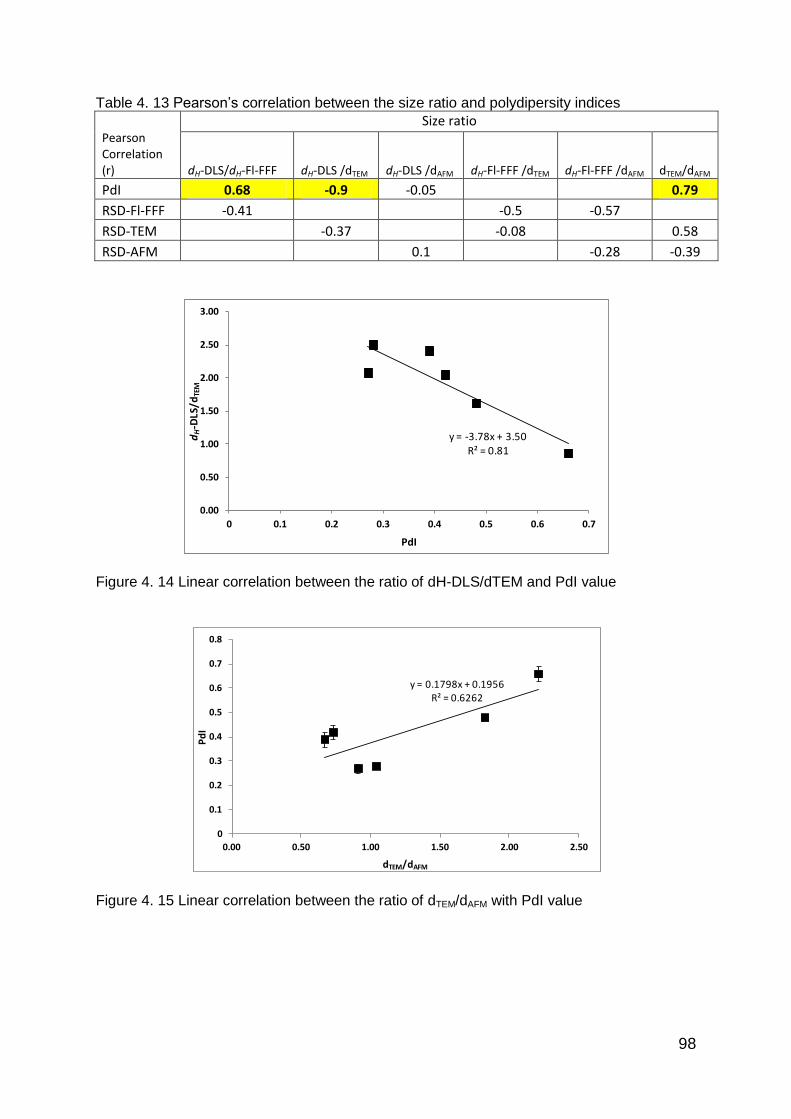
98
Table 4. 13 Pearson‘s correlation between the size ratio and polydipersity indices
Pearson Correlation (r)
Size ratio
dH-DLS/dH-Fl-FFF dH-DLS /dTEM dH-DLS /dAFM dH-Fl-FFF /dTEM dH-Fl-FFF /dAFM dTEM/dAFM
PdI 0.68 -0.9 -0.05
0.79
RSD-Fl-FFF -0.41
-0.5 -0.57 RSD-TEM -0.37
-0.08
0.58
RSD-AFM
0.1
-0.28 -0.39
Figure 4. 14 Linear correlation between the ratio of dH-DLS/dTEM and PdI value
Figure 4. 15 Linear correlation between the ratio of dTEM/dAFM with PdI value
y = -3.78x + 3.50R² = 0.81
0.00
0.50
1.00
1.50
2.00
2.50
3.00
0 0.1 0.2 0.3 0.4 0.5 0.6 0.7
dH
-DLS
/dTE
M
PdI
y = 0.1798x + 0.1956R² = 0.6262
0
0.1
0.2
0.3
0.4
0.5
0.6
0.7
0.8
0.00 0.50 1.00 1.50 2.00 2.50
Pd
I
dTEM/dAFM
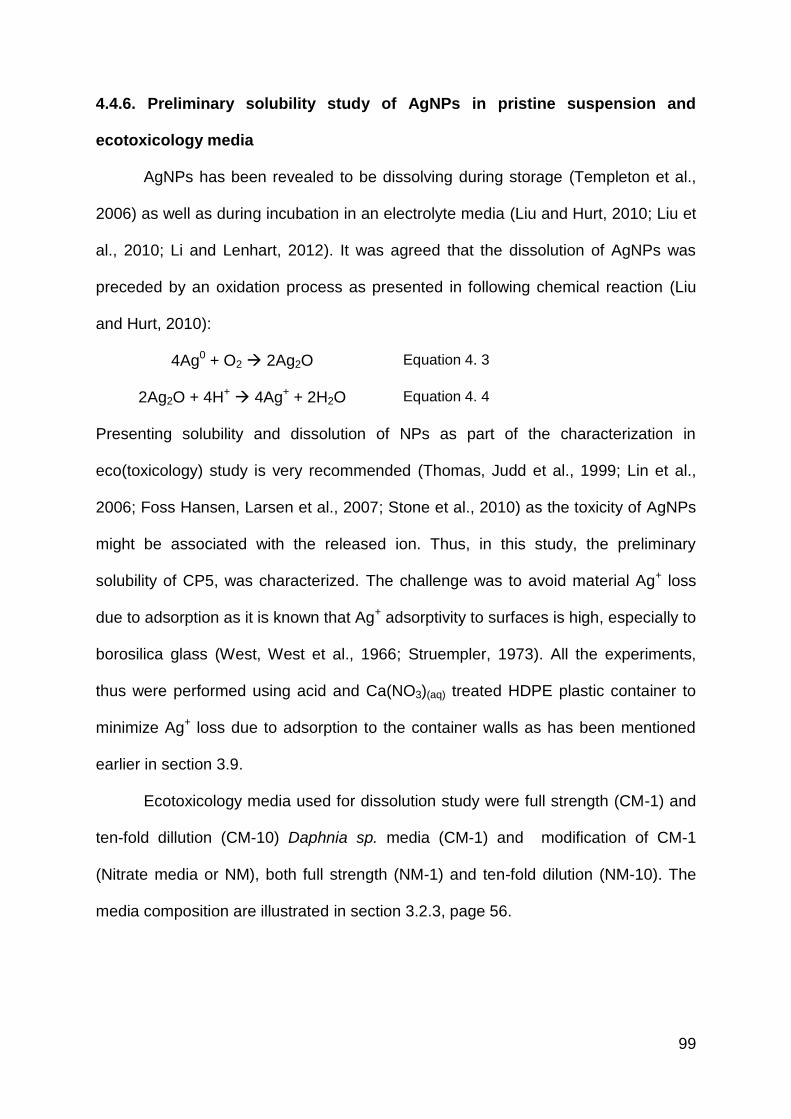
99
4.4.6. Preliminary solubility study of AgNPs in pristine suspension and
ecotoxicology media
AgNPs has been revealed to be dissolving during storage (Templeton et al.,
2006) as well as during incubation in an electrolyte media (Liu and Hurt, 2010; Liu et
al., 2010; Li and Lenhart, 2012). It was agreed that the dissolution of AgNPs was
preceded by an oxidation process as presented in following chemical reaction (Liu
and Hurt, 2010):
4Ag0 + O2 2Ag2O Equation 4. 3
2Ag2O + 4H+ 4Ag+ + 2H2O Equation 4. 4
Presenting solubility and dissolution of NPs as part of the characterization in
eco(toxicology) study is very recommended (Thomas, Judd et al., 1999; Lin et al.,
2006; Foss Hansen, Larsen et al., 2007; Stone et al., 2010) as the toxicity of AgNPs
might be associated with the released ion. Thus, in this study, the preliminary
solubility of CP5, was characterized. The challenge was to avoid material Ag+ loss
due to adsorption as it is known that Ag+ adsorptivity to surfaces is high, especially to
borosilica glass (West, West et al., 1966; Struempler, 1973). All the experiments,
thus were performed using acid and Ca(NO3)(aq) treated HDPE plastic container to
minimize Ag+ loss due to adsorption to the container walls as has been mentioned
earlier in section 3.9.
Ecotoxicology media used for dissolution study were full strength (CM-1) and
ten-fold dillution (CM-10) Daphnia sp. media (CM-1) and modification of CM-1
(Nitrate media or NM), both full strength (NM-1) and ten-fold dilution (NM-10). The
media composition are illustrated in section 3.2.3, page 56.
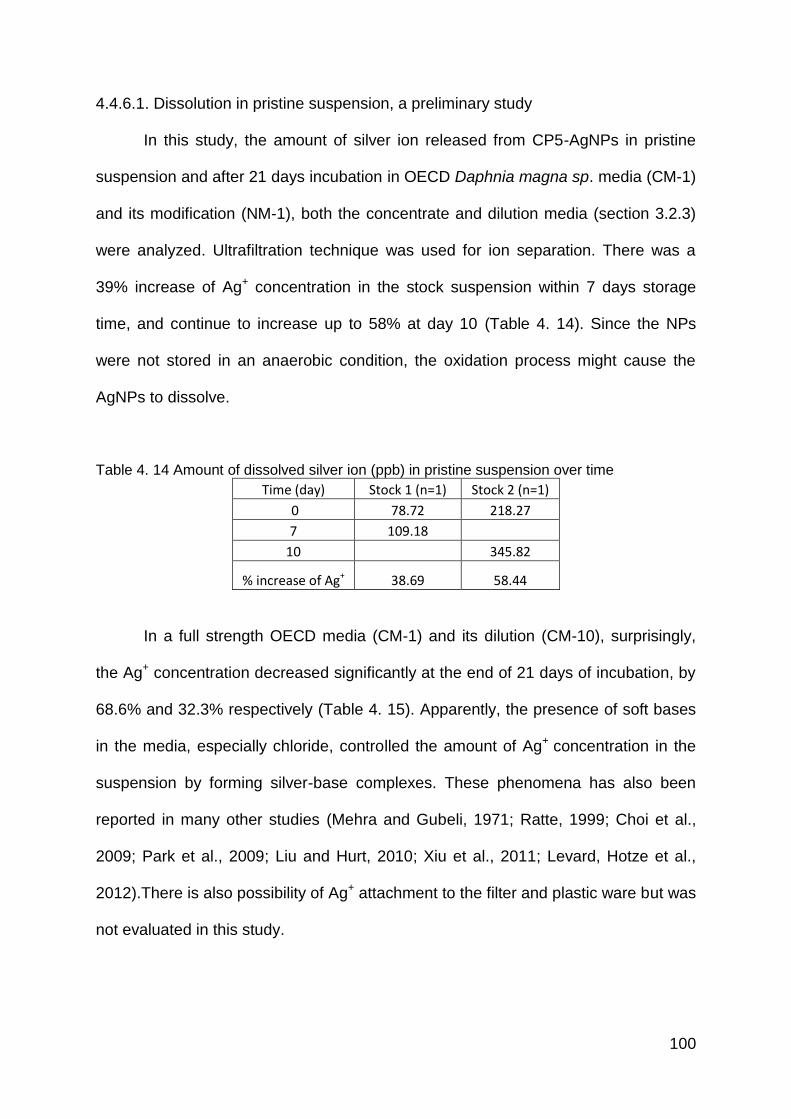
100
4.4.6.1. Dissolution in pristine suspension, a preliminary study
In this study, the amount of silver ion released from CP5-AgNPs in pristine
suspension and after 21 days incubation in OECD Daphnia magna sp. media (CM-1)
and its modification (NM-1), both the concentrate and dilution media (section 3.2.3)
were analyzed. Ultrafiltration technique was used for ion separation. There was a
39% increase of Ag+ concentration in the stock suspension within 7 days storage
time, and continue to increase up to 58% at day 10 (Table 4. 14). Since the NPs
were not stored in an anaerobic condition, the oxidation process might cause the
AgNPs to dissolve.
Table 4. 14 Amount of dissolved silver ion (ppb) in pristine suspension over time
Time (day) Stock 1 (n=1) Stock 2 (n=1)
0 78.72 218.27
7 109.18
10 345.82
% increase of Ag+ 38.69 58.44
In a full strength OECD media (CM-1) and its dilution (CM-10), surprisingly,
the Ag+ concentration decreased significantly at the end of 21 days of incubation, by
68.6% and 32.3% respectively (Table 4. 15). Apparently, the presence of soft bases
in the media, especially chloride, controlled the amount of Ag+ concentration in the
suspension by forming silver-base complexes. These phenomena has also been
reported in many other studies (Mehra and Gubeli, 1971; Ratte, 1999; Choi et al.,
2009; Park et al., 2009; Liu and Hurt, 2010; Xiu et al., 2011; Levard, Hotze et al.,
2012).There is also possibility of Ag+ attachment to the filter and plastic ware but was
not evaluated in this study.
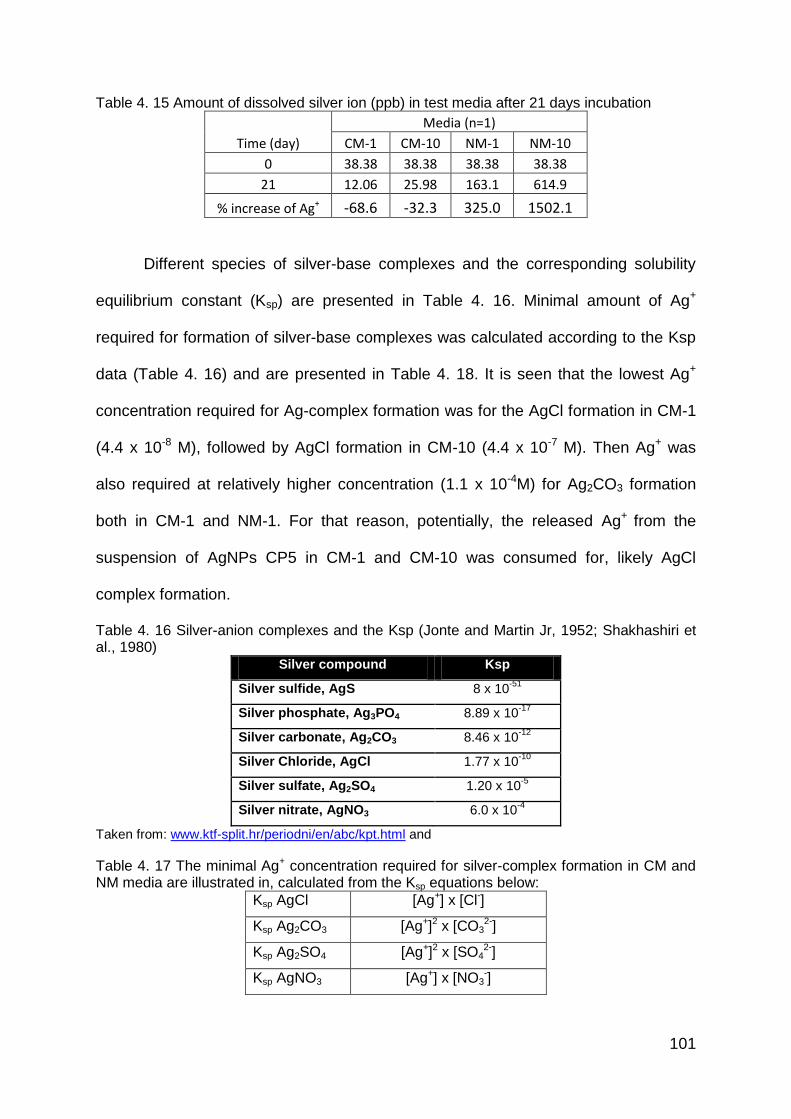
101
Table 4. 15 Amount of dissolved silver ion (ppb) in test media after 21 days incubation
Time (day)
Media (n=1)
CM-1 CM-10 NM-1 NM-10
0 38.38 38.38 38.38 38.38
21 12.06 25.98 163.1 614.9
% increase of Ag+ -68.6 -32.3 325.0 1502.1
Different species of silver-base complexes and the corresponding solubility
equilibrium constant (Ksp) are presented in Table 4. 16. Minimal amount of Ag+
required for formation of silver-base complexes was calculated according to the Ksp
data (Table 4. 16) and are presented in Table 4. 18. It is seen that the lowest Ag+
concentration required for Ag-complex formation was for the AgCl formation in CM-1
(4.4 x 10⁻⁸ M), followed by AgCl formation in CM-10 (4.4 x 10⁻⁷ M). Then Ag+ was
also required at relatively higher concentration (1.1 x 10⁻⁴M) for Ag2CO3 formation
both in CM-1 and NM-1. For that reason, potentially, the released Ag+ from the
suspension of AgNPs CP5 in CM-1 and CM-10 was consumed for, likely AgCl
complex formation.
Table 4. 16 Silver-anion complexes and the Ksp (Jonte and Martin Jr, 1952; Shakhashiri et al., 1980)
Silver compound Ksp
Silver sulfide, AgS 8 x 10-51
Silver phosphate, Ag3PO4 8.89 x 10⁻¹⁷
Silver carbonate, Ag2CO3 8.46 x 10⁻¹²
Silver Chloride, AgCl 1.77 x 10⁻¹⁰
Silver sulfate, Ag2SO4 1.20 x 10⁻⁵
Silver nitrate, AgNO3 6.0 x 10⁻⁴
Taken from: www.ktf-split.hr/periodni/en/abc/kpt.html and
Table 4. 17 The minimal Ag+ concentration required for silver-complex formation in CM and NM media are illustrated in, calculated from the Ksp equations below:
Ksp AgCl [Ag+] x [Cl-]
Ksp Ag2CO3 [Ag+]2 x [CO32-]
Ksp Ag2SO4 [Ag+]2 x [SO42-]
Ksp AgNO3 [Ag+] x [NO3-]
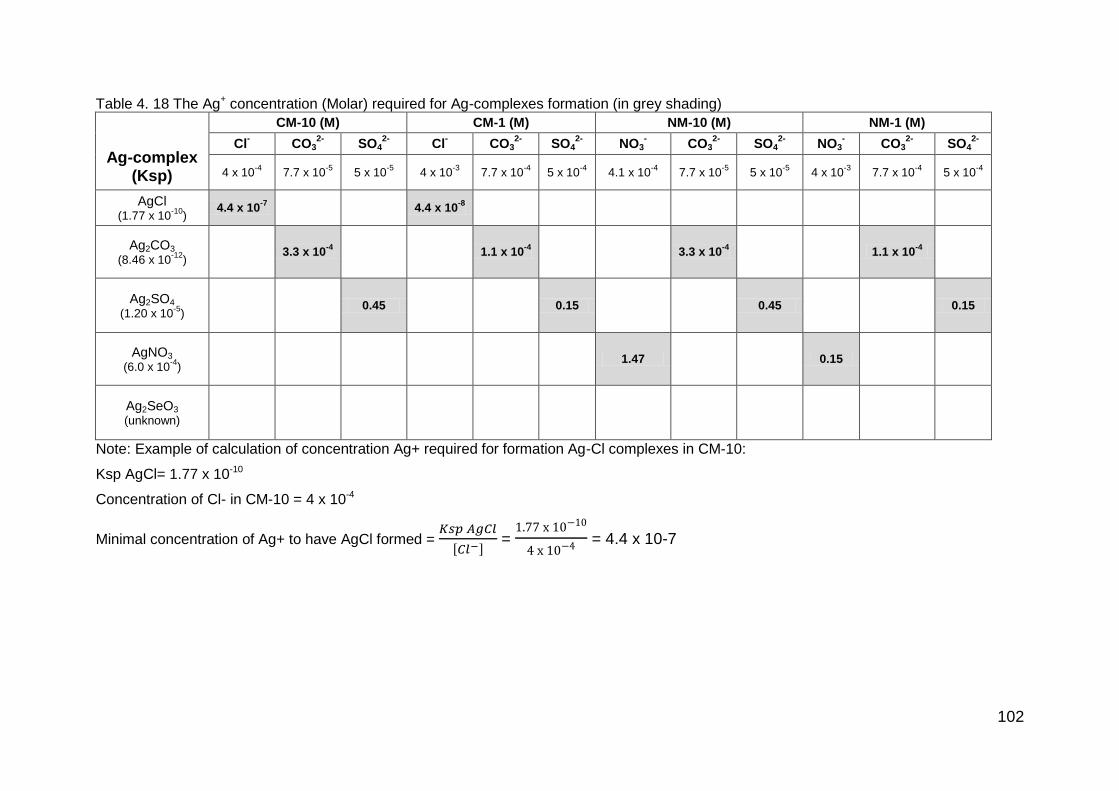
102
Table 4. 18 The Ag+ concentration (Molar) required for Ag-complexes formation (in grey shading)
Ag-complex (Ksp)
CM-10 (M) CM-1 (M) NM-10 (M) NM-1 (M)
Cl- CO3
2- SO4
2- Cl
- CO3
2- SO4
2- NO3
- CO3
2- SO4
2- NO3
- CO3
2- SO4
2-
4 x 10⁻⁴
7.7 x 10⁻⁵
5 x 10⁻⁵
4 x 10⁻³
7.7 x 10⁻⁴
5 x 10⁻⁴
4.1 x 10⁻⁴
7.7 x 10⁻⁵
5 x 10⁻⁵
4 x 10⁻³
7.7 x 10⁻⁴
5 x 10⁻⁴
AgCl (1.77 x 10
-10)
4.4 x 10⁻⁷
4.4 x 10⁻⁸
Ag2CO3
(8.46 x 10⁻¹²
) 3.3 x 10
-4
1.1 x 10
-4
3.3 x 10
-4
1.1 x 10
-4
Ag2SO4
(1.20 x 10⁻⁵
) 0.45
0.15
0.45
0.15
AgNO3
(6.0 x 10⁻⁴
) 1.47
0.15
Ag2SeO3
(unknown)
Note: Example of calculation of concentration Ag+ required for formation Ag-Cl complexes in CM-10:
Ksp AgCl= 1.77 x 10⁻¹⁰
Concentration of Cl- in CM-10 = 4 x 10⁻⁴
Minimal concentration of Ag+ to have AgCl formed =
[ ] =
= 4.4 x 10⁻⁷
103
There are different species of Ag-Cl complexes can be formed (AgClx(x-1)-).
According to Levard et al. study (2013), the concentration ratio of Cl/Ag determines
the species of Ag-Cl complexes formed in a media, and solid AgCl is expected to be
the dominant species if the ratio of Cl/Ag < 2675 (Levard et al., 2013). In this study,
the concentration ratio of Cl/Ag was about 1124 (CM-1) and 112,4 (CM-10), thus the
main form of Ag-Cl complexes was likely to be the solid AgCl.
Not only in the bulk media, the AgCl complex has been shown to be formed
on the AgNPs surface due to Cl- adsorption and the formed Ag-Cl complex inhibited
AgNPs from oxidation and dissolution (Choi, Clevenger et al., 2009). Since the
concentration of Cl- in CM-1 was 10 fold higher than in CM-10, the extent of Ag-Cl
complex formation both in the media and on the AgNPs surface was possibly more
obvious than in CM-10 and led to higher decrease of Ag+ concentration in CM-1 as
also shown by this study.
In contrast, the concentration of Ag+ released from CP5 after 21 days
incubation in the media where the chloride anion was replaced by nitrate, increased
significantly. The increase of Ag+ concentration in NM-10 (1,502.1%) was much
higher than in concentrated NM-1 (325%), showing that even in the absence of
chloride ion, other anions (such as carbonate and sulfate) significantly influence the
Ag+ concentration. In NM-1, the level of Ag+ released from CP5 was potentially
controlled by formation of Ag2CO3 and minimal Ag+ concentration required for
Ag2CO3 formation is 1.1 x 10⁻⁴ M (≈ 11,858 ppb,Table 4. 17). In this study, since the
Ag+ concentration in NM-1 was lower than NM-10 after 21 days incubation, the
formation and sedimentation of Ag2CO3 was likely to occur.
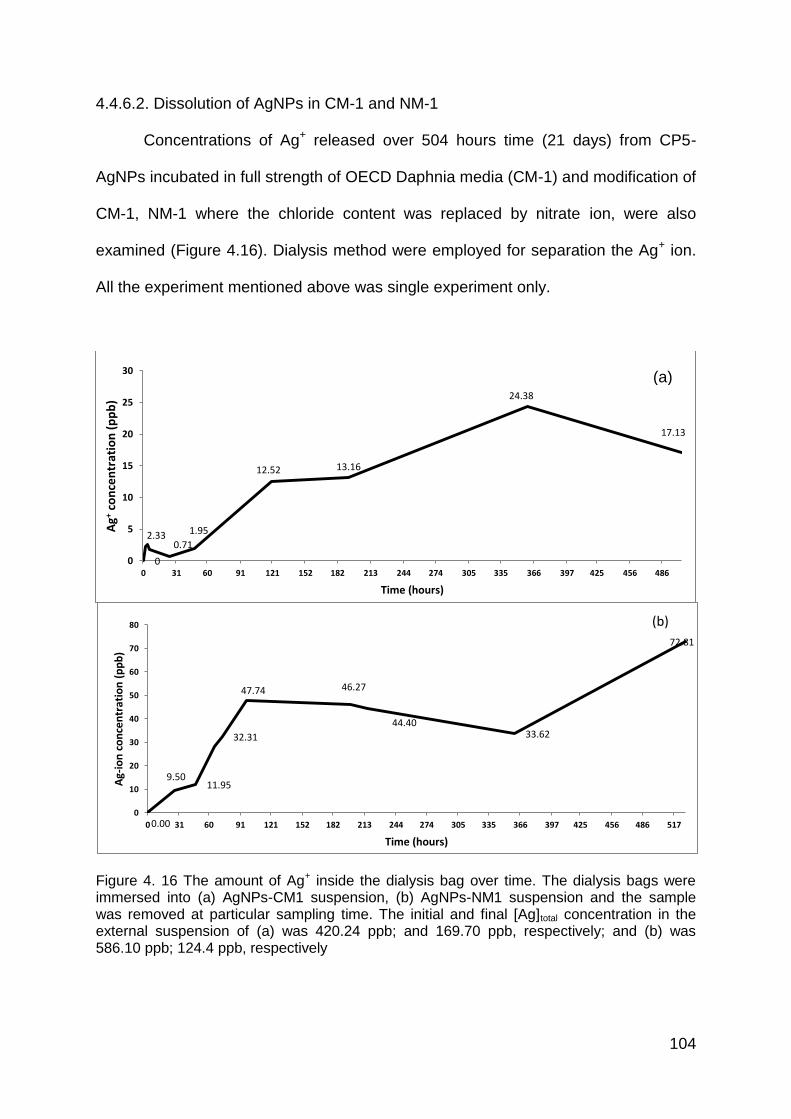
104
4.4.6.2. Dissolution of AgNPs in CM-1 and NM-1
Concentrations of Ag+ released over 504 hours time (21 days) from CP5-
AgNPs incubated in full strength of OECD Daphnia media (CM-1) and modification of
CM-1, NM-1 where the chloride content was replaced by nitrate ion, were also
examined (Figure 4.16). Dialysis method were employed for separation the Ag+ ion.
All the experiment mentioned above was single experiment only.
Figure 4. 16 The amount of Ag+ inside the dialysis bag over time. The dialysis bags were immersed into (a) AgNPs-CM1 suspension, (b) AgNPs-NM1 suspension and the sample was removed at particular sampling time. The initial and final [Ag]total concentration in the external suspension of (a) was 420.24 ppb; and 169.70 ppb, respectively; and (b) was 586.10 ppb; 124.4 ppb, respectively
0
2.33 0.71
1.95
12.52 13.16
24.38
17.13
0
5
10
15
20
25
30
0 31 60 91 121 152 182 213 244 274 305 335 366 397 425 456 486
Ag+
con
cen
trat
ion
(p
pb
)
Time (hours)
0.00
9.50 11.95
32.31
47.74 46.27
44.40 33.62
72.81
0
10
20
30
40
50
60
70
80
0 31 60 91 121 152 182 213 244 274 305 335 366 397 425 456 486 517
Ag-
ion
co
nce
ntr
atio
n (
pp
b)
Time (hours)
(b)
(a)
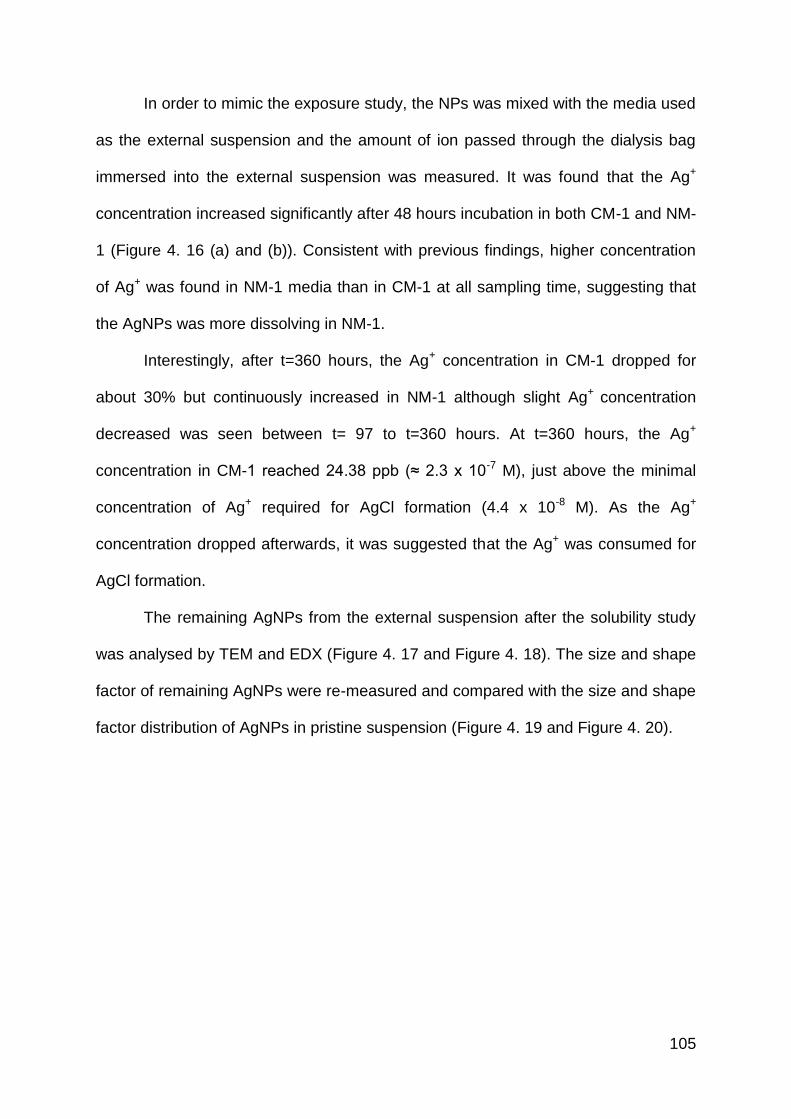
105
In order to mimic the exposure study, the NPs was mixed with the media used
as the external suspension and the amount of ion passed through the dialysis bag
immersed into the external suspension was measured. It was found that the Ag+
concentration increased significantly after 48 hours incubation in both CM-1 and NM-
1 (Figure 4. 16 (a) and (b)). Consistent with previous findings, higher concentration
of Ag+ was found in NM-1 media than in CM-1 at all sampling time, suggesting that
the AgNPs was more dissolving in NM-1.
Interestingly, after t=360 hours, the Ag+ concentration in CM-1 dropped for
about 30% but continuously increased in NM-1 although slight Ag+ concentration
decreased was seen between t= 97 to t=360 hours. At t=360 hours, the Ag+
concentration in CM-1 reached 24.38 ppb (≈ 2.3 x 10⁻⁷ M), just above the minimal
concentration of Ag+ required for AgCl formation (4.4 x 10⁻⁸ M). As the Ag+
concentration dropped afterwards, it was suggested that the Ag+ was consumed for
AgCl formation.
The remaining AgNPs from the external suspension after the solubility study
was analysed by TEM and EDX (Figure 4. 17 and Figure 4. 18). The size and shape
factor of remaining AgNPs were re-measured and compared with the size and shape
factor distribution of AgNPs in pristine suspension (Figure 4. 19 and Figure 4. 20).
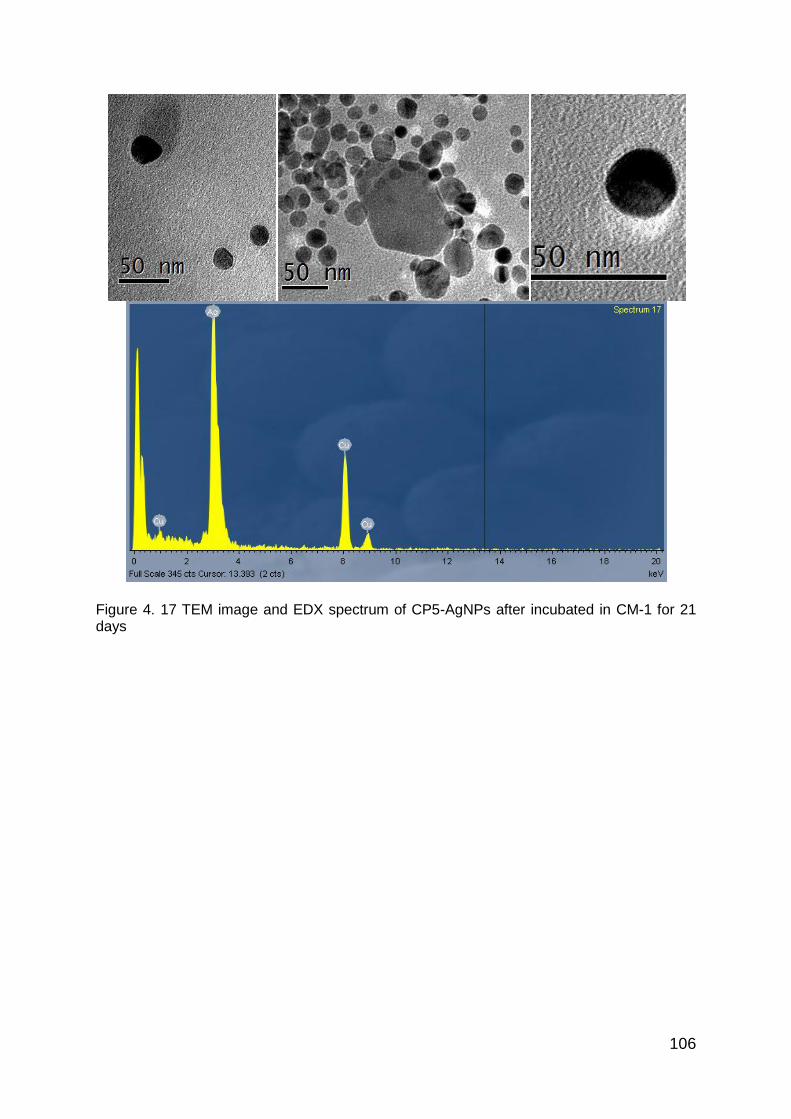
106
Figure 4. 17 TEM image and EDX spectrum of CP5-AgNPs after incubated in CM-1 for 21 days
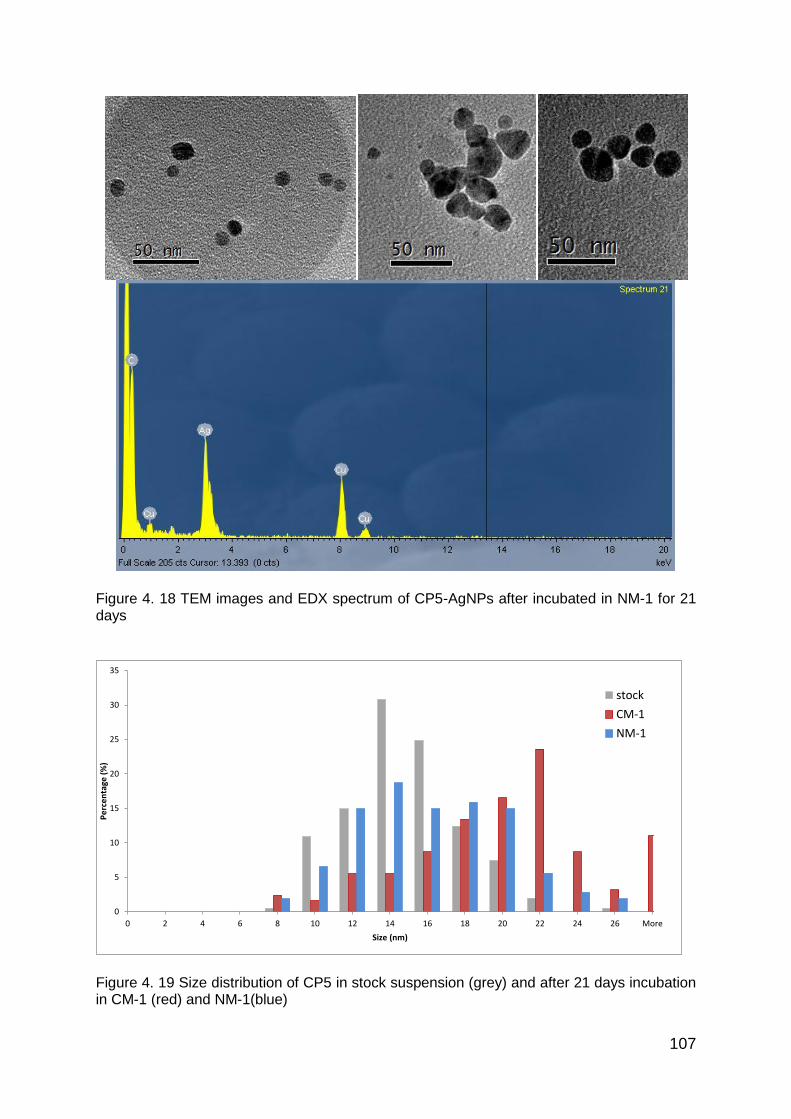
107
Figure 4. 18 TEM images and EDX spectrum of CP5-AgNPs after incubated in NM-1 for 21 days
Figure 4. 19 Size distribution of CP5 in stock suspension (grey) and after 21 days incubation in CM-1 (red) and NM-1(blue)
0
5
10
15
20
25
30
35
0 2 4 6 8 10 12 14 16 18 20 22 24 26 More
Pe
rce
nta
ge (
%)
Size (nm)
stock
CM-1
NM-1
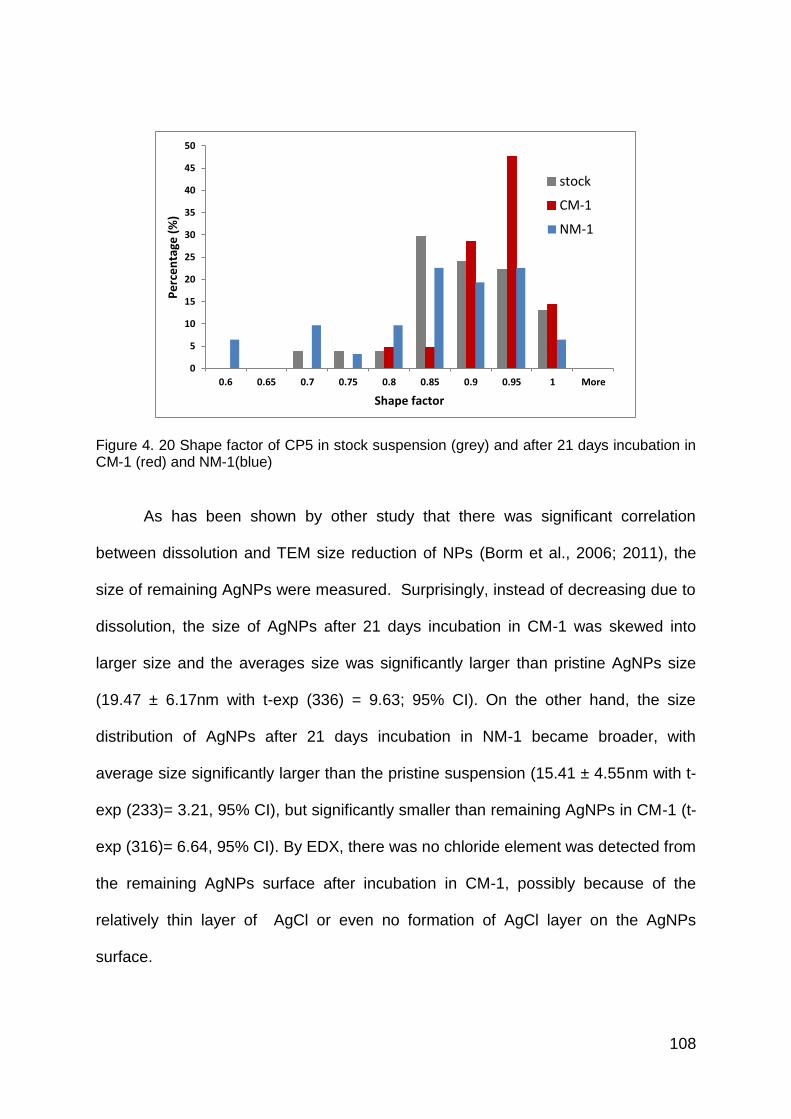
108
Figure 4. 20 Shape factor of CP5 in stock suspension (grey) and after 21 days incubation in CM-1 (red) and NM-1(blue)
As has been shown by other study that there was significant correlation
between dissolution and TEM size reduction of NPs (Borm et al., 2006; 2011), the
size of remaining AgNPs were measured. Surprisingly, instead of decreasing due to
dissolution, the size of AgNPs after 21 days incubation in CM-1 was skewed into
larger size and the averages size was significantly larger than pristine AgNPs size
(19.47 ± 6.17nm with t-exp (336) = 9.63; 95% CI). On the other hand, the size
distribution of AgNPs after 21 days incubation in NM-1 became broader, with
average size significantly larger than the pristine suspension (15.41 ± 4.55nm with t-
exp (233)= 3.21, 95% CI), but significantly smaller than remaining AgNPs in CM-1 (t-
exp (316)= 6.64, 95% CI). By EDX, there was no chloride element was detected from
the remaining AgNPs surface after incubation in CM-1, possibly because of the
relatively thin layer of AgCl or even no formation of AgCl layer on the AgNPs
surface.
0
5
10
15
20
25
30
35
40
45
50
0.6 0.65 0.7 0.75 0.8 0.85 0.9 0.95 1 More
Pe
rce
nta
ge (
%)
Shape factor
stock
CM-1
NM-1
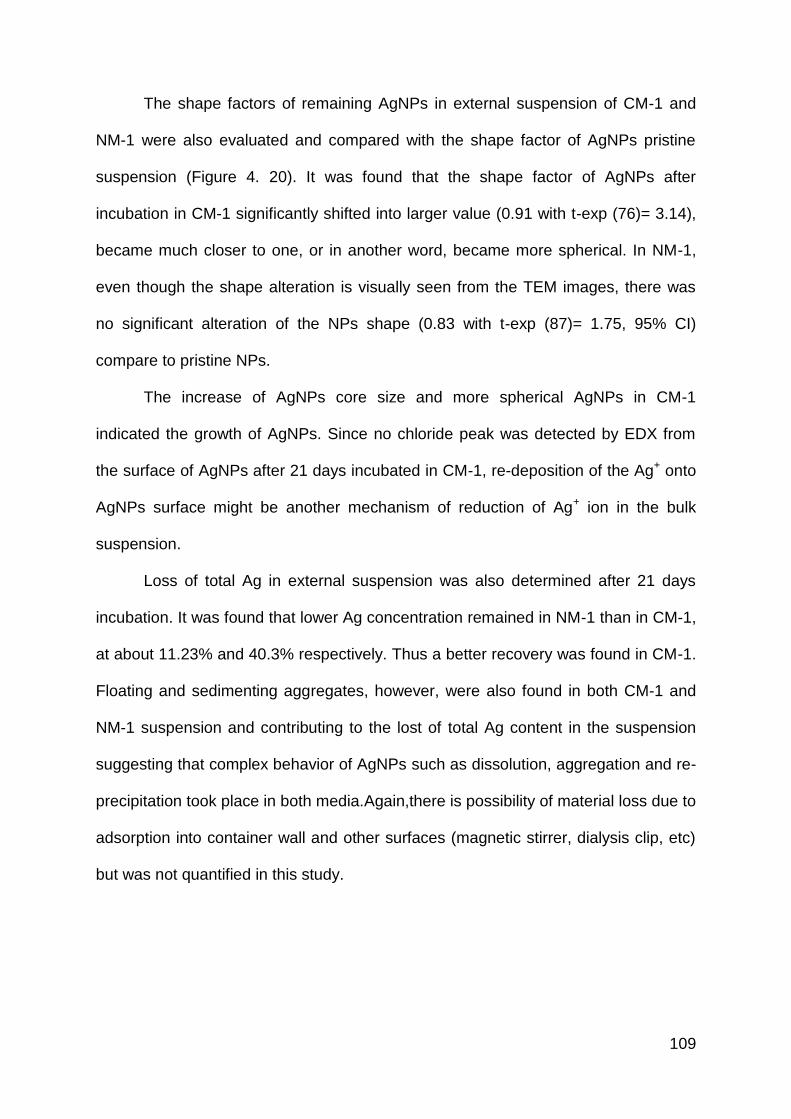
109
The shape factors of remaining AgNPs in external suspension of CM-1 and
NM-1 were also evaluated and compared with the shape factor of AgNPs pristine
suspension (Figure 4. 20). It was found that the shape factor of AgNPs after
incubation in CM-1 significantly shifted into larger value (0.91 with t-exp (76)= 3.14),
became much closer to one, or in another word, became more spherical. In NM-1,
even though the shape alteration is visually seen from the TEM images, there was
no significant alteration of the NPs shape (0.83 with t-exp (87)= 1.75, 95% CI)
compare to pristine NPs.
The increase of AgNPs core size and more spherical AgNPs in CM-1
indicated the growth of AgNPs. Since no chloride peak was detected by EDX from
the surface of AgNPs after 21 days incubated in CM-1, re-deposition of the Ag+ onto
AgNPs surface might be another mechanism of reduction of Ag+ ion in the bulk
suspension.
Loss of total Ag in external suspension was also determined after 21 days
incubation. It was found that lower Ag concentration remained in NM-1 than in CM-1,
at about 11.23% and 40.3% respectively. Thus a better recovery was found in CM-1.
Floating and sedimenting aggregates, however, were also found in both CM-1 and
NM-1 suspension and contributing to the lost of total Ag content in the suspension
suggesting that complex behavior of AgNPs such as dissolution, aggregation and re-
precipitation took place in both media.Again,there is possibility of material loss due to
adsorption into container wall and other surfaces (magnetic stirrer, dialysis clip, etc)
but was not quantified in this study.
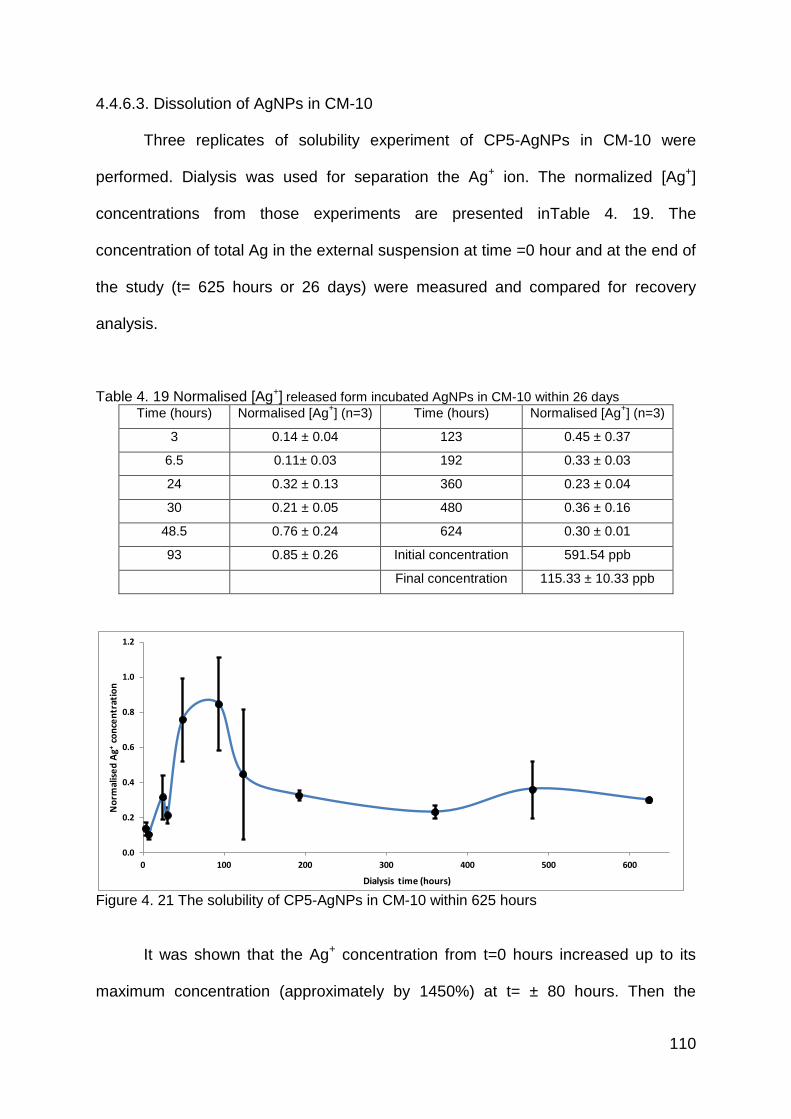
110
4.4.6.3. Dissolution of AgNPs in CM-10
Three replicates of solubility experiment of CP5-AgNPs in CM-10 were
performed. Dialysis was used for separation the Ag+ ion. The normalized [Ag+]
concentrations from those experiments are presented inTable 4. 19. The
concentration of total Ag in the external suspension at time =0 hour and at the end of
the study (t= 625 hours or 26 days) were measured and compared for recovery
analysis.
Table 4. 19 Normalised [Ag+] released form incubated AgNPs in CM-10 within 26 days Time (hours) Normalised [Ag
+] (n=3) Time (hours) Normalised [Ag
+] (n=3)
3 0.14 ± 0.04 123 0.45 ± 0.37
6.5 0.11± 0.03 192 0.33 ± 0.03
24 0.32 ± 0.13 360 0.23 ± 0.04
30 0.21 ± 0.05 480 0.36 ± 0.16
48.5 0.76 ± 0.24 624 0.30 ± 0.01
93 0.85 ± 0.26 Initial concentration 591.54 ppb
Final concentration 115.33 ± 10.33 ppb
Figure 4. 21 The solubility of CP5-AgNPs in CM-10 within 625 hours
It was shown that the Ag+ concentration from t=0 hours increased up to its
maximum concentration (approximately by 1450%) at t= ± 80 hours. Then the
0.0
0.2
0.4
0.6
0.8
1.0
1.2
0 100 200 300 400 500 600
No
rmal
ise
d A
g+co
nce
ntr
atio
n
Dialysis time (hours)
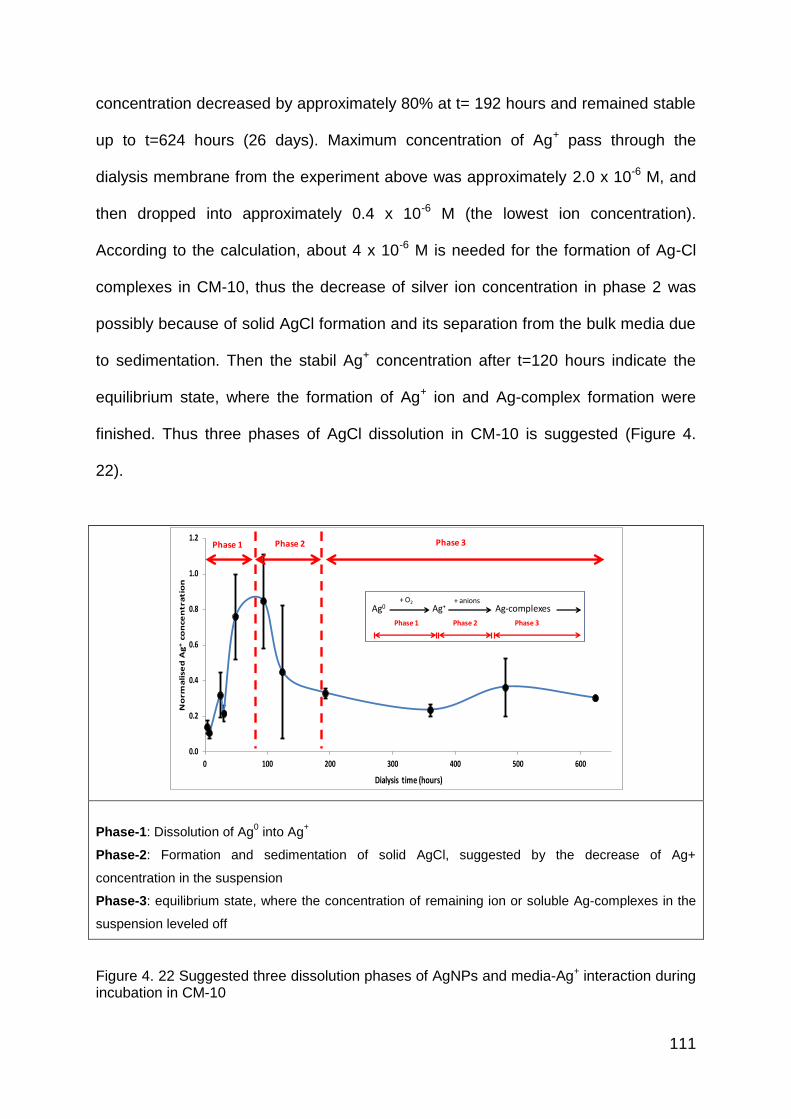
111
concentration decreased by approximately 80% at t= 192 hours and remained stable
up to t=624 hours (26 days). Maximum concentration of Ag+ pass through the
dialysis membrane from the experiment above was approximately 2.0 x 10⁻⁶ M, and
then dropped into approximately 0.4 x 10⁻⁶ M (the lowest ion concentration).
According to the calculation, about 4 x 10⁻⁶ M is needed for the formation of Ag-Cl
complexes in CM-10, thus the decrease of silver ion concentration in phase 2 was
possibly because of solid AgCl formation and its separation from the bulk media due
to sedimentation. Then the stabil Ag+ concentration after t=120 hours indicate the
equilibrium state, where the formation of Ag+ ion and Ag-complex formation were
finished. Thus three phases of AgCl dissolution in CM-10 is suggested (Figure 4.
22).
Phase-1: Dissolution of Ag0 into Ag
+
Phase-2: Formation and sedimentation of solid AgCl, suggested by the decrease of Ag+
concentration in the suspension
Phase-3: equilibrium state, where the concentration of remaining ion or soluble Ag-complexes in the
suspension leveled off
Figure 4. 22 Suggested three dissolution phases of AgNPs and media-Ag+ interaction during incubation in CM-10
0.0
0.2
0.4
0.6
0.8
1.0
1.2
0 100 200 300 400 500 600
No
rm
ali
se
d A
g+
co
nce
ntra
tio
n
Dialysis time (hours)
Phase 1 Phase 2 Phase 3
Ag0 Ag+ Ag-complexes+ O2 + anions
Phase 1 Phase 2 Phase 3
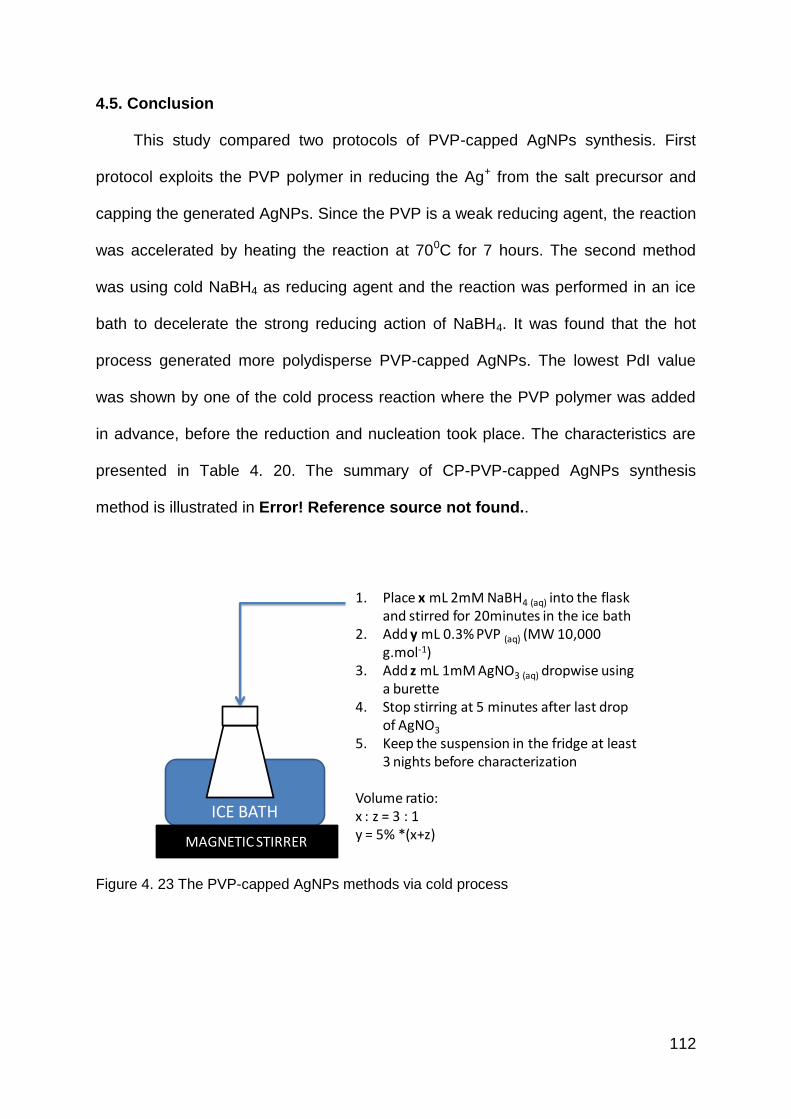
112
4.5. Conclusion
This study compared two protocols of PVP-capped AgNPs synthesis. First
protocol exploits the PVP polymer in reducing the Ag+ from the salt precursor and
capping the generated AgNPs. Since the PVP is a weak reducing agent, the reaction
was accelerated by heating the reaction at 700C for 7 hours. The second method
was using cold NaBH4 as reducing agent and the reaction was performed in an ice
bath to decelerate the strong reducing action of NaBH4. It was found that the hot
process generated more polydisperse PVP-capped AgNPs. The lowest PdI value
was shown by one of the cold process reaction where the PVP polymer was added
in advance, before the reduction and nucleation took place. The characteristics are
presented in Table 4. 20. The summary of CP-PVP-capped AgNPs synthesis
method is illustrated in Error! Reference source not found..
Figure 4. 23 The PVP-capped AgNPs methods via cold process
SYNTHESIS OF PVP CAPPED AgNPs(COLD PROCESS)
ICE BATH
MAGNETIC STIRRER
1. Place x mL 2mM NaBH4 (aq) into the flask and stirred for 20minutes in the ice bath
2. Add y mL 0.3% PVP (aq) (MW 10,000 g.mol-1)
3. Add z mL 1mM AgNO3 (aq) dropwise using a burette
4. Stop stirring at 5 minutes after last drop of AgNO3
5. Keep the suspension in the fridge at least 3 nights before characterization
Volume ratio:x : z = 3 : 1y = 5% *(x+z)
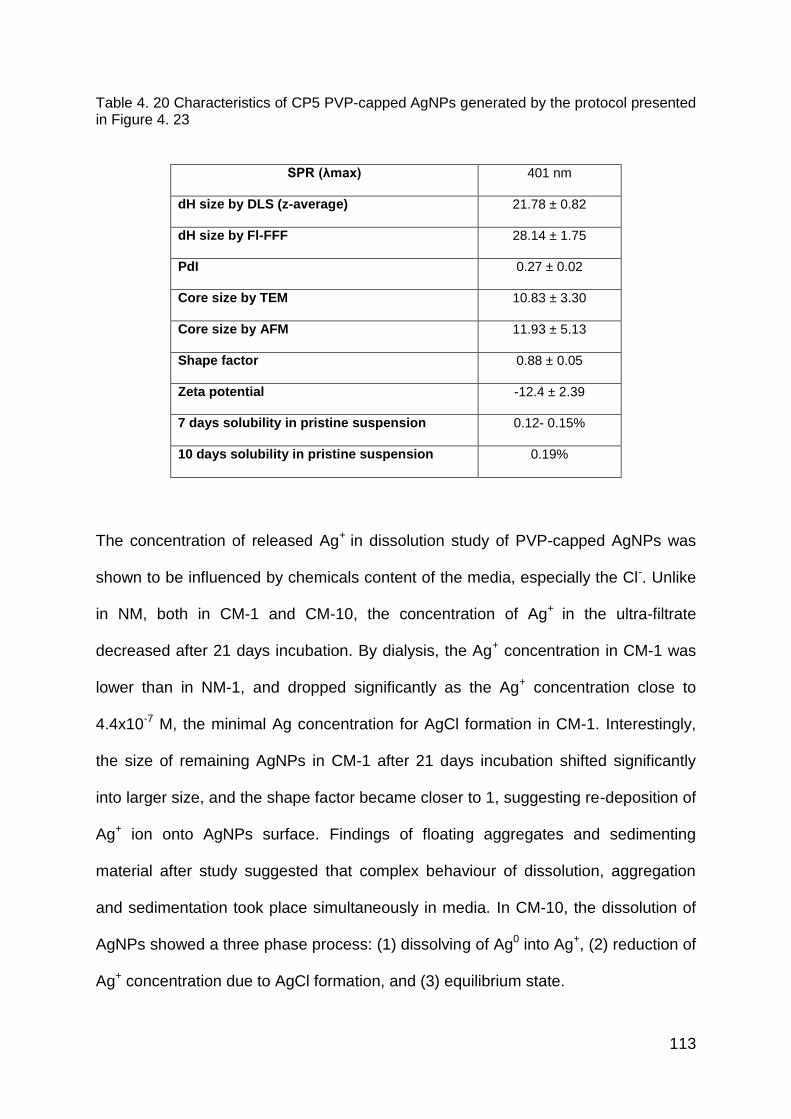
113
Table 4. 20 Characteristics of CP5 PVP-capped AgNPs generated by the protocol presented in Figure 4. 23
SPR (λmax) 401 nm
dH size by DLS (z-average) 21.78 ± 0.82
dH size by Fl-FFF 28.14 ± 1.75
PdI 0.27 ± 0.02
Core size by TEM 10.83 ± 3.30
Core size by AFM 11.93 ± 5.13
Shape factor 0.88 ± 0.05
Zeta potential -12.4 ± 2.39
7 days solubility in pristine suspension 0.12- 0.15%
10 days solubility in pristine suspension 0.19%
The concentration of released Ag+ in dissolution study of PVP-capped AgNPs was
shown to be influenced by chemicals content of the media, especially the Cl-. Unlike
in NM, both in CM-1 and CM-10, the concentration of Ag+ in the ultra-filtrate
decreased after 21 days incubation. By dialysis, the Ag+ concentration in CM-1 was
lower than in NM-1, and dropped significantly as the Ag+ concentration close to
4.4x10⁻⁷ M, the minimal Ag concentration for AgCl formation in CM-1. Interestingly,
the size of remaining AgNPs in CM-1 after 21 days incubation shifted significantly
into larger size, and the shape factor became closer to 1, suggesting re-deposition of
Ag+ ion onto AgNPs surface. Findings of floating aggregates and sedimenting
material after study suggested that complex behaviour of dissolution, aggregation
and sedimentation took place simultaneously in media. In CM-10, the dissolution of
AgNPs showed a three phase process: (1) dissolving of Ag0 into Ag+, (2) reduction of
Ag+ concentration due to AgCl formation, and (3) equilibrium state.
114
CHAPTER V
THE EFFECT OF LIGAND-EXCHANGE ON NANOPARTICLE
CHARACTERISTICS AND STABILITY
Chapter summary
The purpose of this study was to evaluate the ligand-exchange synthesis
protocols from electrostatically-stabilised AgNPs to generate sterically-capped
AgNPs. Different polymers suspensions were added into citrate-capped AgNPs, and
the occurrence of ligand-exchange was analysed. The practicability of indirect
recapping method (ligand-exchange) compared to direct synthesis (chapter IV),
alteration of physico-chemicals properties of core AgNPs because of ligand-
exchange, and AgNPs stability in ecotoxicology media before and after ligand-
exchange in ecotoxicology media were evaluated.
It was found that PVP polymer and Fulvic acid preserved the NPs core size
and increased the stability of AgNPs in a full strength OECD Daphnia sp. media for
up to 21 days incubation. PEG-SH and Tween-80 polymers, however, significantly
changed the core size of NPs although increased the stability of AgNPs in the media.
The polymer structure, number and position of functional head group in the ligand
molecules and the interaction strength between ligand and NPs, influence the SPR,
dH and core size, zeta potential, and stability of AgNPs in full strength OECD
Daphnia sp. media. Finding concentration ratio of NP suspension and polymer
solution to form a stable steric-capped AgNPs, and effect of polymers into NPs core
characteristics are novelty of this study.
115
5.1. Introduction
It has been shown that ligand-exchange of electrostatically-capped
nanoparticles with a polymer significantly increases the stability of the NP in high
ionic strength media (Rao, Kulkarni et al., 2002; Kvitek, Pana ek et al., 2008; Kvitek
et al., 2009). Ligand-exchange by polymer also allows further manipulation of NP
properties as the adsorbed ligand polymer shell is associated with the increase of
NPs chemical reactivity (Stobiecka et al., 2010; Park and Advincula, 2011), electrical
and thermal conductivity (Brown and Hutchison, 2001; Seo et al., 2009), and other
properties (Balazs et al., 2006). Recently, it was found that the transport of NPs in
porous media was also influenced by capping-ligand (El Badawy et al., 2013)
Additionally, polymer-capped NPs have a potential for application in a broad
range of areas such as in material, chemical and biological sciences as discussed in
Templeton (1999) and presented in Figure 5. 1. An example of this is the prospective
application of polymer-capped AgNPs as a sensor in detection of amine and thiol
vapour (Marques-Hueso et al., 2012), streptavidin (Haes and Van Duyne, 2002),
chiral molecules (Zhang and Ye, 2011), etc. Moreover, ligand-exchange can also be
adopted to build up a diverse library of steric-capped AgNPs generated from a single
source of uncapped NPs for research purposes (Woehrle et al., 2005), which is the
main focus of this study. Due to diverse advantages of polymer-capped NPs, the
understanding of the ligand-capped NPs synthesis, characterization and stability
study need to be further explored.
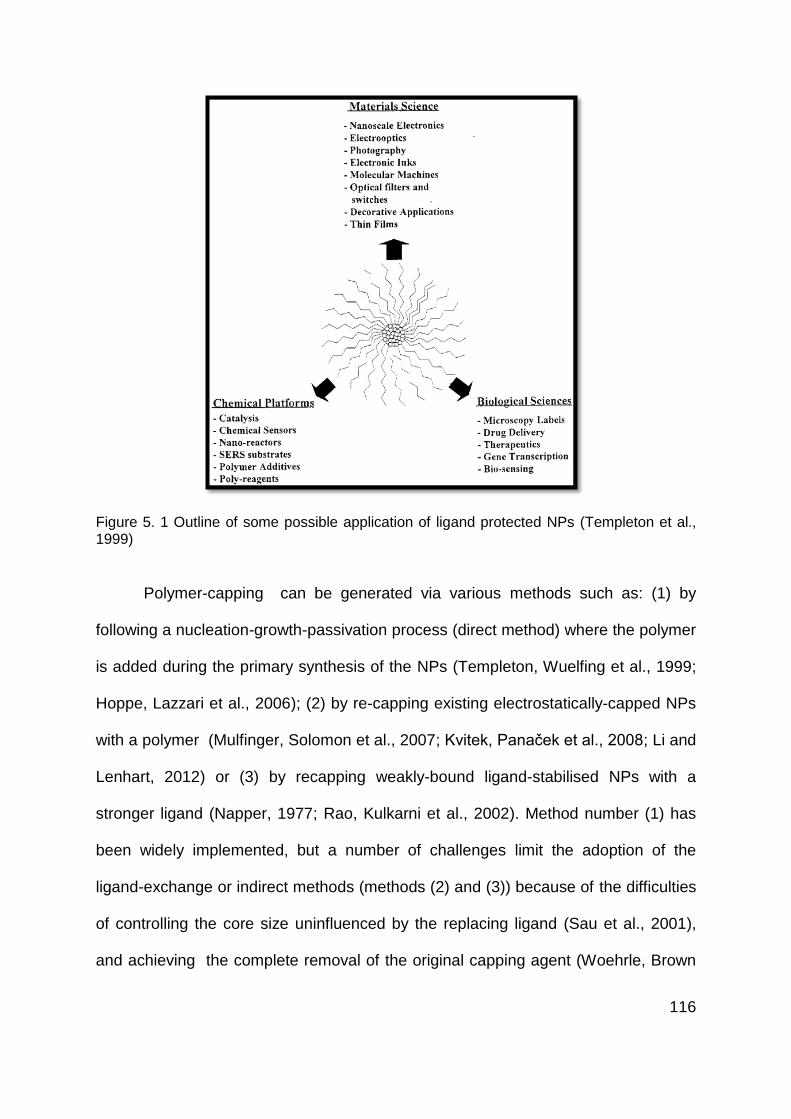
116
Figure 5. 1 Outline of some possible application of ligand protected NPs (Templeton et al., 1999)
Polymer-capping can be generated via various methods such as: (1) by
following a nucleation-growth-passivation process (direct method) where the polymer
is added during the primary synthesis of the NPs (Templeton, Wuelfing et al., 1999;
Hoppe, Lazzari et al., 2006); (2) by re-capping existing electrostatically-capped NPs
with a polymer (Mulfinger, Solomon et al., 2007; Kvitek, Pana ek et al., 2008; Li and
Lenhart, 2012) or (3) by recapping weakly-bound ligand-stabilised NPs with a
stronger ligand (Napper, 1977; Rao, Kulkarni et al., 2002). Method number (1) has
been widely implemented, but a number of challenges limit the adoption of the
ligand-exchange or indirect methods (methods (2) and (3)) because of the difficulties
of controlling the core size uninfluenced by the replacing ligand (Sau et al., 2001),
and achieving the complete removal of the original capping agent (Woehrle, Brown
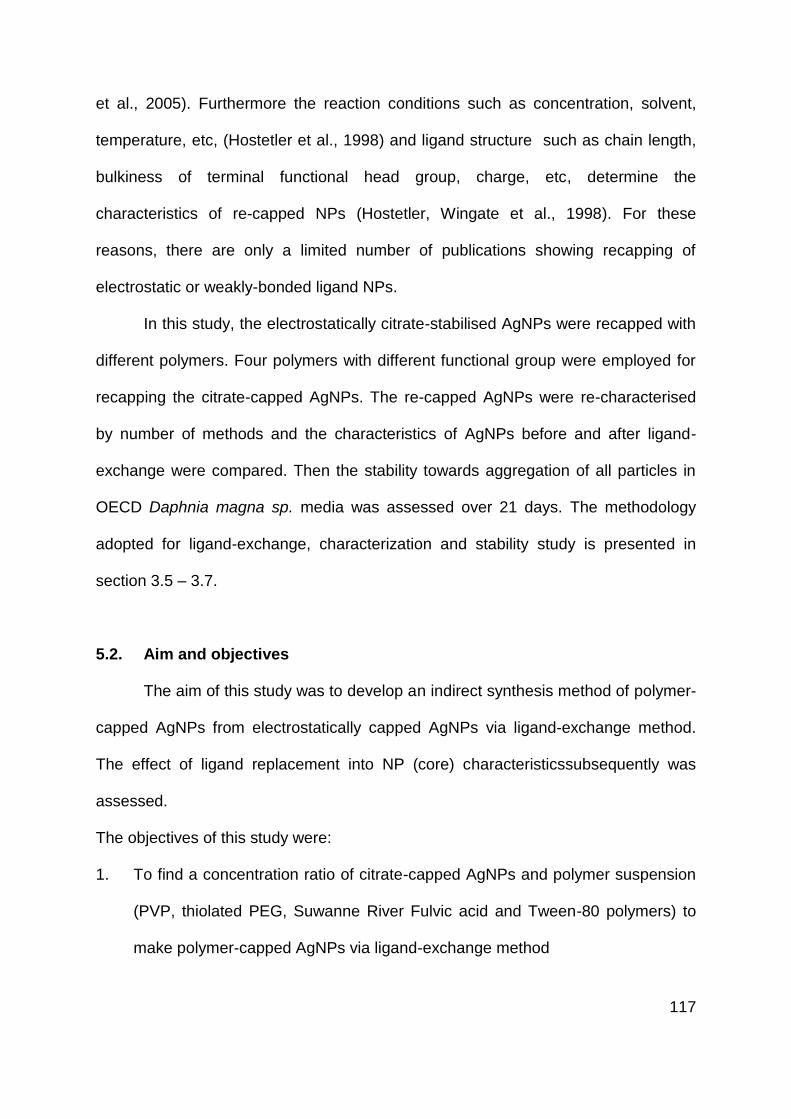
117
et al., 2005). Furthermore the reaction conditions such as concentration, solvent,
temperature, etc, (Hostetler et al., 1998) and ligand structure such as chain length,
bulkiness of terminal functional head group, charge, etc, determine the
characteristics of re-capped NPs (Hostetler, Wingate et al., 1998). For these
reasons, there are only a limited number of publications showing recapping of
electrostatic or weakly-bonded ligand NPs.
In this study, the electrostatically citrate-stabilised AgNPs were recapped with
different polymers. Four polymers with different functional group were employed for
recapping the citrate-capped AgNPs. The re-capped AgNPs were re-characterised
by number of methods and the characteristics of AgNPs before and after ligand-
exchange were compared. Then the stability towards aggregation of all particles in
OECD Daphnia magna sp. media was assessed over 21 days. The methodology
adopted for ligand-exchange, characterization and stability study is presented in
section 3.5 – 3.7.
5.2. Aim and objectives
The aim of this study was to develop an indirect synthesis method of polymer-
capped AgNPs from electrostatically capped AgNPs via ligand-exchange method.
The effect of ligand replacement into NP (core) characteristicssubsequently was
assessed.
The objectives of this study were:
1. To find a concentration ratio of citrate-capped AgNPs and polymer suspension
(PVP, thiolated PEG, Suwanne River Fulvic acid and Tween-80 polymers) to
make polymer-capped AgNPs via ligand-exchange method
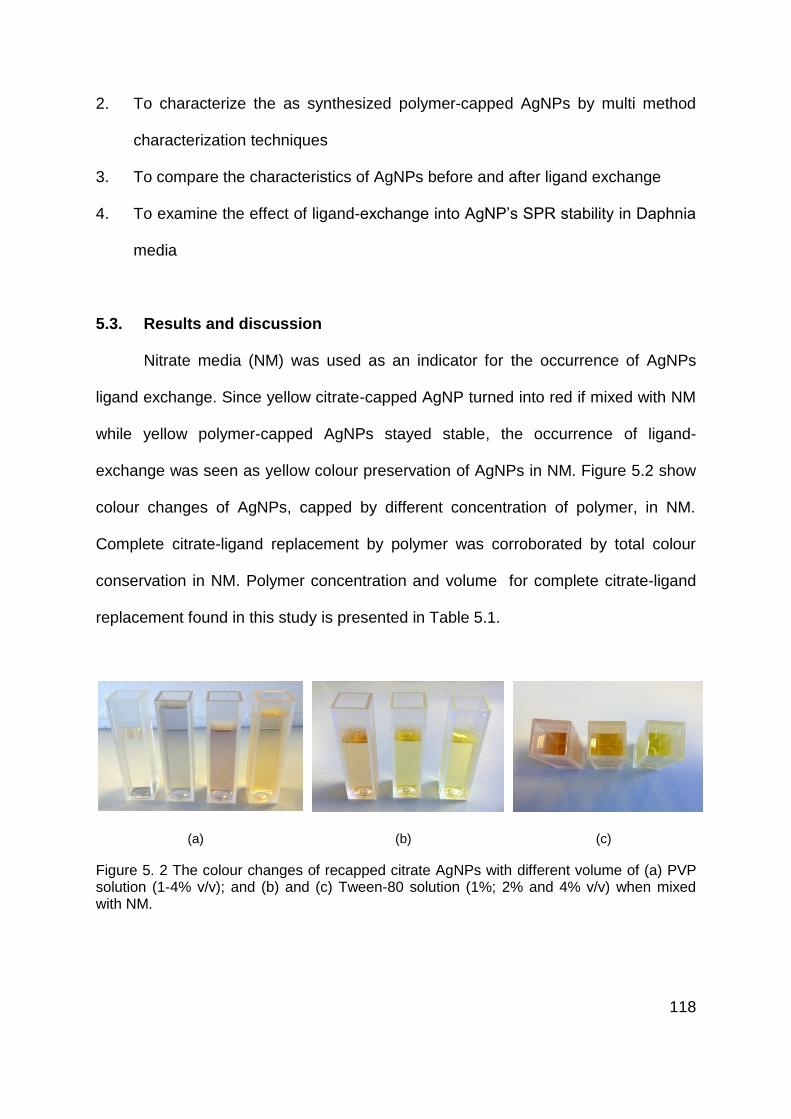
118
2. To characterize the as synthesized polymer-capped AgNPs by multi method
characterization techniques
3. To compare the characteristics of AgNPs before and after ligand exchange
4. To examine the effect of ligand-exchange into AgNP‘s SPR stability in Daphnia
media
5.3. Results and discussion
Nitrate media (NM) was used as an indicator for the occurrence of AgNPs
ligand exchange. Since yellow citrate-capped AgNP turned into red if mixed with NM
while yellow polymer-capped AgNPs stayed stable, the occurrence of ligand-
exchange was seen as yellow colour preservation of AgNPs in NM. Figure 5.2 show
colour changes of AgNPs, capped by different concentration of polymer, in NM.
Complete citrate-ligand replacement by polymer was corroborated by total colour
conservation in NM. Polymer concentration and volume for complete citrate-ligand
replacement found in this study is presented in Table 5.1.
(a) (b) (c)
Figure 5. 2 The colour changes of recapped citrate AgNPs with different volume of (a) PVP solution (1-4% v/v); and (b) and (c) Tween-80 solution (1%; 2% and 4% v/v) when mixed with NM.
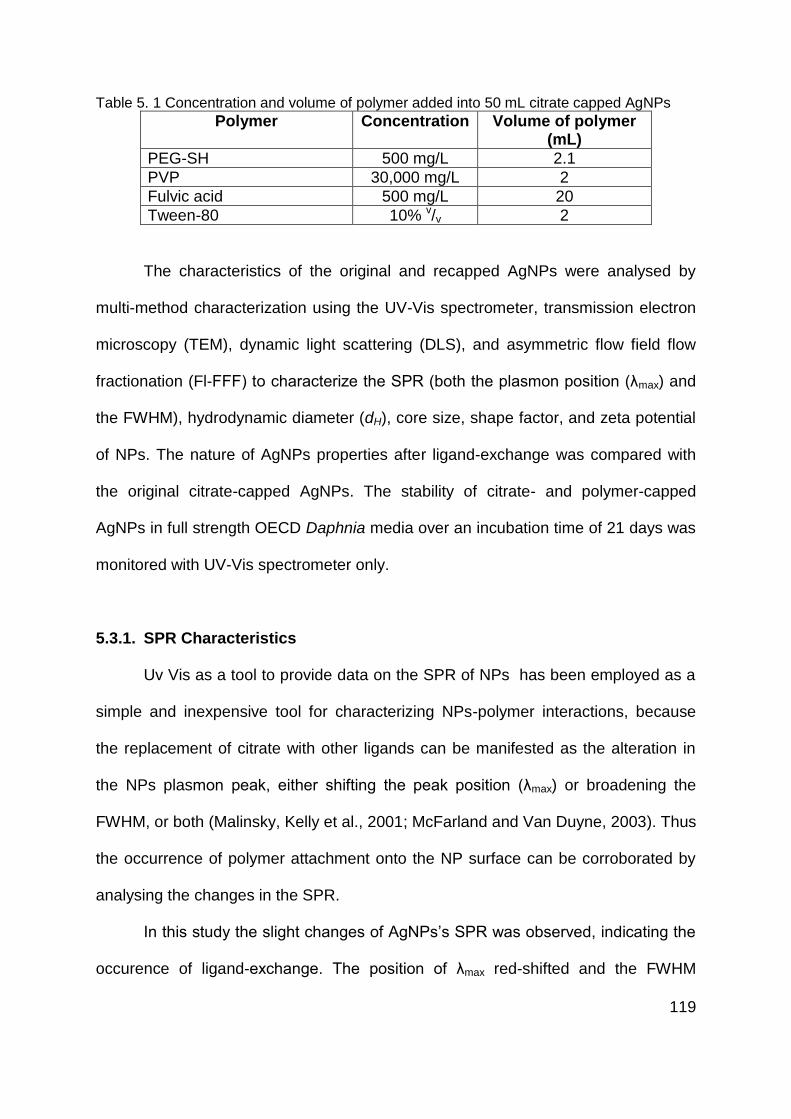
119
Table 5. 1 Concentration and volume of polymer added into 50 mL citrate capped AgNPs
Polymer Concentration Volume of polymer (mL)
PEG-SH 500 mg/L 2.1
PVP 30,000 mg/L 2
Fulvic acid 500 mg/L 20
Tween-80 10% v/v 2
The characteristics of the original and recapped AgNPs were analysed by
multi-method characterization using the UV-Vis spectrometer, transmission electron
microscopy (TEM), dynamic light scattering (DLS), and asymmetric flow field flow
fractionation (Fl-FFF) to characterize the SPR (both the plasmon position (λmax) and
the FWHM), hydrodynamic diameter (dH), core size, shape factor, and zeta potential
of NPs. The nature of AgNPs properties after ligand-exchange was compared with
the original citrate-capped AgNPs. The stability of citrate- and polymer-capped
AgNPs in full strength OECD Daphnia media over an incubation time of 21 days was
monitored with UV-Vis spectrometer only.
5.3.1. SPR Characteristics
Uv Vis as a tool to provide data on the SPR of NPs has been employed as a
simple and inexpensive tool for characterizing NPs-polymer interactions, because
the replacement of citrate with other ligands can be manifested as the alteration in
the NPs plasmon peak, either shifting the peak position (λmax) or broadening the
FWHM, or both (Malinsky, Kelly et al., 2001; McFarland and Van Duyne, 2003). Thus
the occurrence of polymer attachment onto the NP surface can be corroborated by
analysing the changes in the SPR.
In this study the slight changes of AgNPs‘s SPR was observed, indicating the
occurence of ligand-exchange. The position of λmax red-shifted and the FWHM
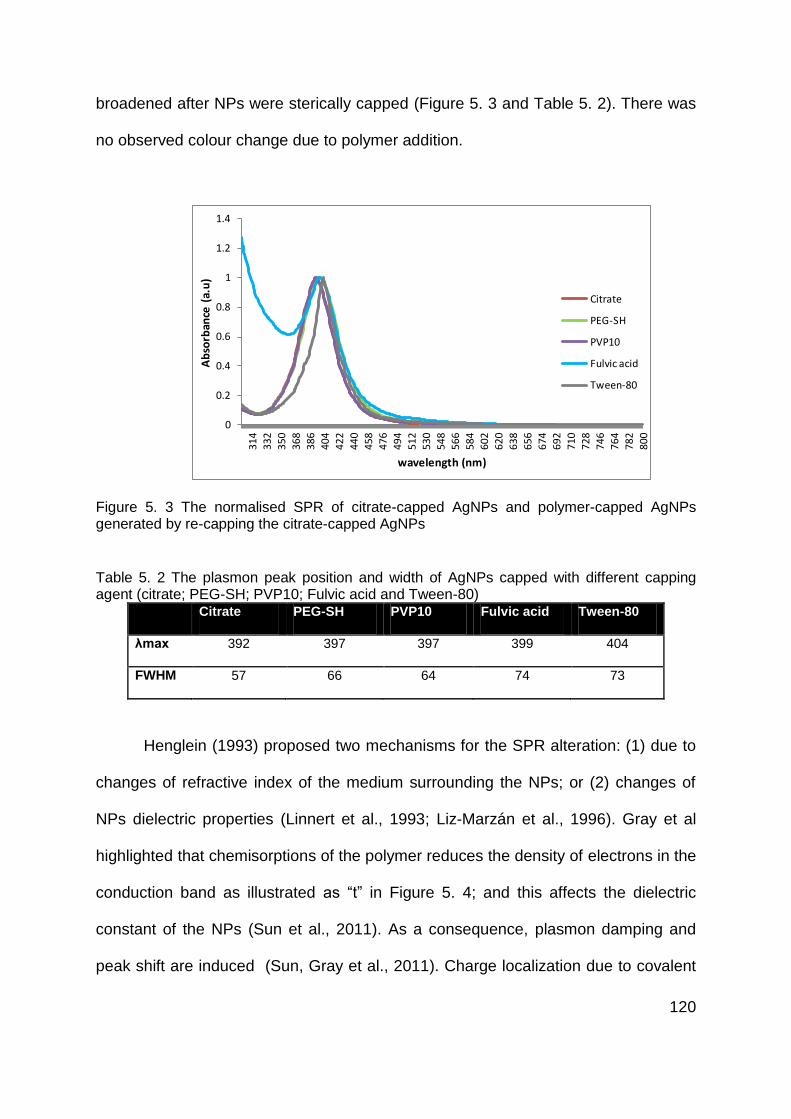
120
broadened after NPs were sterically capped (Figure 5. 3 and Table 5. 2). There was
no observed colour change due to polymer addition.
Figure 5. 3 The normalised SPR of citrate-capped AgNPs and polymer-capped AgNPs generated by re-capping the citrate-capped AgNPs
Table 5. 2 The plasmon peak position and width of AgNPs capped with different capping agent (citrate; PEG-SH; PVP10; Fulvic acid and Tween-80)
Citrate PEG-SH PVP10 Fulvic acid Tween-80
λmax 392 397 397 399 404
FWHM 57 66 64 74 73
Henglein (1993) proposed two mechanisms for the SPR alteration: (1) due to
changes of refractive index of the medium surrounding the NPs; or (2) changes of
NPs dielectric properties (Linnert et al., 1993; Liz-Marzán et al., 1996). Gray et al
highlighted that chemisorptions of the polymer reduces the density of electrons in the
conduction band as illustrated as ―t‖ in Figure 5. 4; and this affects the dielectric
constant of the NPs (Sun et al., 2011). As a consequence, plasmon damping and
peak shift are induced (Sun, Gray et al., 2011). Charge localization due to covalent
0
0.2
0.4
0.6
0.8
1
1.2
1.4
80
0
78
2
76
4
74
6
72
8
71
0
69
2
67
4
65
6
63
8
62
0
60
2
58
4
56
6
54
8
53
0
51
2
49
4
47
6
45
8
44
0
42
2
40
4
38
6
36
8
35
0
33
2
31
4
Ab
sorb
ance
(a.
u)
wavelength (nm)
Citrate
PEG-SH
PVP10
Fulvic acid
Tween-80
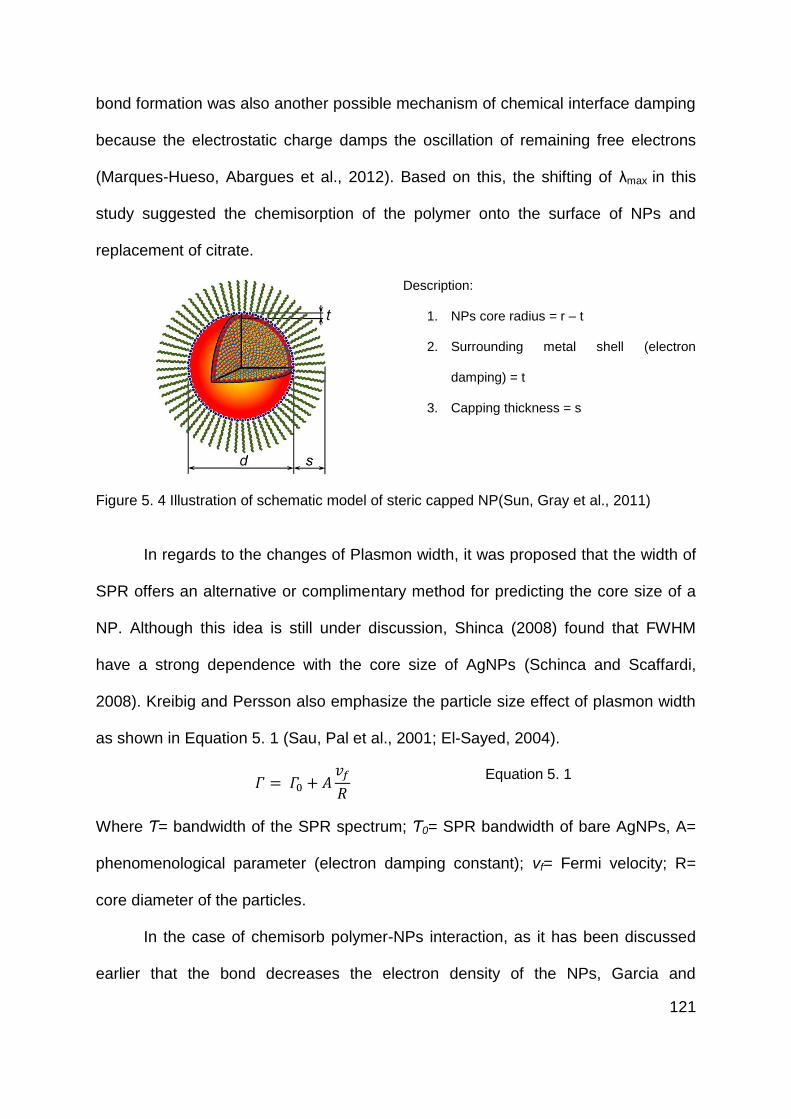
121
bond formation was also another possible mechanism of chemical interface damping
because the electrostatic charge damps the oscillation of remaining free electrons
(Marques-Hueso, Abargues et al., 2012). Based on this, the shifting of λmax in this
study suggested the chemisorption of the polymer onto the surface of NPs and
replacement of citrate.
Description:
1. NPs core radius = r – t
2. Surrounding metal shell (electron
damping) = t
3. Capping thickness = s
Figure 5. 4 Illustration of schematic model of steric capped NP(Sun, Gray et al., 2011)
In regards to the changes of Plasmon width, it was proposed that the width of
SPR offers an alternative or complimentary method for predicting the core size of a
NP. Although this idea is still under discussion, Shinca (2008) found that FWHM
have a strong dependence with the core size of AgNPs (Schinca and Scaffardi,
2008). Kreibig and Persson also emphasize the particle size effect of plasmon width
as shown in Equation 5. 1 (Sau, Pal et al., 2001; El-Sayed, 2004).
Equation 5. 1
Where Ƭ= bandwidth of the SPR spectrum; Ƭ0= SPR bandwidth of bare AgNPs, A=
phenomenological parameter (electron damping constant); vf= Fermi velocity; R=
core diameter of the particles.
In the case of chemisorb polymer-NPs interaction, as it has been discussed
earlier that the bond decreases the electron density of the NPs, Garcia and
122
Hernando proposed another model of the SPR width-core size dependence (Park et
al., 2007). They argued that the R in Equation 5. 1 should be corrected by
surrounding metal shell (t) (Figure 5. 4) and represented the as:
Equation 5. 2
where the thickness of t depends on the strength of interaction between capping
molecule and NPs (El-Sayed, 2004). Following from this, Garcia et al. explained why
1.5 nm thiol capped-AgNPs do not demonstrate a plasmon peak (Zhang and Sham,
2003; Crespo et al., 2004) as the strong interaction between thiol functional group
and NPs lead to an infinite damping (R = t). However, in linking the FWHM with the
core size of NPs it is necessary to consider the effect of aggregation, as it is well
known that aggregation make the plasmon peak wider (Haes and Van Duyne, 2002;
Park, Papaefthymiou et al., 2007).
In this study, different extent of the FWHM changes was shown by each
polymer. Fulvic acid and Tween-80 polymer broadened the plasmon peak more
notably than PEG-SH and PVP, suggesting greater core size changes according to
Equation 5. 2 and or aggregation. The fact that the thiolated polymer modifies the
size of NPs has been corroborated by some studies especially for gold NPs (Rao,
Kulkarni et al., 2002; Park, Papaefthymiou et al., 2007; Huang et al., 2011). Although
some studies refuted that ligand-exchange alters the core size of NPs (Seo et al.,
2004; Woehrle, Brown et al., 2005; Caragheorgheopol and Chechik, 2008), it is an
interesting question whether the adsoption of polymer in this study could modify the
core size of the NPs or the observed alteration is only due to aggregation. To answer
this question, TEM was employed for further analysis.
123
5.3.2. TEM core size and measurement and shape factor analysis
Figure 5. 5 shows the TEM images, core size and shape factor of AgNPs.
Since the TEM used could not capture a clear image of Tween-80 capped AgNPs,
an estimate of the size was made.
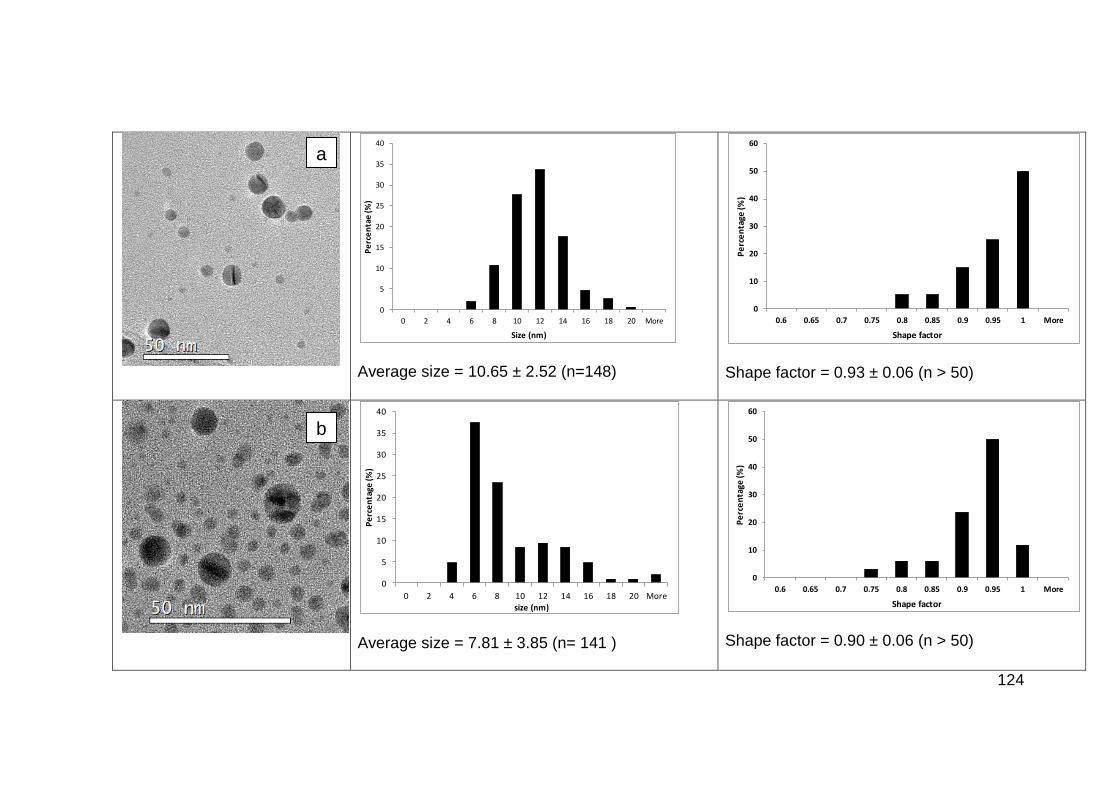
124
Average size = 10.65 ± 2.52 (n=148)
Shape factor = 0.93 ± 0.06 (n > 50)
Average size = 7.81 ± 3.85 (n= 141 )
Shape factor = 0.90 ± 0.06 (n > 50)
0
5
10
15
20
25
30
35
40
0 2 4 6 8 10 12 14 16 18 20 More
Pe
rce
nta
e (%
)
Size (nm)
0
10
20
30
40
50
60
0.6 0.65 0.7 0.75 0.8 0.85 0.9 0.95 1 More
Pe
rce
nta
ge (%
)
Shape factor
0
5
10
15
20
25
30
35
40
0 2 4 6 8 10 12 14 16 18 20 More
Pe
rce
nta
ge (%
)
size (nm)
0
10
20
30
40
50
60
0.6 0.65 0.7 0.75 0.8 0.85 0.9 0.95 1 More
Pe
rce
nta
ge (%
)
Shape factor
a
b
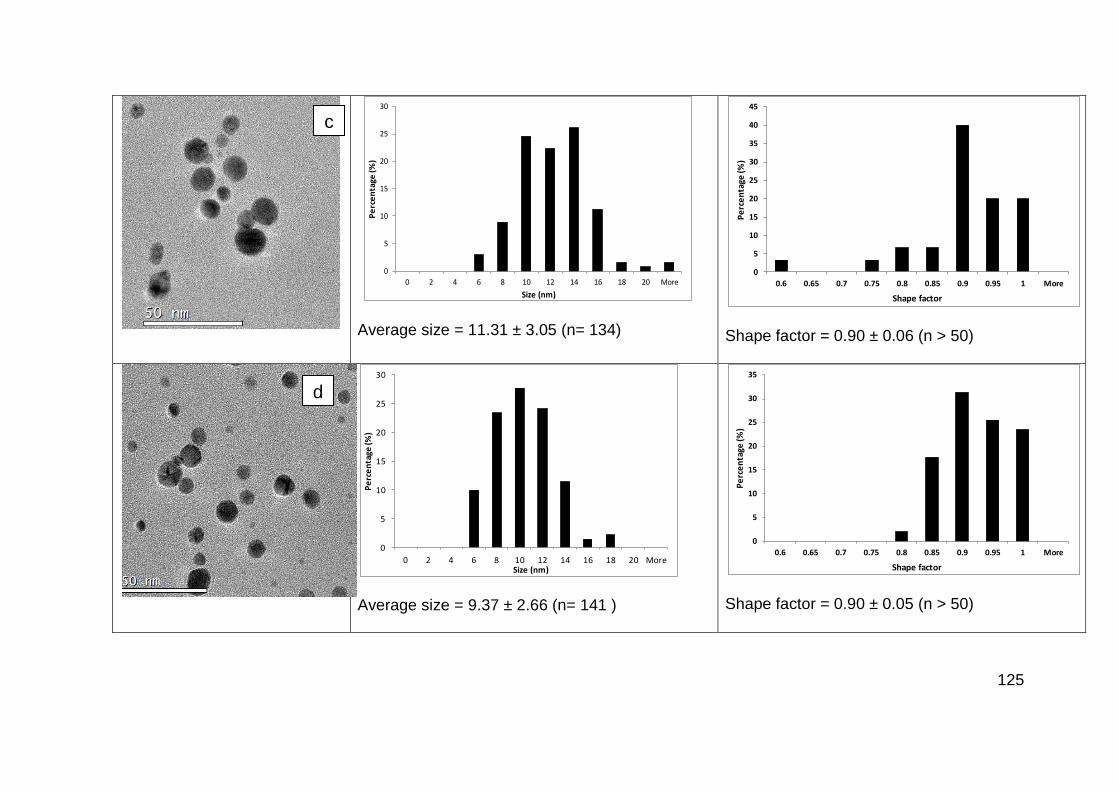
125
Average size = 11.31 ± 3.05 (n= 134)
Shape factor = 0.90 ± 0.06 (n > 50)
Average size = 9.37 ± 2.66 (n= 141 )
Shape factor = 0.90 ± 0.05 (n > 50)
0
5
10
15
20
25
30
0 2 4 6 8 10 12 14 16 18 20 More
Pe
rce
nta
ge (%
)
Size (nm)
0
5
10
15
20
25
30
35
40
45
0.6 0.65 0.7 0.75 0.8 0.85 0.9 0.95 1 More
Pe
rce
nta
ge (%
)
Shape factor
0
5
10
15
20
25
30
0 2 4 6 8 10 12 14 16 18 20 More
Pe
rce
nta
ge (%
)
Size (nm)
0
5
10
15
20
25
30
35
0.6 0.65 0.7 0.75 0.8 0.85 0.9 0.95 1 More
Pe
rce
nta
ge (%
)
Shape factor
c
d
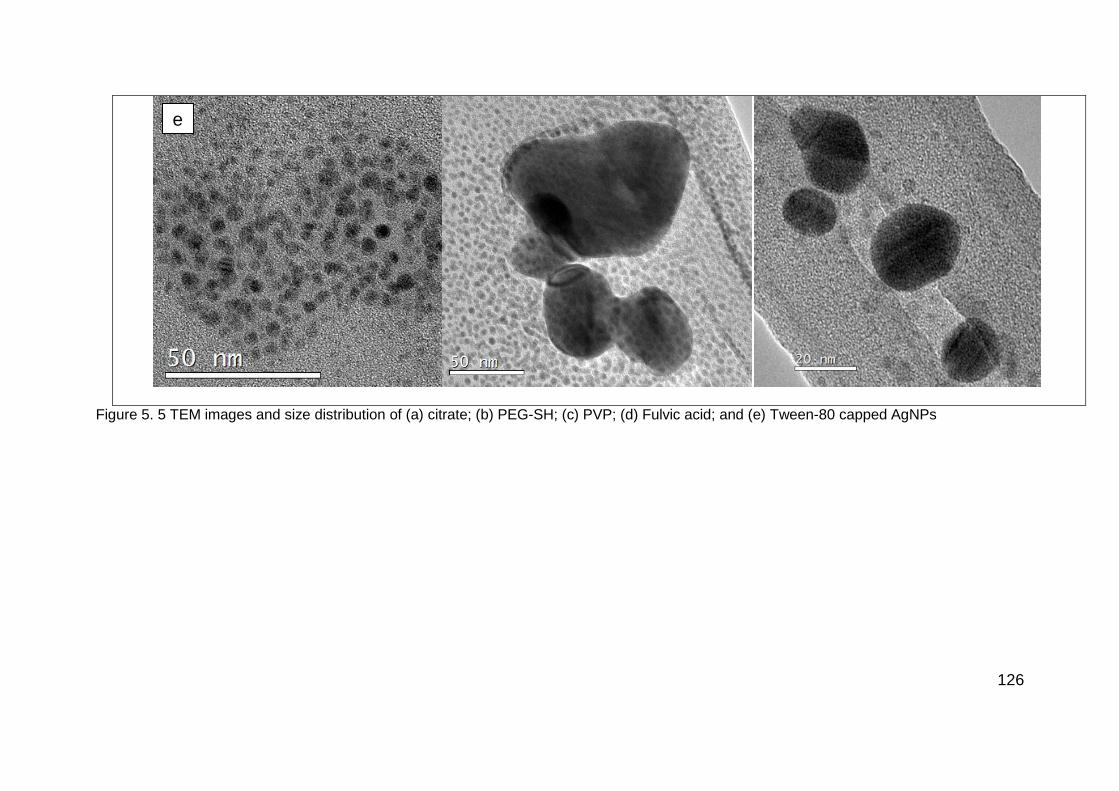
126
Figure 5. 5 TEM images and size distribution of (a) citrate; (b) PEG-SH; (c) PVP; (d) Fulvic acid; and (e) Tween-80 capped AgNPs
e
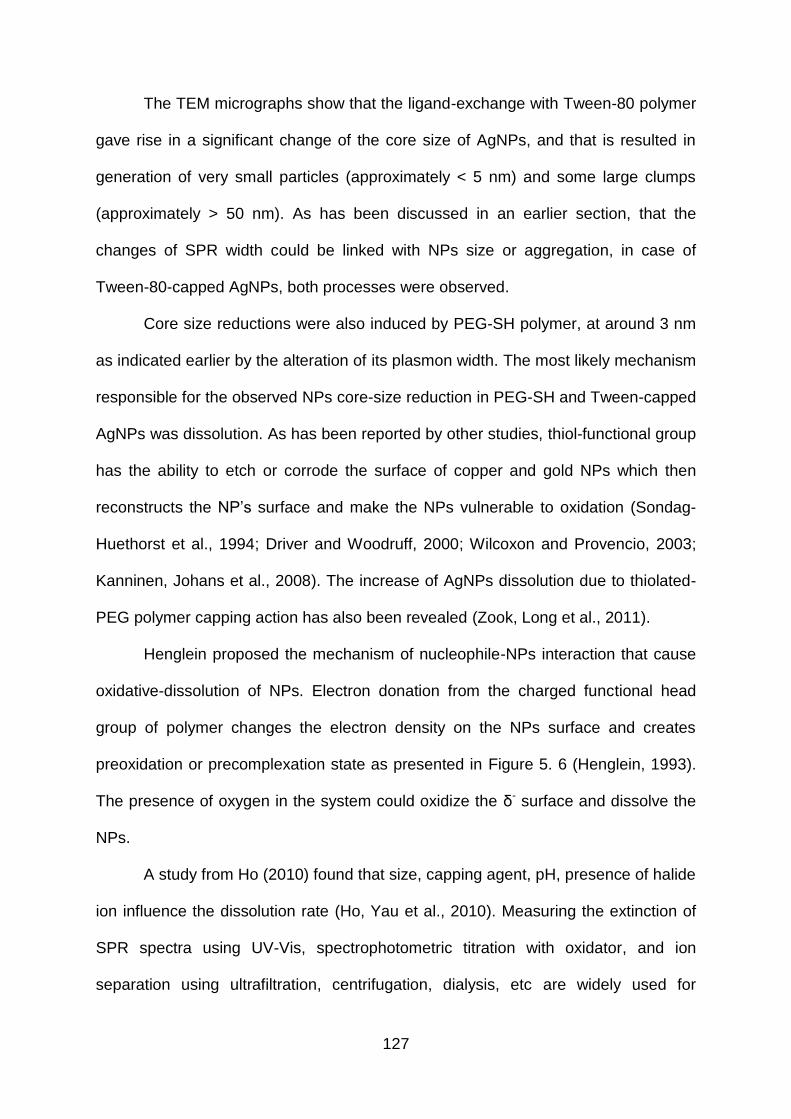
127
The TEM micrographs show that the ligand-exchange with Tween-80 polymer
gave rise in a significant change of the core size of AgNPs, and that is resulted in
generation of very small particles (approximately < 5 nm) and some large clumps
(approximately > 50 nm). As has been discussed in an earlier section, that the
changes of SPR width could be linked with NPs size or aggregation, in case of
Tween-80-capped AgNPs, both processes were observed.
Core size reductions were also induced by PEG-SH polymer, at around 3 nm
as indicated earlier by the alteration of its plasmon width. The most likely mechanism
responsible for the observed NPs core-size reduction in PEG-SH and Tween-capped
AgNPs was dissolution. As has been reported by other studies, thiol-functional group
has the ability to etch or corrode the surface of copper and gold NPs which then
reconstructs the NP‘s surface and make the NPs vulnerable to oxidation (Sondag-
Huethorst et al., 1994; Driver and Woodruff, 2000; Wilcoxon and Provencio, 2003;
Kanninen, Johans et al., 2008). The increase of AgNPs dissolution due to thiolated-
PEG polymer capping action has also been revealed (Zook, Long et al., 2011).
Henglein proposed the mechanism of nucleophile-NPs interaction that cause
oxidative-dissolution of NPs. Electron donation from the charged functional head
group of polymer changes the electron density on the NPs surface and creates
preoxidation or precomplexation state as presented in Figure 5. 6 (Henglein, 1993).
The presence of oxygen in the system could oxidize the δ- surface and dissolve the
NPs.
A study from Ho (2010) found that size, capping agent, pH, presence of halide
ion influence the dissolution rate (Ho, Yau et al., 2010). Measuring the extinction of
SPR spectra using UV-Vis, spectrophotometric titration with oxidator, and ion
separation using ultrafiltration, centrifugation, dialysis, etc are widely used for
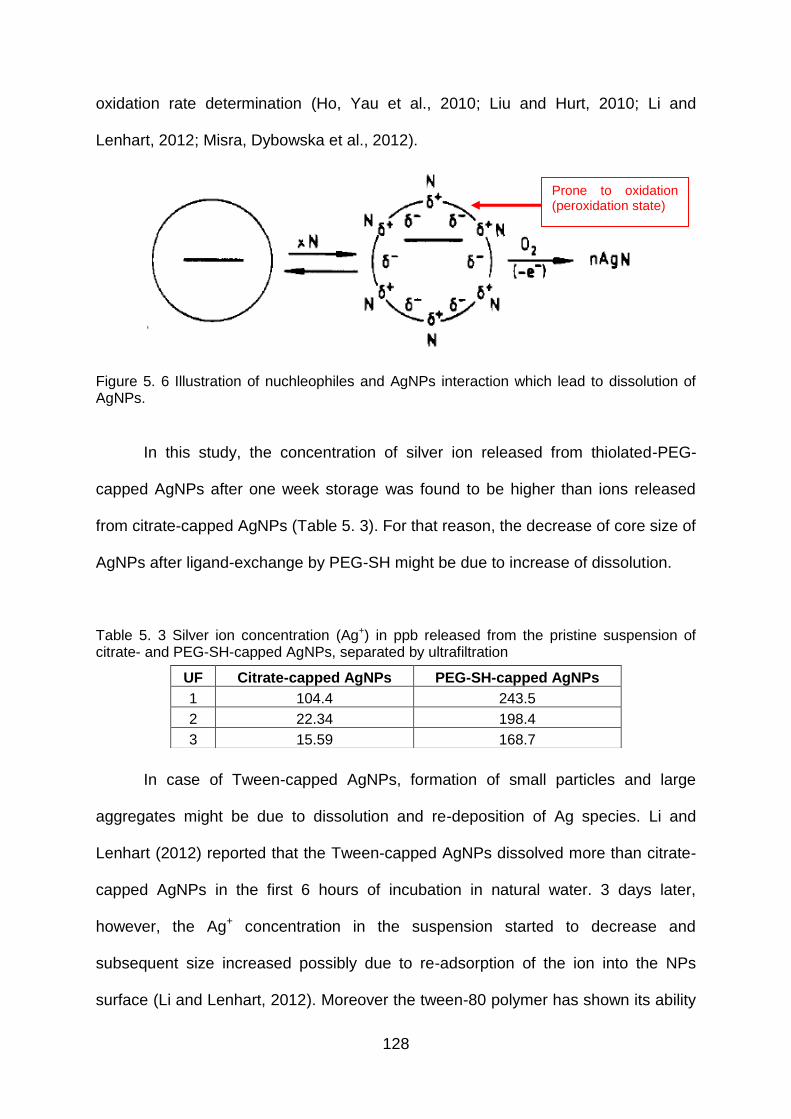
128
oxidation rate determination (Ho, Yau et al., 2010; Liu and Hurt, 2010; Li and
Lenhart, 2012; Misra, Dybowska et al., 2012).
Figure 5. 6 Illustration of nuchleophiles and AgNPs interaction which lead to dissolution of AgNPs.
In this study, the concentration of silver ion released from thiolated-PEG-
capped AgNPs after one week storage was found to be higher than ions released
from citrate-capped AgNPs (Table 5. 3). For that reason, the decrease of core size of
AgNPs after ligand-exchange by PEG-SH might be due to increase of dissolution.
Table 5. 3 Silver ion concentration (Ag+) in ppb released from the pristine suspension of citrate- and PEG-SH-capped AgNPs, separated by ultrafiltration
In case of Tween-capped AgNPs, formation of small particles and large
aggregates might be due to dissolution and re-deposition of Ag species. Li and
Lenhart (2012) reported that the Tween-capped AgNPs dissolved more than citrate-
capped AgNPs in the first 6 hours of incubation in natural water. 3 days later,
however, the Ag+ concentration in the suspension started to decrease and
subsequent size increased possibly due to re-adsorption of the ion into the NPs
surface (Li and Lenhart, 2012). Moreover the tween-80 polymer has shown its ability
UF Citrate-capped AgNPs PEG-SH-capped AgNPs
1 104.4 243.5
2 22.34 198.4
3 15.59 168.7
Prone to oxidation (peroxidation state)
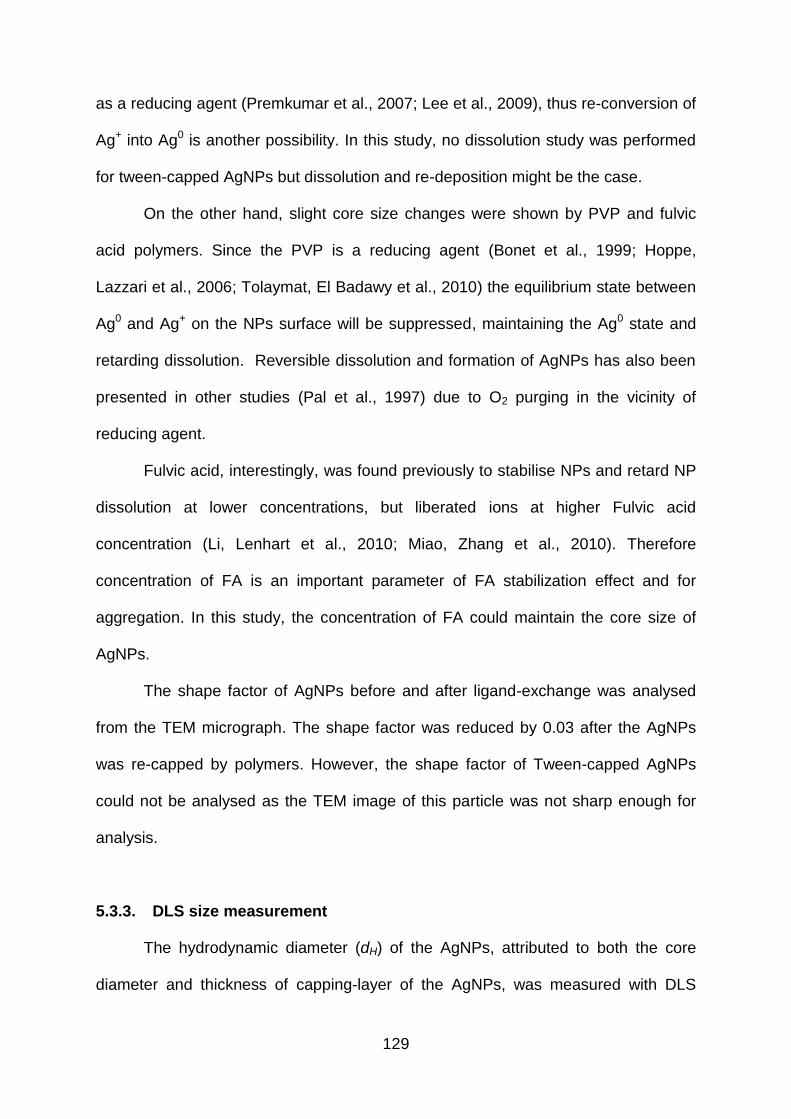
129
as a reducing agent (Premkumar et al., 2007; Lee et al., 2009), thus re-conversion of
Ag+ into Ag0 is another possibility. In this study, no dissolution study was performed
for tween-capped AgNPs but dissolution and re-deposition might be the case.
On the other hand, slight core size changes were shown by PVP and fulvic
acid polymers. Since the PVP is a reducing agent (Bonet et al., 1999; Hoppe,
Lazzari et al., 2006; Tolaymat, El Badawy et al., 2010) the equilibrium state between
Ag0 and Ag+ on the NPs surface will be suppressed, maintaining the Ag0 state and
retarding dissolution. Reversible dissolution and formation of AgNPs has also been
presented in other studies (Pal et al., 1997) due to O2 purging in the vicinity of
reducing agent.
Fulvic acid, interestingly, was found previously to stabilise NPs and retard NP
dissolution at lower concentrations, but liberated ions at higher Fulvic acid
concentration (Li, Lenhart et al., 2010; Miao, Zhang et al., 2010). Therefore
concentration of FA is an important parameter of FA stabilization effect and for
aggregation. In this study, the concentration of FA could maintain the core size of
AgNPs.
The shape factor of AgNPs before and after ligand-exchange was analysed
from the TEM micrograph. The shape factor was reduced by 0.03 after the AgNPs
was re-capped by polymers. However, the shape factor of Tween-capped AgNPs
could not be analysed as the TEM image of this particle was not sharp enough for
analysis.
5.3.3. DLS size measurement
The hydrodynamic diameter (dH) of the AgNPs, attributed to both the core
diameter and thickness of capping-layer of the AgNPs, was measured with DLS
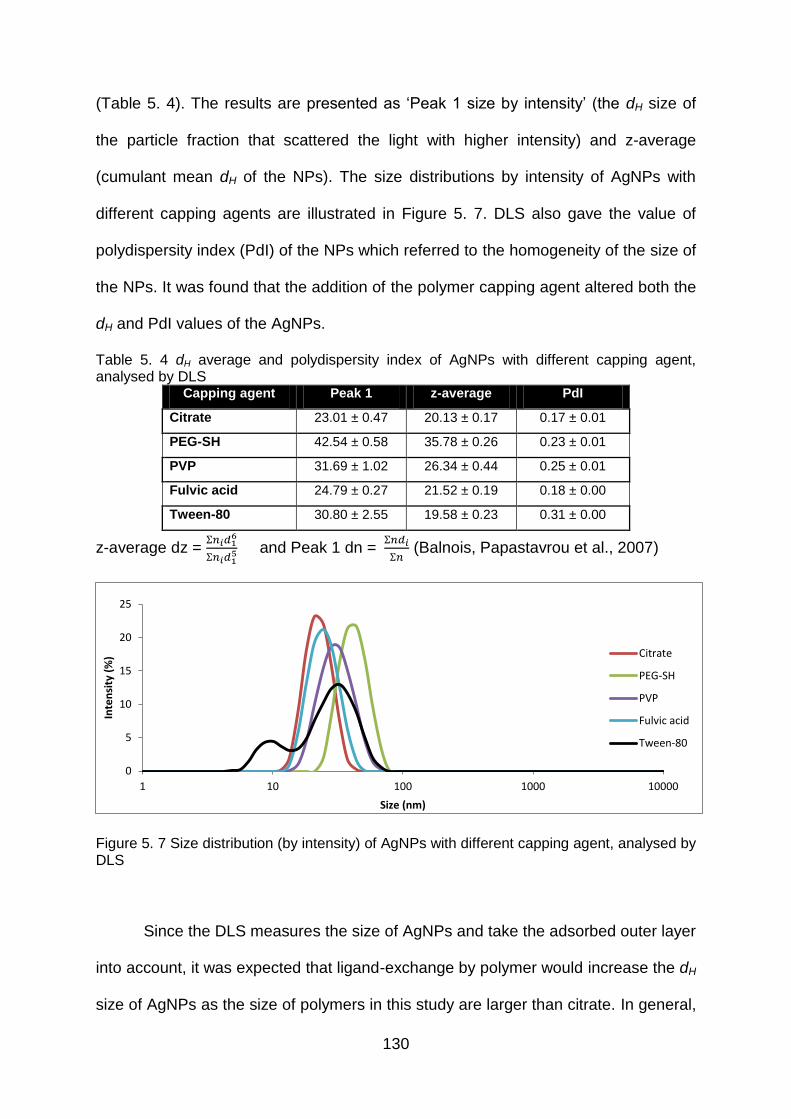
130
(Table 5. 4). The results are presented as ‗Peak 1 size by intensity‘ (the dH size of
the particle fraction that scattered the light with higher intensity) and z-average
(cumulant mean dH of the NPs). The size distributions by intensity of AgNPs with
different capping agents are illustrated in Figure 5. 7. DLS also gave the value of
polydispersity index (PdI) of the NPs which referred to the homogeneity of the size of
the NPs. It was found that the addition of the polymer capping agent altered both the
dH and PdI values of the AgNPs.
Table 5. 4 dH average and polydispersity index of AgNPs with different capping agent, analysed by DLS
Capping agent Peak 1 z-average PdI
Citrate 23.01 ± 0.47 20.13 ± 0.17 0.17 ± 0.01
PEG-SH 42.54 ± 0.58 35.78 ± 0.26 0.23 ± 0.01
PVP 31.69 ± 1.02 26.34 ± 0.44 0.25 ± 0.01
Fulvic acid 24.79 ± 0.27 21.52 ± 0.19 0.18 ± 0.00
Tween-80 30.80 ± 2.55 19.58 ± 0.23 0.31 ± 0.00
z-average dz =
and Peak 1 dn =
(Balnois, Papastavrou et al., 2007)
Figure 5. 7 Size distribution (by intensity) of AgNPs with different capping agent, analysed by DLS
Since the DLS measures the size of AgNPs and take the adsorbed outer layer
into account, it was expected that ligand-exchange by polymer would increase the dH
size of AgNPs as the size of polymers in this study are larger than citrate. In general,
0
5
10
15
20
25
1 10 100 1000 10000
Inte
nsi
ty (
%)
Size (nm)
Citrate
PEG-SH
PVP
Fulvic acid
Tween-80
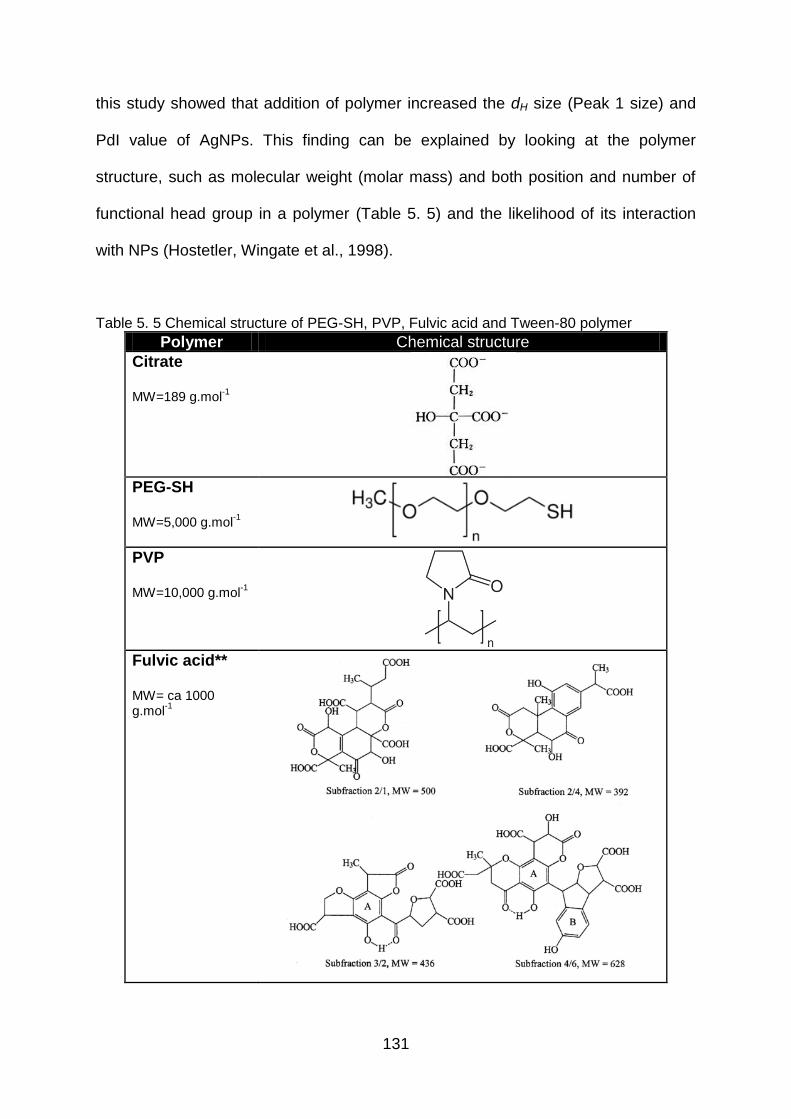
131
this study showed that addition of polymer increased the dH size (Peak 1 size) and
PdI value of AgNPs. This finding can be explained by looking at the polymer
structure, such as molecular weight (molar mass) and both position and number of
functional head group in a polymer (Table 5. 5) and the likelihood of its interaction
with NPs (Hostetler, Wingate et al., 1998).
Table 5. 5 Chemical structure of PEG-SH, PVP, Fulvic acid and Tween-80 polymer
Polymer Chemical structure
Citrate MW=189 g.mol
-1
PEG-SH MW=5,000 g.mol
-1
PVP MW=10,000 g.mol
-1
Fulvic acid** MW= ca 1000 g.mol
-1
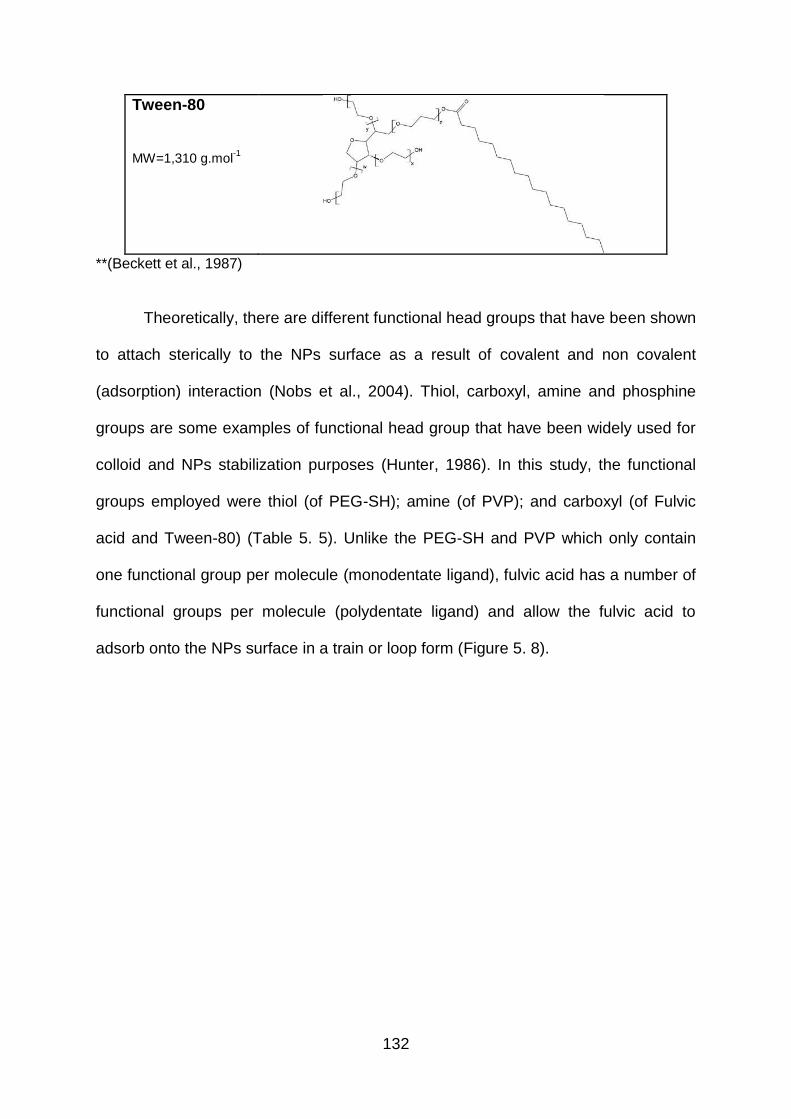
132
Tween-80 MW=1,310 g.mol
-1
**(Beckett et al., 1987)
Theoretically, there are different functional head groups that have been shown
to attach sterically to the NPs surface as a result of covalent and non covalent
(adsorption) interaction (Nobs et al., 2004). Thiol, carboxyl, amine and phosphine
groups are some examples of functional head group that have been widely used for
colloid and NPs stabilization purposes (Hunter, 1986). In this study, the functional
groups employed were thiol (of PEG-SH); amine (of PVP); and carboxyl (of Fulvic
acid and Tween-80) (Table 5. 5). Unlike the PEG-SH and PVP which only contain
one functional group per molecule (monodentate ligand), fulvic acid has a number of
functional groups per molecule (polydentate ligand) and allow the fulvic acid to
adsorb onto the NPs surface in a train or loop form (Figure 5. 8).
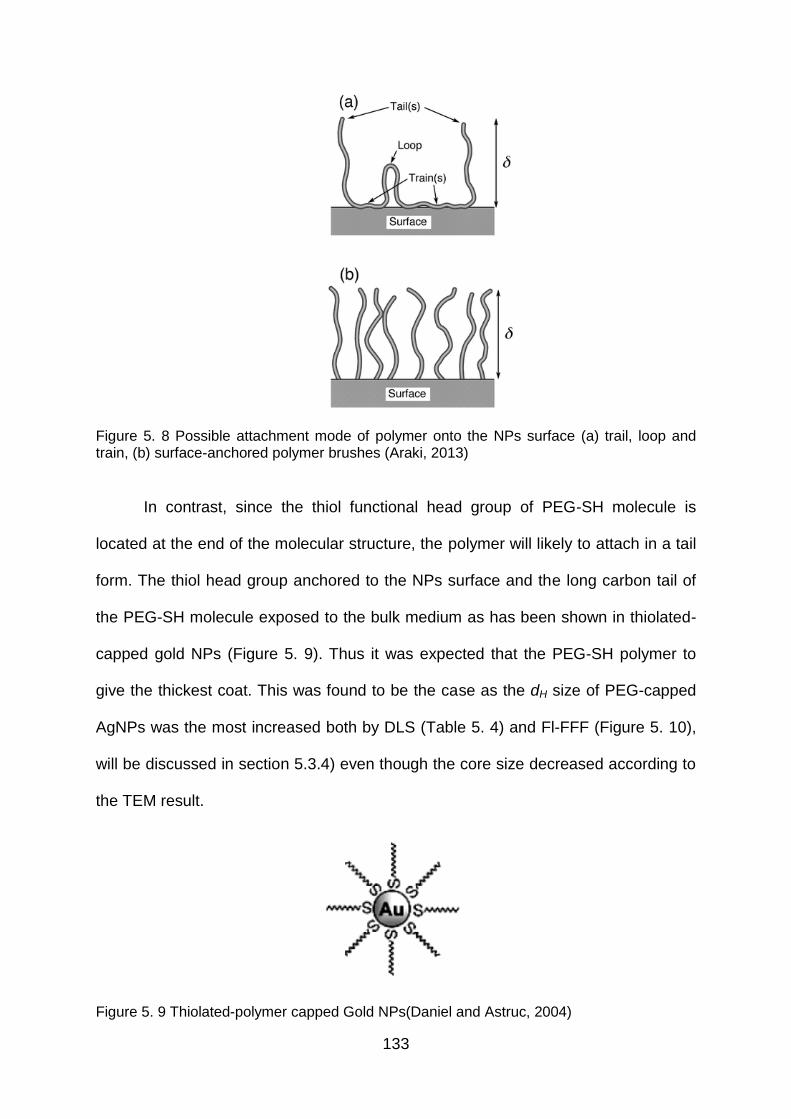
133
Figure 5. 8 Possible attachment mode of polymer onto the NPs surface (a) trail, loop and train, (b) surface-anchored polymer brushes (Araki, 2013)
In contrast, since the thiol functional head group of PEG-SH molecule is
located at the end of the molecular structure, the polymer will likely to attach in a tail
form. The thiol head group anchored to the NPs surface and the long carbon tail of
the PEG-SH molecule exposed to the bulk medium as has been shown in thiolated-
capped gold NPs (Figure 5. 9). Thus it was expected that the PEG-SH polymer to
give the thickest coat. This was found to be the case as the dH size of PEG-capped
AgNPs was the most increased both by DLS (Table 5. 4) and Fl-FFF (Figure 5. 10),
will be discussed in section 5.3.4) even though the core size decreased according to
the TEM result.
Figure 5. 9 Thiolated-polymer capped Gold NPs(Daniel and Astruc, 2004)
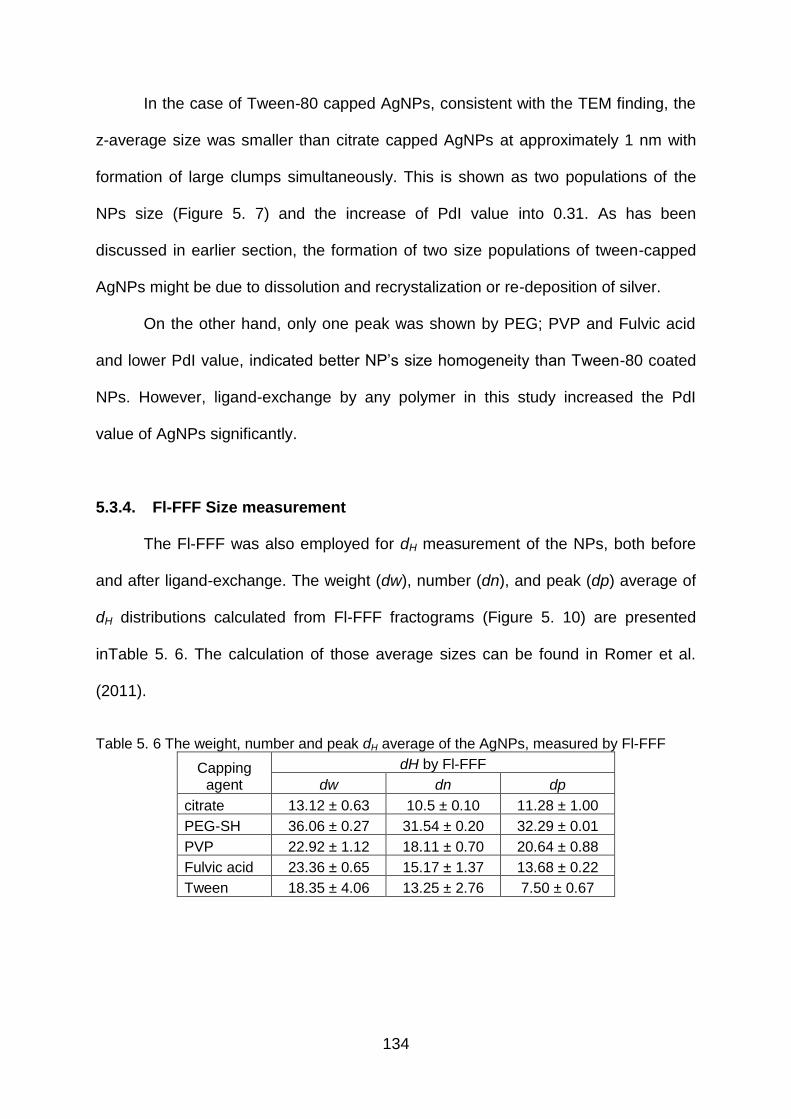
134
In the case of Tween-80 capped AgNPs, consistent with the TEM finding, the
z-average size was smaller than citrate capped AgNPs at approximately 1 nm with
formation of large clumps simultaneously. This is shown as two populations of the
NPs size (Figure 5. 7) and the increase of PdI value into 0.31. As has been
discussed in earlier section, the formation of two size populations of tween-capped
AgNPs might be due to dissolution and recrystalization or re-deposition of silver.
On the other hand, only one peak was shown by PEG; PVP and Fulvic acid
and lower PdI value, indicated better NP‘s size homogeneity than Tween-80 coated
NPs. However, ligand-exchange by any polymer in this study increased the PdI
value of AgNPs significantly.
5.3.4. Fl-FFF Size measurement
The Fl-FFF was also employed for dH measurement of the NPs, both before
and after ligand-exchange. The weight (dw), number (dn), and peak (dp) average of
dH distributions calculated from Fl-FFF fractograms (Figure 5. 10) are presented
inTable 5. 6. The calculation of those average sizes can be found in Romer et al.
(2011).
Table 5. 6 The weight, number and peak dH average of the AgNPs, measured by Fl-FFF
Capping agent
dH by Fl-FFF
dw dn dp
citrate 13.12 ± 0.63 10.5 ± 0.10 11.28 ± 1.00
PEG-SH 36.06 ± 0.27 31.54 ± 0.20 32.29 ± 0.01
PVP 22.92 ± 1.12 18.11 ± 0.70 20.64 ± 0.88
Fulvic acid 23.36 ± 0.65 15.17 ± 1.37 13.68 ± 0.22
Tween 18.35 ± 4.06 13.25 ± 2.76 7.50 ± 0.67
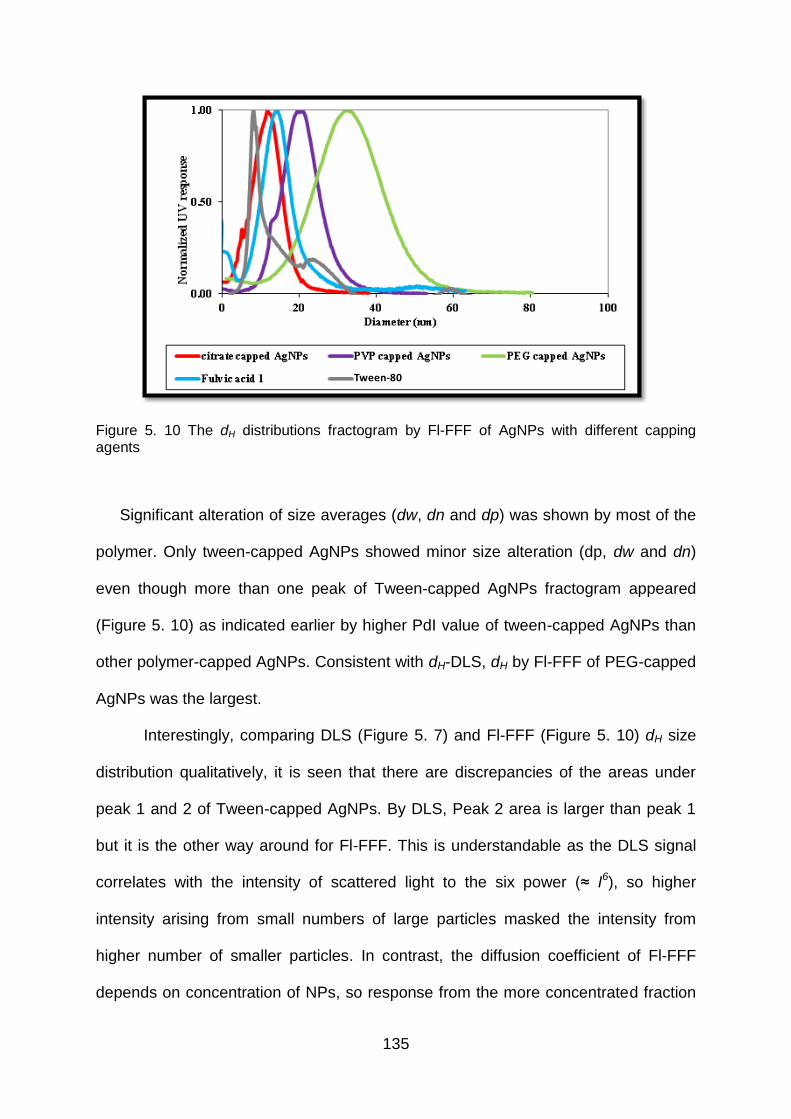
135
Figure 5. 10 The dH distributions fractogram by Fl-FFF of AgNPs with different capping agents
Significant alteration of size averages (dw, dn and dp) was shown by most of the
polymer. Only tween-capped AgNPs showed minor size alteration (dp, dw and dn)
even though more than one peak of Tween-capped AgNPs fractogram appeared
(Figure 5. 10) as indicated earlier by higher PdI value of tween-capped AgNPs than
other polymer-capped AgNPs. Consistent with dH-DLS, dH by Fl-FFF of PEG-capped
AgNPs was the largest.
Interestingly, comparing DLS (Figure 5. 7) and Fl-FFF (Figure 5. 10) dH size
distribution qualitatively, it is seen that there are discrepancies of the areas under
peak 1 and 2 of Tween-capped AgNPs. By DLS, Peak 2 area is larger than peak 1
but it is the other way around for Fl-FFF. This is understandable as the DLS signal
correlates with the intensity of scattered light to the six power (≈ I6), so higher
intensity arising from small numbers of large particles masked the intensity from
higher number of smaller particles. In contrast, the diffusion coefficient of Fl-FFF
depends on concentration of NPs, so response from the more concentrated fraction
Tween-80
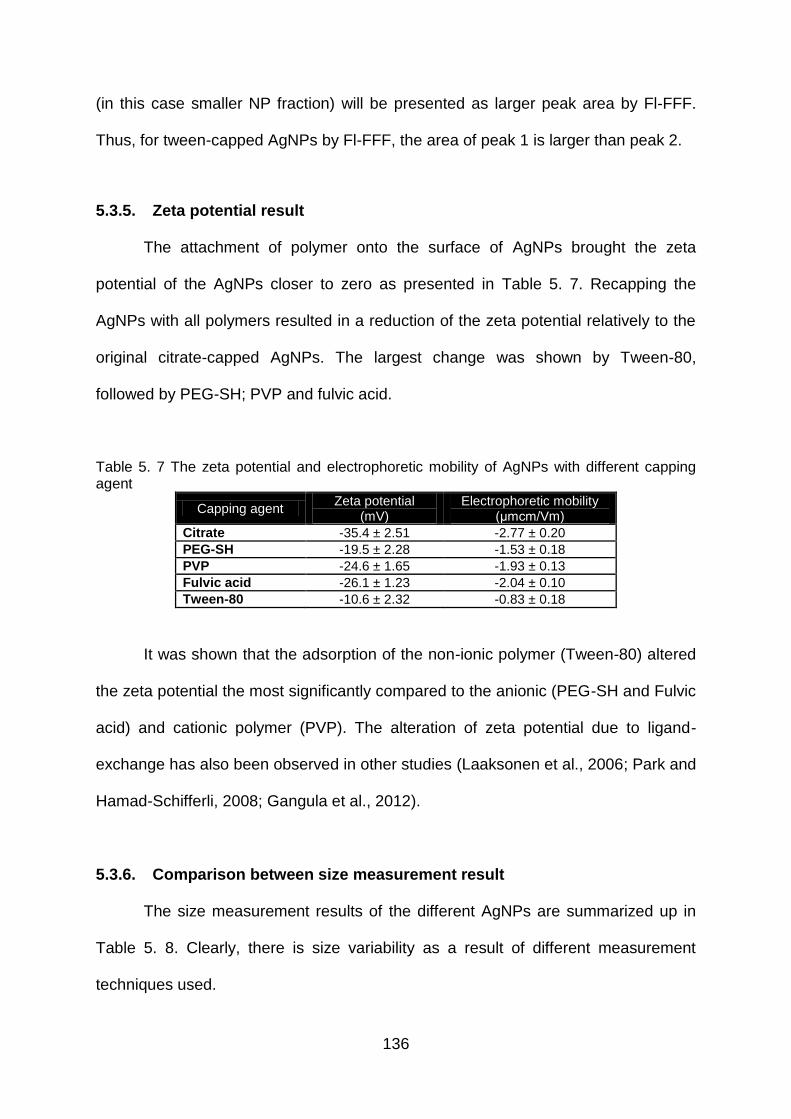
136
(in this case smaller NP fraction) will be presented as larger peak area by Fl-FFF.
Thus, for tween-capped AgNPs by Fl-FFF, the area of peak 1 is larger than peak 2.
5.3.5. Zeta potential result
The attachment of polymer onto the surface of AgNPs brought the zeta
potential of the AgNPs closer to zero as presented in Table 5. 7. Recapping the
AgNPs with all polymers resulted in a reduction of the zeta potential relatively to the
original citrate-capped AgNPs. The largest change was shown by Tween-80,
followed by PEG-SH; PVP and fulvic acid.
Table 5. 7 The zeta potential and electrophoretic mobility of AgNPs with different capping agent
Capping agent Zeta potential
(mV) Electrophoretic mobility
(μmcm/Vm)
Citrate -35.4 ± 2.51 -2.77 ± 0.20
PEG-SH -19.5 ± 2.28 -1.53 ± 0.18
PVP -24.6 ± 1.65 -1.93 ± 0.13
Fulvic acid -26.1 ± 1.23 -2.04 ± 0.10
Tween-80 -10.6 ± 2.32 -0.83 ± 0.18
It was shown that the adsorption of the non-ionic polymer (Tween-80) altered
the zeta potential the most significantly compared to the anionic (PEG-SH and Fulvic
acid) and cationic polymer (PVP). The alteration of zeta potential due to ligand-
exchange has also been observed in other studies (Laaksonen et al., 2006; Park and
Hamad-Schifferli, 2008; Gangula et al., 2012).
5.3.6. Comparison between size measurement result
The size measurement results of the different AgNPs are summarized up in
Table 5. 8. Clearly, there is size variability as a result of different measurement
techniques used.
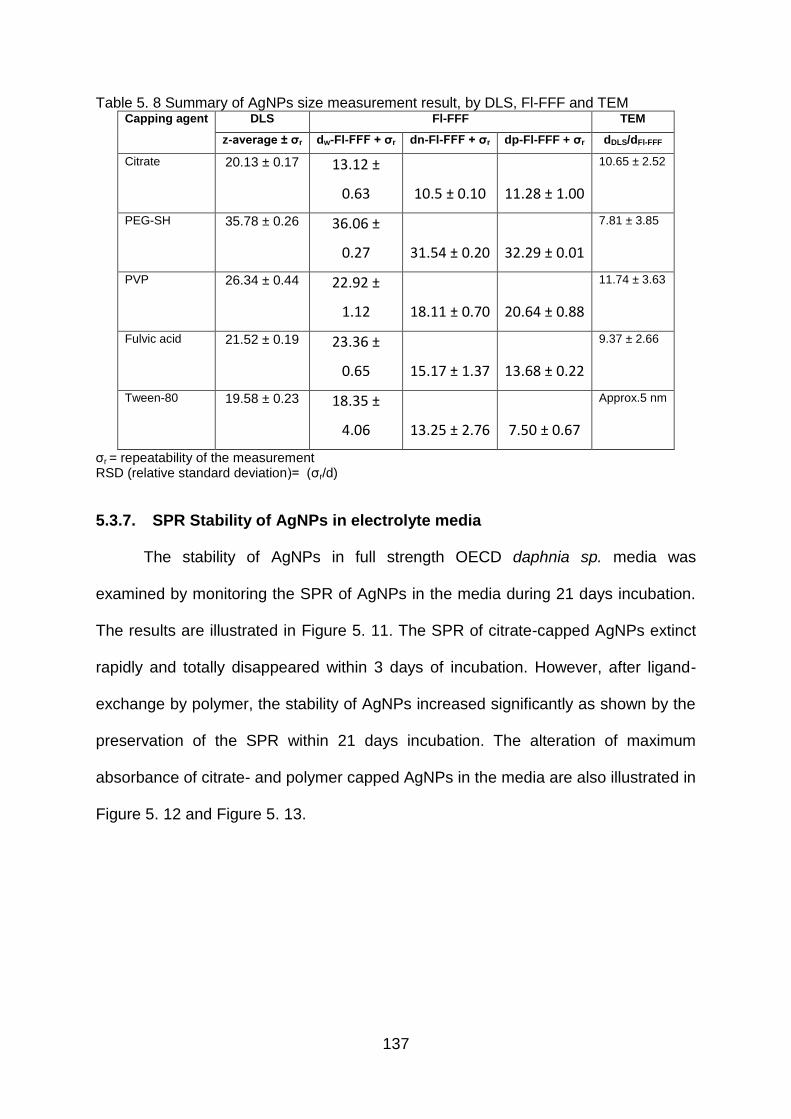
137
Table 5. 8 Summary of AgNPs size measurement result, by DLS, Fl-FFF and TEM Capping agent DLS Fl-FFF TEM
z-average ± σr dw-Fl-FFF + σr dn-Fl-FFF + σr dp-Fl-FFF + σr dDLS/dFl-FFF
Citrate 20.13 ± 0.17 13.12 ±
0.63 10.5 ± 0.10 11.28 ± 1.00
10.65 ± 2.52
PEG-SH 35.78 ± 0.26 36.06 ±
0.27 31.54 ± 0.20 32.29 ± 0.01
7.81 ± 3.85
PVP 26.34 ± 0.44 22.92 ±
1.12 18.11 ± 0.70 20.64 ± 0.88
11.74 ± 3.63
Fulvic acid 21.52 ± 0.19 23.36 ±
0.65 15.17 ± 1.37 13.68 ± 0.22
9.37 ± 2.66
Tween-80 19.58 ± 0.23 18.35 ±
4.06 13.25 ± 2.76 7.50 ± 0.67
Approx.5 nm
ζr = repeatability of the measurement RSD (relative standard deviation)= (ζr/d)
5.3.7. SPR Stability of AgNPs in electrolyte media
The stability of AgNPs in full strength OECD daphnia sp. media was
examined by monitoring the SPR of AgNPs in the media during 21 days incubation.
The results are illustrated in Figure 5. 11. The SPR of citrate-capped AgNPs extinct
rapidly and totally disappeared within 3 days of incubation. However, after ligand-
exchange by polymer, the stability of AgNPs increased significantly as shown by the
preservation of the SPR within 21 days incubation. The alteration of maximum
absorbance of citrate- and polymer capped AgNPs in the media are also illustrated in
Figure 5. 12 and Figure 5. 13.
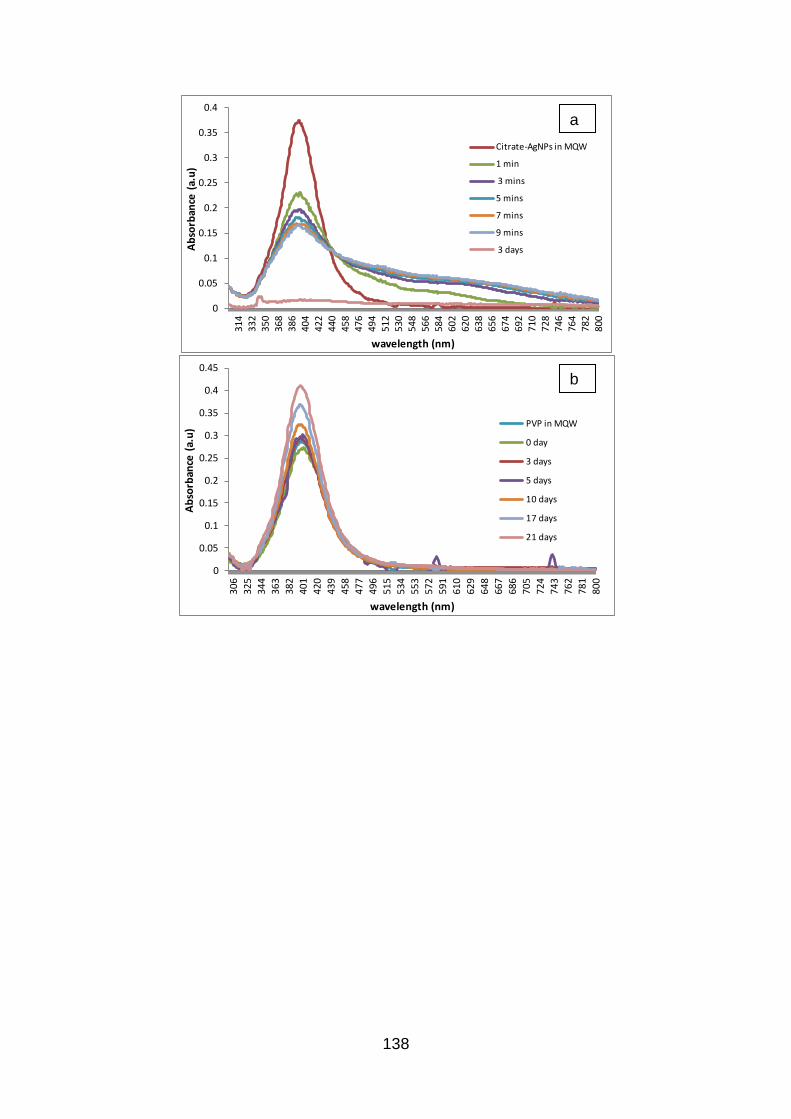
138
0
0.05
0.1
0.15
0.2
0.25
0.3
0.35
0.4
800
782
764
746
728
710
692
674
656
638
620
602
584
566
548
530
512
494
476
458
440
422
404
386
368
350
332
314
Ab
sorb
ance
(a.
u)
wavelength (nm)
Citrate-AgNPs in MQW
1 min
3 mins
5 mins
7 mins
9 mins
3 days
0
0.05
0.1
0.15
0.2
0.25
0.3
0.35
0.4
0.45
800
781
762
743
724
705
686
667
648
629
610
591
572
553
534
515
496
477
458
439
420
401
382
363
344
325
306
Ab
sorb
ance
(a.
u)
wavelength (nm)
PVP in MQW
0 day
3 days
5 days
10 days
17 days
21 days
a
b
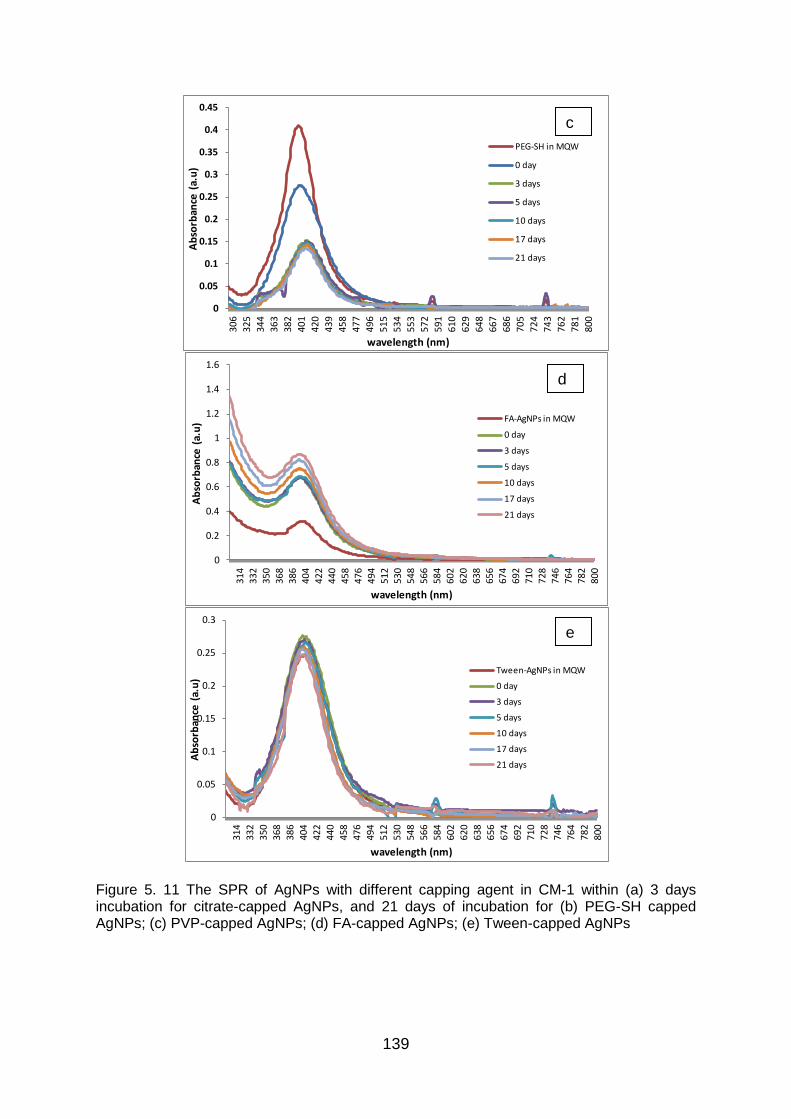
139
Figure 5. 11 The SPR of AgNPs with different capping agent in CM-1 within (a) 3 days incubation for citrate-capped AgNPs, and 21 days of incubation for (b) PEG-SH capped AgNPs; (c) PVP-capped AgNPs; (d) FA-capped AgNPs; (e) Tween-capped AgNPs
0
0.05
0.1
0.15
0.2
0.25
0.3
0.35
0.4
0.45
80
0
78
1
76
2
74
3
72
4
70
5
68
6
66
7
64
8
62
9
61
0
59
1
57
2
55
3
53
4
51
5
49
6
47
7
45
8
43
9
42
0
40
1
38
2
36
3
34
4
32
5
30
6
Ab
sorb
ance
(a.
u)
wavelength (nm)
PEG-SH in MQW
0 day
3 days
5 days
10 days
17 days
21 days
0
0.2
0.4
0.6
0.8
1
1.2
1.4
1.6
80
07
82
76
47
46
72
87
10
69
26
74
65
66
38
62
06
02
58
45
66
54
85
30
51
24
94
47
64
58
44
04
22
40
43
86
36
83
50
33
23
14
Ab
sorb
ance
(a.
u)
wavelength (nm)
FA-AgNPs in MQW
0 day
3 days
5 days
10 days
17 days
21 days
0
0.05
0.1
0.15
0.2
0.25
0.3
800
782
764
746
728
710
692
674
656
638
620
602
584
566
548
530
512
494
476
458
440
422
404
386
368
350
332
314
Ab
sorb
ance
(a.
u)
wavelength (nm)
Tween-AgNPs in MQW
0 day
3 days
5 days
10 days
17 days
21 days
c
d
e
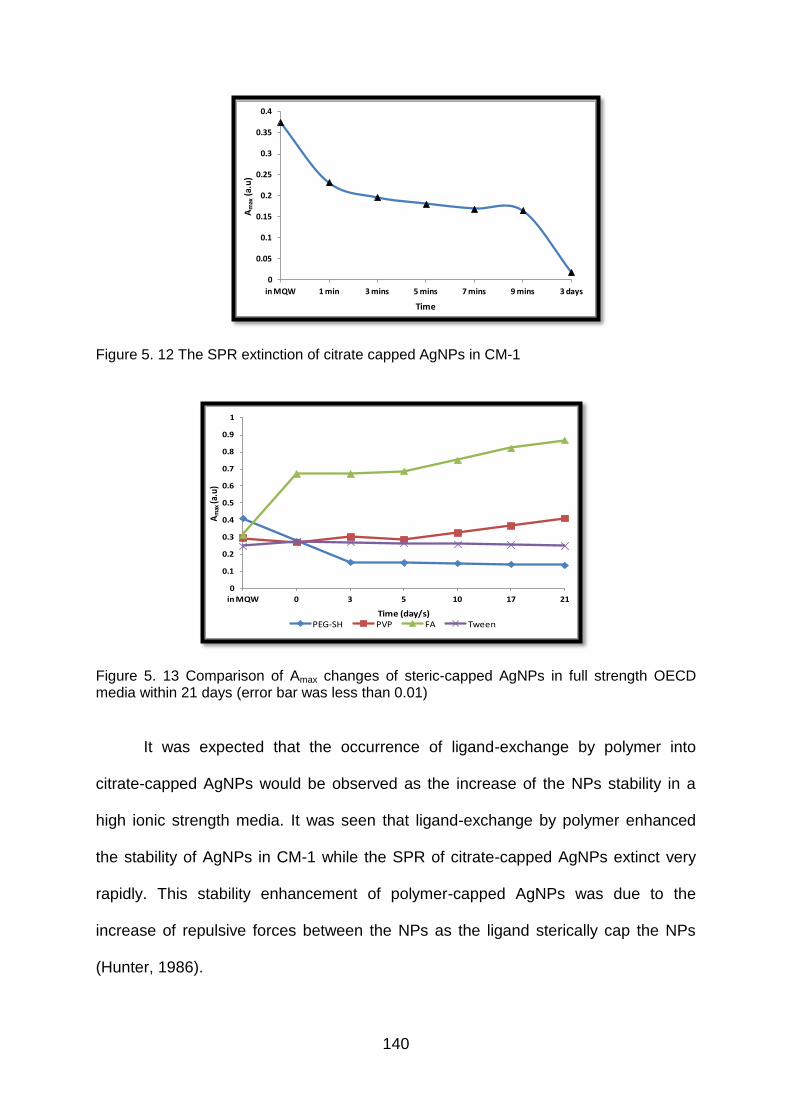
140
Figure 5. 12 The SPR extinction of citrate capped AgNPs in CM-1
Figure 5. 13 Comparison of Amax changes of steric-capped AgNPs in full strength OECD media within 21 days (error bar was less than 0.01)
It was expected that the occurrence of ligand-exchange by polymer into
citrate-capped AgNPs would be observed as the increase of the NPs stability in a
high ionic strength media. It was seen that ligand-exchange by polymer enhanced
the stability of AgNPs in CM-1 while the SPR of citrate-capped AgNPs extinct very
rapidly. This stability enhancement of polymer-capped AgNPs was due to the
increase of repulsive forces between the NPs as the ligand sterically cap the NPs
(Hunter, 1986).
0
0.05
0.1
0.15
0.2
0.25
0.3
0.35
0.4
in MQW 1 min 3 mins 5 mins 7 mins 9 mins 3 days
Am
ax(a
.u)
Time
0
0.1
0.2
0.3
0.4
0.5
0.6
0.7
0.8
0.9
1
in MQW 0 3 5 10 17 21
Am
ax (a
.u)
Time (day/s)PEG-SH PVP FA Tween
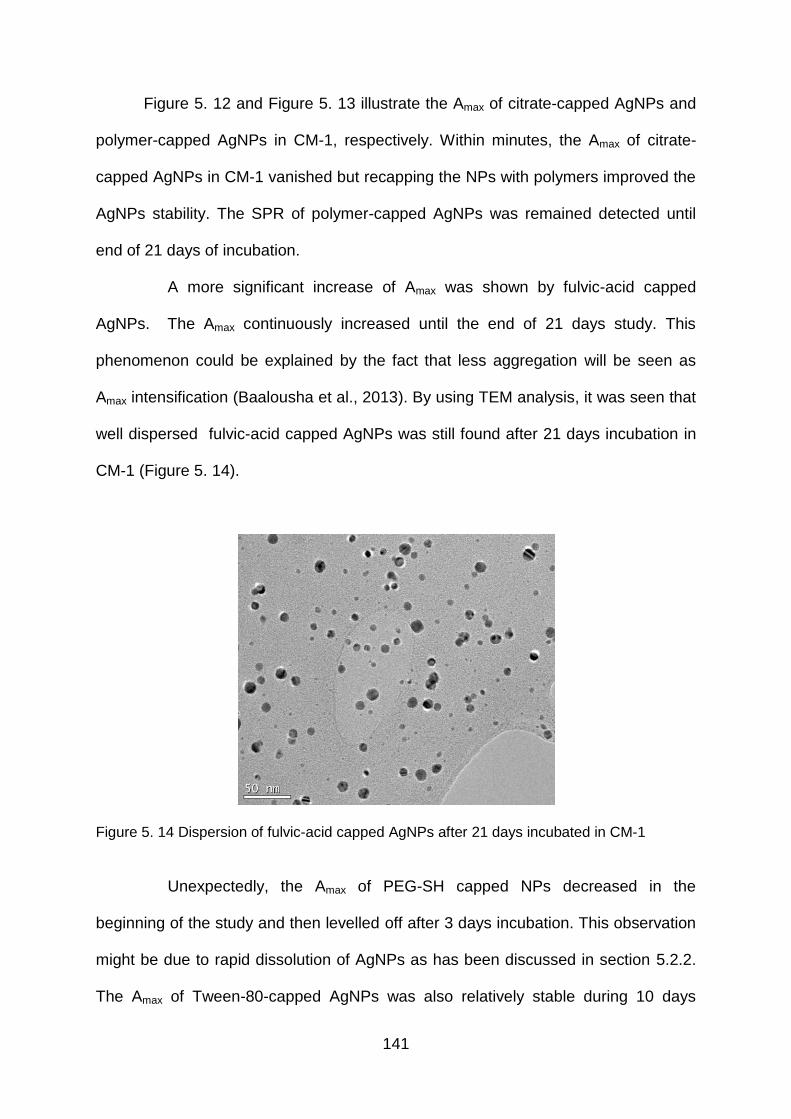
141
Figure 5. 12 and Figure 5. 13 illustrate the Amax of citrate-capped AgNPs and
polymer-capped AgNPs in CM-1, respectively. Within minutes, the Amax of citrate-
capped AgNPs in CM-1 vanished but recapping the NPs with polymers improved the
AgNPs stability. The SPR of polymer-capped AgNPs was remained detected until
end of 21 days of incubation.
A more significant increase of Amax was shown by fulvic-acid capped
AgNPs. The Amax continuously increased until the end of 21 days study. This
phenomenon could be explained by the fact that less aggregation will be seen as
Amax intensification (Baalousha et al., 2013). By using TEM analysis, it was seen that
well dispersed fulvic-acid capped AgNPs was still found after 21 days incubation in
CM-1 (Figure 5. 14).
Figure 5. 14 Dispersion of fulvic-acid capped AgNPs after 21 days incubated in CM-1
Unexpectedly, the Amax of PEG-SH capped NPs decreased in the
beginning of the study and then levelled off after 3 days incubation. This observation
might be due to rapid dissolution of AgNPs as has been discussed in section 5.2.2.
The Amax of Tween-80-capped AgNPs was also relatively stable during 10 days
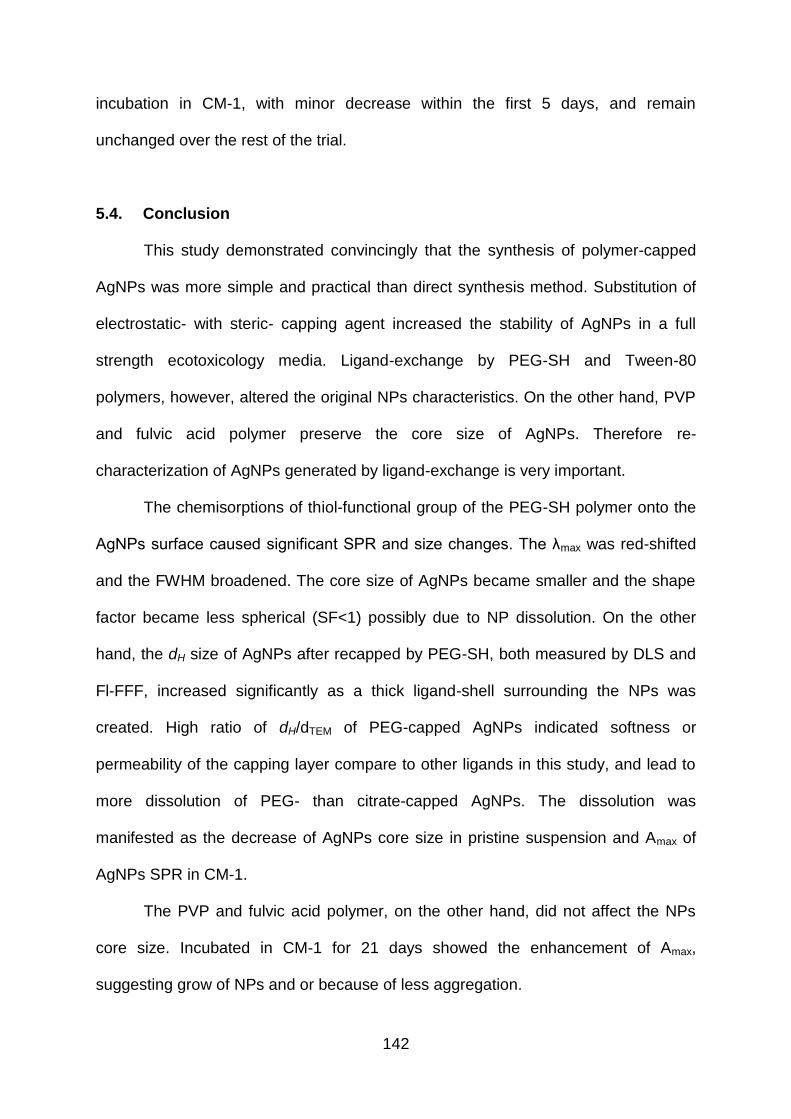
142
incubation in CM-1, with minor decrease within the first 5 days, and remain
unchanged over the rest of the trial.
5.4. Conclusion
This study demonstrated convincingly that the synthesis of polymer-capped
AgNPs was more simple and practical than direct synthesis method. Substitution of
electrostatic- with steric- capping agent increased the stability of AgNPs in a full
strength ecotoxicology media. Ligand-exchange by PEG-SH and Tween-80
polymers, however, altered the original NPs characteristics. On the other hand, PVP
and fulvic acid polymer preserve the core size of AgNPs. Therefore re-
characterization of AgNPs generated by ligand-exchange is very important.
The chemisorptions of thiol-functional group of the PEG-SH polymer onto the
AgNPs surface caused significant SPR and size changes. The λmax was red-shifted
and the FWHM broadened. The core size of AgNPs became smaller and the shape
factor became less spherical (SF<1) possibly due to NP dissolution. On the other
hand, the dH size of AgNPs after recapped by PEG-SH, both measured by DLS and
Fl-FFF, increased significantly as a thick ligand-shell surrounding the NPs was
created. High ratio of dH/dTEM of PEG-capped AgNPs indicated softness or
permeability of the capping layer compare to other ligands in this study, and lead to
more dissolution of PEG- than citrate-capped AgNPs. The dissolution was
manifested as the decrease of AgNPs core size in pristine suspension and Amax of
AgNPs SPR in CM-1.
The PVP and fulvic acid polymer, on the other hand, did not affect the NPs
core size. Incubated in CM-1 for 21 days showed the enhancement of Amax,
suggesting grow of NPs and or because of less aggregation.
143
Formation of very small particles and large aggregates at the same time, due
to tween-80 polymers capping action was another interesting finding in this study.
Dissolution and re-deposition of Ag species might responsible for the size alteration.
Multi peaks were shown by DLS and Fl-FFF size distribution corroborated the
polydispersity of tween-capped AgNPs as also shown by the highest PdI value
amongst other ligand-capped AgNPs. However, the tween polymer retained the
AgNPs stable in the CM-1.
This study also verifies that full strength nitrate media is a good indicator for
rapid examining of ligand-exchange occurence. Since the incomplete ligand-
exchange was indicated by the appearance of red colour after mixed with NM-1,
there is potential for the use of NM-1 as an indicator. Moreover it was demonstrated
that UV-Vis, TEM, DLS, Fl-FFF and zeta potential were powerful tools for ligand-
exchange analysis.
144
CHAPTER VI
STABILITY OF SILVER NANOPARTICLES IN ECOTOXICOLOGY
MEDIA
Some part of this study has been published in Tejamaya, M. (2012) Environmental
Science and Technology (ES&T) Journal, 46 (13), pp. 7011-7017 (the paper is
attached)
Chapter Summary
Establishing the dose-response relationship of NPs in any (eco)toxicology
studies is challenged by understanding of which characteristics of NPs can be
referred as the dose. Providing full characteristics of NPs in any eco(toxicology)
study thus become very important to be able to draw an association (Handy, Owen
et al., 2008; Fabrega, Luoma et al., 2011).
In this study, the behaviour of well-characterized and tightly constrained AgNPs
separately capped with one of three coatings (citrate, thiolated PEG and PVP) in
selected ecotoxicology media was examined. As has been predicted, the
characteristics of electrostatically, citrate-stabilised AgNPs was the most altered in
all of tested media due to the dependence of electrostatic double layer (EDL)
thickness into the ionic strength and media composition of the media. However
citrate-capped AgNPs showed a better stability in algae media than in Daphnia
media due to lower content of bivalent cation and Ca2+, as well as lower ionic
strength.
PEG- and PVP-capped AgNPs were more stable in all media as corroborated
by color and SPR preservation, even though the dH and PdI increased to some
145
extent. Yet, the decrease of SPR area of PEG-capped AgNPs was greater than
citrate-capped AgNPs in Algae media, potentially due to dissolution-redeposition of
NPs.
Shape transformation of citrate-capped AgNPs was found in dilution media
without chloride. PEG- and PVP-capped AgNPs also generated non-spherical shape
after incubated in concentrated media without chloride. Chloride content of the
media, therefore imparted better stability of AgNPs, potentially due to formation Ag-
Cl complex on the NPs surface. Thus, factors affecting behaviour and stability of
AgNPs in ecotoxicology media were the type of capping agent, ionic strength and
chemical composition of media.
6.1. Introduction
AgNPs are potentially toxic both to humans and the environment as has been
presented in number of review papers (Handy, Kammer et al., 2008; Klaine, Alvarez
et al., 2008; Fabrega, Luoma et al., 2011; Batley, Kirby et al., 2012; Reidy, Haase et
al., 2013). As with exposure, there are many uncertainties about mechanisms of
action, dose measurement, dose-response relationships and the physico-chemical
form of the AgNPs during and after exposure in a complex media. In particular, the
change in exposure dose and the nature of the toxicant in ecotoxicological media,
due to aggregation, dissolution, shape and surface chemistry changes, is poorly
quantified (Thomas, Judd et al., 1999; Alvarez et al., 2009; Handy et al., 2012). For
AgNPs, there is little information about changes such as aggregation, dissolution and
shape at high ionic strength and chloride concentrations relevant to such media.
Understanding both the dynamics of exposure concentration changes and the
alteration in physico-chemical properties of NPs during ecotoxicology exposure is
146
essential in the interpretation of dose-response relationships. Those changes are
likely to occur over relevant exposure periods which are poorly accounted for in the
literature to date (Auffan et al., 2009; Stone, Nowack et al., 2010). A few studies
have shown that aggregation (Shrivastava et al., 2007; Kvitek, Pana ek et al., 2008)
and dissolution(Brunner et al., 2006; Franklin, Rogers et al., 2007) of AgNPs have
occurred in toxicology media with consequent changes in bioavailability and
toxicity(Chen et al., 2010; Fabrega, Luoma et al., 2011). Systematic investigations of
temporal changes over exposure are required and changes may be influenced by
factors such as solution chemistry (Gao et al., 2009; Jin et al., 2010) and sunlight
(Cheng, Yin et al., 2011).
This study examined the influence of capping agent, ionic strength and media
composition to the AgNPs stability, in the absence of light. Three different capping
agents which are representative and have been frequently used in other studies
(Tolaymat, El Badawy et al., 2010) were utilised. They are citrate, which stabilizes
NPs by charge repulsion (Henglein and Giersig, 1999) and is weakly bound to the
core Ag; and thiolated-polyethylene glycol (PEG-SH) and polyvinyl pyrrolidone
(PVP), which sterically-stabilize nanoparticles (Huang, Ni et al., 1996; Zhang, Zhao
et al., 1996; Yoo, 1998), strongly bound to the core and potentially permeable to
solutes and solvents. Standard OECD (Organisation for Economic Co-operation and
Development) media for Daphnia. Sp (OECD/OCDE, 2004) for acute and chronic
studies, its dilution and variants by replacement of specific ions, were employed to
examine NP changes over both acute and chronic exposure timescales and under
different media chemistry. The ISO algae media or also known as Bold Basal
medium as one of media commonly used for eco(toxicology) study was also used to
examine the stability of AgNPs coated with three different capping agents.
147
6.2. Aims and Objectives
The aim of this study was to examine the behavior and stability of citrate-, PEG-
and PVP- coated AgNPs during incubation in Daphnia media for 21 days and in
algae media during 3 days (72 hours).
The objectives were:
1. To analyse behavior and stability of citrate-, PEG-, and PVP-capped AgNPs in
ecotoxicology media by evaluating the visual color preservation, size, zeta
potential and shape alteration of AgNPs during and at the end of incubation
period.
2. To evaluate the effect of capping agent to the stability of AgNPs
3. To evaluate the effect of media ionic strength to the stability of AgNPs
4. To evaluate the effect of media ionic composition to the stability of AgNPs
6.3. Methodology
The methods of NPs-media suspension preparation and characterization have
been presented in section 3.8 and 3.7, respectively. The media composition used for
this study has been presented in section 3.2.3. Briefly, OECD Daphnia media (CM)
and Algae media (AM) were used for incubation. Two OECD Daphnia modifications,
nitrate and sulphate media (NM and SM) were also used to examine the specific ion
effect into AgNPs behavior during incubation. NM and SM were prepared by
replacing the chloride content from CM media with nitrate and sulphate ion
respectively. Both full strength and ten-fold dilution media concentration were used
for testing the stability of AgNPs in CM, NM and SM, however single full
concentration of Algae media (AM) was used.
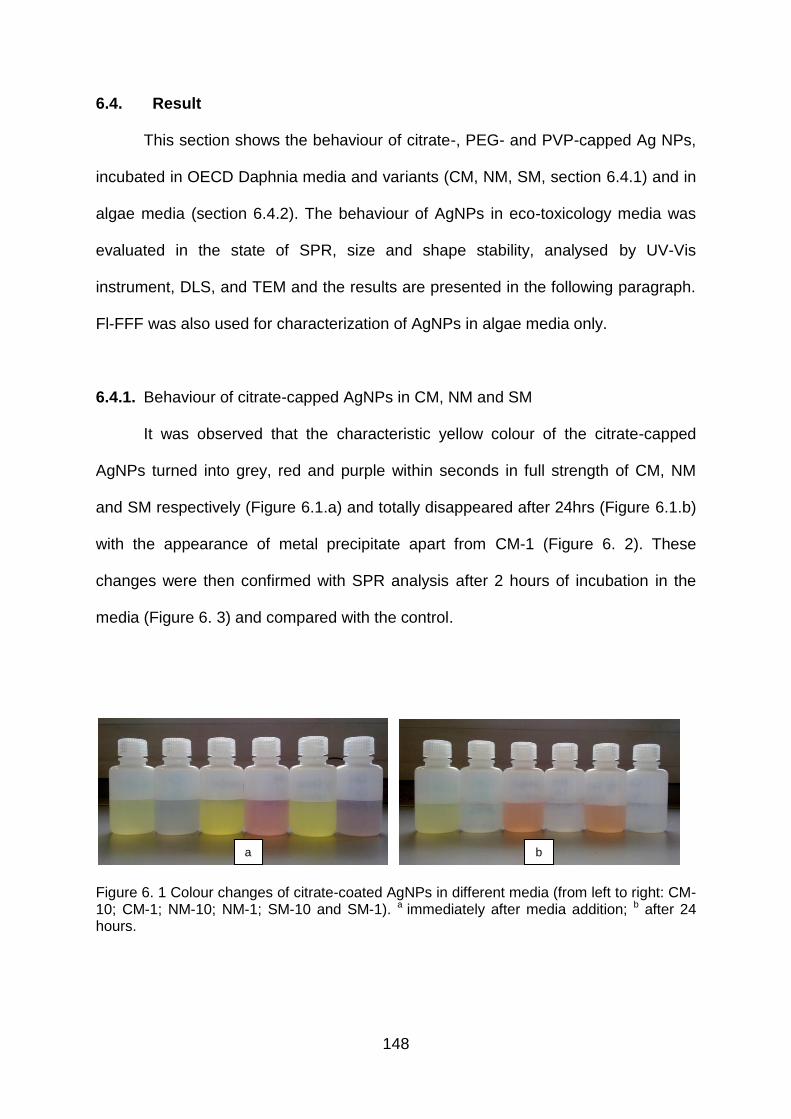
148
6.4. Result
This section shows the behaviour of citrate-, PEG- and PVP-capped Ag NPs,
incubated in OECD Daphnia media and variants (CM, NM, SM, section 6.4.1) and in
algae media (section 6.4.2). The behaviour of AgNPs in eco-toxicology media was
evaluated in the state of SPR, size and shape stability, analysed by UV-Vis
instrument, DLS, and TEM and the results are presented in the following paragraph.
Fl-FFF was also used for characterization of AgNPs in algae media only.
6.4.1. Behaviour of citrate-capped AgNPs in CM, NM and SM
It was observed that the characteristic yellow colour of the citrate-capped
AgNPs turned into grey, red and purple within seconds in full strength of CM, NM
and SM respectively (Figure 6.1.a) and totally disappeared after 24hrs (Figure 6.1.b)
with the appearance of metal precipitate apart from CM-1 (Figure 6. 2). These
changes were then confirmed with SPR analysis after 2 hours of incubation in the
media (Figure 6. 3) and compared with the control.
Figure 6. 1 Colour changes of citrate-coated AgNPs in different media (from left to right: CM-10; CM-1; NM-10; NM-1; SM-10 and SM-1). a immediately after media addition; b after 24 hours.
b a
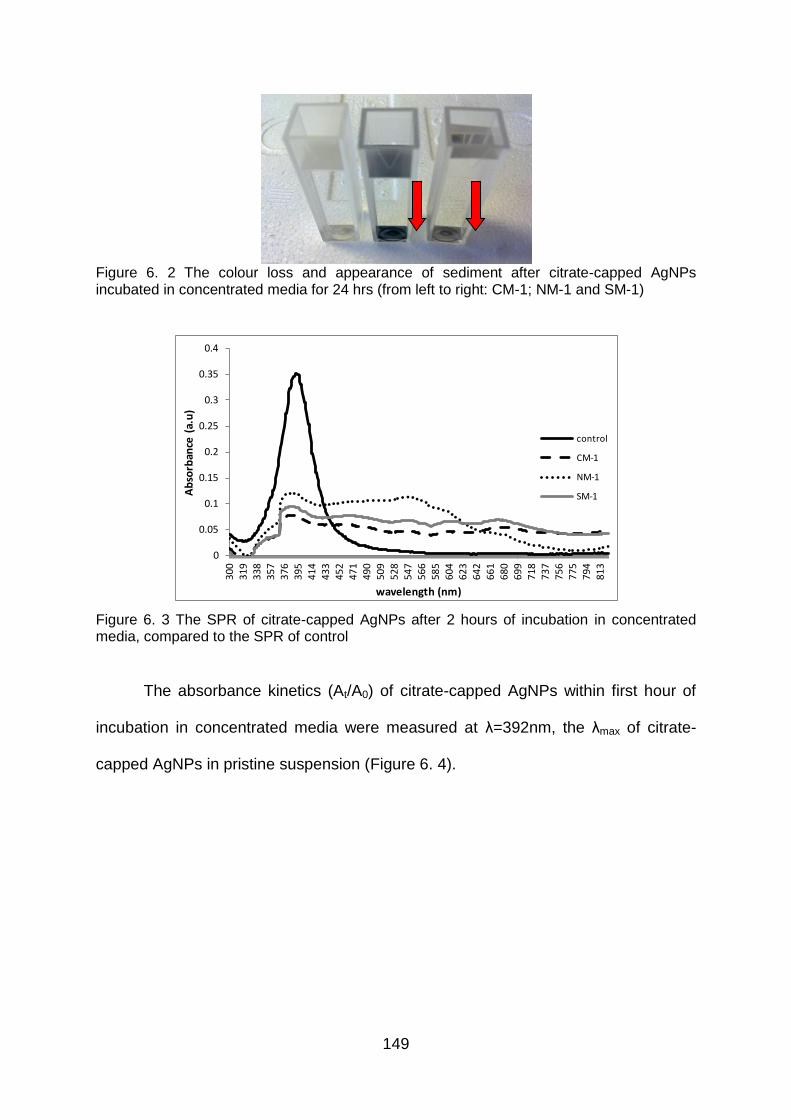
149
Figure 6. 2 The colour loss and appearance of sediment after citrate-capped AgNPs incubated in concentrated media for 24 hrs (from left to right: CM-1; NM-1 and SM-1)
Figure 6. 3 The SPR of citrate-capped AgNPs after 2 hours of incubation in concentrated media, compared to the SPR of control
The absorbance kinetics (At/A0) of citrate-capped AgNPs within first hour of
incubation in concentrated media were measured at λ=392nm, the λmax of citrate-
capped AgNPs in pristine suspension (Figure 6. 4).
0
0.05
0.1
0.15
0.2
0.25
0.3
0.35
0.4
30
03
19
33
83
57
37
63
95
41
44
33
45
24
71
49
05
09
52
85
47
56
65
85
60
46
23
64
26
61
68
06
99
71
87
37
75
67
75
79
48
13
Ab
sorb
ance
(a.
u)
wavelength (nm)
control
CM-1
NM-1
SM-1
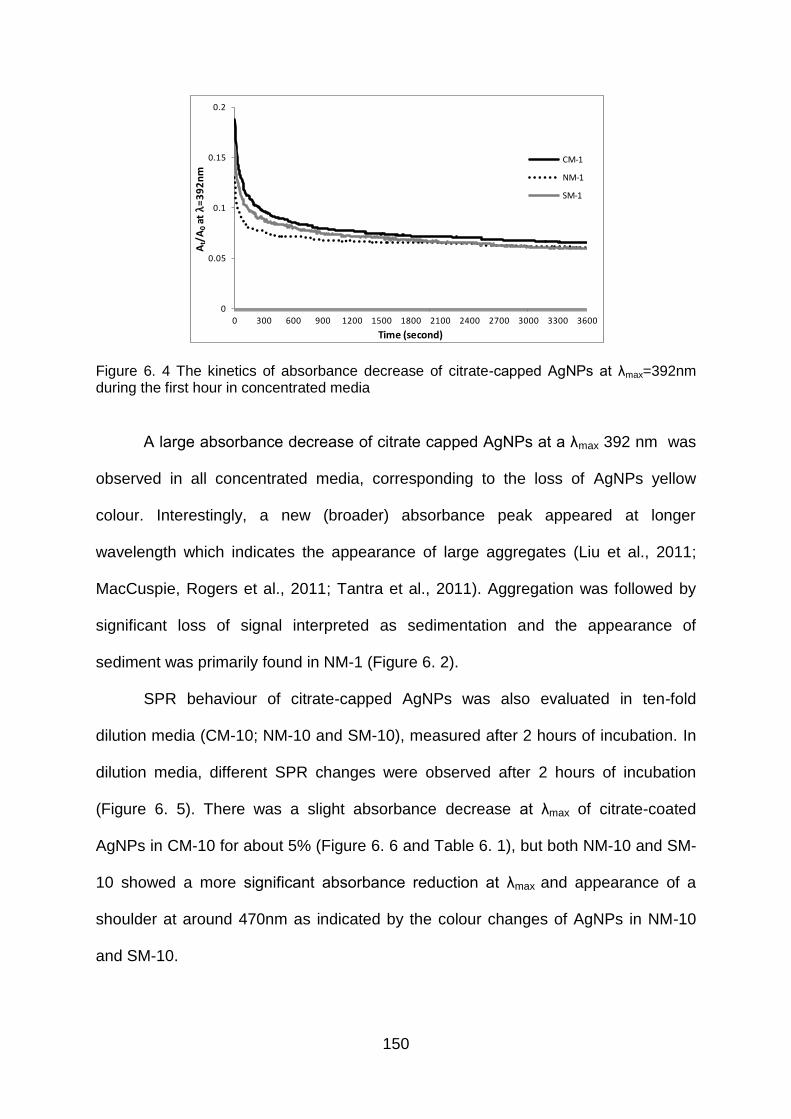
150
Figure 6. 4 The kinetics of absorbance decrease of citrate-capped AgNPs at λmax=392nm during the first hour in concentrated media
A large absorbance decrease of citrate capped AgNPs at a λmax 392 nm was
observed in all concentrated media, corresponding to the loss of AgNPs yellow
colour. Interestingly, a new (broader) absorbance peak appeared at longer
wavelength which indicates the appearance of large aggregates (Liu et al., 2011;
MacCuspie, Rogers et al., 2011; Tantra et al., 2011). Aggregation was followed by
significant loss of signal interpreted as sedimentation and the appearance of
sediment was primarily found in NM-1 (Figure 6. 2).
SPR behaviour of citrate-capped AgNPs was also evaluated in ten-fold
dilution media (CM-10; NM-10 and SM-10), measured after 2 hours of incubation. In
dilution media, different SPR changes were observed after 2 hours of incubation
(Figure 6. 5). There was a slight absorbance decrease at λmax of citrate-coated
AgNPs in CM-10 for about 5% (Figure 6. 6 and Table 6. 1), but both NM-10 and SM-
10 showed a more significant absorbance reduction at λmax and appearance of a
shoulder at around 470nm as indicated by the colour changes of AgNPs in NM-10
and SM-10.
0
0.05
0.1
0.15
0.2
0 300 600 900 1200 1500 1800 2100 2400 2700 3000 3300 3600
At/
A0
at λ
=3
92
nm
Time (second)
CM-1
NM-1
SM-1
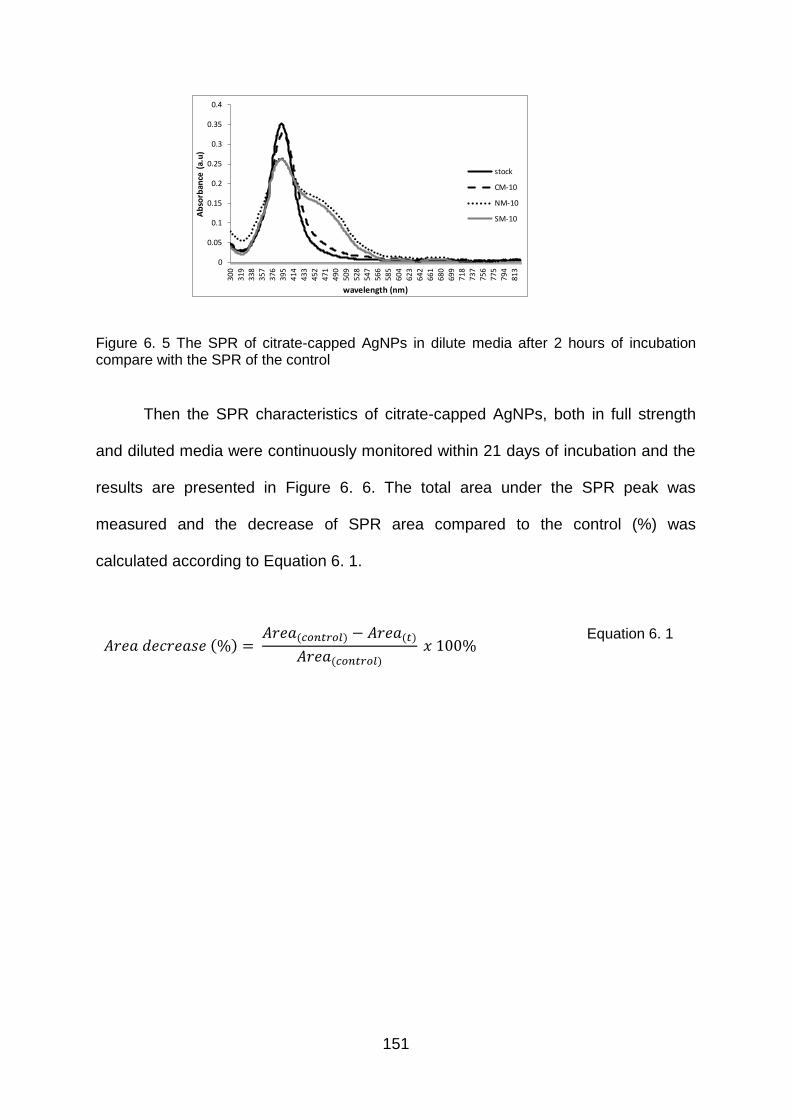
151
Figure 6. 5 The SPR of citrate-capped AgNPs in dilute media after 2 hours of incubation compare with the SPR of the control
Then the SPR characteristics of citrate-capped AgNPs, both in full strength
and diluted media were continuously monitored within 21 days of incubation and the
results are presented in Figure 6. 6. The total area under the SPR peak was
measured and the decrease of SPR area compared to the control (%) was
calculated according to Equation 6. 1.
Equation 6. 1
0
0.05
0.1
0.15
0.2
0.25
0.3
0.35
0.4
300
319
338
35
7
376
39
5
414
433
452
471
49
0
509
52
8
547
566
585
604
62
3
642
66
1
680
699
718
737
75
6
775
79
4
813
Ab
sorb
ance
(a.
u)
wavelength (nm)
stock
CM-10
NM-10
SM-10
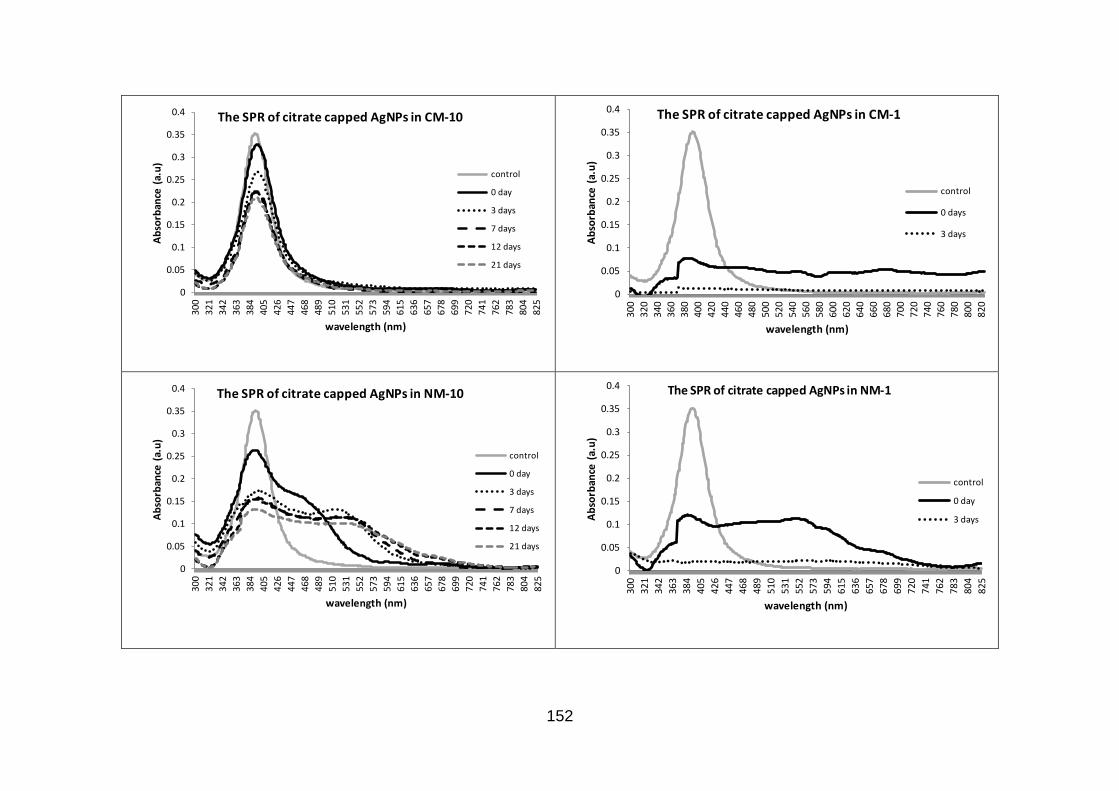
152
0
0.05
0.1
0.15
0.2
0.25
0.3
0.35
0.4
300
321
342
363
384
405
426
447
468
489
510
531
552
573
594
615
636
657
678
699
720
741
762
783
804
825
Ab
sorb
ance
(a.
u)
wavelength (nm)
The SPR of citrate capped AgNPs in CM-10
control
0 day
3 days
7 days
12 days
21 days
0
0.05
0.1
0.15
0.2
0.25
0.3
0.35
0.4
300
320
340
360
380
400
420
440
460
480
500
520
540
560
580
600
620
640
660
680
700
720
740
760
780
800
820
Ab
sorb
ance
(a.
u)
wavelength (nm)
The SPR of citrate capped AgNPs in CM-1
control
0 days
3 days
0
0.05
0.1
0.15
0.2
0.25
0.3
0.35
0.4
300
321
342
363
384
405
426
447
468
489
510
531
552
573
594
615
636
657
678
699
720
741
762
783
804
825
Ab
sorb
ance
(a.
u)
wavelength (nm)
The SPR of citrate capped AgNPs in NM-10
control
0 day
3 days
7 days
12 days
21 days
0
0.05
0.1
0.15
0.2
0.25
0.3
0.35
0.4
300
321
342
363
384
405
426
447
468
489
510
531
552
573
594
615
636
657
678
699
720
741
762
783
804
825
Ab
sorb
ance
(a.
u)
wavelength (nm)
The SPR of citrate capped AgNPs in NM-1
control
0 day
3 days
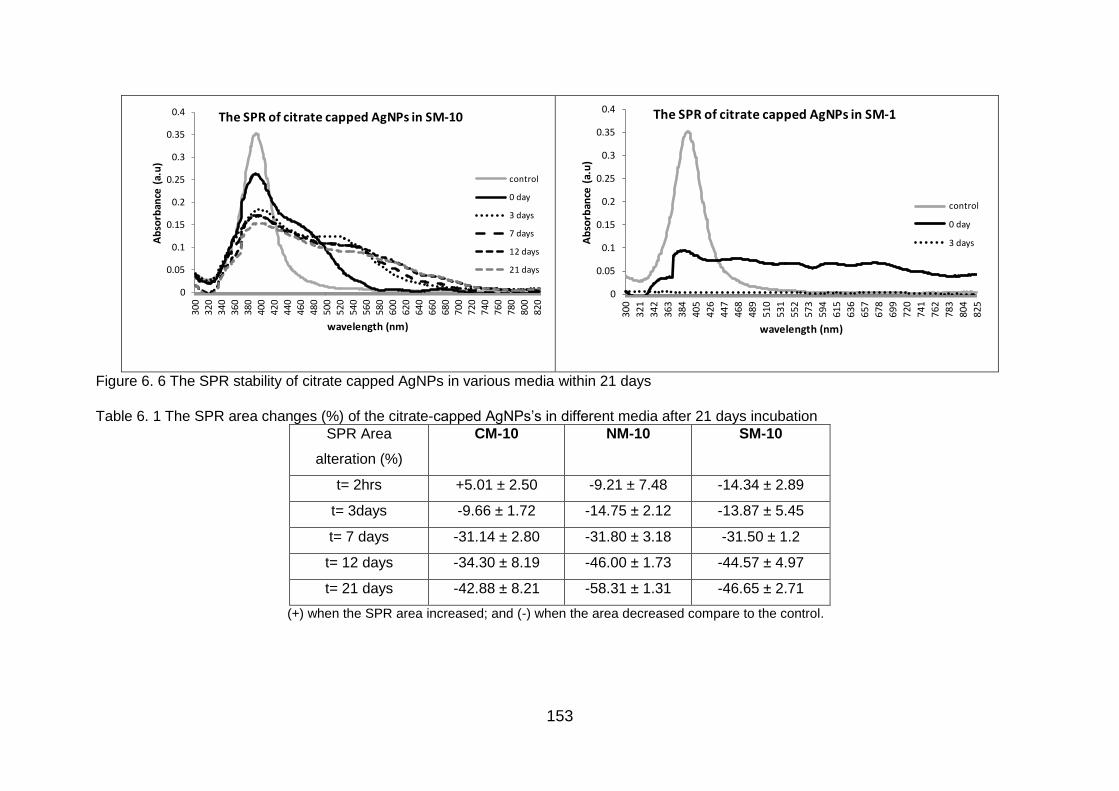
153
Figure 6. 6 The SPR stability of citrate capped AgNPs in various media within 21 days
Table 6. 1 The SPR area changes (%) of the citrate-capped AgNPs‘s in different media after 21 days incubation
SPR Area
alteration (%)
CM-10 NM-10 SM-10
t= 2hrs +5.01 ± 2.50 -9.21 ± 7.48 -14.34 ± 2.89
t= 3days -9.66 ± 1.72 -14.75 ± 2.12 -13.87 ± 5.45
t= 7 days -31.14 ± 2.80 -31.80 ± 3.18 -31.50 ± 1.2
t= 12 days -34.30 ± 8.19 -46.00 ± 1.73 -44.57 ± 4.97
t= 21 days -42.88 ± 8.21 -58.31 ± 1.31 -46.65 ± 2.71
(+) when the SPR area increased; and (-) when the area decreased compare to the control.
0
0.05
0.1
0.15
0.2
0.25
0.3
0.35
0.4
300
320
340
360
380
400
420
440
460
480
500
520
540
560
580
600
620
640
660
680
700
720
740
760
780
800
820
Ab
sorb
ance
(a.
u)
wavelength (nm)
The SPR of citrate capped AgNPs in SM-10
control
0 day
3 days
7 days
12 days
21 days
0
0.05
0.1
0.15
0.2
0.25
0.3
0.35
0.4
300
321
342
363
384
405
426
447
468
489
510
531
552
573
594
615
636
657
678
699
720
741
762
783
804
825
Ab
sorb
ance
(a.
u)
wavelength (nm)
The SPR of citrate capped AgNPs in SM-1
control
0 day
3 days
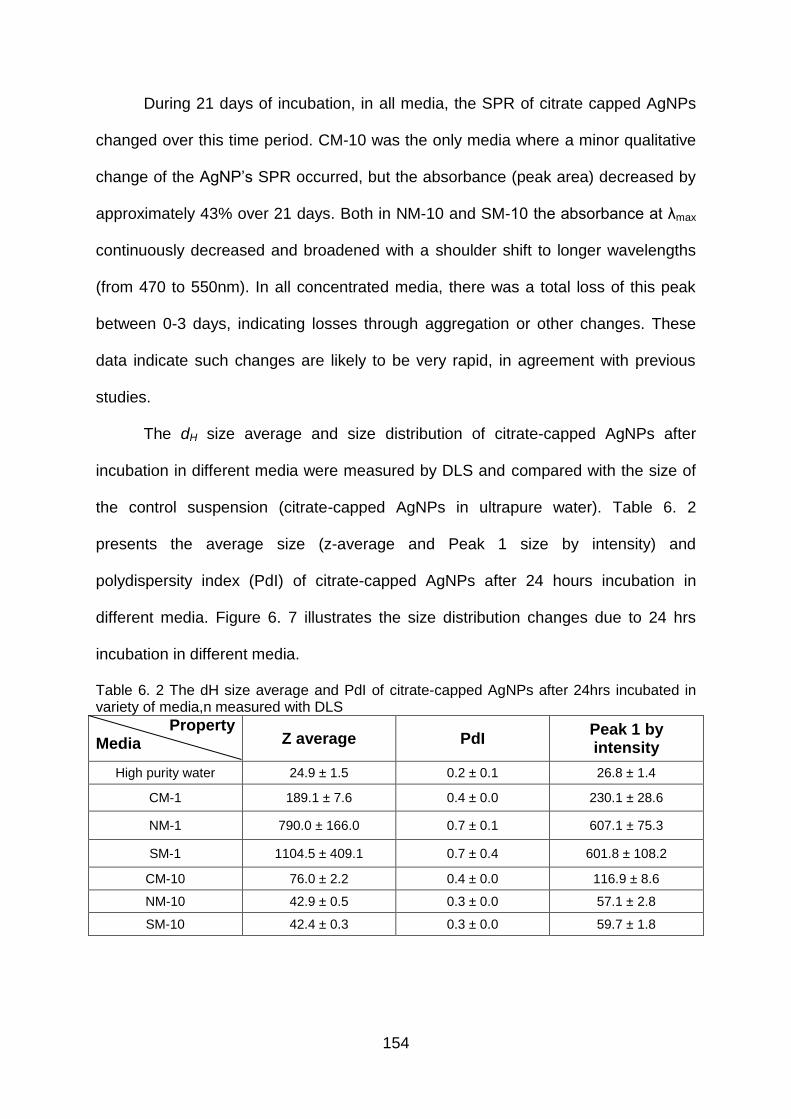
154
During 21 days of incubation, in all media, the SPR of citrate capped AgNPs
changed over this time period. CM-10 was the only media where a minor qualitative
change of the AgNP‘s SPR occurred, but the absorbance (peak area) decreased by
approximately 43% over 21 days. Both in NM-10 and SM-10 the absorbance at λmax
continuously decreased and broadened with a shoulder shift to longer wavelengths
(from 470 to 550nm). In all concentrated media, there was a total loss of this peak
between 0-3 days, indicating losses through aggregation or other changes. These
data indicate such changes are likely to be very rapid, in agreement with previous
studies.
The dH size average and size distribution of citrate-capped AgNPs after
incubation in different media were measured by DLS and compared with the size of
the control suspension (citrate-capped AgNPs in ultrapure water). Table 6. 2
presents the average size (z-average and Peak 1 size by intensity) and
polydispersity index (PdI) of citrate-capped AgNPs after 24 hours incubation in
different media. Figure 6. 7 illustrates the size distribution changes due to 24 hrs
incubation in different media.
Table 6. 2 The dH size average and PdI of citrate-capped AgNPs after 24hrs incubated in variety of media,n measured with DLS
Property Media Z average PdI
Peak 1 by intensity
High purity water 24.9 ± 1.5 0.2 ± 0.1 26.8 ± 1.4
CM-1 189.1 ± 7.6 0.4 ± 0.0 230.1 ± 28.6
NM-1 790.0 ± 166.0 0.7 ± 0.1 607.1 ± 75.3
SM-1 1104.5 ± 409.1 0.7 ± 0.4 601.8 ± 108.2
CM-10 76.0 ± 2.2 0.4 ± 0.0 116.9 ± 8.6
NM-10 42.9 ± 0.5 0.3 ± 0.0 57.1 ± 2.8
SM-10 42.4 ± 0.3 0.3 ± 0.0 59.7 ± 1.8
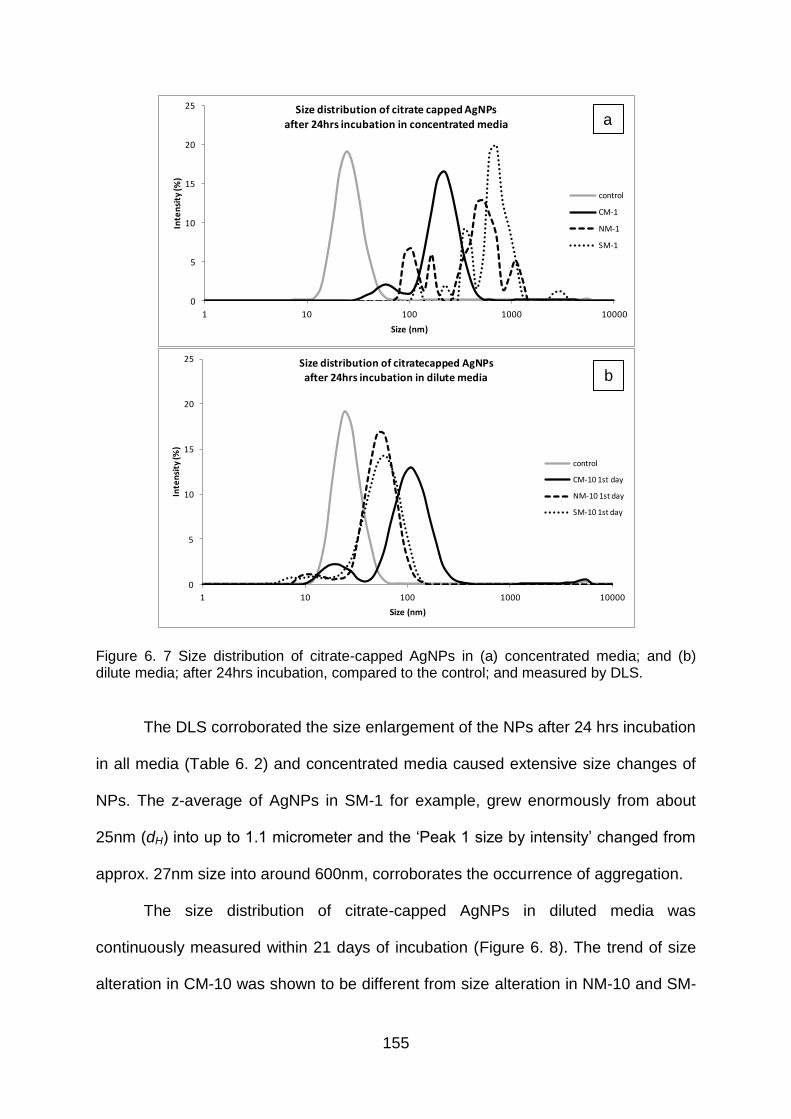
155
Figure 6. 7 Size distribution of citrate-capped AgNPs in (a) concentrated media; and (b) dilute media; after 24hrs incubation, compared to the control; and measured by DLS.
The DLS corroborated the size enlargement of the NPs after 24 hrs incubation
in all media (Table 6. 2) and concentrated media caused extensive size changes of
NPs. The z-average of AgNPs in SM-1 for example, grew enormously from about
25nm (dH) into up to 1.1 micrometer and the ‗Peak 1 size by intensity‘ changed from
approx. 27nm size into around 600nm, corroborates the occurrence of aggregation.
The size distribution of citrate-capped AgNPs in diluted media was
continuously measured within 21 days of incubation (Figure 6. 8). The trend of size
alteration in CM-10 was shown to be different from size alteration in NM-10 and SM-
0
5
10
15
20
25
1 10 100 1000 10000
Inte
nsi
ty (%
)
Size (nm)
Size distribution of citrate capped AgNPs
after 24hrs incubation in concentrated media
control
CM-1
NM-1
SM-1
0
5
10
15
20
25
1 10 100 1000 10000
Inte
nsi
ty (%
)
Size (nm)
Size distribution of citratecapped AgNPs
after 24hrs incubation in dilute media
control
CM-10 1st day
NM-10 1st day
SM-10 1st day
a
b
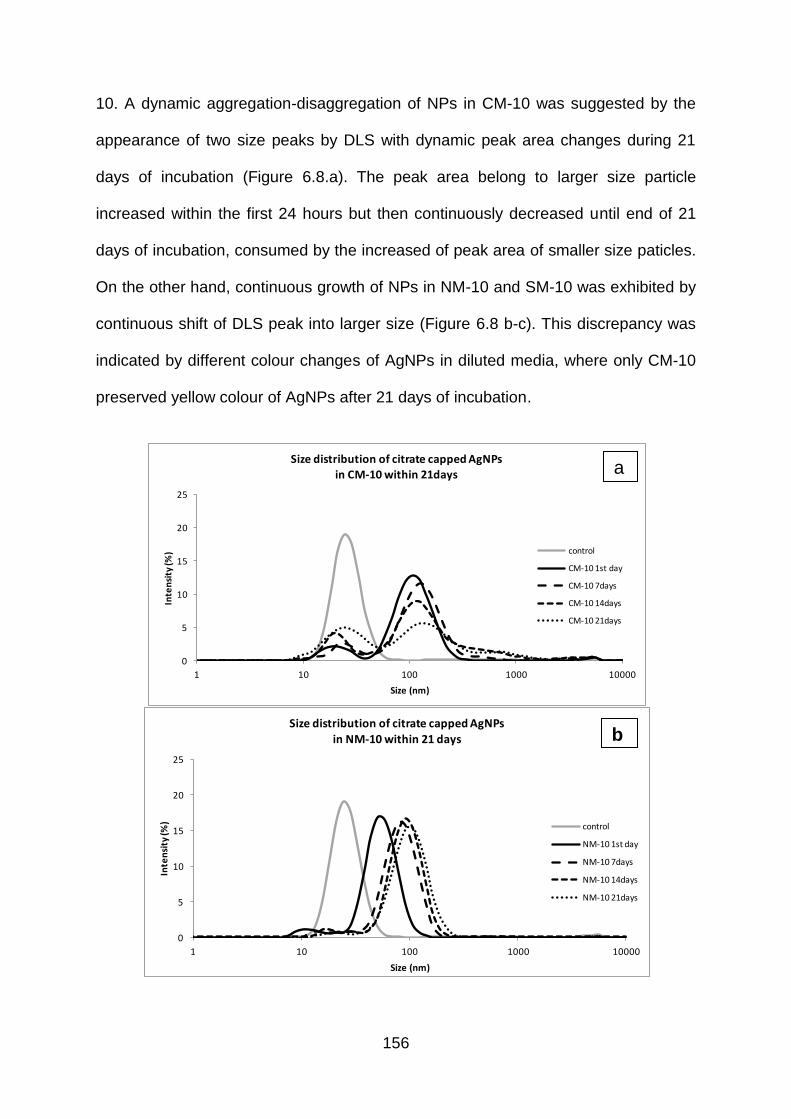
156
10. A dynamic aggregation-disaggregation of NPs in CM-10 was suggested by the
appearance of two size peaks by DLS with dynamic peak area changes during 21
days of incubation (Figure 6.8.a). The peak area belong to larger size particle
increased within the first 24 hours but then continuously decreased until end of 21
days of incubation, consumed by the increased of peak area of smaller size paticles.
On the other hand, continuous growth of NPs in NM-10 and SM-10 was exhibited by
continuous shift of DLS peak into larger size (Figure 6.8 b-c). This discrepancy was
indicated by different colour changes of AgNPs in diluted media, where only CM-10
preserved yellow colour of AgNPs after 21 days of incubation.
0
5
10
15
20
25
1 10 100 1000 10000
Inte
nsi
ty (%
)
Size (nm)
Size distribution of citrate capped AgNPs
in CM-10 within 21days
control
CM-10 1st day
CM-10 7days
CM-10 14days
CM-10 21days
0
5
10
15
20
25
1 10 100 1000 10000
Inte
nsi
ty (%
)
Size (nm)
Size distribution of citrate capped AgNPs
in NM-10 within 21 days
control
NM-10 1st day
NM-10 7days
NM-10 14days
NM-10 21days
a
b
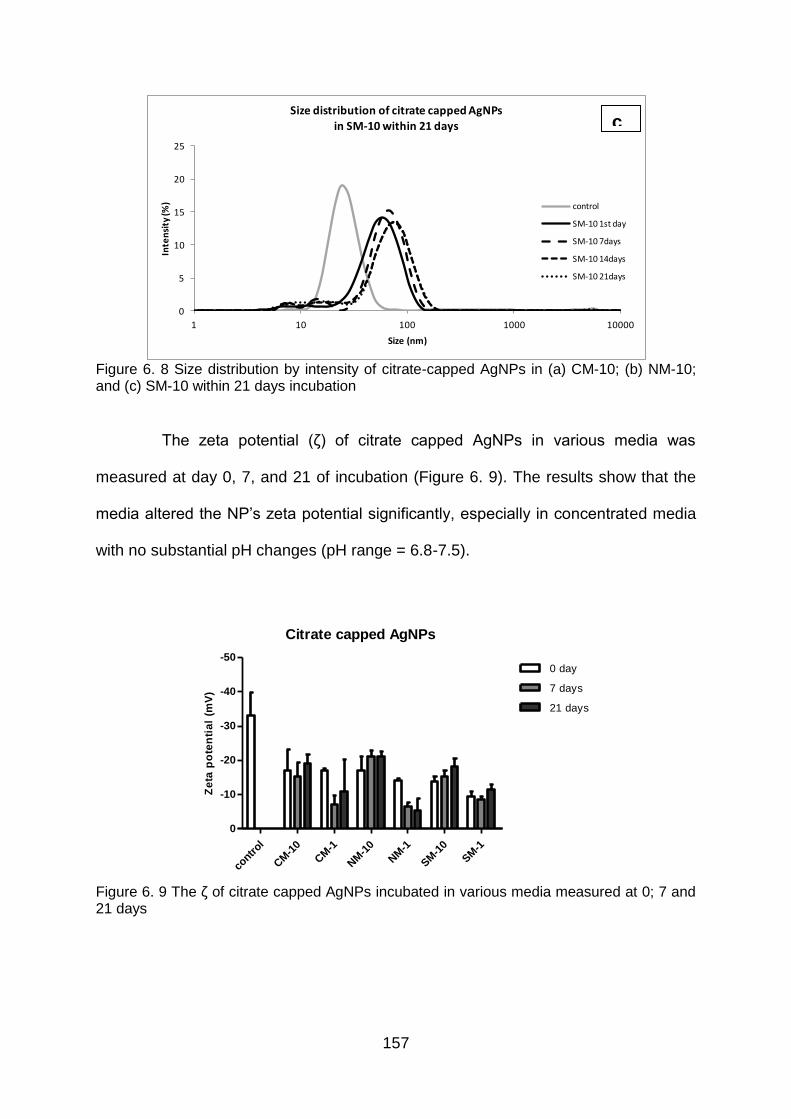
157
Figure 6. 8 Size distribution by intensity of citrate-capped AgNPs in (a) CM-10; (b) NM-10; and (c) SM-10 within 21 days incubation
The zeta potential (ζ) of citrate capped AgNPs in various media was
measured at day 0, 7, and 21 of incubation (Figure 6. 9). The results show that the
media altered the NP‘s zeta potential significantly, especially in concentrated media
with no substantial pH changes (pH range = 6.8-7.5).
Citrate capped AgNPs
contr
ol
CM
-10
CM
-1
NM
-10
NM
-1
SM
-10
SM
-1
-50
-40
-30
-20
-10
0
0 day
7 days
21 days
Ze
ta p
ote
nti
al
(mV
)
Figure 6. 9 The ζ of citrate capped AgNPs incubated in various media measured at 0; 7 and 21 days
0
5
10
15
20
25
1 10 100 1000 10000
Inte
nsi
ty (%
)
Size (nm)
Size distribution of citrate capped AgNPs
in SM-10 within 21 days
control
SM-10 1st day
SM-10 7days
SM-10 14days
SM-10 21days
c
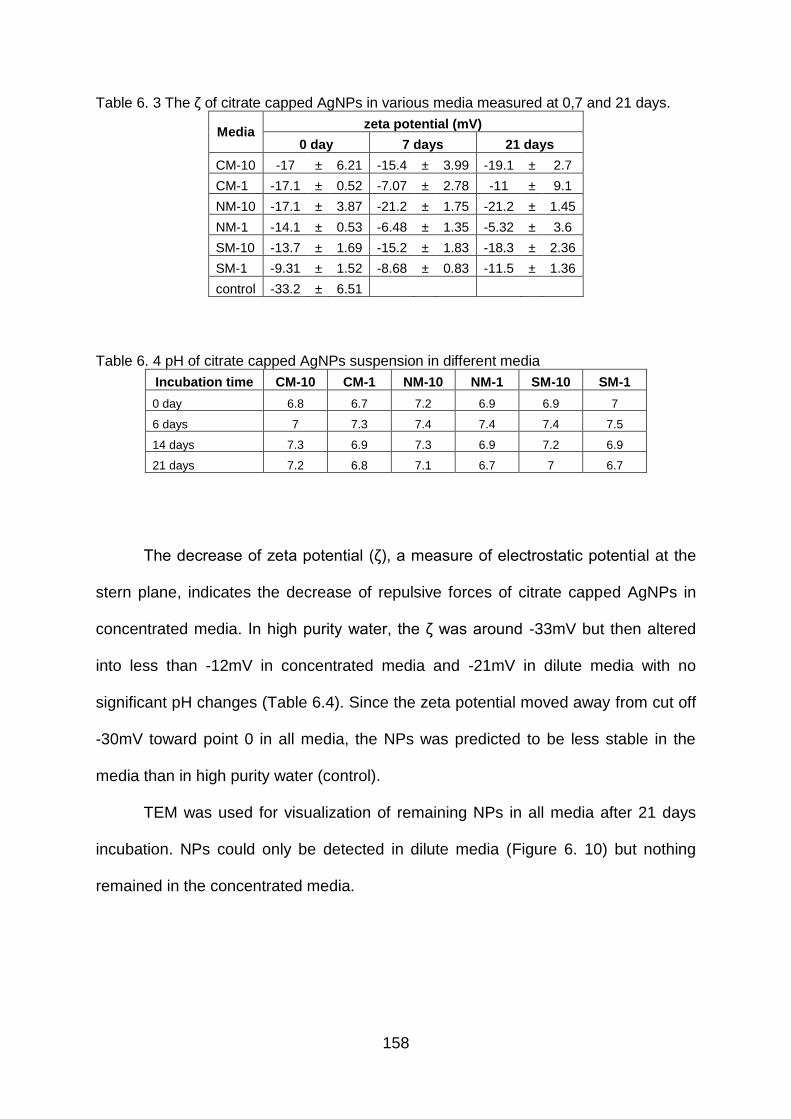
158
Table 6. 3 The ζ of citrate capped AgNPs in various media measured at 0,7 and 21 days.
Media zeta potential (mV)
0 day 7 days 21 days
CM-10 -17 ± 6.21 -15.4 ± 3.99 -19.1 ± 2.7
CM-1 -17.1 ± 0.52 -7.07 ± 2.78 -11 ± 9.1
NM-10 -17.1 ± 3.87 -21.2 ± 1.75 -21.2 ± 1.45
NM-1 -14.1 ± 0.53 -6.48 ± 1.35 -5.32 ± 3.6
SM-10 -13.7 ± 1.69 -15.2 ± 1.83 -18.3 ± 2.36
SM-1 -9.31 ± 1.52 -8.68 ± 0.83 -11.5 ± 1.36
control -33.2 ± 6.51
Table 6. 4 pH of citrate capped AgNPs suspension in different media
Incubation time CM-10 CM-1 NM-10 NM-1 SM-10 SM-1
0 day 6.8 6.7 7.2 6.9 6.9 7
6 days 7 7.3 7.4 7.4 7.4 7.5
14 days 7.3 6.9 7.3 6.9 7.2 6.9
21 days 7.2 6.8 7.1 6.7 7 6.7
The decrease of zeta potential (ζ), a measure of electrostatic potential at the
stern plane, indicates the decrease of repulsive forces of citrate capped AgNPs in
concentrated media. In high purity water, the ζ was around -33mV but then altered
into less than -12mV in concentrated media and -21mV in dilute media with no
significant pH changes (Table 6.4). Since the zeta potential moved away from cut off
-30mV toward point 0 in all media, the NPs was predicted to be less stable in the
media than in high purity water (control).
TEM was used for visualization of remaining NPs in all media after 21 days
incubation. NPs could only be detected in dilute media (Figure 6. 10) but nothing
remained in the concentrated media.
159
a b
c d
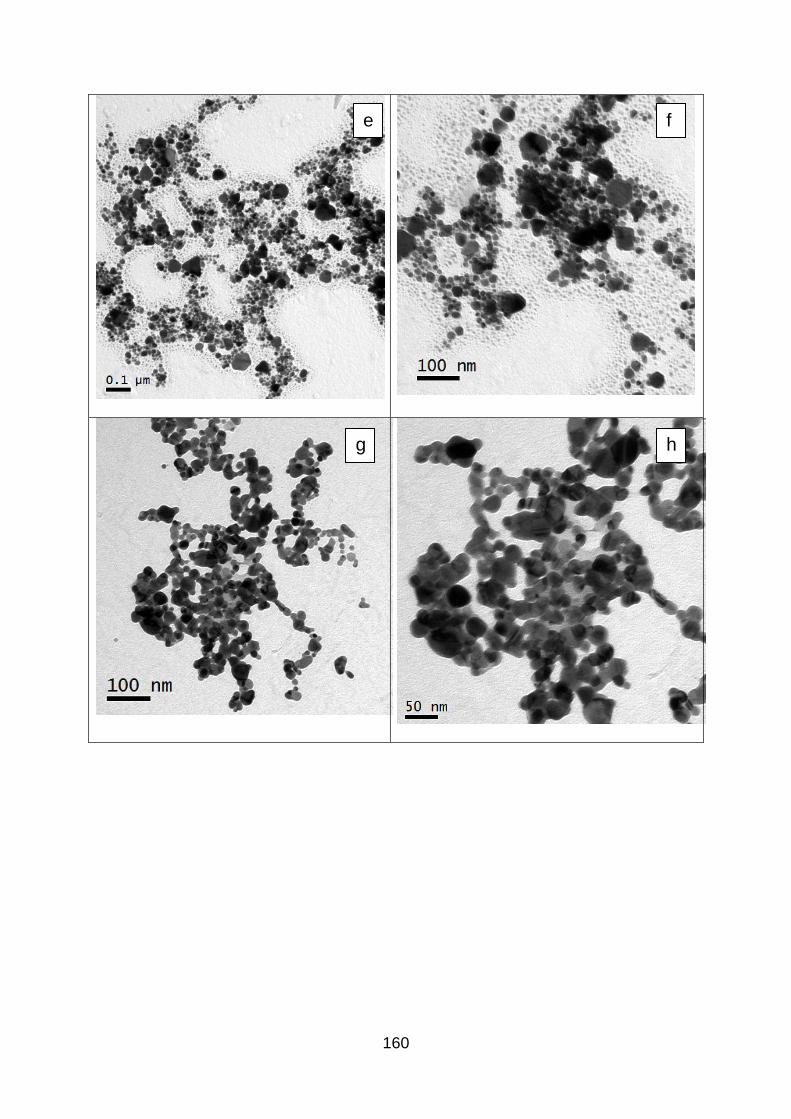
160
e f
g h
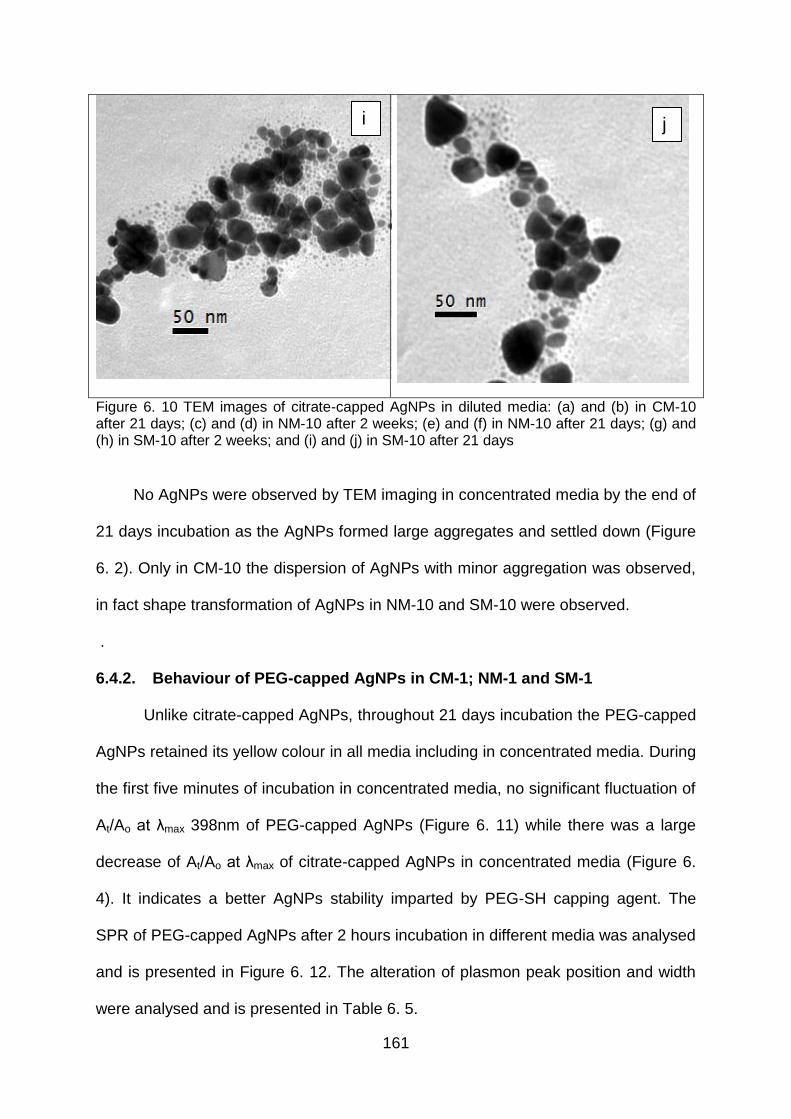
161
Figure 6. 10 TEM images of citrate-capped AgNPs in diluted media: (a) and (b) in CM-10 after 21 days; (c) and (d) in NM-10 after 2 weeks; (e) and (f) in NM-10 after 21 days; (g) and (h) in SM-10 after 2 weeks; and (i) and (j) in SM-10 after 21 days
No AgNPs were observed by TEM imaging in concentrated media by the end of
21 days incubation as the AgNPs formed large aggregates and settled down (Figure
6. 2). Only in CM-10 the dispersion of AgNPs with minor aggregation was observed,
in fact shape transformation of AgNPs in NM-10 and SM-10 were observed.
.
6.4.2. Behaviour of PEG-capped AgNPs in CM-1; NM-1 and SM-1
Unlike citrate-capped AgNPs, throughout 21 days incubation the PEG-capped
AgNPs retained its yellow colour in all media including in concentrated media. During
the first five minutes of incubation in concentrated media, no significant fluctuation of
At/Ao at λmax 398nm of PEG-capped AgNPs (Figure 6. 11) while there was a large
decrease of At/Ao at λmax of citrate-capped AgNPs in concentrated media (Figure 6.
4). It indicates a better AgNPs stability imparted by PEG-SH capping agent. The
SPR of PEG-capped AgNPs after 2 hours incubation in different media was analysed
and is presented in Figure 6. 12. The alteration of plasmon peak position and width
were analysed and is presented in Table 6. 5.
i j
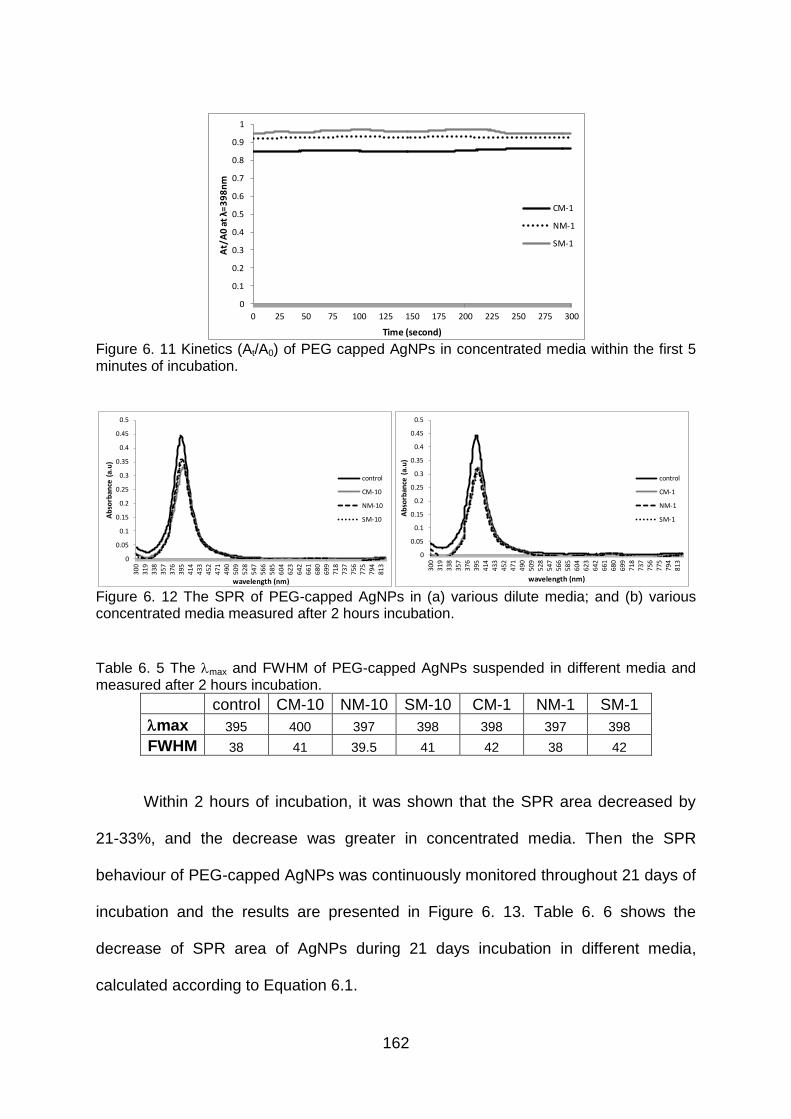
162
Figure 6. 11 Kinetics (At/A0) of PEG capped AgNPs in concentrated media within the first 5 minutes of incubation.
Figure 6. 12 The SPR of PEG-capped AgNPs in (a) various dilute media; and (b) various concentrated media measured after 2 hours incubation.
Table 6. 5 The max and FWHM of PEG-capped AgNPs suspended in different media and measured after 2 hours incubation.
control CM-10 NM-10 SM-10 CM-1 NM-1 SM-1
max 395 400 397 398 398 397 398
FWHM 38 41 39.5 41 42 38 42
Within 2 hours of incubation, it was shown that the SPR area decreased by
21-33%, and the decrease was greater in concentrated media. Then the SPR
behaviour of PEG-capped AgNPs was continuously monitored throughout 21 days of
incubation and the results are presented in Figure 6. 13. Table 6. 6 shows the
decrease of SPR area of AgNPs during 21 days incubation in different media,
calculated according to Equation 6.1.
0
0.1
0.2
0.3
0.4
0.5
0.6
0.7
0.8
0.9
1
0 25 50 75 100 125 150 175 200 225 250 275 300
At/
A0
at
λ=3
98
nm
Time (second)
CM-1
NM-1
SM-1
0
0.05
0.1
0.15
0.2
0.25
0.3
0.35
0.4
0.45
0.5
30
03
19
33
83
57
37
63
95
41
44
33
45
24
71
49
05
09
52
85
47
56
65
85
60
46
23
64
26
61
68
06
99
71
87
37
75
67
75
79
48
13
Ab
sorb
ance
(a.
u)
wavelength (nm)
control
CM-10
NM-10
SM-10
0
0.05
0.1
0.15
0.2
0.25
0.3
0.35
0.4
0.45
0.5
30
03
19
33
83
57
37
63
95
41
44
33
45
24
71
49
0
50
95
28
54
75
66
58
56
04
62
36
42
66
16
80
69
97
18
73
77
56
77
57
94
81
3
Ab
sorb
ance
(a.
u)
wavelength (nm)
control
CM-1
NM-1
SM-1
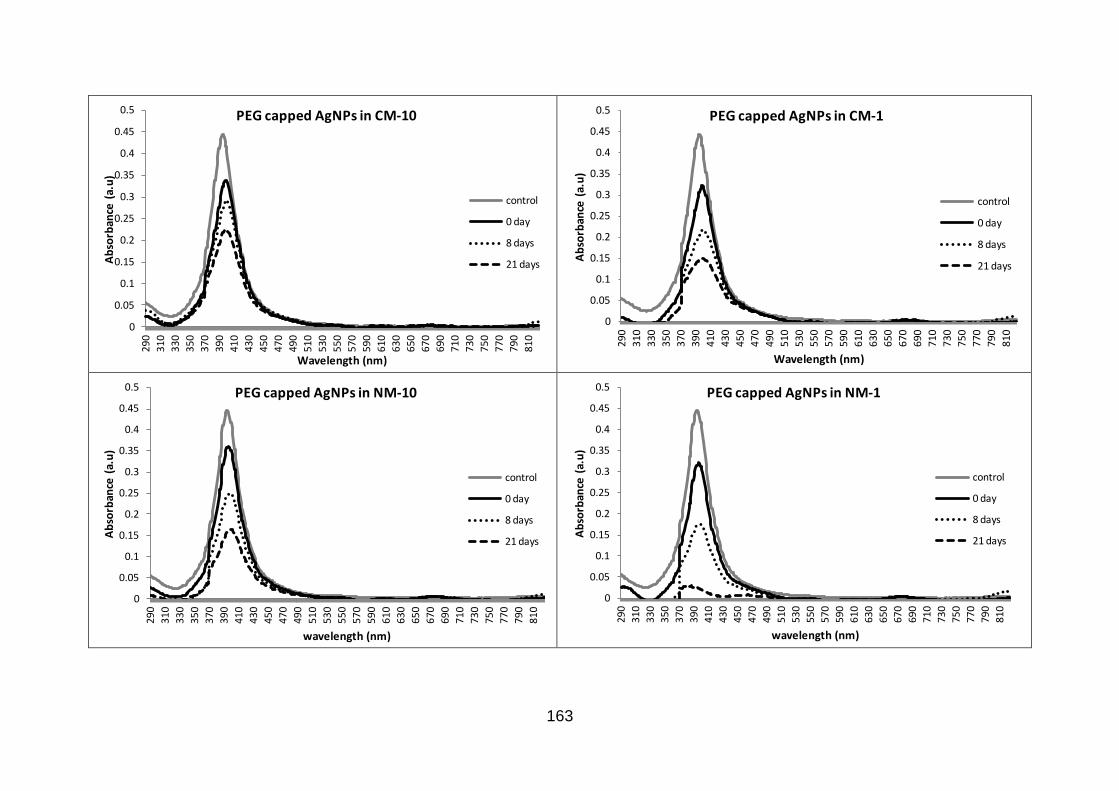
163
0
0.05
0.1
0.15
0.2
0.25
0.3
0.35
0.4
0.45
0.5
290
31
0
330
350
370
390
41
0
430
450
47
0
490
510
53
0
550
570
59
0
610
630
650
670
69
0
710
730
75
0
770
790
81
0
Ab
sorb
ance
(a.
u)
Wavelength (nm)
PEG capped AgNPs in CM-10
control
0 day
8 days
21 days
0
0.05
0.1
0.15
0.2
0.25
0.3
0.35
0.4
0.45
0.5
29
0
31
0
33
0
35
0
37
0
39
0
41
0
43
0
45
0
47
0
49
0
51
0
53
0
55
0
57
0
59
0
61
0
63
0
65
0
67
0
69
0
71
0
73
0
75
0
77
0
79
0
81
0
Ab
sorb
ance
(a.
u)
Wavelength (nm)
PEG capped AgNPs in CM-1
control
0 day
8 days
21 days
0
0.05
0.1
0.15
0.2
0.25
0.3
0.35
0.4
0.45
0.5
290
310
330
350
370
390
410
430
450
470
490
510
530
550
570
590
610
630
650
670
690
710
730
750
770
790
810
Ab
sorb
ance
(a.
u)
wavelength (nm)
PEG capped AgNPs in NM-10
control
0 day
8 days
21 days
0
0.05
0.1
0.15
0.2
0.25
0.3
0.35
0.4
0.45
0.5
290
310
330
350
370
390
410
430
450
470
490
510
530
550
570
590
610
630
650
670
690
710
730
750
770
790
810
Ab
sorb
ance
(a.
u)
wavelength (nm)
PEG capped AgNPs in NM-1
control
0 day
8 days
21 days
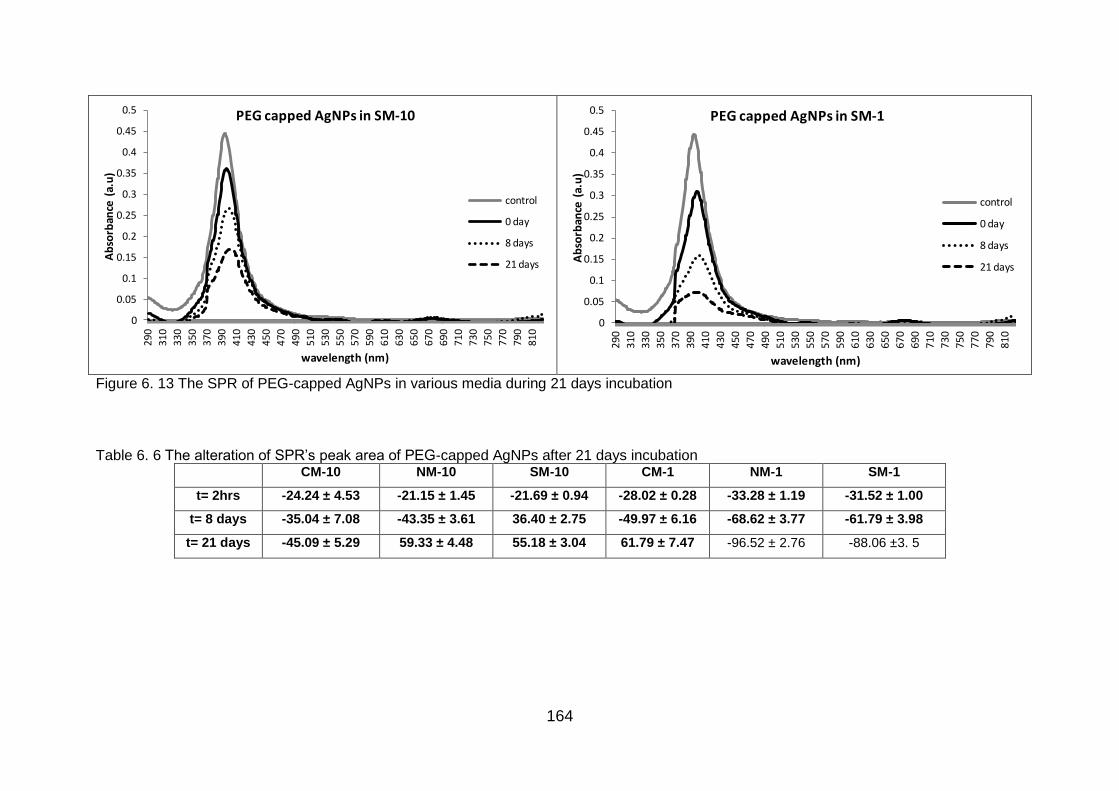
164
Figure 6. 13 The SPR of PEG-capped AgNPs in various media during 21 days incubation
Table 6. 6 The alteration of SPR‘s peak area of PEG-capped AgNPs after 21 days incubation CM-10 NM-10 SM-10 CM-1 NM-1 SM-1
t= 2hrs -24.24 ± 4.53 -21.15 ± 1.45 -21.69 ± 0.94 -28.02 ± 0.28 -33.28 ± 1.19 -31.52 ± 1.00
t= 8 days -35.04 ± 7.08 -43.35 ± 3.61 36.40 ± 2.75 -49.97 ± 6.16 -68.62 ± 3.77 -61.79 ± 3.98
t= 21 days -45.09 ± 5.29 59.33 ± 4.48 55.18 ± 3.04 61.79 ± 7.47 -96.52 ± 2.76 -88.06 ±3. 5
0
0.05
0.1
0.15
0.2
0.25
0.3
0.35
0.4
0.45
0.5
29
0
31
0
33
0
35
0
37
0
39
0
41
0
43
0
45
0
47
0
49
0
51
0
53
0
55
0
57
0
59
0
61
0
63
0
65
0
67
0
69
0
71
0
73
0
75
0
77
0
79
0
81
0
Ab
sorb
ance
(a.
u)
wavelength (nm)
PEG capped AgNPs in SM-10
control
0 day
8 days
21 days
0
0.05
0.1
0.15
0.2
0.25
0.3
0.35
0.4
0.45
0.5
29
0
31
0
33
0
35
0
37
0
39
0
41
0
43
0
45
0
47
0
49
0
51
0
53
0
55
0
57
0
59
0
61
0
63
0
65
0
67
0
69
0
71
0
73
0
75
0
77
0
79
0
81
0
Ab
sorb
ance
(a.
u)
wavelength (nm)
PEG capped AgNPs in SM-1
control
0 day
8 days
21 days
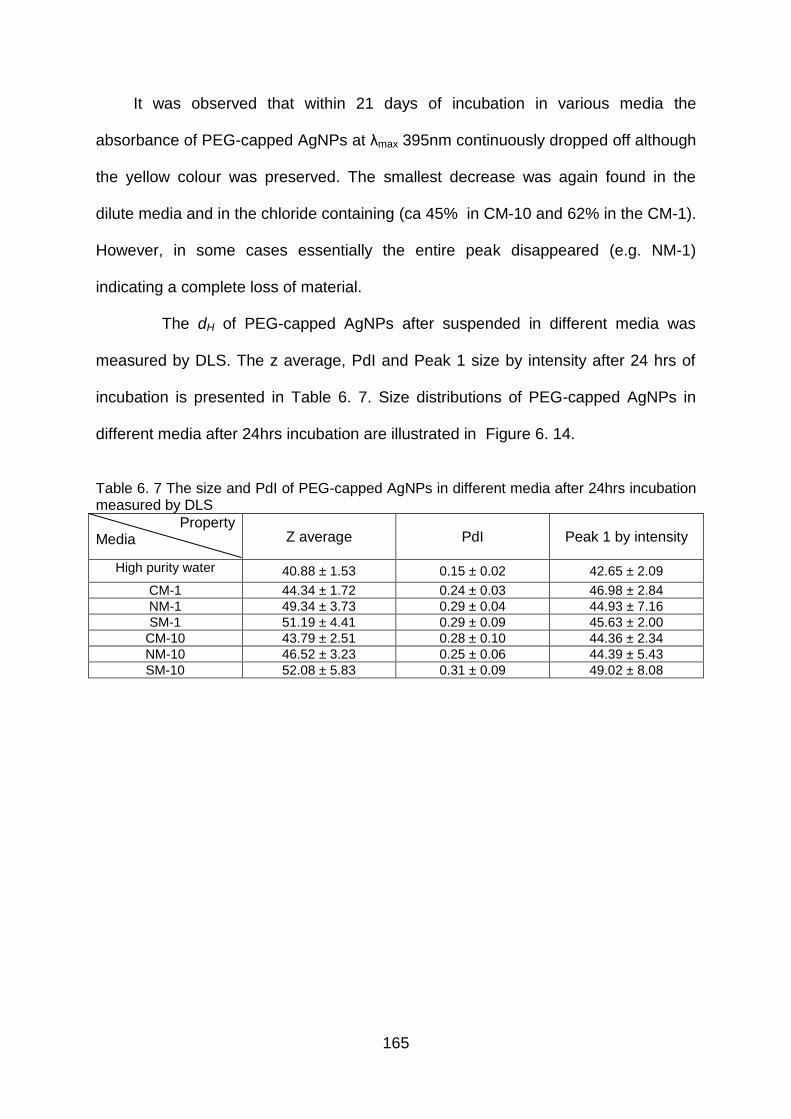
165
It was observed that within 21 days of incubation in various media the
absorbance of PEG-capped AgNPs at λmax 395nm continuously dropped off although
the yellow colour was preserved. The smallest decrease was again found in the
dilute media and in the chloride containing (ca 45% in CM-10 and 62% in the CM-1).
However, in some cases essentially the entire peak disappeared (e.g. NM-1)
indicating a complete loss of material.
The dH of PEG-capped AgNPs after suspended in different media was
measured by DLS. The z average, PdI and Peak 1 size by intensity after 24 hrs of
incubation is presented in Table 6. 7. Size distributions of PEG-capped AgNPs in
different media after 24hrs incubation are illustrated in Figure 6. 14.
Table 6. 7 The size and PdI of PEG-capped AgNPs in different media after 24hrs incubation measured by DLS
Property Media Z average PdI Peak 1 by intensity
High purity water 40.88 ± 1.53 0.15 ± 0.02 42.65 ± 2.09
CM-1 44.34 ± 1.72 0.24 ± 0.03 46.98 ± 2.84
NM-1 49.34 ± 3.73 0.29 ± 0.04 44.93 ± 7.16
SM-1 51.19 ± 4.41 0.29 ± 0.09 45.63 ± 2.00
CM-10 43.79 ± 2.51 0.28 ± 0.10 44.36 ± 2.34
NM-10 46.52 ± 3.23 0.25 ± 0.06 44.39 ± 5.43
SM-10 52.08 ± 5.83 0.31 ± 0.09 49.02 ± 8.08
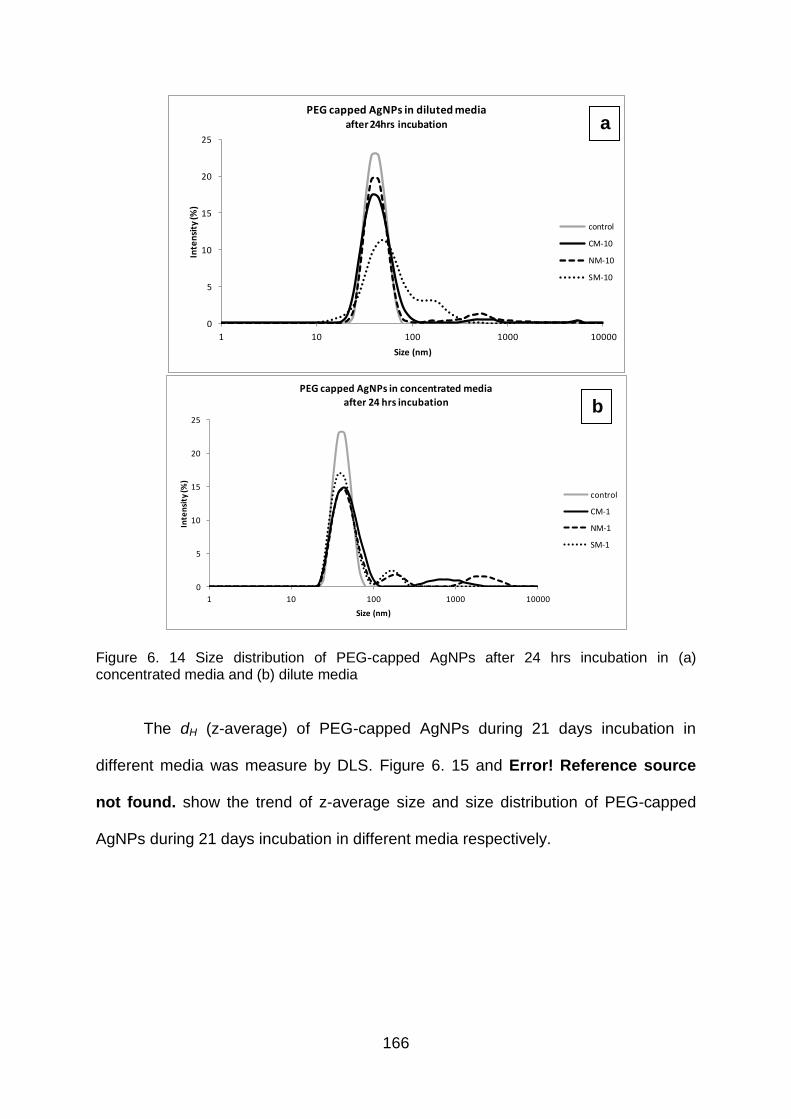
166
Figure 6. 14 Size distribution of PEG-capped AgNPs after 24 hrs incubation in (a) concentrated media and (b) dilute media
The dH (z-average) of PEG-capped AgNPs during 21 days incubation in
different media was measure by DLS. Figure 6. 15 and Error! Reference source
not found. show the trend of z-average size and size distribution of PEG-capped
AgNPs during 21 days incubation in different media respectively.
0
5
10
15
20
25
1 10 100 1000 10000
Inte
nsi
ty (%
)
Size (nm)
PEG capped AgNPs in diluted mediaafter 24hrs incubation
control
CM-10
NM-10
SM-10
0
5
10
15
20
25
1 10 100 1000 10000
Inte
nsi
ty (%
)
Size (nm)
PEG capped AgNPs in concentrated media
after 24 hrs incubation
control
CM-1
NM-1
SM-1
b
a
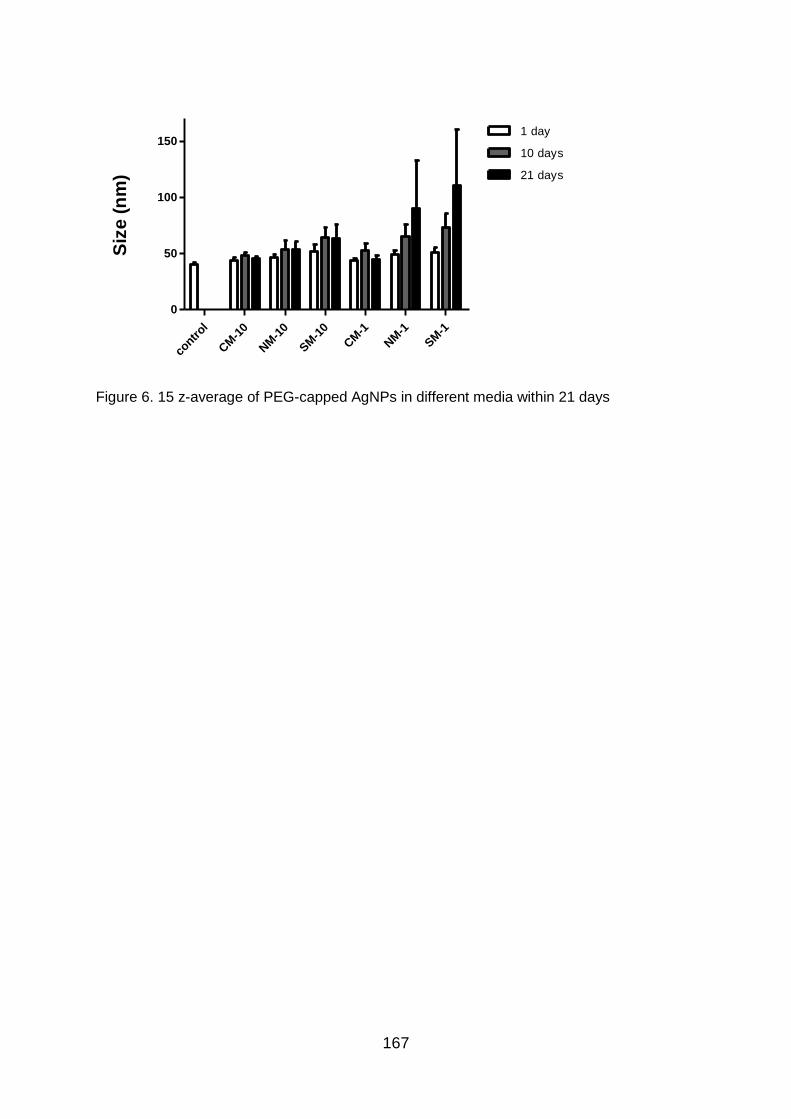
167
contr
ol
CM
-10
NM
-10
SM
-10
CM
-1
NM
-1
SM
-1
0
50
100
1501 day
10 days
21 days
Siz
e (
nm
)
Figure 6. 15 z-average of PEG-capped AgNPs in different media within 21 days
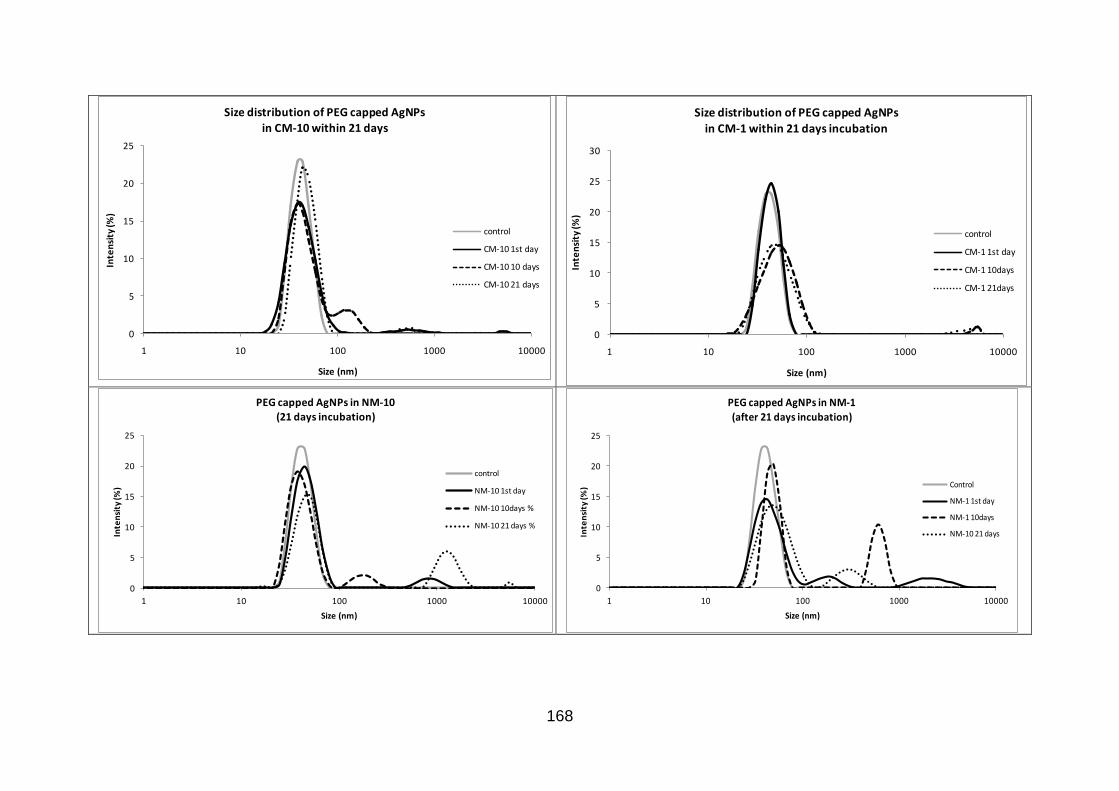
168
0
5
10
15
20
25
1 10 100 1000 10000
Inte
nsi
ty (%
)
Size (nm)
Size distribution of PEG capped AgNPs
in CM-10 within 21 days
control
CM-10 1st day
CM-10 10 days
CM-10 21 days
0
5
10
15
20
25
30
1 10 100 1000 10000
Inte
nsi
ty (%
)
Size (nm)
Size distribution of PEG capped AgNPs
in CM-1 within 21 days incubation
control
CM-1 1st day
CM-1 10days
CM-1 21days
0
5
10
15
20
25
1 10 100 1000 10000
Inte
nsi
ty (%
)
Size (nm)
PEG capped AgNPs in NM-10
(21 days incubation)
control
NM-10 1st day
NM-10 10days %
NM-10 21 days %
0
5
10
15
20
25
1 10 100 1000 10000
Inte
nsi
ty (%
)
Size (nm)
PEG capped AgNPs in NM-1
(after 21 days incubation)
Control
NM-1 1st day
NM-1 10days
NM-10 21 days
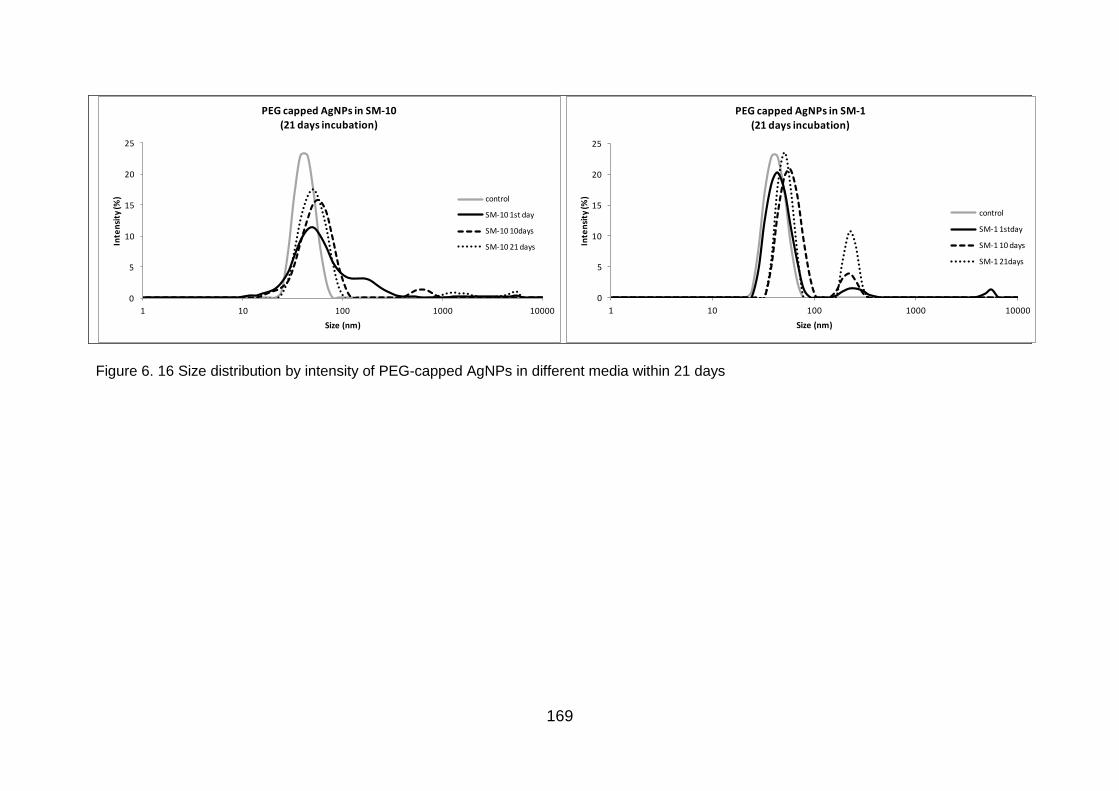
169
Figure 6. 16 Size distribution by intensity of PEG-capped AgNPs in different media within 21 days
0
5
10
15
20
25
1 10 100 1000 10000
Inte
nsi
ty (%
)
Size (nm)
PEG capped AgNPs in SM-10
(21 days incubation)
control
SM-10 1st day
SM-10 10days
SM-10 21 days
0
5
10
15
20
25
1 10 100 1000 10000
Inte
nsi
ty (%
)
Size (nm)
PEG capped AgNPs in SM-1
(21 days incubation)
control
SM-1 1stday
SM-1 10 days
SM-1 21days
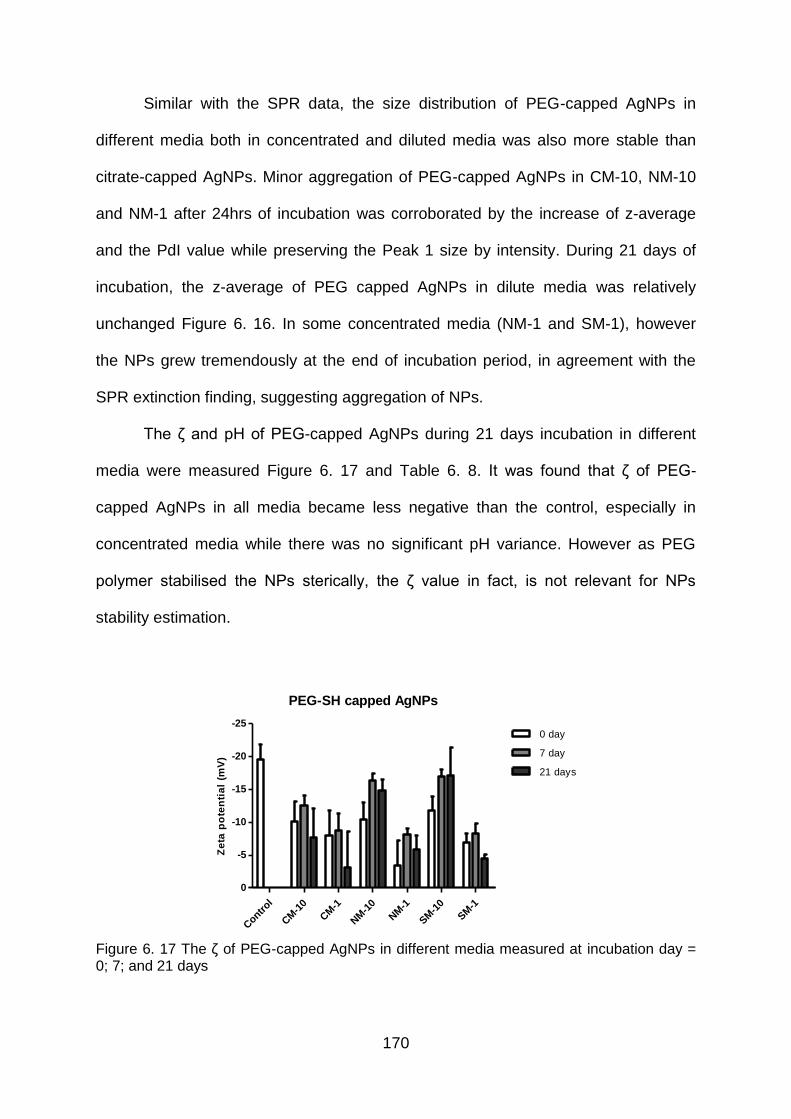
170
Similar with the SPR data, the size distribution of PEG-capped AgNPs in
different media both in concentrated and diluted media was also more stable than
citrate-capped AgNPs. Minor aggregation of PEG-capped AgNPs in CM-10, NM-10
and NM-1 after 24hrs of incubation was corroborated by the increase of z-average
and the PdI value while preserving the Peak 1 size by intensity. During 21 days of
incubation, the z-average of PEG capped AgNPs in dilute media was relatively
unchanged Figure 6. 16. In some concentrated media (NM-1 and SM-1), however
the NPs grew tremendously at the end of incubation period, in agreement with the
SPR extinction finding, suggesting aggregation of NPs.
The ζ and pH of PEG-capped AgNPs during 21 days incubation in different
media were measured Figure 6. 17 and Table 6. 8. It was found that ζ of PEG-
capped AgNPs in all media became less negative than the control, especially in
concentrated media while there was no significant pH variance. However as PEG
polymer stabilised the NPs sterically, the ζ value in fact, is not relevant for NPs
stability estimation.
PEG-SH capped AgNPs
Contr
ol
CM
-10
CM
-1
NM
-10
NM
-1
SM
-10
SM
-1
-25
-20
-15
-10
-5
0
0 day
7 day
21 days
Ze
ta p
ote
nti
al
(mV
)
Figure 6. 17 The ζ of PEG-capped AgNPs in different media measured at incubation day = 0; 7; and 21 days
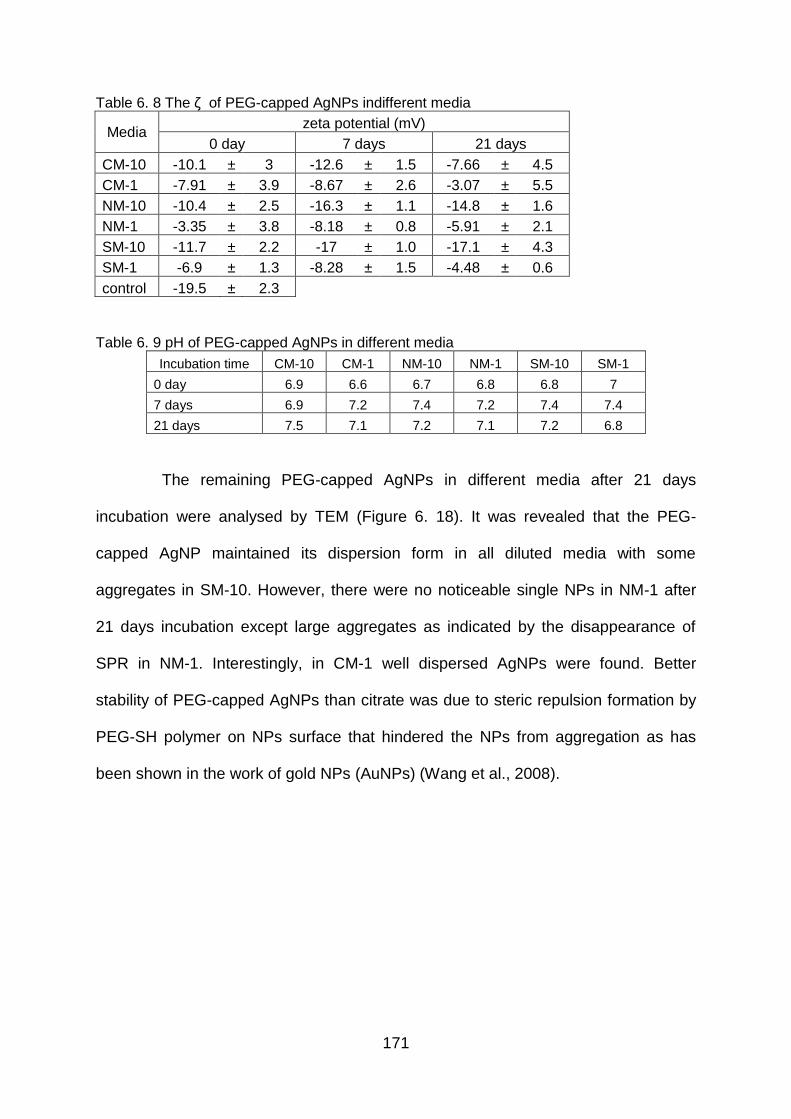
171
Table 6. 8 The ζ of PEG-capped AgNPs indifferent media
Media zeta potential (mV)
0 day 7 days 21 days
CM-10 -10.1 ± 3 -12.6 ± 1.5 -7.66 ± 4.5
CM-1 -7.91 ± 3.9 -8.67 ± 2.6 -3.07 ± 5.5
NM-10 -10.4 ± 2.5 -16.3 ± 1.1 -14.8 ± 1.6
NM-1 -3.35 ± 3.8 -8.18 ± 0.8 -5.91 ± 2.1
SM-10 -11.7 ± 2.2 -17 ± 1.0 -17.1 ± 4.3
SM-1 -6.9 ± 1.3 -8.28 ± 1.5 -4.48 ± 0.6
control -19.5 ± 2.3
Table 6. 9 pH of PEG-capped AgNPs in different media
Incubation time CM-10 CM-1 NM-10 NM-1 SM-10 SM-1
0 day 6.9 6.6 6.7 6.8 6.8 7
7 days 6.9 7.2 7.4 7.2 7.4 7.4
21 days 7.5 7.1 7.2 7.1 7.2 6.8
The remaining PEG-capped AgNPs in different media after 21 days
incubation were analysed by TEM (Figure 6. 18). It was revealed that the PEG-
capped AgNP maintained its dispersion form in all diluted media with some
aggregates in SM-10. However, there were no noticeable single NPs in NM-1 after
21 days incubation except large aggregates as indicated by the disappearance of
SPR in NM-1. Interestingly, in CM-1 well dispersed AgNPs were found. Better
stability of PEG-capped AgNPs than citrate was due to steric repulsion formation by
PEG-SH polymer on NPs surface that hindered the NPs from aggregation as has
been shown in the work of gold NPs (AuNPs) (Wang et al., 2008).
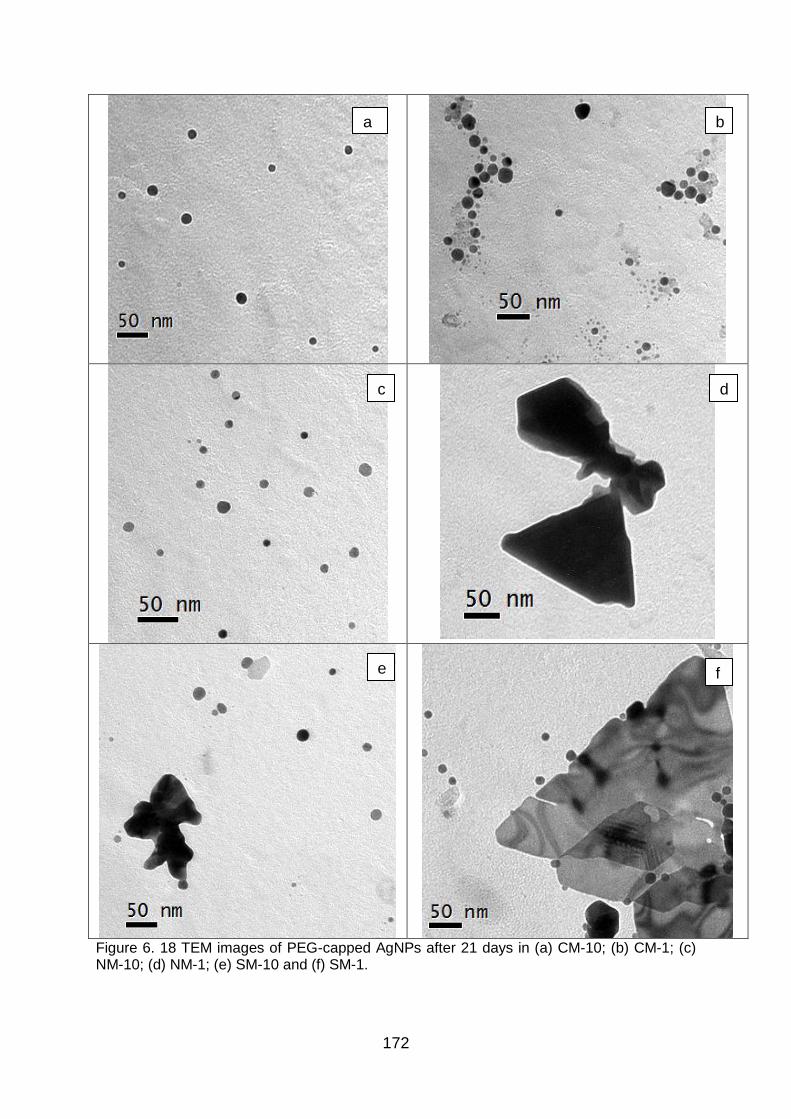
172
Figure 6. 18 TEM images of PEG-capped AgNPs after 21 days in (a) CM-10; (b) CM-1; (c) NM-10; (d) NM-1; (e) SM-10 and (f) SM-1.
a b
d c
f e
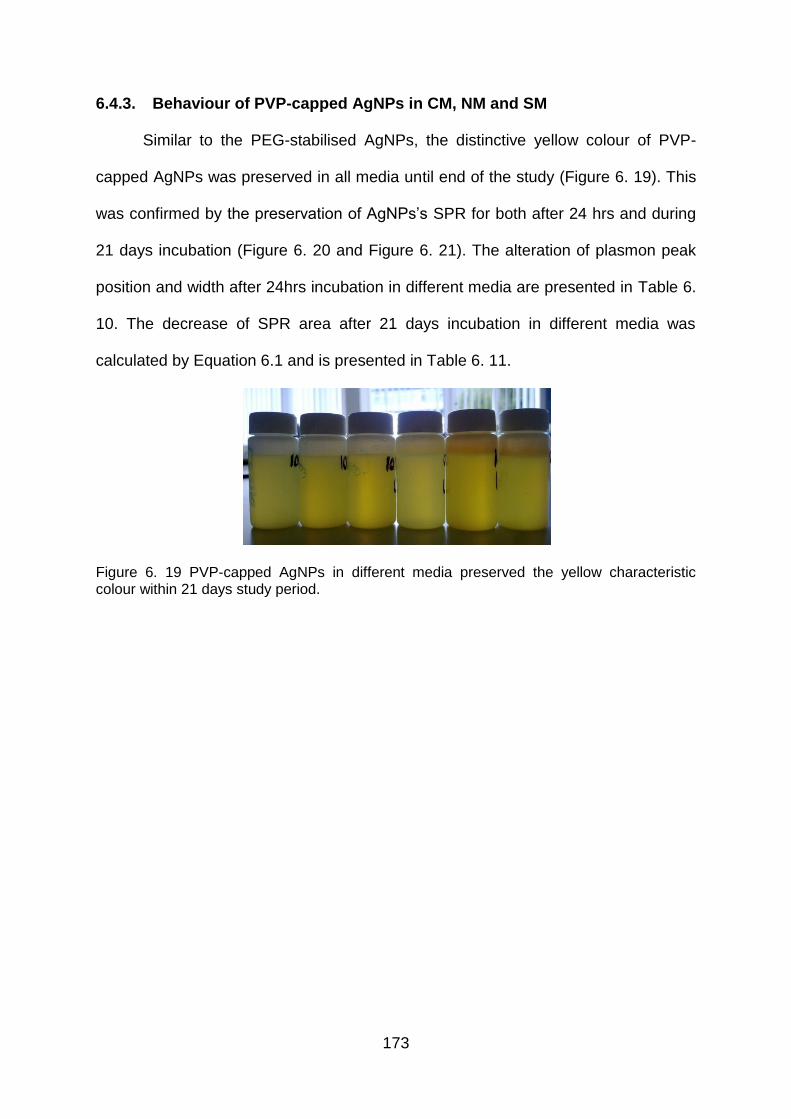
173
6.4.3. Behaviour of PVP-capped AgNPs in CM, NM and SM
Similar to the PEG-stabilised AgNPs, the distinctive yellow colour of PVP-
capped AgNPs was preserved in all media until end of the study (Figure 6. 19). This
was confirmed by the preservation of AgNPs‘s SPR for both after 24 hrs and during
21 days incubation (Figure 6. 20 and Figure 6. 21). The alteration of plasmon peak
position and width after 24hrs incubation in different media are presented in Table 6.
10. The decrease of SPR area after 21 days incubation in different media was
calculated by Equation 6.1 and is presented in Table 6. 11.
Figure 6. 19 PVP-capped AgNPs in different media preserved the yellow characteristic colour within 21 days study period.
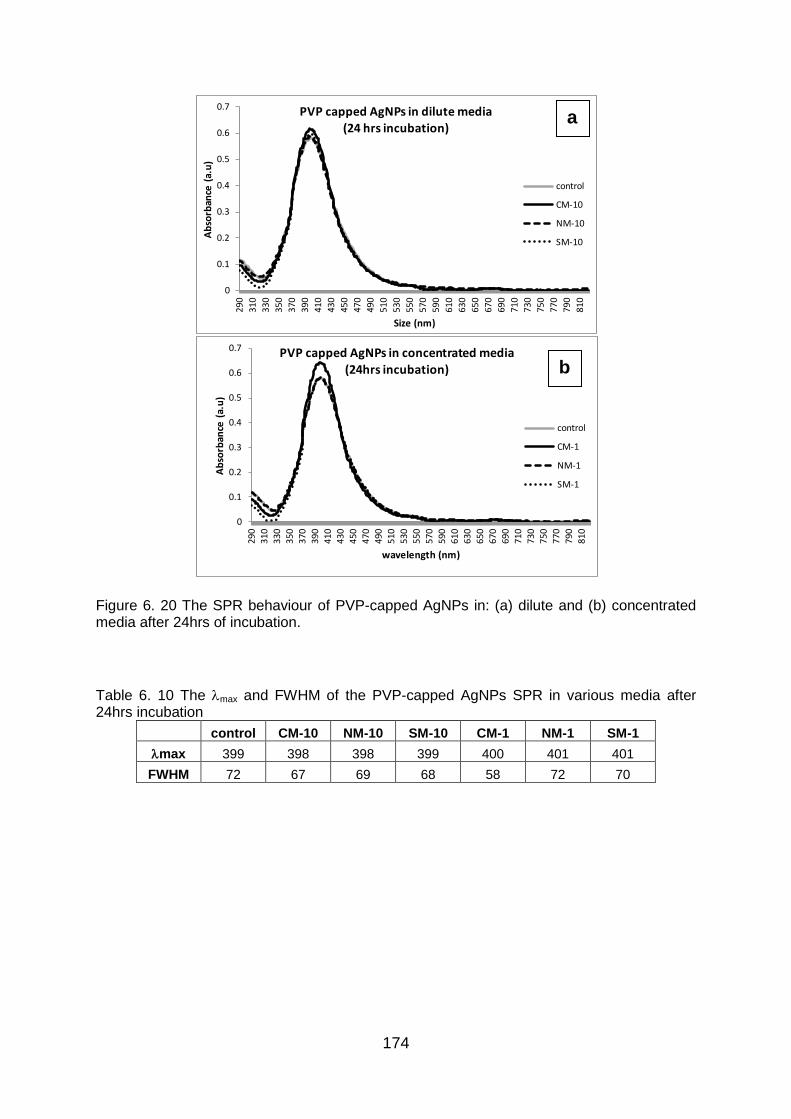
174
Figure 6. 20 The SPR behaviour of PVP-capped AgNPs in: (a) dilute and (b) concentrated media after 24hrs of incubation.
Table 6. 10 The max and FWHM of the PVP-capped AgNPs SPR in various media after 24hrs incubation
control CM-10 NM-10 SM-10 CM-1 NM-1 SM-1
max 399 398 398 399 400 401 401
FWHM 72 67 69 68 58 72 70
0
0.1
0.2
0.3
0.4
0.5
0.6
0.7
290
310
330
350
370
390
410
430
450
470
490
510
530
550
570
590
610
630
650
670
690
710
730
750
770
790
810
Ab
sorb
ance
(a.
u)
Size (nm)
PVP capped AgNPs in dilute media(24 hrs incubation)
control
CM-10
NM-10
SM-10
0
0.1
0.2
0.3
0.4
0.5
0.6
0.7
290
310
330
350
370
390
410
430
450
470
490
510
530
550
570
590
610
630
650
670
690
710
730
750
770
790
810
Ab
sorb
ance
(a.
u)
wavelength (nm)
PVP capped AgNPs in concentrated media(24hrs incubation)
control
CM-1
NM-1
SM-1
a
b
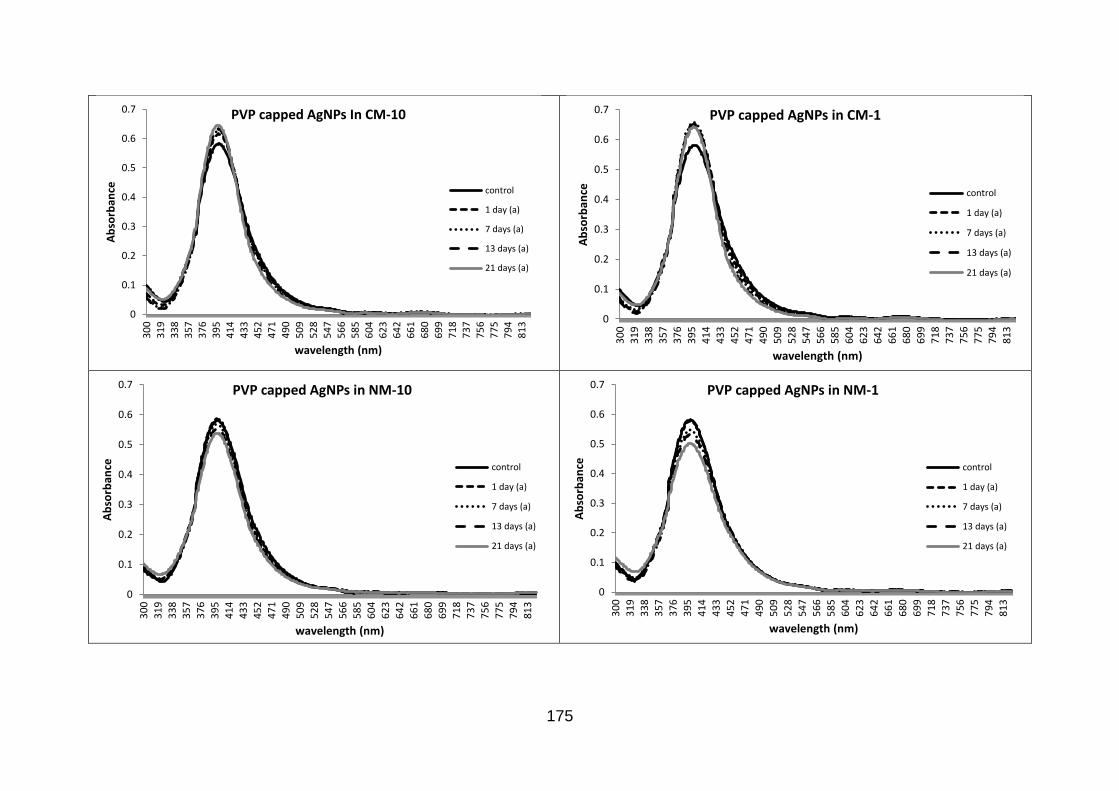
175
0
0.1
0.2
0.3
0.4
0.5
0.6
0.7
30
03
19
33
83
57
37
63
95
41
44
33
45
24
71
49
05
09
52
85
47
56
65
85
60
46
23
64
26
61
68
06
99
71
87
37
75
67
75
79
48
13
Ab
sorb
ance
wavelength (nm)
PVP capped AgNPs In CM-10
control
1 day (a)
7 days (a)
13 days (a)
21 days (a)
0
0.1
0.2
0.3
0.4
0.5
0.6
0.7
30
0
31
9
33
8
35
7
37
6
39
5
41
4
43
3
45
24
71
49
0
50
9
52
8
54
7
56
65
85
60
4
62
36
42
66
16
80
69
9
71
8
73
7
75
6
77
57
94
81
3
Ab
sorb
ance
wavelength (nm)
PVP capped AgNPs in CM-1
control
1 day (a)
7 days (a)
13 days (a)
21 days (a)
0
0.1
0.2
0.3
0.4
0.5
0.6
0.7
30
0
31
9
33
8
35
7
37
6
39
5
41
4
43
3
45
2
47
1
49
0
50
9
52
8
54
7
56
6
58
5
60
4
62
3
64
2
66
1
68
0
69
9
71
8
73
7
75
6
77
5
79
4
81
3
Ab
sorb
ance
wavelength (nm)
PVP capped AgNPs in NM-10
control
1 day (a)
7 days (a)
13 days (a)
21 days (a)
0
0.1
0.2
0.3
0.4
0.5
0.6
0.7
30
0
31
9
33
8
35
7
37
6
39
5
41
4
43
3
45
2
47
1
49
0
50
9
52
8
54
7
56
6
58
5
60
4
62
3
64
2
66
1
68
0
69
9
71
8
73
7
75
6
77
5
79
4
81
3
Ab
sorb
ance
wavelength (nm)
PVP capped AgNPs in NM-1
control
1 day (a)
7 days (a)
13 days (a)
21 days (a)
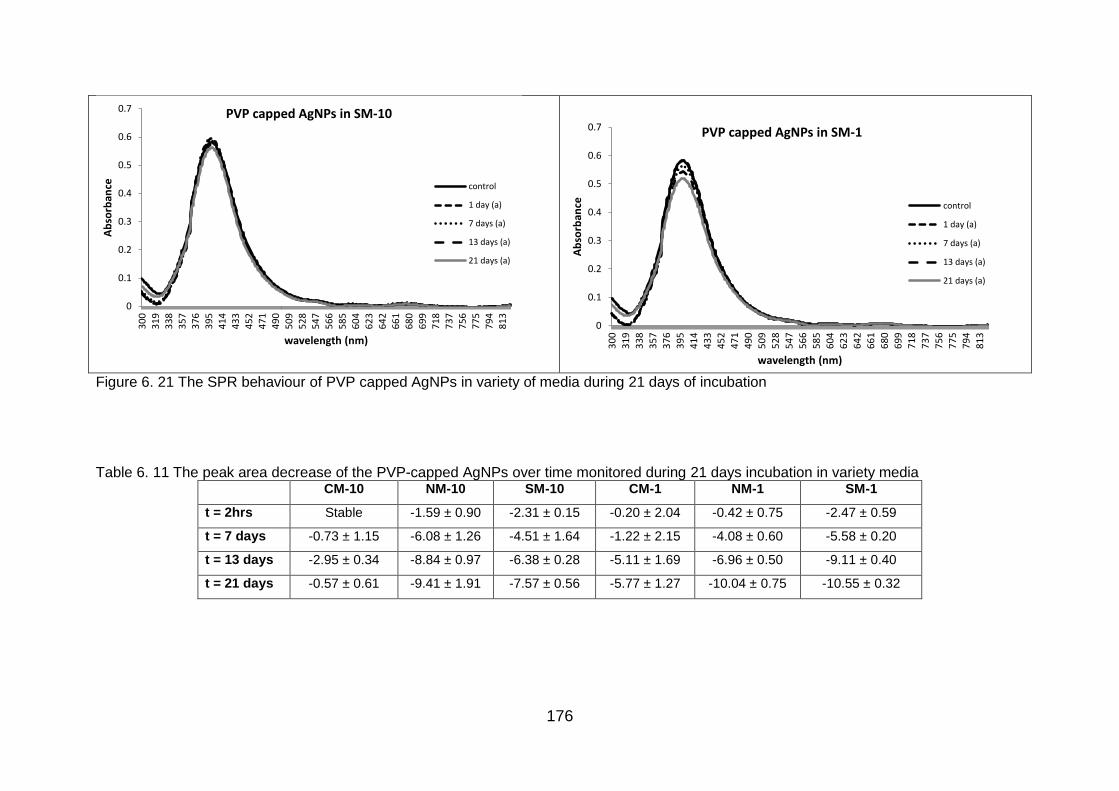
176
Figure 6. 21 The SPR behaviour of PVP capped AgNPs in variety of media during 21 days of incubation
Table 6. 11 The peak area decrease of the PVP-capped AgNPs over time monitored during 21 days incubation in variety media CM-10 NM-10 SM-10 CM-1 NM-1 SM-1
t = 2hrs Stable -1.59 ± 0.90 -2.31 ± 0.15 -0.20 ± 2.04 -0.42 ± 0.75 -2.47 ± 0.59
t = 7 days -0.73 ± 1.15 -6.08 ± 1.26 -4.51 ± 1.64 -1.22 ± 2.15 -4.08 ± 0.60 -5.58 ± 0.20
t = 13 days -2.95 ± 0.34 -8.84 ± 0.97 -6.38 ± 0.28 -5.11 ± 1.69 -6.96 ± 0.50 -9.11 ± 0.40
t = 21 days -0.57 ± 0.61 -9.41 ± 1.91 -7.57 ± 0.56 -5.77 ± 1.27 -10.04 ± 0.75 -10.55 ± 0.32
0
0.1
0.2
0.3
0.4
0.5
0.6
0.7
30
0
31
9
33
8
35
7
37
6
39
5
41
4
43
3
45
2
47
1
49
05
09
52
8
54
7
56
6
58
5
60
4
62
3
64
2
66
1
68
0
69
9
71
8
73
7
75
6
77
5
79
4
81
3
Ab
sorb
ance
wavelength (nm)
PVP capped AgNPs in SM-10
control
1 day (a)
7 days (a)
13 days (a)
21 days (a)
0
0.1
0.2
0.3
0.4
0.5
0.6
0.7
30
0
31
9
33
8
35
7
37
6
39
5
41
4
43
3
45
2
47
1
49
0
50
9
52
8
54
7
56
6
58
5
60
4
62
3
64
2
66
1
68
0
69
9
71
8
73
7
75
6
77
5
79
4
81
3
Ab
sorb
ance
wavelength (nm)
PVP capped AgNPs in SM-1
control
1 day (a)
7 days (a)
13 days (a)
21 days (a)
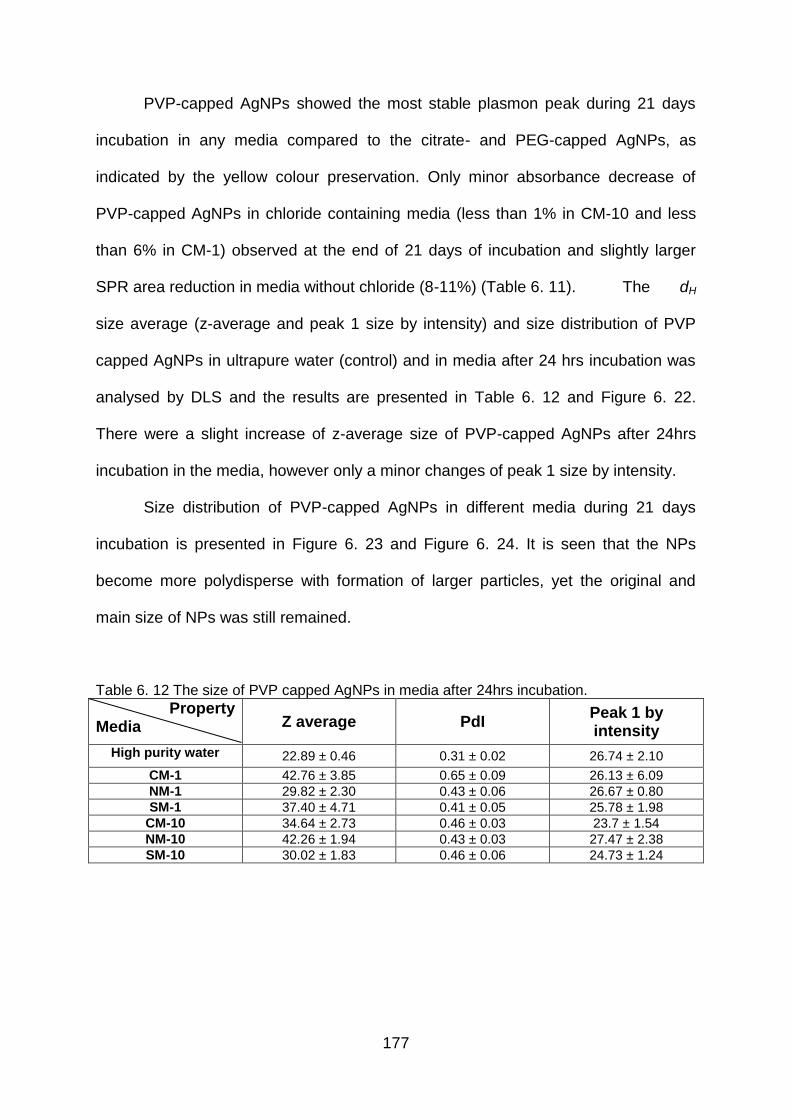
177
PVP-capped AgNPs showed the most stable plasmon peak during 21 days
incubation in any media compared to the citrate- and PEG-capped AgNPs, as
indicated by the yellow colour preservation. Only minor absorbance decrease of
PVP-capped AgNPs in chloride containing media (less than 1% in CM-10 and less
than 6% in CM-1) observed at the end of 21 days of incubation and slightly larger
SPR area reduction in media without chloride (8-11%) (Table 6. 11). The dH
size average (z-average and peak 1 size by intensity) and size distribution of PVP
capped AgNPs in ultrapure water (control) and in media after 24 hrs incubation was
analysed by DLS and the results are presented in Table 6. 12 and Figure 6. 22.
There were a slight increase of z-average size of PVP-capped AgNPs after 24hrs
incubation in the media, however only a minor changes of peak 1 size by intensity.
Size distribution of PVP-capped AgNPs in different media during 21 days
incubation is presented in Figure 6. 23 and Figure 6. 24. It is seen that the NPs
become more polydisperse with formation of larger particles, yet the original and
main size of NPs was still remained.
Table 6. 12 The size of PVP capped AgNPs in media after 24hrs incubation.
Property Media Z average PdI
Peak 1 by intensity
High purity water 22.89 ± 0.46 0.31 ± 0.02 26.74 ± 2.10
CM-1 42.76 ± 3.85 0.65 ± 0.09 26.13 ± 6.09
NM-1 29.82 ± 2.30 0.43 ± 0.06 26.67 ± 0.80
SM-1 37.40 ± 4.71 0.41 ± 0.05 25.78 ± 1.98
CM-10 34.64 ± 2.73 0.46 ± 0.03 23.7 ± 1.54
NM-10 42.26 ± 1.94 0.43 ± 0.03 27.47 ± 2.38
SM-10 30.02 ± 1.83 0.46 ± 0.06 24.73 ± 1.24
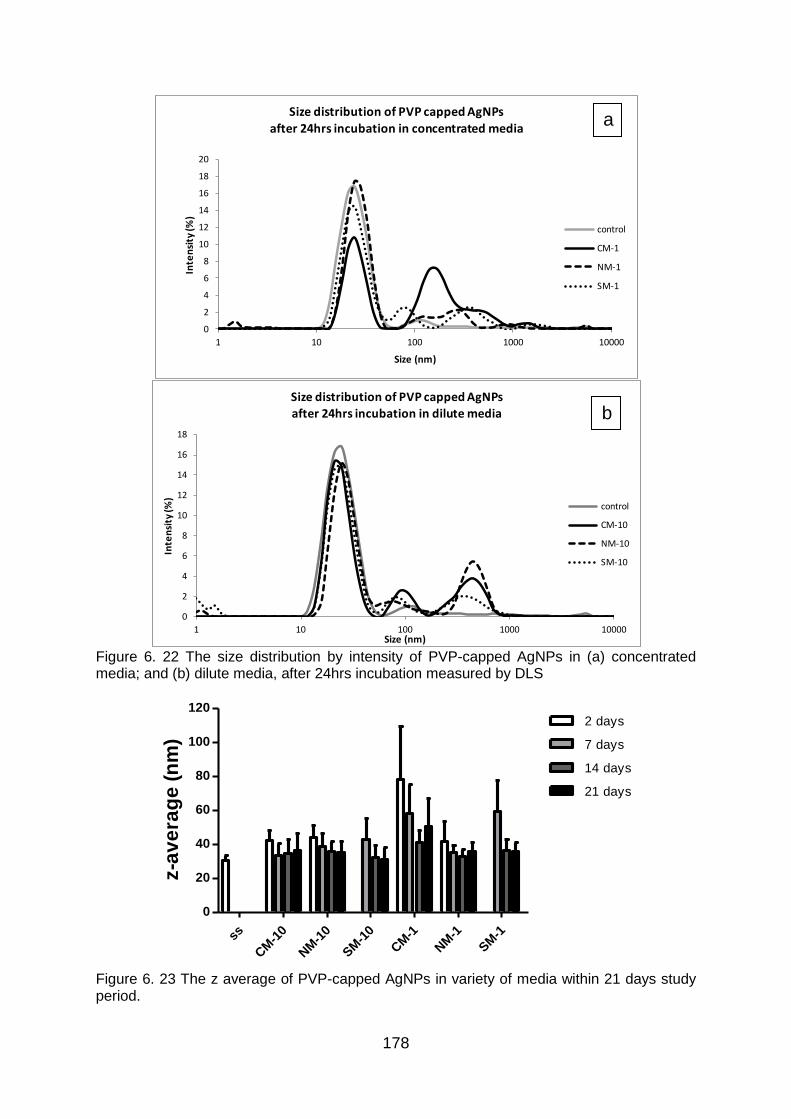
178
Figure 6. 22 The size distribution by intensity of PVP-capped AgNPs in (a) concentrated media; and (b) dilute media, after 24hrs incubation measured by DLS
ss
CM
-10
NM
-10
SM
-10
CM
-1
NM
-1
SM
-1
0
20
40
60
80
100
1202 days
7 days
14 days
21 days
z-a
ve
rag
e (
nm
)
Figure 6. 23 The z average of PVP-capped AgNPs in variety of media within 21 days study period.
0
2
4
6
8
10
12
14
16
18
20
1 10 100 1000 10000
Inte
nsi
ty (%
)
Size (nm)
Size distribution of PVP capped AgNPs
after 24hrs incubation in concentrated media
control
CM-1
NM-1
SM-1
0
2
4
6
8
10
12
14
16
18
1 10 100 1000 10000
Inte
nsi
ty (%
)
Size (nm)
Size distribution of PVP capped AgNPs
after 24hrs incubation in dilute media
control
CM-10
NM-10
SM-10
a
b
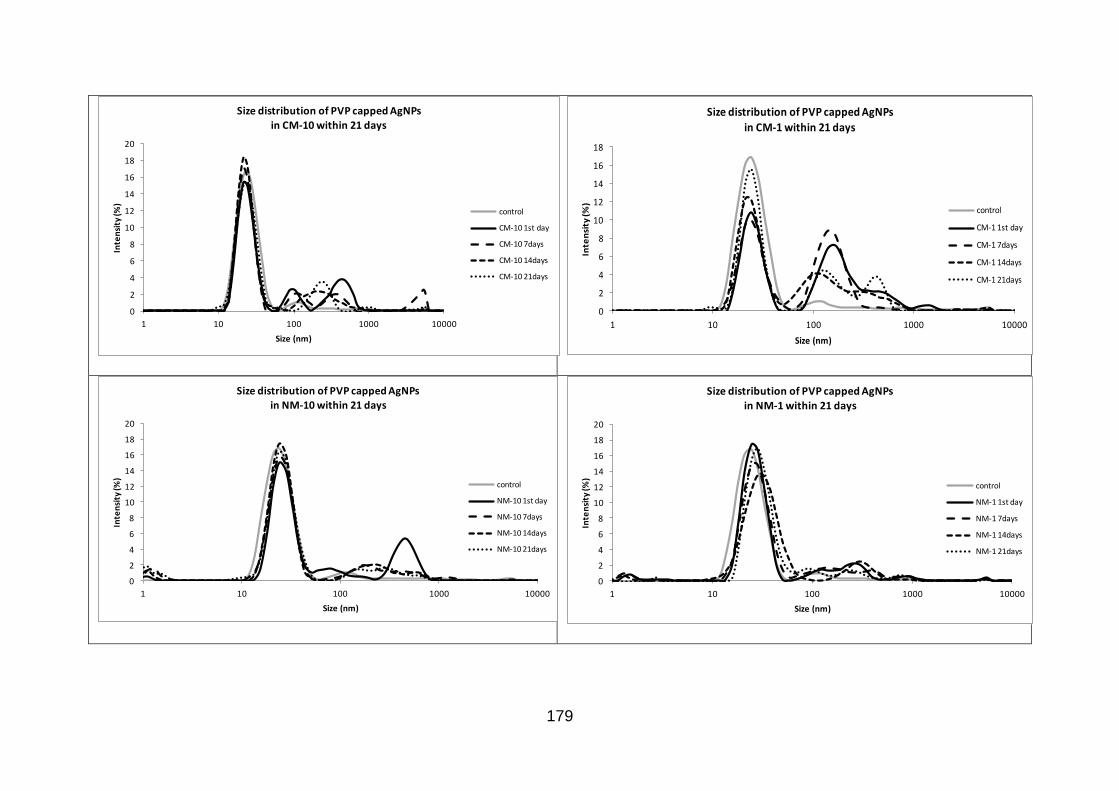
179
0
2
4
6
8
10
12
14
16
18
20
1 10 100 1000 10000
Inte
nsi
ty (%
)
Size (nm)
Size distribution of PVP capped AgNPs
in CM-10 within 21 days
control
CM-10 1st day
CM-10 7days
CM-10 14days
CM-10 21days
0
2
4
6
8
10
12
14
16
18
1 10 100 1000 10000
Inte
nsi
ty (%
)
Size (nm)
Size distribution of PVP capped AgNPs
in CM-1 within 21 days
control
CM-1 1st day
CM-1 7days
CM-1 14days
CM-1 21days
0
2
4
6
8
10
12
14
16
18
20
1 10 100 1000 10000
Inte
nsi
ty (%
)
Size (nm)
Size distribution of PVP capped AgNPs
in NM-10 within 21 days
control
NM-10 1st day
NM-10 7days
NM-10 14days
NM-10 21days
0
2
4
6
8
10
12
14
16
18
20
1 10 100 1000 10000In
ten
sity
(%)
Size (nm)
Size distribution of PVP capped AgNPs
in NM-1 within 21 days
control
NM-1 1st day
NM-1 7days
NM-1 14days
NM-1 21days
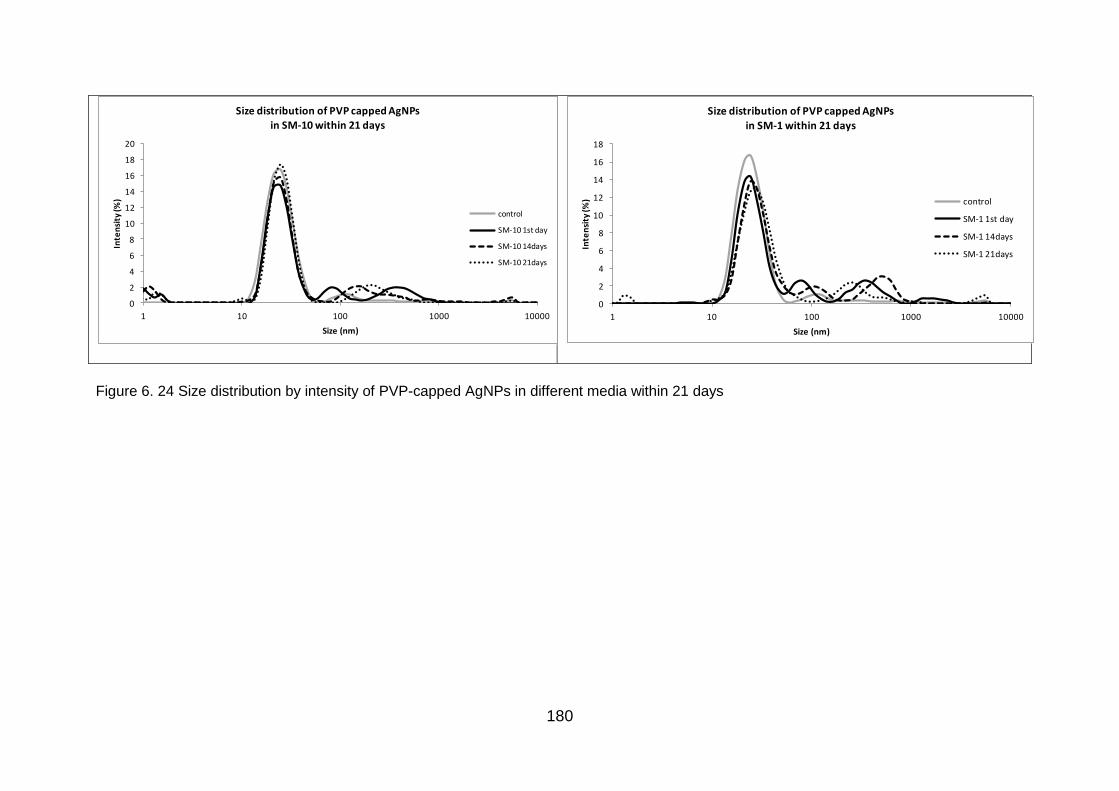
180
Figure 6. 24 Size distribution by intensity of PVP-capped AgNPs in different media within 21 days
0
2
4
6
8
10
12
14
16
18
20
1 10 100 1000 10000
Inte
nsi
ty (%
)
Size (nm)
Size distribution of PVP capped AgNPs
in SM-10 within 21 days
control
SM-10 1st day
SM-10 14days
SM-10 21days
0
2
4
6
8
10
12
14
16
18
1 10 100 1000 10000
Inte
nsi
ty (%
)
Size (nm)
Size distribution of PVP capped AgNPs
in SM-1 within 21 days
control
SM-1 1st day
SM-1 14days
SM-1 21days
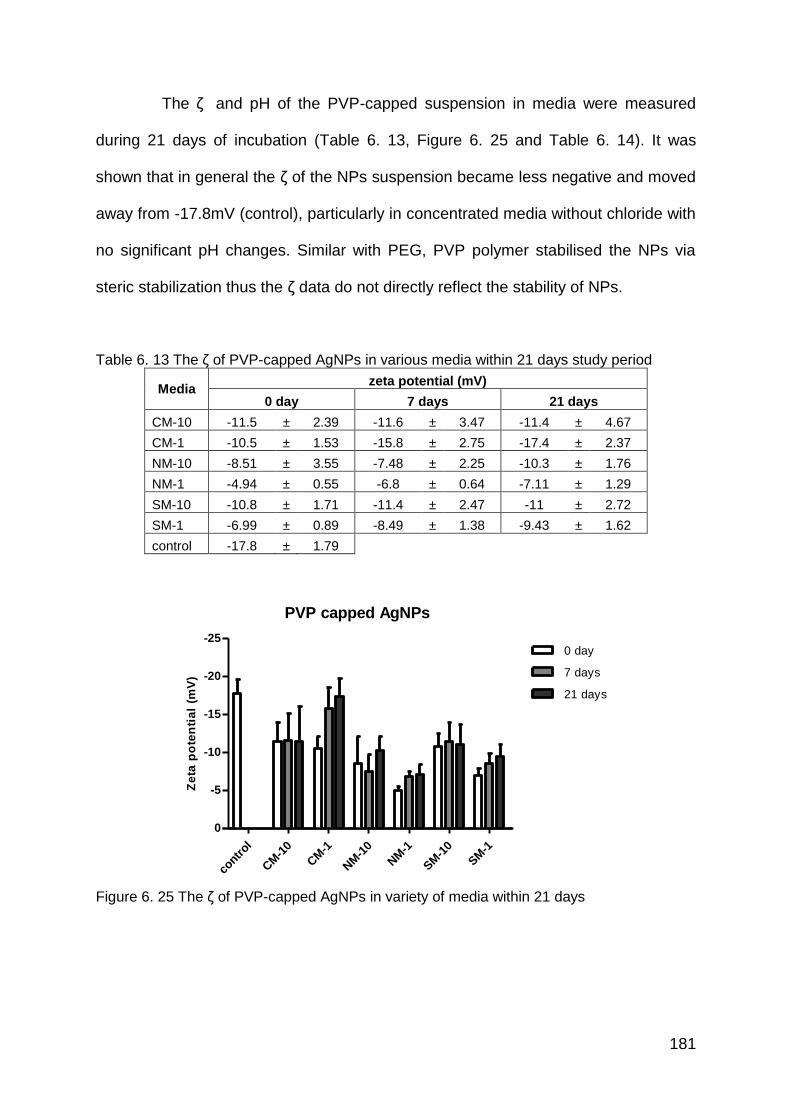
181
The ζ and pH of the PVP-capped suspension in media were measured
during 21 days of incubation (Table 6. 13, Figure 6. 25 and Table 6. 14). It was
shown that in general the ζ of the NPs suspension became less negative and moved
away from -17.8mV (control), particularly in concentrated media without chloride with
no significant pH changes. Similar with PEG, PVP polymer stabilised the NPs via
steric stabilization thus the ζ data do not directly reflect the stability of NPs.
Table 6. 13 The ζ of PVP-capped AgNPs in various media within 21 days study period
Media zeta potential (mV)
0 day 7 days 21 days
CM-10 -11.5 ± 2.39 -11.6 ± 3.47 -11.4 ± 4.67
CM-1 -10.5 ± 1.53 -15.8 ± 2.75 -17.4 ± 2.37
NM-10 -8.51 ± 3.55 -7.48 ± 2.25 -10.3 ± 1.76
NM-1 -4.94 ± 0.55 -6.8 ± 0.64 -7.11 ± 1.29
SM-10 -10.8 ± 1.71 -11.4 ± 2.47 -11 ± 2.72
SM-1 -6.99 ± 0.89 -8.49 ± 1.38 -9.43 ± 1.62
control -17.8 ± 1.79
PVP capped AgNPs
contr
ol
CM
-10
CM
-1
NM
-10
NM
-1
SM
-10
SM
-1
-25
-20
-15
-10
-5
0
0 day
7 days
21 days
Ze
ta p
ote
nti
al
(mV
)
Figure 6. 25 The ζ of PVP-capped AgNPs in variety of media within 21 days
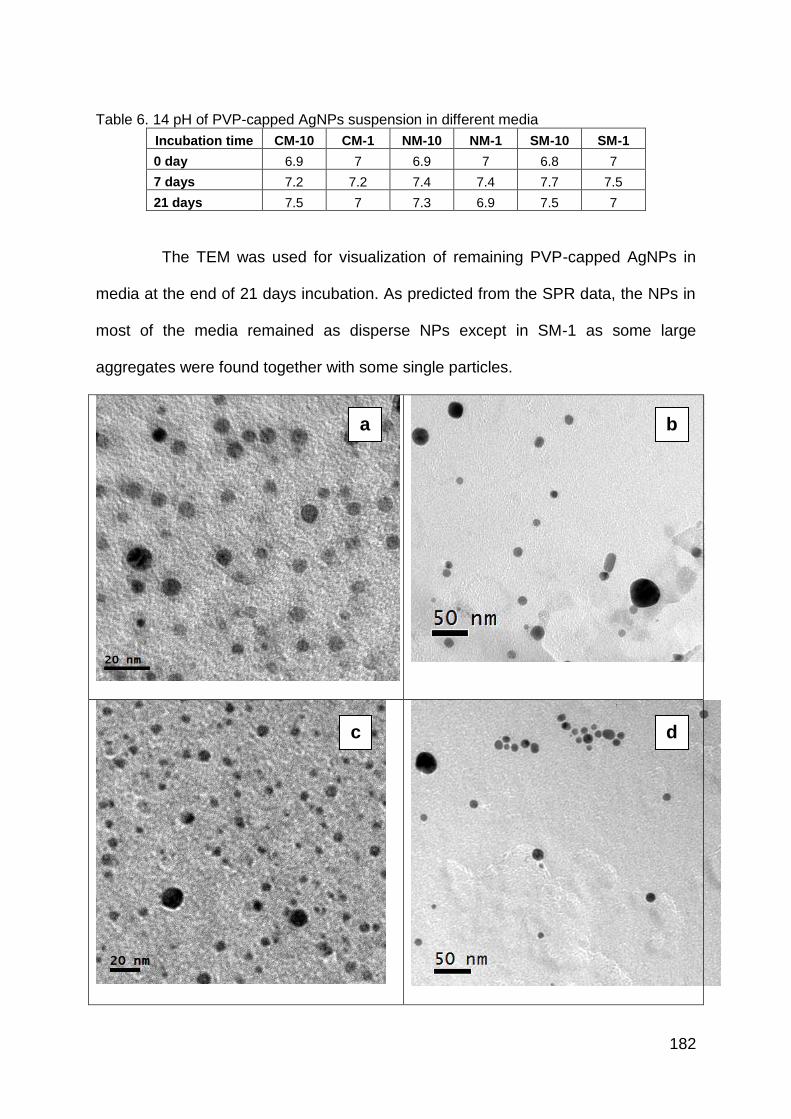
182
Table 6. 14 pH of PVP-capped AgNPs suspension in different media
Incubation time CM-10 CM-1 NM-10 NM-1 SM-10 SM-1
0 day 6.9 7 6.9 7 6.8 7
7 days 7.2 7.2 7.4 7.4 7.7 7.5
21 days 7.5 7 7.3 6.9 7.5 7
The TEM was used for visualization of remaining PVP-capped AgNPs in
media at the end of 21 days incubation. As predicted from the SPR data, the NPs in
most of the media remained as disperse NPs except in SM-1 as some large
aggregates were found together with some single particles.
a b
c d
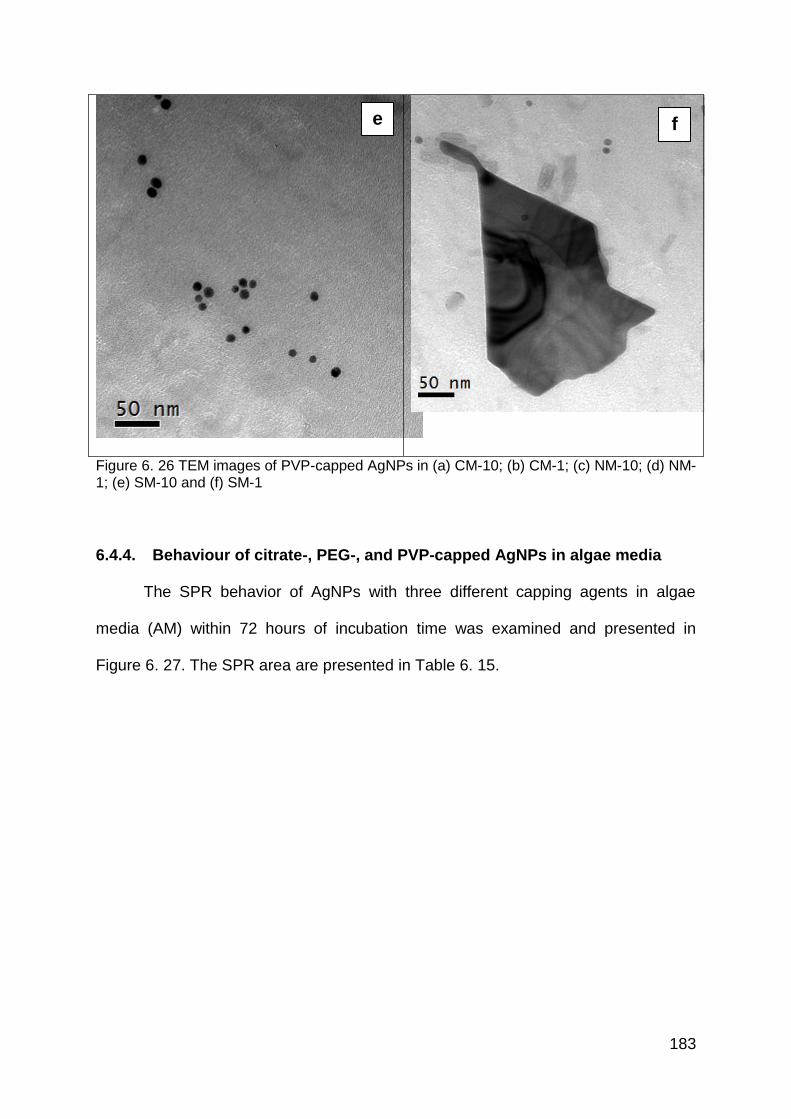
183
Figure 6. 26 TEM images of PVP-capped AgNPs in (a) CM-10; (b) CM-1; (c) NM-10; (d) NM-1; (e) SM-10 and (f) SM-1
6.4.4. Behaviour of citrate-, PEG-, and PVP-capped AgNPs in algae media
The SPR behavior of AgNPs with three different capping agents in algae
media (AM) within 72 hours of incubation time was examined and presented in
Figure 6. 27. The SPR area are presented in Table 6. 15.
e f
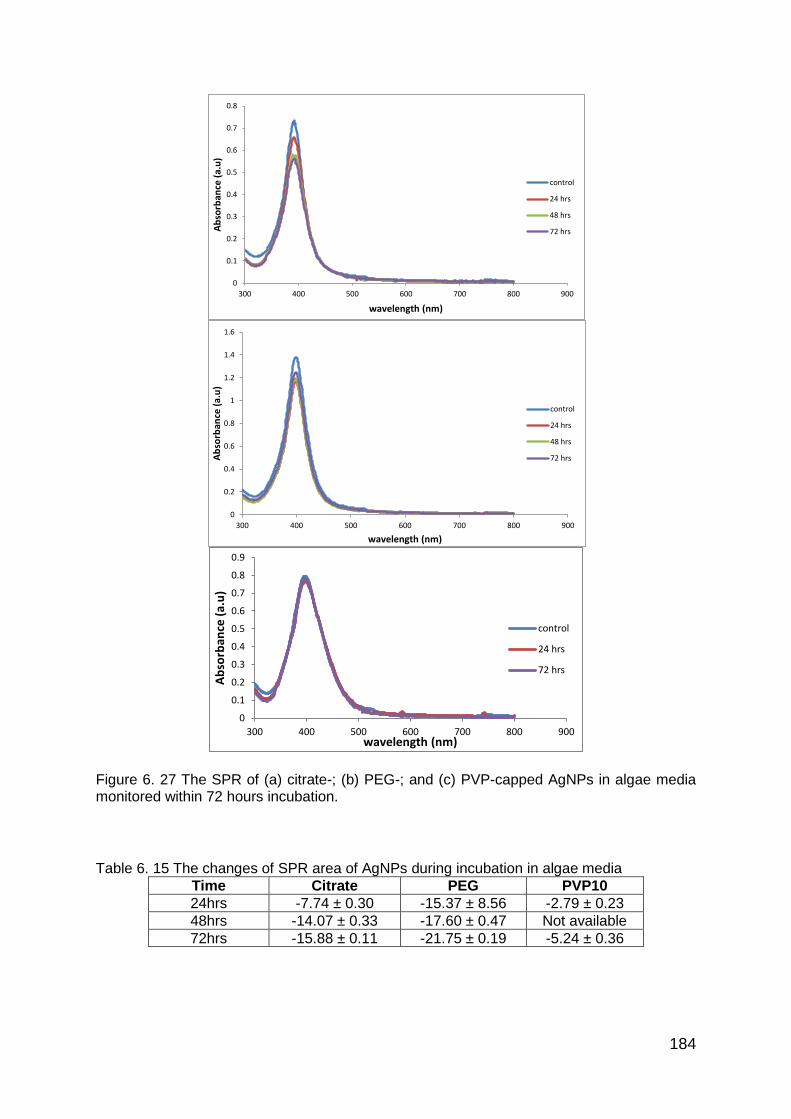
184
Figure 6. 27 The SPR of (a) citrate-; (b) PEG-; and (c) PVP-capped AgNPs in algae media monitored within 72 hours incubation.
Table 6. 15 The changes of SPR area of AgNPs during incubation in algae media
Time Citrate PEG PVP10 24hrs -7.74 ± 0.30 -15.37 ± 8.56 -2.79 ± 0.23 48hrs -14.07 ± 0.33 -17.60 ± 0.47 Not available 72hrs -15.88 ± 0.11 -21.75 ± 0.19 -5.24 ± 0.36
0
0.1
0.2
0.3
0.4
0.5
0.6
0.7
0.8
300 400 500 600 700 800 900
Ab
sorb
ance
(a.
u)
wavelength (nm)
control
24 hrs
48 hrs
72 hrs
0
0.2
0.4
0.6
0.8
1
1.2
1.4
1.6
300 400 500 600 700 800 900
Ab
sorb
ance
(a.
u)
wavelength (nm)
control
24 hrs
48 hrs
72 hrs
0
0.1
0.2
0.3
0.4
0.5
0.6
0.7
0.8
0.9
300 400 500 600 700 800 900
Ab
sorb
ance
(a.
u)
wavelength (nm)
control
24 hrs
72 hrs
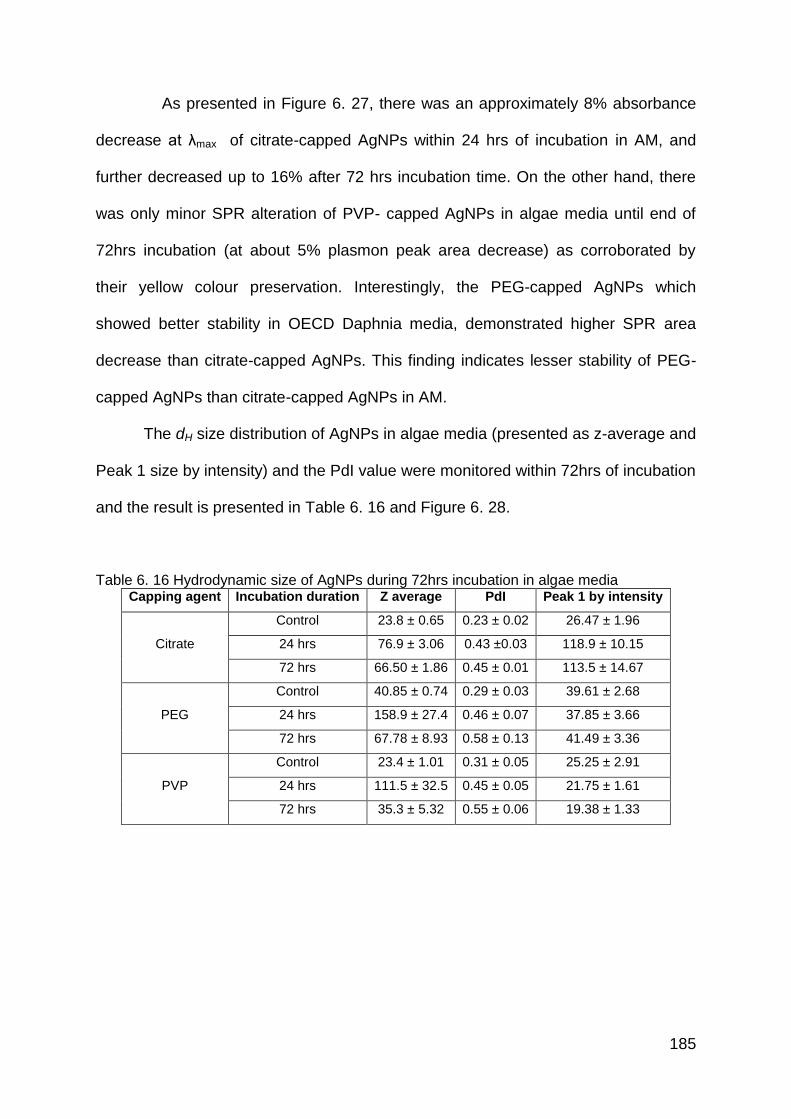
185
As presented in Figure 6. 27, there was an approximately 8% absorbance
decrease at λmax of citrate-capped AgNPs within 24 hrs of incubation in AM, and
further decreased up to 16% after 72 hrs incubation time. On the other hand, there
was only minor SPR alteration of PVP- capped AgNPs in algae media until end of
72hrs incubation (at about 5% plasmon peak area decrease) as corroborated by
their yellow colour preservation. Interestingly, the PEG-capped AgNPs which
showed better stability in OECD Daphnia media, demonstrated higher SPR area
decrease than citrate-capped AgNPs. This finding indicates lesser stability of PEG-
capped AgNPs than citrate-capped AgNPs in AM.
The dH size distribution of AgNPs in algae media (presented as z-average and
Peak 1 size by intensity) and the PdI value were monitored within 72hrs of incubation
and the result is presented in Table 6. 16 and Figure 6. 28.
Table 6. 16 Hydrodynamic size of AgNPs during 72hrs incubation in algae media Capping agent Incubation duration Z average PdI Peak 1 by intensity
Citrate
Control 23.8 ± 0.65 0.23 ± 0.02 26.47 ± 1.96
24 hrs 76.9 ± 3.06 0.43 ±0.03 118.9 ± 10.15
72 hrs 66.50 ± 1.86 0.45 ± 0.01 113.5 ± 14.67
PEG
Control 40.85 ± 0.74 0.29 ± 0.03 39.61 ± 2.68
24 hrs 158.9 ± 27.4 0.46 ± 0.07 37.85 ± 3.66
72 hrs 67.78 ± 8.93 0.58 ± 0.13 41.49 ± 3.36
PVP
Control 23.4 ± 1.01 0.31 ± 0.05 25.25 ± 2.91
24 hrs 111.5 ± 32.5 0.45 ± 0.05 21.75 ± 1.61
72 hrs 35.3 ± 5.32 0.55 ± 0.06 19.38 ± 1.33
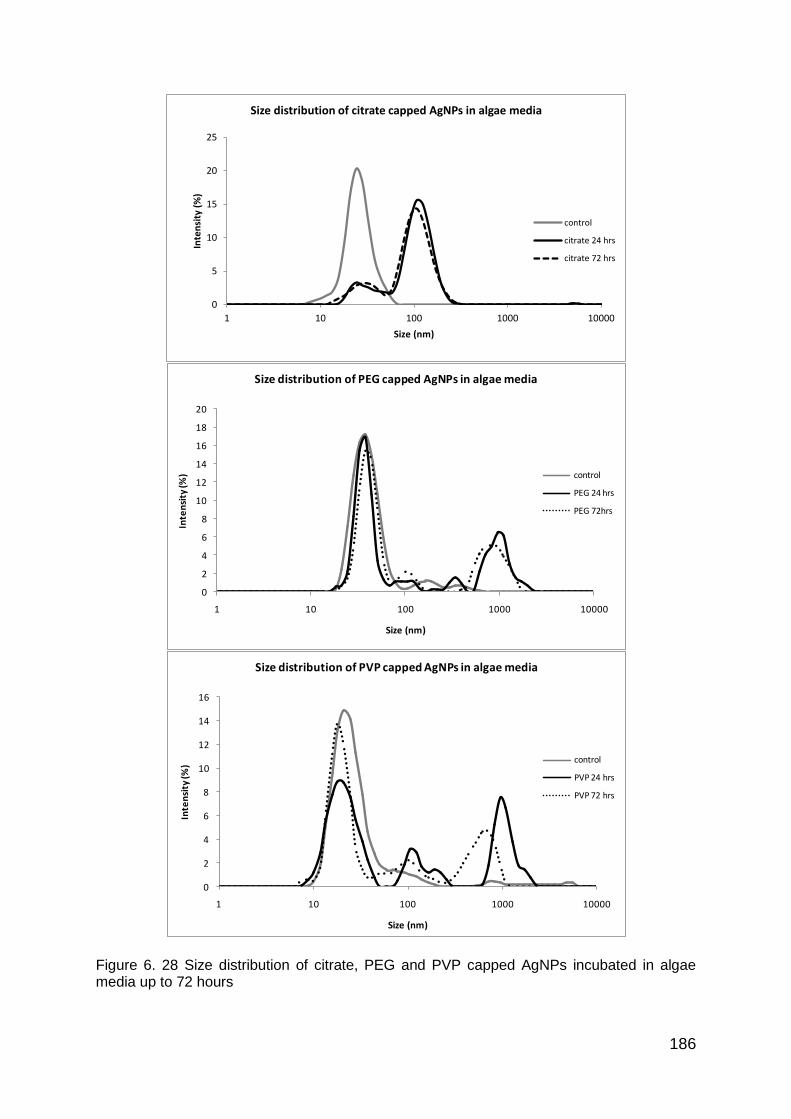
186
Figure 6. 28 Size distribution of citrate, PEG and PVP capped AgNPs incubated in algae media up to 72 hours
0
5
10
15
20
25
1 10 100 1000 10000
Inte
nsi
ty (
%)
Size (nm)
Size distribution of citrate capped AgNPs in algae media
control
citrate 24 hrs
citrate 72 hrs
0
2
4
6
8
10
12
14
16
18
20
1 10 100 1000 10000
Inte
nsi
ty (%
)
Size (nm)
Size distribution of PEG capped AgNPs in algae media
control
PEG 24 hrs
PEG 72hrs
0
2
4
6
8
10
12
14
16
1 10 100 1000 10000
Inte
nsi
ty (%
)
Size (nm)
Size distribution of PVP capped AgNPs in algae media
control
PVP 24 hrs
PVP 72 hrs
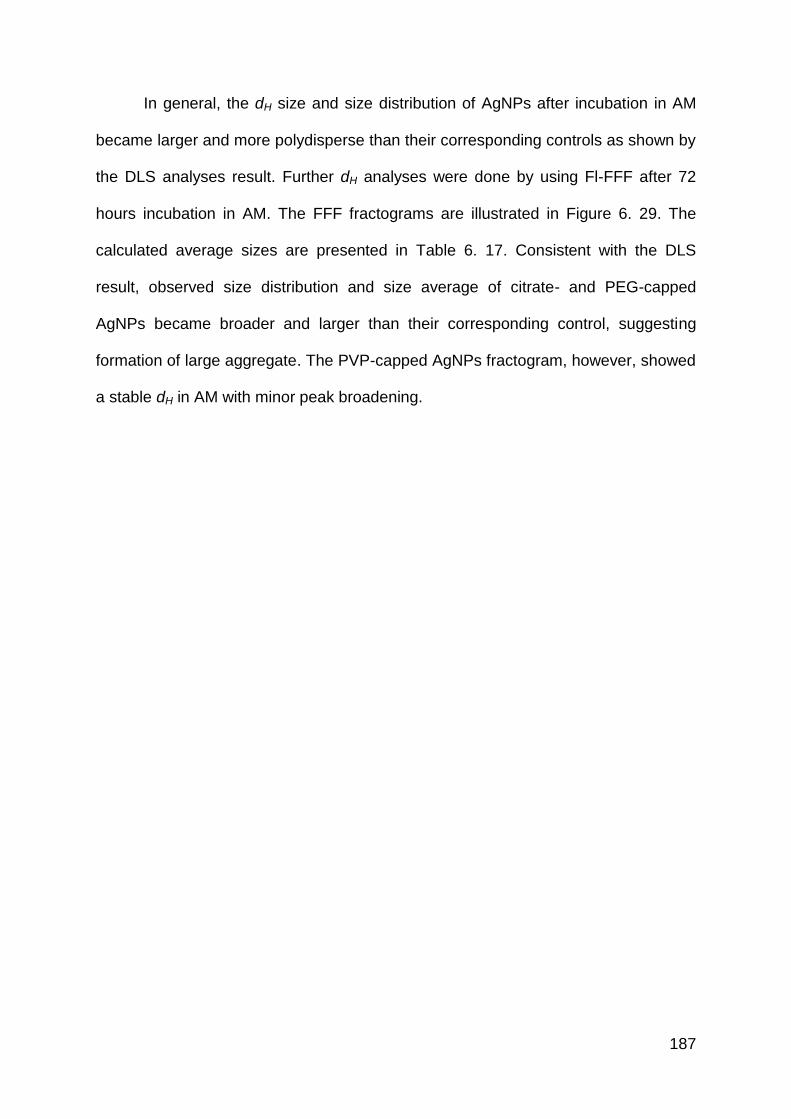
187
In general, the dH size and size distribution of AgNPs after incubation in AM
became larger and more polydisperse than their corresponding controls as shown by
the DLS analyses result. Further dH analyses were done by using Fl-FFF after 72
hours incubation in AM. The FFF fractograms are illustrated in Figure 6. 29. The
calculated average sizes are presented in Table 6. 17. Consistent with the DLS
result, observed size distribution and size average of citrate- and PEG-capped
AgNPs became broader and larger than their corresponding control, suggesting
formation of large aggregate. The PVP-capped AgNPs fractogram, however, showed
a stable dH in AM with minor peak broadening.
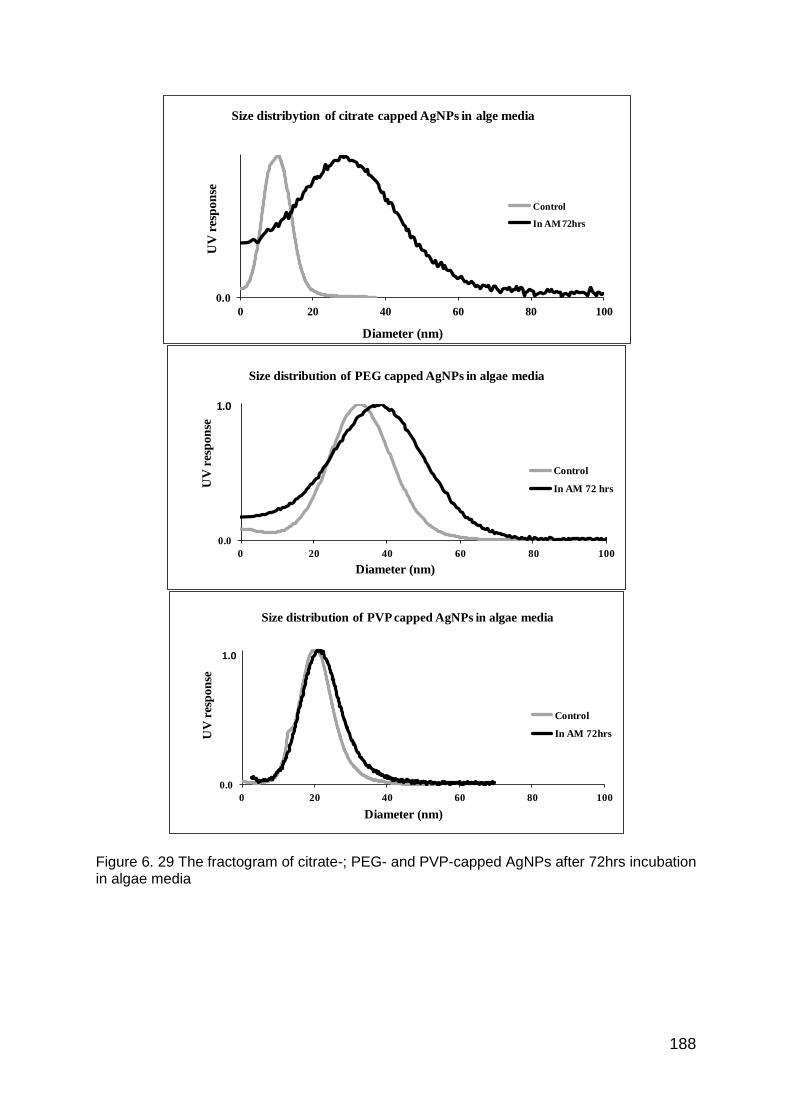
188
Figure 6. 29 The fractogram of citrate-; PEG- and PVP-capped AgNPs after 72hrs incubation in algae media
0.0
0 20 40 60 80 100
UV
res
po
nse
Diameter (nm)
Size distribytion of citrate capped AgNPs in alge media
Control
In AM 72hrs
0.0
0 20 40 60 80 100
UV
res
pon
se
Diameter (nm)
Size distribution of PEG capped AgNPs in algae media
Control
In AM 72 hrs
1.0
0.0
0 20 40 60 80 100
UV
res
pon
se
Diameter (nm)
Size distribution of PVP capped AgNPs in algae media
Control
In AM 72hrs
1.0
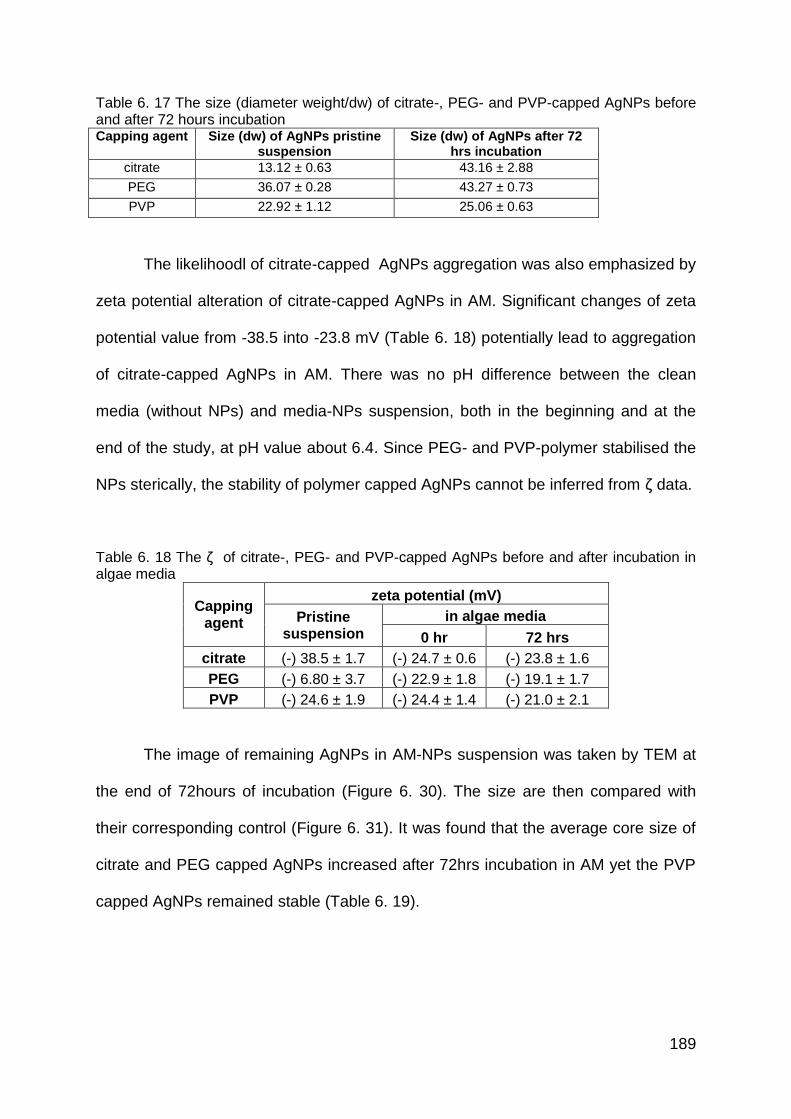
189
Table 6. 17 The size (diameter weight/dw) of citrate-, PEG- and PVP-capped AgNPs before and after 72 hours incubation Capping agent Size (dw) of AgNPs pristine
suspension Size (dw) of AgNPs after 72
hrs incubation
citrate 13.12 ± 0.63 43.16 ± 2.88
PEG 36.07 ± 0.28 43.27 ± 0.73
PVP 22.92 ± 1.12 25.06 ± 0.63
The likelihoodl of citrate-capped AgNPs aggregation was also emphasized by
zeta potential alteration of citrate-capped AgNPs in AM. Significant changes of zeta
potential value from -38.5 into -23.8 mV (Table 6. 18) potentially lead to aggregation
of citrate-capped AgNPs in AM. There was no pH difference between the clean
media (without NPs) and media-NPs suspension, both in the beginning and at the
end of the study, at pH value about 6.4. Since PEG- and PVP-polymer stabilised the
NPs sterically, the stability of polymer capped AgNPs cannot be inferred from ζ data.
Table 6. 18 The ζ of citrate-, PEG- and PVP-capped AgNPs before and after incubation in algae media
Capping agent
zeta potential (mV)
Pristine suspension
in algae media
0 hr 72 hrs
citrate (-) 38.5 ± 1.7 (-) 24.7 ± 0.6 (-) 23.8 ± 1.6
PEG (-) 6.80 ± 3.7 (-) 22.9 ± 1.8 (-) 19.1 ± 1.7
PVP (-) 24.6 ± 1.9 (-) 24.4 ± 1.4 (-) 21.0 ± 2.1
The image of remaining AgNPs in AM-NPs suspension was taken by TEM at
the end of 72hours of incubation (Figure 6. 30). The size are then compared with
their corresponding control (Figure 6. 31). It was found that the average core size of
citrate and PEG capped AgNPs increased after 72hrs incubation in AM yet the PVP
capped AgNPs remained stable (Table 6. 19).
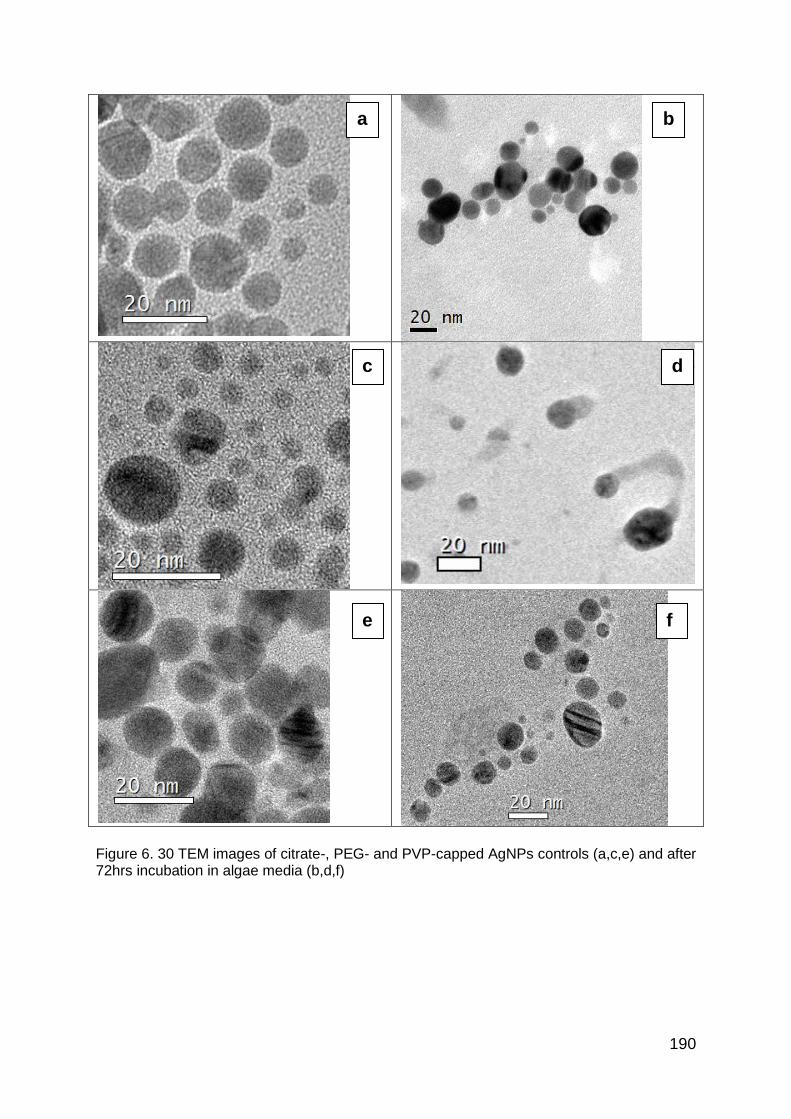
190
Figure 6. 30 TEM images of citrate-, PEG- and PVP-capped AgNPs controls (a,c,e) and after 72hrs incubation in algae media (b,d,f)
a b
c d
e f
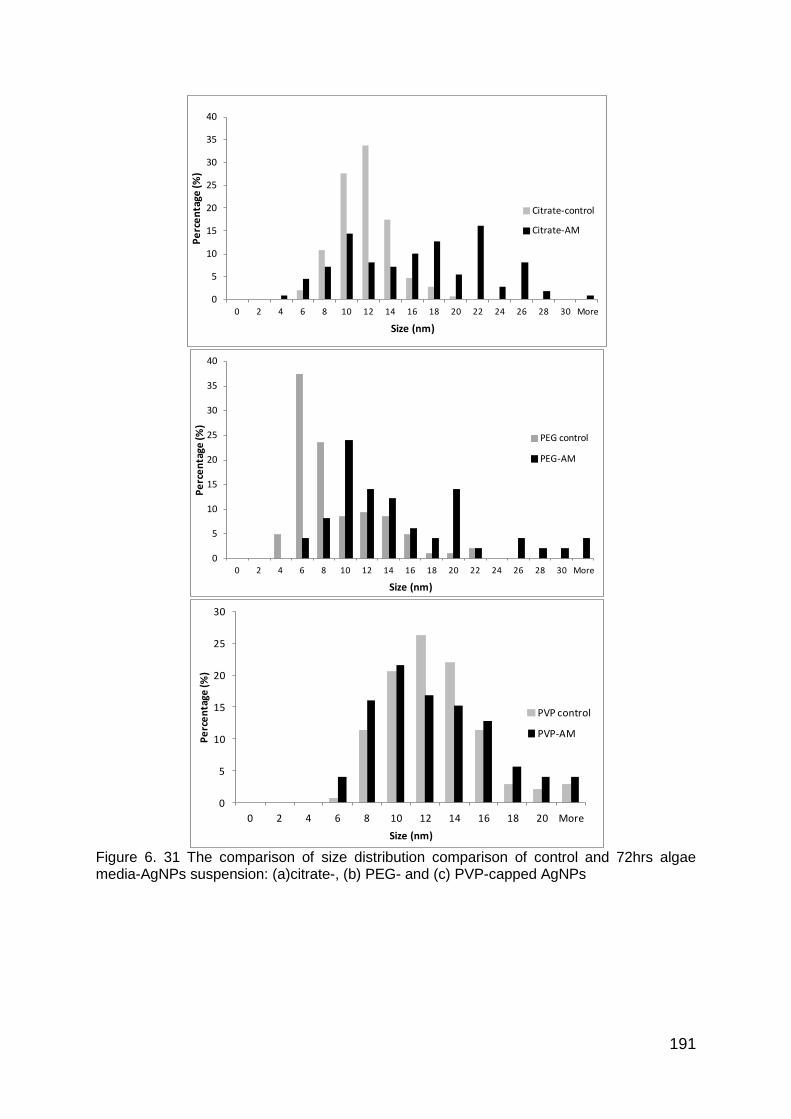
191
Figure 6. 31 The comparison of size distribution comparison of control and 72hrs algae media-AgNPs suspension: (a)citrate-, (b) PEG- and (c) PVP-capped AgNPs
0
5
10
15
20
25
30
35
40
0 2 4 6 8 10 12 14 16 18 20 22 24 26 28 30 More
Pe
rce
nta
ge (%
)
Size (nm)
Citrate-control
Citrate-AM
0
5
10
15
20
25
30
35
40
0 2 4 6 8 10 12 14 16 18 20 22 24 26 28 30 More
Pe
rce
nta
ge (%
)
Size (nm)
PEG control
PEG-AM
0
5
10
15
20
25
30
0 2 4 6 8 10 12 14 16 18 20 More
Pe
rce
nta
ge (%
)
Size (nm)
PVP control
PVP-AM
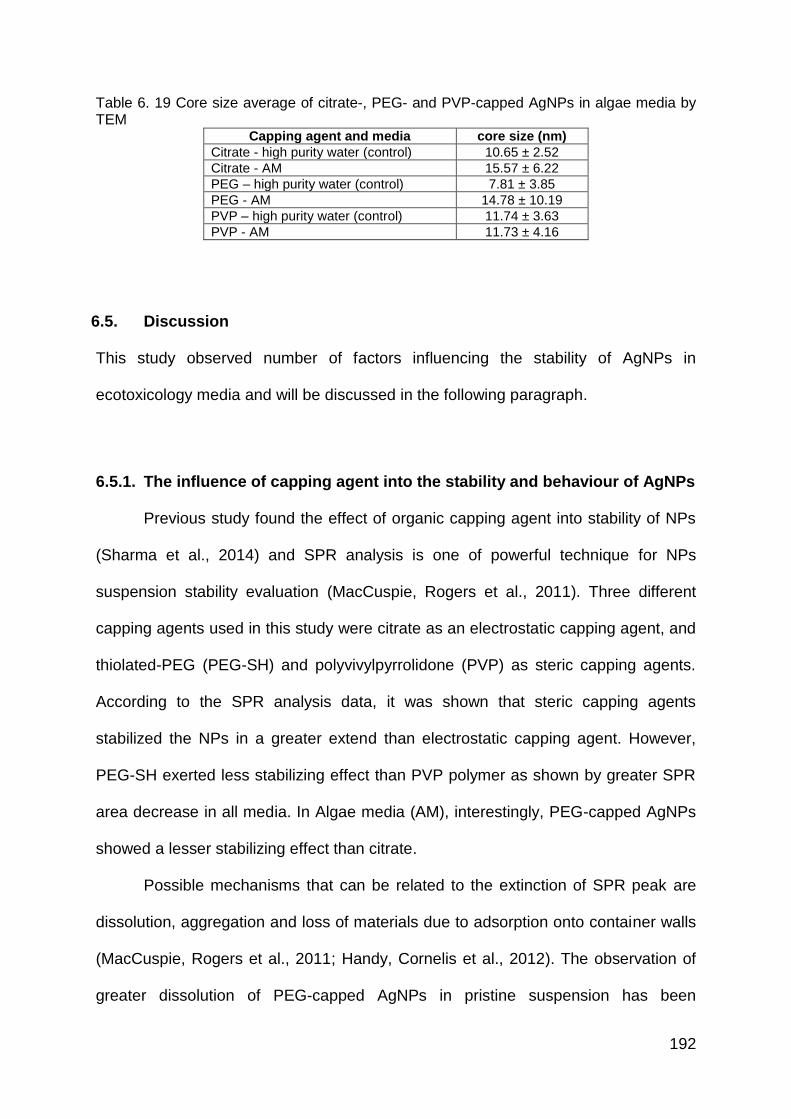
192
Table 6. 19 Core size average of citrate-, PEG- and PVP-capped AgNPs in algae media by TEM
Capping agent and media core size (nm)
Citrate - high purity water (control) 10.65 ± 2.52
Citrate - AM 15.57 ± 6.22
PEG – high purity water (control) 7.81 ± 3.85
PEG - AM 14.78 ± 10.19
PVP – high purity water (control) 11.74 ± 3.63
PVP - AM 11.73 ± 4.16
6.5. Discussion
This study observed number of factors influencing the stability of AgNPs in
ecotoxicology media and will be discussed in the following paragraph.
6.5.1. The influence of capping agent into the stability and behaviour of AgNPs
Previous study found the effect of organic capping agent into stability of NPs
(Sharma et al., 2014) and SPR analysis is one of powerful technique for NPs
suspension stability evaluation (MacCuspie, Rogers et al., 2011). Three different
capping agents used in this study were citrate as an electrostatic capping agent, and
thiolated-PEG (PEG-SH) and polyvivylpyrrolidone (PVP) as steric capping agents.
According to the SPR analysis data, it was shown that steric capping agents
stabilized the NPs in a greater extend than electrostatic capping agent. However,
PEG-SH exerted less stabilizing effect than PVP polymer as shown by greater SPR
area decrease in all media. In Algae media (AM), interestingly, PEG-capped AgNPs
showed a lesser stabilizing effect than citrate.
Possible mechanisms that can be related to the extinction of SPR peak are
dissolution, aggregation and loss of materials due to adsorption onto container walls
(MacCuspie, Rogers et al., 2011; Handy, Cornelis et al., 2012). The observation of
greater dissolution of PEG-capped AgNPs in pristine suspension has been
193
presented in Chapter 5, section 5.3.2, and most likely increased in ecotoxicology
media as also revealed in other studies (Zook, Long et al., 2011; Li and Lenhart,
2012). As a result, the reduction of PEG-capped AgNPs SPR peak was greater than
PVP-capped AgNPs in all media, and greater than citrate-capped AgNPs in Algae
media.
Aggregation was also another potential reason of SPR extinction in this study,
citrate-capped AgNPs in particular. The enlargement of dH size, the appearance of
sediments and the disappearance of NPs from the suspension corroborated citrate-
capped AgNPs aggregation. Although DLS and Fl-FFF dH size of PEG-capped
AgNPs in all media became larger, the occurrence of aggregation seemed to be
minor since well-dispersed PEG-capped AgNPs was found by TEM, apart from the
suspension in NM-1 and SM-1. Instead, dissolution-redeposition might be the case,
as the dissolution of PEG-capped AgNPs was followed by the increase of core size
of PEG-capped AgNPs, both in CM-10 and AM.
The potential of AgNPs adsorption into container walls was not evaluated in
this study. The implementation of acid wash and Ca(NO3)2 treatment to the plastic
ware as has been presented in section 3.2.4, however, could prervent NPs loss due
to adsorption. Thus, the reduction of SPR absorbance due to container adsorption in
this study was trivial.
In all media, PVP was shown to be imparted extensive stabilization effect. By
the action of loan pair donation from the amine functional head group, PVP polymer
coats the AgNPs surface and increases AgNPs stability in electrolyte media
(Henglein, 1993). Enhancing NPs stability by coating the NPs with PVP polymer has
been presented in number of studies (Reed, 1993; Zhang et al., 2007; Panacek,
Kolar et al., 2009).
194
6.5.2. Ionic strength dependence of stability and behaviour of AgNPs
The effect of ionic strength (IS) of media into NPs stability, both electrostatic
(Yoo, 1998; Komarneni et al., 2002; Sardar et al., 2009; Liu, Zhou et al., 2011) and
steric capped NPs studies (Guo et al., 2000; Li and El-Sayed, 2001; Liu et al., 2003;
Gerbec et al., 2005; EU, 2013), has been shown by many studies. In this study, two
concentrations of media, full strength and 10 fold dilution of CM, NM and SM were
used to evaluate the IS effect to AgNPs. Algae media (AM), having IS about 10%
less than CM-1 was also used.
It was clearly shown that electrostatically, citrate-capped AgNPs were more
sensitive to high IS media (CM-1; NM-1; SM-1) as presented by its rapid
disappearance of SPR, the vast increase of dH size, the appearance of sediment in
the container and NPs removal from the media as shown by TEM analysis.
According to DLVO (Derjaguin and Landau, Verweey and Overbeek) theory, the
stability of NPs was influenced by the extent of attractive and repulsive forces act on
the NPs (Mittal et al., 2013). The formation of electrostatic double layer (EDL)
surrounding the NPs can increase the repulsive force between NPs and stabilize the
dispersion electrostatically against aggregation. Any interruption to the thickness of
EDL will disrupt the stability of NPs and induce aggregation.
According to Debye-Hϋckel approximation, the thickness of EDL
( ⁄ depends on the temperature and the bulk electrolyte
concentration as presented in (Equation 6. 2) (Mittal, Chisti et al., 2013):
Κ= √
x √ (meter)-1
(Equation 6. 2)
where K is Debye-Hϋckel parameter, F is Faraday‘s constant (96,485 C.mol-1), I is
ionic strength, ε0 is permittivity of a vacuum (8.85 x 10⁻¹² farad.m-1), εr is dielectric
constant of solution, R is gas constant (8.31 J.K-1.mol-1) and T is temperature (K).
195
At 250C in water (εr at 250C = 78.57), than the K = 3.288 √ (nm-1), shows that
the EDL (~ ⁄ is only influenced by media‘s ionic strength where
I =
∑
(Equation 6. 3)
where ci is ionic concentration and zi is the ionic charge.
Given that the CM-1; NM-1 and SM-1 had a higher ionic strength than the
high purity water (the media of pristine suspension) as calculated in appendix 1, the
increase of I amplified the K value, point to the contraction of NPs‘s EDL layer and
lead to NPs aggregation. In dilution media (lower ionic strength), however, the
aggregation process was slower than in concentrated media as the ionic strength
(IS) was smaller than concentrated media.
In Algae media, where the IS difference was only 10% lower than CM-1, the
stability of citrate-capped AgNPs enhanced significantly. Loss of SPR area was only
about 16%, smaller than the SPR decrease of PEG-SH capped AgNPs (ca 22%).
Thus, other factors, such as cation and anion composition of media might contribute
to the stability of electrostatic capped AgNPs in electrolyte media.
6.5.3. Media composition dependence of stability and behaviour of AgNPs
One of interesting findings from this study was the observation of a better
stability of citrate-capped AgNPs in Algae media (AM) than in OECD Daphnia media
(CM-1). Even though the IS difference between CM-1 (8.88 mM) and AM (8.02 mM)
was less than 10%, but lower concentration of divalent cation in AM (ca 8%) than in
CM-1 (ca 74%) increase the stability of citrate-capped AgNPs. Dramatic effect of
divalent cation content in the media into NPs stability has also been revealed in other
studies (Haiss et al., 2007; French, Jacobson et al., 2009; Badawy, Luxton et al.,
2010) in fact Schulze-Hardy rule emphasized the dependences of colloid stability on
196
the valency of counter-ions only (Gerbec, Magana et al., 2005). Moreover higher
concentration of Ca2+ in media increases the likely of aggregation due to
complexation of Ca2+ with the carbonyl group of citrate coating (Komarneni, Li et al.,
2002; Yin et al., 2004). Since Ca2+ concentration in AM and CM-1 were 0.17 and 2
mM respectively, less aggregation of citrate-capped AgNPs in AM.
Another effect of media composition to the NPs stability was shown by the
appearance of SPR shoulder peak and shape transformation of citrate-capped
AgNPs in dilution media without chloride (NM-10 and SM-10). Since the presence of
shoulder peak can be explained by: (1) strong coupling between NPs due to Ostwald
ripening driven aggregation (Handy, von der Kammer et al., 2008; Baalousha, Stolpe
et al., 2011); (2) in-plane dipole resonance of nanoplate with edge length greater
than 100nm (Warheit, 2008) and or (3) dissolution-recrystallization of NPs
(Anderson, 1987; Yang, Zhang et al., 2007), these mechanisms might occur in
dilution media without chloride. NPs shapes other than spherical were also found
from PEG-SH capped AgNPs after 21 days incubation in NM-1 and SM-1. Large
non-spherical aggregates were also found from PVP-capped AgNPs after
suspended in SM-1 for 21 days. Yet no shape transformation was found in chloride
containing media.
The shape stability of AgNPs in chloride containing media potentially due to
the formation of Ag-Cl complexes on the AgNPs surface, and protect the particles
from further transformation. Both in dilution and concentrated chloride containing
media, all particles showed less SPR area decreases, indicating less transformation
of AgNPs. Similar findings was found from other studies (Badawy, Luxton et al.,
2010; Li, Lenhart et al., 2010) and also suggested earlier by Henglein (1993) that the
Cl- content prevents the aggregation of citrate-caped AgNPs.
197
6.6. Conclusion
This study showed that behaviour of AgNPs in ecotoxicology media were
manifested as colour preservation; SPR peak area alteration; dH and core size
changes; lesser zeta potential value (closer to zero); and shape transformation. The
stability was influenced by types of capping agent; ionic strength and chemical
composition of the media.
In general, steric capping agent (PEG-SH and PVP polymer) imparted better
stability than electrostatic capping agent (citrate) and PVP gave the best
stabililization effect in all media under study. In Algae media, however, PEG-capped
AgNPs showed less SPR stability than citrate-capped AgNPs due to dissolution-
redeposition of NPs. Lower divalent cation and Ca2+ content of Algae media than
OECD Daphnia media less interrupted the stability of citrate-capped AgNPs.
The effect of media ionic strength to the stability of electrostatic-capped
AgNPs was due to contraction of electrostatic double layer (EDL) of NPs. Chloride
containing media, however increased the stability of citrate-capped AgNPs at some
extent potentially due to formation of Ag-Cl complexes on the NPs surface. In
contrast, media without chloride transformed the shape of AgNPs potentially due to
Ostwald ripening driven aggregation, nanoplate formation and or dissolution-
recrystalization of NPs.
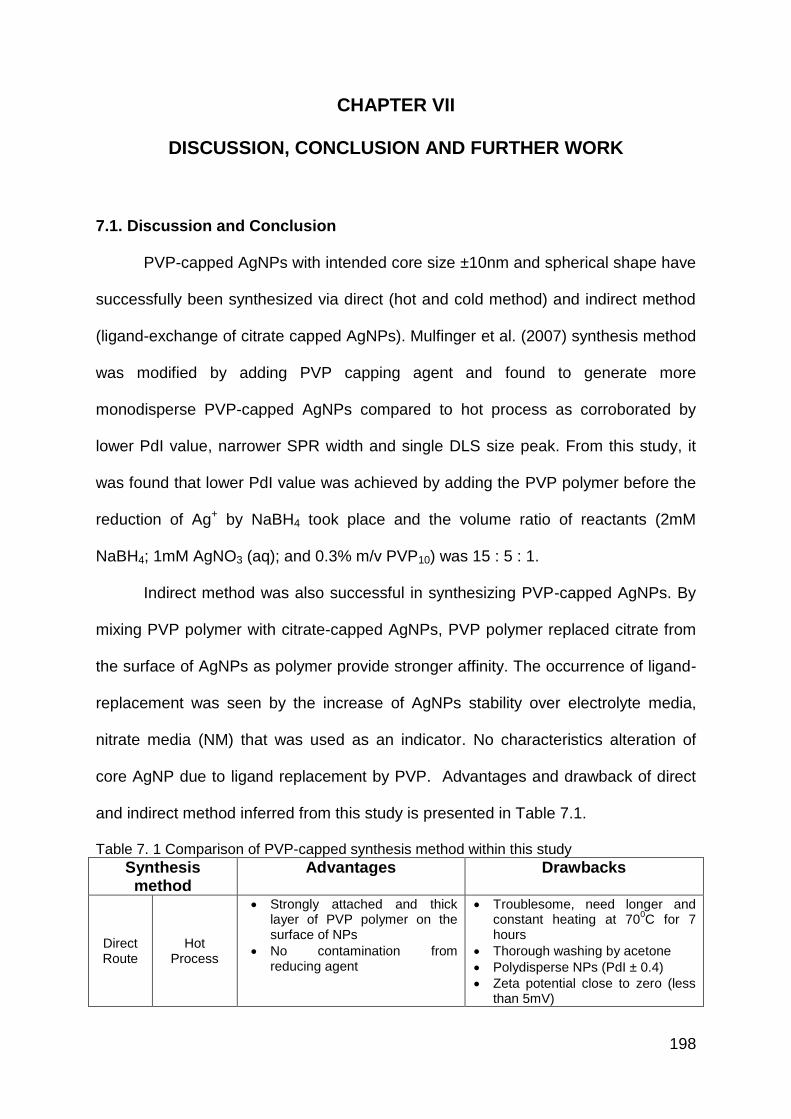
198
CHAPTER VII
DISCUSSION, CONCLUSION AND FURTHER WORK
7.1. Discussion and Conclusion
PVP-capped AgNPs with intended core size ±10nm and spherical shape have
successfully been synthesized via direct (hot and cold method) and indirect method
(ligand-exchange of citrate capped AgNPs). Mulfinger et al. (2007) synthesis method
was modified by adding PVP capping agent and found to generate more
monodisperse PVP-capped AgNPs compared to hot process as corroborated by
lower PdI value, narrower SPR width and single DLS size peak. From this study, it
was found that lower PdI value was achieved by adding the PVP polymer before the
reduction of Ag+ by NaBH4 took place and the volume ratio of reactants (2mM
NaBH4; 1mM AgNO3 (aq); and 0.3% m/v PVP10) was 15 : 5 : 1.
Indirect method was also successful in synthesizing PVP-capped AgNPs. By
mixing PVP polymer with citrate-capped AgNPs, PVP polymer replaced citrate from
the surface of AgNPs as polymer provide stronger affinity. The occurrence of ligand-
replacement was seen by the increase of AgNPs stability over electrolyte media,
nitrate media (NM) that was used as an indicator. No characteristics alteration of
core AgNP due to ligand replacement by PVP. Advantages and drawback of direct
and indirect method inferred from this study is presented in Table 7.1.
Table 7. 1 Comparison of PVP-capped synthesis method within this study Synthesis
method Advantages Drawbacks
Direct Route
Hot Process
Strongly attached and thick layer of PVP polymer on the surface of NPs
No contamination from reducing agent
Troublesome, need longer and constant heating at 70
0C for 7
hours
Thorough washing by acetone
Polydisperse NPs (PdI ± 0.4)
Zeta potential close to zero (less than 5mV)
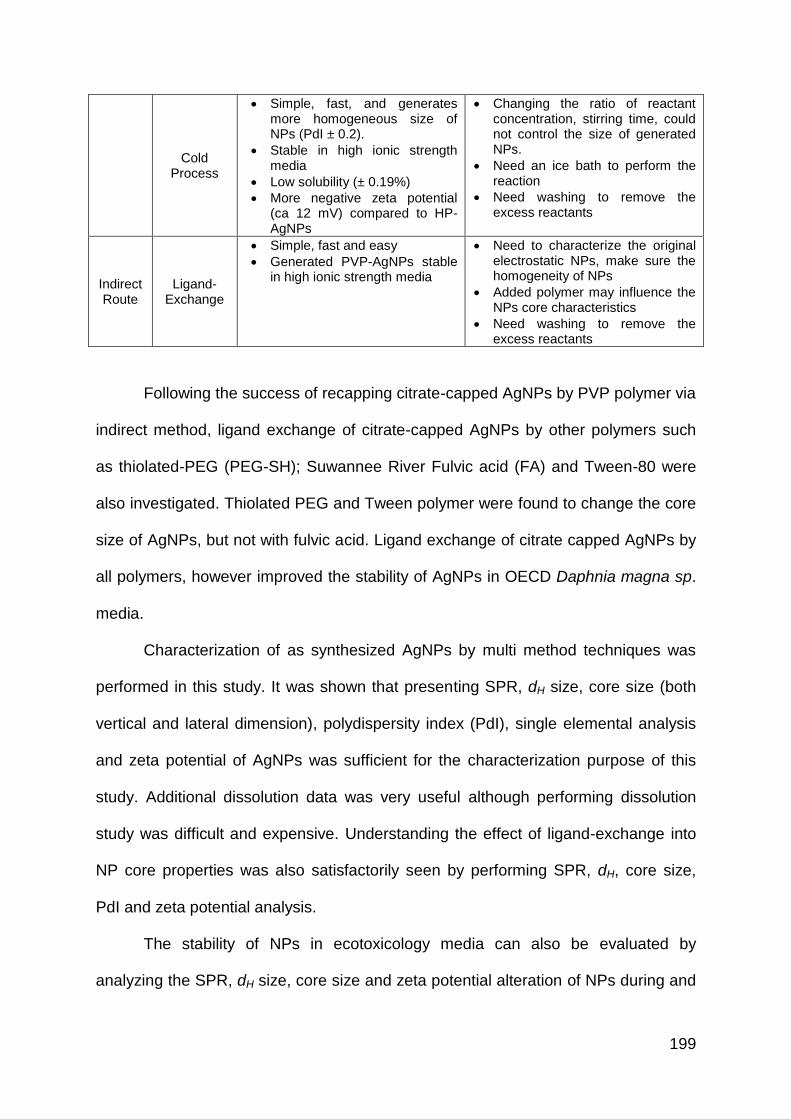
199
Cold Process
Simple, fast, and generates more homogeneous size of NPs (PdI ± 0.2).
Stable in high ionic strength media
Low solubility (± 0.19%)
More negative zeta potential (ca 12 mV) compared to HP-AgNPs
Changing the ratio of reactant concentration, stirring time, could not control the size of generated NPs.
Need an ice bath to perform the reaction
Need washing to remove the excess reactants
Indirect Route
Ligand- Exchange
Simple, fast and easy
Generated PVP-AgNPs stable in high ionic strength media
Need to characterize the original electrostatic NPs, make sure the homogeneity of NPs
Added polymer may influence the NPs core characteristics
Need washing to remove the excess reactants
Following the success of recapping citrate-capped AgNPs by PVP polymer via
indirect method, ligand exchange of citrate-capped AgNPs by other polymers such
as thiolated-PEG (PEG-SH); Suwannee River Fulvic acid (FA) and Tween-80 were
also investigated. Thiolated PEG and Tween polymer were found to change the core
size of AgNPs, but not with fulvic acid. Ligand exchange of citrate capped AgNPs by
all polymers, however improved the stability of AgNPs in OECD Daphnia magna sp.
media.
Characterization of as synthesized AgNPs by multi method techniques was
performed in this study. It was shown that presenting SPR, dH size, core size (both
vertical and lateral dimension), polydispersity index (PdI), single elemental analysis
and zeta potential of AgNPs was sufficient for the characterization purpose of this
study. Additional dissolution data was very useful although performing dissolution
study was difficult and expensive. Understanding the effect of ligand-exchange into
NP core properties was also satisfactorily seen by performing SPR, dH, core size,
PdI and zeta potential analysis.
The stability of NPs in ecotoxicology media can also be evaluated by
analyzing the SPR, dH size, core size and zeta potential alteration of NPs during and
200
after incubated in media. The changes of λmax and FWHM of AgNP‘s SPR indicates
size, aggregation state and shape transformation. Further confirmation of size
changes can be done by DLS, Fl-FFF, TEM, and AFM method, and shape
transformation by TEM. EDX was also useful to analyse chemical composition of
NPs both before and after incubation. This study found that PVP-polymer stabilized
AgNPs at greater extent compared to citrate, and thiolated PEG. Chloride content in
media apparently stabilized AgNPs, potentially due to formation Ag-Cl complexes on
AgNPs surface. On the other hand, media without chloride induced shape
transformation of AgNPs. Shape transformation was potentially caused by
dissolution-redeposition mechanism, but it needs further confirmation. Lower ionic
strength and lower divalent cation content in media gave lesser effect to both
electrostatically and sterically capped AgNPs.
Dissolution properties of PVP-capped AgNPs generated by cold process was
partly characterized by dialysis method and ICP-MS. It was shown that the silver ion
concentration in the bulk media was controlled by the chloride content of the media.
In ten fold dilution of OECD Daphnia magna sp. media, three phases of AgNPs
transformation were observed which were: (1) dissolving of Ag0 into Ag+, (2)
reduction of Ag+ concentration in the bulk suspension due to Ag-Cl complexes
formation, and (3) equilibrium state.
7.2. Further works
For the purpose of ecotoxicology study, tight constrained, fully characterized
and stable NPs are required. As this study is part of larger ecotoxicology study, all
those requirements was tried to be fulfilled. In this short study, due to time and
resources limitation, however, several attemps regarding synthesis, characterization
201
and stability test of AgNPs could not be performed, but suggested to be done in
future work.
In the synthesis process, to have a better monodispersity of NPs, separation
technique such as ultracentrifugation and Fl-FFF can be utilized for NPs size
segregation. It was expected to have a lower PdI value after separation process.
More polymers such as gum Arabic, SDS, chitosan, etc can be used in indirect
synthesis to have a stable AgNPs. Characterising dissolution properties of AgNPs
has not been comprehensively done in this study and suggested to be done in
further work not only by dialysis and ultrafiltration, but also using centrifugation, DGT,
and other techniques. NPs surface analysis after ligand-exchange by Raman
spectrometry, FTIR, H-NMR, STEM, etc, are also suggested to fully understand the
occurrence of ligand-exchange, and media effect onto AgNPs.
From this study, it was observed that PVP-capped AgNPs, both generated from
direct cold process and indirect method showed a satisfactory monodispersity and
stability in OECD Daphnia magne sp. and Algae media. Therefore this particular NPs
can be utilized for further ecotoxicology study.
202
Special acknowledgment
I would like to acknowledge Isabella Römer and Angelina Camina for synthesizing
some of citrate and PEG-SH capped AgNPs for this study. Also Isabella work with
FFF for size characterization of AgNPs after incubated in algae media is highly
appreciated.
LIST OF REFERENCES
(2005). Zetasizer Nano Series: User Manual, Malvern Instrument. (2011). "Solution-phase, dual LSPR-SERS plasmonic sensors of high sensitivity and stability based on chitosan-coated anisotropic silver nanoparticles." Journal of Materials Chemistry 21(11): 3625. Ahamed, M., M. S. AlSalhi, et al. (2010). "Silver nanoparticle applications and human health." Clinica Chimica Acta 411(23-24): 1841-1848. Alasonati, E., V. I. Slaveykova, et al. (2010). "Characterization of the colloidal organic matter from the Amazonian basin by asymmetrical flow field-flow fractionation and size exclusion chromatography." Water Research 44(1): 223-231. Allen, B. L., P. D. Kichambare, et al. (2008). "Biodegradation of Single-Walled Carbon Nanotubes through Enzymatic Catalysis." Nano Letters 8(11): 3899-3903. Allen, B. L., G. P. Kotchey, et al. (2009). "Mechanistic Investigations of Horseradish Peroxidase-Catalyzed Degradation of Single-Walled Carbon Nanotubes." Journal of the American Chemical Society 131(47): 17194-17205. Alvarez, P. J. J., V. Colvin, et al. (2009). "Research Priorities to Advance Eco-Responsible Nanotechnology." ACS Nano 3(7): 1616-1619. An, J., B. Tang, et al. (2008). "Sculpturing Effect of Chloride Ions in Shape Transformation from Triangular to Discal Silver Nanoplates." The Journal of Physical Chemistry C 112(39): 15176-15182. Anderson, R. L. (1987). "Practical statistics for analytical chemists." Andrievski, R. (2009). "Size-dependent effects in properties of nanostructured materials." Rev. Adv. Mater. Sci 21(2): 107-133. Araki, J. (2013). "Electrostatic or steric? - preparations and characterizations of well-dispersed systems containing rod-like nanowhiskers of crystalline polysaccharides." Soft Matter 9(16): 4125-4141. Auffan, M., J. Rose, et al. (2009). "Towards a definition of inorganic nanoparticles from an environmental, health and safety perspective." Nat Nano 4(10): 634-641. Auffan, M., J. Rose, et al. (2009). "Chemical stability of metallic nanoparticles: A parameter controlling their potential cellular toxicity in vitro." Env. Pollut. 157(4): 1127-1133. Aymonier, C., U. Schlotterbeck, et al. (2002). "Hybrids of silver nanoparticles with amphiphilic hyperbranched macromolecules exhibiting antimicrobial properties." Chemical Communications 0(24): 3018-3019.
Baalousha, M. and J. R. Lead (2007). "Characterization of Natural Aquatic Colloids (<5 nm) by Flow-Field Flow Fractionation and Atomic Force Microscopy." Environmental Science & Technology 41(4): 1111-1117. Baalousha, M. and J. R. Lead (2009). Overview of nanoscience in the environment. Environmental and human health impacts of nanotechnology. J. R. Lead and E. Smith. West Sussex, John Wiley & Sons, Ltd. Baalousha, M. and J. R. Lead (2012). "Rationalizing Nanomaterial Sizes Measured by Atomic Force Microscopy, Flow Field-Flow Fractionation, and Dynamic Light Scattering: Sample Preparation, Polydispersity, and Particle Structure." Environmental Science & Technology 46(11): 6134-6142. Baalousha, M., Y. Nur, et al. (2013). "Effect of monovalent and divalent cations, anions and fulvic acid on aggregation of citrate-coated silver nanoparticles." Science of The Total Environment 454–455(0): 119-131. Baalousha, M., B. Stolpe, et al. (2011). "Flow field-flow fractionation for the analysis and characterization of natural colloids and manufactured nanoparticles in environmental systems: a critical review." Journal of Chromatography A 1218(27): 4078-4103. Baalousha, M., B. Stolpe, et al. (2011). "Flow field-flow fractionation for the analysis and characterization of natural colloids and manufactured nanoparticles in environmental systems: A critical review." Journal of Chromatography A 1218(27): 4078-4103. Badawy, A. M. E., T. P. Luxton, et al. (2010). "Impact of environmental conditions (pH, ionic strength, and electrolyte type) on the surface charge and aggregation of silver nanoparticles suspensions." Environmental Science & Technology 44(4): 1260-1266. Balazs, A. C., T. Emrick, et al. (2006). "Nanoparticle Polymer Composites: Where Two Small Worlds Meet." Science 314(5802): 1107-1110. Balnois, E., G. Papastavrou, et al. (2007). Force microscopy and force measurement of environmental colloids. Environmental colloids and particles: behaviour, separation and characterisation. K. J. Wilkinson and J. R. Lead. Chichester, John Wiley & Sons. Barillet, S., A. Simon-Deckers, et al. (2010). "Toxicological consequences of TiO2, SiC nanoparticles and multi-walled carbon nanotubes exposure in several mammalian cell types: an in vitro study." Journal of Nanoparticle Research 12(1): 61-73. Batley, G. E., J. K. Kirby, et al. (2012). "Fate and Risks of Nanomaterials in Aquatic and Terrestrial Environments." Accounts of Chemical Research 46(3): 854-862.
Baun, A., N. Hartmann, et al. (2008). "Ecotoxicity of engineered nanoparticles to aquatic invertebrates: a brief review and recommendations for future toxicity testing." Ecotoxicology 17(5): 387-395. Baur, C., A. Bugacov, et al. (1998). "Nanoparticle manipulation by mechanical pushing: underlying phenomena and real-time monitoring." Nanotechnology 9: 360. Beckett, R., Z. Jue, et al. (1987). "Determination of molecular weight distributions of fulvic and humic acids using flow field-flow fractionation." Environmental Science & Technology 21(3): 289-295. Benn, T. M. and P. Westerhoff (2008). "Nanoparticle silver released into water from commercially available sock fabrics." Env. Sci. & Tech. 42(13): 7. Binnig, G., C. Gerber, et al. (1987). "Atomic resolution with atomic force microscope." Surface Science 189–190(0): 1-6. Binnig, G., C. F. Quate, et al. (1986). "Atomic Force Microscope." Physical Review Letters 56(9): 930-933. Bleeker, E. A. J., W. H. de Jong, et al. (2013). "Considerations on the EU definition of a nanomaterial: Science to support policy making." Regulatory Toxicology and Pharmacology 65(1): 119-125. Bone, A. J., B. P. Colman, et al. (2012). "Biotic and abiotic interactions in aquatic microcosms determine fate and toxicity of Ag nanoparticles: Part 2–Toxicity and Ag speciation." Environmental science & technology 46(13): 6925-6933. Bonet, F., V. Delmas, et al. (1999). "Synthesis of monodisperse Au, Pt, Pd, Ru and Ir nanoparticles in ethylene glycol." Nanostructured Materials 11(8): 1277-1284. Borm, P., F. C. Klaessig, et al. (2006). "Research strategies for safety evaluation of nanomaterials, part V: role of dissolution in biological fate and effects of nanoscale particles." Toxicological Sciences 90(1): 23-32. Brown, L. O. and J. E. Hutchison (2001). "Formation and Electron Diffraction Studies of Ordered 2-D and 3-D Superlattices of Amine-Stabilized Gold Nanocrystals†." The Journal of Physical Chemistry B 105(37): 8911-8916. Brunner, T. J., P. Wick, et al. (2006). "In vitro cytotoxicity of oxide nanoparticles: comparison to asbestos, silica and the effect of particle solubility." Env. Sci. & Tech. 40(14): 8. Brust, M. and C. J. Kiely (2002). "Some recent advances in nanostructure preparation from gold and silver particles: a short topical review." Colloids and Surface A: Physicochemical and Engineering Aspects 202: 12. BSI (2005). Vocabulary-Nanoparticles. PAS 71:2005. UK, British Standard Institution.
Burda, C., T. Green, et al. (2000). Optical spectroscopy of nanophase material. Characterization of nanophase materials. Z. L. Wang. Weineim, Wiley-VCH. Caragheorgheopol, A. and V. Chechik (2008). "Mechanistic aspects of ligand exchange in Au nanoparticles." Physical Chemistry Chemical Physics 10(33): 5029-5041. Casals, E., T. Pfaller, et al. (2011). "Hardening of the nanoparticle–protein corona in metal (Au, Ag) and oxide (Fe3O4, CoO, and CeO2) nanoparticles." Small 7(24): 3479-3486. Cedervall, T., I. Lynch, et al. (2007). "Understanding the nanoparticle–protein corona using methods to quantify exchange rates and affinities of proteins for nanoparticles." Proceedings of the National Academy of Sciences 104(7): 2050-2055. Chambers, B. A., A. Afrooz, et al. (2014). "Effects of Chloride and Ionic Strength on Physical Morphology, Dissolution, and Bacterial Toxicity of Silver Nanoparticles." Environmental Science & Technology 48(1): 761-769. Chen, C.-Y. and C. T. Jafvert (2011). "The role of surface functionalization in the solar light-induced production of reactive oxygen species by single-walled carbon nanotubes in water." Carbon 49(15): 5099-5106. Chen, K. L., B. A. Smith, et al. (2010). "Assesing the colloidal properties of engineered nanoparticles in water: case studies from fullerene C60 nanoparticles and carbon nanotubes." Env. Chem. 7(1): 18. Cheng, Y., L. Yin, et al. (2011). "Toxicity reduction of polymer-stabilized silver nanoparticles by sunlight." The Journal of Physical Chemistry C 115(11): 4425-4432. Cheng, Y., L. Yin, et al. (2011). "Toxicity Reduction of Polymer-Stabilized Silver Nanoparticles by Sunlight." The J. of Phy. Chem. C 115(11): 4425-4432. Chernousova, S. and M. Epple (2013). "Silver as Antibacterial Agent: Ion, Nanoparticle, and Metal." Angewandte Chemie-International Edition 52(6): 1636-1653. Chi, L. and C. Rothig (2000). Scanning Probe Microscopy of Nanoclusters. Characterization of nanophase materials. Z. L. Wang. Weinheil, Wiley-VCH. Choi, O., T. E. Clevenger, et al. (2009). "Role of sulfide and ligand strength in controlling nanosilver toxicity." Water Research 43(7): 1879-1886. Chou, K.-S. and Y.-S. Lai (2004). "Effect of polyvinyl pyrrolidone molecular weights on the formation of nanosized silver colloids." Materials Chemistry and Physics 83: 7. Christian, P. (2009). Nanomaterials: Properties, preparation and application. Environmental and Human Health Impacts of Nanotechnology. J. R. Lead and E. Smith. West Sussex, John Wiley & Sons, Ltd.
Christian, P., F. Kammer, et al. (2008). "Nanoparticles: structure, properties, preparation and behaviour in environmental media." Ecotoxicology 17(5): 326-343. Coleman, J. N., U. Khan, et al. (2006). "Small but strong: a review of the mechanical properties of carbon nanotube–polymer composites." Carbon 44(9): 1624-1652. Crane, M., R. D. Handy, et al. (2008). "Ecotoxicity test methods and environmental hazard assessment for engineered nanoparticles." Ecotoxicology 17(5): 421-437. Crespo, P., R. Litrán, et al. (2004). "Permanent Magnetism, Magnetic Anisotropy, and Hysteresis of Thiol-Capped Gold Nanoparticles." Physical Review Letters 93(8): 087204. Cumberland, S. A. and J. R. Lead (2009). "Particle size distributions of silver nanoparticles at environmentally relevant conditions." Journal of Chromatography A 1216(52): 9099-9105. Curtis, J., M. Greenberg, et al. (2006). "Nanotechnology and nanotoxicology." Toxicological reviews 25(4): 245-260. Dalai, S., S. Pakrashi, et al. (2013). "Cytotoxicity of TiO2 nanoparticles and their detoxification in a freshwater system." Aquatic Toxicology 138–139(0): 1-11. Daniel, M.-C. and D. Astruc (2004). "Gold Nanoparticles: Assembly, Supramolecular Chemistry, Quantum-size-related properties, and Applications toward biology, catalysis and nanotechnology." Chemical Reviews 104(1): 54. de Lima, R., A. B. Seabra, et al. (2012). "Silver nanoparticles: a brief review of cytotoxicity and genotoxicity of chemically and biogenically synthesized nanoparticles." Journal of Applied Toxicology 32(11): 867-879. Derfus, A. M., W. C. W. Chan, et al. (2003). "Probing the Cytotoxicity of Semiconductor Quantum Dots." Nano Letters 4(1): 11-18. Derjaguin, B. V. (1989). Theory of stability of colloids and thin films. New York, Consultant Bureau. Dolgaev, S. I., A. V. Simakin, et al. (2002). "Nanoparticles produced by laser ablation of solids in liquid environment." Applied Surface Science 186(1-4): 6. Domingos, R. F., M. A. Baalousha, et al. (2009). "Characterizing manufactured nanoparticles in the environment: Multimethod determination of particle sizes." Env. Sci. & Tech. 43(19): 8. Driver, S. M. and D. P. Woodruff (2000). "Adsorption Structures of 1-Octanethiol on Cu(111) Studied by Scanning Tunneling Microscopy." Langmuir 16(16): 6693-6700.
Ducamp-Sanguesa, C., R. Herrera-Urbina, et al. (1992). "Synthesis and characterization of fine and monodisperse silver particles of uniform shape." Journal of Solid State Chemistry 100(2): 272-280. Duffin, R., L. Tran, et al. (2007). "Proinflammogenic effects of low-toxicity and metal nanoparticles in vivo and in vitro: highlighting the role of particle surface area and surface reactivity." Inhalation toxicology 19(10): 849-856. Eaton, P. and P. West (2010). Atomic Force Microsocpy. Oxford, Oxford university press. EFSA, S. C. (2011). "Guidance on the risk assessment of the application of nanoscience and nanotechnologies in the food and feed chain." EFSA J 9(5): 2140. El-Sayed, M. A. (2004). "Small Is Different: Shape-, Size-, and Composition-Dependent Properties of Some Colloidal Semiconductor Nanocrystals." Accounts of Chemical Research 37(5): 326-333. El Badawy, A. M., A. Aly Hassan, et al. (2013). "Key Factors Controlling the Transport of Silver Nanoparticles in Porous Media." Environmental Science & Technology 47(9): 4039-4045. El Badawy, A. M., R. G. Silva, et al. (2010). "Surface Charge-Dependent Toxicity of Silver Nanoparticles." Environmental Science & Technology 45(1): 283-287. Elechiguerra, J. L., J. L. Burt, et al. (2005). "Interaction of silver nanoparticles with HIV-I." Journal of Nanobiotechnology 3(6): 10. Elechiguerra, J. L., L. Larios-Lopez, et al. (2005). "Corrosion at the nanoscale: the case of silver nanowires and nanoparticles." Chemistry of materials 17(24): 6042-6052. Elimelech, M. and C. R. O'Melia (1990). "Effect of particle size on collision efficiency in the deposition of Brownian particles with electrostatic energy barriers." Langmuir 6(6): 1153-1163. Endo, T., S. Yamamura, et al. (2005). "Localized surface plasmon resonance based optical biosensor using surface modified nanoparticle layer for label-free monitoring of antigen–antibody reaction." Science and Technology of Advanced Materials 6(5): 491-500. EPA (2013). "Priority Polutants." from http://water.epa.gov/scitech/methods/cwa/pollutants.cfm. EU (2013). "Nanotechnology." Retrieved 28th March, 2014, from http://ec.europa.eu/nanotechnology/index_en.html. Fabrega, J., S. R. Fawcett, et al. (2009). "Silver nanoparticle impact on bacterial growth: effect of pH, concentration, and organic matter." Environmental Science and Technology 43(19): 6.
Fabrega, J., S. N. Luoma, et al. (2011). "Silver nanoparticles: Behaviour and effects in the aquatic environment." Env. Intl. 37(2): 517-531. Fabrega, J., R. Zhang, et al. (2011). "Impact of silver nanoparticles on natural marine biofilm bacteria." Chemosphere 85(6): 961-966. Faraday, M. (1857). "The Bakerian Lecture: Experimental Relations of Gold (and Other Metals) to Light." Philosophical Transactions of the Royal Society of London 147: 145-181. Farkas, J., H. Peter, et al. (2011). "Characterization of the effluent from a nanosilver producing washing machine." Environment International 37(6): 1057-1062. Fauss, E. (2008). The silver nanotechnology commercial inventory, Woodrow WilsonInternational Centre for Scholar. Fonseca, F. C., G. F. Goya, et al. (2002). Superparamagnetism and magnetic properties of Ni nanoparticles embedded in SiO2. Physical Review B, American Physical Society. 66: 104406. Foss Hansen, S., B. H. Larsen, et al. (2007). "Categorization framework to aid hazard identification of nanomaterials." Nanotoxicology 1(3): 243-250. Franklin, N. M., N. J. Rogers, et al. (2007). "Comparative Toxicity of Nanoparticulate ZnO, Bulk ZnO, and ZnCl2 to a Freshwater Microalga (Pseudokirchneriella subcapitata): The Importance of Particle Solubility." Environmental Science & Technology 41(24): 8484-8490. Franklin, N. M., N. J. Rogers, et al. (2007). "Comparative toxicity of nanoparticulate ZnO, bulk ZnO, and ZnCl2 to a freshwater microalga (Pseudokirchneriella subcapitata): the importance of particle solubility." Env. Sci. and Tech. 41(24): 7. Freitas, C. and R. H. Müller (1998). "Effect of light and temperature on zeta potential and physical stability in solid lipid nanoparticle (SLN™) dispersions." International Journal of Pharmaceutics 168(2): 221-229. French, R. A., A. R. Jacobson, et al. (2009). "Influence of Ionic Strength, pH, and Cation Valence on Aggregation Kinetics of Titanium Dioxide Nanoparticles." Environmental Science & Technology 43(5): 1354-1359. Gangula, A., J. Chelli, et al. (2012). "Thione-gold nanoparticles interactions: Vroman-like effect, self-assembly and sensing." Journal of Materials Chemistry 22(43): 22866-22872. Gao, J., S. Youn, et al. (2009). "Dispersion and Toxicity of Selected Manufactured Nanomaterials in Natural River Water Samples: Effects of Water Chemical Composition." Env. Sci. & Tech. 43(9): 3322-3328.
Geranio, L., M. Heuberger, et al. (2009). "The behavior of silver nanotextiles during washing." Environmental Science and Technology 43(21): 6. Gerbec, J. A., D. Magana, et al. (2005). "Microwave-Enhanced Reaction Rates for Nanoparticle Synthesis." Journal of the American Chemical Society 127(45): 15791-15800. Ghosh, S. K., S. Nath, et al. (2004). "Solvent and Ligand Effects on the Localized Surface Plasmon Resonance (LSPR) of Gold Colloids." The Journal of Physical Chemistry B 108(37): 13963-13971. Giddings, J. (1993). "Field-flow fractionation: analysis of macromolecular, colloidal, and particulate materials." Science 260(5113): 1456-1465. Gigault, J., B. Grassl, et al. (2012). "A new analytical approach based on asymmetrical flow field-flow fractionation coupled to ultraviolet spectrometry and light scattering detection for SWCNT aqueous dispersion studies." Analyst 137(4): 917-923. Glover, R. D., J. M. Miller, et al. (2011). "Generation of Metal Nanoparticles from Silver and Copper Objects: Nanoparticle Dynamics on Surfaces and Potential Sources of Nanoparticles in the Environment." ACS Nano 5(11): 8950-8957. Gubbins, E. J., L. C. Batty, et al. (2011). "Phytotoxicity of silver nanoparticles to Lemna minor L." Env. Pollut. 159(6): 1551-1559. Guo, L., S. Yang, et al. (2000). "Highly monodisperse polymer-capped ZnO nanoparticles: Preparation and optical properties." Applied Physics Letters 76(20): 2901-2903. Haes, A. J. and R. P. Van Duyne (2002). "A Nanoscale Optical Biosensor: Sensitivity and Selectivity of an Approach Based on the Localized Surface Plasmon Resonance Spectroscopy of Triangular Silver Nanoparticles." Journal of the American Chemical Society 124(35): 10596-10604. Haiss, W., N. T. K. Thanh, et al. (2007). "Determination of size and concentration of gold nanoparticles from UV-Vis spectra." Analytical Chemistry 79(11): 4215-4221. Handy, R., R. Owen, et al. (2008). "The ecotoxicology of nanoparticles and nanomaterials: current status, knowledge gaps, challenges, and future needs." Ecotoxicology 17(5): 315-325. Handy, R. D., G. Cornelis, et al. (2012). "Ecotoxicity test methods for engineered nanomaterials: practical experiences and recommendations from the bench." Environmental Toxicology and Chemistry 31(1): 15-31. Handy, R. D., F. v. d. Kammer, et al. (2008). "The ecotoxicology and chemistry of manufactured nanoparticles." Ecotoxicology 17(4): 28.
Handy, R. D., F. von der Kammer, et al. (2008). "The ecotoxicology and chemistry of manufactured nanoparticles." Ecotoxicology 17(4): 287-314. Hansen, S. F., B. H. Larsen, et al. (2007). "Categorization framework to aid hazard identification of nanomaterials." Nanotoxicology 1(3): 243-U369. Hartmann, N. B., F. Von der Kammer, et al. (2010). "Algal testing of titanium dioxide nanoparticles—Testing considerations, inhibitory effects and modification of cadmium bioavailability." Toxicology 269(2–3): 190-197. Haruta, M. (1997). "Size-and support-dependency in the catalysis of gold." Catalysis Today 36(1): 153-166. Haruta, M. (2004). "Gold as a novel catalyst in the 21st century: preparation, working mechanism and applications." Gold bulletin 37(1-2): 27-36. Haruta, M., N. Yamada, et al. (1989). "Gold catalysts prepared by coprecipitation for low-temperature oxidation of hydrogen and of carbon monoxide." Journal of Catalysis 115(2): 301-309. Hassellov, M., F. V. D. Kammer, et al. (2007). Characterization of aquatic colloids and macromolecules by Field-flow fractionation. Environmental colloids and particles: behaviour, separation and characterization. K. J. Wilkinson and J. R. Lead. Chichester, John Wiley & Sons. 10. Hassellöv, M., J. Readman, et al. (2008). "Nanoparticle analysis and characterization methodologies in environmental risk assessment of engineered nanoparticles." Ecotoxicology 17(5): 344-361. Hassellov, M., J. W. Readman, et al. (2008). "Nanoparticle analysis and characterization methodologies in environmental risk assessment of engineered nanoparticles." Ecotoxicology 17: 18. Hassellov, M., F. von der Kammer, et al. (2007). "Characterisation of aquatic colloids and macromolecules by field-flow fractionation." IUPAC Series on Analytical and Physical Chemistry of Environmental Systems 10: 223. He, Y. T., J. Wan, et al. (2008). "Kinetic stability of hematite nanoparticles: the effect of particle sizes." Journal of Nanoparticle Research 10(2): 321-332. Heard, S. M., F. Grieser, et al. (1983). "The characterization of ag sols by electron microscopy, optical absorption, and electrophoresis." Journal of Colloid and Interface Science 93(2): 545-555. Henglein, A. (1993). "Physicochemical properties of small metal particles in solution: "microelectrode" reactions, chemisorption, composite metal particles, and the atom-to-metal transition." The J. of Phy. Chem. 97(21): 5457-5471. Henglein, A. and M. Giersig (1999). "Formation of Colloidal Silver Nanoparticles, capping action of citrate." Journal of Physical Chemistry 103: 7.
Ho, C.-M., S. K.-W. Yau, et al. (2010). "Oxidative Dissolution of Silver Nanoparticles by Biologically Relevant Oxidants: A Kinetic and Mechanistic Study." Chemistry – An Asian Journal 5(2): 285-293. Hoppe, C. E., M. Lazzari, et al. (2006). "One-step synthesis of gold and silver hydrosols using Poly (N-vinyl-2-pyrrolidone) as a reducing agent " Langmuir 22: 8. Hori, H., Y. Yamamoto, et al. (2004). "Diameter dependence of ferromagnetic spin moment in Au nanocrystals." Physical Review B 69(17): 174411. Hostetler, M. J., J. E. Wingate, et al. (1998). "Alkanethiolate Gold Cluster Molecules with Core Diameters from 1.5 to 5.2 nm: Core and Monolayer Properties as a Function of Core Size." Langmuir 14(1): 17-30. Hu, W., C. Peng, et al. (2011). "Protein Corona-Mediated Mitigation of Cytotoxicity of Graphene Oxide." ACS Nano 5(5): 3693-3700. Huang, C.-Y., D.-Y. Wang, et al. (2011). "Efficient light harvesting and carrier transport in PbS quantum dots/silicon nanotips heterojunctions." Journal of Physics D: Applied Physics 44(8): 085103. Huang, H. H., X. P. Ni, et al. (1996). "Photochemical Formation of Silver Nanoparticles in Poly(N-vinylpyrrolidone)." Langmuir 12(4): 909-912. Hunter, R. J. (1986). Foundations of colloid science. Oxford, Oxford University Press. Hunter, R. J. (1986). Foundations of colloids science. New York, Oxford University Press. Hussain, S., S. Boland, et al. (2009). "Oxidative stress and proinflammatory effects of carbon black and titanium dioxide nanoparticles: role of particle surface area and internalized amount." Toxicology 260(1): 142-149. Hwang, M. G., H. Katayama, et al. (2007). "Inactivation of< i> Legionella pneumophila</i> and< i> Pseudomonas aeruginosa</i>: Evaluation of the bactericidal ability of silver cations." Water Research 41(18): 4097-4104. Impellitteri, C. A., S. Harmon, et al. (2013). "Transformation of silver nanoparticles in fresh, aged, and incinerated biosolids." Water research 47(12): 3878-3886. Impellitteri, C. A., T. M. Tolaymat, et al. (2009). "The speciation of silver nanoparticles in antimicrobial fabric before and after exposure to a hypochlorite/detergent solution." Journal of environmental quality 38(4): 1528-1530. Jalili, N. and K. Laxminarayana (2004). "A review of atomic force microscopy imaging systems: application to molecular metrology and biological sciences." Mechatronics 14(8): 907-945.
Jana, N. R., L. Gearheart, et al. (2001). "Wet chemical synthesis of silver nanorods and nanowires of controllable aspect ratio." Chemical Communications 0(7): 617-618. Jin, X., M. Li, et al. (2010). "High-Throughput Screening of Silver Nanoparticle Stability and Bacterial Inactivation in Aquatic Media: Influence of Specific Ions." Env. Sci. & Tech. 44(19): 7321-7328. Jo, Y.-K., B. H. Kim, et al. (2009). "Antifungal Activity of silver ions and nanoparticles on phytopathogenic fungi." Plant Disease 93(10): 7. Jonte, J. H. and D. S. Martin Jr (1952). "The Solubility of Silver Chloride and the Formation of Complexes in Chloride Solution1." Journal of the American Chemical Society 74(8): 2052-2054. Ju-Nam, Y. and J. R. Lead (2008). "Manufactured nanoparticles: An overview of their chemistry, interactions and potential environmental implications." Science of the Total Environment 400: 19. Kaegi, R., B. Sinnet, et al. (2010). "Release of silver nanoparticles from outdoor facades." Env. Pollut. 158(9): 2900-2905. Kaegi, R., A. Voegelin, et al. (2013). "Fate and transformation of silver nanoparticles in urban wastewater systems." Water research 47(12): 3866-3877. Kamat, P. V., M. Gevaert, et al. (1997). "Photochemistry on Semiconductor Surfaces. Visible Light Induced Oxidation of C60 on TiO2 Nanoparticles." The Journal of Physical Chemistry B 101(22): 4422-4427. Kanninen, P., C. Johans, et al. (2008). "Influence of ligand structure on the stability and oxidation of copper nanoparticles." Journal of Colloid and Interface Science 318(1): 88-95. Kapoor, S. (1998). "Preparation, characterization, and surface modification of silver particles." Langmuir 14(5): 1021-1025. Keller, A. A., H. Wang, et al. (2010). "Stability and Aggregation of Metal Oxide Nanoparticles in Natural Aqueous Matrices." Environmental Science & Technology 44(6): 1962-1967. Kelly, K. L., E. Coronado, et al. (2002). "The Optical Properties of Metal Nanoparticles: The Influence of Size, Shape, and Dielectric Environment." The Journal of Physical Chemistry B 107(3): 668-677. Kelly, K. L., E. Coronado, et al. (2003). "The optical properties of metal nanoparticles: The influence of size, shape and dielectric environment." Journal of Physical Chemistry 107(3): 10. Kendall, M. and S. Holgate (2012). "Health impact and toxicological effects of nanomaterials in the lung." Respirology 17(5): 743-758.
Kent, R. D. and P. J. Vikesland (2011). "Controlled Evaluation of Silver Nanoparticle Dissolution Using Atomic Force Microscopy." Environmental Science & Technology. Khanna, S. N. and A. W. Castleman (2003). Quantum phenomena in clusters and nanostructures, Springer. Kim, B., C.-S. Park, et al. (2010). "Discovery and Characterization of Silver Sulfide Nanoparticles in Final Sewage Sludge Products." Environmental Science & Technology 44(19): 7509-7514. Kim, D., S. Jeong, et al. (2006). "Synthesis of silver nanoparticles using the polyol process and the influence of precursor injection." Nanotechnology 17: 6. Kirby, B. J. and E. F. H. Jr (2004). "Zeta potential of microfluidic substrate: 1. Theory, experimental techniques, and effect on separation." Electrophoresis 25(2): 187-202. Kittler, S., C. Greulich, et al. (2010). "Toxicity of silver nanoparticles increases during storage because of slow dissolution under release of silver ions." Chemistry of Materials 22(16): 7. Klaine, S. J., P. J. J. Alvarez, et al. (2008). "Nanomaterials in the environment: behavior, fate, bioavailability and effects." Environmental Toxicology and Chemistry 27(9): 27. Klein, J. (2007). "Probing the interactions of proteins and nanoparticles." Proceedings of the National Academy of Sciences 104(7): 2029-2030. Komarneni, S., D. Li, et al. (2002). "Microwave-polyol process for Pt and Ag nanoparticles." Langmuir 18(15): 5959-5962. Krüger, D., H. Fuchs, et al. (2001). "Interaction of short-chain alkane thiols and thiolates with small gold clusters: Adsorption structures and energetics." Journal of Chemical Physics 115(10): 4776-4786. Kvitek, L., A. Pana ek, et al. (2008). "Effect of Surfactants and Polymers on Stability and Antibacterial Activity of Silver Nanoparticles (NPs)." The J. Phy. Chem. C 112(15): 5825-5834. Kvitek, L., M. Vanickova, et al. (2009). "Initial Study on the Toxicity of Silver Nanoparticles (NPs) against Paramecium caudatum." The Journal of Physical Chemistry C 113(11): 4296-4300. Laaksonen, T., P. Ahonen, et al. (2006). "Stability and Electrostatics of Mercaptoundecanoic Acid-Capped Gold Nanoparticles with Varying Counterion Size." ChemPhysChem 7(10): 2143-2149. Lajunen, L. H. and P. Perämäki (2004). Spectrochemical analysis by atomic absorption and emission, Royal Society of Chemistry.
Lead, J. R. and E. Smith, Eds. (2009). Environmental and human health impacts of nanotechnology, Wiley. Ledwith, D. M., D. Aherne, et al. (2009). Approaches to the synthesis and characterization of spherical and anisotropic silver nanomaterials. Metallic Nanomaterials. C. Kumar. Weinheim, Wiley-VCH Verlag GmbH&Co. Ledwith, D. M., D. Aherne, et al. (2009). Approaches to the synthesis and characterization of spherical and anisotropic silver nanomaterials. Weinheim, Wiley-VCH Verlag GmbH & Co.KGaA. Lee, J. H., B. E. Park, et al. (2009). "Synthesis of fullerene[C60]-silver nanoparticles using various non-ionic surfactants under microwave irradiation." Current Applied Physics 9(2, Supplement): e152-e156. Lee, Y. S. (2008). Nanoparticles: Metals, Semiconductors, and Oxides. Self-Assembly and Nanotechnology. New Jersey, John Wiley and Sons. Levard, C., E. M. Hotze, et al. (2012). "Environmental Transformations of Silver Nanoparticles: Impact on Stability and Toxicity." Environmental Science & Technology 46(13): 6900-6914. Levard, C., S. Mitra, et al. (2013). "Effect of Chloride on the Dissolution Rate of Silver Nanoparticles and Toxicity to E. coli." Environmental Science & Technology 47(11): 5738-5745. Levard, C., B. C. Reinsch, et al. (2011). "Sulfidation processes of PVP-coated silver nanoparticles in aqueous solution: impact on dissolution rate." Environmental science & technology 45(12): 5260-5266. Li, X. and J. J. Lenhart (2012). "Aggregation and Dissolution of Silver Nanoparticles in Natural Surface Water." Environmental Science & Technology 46(10): 5378-5386. Li, X., J. J. Lenhart, et al. (2010). "Dissolution-Accompanied Aggregation Kinetics of Silver Nanoparticles." Langmuir 26(22): 16690-16698. null Li, X., J. J. Lenhart, et al. (2011). "Aggregation kinetics and dissolution of coated silver nanoparticles." Langmuir 28(2): 1095-1104. Li, Y. and M. A. El-Sayed (2001). "The effect of stabilizers on the catalytic activity and stability of Pd colloidal nanoparticles in the Suzuki reactions in aqueous solution." The Journal of Physical Chemistry B 105(37): 8938-8943. Lidén, G. (2011). "The European Commission Tries to Define Nanomaterials." Annals of Occupational Hygiene 55(1): 1-5. I Lin, W., Y.-w. Huang, et al. (2006). "In vitro toxicity of silica nanoparticles in human lung cancer cells." Toxicology and Applied Pharmacology 217(3): 252-259.
Lin, X.-M. and A. C. Samia (2006). "Synthesis, assembly and physical properties of magnetic nanoparticles." Journal of Magnetism and Magnetic Materials 305(1): 10. Linnert, T., P. Mulvaney, et al. (1993). "Surface chemistry of colloidal silver: surface plasmon damping by chemisorbed iodide, hydrosulfide (SH-), and phenylthiolate." The Journal of Physical Chemistry 97(3): 679-682. Liu, J. and R. H. Hurt (2010). "Ion Release Kinetics and Particle Persistence in Aqueous Nano-Silver Colloids." Environmental Science & Technology 44(6): 2169-2175. null Liu, J., D. A. Sonshine, et al. (2010). "Controlled Release of Biologically Active Silver from Nanosilver Surfaces." ACS Nano 4(11): 6903-6913. Liu, S., X. Qian, et al. (2003). "Preparation and characterization of polymer-capped CdS nanocrystals." Journal of physics and chemistry of solids 64(3): 455-458. Liu, W., Q. Zhou, et al. (2011). "Environmental and biological influences on the stability of silver nanoparticles." Chinese Science Bulletin 56(19): 2009-2015. Liu, Z., Z. Li, et al. (2006). "Manipulation, dissection, and lithography using modified tapping mode atomic force microscope." Microscopy Research and Technique 69(12): 998-1004. Liz-Marzán, L. M., M. Giersig, et al. (1996). "Synthesis of Nanosized Gold−Silica Core−Shell Particles." Langmuir 12(18): 4329-4335. Lohrke, J., A. Briel, et al. (2008). "Characterization of superparamagnetic iron oxide nanoparticles by asymmetrical flow-field-flow-fractionation." Nanomedicine 3(4): 437-452. Lopez, N. and J. K. Nørskov (2002). "Catalytic CO Oxidation by a Gold Nanoparticle: A Density Functional Study." Journal of the American Chemical Society 124(38): 11262-11263. Lorenz, C., L. Windler, et al. (2012). "Characterization of silver release from commercially available functional (nano)textiles." Chemosphere 89(7): 817-824. Lowry, G. V., B. P. Espinasse, et al. (2012). "Long-Term Transformation and Fate of Manufactured Ag Nanoparticles in a Simulated Large Scale Freshwater Emergent Wetland." Environmental Science & Technology 46(13): 7027-7036. Lowry, G. V., K. B. Gregory, et al. (2012). "Transformations of Nanomaterials in the Environment." Environmental Science & Technology 46(13): 6893-6899. Lu, L., R. W.-Y. Sun, et al. (2008). "Silver nanoparticles inhibit hepatitis B virus replication." Antiviral Therapy 13: 10.
Luoma, S. N. (2008). Silver nanotechnologies and the environment: old problems or new challenges, Woodrow Wilson International Center for Scholar, Project on Emerging Nanotechnologies. Luoma, S. N. (2008). Silver nanotechnologies and the environment: old problems or new challenges?, Woodrow Wilson International Centre for Scholars. PEN 15. MacCuspie, R. (2011). "Colloidal stability of silver nanoparticles in biologically relevant conditions." Journal of Nanoparticle Research 13(7): 2893-2908. MacCuspie, R. I., K. Rogers, et al. (2011). "Challenges for physical characterization of silver nanoparticles under pristine and environmentally relevant conditions." Journal of Environmental Monitoring 13(5): 1212-1226. Mafune, F., J.-y. Kohno, et al. (2000). "Structure and stability of silver nanoparticles in aqueous solution produced by laser ablation." The Journal of Physical Chemistry 104(35): 5. Mak, K. F., C. H. Lui, et al. (2009). "Observation of an electric-field-induced band gap in bilayer graphene by infrared spectroscopy." Physical review letters 102(25): 256405. Malinsky, M. D., K. L. Kelly, et al. (2001). "Chain Length Dependence and Sensing Capabilities of the Localized Surface Plasmon Resonance of Silver Nanoparticles Chemically Modified with Alkanethiol Self-Assembled Monolayers." Journal of the American Chemical Society 123(7): 1471-1482. Malvern Zeta potential an introduction in 30 minutes. Marambio-Jones, C. and E. V. Hoek (2010). "A review of the antibacterial effects of silver nanomaterials and potential implications for human health and the environment." Journal of Nanoparticle Research 12(5): 1531-1551. Marques-Hueso, J., R. Abargues, et al. (2012). Plasmon dumping in Ag-nanoparticles/polymer composite for optical detection of amines and thiols vapors. McFarland, A. D. and R. P. Van Duyne (2003). "Single Silver Nanoparticles as Real-Time Optical Sensors with Zeptomole Sensitivity." Nano Letters 3(8): 1057-1062. Mehra, M. and A. Gubeli (1971). "COMPLEXING CHARACTERISTICS OF INSOLUBLE SELENIDES. PT. 3.--MERCURIC SELENIDE." J LESS-COMMON METALS 25(2): 221-224. Meyers, M. A., A. Mishra, et al. (2006). "Mechanical properties of nanocrystalline materials." Progress in Materials Science 51(4): 427-556. Miao, A.-J., X.-Y. Zhang, et al. (2010). "Zinc oxide–engineered nanoparticles: Dissolution and toxicity to marine phytoplankton." Environmental Toxicology and Chemistry 29(12): 2814-2822.
Misra, S. K., A. Dybowska, et al. (2012). "The complexity of nanoparticle dissolution and its importance in nanotoxicological studies." Science of the Total Environment 438: 225-232. Mittal, A. K., Y. Chisti, et al. (2013). "Synthesis of metallic nanoparticles using plant extracts." Biotechnology Advances 31(2): 346-356. Mock, J., M. Barbic, et al. (2002). "Shape effects in plasmon resonance of individual colloidal silver nanoparticles." The Journal of Chemical Physics 116: 6755. Monteiller, C., L. Tran, et al. (2007). "The pro-inflammatory effects of low-toxicity low-solubility particles, nanoparticles and fine particles, on epithelial cells in vitro: the role of surface area." Occupational and environmental medicine 64(9): 609-615. Mulfinger, L., S. D. Solomon, et al. (2007). "Synthesis and Study of Silver Nanoparticles." J. of Chem. Edu. 84(2): 322. Mulvaney, P., T. Linnert, et al. (1991). "Surface chemistry of colloidal silver in aqueous solution: observations on chemisorption and reactivity." The Journal of Physical Chemistry 95(20): 7843-7846. Napper, D. H. (1977). "Steric stabilization." Journal of Colloid and Interface Science 58(2): 390-407. Navarro, E., F. Piccapietra, et al. (2008). "Toxicity of Silver Nanoparticles to Chlamydomonas reinhardtii." Environmental Science & Technology 42(23): 8959-8964. Navarro, E., F. Piccapietra, et al. (2008). "Toxicity of silver nanoparticles to Chlamydomonas reinhardtii." Environmental Science and Technology 42: 6. Nobs, L., F. Buchegger, et al. (2004). "Current methods for attaching targeting ligands to liposomes and nanoparticles." Journal of Pharmaceutical Sciences 93(8): 1980-1992. Novotny, L. and B. Hecht (2012). Principles of nano-optics, Cambridge university press. Nowack, B. and T. D. Bucheli (2007). "Occurence, behaviour and effects of nanoparticles in the environment." Env. Pollut. 150: 18. Nowack, B. and T. D. Bucheli (2007). "Occurrence, behavior and effects of nanoparticles in the environment." Env. Pollution 150(1): 5-22. Oberdörster, G., J. Ferin, et al. (1994). "Correlation between particle size, in vivo particle persistence, and lung injury." Environmental health perspectives 102(Suppl 5): 173.
Oberdörster, G., E. Oberdörster, et al. (2005). "Nanotoxicology: an emerging discipline evolving from studies of ultrafine particles." Environmental health perspectives 113(7): 823. OECD (2002). "OECD Guidelines for the testing of chemicals number 201: Freshwater algae and Cyanobacteris, Growth Inhibition Test." Retrieved 31st March, 2014, from http://www.oecd.org/chemicalsafety/testing/1946914.pdf. OECD (2004). Test No. 202: Daphnia sp. Acute Immobilisation Test, OECD Publishing. OECD/OCDE (2004). OECD Guideline for Testing of Chemicals: Daphnia sp., Acute Immobilisation Test, number 202. France, OECD/OCDE. Owens, F. J. and C. P. Poole Jr (2008). The physics and chemistry of nanosolids, John Wiley & Sons. Pal, T., T. K. Sau, et al. (1997). "Reversible Formation and Dissolution of Silver Nanoparticles in Aqueous Surfactant Media†." Langmuir 13(6): 1481-1485. Panacek, A., M. Kolar, et al. (2009). "Antifungal activity of silver nanoparticles against Candida spp." Biomaterials0 30(31): 8. Paná ek, A., L. Kv tek, et al. (2006). "Silver Colloid Nanoparticles: Synthesis, Characterization, and Their Antibacterial Activity." The Journal of Physical Chemistry B 110(33): 16248-16253. null Park, H.-J., J. Y. Kim, et al. (2009). "Silver-ion-mediated reactive oxygen species generation affecting bactericidal activity." Water Research 43(4): 1027-1032. Park, K., G. Tuttle, et al. (2013). "Stability of citrate-capped silver nanoparticles in exposure media and their effects on the development of embryonic zebrafish (Danio rerio)." Archives of pharmacal research 36(1): 125-133. Park, S. and K. Hamad-Schifferli (2008). "Evaluation of Hydrodynamic Size and Zeta-Potential of Surface-Modified Au Nanoparticle-DNA Conjugates via Ferguson Analysis." The Journal of Physical Chemistry C 112(20): 7611-7616. Park, T.-J., G. C. Papaefthymiou, et al. (2007). "Size-Dependent Magnetic Properties of Single-Crystalline Multiferroic BiFeO3 Nanoparticles." Nano Letters 7(3): 766-772. Park, Y. and R. C. Advincula (2011). "Hybrid Semiconductor Nanoparticles: pi-Conjugated Ligands and Nanostructured Films." Chemistry of Materials 23(19): 4273-4294. Parr, R. G., L. v. Szentpály, et al. (1999). "Electrophilicity Index." Journal of the American Chemical Society 121(9): 1922-1924.
Patakfalvi, R., S. Papp, et al. (2007). "The kinetic of homogeneous nucleation of silver nanoparticles stabilized by polymers." Journal of nanoparticle Research 9(3): 12. Pattanaik, M. and S. K. Bhaumik (2000). "Adsorption behaviour of polyvinyl pyrrolidone on oxide surfaces." Materials Letters 44(6): 352-360. PEN (2013). "The Project on Emerging Nanotechnologies ". Retrieved 28th March, 2014, from
http://www.nanotechproject.org/cpi/about/analysis/. Pettitt, M. E. and J. R. Lead (2013). "Minimum physicochemical characterisation requirements for nanomaterial regulation." Environment International 52: 41-50. Poda, A. R., A. J. Bednar, et al. (2011). "Characterization of silver nanoparticles using flow-field flow fractionation interfaced to inductively coupled plasma mass spectrometry." Journal of Chromatography A 1218(27): 4219-4225. Popa, M., T. Paradell, et al. (2007). "Stable silver colloidal dispersions using short chain polyethylene glycol." Colloids and Surface A: Physicochemical and Engineering Aspects 303: 7. Porel, S., S. Singh, et al. (2004). "Nanoparticle-Embedded Polymer: In Situ Synthesis, Free-Standing Films with Highly Monodisperse Silver Nanoparticles and Optical Limiting." Chemistry of Materials 17(1): 9-12. Powers, K. W., S. C. Brown, et al. (2006). "Research strategies for safety evaluation of nanomaterials. Part VI. Characterization of nanoscale particles for toxicological evaluation." Toxicological Sciences 90(2): 296-303. Prathna, T. C., N. Chandrasekaran, et al. (2011). "Studies on aggregation behaviour of silver nanoparticles in aqueous matrices: Effect of surface functionalization and matrix composition." Colloids and Surfaces A: Physicochemical and Engineering Aspects 390(1–3): 216-224. Premkumar, T., D. Kim, et al. (2007). "Polysorbate 80 as a Tool: Synthesis of Gold Nanoparticles." Macromolecular Rapid Communications 28(7): 888-893. Rahman, I. A. and V. Padavettan (2012). "Synthesis of silica nanoparticles by sol-gel: size-dependent properties, surface modification, and applications in silica-polymer nanocomposites—a review." Journal of Nanomaterials 2012: 8. Rao, C. N. R., G. U. Kulkarni, et al. (2002). "Size-Dependent Chemistry: Properties of Nanocrystals." Chemistry – A European Journal 8(1): 28-35. Ratte, H. T. (1999). "Bioaccumulation and toxicity of silver compounds: A review." Environmental Toxicology and Chemistry 18(1): 89-108. Rauscher, H., G. Roebben, et al. (2014). Towards a review of the EC Recommendation for a definition of the term "nanomaterial"
Part 1: Compilation of information concerning the experience with the definition. JRC Scientific and policy report. H. Rauscher and G. Roebben. Luxembourg, Joint Research Centre European Commission. 50: 289.
Reed, S. J. B. (1993). Electron Microprobe Analysis. Cambridge, University Cambridge, Press. Rehn, B., F. Seiler, et al. (2003). "Investigations on the inflammatory and genotoxic lung effects of two types of titanium dioxide: untreated and surface treated." Toxicology and Applied Pharmacology 189(2): 84-95. Reidy, B., A. Haase, et al. (2013). "Mechanisms of Silver Nanoparticle Release, Transformation and Toxicity: A Critical Review of Current Knowledge and Recommendations for Future Studies and Applications." Materials 6(6): 2295-2350. Reimer, L. (1997). Transmission electron microscopy: Physics of image formation and microanalysis. Berlin, Springer. Rejeski, D. (2009). Testimony of Project on Emerging Nanotechnology (PEN): Consumer Product Safety Commison (CPSC) FY 2010 Agenda and Priorities. Washington, Woodrow Wilson International Center for Scholars. Resch, R., D. Lewis, et al. (2000). "Manipulation of gold nanoparticles in liquid environments using scanning force microscopy." Ultramicroscopy 82(1–4): 135-139. Riddick, T. M. (1968). "Control of colloid stability through zeta potential." Blood 10: 1. Rochow, T. G. and P. A. Tucker (1994). Introduction to microscopy by means of light, electrons, X rays, or acoustics. New York, Plenum Press. Rogers, N. J., N. M. Franklin, et al. (2010). "Physico-chemical behaviour and algal toxicity of nanoparticulate CeO2 in freshwater." Environmental Chemistry 7(1): 50-60. Römer, I., T. A. White, et al. (2011). "Aggregation and dispersion of silver nanoparticles in exposure media for aquatic toxicity tests." J. of Chrom. A 1218(27): 4226-4233. RS (2004). Nanoscience and nanotechnologies: opportunities and uncertainties. London, The Royal Society. Rugar, D. and P. Hansma (1990). "Atomic force microscopy." Physics today 43(10): 23-30. Sardar, R., A. M. Funston, et al. (2009). "Gold Nanoparticles: Past, Present, and Future." Langmuir 25(24): 13840-13851. Sartor, M. Dynamic Light Scattering to determine the radius of small beads in Brownian motion in a solution, University of California San Diego. 2012.
Sau, T. K., A. Pal, et al. (2001). "Size Regime Dependent Catalysis by Gold Nanoparticles for the Reduction of Eosin." The Journal of Physical Chemistry B 105(38): 9266-9272. Schenk, J., L. Trobs, et al. (2012). "Simultaneous UV/Vis spectroscopy and surface enhanced Raman scattering of nanoparticle formation and aggregation in levitated droplets." Analytical Methods 4(5): 1252-1258. Schinca, D. C. and L. B. Scaffardi (2008). "Core and shell sizing of small silver-coated nanospheres by optical extinction spectroscopy." Nanotechnology 19(49): 495712. Schmitt, J., G. Decher, et al. (1997). "Metal nanoparticle/polymer superlattice films: Fabrication and control of layer structure." Advanced Materials 9(1): 61-65. Scown, T. M., E. M. Santos, et al. (2010). "Effects of Aqueous Exposure to Silver Nanoparticles of Different Sizes in Rainbow Trout." Toxicol. Sci. 115(2): 521-534. Seo, J., S. J. Kim, et al. (2009). "Enhancement of the photovoltaic performance in PbS nanocrystal:P3HT hybrid composite devices by post-treatment-driven ligand exchange." Nanotechnology 20(9): 095202.
Seo, W. S., H. H. Jo, et al. (2004). "Size‐Dependent Magnetic Properties of Colloidal Mn3O4 and MnO Nanoparticles." Angewandte Chemie International Edition 43(9): 1115-1117. Shakhashiri, B. Z., G. E. Dirreen, et al. (1980). "Solubility and complex ion equilibria of silver(I) species in aqueous solution." Journal of Chemical Education 57(11): 813. Sharma, V. K., K. M. Siskova, et al. (2014). "Organic-coated silver nanoparticles in biological and environmental conditions: Fate, stability and toxicity." Advances in Colloid and Interface Science 204(0): 15-34. Shi, H. B., R. Magaye, et al. (2013). "Titanium dioxide nanoparticles: a review of current toxicological data." Particle and Fibre Toxicology 10: 15-15. Shin, H. S., H. J. Yang, et al. (2004). "Mechanism of growth of colloidal silver nanoparticles stabilized by polyvinyl pyrrolidone in< i> γ</i>-irradiated silver nitrate solution." Journal of colloid and interface science 274(1): 89-94. Shinde, M., A. Pawar, et al. (2009). "Uncapped silver nanoparticles synthesis by DC arc thermal plasma technique for conductor paste formulation." Journal of Nanoparticle Research 11: 5. Shrivastava, S., T. Bera, et al. (2007). "Characterization of enhanced antibacterial effects of novel silver nanoparticles." Nanotech. 18(225103): 9. Shvedova, A. A., A. Pietroiusti, et al. (2012). "Mechanisms of carbon nanotube-induced toxicity: Focus on oxidative stress." Toxicology and Applied Pharmacology 261(2): 121-133.
Silva, A. R. and G. Unali (2011). "Controlled silver delivery by silver–cellulose nanocomposites prepared by a one-pot green synthesis assisted by microwaves." Nanotechnology 22(31): 315605. Silva, B. F. d., S. Pérez, et al. (2011). "Analytical chemistry of metallic nanoparticles in natural environments." TrAC Trends in Analytical Chemistry 30(3): 528-540. Silvert, P.-Y., R. Herrera-Urbina, et al. (1997). "Preparation of colloidal silver dispersions by the polyol process, Part 2: Mechanism of particle formation." Journal of Materials Chemistry 7(2): 7. Skandan, G. and A. Singhal (2006). Perspectives on the science and technology of nanoparticle synthesis. Nanomaterials Handbook. Y. Gogotsi. Boca Raton, CRC Press. Slistan-Grijalva, A., R. Herrera-Urbina, et al. (2005). "Assessment of growth of silver nanoparticles synthesized from an ethylene glycol-silver nitrate-polyvinylpyrrolidone solution." Physica E 25: 10. Smitha, S. L., K. M. Nissamudeen, et al. (2008). "Studies on surface plasmon resonance and photoluminescence of silver nanoparticles." Spectrochimica Acta Part A: Molecular and Biomolecular Spectroscopy 71(1): 186-190. Sondag-Huethorst, J. A. M., C. Schonenberger, et al. (1994). "Formation of Holes in Alkanethiol Monolayers on Gold." The Journal of Physical Chemistry 98(27): 6826-6834. Stobiecka, M., K. Coopersmith, et al. (2010). "Resonance elastic light scattering (RELS) spectroscopy of fast non-Langmuirian ligand-exchange in glutathione-induced gold nanoparticle assembly." Journal of Colloid and Interface Science 350(1): 168-177. Stolpe, B., L. Guo, et al. (2010). "Size and composition of colloidal organic matter and trace elements in the Mississippi River, Pearl River and the northern Gulf of Mexico, as characterized by flow field-flow fractionation." Marine Chemistry 118(3–4): 119-128. Stone, V., B. Nowack, et al. (2010). "Nanomaterials for environmental studies: Classification, reference material issues, and strategies for physico-chemical characterisation." Sci. of the Tot. Env. 408(7): 1745-1754. Struempler, A. W. (1973). "Adsorption characteristics of silver, lead, cadmium, zinc, and nickel on borosilicate glass, polyethylene, and polypropylene container surfaces." Analytical Chemistry 45(13): 2251-2254. Sugimoto, T. (1987). "Preparation of monodisperse colloidal particles." Advances in Colloid and Interface Science 28: 44.
Sun, Y., S. K. Gray, et al. (2011). "Surface chemistry: a non-negligible parameter in determining optical properties of small colloidal metal nanoparticles." Physical Chemistry Chemical Physics 13(25): 11814-11826. Tantra, R., S. Jing, et al. (2011). "Dispersion stability of nanoparticles in ecotoxicological investigations: the need for adequate measurement tools." Journal of Nanoparticle Research 13(9): 3765-3780. Tantra, R., S. Jing, et al. (2011). "Dispersion stability of nanoparticles in ecotoxicological investigations: the need for adequate measurement tools." Journal of Nanoparticle Research 13(9): 3765-3780. Taylor, H. E., J. R. Garbarino, et al. (2002). "Inductively coupled plasma-mass spectrometry as an element-specific detector for field-flow fractionation particle separation." Analytical chemistry 64(18): 2036-2041. Templeton, A. C., W. P. Wuelfing, et al. (1999). "Monolayer-Protected Cluster Molecules." Accounts of Chemical Research 33(1): 27-36. Templeton, R. C., P. L. Ferguson, et al. (2006). "Life-Cycle Effects of Single-Walled Carbon Nanotubes (SWNTs) on an Estuarine Meiobenthic Copepod†." Environmental Science & Technology 40(23): 7387-7393. Thomas, D. N., S. J. Judd, et al. (1999). "Flocculation modelling: a review." Water Research 33(7): 1579-1592. Thomas, J. C. (1987). "The determination of log normal particle size distributions by dynamic light scattering." Journal of Colloid and Interface Science 117(1): 187-192. Tolaymat, T. M., A. M. El Badawy, et al. (2010). "An evidence-based environmental perspective of manufactured silver nanoparticle in syntheses and applications: A systematic review and critical appraisal of peer-reviewed scientific papers." Science of the Total Environment 408(5): 999-1006. Torrey, D., K. Michael, et al. (2006). "Optimizing silicone emulsion stability using zeta potential." American Laboratory News, June/July.
Tourinho, P. S., C. A. Van Gestel, et al. (2012). "Metal‐based nanoparticles in soil: Fate, behavior, and effects on soil invertebrates." Environmental Toxicology and Chemistry 31(8): 1679-1692. Treuel, L. and G. U. Nienhaus (2012). "Toward a molecular understanding of nanoparticle–protein interactions." Biophysical Reviews 4(2): 137-147. Tsunoyama, H., H. Sakurai, et al. (2005). "Size-Specific Catalytic Activity of Polymer-Stabilized Gold Nanoclusters for Aerobic Alcohol Oxidation in Water." Journal of the American Chemical Society 127(26): 9374-9375. Tsuzuki, T. and P. G. McCormick (2004). "Mechanochemical synthesis of nanoparticles." Journal of Materials Science 39(16-17): 4.
Unrine, J. M., B. P. Colman, et al. (2012). "Biotic and abiotic interactions in aquatic microcosms determine fate and toxicity of Ag nanoparticles. Part 1. Aggregation and dissolution." Environmental science & technology 46(13): 6915-6924. Verwey, E. J. W., J. T. G. Overbeek, et al. (1999). Theory of the stability of lyophobic colloids, Courier Dover Publications. Vollath, D. (2008). Nanomaterials: An Introduction to Synthesis, Properties and Applications. Germany, WILEY-CH. Vollath, D. (2008). Nanomaterials: an introduction to synthesis, properties and applications. Weinheim, Wiley-VCH. Wang, C.-H., C.-J. Liu, et al. (2008). "Optimizing the size and surface properties of polyethylene glycol (PEG)–gold nanoparticles by intense x-ray irradiation." Journal of Physics D: Applied Physics 41(19): 195301. Wang, C., D. van der Vliet, et al. (2009). "Monodisperse Pt3Co nanoparticles as a catalyst for the oxygen reduction reaction: Size-dependent activity." The Journal of Physical Chemistry C 113(45): 19365-19368. Wang, X., X. Xu, et al. (1999). "Thermal conductivity of nanoparticle-fluid mixture." Journal of thermophysics and heat transfer 13(4): 474-480. Wang, Y. and Y. Xia (2004). "Bottom-Up and Top-Down Approaches to the Synthesis of Monodispersed Spherical Colloids of Low Melting-Point Metals." Nano Letters 4(10): 2047-2050. Warheit, D. B. (2008). "Absence of adequate material characterization?" Toxicological Sciences 101(2): 3. Washio, I., Y. Xiong, et al. (2006). "Reduction by the end groups of poly(vinyl pyrrolidone): A new and versatile route to the kinetically controlled synthesis of Ag Triangular Nanoplates." Advance Materials 18(13): 5. West, F. K., P. W. West, et al. (1966). "Adsorption of Traces of Silver on Container Surfaces." Analytical Chemistry 38(11): 1566-1570. Wilcoxon, J. P. and P. Provencio (2003). "Etching and Aging Effects in Nanosize Au Clusters Investigated Using High-Resolution Size-Exclusion Chromatography." The Journal of Physical Chemistry B 107(47): 12949-12957. Wiley, B. J., S. H. Im, et al. (2006). "Maneuvering the Surface Plasmon Resonance of Silver Nanostructures through Shape-Controlled Synthesis." The Journal of Physical Chemistry B 110(32): 15666-15675. Wilkinson, K. J. and J. R. Lead, Eds. (2007). Environmental colloids and particles: behaviour, separation and characterization. IUPAC series on analytical and physical chemistry of environmental system. Chicester, England, John Wiley & Sons.
Williams, P. S., M. H. Moon, et al. (1996). "Effect of viscosity on retention time and hydrodynamic lift forces in sedimentation/steric field-flow fractionation." Chemical engineering science 51(19): 4477-4488. Woehrle, G. H., L. O. Brown, et al. (2005). "Thiol-Functionalized, 1.5-nm Gold Nanoparticles through Ligand Exchange Reactions: Scope and Mechanism of Ligand Exchange." Journal of the American Chemical Society 127(7): 2172-2183. Xiong, Y., I. Washio, et al. (2006). "Poly(vinyl pyrrolidone): A Dual Functional Reductant and Stabilizer for the Facile Synthesis of Noble Metal Nanoplates in Aqueous Solutions." Langmuir 22(20): 8563-8570. null Xiu, Z.-M., J. Ma, et al. (2011). "Differential Effect of Common Ligands and Molecular Oxygen on Antimicrobial Activity of Silver Nanoparticles versus Silver Ions." Environmental Science & Technology 45(20): 9003-9008. Yan, S., Y. Wang, et al. (2006). "A study on the optical absorption properties of dielectric-mediated gold nanoshells." Physica E: Low-dimensional Systems and Nanostructures 33(1): 139-143. Yang, J., Q. Zhang, et al. (2007). "Dissolution-recrystallization mechanism for the conversion of silver nanospheres to triangular nanoplates." J. of Coll. and Inter. Sci. 308(1): 157-161. Yang, X., A. P. Gondikas, et al. (2011). "Mechanism of silver nanoparticle toxicity is dependent on dissolved silver and surface coating in Caenorhabditis elegans." Environmental science & technology 46(2): 1119-1127. Yin, B., H. Ma, et al. (2003). "Electrochemical synthesis of silver nanoparticles under protection of poly (N-vinylpyrrolidone)." The Journal of Physical Chemistry B 107(34): 8898-8904. Yin, H., T. Yamamoto, et al. (2004). "Large-scale and size-controlled synthesis of silver nanoparticles under microwave irradiation." Materials Chemistry and Physics 83(1): 66-70. Yoo, J. S. (1998). "Selective gas-phase oxidation at oxide nanoparticles on microporous materials." Catalysis today 41(4): 409-432. Zhang, L., Y. Jiang, et al. (2007). "Investigation into the antibacterial behaviour of suspensions of ZnO nanoparticles (ZnO nanofluids)." Journal of Nanoparticle Research 9(3): 479-489. Zhang, M. and B.-C. Ye (2011). "Colorimetric Chiral Recognition of Enantiomers Using the Nucleotide-Capped Silver Nanoparticles." Analytical Chemistry 83(5): 1504-1509.
Zhang, P. and T. K. Sham (2003). "X-Ray Studies of the Structure and Electronic Behavior of Alkanethiolate-Capped Gold Nanoparticles: The Interplay of Size and Surface Effects." Physical Review Letters 90(24): 245502. Zhang, Y.-W., R. Si, et al. (2003). "Facile alcohothermal synthesis, size-dependent ultraviolet absorption, and enhanced CO conversion activity of ceria nanocrystals." The Journal of Physical Chemistry B 107(37): 10159-10167. Zhang, Z., B. Zhao, et al. (1996). "PVP Protective Mechanism of Ultrafine Silver Powder Synthesized by Chemical Reduction Processes." Journal of Solid State Chemistry 121(1): 105-110. Zhou, W. P., A. Lewera, et al. (2006). "Size Effects in Electronic and Catalytic Properties of Unsupported Palladium Nanoparticles in Electrooxidation of Formic Acid." The Journal of Physical Chemistry B 110(27): 13393-13398. Zook, J. M., S. E. Long, et al. (2011). "Measuring silver nanoparticle dissolution in complex biological and environmental matrices using UV–visible absorbance." Analytical and bioanalytical chemistry 401(6): 1993-2002.
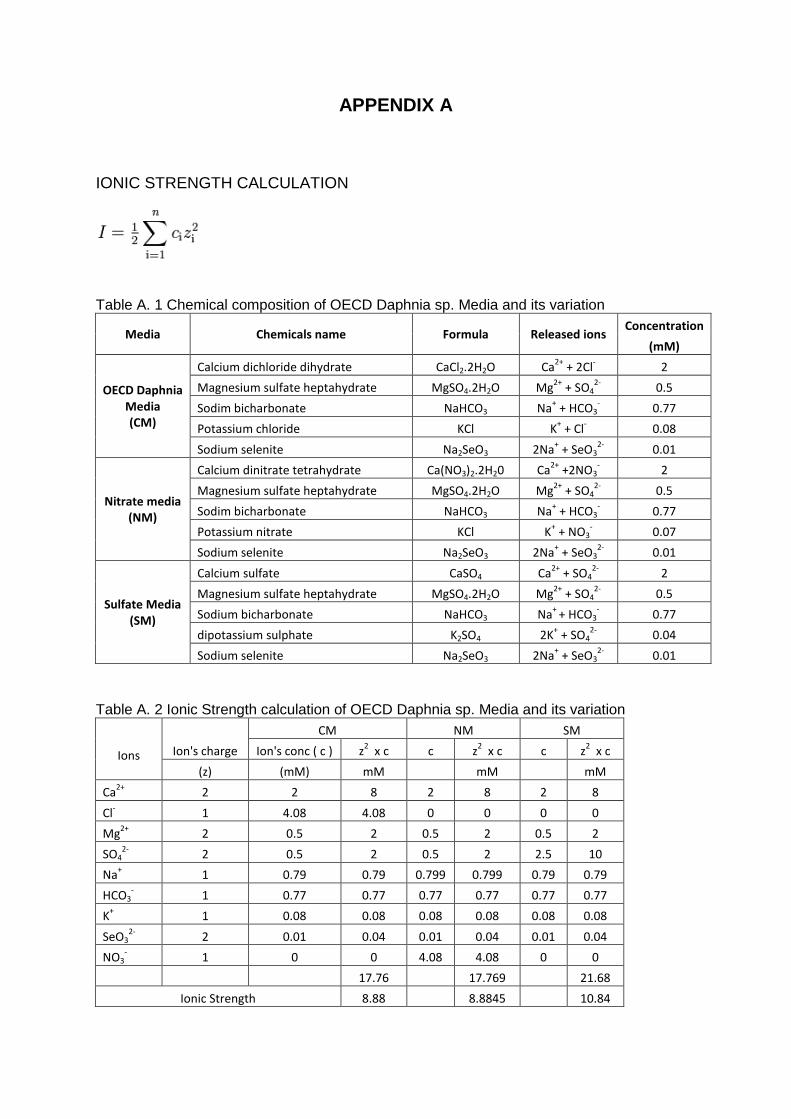
APPENDIX A
IONIC STRENGTH CALCULATION
Table A. 1 Chemical composition of OECD Daphnia sp. Media and its variation
Media Chemicals name Formula Released ions Concentration
(mM)
OECD Daphnia Media (CM)
Calcium dichloride dihydrate CaCl2.2H2O Ca2+
+ 2Cl- 2
Magnesium sulfate heptahydrate MgSO4.2H2O Mg2+
+ SO42-
0.5
Sodim bicharbonate NaHCO3 Na+ + HCO3
- 0.77
Potassium chloride KCl K+ + Cl
- 0.08
Sodium selenite Na2SeO3 2Na+ + SeO3
2- 0.01
Nitrate media (NM)
Calcium dinitrate tetrahydrate Ca(NO3)2.2H20 Ca2+
+2NO3- 2
Magnesium sulfate heptahydrate MgSO4.2H2O Mg2+
+ SO42-
0.5
Sodim bicharbonate NaHCO3 Na+ + HCO3
- 0.77
Potassium nitrate KCl K+ + NO3
- 0.07
Sodium selenite Na2SeO3 2Na+ + SeO3
2- 0.01
Sulfate Media (SM)
Calcium sulfate CaSO4 Ca2+
+ SO42-
2
Magnesium sulfate heptahydrate MgSO4.2H2O Mg2+
+ SO42-
0.5
Sodium bicharbonate NaHCO3 Na+
+ HCO3- 0.77
dipotassium sulphate K2SO4 2K+ + SO4
2- 0.04
Sodium selenite Na2SeO3 2Na+ + SeO3
2- 0.01
Table A. 2 Ionic Strength calculation of OECD Daphnia sp. Media and its variation
Ions
Ion's charge
CM NM SM
Ion's conc ( c ) z2 x c c z
2 x c c z
2 x c
(z) (mM) mM
mM
mM
Ca2+
2 2 8 2 8 2 8
Cl- 1 4.08 4.08 0 0 0 0
Mg2+
2 0.5 2 0.5 2 0.5 2
SO42-
2 0.5 2 0.5 2 2.5 10
Na+ 1 0.79 0.79 0.799 0.799 0.79 0.79
HCO3- 1 0.77 0.77 0.77 0.77 0.77 0.77
K+ 1 0.08 0.08 0.08 0.08 0.08 0.08
SeO32-
2 0.01 0.04 0.01 0.04 0.01 0.04
NO3- 1 0 0 4.08 4.08 0 0
17.76
17.769
21.68
Ionic Strength 8.88
8.8845
10.84
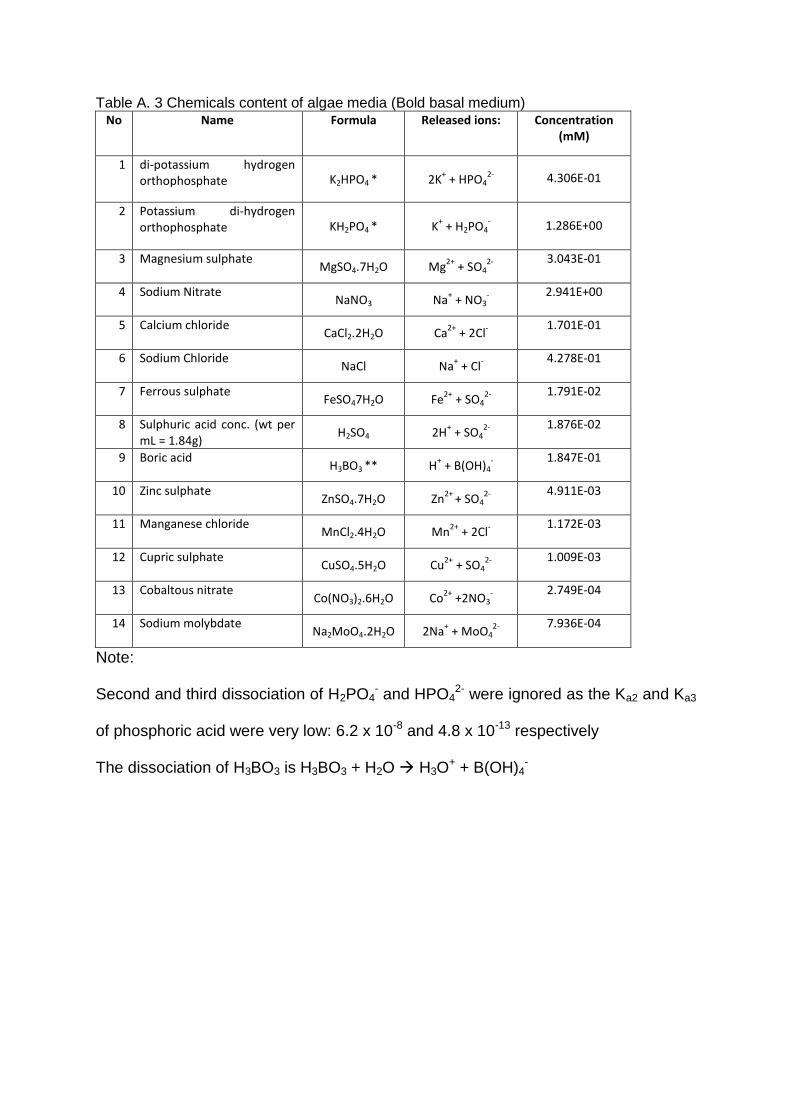
Table A. 3 Chemicals content of algae media (Bold basal medium) No Name Formula Released ions: Concentration
(mM)
1 di-potassium hydrogen orthophosphate K2HPO4 * 2K
+ + HPO4
2- 4.306E-01
2 Potassium di-hydrogen orthophosphate KH2PO4 * K
+ + H2PO4
- 1.286E+00
3 Magnesium sulphate MgSO4.7H2O Mg
2+ + SO4
2-
3.043E-01
4 Sodium Nitrate NaNO3 Na
+ + NO3
-
2.941E+00
5 Calcium chloride CaCl2.2H2O Ca
2+ + 2Cl
-
1.701E-01
6 Sodium Chloride NaCl Na
+ + Cl
-
4.278E-01
7 Ferrous sulphate FeSO47H2O Fe
2+ + SO4
2-
1.791E-02
8 Sulphuric acid conc. (wt per mL = 1.84g)
H2SO4 2H+ + SO4
2-
1.876E-02
9 Boric acid H3BO3 ** H
+ + B(OH)4
-
1.847E-01
10 Zinc sulphate ZnSO4.7H2O Zn
2+ + SO4
2-
4.911E-03
11 Manganese chloride MnCl2.4H2O Mn
2+ + 2Cl
-
1.172E-03
12 Cupric sulphate CuSO4.5H2O Cu
2+ + SO4
2-
1.009E-03
13 Cobaltous nitrate Co(NO3)2.6H2O Co
2+ +2NO3
-
2.749E-04
14 Sodium molybdate Na2MoO4.2H2O 2Na
+ + MoO4
2-
7.936E-04
Note:
Second and third dissociation of H2PO4- and HPO4
2- were ignored as the Ka2 and Ka3
of phosphoric acid were very low: 6.2 x 10⁻⁸ and 4.8 x 10⁻¹³ respectively
The dissociation of H3BO3 is H3BO3 + H2O H3O+ + B(OH)4
-
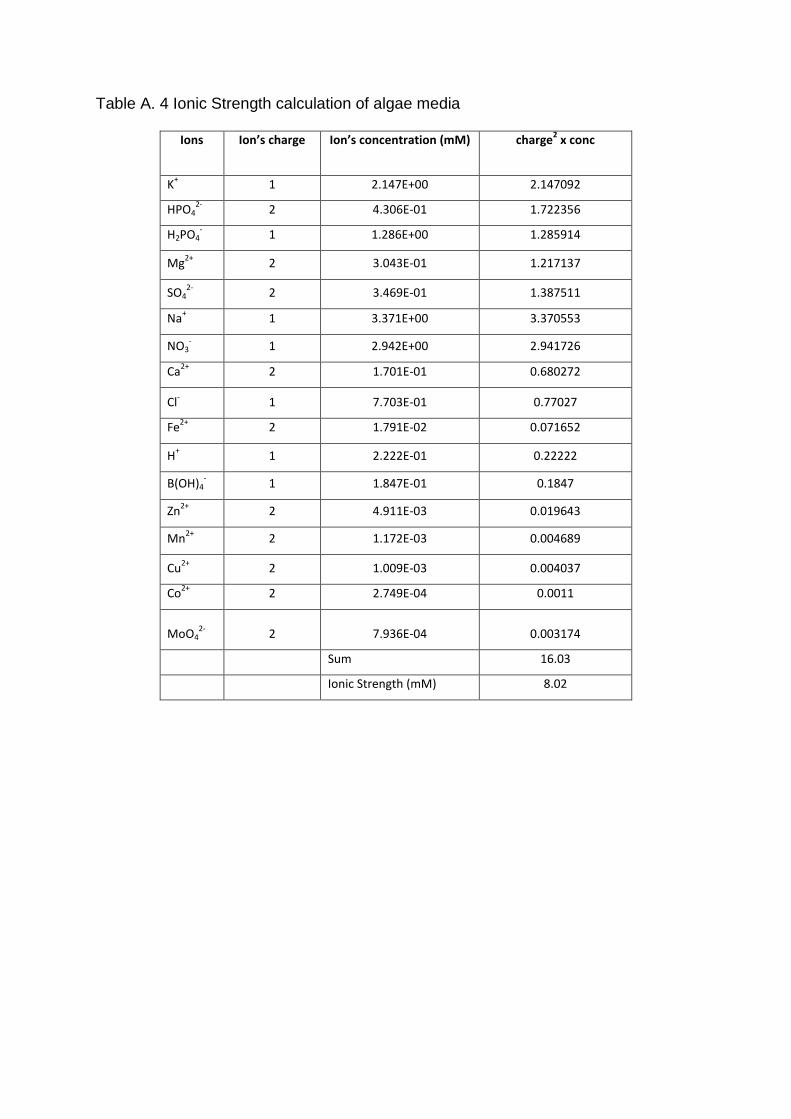
Table A. 4 Ionic Strength calculation of algae media
Ions Ion’s charge Ion’s concentration (mM) charge2 x conc
K+ 1 2.147E+00 2.147092
HPO42-
2 4.306E-01 1.722356
H2PO4- 1 1.286E+00 1.285914
Mg2+
2 3.043E-01 1.217137
SO42-
2 3.469E-01 1.387511
Na+ 1 3.371E+00 3.370553
NO3- 1 2.942E+00 2.941726
Ca2+
2 1.701E-01 0.680272
Cl- 1 7.703E-01 0.77027
Fe2+
2 1.791E-02 0.071652
H+ 1 2.222E-01 0.22222
B(OH)4- 1 1.847E-01 0.1847
Zn2+
2 4.911E-03 0.019643
Mn2+
2 1.172E-03 0.004689
Cu2+
2 1.009E-03 0.004037
Co2+
2 2.749E-04 0.0011
MoO42-
2 7.936E-04 0.003174
Sum 16.03
Ionic Strength (mM) 8.02
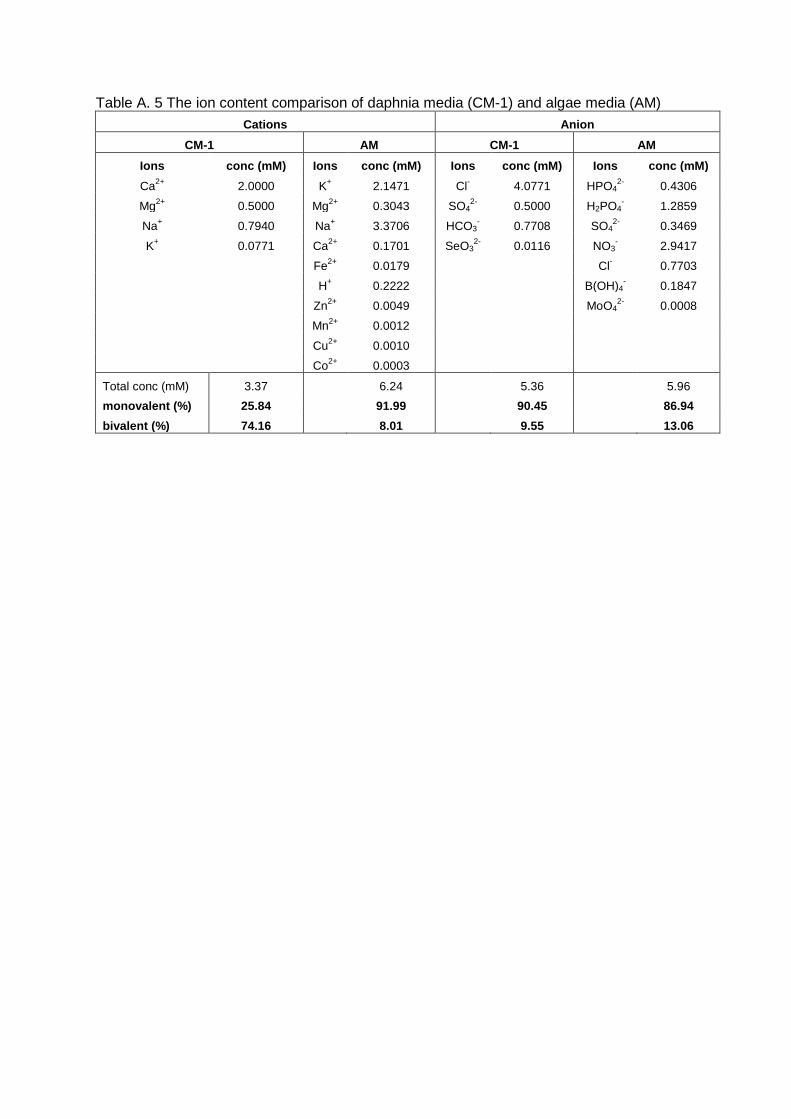
Table A. 5 The ion content comparison of daphnia media (CM-1) and algae media (AM)
Cations Anion
CM-1 AM CM-1 AM
Ions conc (mM) Ions conc (mM) Ions conc (mM) Ions conc (mM)
Ca2+
2.0000 K+ 2.1471 Cl
- 4.0771 HPO4
2- 0.4306
Mg2+
0.5000 Mg2+
0.3043 SO42-
0.5000 H2PO4- 1.2859
Na+ 0.7940 Na
+ 3.3706 HCO3
- 0.7708 SO4
2- 0.3469
K+ 0.0771 Ca
2+ 0.1701 SeO3
2- 0.0116 NO3
- 2.9417
Fe2+
0.0179 Cl- 0.7703
H+ 0.2222 B(OH)4
- 0.1847
Zn2+
0.0049 MoO42-
0.0008
Mn2+
0.0012
Cu2+
0.0010
Co2+
0.0003
Total conc (mM) 3.37 6.24 5.36 5.96
monovalent (%) 25.84 91.99 90.45 86.94
bivalent (%) 74.16 8.01 9.55 13.06
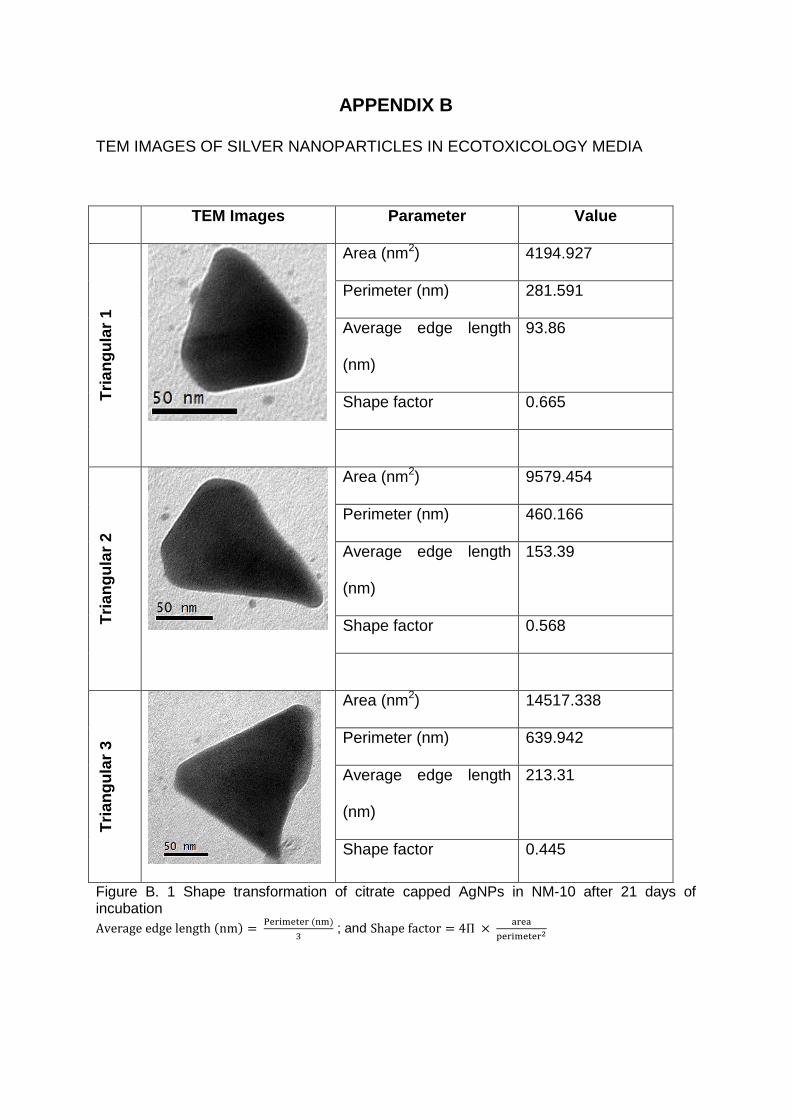
APPENDIX B
TEM IMAGES OF SILVER NANOPARTICLES IN ECOTOXICOLOGY MEDIA
TEM Images Parameter Value
Tri
an
gu
lar
1
Area (nm2) 4194.927
Perimeter (nm) 281.591
Average edge length
(nm)
93.86
Shape factor 0.665
Tri
an
gu
lar
2
Area (nm2) 9579.454
Perimeter (nm) 460.166
Average edge length
(nm)
153.39
Shape factor 0.568
Tri
an
gu
lar
3
Area (nm2) 14517.338
Perimeter (nm) 639.942
Average edge length
(nm)
213.31
Shape factor 0.445
Figure B. 1 Shape transformation of citrate capped AgNPs in NM-10 after 21 days of incubation
; and
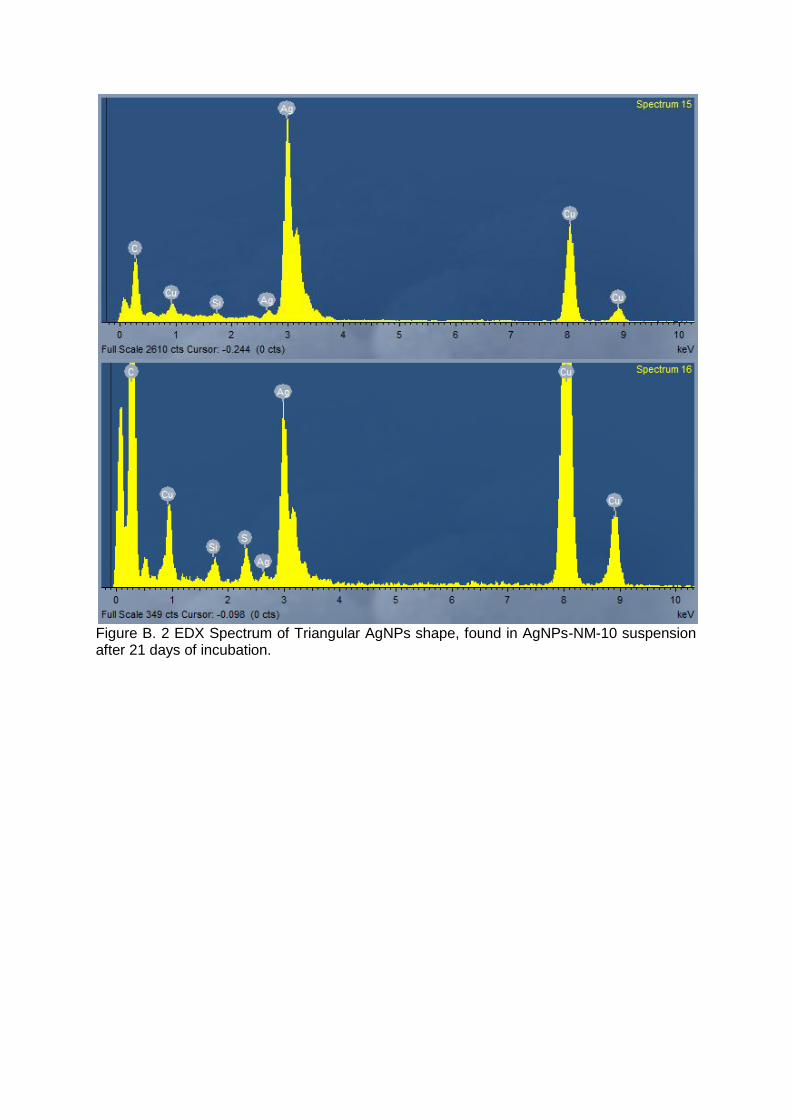
Figure B. 2 EDX Spectrum of Triangular AgNPs shape, found in AgNPs-NM-10 suspension after 21 days of incubation.