synthesis and metal complex formation of water …...synthesis and metal complex formation of water...
TRANSCRIPT

Synthesis and metal complex formation
of water soluble derivatives of the
iron-chelating ligand deferasirox
Dissertation
zur Erlangung des Grades
des Doktors der Naturwissenschaften
der Naturwissenschaftlich-Technischen Fakultät III
Chemie, Pharmazie, Bio- und Werkstoffwissenschaften
der Universität des Saarlandes
von
Nadine Jane Koch
Saarbrücken
2011

Tag des Kolloquiums: 16.12.2011
Dekan: Prof. Dr. Wilhelm F. Maier
Berichterstatter: Prof. Dr. Kaspar Hegetschweiler
Prof. Dr. Gregor Jung
Vorsitz: Prof. Dr. David Scheschkewitz
Akad. Mitarbeiter: Dr. Andreas Rammo

Acknowledgements
The studies for this doctoral thesis have been performed in the research
group of Prof. Dr. Kaspar Hegetschweiler at the Saarland University.
First of all I would like to thank Prof. Kaspar Hegetschweiler for the inter-
esting topic of my doctoral thesis and for his advice and helpfulness during my
studies.
I would like to thank the current members Matthias Basters, Martin Beck-
er, Sergej Gisbrecht, Anna Goldammer, Silvia Lauria, Günter Merten, Dr. Bernd
Morgenstern, Dr. Christian Neis, Sabine Wilbrand and Mandy Wild as well as
former members Dr. Mark Bartholomä, Dr. Barbara Kutzky, David Petry, Dr.
Thorsten Riebold, Dr. Thomas Schweitzer and Dr. Stefan Stucky of our re-
search group for the great working atmosphere and the great times we had.
Special thanks go to Anna Goldammer for performing several NMR
measurements, numerous discussions and the critical revision of this thesis.
Special thanks also go to Sabine Wilbrand for performing NMR measurements
and preparative HPLC.
I would like to thank our laboratory technician Anton “Toni” Zaschka for
measuring numerous elemental analyses and for his support with laboratory
matters. Thanks also go to our secretary Beate Tiefenbrunner for administr a-
tive support and nice talks beyond chemistry.
I would like to especially thank Frank Teucke and Thomas Nicolai for
good teamwork and for many valuable discussions during their studies.
Further, I would like to thank Dr. Volker Huch for the collection of the X-
ray diffraction data and Dr. Stefan Stucky and Dr. Christian Neis for solving and
refining the crystal structures.
Thanks go to Traudl Allgayer for carrying out the ICP-OES measure-
ments. Further, I would like to thank Dr. Matthias Großer for ESI-MS measure-
ments. Thanks also go to Dr. Robert Haberkorn for MXRFA measurements.
Special thanks go to Prof. Dr. Peter Strauch (University of Potsdam) for
having me in his lab and for performing and interpreting EPR measurements.

Very special thanks go to my parents Lilian and Hans-Jürgen Koch for
endless support throughout my life. Without them I would have never had the
chance and the strength to achieve what I have achieved. Further, I want to
especially thank my father for his support and for revising this thesis.
Very special thanks go to Lewe Meichsner who has supported me
through highs and lows. Thanks for your endless understanding and never end-
ing encouragement.
I would also like to thank my dear friend Carolin Thiele for many great
years at university and many talks and wonderful times beyond university life.

List of abbreviations
[A]t total concentration of all species containing A
AAS atom absorption spectroscopy
AU absorption units
BFC bifunctional chelating agent
BNC bayonet nut connector
CN coordination number
conc. concentrated
CT X-ray computed tomography
d day
DMSO dimethyl sulphoxide
E° standard electrode potential
EPR electron paramagnetic resonance
ESI-MS electrospray ionization mass spectroscopy
FT-IR Fourier transform infrared
h hours
HMDE hanging mercury drop electrode
HPLC high-performance liquid chromatography
hs haemosiderin
I ionic strength
kex water-exchange rate constant
KW dissociation constant of water
L ligand or litre
M central metal ion or molar mass
MDS myelodysplastic syndrome
MRI magnetic resonance imaging
N normality of solutions
NHE normal hydrogen electrode
NMR nuclear magnetic resonance
ORTEP Oak Ridge Thermal Ellipsoid Plot
pD pH dependent on deuterium

PET positron emission tomography
Ph phenyl
pKaD acidity constant dependent on deuterium
pKW -log(Kw)
solv solvent molecule
T temperature
T1/2 half-life
TMS tetramethylsilane
UV-VIS ultraviolet / visible
x molar fraction

Ligand abbreviations
deferasirox ICL670, 4-[3,5-bis(2-hydroxyphenyl)-1H-1,2,4-triazol-1-yl]-
benzoic acid
DCA dicarboxylic acid derivative of deferasirox
5-[3,5-bis(2-hydroxyphenyl)-1H-1,2,4-triazol-1-yl]-
isophthalic acid
DSA disulfonic acid derivative of deferasirox
2-[3,5-bis(2-hydroxyphenyl)-1H-1,2,4-triazol-1-yl]-
benzene-1,4-disulfonic acid
MSA monosulfonic acid derivative of deferasirox
4-[3,5-bis(2-hydroxyphenyl)-1H-1,2,4-triazol-1-yl]-
benzenesulfonic acid
1N-phenyl 1N-phenyl derivative of deferasirox
derivative 3,5-bis(2-hydroxyphenyl)-1-phenyl-1,2,4-triazole
DFO deferoxamine, desferrioxamine-B
DOTA 2,2’,2’’,2’’’-(1,4,7,10-tetraazacyclododecane-1,4,7,10-tetrayl)-
tetraacetic acid
dpt bis(3-aminopropyl) amine
DTPA diethylenetriaminepentaacetic acid
EDTA ethylenediamine tetraacetic acid
L1 deferiprone, CP20
NTA nitrilotriacetic acid
salphen N,N’-bis(salicylidene)-1,2-phenylenediamine
tempt 2,4,6-tris[4-(imidazole-1-ylmethyl)phenyl]-1,3,5-trazine
tren 2,2',2''-triaminotriethylamine
trien trientine, triethyltetramine dihydrochloride

Table of contents
1 Short abstract .............................................................. 1
2 Kurzzusammenfassung ................................................ 2
3 Abstract ....................................................................... 3
4 Introduction ................................................................. 6
4.1 Iron metabolism in human ............................................................... 6
4.2 Iron overload and iron chelation ..................................................... 10
4.3 Motivation and objectives .............................................................. 15
5 Synthesis of the ligands.............................................. 17
5.1 Synthesis of the ligand deferasirox and its monosulfonic acid derivative (MSA) ........................................................................... 17
5.2 Synthesis of the dicarboxylic acid (DCA) and disulfonic acid derivative (DSA) of deferasirox ...................................................... 19
6 The Ligand DCA ........................................................ 25
7 The ligand DSA .......................................................... 33
7.1 Determination of the pKa values of DSA ......................................... 34
7.1.1 Determination of the pKa,2 by spectrophotometric batch titration ............... 34
7.1.2 Determination of the pKa,3 and pKa,4 with potentiometric titrations ............ 41
7.1.3 Crystal structures of the ligand DSA ...................................................... 47
7.2 Complex formation of DSA with iron (III) ......................................... 53
7.2.1 Determination of the stability constant of the [Fe(DSA)]- complex by
spectrophotometric batch titration in pure water ..................................... 53
7.2.2 Continuous potentiometric and spectrophotometric titrations of DSA with iron (III) .............................................................................................. 58
7.2.3 The Crystal structure Cs5[Fe(DSA)2] · 10.74 H2O .................................... 73
7.2.4 Investigation of the redox chemistry of the iron (II) / iron (III) -DSA system by cyclic voltammetry .......................................................................... 79
7.3 Complex formation of DSA with copper (II) ..................................... 89
7.3.1 Investigation of the complex formation of DSA with copper (II) in pure water by potentiometric titrations .......................................................... 90
7.3.2 EPR-Experiments with copper (II) complexes of deferasirox and DSA ..... 103
7.3.3 The crystal structures Na3[Cu(DSA)(HCO3)] · 2.5 H2O · 1.5 MeOH and Na3[Cu(DSA)(HCO3)] · (H2O)25/6 · 3 MeOH ........................................... 116

7.4 Complex formation of DSA with nickel (II)..................................... 123
7.5 Complex formation of DSA with zinc (II) ....................................... 132
7.6 Complex formation of DSA with cadmium (II) ................................ 141
7.7 Complex formation of DSA with magnesium (II) ............................ 150
7.8 Complex formation of DSA with calcium (II) .................................. 156
7.9 Complex formation of DSA with aluminium (III) ............................. 162
8 Complex formation of magnesium (II), calcium (II) and aluminium (III) with deferasirox in pure water ...... 172
8.1 Investigation of the pKa values of deferasirox ............................... 173
8.1.1 Determination of the pKa values of deferasirox in pure water by continuous potentiometric titrations ..................................................... 174
8.1.2 Investigation of the protonation of deferasirox in acidic solutions in pure water by spectrophotometric batch titration .......................................... 179
8.1.3 1H-NMR spectroscopic measurements of the ligand deferasirox in acidic
D2O/D6-DMSO solution ...................................................................... 187
8.2 Complex formation of deferasirox with magnesium (II) in pure water solution ............................................................................. 189
8.3 Complex formation of deferasirox with calcium (II) in pure water solution ...................................................................................... 193
8.4 Complex formation of deferasirox with aluminium (III) in pure water solution ............................................................................. 197
9 Interaction of deferasirox, MSA and DSA with gadolinium (III) and gallium (III) in contrast agents ..... 201
9.1 Complex formation of deferasirox and its water soluble derivatives with gadolinium (III)..................................................................... 201
9.1.1 Complex formation of deferasirox with gadolinium (III) in water/DMSO solution xDMSO = 0.20 ......................................................................... 204
9.1.2 Complex formation of MSA with gadolinium (III) and determination of the pKa values of MSA in pure water ................................................... 206
9.1.3 Complex formation of DSA with gadolinium (III) in pure water ................ 214
9.1.4 Summary and discussion ................................................................... 219
9.2 Complex formation of deferasirox and its water soluble derivatives with gallium (III) .......................................................................... 223
9.2.1 Complex formation of deferasirox with gallium (III) in pure water and water/DMSO solution xDMSO = 0.20 ...................................................... 226
9.2.2 Complex formation of MSA with gallium (III) in pure water ..................... 230
9.2.3 Complex formation of DSA with gallium (III) in pure water...................... 237
9.2.4 Summary and discussion ................................................................... 241

10 Linear free energy relation and discussion ................. 249
11 Experimental Section ............................................... 263
11.1 Ligand synthesis ......................................................................... 263
11.1.1 Synthesis of 2-(2-hydroxyphenyl)-benzo-4H-[1,3]-oxazin-4-one .............. 263
11.1.2 Synthesis of 4-[3,5-bis(2-hydroxyphenyl)-1H-1,2,4-triazol-1-yl]benzoic acid (deferasirox) .............................................................................. 265
11.1.3 Synthesis of 4-[3,5-bis(2-hydroxyphenyl)-1H-1,2,4-triazol-1-yl]benzenesulfonic acid (MSA) ............................................................ 267
11.1.4 Synthesis of 2-hydrazinylbenzene-1,4-disulfonic acid · HCl (DSH) .......... 268
11.1.5 Synthesis of 2-[3,5-bis(2-hydroxyphenyl)-1H-1,2,4-triazol-1-yl]benzene- 1,4-disulfonic acid (DSA) ................................................................... 270
11.1.6 Synthesis of 5-hydrazinylisophthalic acid hydrochloric acid (DCH) .......... 272
11.1.7 Synthesis of 5-[3,5-bis(2-hydroxyphenyl)-1H-1,2,4-triazol-1-yl]isophthalic acid (DCA) ....................................................................................... 274
11.1.8 Crystal growth of [deferasirox] · H2O ................................................... 276
11.1.9 Crystal growth of [DSA-H4] · 1.5 MeOH ............................................... 276
11.1.10 Crystal growth of Cs4[DSA-H2]2 · (H2O)13/6 · MeOH ........................... 277
11.1.11 Crystal growth of Cs5[Fe(DSA)2] · 10.74 H2O.................................... 277
11.1.12 Crystal growth of Na3[Cu(DSA)(HCO3)] · 2.5 H2O · 1.5 MeOH (violet) and Na3[Cu(DSA)(HCO3)] · (H2O)25/6 · 3 MeOH (green) ..................... 278
11.2 Titration experiments .................................................................. 280
11.2.1 Potentiometric titration experiments .................................................... 280
11.2.2 Potentiometric titrations in water/DMSO solution mixture ....................... 282
11.2.3 Spectrophotometric titrations .............................................................. 284
11.2.4 Calculation of equilibrium constants .................................................... 286
11.2.5 NMR-titration experiments .................................................................. 287
11.3 Instrumentation ........................................................................... 288
11.3.1 NMR-spectroscopy ............................................................................ 288
11.3.2 Elemental analysis (C,H,N) ................................................................ 288
11.3.3 UV-VIS-spectroscopy ........................................................................ 288
11.3.4 IR-spectroscopy ................................................................................ 289
11.3.5 ESI-mass spectroscopy ..................................................................... 289
11.3.6 Preparative HPLC ............................................................................. 289
11.3.7 EPR-spectroscopy ............................................................................. 289
11.3.8 ICP-OES spectroscopy ...................................................................... 290
11.3.9 Microscopic X-ray fluorescence - MXRFA ............................................ 290
11.3.10 Crystal structure determination ....................................................... 290
11.3.11 Cyclic voltammetry ........................................................................ 290
11.4 Chemicals and preparation of stock solutions ............................... 291
12 Appendix ................................................................. 293
13 References .............................................................. 301

1 Short abstract
1
1 Short abstract
A water soluble model of deferasirox, 2-[3,5-bis(2-hydroxyphenyl)-1H-
1,2,4-triazol-1-yl]benzene-1,4-disulfonic acid (DSA), was prepared and charac-
terised. The ligands complex formation with the metal ions Fe 3+
(logβ110 = 23.54(4); logβ120 = 39.50(2)), Al3+, Ga3+, Gd3+, Ni2+, Cu2+, Zn2+, Cd2+,
Mg2+ and Ca2+ was investigated in pure water by titrations. A crystal structure
of the [Fe(DSA)2]5- complex and two structures of the [Cu(DSA)(HCO3)]3- com-
plex were obtained. The redox chemistry of Fe3+ with DSA was studied in acidic
and alkaline solution. Investigations on the Cu2+-DSA and -deferasirox system
revealed little to no evidence for polynuclear species. Deferasirox and DSA
form rather strong complexes with Ga3+ and weak with Gd3+ which have been
studied with respect to interactions with contrast agents. The pKa value
(pKa = 0.98(4), H2O) of deferasirox in acidic solution and the stability constants
of Al3+ (logβ120 = 29.0(5)), Mg2+ (logβ120 = 7.4(6)) and Ca2+ (logβ110 = 3.28(7))
were estimated for pure water solution. Deferasirox and DSA are correlated in
terms of a linear free energy relation for the [M(L)] and [M(L)2] complex (equa-
tion: logβ120 [deferasirox] = 0.96(2) × logβ120 [DSA] -1.5(8)). The estimated
logβ120 for deferasirox are: Ga3+ 33.8(1), Gd2+ 18.3, Cu2+ 19.4, Ni2+ 15.1,
Zn2+ 13.3, Cd2+ 10.3 for pure water. Furthermore, the pM values for deferasirox
in pure water have been calculated and show that it is a selective iron-chelator
with pFe = 22.2.

2 Kurzzusammenfassung
2
2 Kurzzusammenfassung
Eine wasserlösliche Modelverbindung von Deferasirox, 2-[3,5-bis(2-
hydroxyphenyl)-1H-1,2,4-triazol-1-yl]benzene-1,4-disulfonsäure (DSA), wurde
synthetisiert und charakterisiert. Die Komplexbildung von DSA mit Fe 3+
(logβ110 = 23.54(4); logβ120 = 39.50(2)), Al3+, Ga3+, Gd3+, Ni2+, Cu2+, Zn2+, Cd2+,
Mg2+ und Ca2+ wurde mit Titrationen (H2O) untersucht. Die Kristallstruktur des
[Fe(DSA)2]5- Komplexes sowie zwei Strukturen des [Cu(DSA)(HCO3)]3- Kom-
plexes wurden erhalten. Die Redox-Eigenschaften von DSA mit Fe3+ wurden im
sauren und alkalischen Medium bestimmt. Untersuchungen der Cu 2+-DSA und
-Deferasirox Komplexe ergaben wenig bis gar keine Beweise für polynukleare
Teilchen. Deferasirox und DSA bilden starke Komplexe mit Ga 3+ und eher
schwache mit Gd3+, welche auf Wechselwirkungen mit Kontrastmitteln unter-
sucht wurden. Der pKs Wert von Deferasirox (pKs = 0.98(4), H2O) in saurer Lö-
sung, sowie die Stabilitätskonstanten mit Al 3+ (logβ120 = 29.0(5)),
Mg2+ (logβ120 = 7.4(6)) und Ca2+ (logβ110 = 3.28(7)) wurden für H2O abge-
schätzt. Deferasirox und DSA konnten in Form einer linearen freien Energie -
Beziehung für [ML] und [ML2] (Gleichung: logβ120 [Deferasirox] = 0.96(2) ×
logβ120 [DSA] -1.5(8)) korreliert werden. Die abgeschätzten logβ120 für De-
ferasirox in Wasser sind: Ga3+ 33.8(1), Gd2+ 18.3, Cu2+ 19.4, Ni2+ 15.1,
Zn2+ 13.3, Cd2+ 10.3. Es konnten die pM Werte für Deferasirox in H2O berech-
net werden, welche Deferasirox mit einem pFe = 22.2 als selektiven Eisen-
chelator bestätigen.

3 Abstract
3
3 Abstract
2-[3,5-bis(2-hydroxyphenyl)-1H-1,2,4-triazol-1-yl]benzene-1,4-disulfonic
acid (DSA) a highly water soluble disulfonic acid derivative of the iron-chelating
ligand deferasirox was successfully synthesised on a large scale and charac-
terised in this thesis. The pKa values of the fourfold protonated ligand DSA
were investigated in pure water and revealed two very acidic pKa values
pKa,1 < -2 and pKa,2 = 1.33(8) (T = 298 K, I = 0.1 mol/L HCl/KCl). The pKa,1 can
be assigned to a protonation of one of the sulfonic acids which cannot be de-
termined in aqueous solution. The pKa,2 needed to be determined with a spec-
trophotometric batch titration in acidic solution (pH 1 – 2) and could be as-
signed to a protonation of one of the 1,2,4-triazole nitrogen atoms. Two further
acidity constants pKa,3 = 9.35(1) and pKa,4 = 11.32(2) of the two hydroxyphenyl
rings have been determined by continuous potentiometric titrations. The zwit-
terionic structure has been confirmed by a crystal structure of the ligand DSA
received from a methanol/ethyl acetate solution.
The complex formation of DSA with the metal ion Fe3+ has been investi-
gated in aqueous solution. Related to the observed strong complex formation
the [Fe(DSA)]- complexation constant logβ110 = 23.54(4) (T = 298 K,
I = 0.1 mol/L HCl/KCl) needed to be determined in acidic solution (pH 1 – 2)
with a spectrophotometric batch titration. Additionally, two further stability con-
stants for the [Fe(DSA)2]5- complex with logβ120 = 39.50(2) and the [Fe(L)(LH)]4-
complex with logβ121 = 43.67(3) (T = 298 K, I = 0.1 mol/L KCl) have been ob-
tained. Further, a crystal structure of the [Fe(DSA)2]5- complex is resported with
the Fe3+ central ion in a distorted octahedral geometry and both ligands coordi-
nating tridentate meridional. The redox chemistry of DSA with Fe3+ was investi-
gated in acidic and alkaline solution with cyclic voltammetry in pure water. The
reduction potential for the [Fe III/II(DSA)2]5-/6- couple (vs. NHE) was calculated to
E1/2 = -0.67 V.
The investigation of the complex formation of the divalent metal ions Ni2+,
Cu2+, Zn2+ and Cd2+ with DSA gave rise to monomeric complexes such as
[M(L)]2- and [M(LH)]-, bis-complexes like [M(L)2]6- and [M(L)(LH)]5- but also to
dinuclear complexes such as [M2(L)2]4- and [M2(L)2(OH)]5- for the Ni2+-DSA sys-

3 Abstract
4
tem and the complexes [M2(L)2(OH)]5- and [M2(L)2(OH)2]6- for the Cu2+, Zn2+
and Cd2+-DSA systems. Two crystal structures of the [Cu(DSA)(HCO3)]3- com-
plex were obtained with the ligand DSA coordinating tridentate meridional and
the Cu2+ central ion in a square planar coordination geometry. Further, the na-
ture of the precipitate of the Cu2+-deferasirox system and the Cu2+-DSA solu-
tions were studied by EPR spectroscopy. Primarily, monomeric species were
detected, however the EPR spectrum at elevated temperatures or of the aged
Cu2+-deferasirox precipitate changed to a broad badly resolved signal which
can be interpreted as antiferromagnetic coupling often observed for a polymeric
structure. An EPR spectrum of the Cu2+-DSA system in acidic solution (pH 2.7)
may indicate a dinuclear species due to the corresponding half-field signal ob-
served.
The complex formation of the ligands deferasirox, MSA and DSA with the
metal ions Gd3+ and Ga3+ was studied with respect to the simultaneous admin-
istration of deferasirox in iron-chelation therapy and Gd3+ and Ga3+ prepara-
tions as contrast agents and radiopharmaceuticals. In summary, the investiga-
tions with potentiometric titrations gave rise to a rather weak complexation of
deferasirox (pGd = 6.3, pFe = 22.2) and its water soluble derivatives with the
Gd3+ ion which follows that both pharmaceuticals can be administered simulta-
neously. The complex formation determined for all three ligands with the Ga3+
ion were very strong (deferasirox pGa = 19.1) so that a simultaneous admin-
istration could result in a ligand exchange reaction in the body and is therefore
not recommended.
Additionally, the protonation of the 1,2,4-triazole unit of deferasirox was
studied in acidic solution. The acidity constant pKa = 0.98(4) (H2O, T = 298 K,
I = 1.0 mol/L HCl/KCl) was determined by spectrophotometric batch titrations
with different molar fractions of xDMSO and extrapolation to pure water. Another
approach was carried out by 1H-NMR titration to determine the pKa = 0.89(2)
(T = 294 ±2 K, D2O-DCl/D6-DMSO, xDMSO = 0.20, no supporting electrolyte).
The stability constants of Al3+, Mg2+ and Ca2+ with deferasirox were determined
by potentiometric titrations of different molar fractions (xDMSO = 0.20, 0.18, 0.16,
0.14) and extrapolated to pure water Al3+ (logβ110 = 15.9(1); logβ120 = 29.0(5)),
Mg2+ (logβ110 = 5.31(8); logβ120 = 7.4(6)) and Ca2+ (logβ110 = 3.28(7)). Accord-

3 Abstract
5
ingly, the corresponding potentiometric titrations were performed with Al 3+,
Mg2+ and Ca2+ with DSA in pure water. The stability constants of the [M(L)]
complex (equation: logβ110 [deferasirox] = 0.96(5) × logβ110 [DSA] -1.2(8)) and
[M(L)2] complex (equation: logβ120 [deferasirox] = 0.96(2) × logβ120 [DSA] -
1.5(8)) of deferasirox and DSA can be correlated in terms of a linear free ener-
gy relation. With this correlation it was possible to estimate the stability con-
stants logβ110: Ga3+ 19.6, Gd2+ 10.3, Cu2+ 16.0, Ni2+ 10.1, Zn2+ 9.4, Cd2+ 6.4
and logβ120: Ga3+ 33.8(1), Gd2+ 18.3, Cu2+ 19.4, Ni2+ 15.1, Zn2+ 13.3, Cd2+ 10.3
in pure water which cannot be measured directly. In conclusion, the pM values
were calculated for all the studied metal ions with deferasirox which confirmed
that deferasirox is a selective iron-chelator with the pFe = 22.2.

4 Introduction
6
4 Introduction
Iron is the second most abundant metal (after aluminium) and the fourth
most abundant element of the earth’s crust [1]. It is a transition metal in two
stabile oxidation states the rather soluble ferrous state Fe2+ (d6 electronic con-
figuration) and the less soluble ferric state Fe3+ (d5 electronic configuration) [2].
It is one of the elements indispensable for life according to its capability of
transporting electrons and oxygen. Iron is especially suitable for its numerous
tasks in the human body attributed to its extreme variability of the Fe2+/ Fe3+
redox potential which can be fine-tuned by the type of chosen ligand [1]. Iron-
ligand complexes have access to the entire biologically significant range of r e-
dox potentials, from -0.5 to about +0.6 V [1]. If iron is not properly bound to pro-
teins in the body it may participate in harmful free radical reactions (Fenton and
Haber-Weiss) [3] or undergo hydrolysis, especially Fe3+ may precipitate to the
highly insoluble Fe(OH)3. Living organisms have adopted efficient iron transport
and storage mechanisms for a safe handling of iron, avoiding the toxicity of
free unbound iron. [1-4]
4.1 Iron metabolism in human
The total iron content of the human body is about 40 – 50 mg Fe/kg bod-
yweight. Men attain typically higher iron values than women. The distribution
and iron metabolism of the total iron in the human body of an adult male is i l-
lustrated in Figure 4.1. A simple overview of the main function of the transport
protein transferrin and the storage proteins ferritin and haemosiderin is provid-
ed in relation to the distribution of iron in the human body. [1]
Iron is mainly absorbed in the upper part of the gut (duodenum) from the
diet. The daily intake of iron from the diet is about 12 – 18 mg. However, only
1 – 2 mg/day are absorbed to compensate the daily iron losses of about the
same amount. There are two main sources of iron from nutrition , haem iron,
which is highly bioavailable and well absorbed in contrast to non-haem iron.
Further, the amount of absorbed iron is regulated by the intestinal mucosa cells
according to the daily loss. Since the human body has no effective system for

4 Introduction
7
iron excretion the loss is due to exfoliation of mucosa cells and red blood cells
to about two-thirds and one-third is a consequence of exfoliation of cells from
skin and from the urinary tract. The iron balance is primarily determined by iron
absorption, hence as iron stores decline, iron absorption increases. [1, 4-5]
Figure 4.1: Simple schematic presentation of iron metabolism in man with regard to iron stores, daily iron exchange and iron movement in the human body of a normal adult male. The values are given in mg per day. The dark violet circulati on refers to the plasma iron (transfer-rin and non-transferrin bound iron) with about 4 mg, yet the daily turnover is about 30 mg. The abbreviation hs stands for haemosiderin.
[1]
Transferrin
Once iron is absorbed it needs to be transported to sites of utilization and
storage. The class of iron-binding proteins found in many vertebrates is called
transferrins. Serum transferrin is the main iron transport protein, in plasma and
extracellular fluids, which distribute iron between the different cellular com-
partments (depict as dark violet arrows in Figure 4.1). Interestingly, only a
small fraction of total body iron, about 3 mg Fe/kg, circulates in the plasma and
other extracellular fluids bound to the iron transport protein transferrin. It is a
glycoprotein with a molecular weight of about 80 kD which is able to bind two
ferric (Fe3+) ions coupled with binding of commonly two bidentate carbonate
anions, as found for human serotransferrin [6]. A possible role of the anions is

4 Introduction
8
to serve as binding ligands between the protein and the metal ion in vitro. An-
other role might be to complete the coordination sphere of the ferric ion to pre-
vent hydrolysis of the ferric ion by coordinating water molecules. The half-life of
a molecule transferrin is 7.6 days while the bound i ron only has a biological
half-life of about 1.7 h. Consequently, transferrin undergoes more than one
hundred cycles by iron binding, transport and release before it is removed from
the circulation and iron itself is cleaved and bound to transferrin about every
2 h. [1, 7-8]
Haem
Most of the body iron 30 mg Fe/kg is contained in the haem prosthetic
group (porphyrin) of the oxygen transport protein haemoglobin which is part of
the circulating red blood cells (erythrocytes). The iron transported to the bone
marrow (erythroid marrow; erythropoiesis is the process of producing red blood
cells) by transferrin is incorporated into haem to supply the haemoglobolin pro-
duction. The red blood cells circulate in the peripheral blood stream for about
120 days. Subsequently, they are taken up by the mononuclear phagocytic sys-
tem in the spleen (to a minor extent by macrophages in the liver) that digests
the haemoglobin and recycles the iron to the plasma transferrin circulation.
Further, some of the newly formed red blood cells are destroyed within the
bone marrow and the iron is released, this is called ineffective erythropoiesis.
Additionally, 2 mg Fe/kg is present in various tissues as other haemoproteins,
iron-sulphur proteins and non-haem, non-iron-sulphur proteins. [1]
Ferritin and haemosiderin (hs)
The storage proteins ferritin and haemosiderin (hs) store the remaining
10 – 12 mg Fe/kg in men, around 5 mg Fe/kg in women, in the liver, spleen,
bone marrow and muscle. Ferritin is an oligomeric protein of 24 similar or iden-
tical molecular subunits (apoferritins) with a total molecular weight 500 kD,
forming a hollow protein shell (apoferritin protein shell) with an external diame-
ter of 12 – 13 nm and an inside diameter of 7 – 8 nm which consists of a cen-
tral inorganic ferric oxyhydroxide core. This protein is capable of storing up to

4 Introduction
9
4500 atoms of iron in a water soluble, non-toxic and bioavailable form as ferric
hydroxyphosphate micelles. It is proposed that ferrous iron (Fe2+) is oxidised to
ferric iron by dinuclear ferrioxidase sites with O2 and ferric iron is deposited in
the mineral core of the ferritin molecule as amorphous ferrihydrite (proposed
formula: Fe5HO8·4H2O [9]). Ferritin is also a valuable tool for the clinician due to
the determination of serum ferritin levels which are used for example for diag-
nosing and monitoring of hereditary or acquired secondary iron overload condi-
tions. [1, 10-13]
The water-insoluble storage protein haemosiderin also consist of an inor-
ganic iron core, yet the protein part is not well characterised. However, it
seems to contain apoferritin or degradation products of apoferritin. A matter of
debate is whether haemosiderin may be a degradation product of ferritin itself.
The core of haemosiderin can comprehend ferrihydrite iron, like the storage
protein ferritin, amorphous ferric oxide iron or crystalline goethite-like
(α-FeOOH) iron [14]. The iron stored in haemosiderin is visible as iron-rich gold-
en-yellow intracellular granules in tissue. Usually, iron is first stored in ferritin
and after these deposits are full haemosiderin is used as storage protein. Iron
from haemosiderin has not such a great bioavailability as ferritin. For this rea-
son, haemosiderin bound iron is only found in small amounts in human tissue.
However, in conditions of iron overload the vast majority of excess iron (about
80%) in the body is found as haemosiderin which has a higher content of iron
than ferritin. Chelation therapy can help release iron from haemosiderin. [1, 4, 15]
Myoglobin
About 4 mg Fe/kg is found in the muscles bound to the oxygen storage
protein myoglobin [1]. Myoglobin is a protein chain of 153 amino acids folded
around one single haem molecule. Ferrous iron (Fe2+) is bound to myoglobin
with a five-fold pseudo octahedral geometry; the sixth coordination site of the
octahedron can be occupied by an oxygen molecule. [16]
It has been reported that iron can be chelated from ferritin and haemo-
siderin [17-18]. However, there is another source of intracellular iron that seems

4 Introduction
10
to be easily chelated called the labile iron pool (LIP). The labile iron pool was
suggested as an intermediate or transitory pool between extracellular iron and
cellular iron associated with proteins [19]. A synonym of the labile iron pool is
chelatable iron pool referring to the assumption that it is probably the major site
of iron chelation by chelators such as deferrioxamine [1]. The iron in this chelat-
able pool comprises both ferrous and ferric iron which has been taken up into
the cell and is “loosely” bound to low-molecular weight organic molecules (e.g.
citrate and phosphate), polypeptides and surface components of membranes
which all have a low affinity to iron. The intention of the labile iron pool is to
provide available iron for haem synthesis and for iron incorporation into iron -
dependent enzymes and the storage protein ferritin. The risk of this loosely
bound iron is the potential participation in redox-cycling. In conclusion, it seems
though that most chelatable iron is present in the labile iron pool. [1, 19-20]
This rough overview of the main transport and storage proteins helps un-
derstand the major principles of iron metabolism. Nevertheless, iron metabo-
lism is much more complicated and involves many more aspects as discussed
in this section [5, 21]. The understanding of iron metabolism and especially stor-
age is the basis for the application of iron chelators in iron overload diseases.
4.2 Iron overload and iron chelation
The term “iron overload” refers to the condition when too much iron is ac-
cumulated in the human body. Excess iron is predominantly deposited into
parenchymal tissue in the liver, heart and endocrine system, which leads to
damage and, ultimately, to organ failure [22]. Two different types of iron over-
load disorders are distinguished, the primary and the secondary iron overload
as demonstrated in Figure 4.2. Primary overload disorders are for example
caused by hereditary hemochromatosis. Patients with hemochromatosis suffer
from an iron-loading disorder resulting from a genetically determined failure to
prevent unneeded dietary iron from entering the body which is characterised by
progressive parenchymal iron overload with the potential for multiorgan dam-
age [23].

4 Introduction
11
Figure 4.2: Overview of the two main causes for iron overload, resulting diseases and trea t-ment
[24].
Hemochromatosis is generally treated by phlebotomy which is a safe and
effective mode of iron removal when a patient is not anemic (anemia is the lack
of haemoglobin, i.e. erythrocytes). However, not all patients show good compli-
ance with phlebotomy for this reason iron chelation may be an alternative
treatment. [25]
The source for secondary iron overload is not the anemic disease itself,
but the treatment of chronic anemias with regular red blood cell transfusions
which lead to accumulation of iron in the body. [26]
The most common blood transfusion dependent chronic anemia is
β-thalassemia. The β-thalassemia syndromes are a group of hereditary blood
disorders characterised by the reduced or absent β-globin chain synthesis, re-
sulting in reduced haemoglobin in red blood cells, decreased production of red
blood cells and anemia. The β-thalassemias can be classified into the
β-thalassemia major (strongly transfusion dependent), intermedia (only occa-
sionally require transfusions) and minor (usually clinically asymptomatic, but
sometimes have a mild anemia). [27]
Further, patients with sickle cell disease, which is a group of inherited
disorders caused by the sickle like mutation affecting the β-globin chain of

4 Introduction
12
haemoglobin, rely on transfusions of red blood cells on a chronic or intermittent
basis [26]. Another transfusion dependent class of diseases are the myelodys-
plastic syndromes, which is a group of heterogeneous disorders characterised
by impaired blood cell production by the bone marrow usually by patients of
median age 65 – 75 years [26].
All mentioned chronic anemias have in common that long-term blood
transfusions lead to iron overload and to organ damage. For the treatment of
transfusion dependent iron overload, chelation therapy has been applied for
several years by the use of selective and high affinity iron chelators, which mo-
bilise body iron and the iron complexes are excreted by urine and faeces. [25]
Meanwhile three highly specific iron chelators are commercially available:
deferoxamine, deferasirox and deferiprone; depict in Figure 4.3.
Figure 4.3: Chemical structures of the active substances in the pharmaceuticals Desferal® (deferoxamine, DFO), Exjade® (deferasirox, ICL670) and Ferriprox® (deferiprone, L1, CP20).
Deferoxamine (desferrioxamine-B, DFO, Desferal®, Novartis Pharma AG)
was first introduced to the market and available for the treatment of secondary
iron overload in the early 1960’s and marked a breakthrough in the treatment of
β-thalassemia [28]. The hexadentate chelator forms a 1:1 complex with the cen-
tral metal ion Fe3+ which is coordinated by the three hydroxide and their neigh-
bouring carbonyl oxygen atoms [29]. However, this iron chelator shows some
disadvantages. Particularly, it is very hydrophilic which results in a very poor
absorption by the gastrointestinal tract [29]. Further, DFO has a very short

4 Introduction
13
plasma half-life of about 20 – 30 min [22]. As a consequence of these disad-
vantages, DFO is orally inactive and needs to be administered as a slow sub-
cutaneous infusion over 8 – 12 h about 5 – 7 days per week for life [25]. Even
though DFO is a highly specific iron chelator, a poor compliance in a large
segment of the patient population was observed due to adverse effects from
the long-term infusions [28].
There was soon a great requirement for the development of new orally
active iron chelators for the treatment of transfusion dependent iron overload.
Deferiprone (L1, CP20, Ferriprox®, ApoPharma, Apotex Inc.) was the first oral-
ly active iron chelator which was synthesised and evaluated at University of
Essex (UK) in the 1980’s [25, 30]. The hydrophilic bidentate iron chelator binds
iron in a 1:3 iron to ligand ratio by coordination with the hydroxide and carbonyl
oxygen atoms [30]. Deferiprone was licensed in 1999 in the European Union and
a number of countries outside the USA and Canada (total 43 countries) for the
second-line treatment of iron overload in adult patients when DFO therapy was
contraindicated or inadequate [26, 31]. Deferiprone has a short half–life of about
91 – 160 min which makes a three-times-daily dosing necessary [26, 30-31].
Further, deferiprone is a low molecular weight hydrophilic molecule which
enters cells and subsequently is able to transfer intracellular chelated iron to
the stronger chelator DFO if this is simultaneously present in plasma. There-
fore, a combined therapy of deferiprone and DFO has many advantages for
example avoiding high doses of each drug with respect to adverse effects and
increasing patient compliance due to fewer transfusions and still having daily
chelation therapy. The main advantage of deferiprone itself is that is seems to
be superior at protecting the heart from iron overload. [32]
Combined chelation treatment provides a useful option for patients who
are unwilling or unable to maintain the five-times DFO transfusions or for whom
the monotherapy is insufficient [30].
Finally, a new orally bioavailable iron chelator was developed by Novar-
tis: deferasirox (ICL670, Exjade®, Novartis Pharma AG). The iron chelator has
emerged from an extraordinary large study started at CIBA-Geigy (now Novar-
tis Pharma AG) in 1994. During this chemistry program 700 compounds of vari-

4 Introduction
14
ous chemical classes were synthesised and subjected to a rigorous filtering
process which included the determination of iron binding, testing of oral activity
and the important testing of subchronic tolerability in animals at a very early
stage in research. The tridentate iron chelator deferasirox, a bis -hydroxy-
phenyltriazole, was the compound best combining all desired properties. [25]
As a result of extensive clinical studies deferasirox (Exjade®) was ap-
proved in November 2005 for the treatment of chronic iron overload due to
blood transfusions in patients aged ≥ 2 years [25-26]. Deferasirox is highly lipo-
philic and has a long half-life of 11 – 19 h for the treatment of β-thalassemia. A
once-daily dosing maintained deferasirox plasma levels within the therapeutic
range over a 24-hour period providing continuous chelation coverage. Studies
working on the treatment of cardiac iron accumulation with deferasirox are en-
couraging for the cardiac efficacy of deferasirox. Further, deferasirox has
shown to maintain or reduce body iron in patients with MDS [22, 26, 33]. Studies
on the reduction of body iron in sickle cell disease by deferasirox have also
been reported [22, 26, 34]. Additionally, studies are being performed on the effica-
cy and safety of deferasirox as a further treatment of hereditary hemochroma-
tosis [35]. [26]
It has been shown that excess iron is deposited in the form of haemo-
siderin and ferritin mainly in the liver, spleen and endocrine organs causing or-
gan damage. Iron chelation mobilizes body iron deposits probably by an ind i-
rect process where iron is chelated from the labile iron pool of the cell which is
in equilibrium with the insoluble haemosiderin. [28, 36]
It is interesting to note that only three iron selective chelators have been
developed in the past 40 to 50 years. It seems to be challenging to develop
orally active iron chelators for the use of transfusion dependent iron overload
with an adequate safety profile. Further, the failure rate during development
has been very high. Valuable new iron chelators could be designed in future as
very selective iron chelators which show regional selectivity or selectivity for
the targeting of iron containing structures. [25]

4 Introduction
15
4.3 Motivation and objectives
The complex formation of the iron-chelating ligand deferasirox has been
previously investigated with several divalent (Cu2+, Zn2+, Mg2+and Ca2+) and
trivalent (Fe3+ and Al3+) metal ions [37-40]. However, the solubility of deferasirox
is poor in pure water so that potentiometric titration experiments needed to be
carried out in a mixed water/DMSO solution (xDMSO = 0.20). The stability con-
stants with metal ions determined in water/DMSO differ from stability constants
in pure water. Further, precipitation was observed with divalent metal ions in
water/DMSO solution which constrained the investigations. Since deferasirox is
applied as iron-chelating agent in the pharmaceutical Exjade® the stability con-
stants with metal ions in pure water would be of special interest. For this rea-
son the water soluble ligand MSA (monosulfonic acid derivative of deferasirox)
was developed previously and its complexation chemistry was investigated in
pure water [37]. Yet, this ligand was only soluble in low concentrations in pure
water so that investigations especially with divalent metal ions were also ham-
pered by precipitation during titration experiments. Accordingly, there was a
great necessity for a sufficiently water soluble ligand which can help elucidate
the complex behaviour of deferasirox in pure water.
The main objective of this thesis was to synthesise a highly water soluble
ligand on the basis of the iron-chelating ligand deferasirox. The new ligand
should adopt very similar coordination geometry as deferasirox and similar co-
ordination characteristics. The resulting ligand was a disulfonic acid derivative
2-[3,5-bis(2-hydroxyphenyl)-1H-1,2,4-triazol-1-yl]benzene-1,4-disulfonic acid
(DSA) of the ligand deferasirox which was easy to synthesise on a large-scale
(several grams). Of special importance was to show the high specificity of the
new ligand for Fe3+ and the similar redox-chemistry in accordance with defer-
asirox. Potentiometric and spectrophotometric titration experiments with the
divalent metal ions Ni2+, Cu2+, Zn2+, Cd2+, Mg2+ and Ca2+ and the trivalent metal
ions Fe3+, Al3+, Ga3+ and Gd3+ will confirm that DSA is a selective iron-chelating
ligand like deferasirox.
The high water solubility was of great importance to prevent precipitation
during titration experiments. In effect, it has been proposed that the precipitate

4 Introduction
16
observed of deferasirox and MSA with divalent metal ions such as Cu 2+ and
Zn2+ is of polymeric nature. A study by Ryabukhin with the 1N-phenyl derivative
of deferasirox proposes the formation of polymeric complexes with the divalent
metal ions Co2+, Ni2+ and Cu2+ [41]. On account of this hypothesis it was our aim
to bring insight into the nature of the composition of the precipitate of Cu2+ with
deferasirox. More knowledge should be provided by investigations with EPR
spectroscopy on the Cu2+-deferasirox precipitate and on Cu2+-DSA solutions.
Further, potentiometric titration experiments carried out with DSA and divalent
metal ions with different molar ratios of metal ion to ligand should also bring
new findings on the nature of the species in pure water solution.
It has been assumed that deferasirox can be protonated at the 1,2,4-
triazole unit in strong acidic solution [39]. Studies on the ligands deferasirox and
DSA in strong acidic solutions with batch titrations and 1H-NMR spectroscopy
will help contribute to the confirmation of this assumption.
Furthermore, some questions emerged concerning the simultaneous ad-
ministration of deferasirox with Gd3+ and Ga3+ containing contrast agents or
radiopharmaceuticals. How strong are Gd3+ and Ga3+ complexes with defer-
asirox, and its water soluble derivatives, in comparison to the Fe3+ complexes?
Moreover, could these complexes be strong enough to cause ligand exchange
reactions in the body? The answer to these questions should be found by per-
forming potentiometric titrations with deferasirox, MSA and DSA with Gd3+ and
Ga3+.
Most stability constants of deferasirox complexes cannot be measured in
pure water, yet they can be estimated by linear extrapolation of constants
measured with different molar fractions xDMSO. Stability constants of the Fe3+
ion with deferasirox have successfully been extrapolated to pure water [39-40].
Our aim was to estimate the stability constants of deferasirox with Al 3+, Mg2+
and Ca2+ in pure water, to generate a correlation between these constants and
those measured in pure water for DSA. A correlation in form of a linear free
energy relation between the two ligands will allow us to estimate stability con-
stants of deferasirox metal ion complexes in pure water which cannot be de-
termined directly. Accordingly, the ligand DSA will be a valuable tool to help
elucidate the complex behavior of deferasirox.

5 Synthesis of the ligands
17
5 Synthesis of the ligands
5.1 Synthesis of the ligand deferasirox and its monosulfonic
acid derivative (MSA)
The synthesis of 3,5-bis(2-hydroxyphenyl)-1-phenyl-1,2,4-triazole, an un-
substituted derivative of deferasirox, was first mentioned in the literature by
Ryabukhin [42]. The Novartis Pharma AG picked up this synthesis and devel-
oped the ligand synthesis of deferasirox from it. The ligand was synthesised
according to literature by the reaction of two main building blocks to form the
1,2,4-triazole unit [40]. This reaction of a substituted hydrazine with a diacyla-
mine is referred to as the Einhorn-Brunner-Synthesis [43]. To receive defer-
asirox 4 (4-[3,5-bis(2-hydroxyphenyl)-1H-1,2,4-triazol-1-yl]benzoic acid) as
shown in Scheme 5.1, 4-hydrazino-benzoic acid 1 was reacted with
2-(2-hydroxyphenyl)-benzo-4H-[1,3]-oxazin-4-one 2 (benzo-oxazin-4-one) or
rather with 2-hydroxy-N-(2-hydroxybenzoyl)-benzamide 3 which is the hydro-
lysed form of the benzo-oxazin-4-one. The 4-hydrazino-benzoic acid is com-
mercially available and used as obtained.
Scheme 5.1: Synthesis of deferasirox 4 (4-[3,5-bis(2-hydroxyphenyl)-1H-1,2,4-triazol-1-yl]benzoic acid) from 4-hydrazino-benzoic acid 1 and 2-(2-hydroxyphenyl)-benzo-4H-[1,3]-oxazin-4-one 2 respectively 2-hydroxy-N-(2-hydroxybenzoyl)-benzamide 3.

5 Synthesis of the ligands
18
The second building block benzo-oxazin-4-one needed to be synthesised
from salicylic acid 5 and salicylamide 6 in the presence of thionyl chloride and
pyridine in a cyclodehydration as shown in Scheme 5.2.
Scheme 5.2: Synthesis of 2-(2-hydroxyphenyl)-benzo-4H-[1,3]-oxazin-4-one 2 respectively 2-hydroxy-N-(2-hydroxybenzoyl)-benzamide 3 from salicylic acid 5 and salicylamide 6 with thionyl chloride and pyridine in xylene.
The carboxylic acid functional group of deferasirox can be replaced by a
sulfonic acid to increase water solubility. Scheme 5.3 shows the synthesis only
differs in the application of 4-hydrazino-benzosulfonic acid 7 which is also
commercially available. The preparation of the monosulfonic acid derivative
MSA 8 (4-[3,5-bis(2-hydroxyphenyl)-1H-1,2,4-triazol-1-yl]benzenesulfonic acid)
is otherwise in accordance with the reaction described above for the ligand de-
ferasirox [40].

5 Synthesis of the ligands
19
Scheme 5.3: Synthesis of the monosulfonic acid derivative MSA 8 (4-[3,5-bis(2-hydroxy-phenyl)-1H-1,2,4-triazol-1-yl]benzenesulfonic acid) from 4-hydrazino-benzosulfonic acid 7 and benzo-oxazin-4-one 2.
These two ligands were both synthesised in boiling ethanol with stoichi-
ometric amounts of triethylamine. Purification was carried out by precipitating
the ligand from the reaction mixture and washing the resulting precipitate with
cold water. After drying in vacuum and full characterisation the ligands were
employed for further studies.
5.2 Synthesis of the dicarboxylic acid (DCA) and disulfonic
acid derivative (DSA) of deferasirox
The ligand MSA was soluble in pure water (water solubility 0.7 g/L [37]) in
contrast to deferasirox (water solubility 0.4 g/L at pH = 7.4 [38]) and therefore its
complex formation could be investigated in pure water. However, during some
titration experiments precipitation was observed. This made the investigation of
the complex formation much more difficult. To prevent precipitation during titr a-
tion experiments we decided to increase water solubility even more. The idea
we had was the addition of another functional group to the benzoic acid moiety
to enhance water solubility. This was implemented by adding a second carbox-
ylic acid to deferasirox or a second sulfonic acid functional group to MSA. The
main region of the ligand where complex formation occurs is not affected by
this variation. However, the charge of the ligand changes as a result of the ad-
dition of another functional group which can be deprotonated. Consequently,

5 Synthesis of the ligands
20
the hydrazine needed to be modified. The question was to either modify the
hydrazine we used in the synthesis for deferasirox and MSA or to buy a modi-
fied starting material and synthesise the hydrazine. The second method
seemed more promising hence 5-aminoisophthalic acid and aniline-2,5-
disulfonic acid were applicable as starting materials. The synthesis is based on
a procedure for the preparation of 4-hydrazino-benzosulfonic acid [44]. The ani-
line-2,5-disulfonic acid 9 derivative is suitable for the preparation of the
2-hydrazinylbenzene-1,4-disulfonic acid 10 (DSH) as shown in Scheme 5.4.
Aniline-disulfonic acids and their diazonium compounds in general have been
known very early to the literature [45-46].
Scheme 5.4: Synthesis of 2-hydrazinylbenzene-1,4-disulfonic acid (DSH) 10 from aniline-2,5-disulfonic acid 9.
At first, we tried to synthesise the dicarboxylic acid hydrazine by using
2-aminoterephthalic acid 11 as demonstrated in Scheme 5.5. The 2-hydrazinyl-
terephthalic acid 12 would have been an analogue to the disulfonic acid deriva-
tive. The synthesis was carried out on the one hand with the same procedure
as for DSH and on the other hand based on a similar procedure from literature
with the help of SnCl2 [44, 47]. Both methods failed several times. The diazonium
salt was verified but the hydrazine did not form.

5 Synthesis of the ligands
21
Scheme 5.5: Attempt to synthesise 2-hydrazinylterephthalic acid 12 from 2-aminoterephthalic acid 11.
Consequently, we tried the preparation of 5-hydrazinylisophthalic acid
(DCH) 14 with two carboxylic acid groups in 1 and 3 positions with 5-amino-
isophthalic acid 11 as starting material as presented in Scheme 5.6. This syn-
thesis was successful.
Scheme 5.6: Synthesis of 5-hydrazinylisophthalic acid 14 from 5-aminoisophthalic acid 13.
Both hydrazines 5-hydrazinylisophthalic acid (DCH) and 2-hydrazinyl-
benzene-1,4-disulfonic acid (DSH) were prepared by the same procedure. It
was carried out as a two-step reaction in pure water/HCl as solvent.
As demonstrated in Scheme 5.7, in the first step the amine functional
group of 5-aminoisophthalic acid 13 and aniline-2,5-disulfonic acid 9 was dia-
zotised in hydrochloric acid with sodium nitrite in an ice bath. The moist diazo-
nium salt 15 or 16 was passed on to the next step without further purification.

5 Synthesis of the ligands
22
To form the hydrazine a reduction with sodium sulphite was performed at low
temperature.
Scheme 5.7: The first step shows the diazotation of the 5-aminoisophthalic acid 13 and ani-line-2,5-disulfonic acid 9 with sodium nitrite and concentrated HCl to 3,5-dicarboxybenzene-diazonium chloride 15 and 2,5-disulfobenzenediazonium chloride 16. The second step depicts the reduction of the diazonium salt 15 and 16 to 5-hydrazinylisophthalic acid 14 and 2-hydrazinylbenzene-1,4-disulfonic acid 10 with sodium sulphite and concentrated HCl.
The hydrazine 14 and 10 were precipitated with concentrated HCl. As a
result of the preparation process the hydrazine was obtained as a hydrochlo-
ride. Both hydrazines were not obtained entirely pure. Their preparation with
several salts and their good water solubility made it difficult to separate the
product from all salt impurities. Attempts to separate the hydrazine from the
salts with anion exchanger or size exclusion chromatography (using sephadex
for gel permeation chromatography) failed. In effect, the hydrazines applied for
the synthesis of the ligands were used with small impurities which could be re-
moved during the workup process of the ligands.
Now having synthesised the hydrazine we could react it with the same
compound benzo-oxazin-4-one as in the synthesis of deferasirox and MSA
mentioned in section 5.1 to form the desired ligands. Scheme 5.8 demon-
strates the Einhorn-Brunner-Synthesis of the two derivatives of deferasirox
DCA 17 (dicarboxylic acid derivative, 5-[3,5-bis(2-hydroxyphenyl)-1H-1,2,4-
triazol-1-yl]isophthalic acid) and DSA 18 (disulfonic acid derivative, 2-[3,5-
bis(2-hydroxyphenyl)-1H-1,2,4-triazol-1-yl]benzene-1,4-disulfonic acid). The
ligand DCA was prepared in boiling ethanol whereas DSA is prepared in boiling

5 Synthesis of the ligands
23
methanol. Both ligand syntheses were carried out with excess of triethylamine
and a slight excess of benzo-oxazin-4-one.
Scheme 5.8: Synthesis of the ligand DCA 17 in ethanol and DSA 18 in methanol with the ap-propriate hydrazine 14 and 10 and 2-(2-hydroxyphenyl)-benzo-4H-[1,3]-oxazin-4-one 2 re-spectively 2-hydroxy-N-(2-hydroxybenzoyl)-benzamide 3 by Einhorn-Brunner-Synthesis.
The ligand DCA was isolated from the reaction mixture by precipitation
with HCl. Several different ways of reprecipitation failed to remove small impu-
rities. Therefore, the ligand DCA was passed on to preparative HPLC. The
separation was performed with a reversed phase column and methanol/water
mixtures with 0.1% formic acid as eluent. At first, the separation was carried
out with different gradient compositions. Then 90% methanol was kept isocratic
until the ligand completely eluted. The ligand was precipitated from pure water.
After drying in vacuum the ligand was pure and had absorbed some water
which was determined by elemental analysis.
The ligand DSA was precipitated from the reaction mixture with HCl and
reprecipitated from methanol with ethyl acetate. After removing all solvent i m-
purities in vacuum the ligand needed to be left standing exposed to the air to
absorb water. Usually five molecules of water were obtained and determined by

5 Synthesis of the ligands
24
elemental analysis. Effectively, the ligand could be employed for further inves-
tigations.
In conclusion, the variation of both ligands is at the peripheral phenyl
group which does not participate in complexation behaviour. Therefore, the lig-
ands DCA and DSA have the same complexation mode as deferasirox. The
ligand DCA is not well water soluble (water solubility was not determined) and
did not fulfil the requirements of being more water soluble than MSA. Contrary
to DCA the ligand DSA (water solubility 8.0 g/L) is much better water soluble
than MSA (water solubility 0.7 g/L [37]) and therefore titration experiments could
be carried out without precipitation.

6 The Ligand DCA
25
6 The Ligand DCA
The dicarboxylic acid derivative ligand DCA is very closely related to the
iron chelating ligand deferasirox. Its structure is presented in Figure 6.1. The
variation was performed at the peripheral benzocarboxylic acid group. The car-
boxylic acid in position 1 of deferasirox is replaced by two carboxylic acid
groups in positions 1 and 3 of DCA. The intention of the variation was to design
a new ligand that is more water soluble than deferasirox. We believe that high-
er water solubility will prevent precipitation of insoluble complexes during titr a-
tion experiments.
Figure 6.1: The structural formula of the ligand 5-[3,5-bis(2-hydroxyphenyl)-1H-1,2,4-triazol-1-yl]isophthalic acid (dicarboxylic acid derivative DCA of deferasirox).
Despite the two carboxylic acid groups the ligands water solubility was
not enhanced enough to carry out titration experiments in pure water. The pKa
values were studied in a water/DMSO mixture with a molar fraction of
xDMSO = 0.20. For this ligand four pKa values were determined by continuous
potentiometric titration. An example titration with titration conditions is given in
Table 6.1.

6 The Ligand DCA
26
Table 6.1: An example titration experiment of the ligand DCA with overall protonation con-stants logβx
[a] and acidity constants pKa,i
[b]. The standard deviations of the values are given
in brackets [c]
. The titration conditions are given at T = 298 K.
logβ and pKa values of DCA
measuring method potentiometric
method type continuous
solvent water/DMSO xDMSO = 0.20
[L]t 1.00 mmol/L
[H]t 4.10 mmol/L
titration volume 50.0 mL
titrant 0.1 mol/L KOH
supporting electrolyte 0.1 mol/L KCl
electrode Schott IoLine
pKW 15.58
pH range 3.4 – 12.5
volume of data points 60
time for mixing process 150 s
σ [d] 0.771
logβ1 12.26(1) pKa,1 3.91(2)
logβ2 22.61(2) pKa,2 4.95(2)
logβ3 27.56(2) pKa,3 10.35(2)
logβ4 31.47(2) pKa,4 12.26(1)
[a] For the ligand L logβx is defined as: βx = [LHx] × [L]
-1× [H]
-x.
[b] For the ligand LHx the pKa,i is defined as: pKa,i = -logKa,i and Ka,i = [LHx-i] × [H] ×
[LH(x+1)-i]-1
. [c]
The deviations given in brackets correspond to the threefold standard deviation taken from Hyperquad2008. [d]
The σ value is taken from Hyperquad2008.

6 The Ligand DCA
27
The first two pKa values pKa,1 and pKa,2 can be assigned to the deproto-
nations of the carboxylic acid groups. Accordingly, the pKa,3 and pKa,4 can be
assigned to the deprotonations of the two hydroxyphenyl groups. The values of
these acidity constants are in the expected range. In Table 6.2 mean values of
7 titrations were calculated by two methods.
Table 6.2: Mean values of the overall protonation constants logβx [a]
and acidity constants pKa,i
[b] from potentiometric titrations for the ligand DCA determined by two methods in wa-
ter/DMSO with xDMSO = 0.20, T = 298 K and I = 0.1 KCl.
logβ and pKa values of DCA
mean values and standard deviations from 7 titrations [c]
logβ1 12.27(2) pKa,1 3.90(2)
logβ2 22.62(3) pKa,2 4.95(1)
logβ3 27.57(4) pKa,3 10.35(1)
logβ4 31.46(5) pKa,4 12.27(2)
mean values by simultaneous evaluation of 7 titrations [d]
pH range 3.4 – 12.5
σ [e] 0.921
logβ1 12.27(1) pKa,1 3.90(1)
logβ2 22.62(1) pKa,2 4.94(1)
logβ3 27.56(1) pKa,3 10.35(1)
logβ4 31.46(1) pKa,4 12.27(1)
[a] For the ligand L logβx is defined as: βx = [LHx] × [L]
-1× [H]
-x.
[b] For the ligand LHx the pKa,i is defined as: pKa,i = -logKa,i and Ka,i = [LHx-i] × [H] ×
[LH(x+1)-i]-1
.
[c] The standard deviations in brackets were calculated with: √
∑ ( )
( ) ; measured
value; mean value; n number of values. [d]
The titrations were evaluated simultaneously with the program Hyperquad2008. The deviations given in brackets correspond to the threefold standard deviation taken from Hyperquad2008. [e]
The σ value is taken from Hyperquad2008.

6 The Ligand DCA
28
The first values in Table 6.2 are arithmetic means calculated from 7 titra-
tions with their calculated standard deviations in brackets. In addition, the se-
cond values given in Table 6.2 are values calculated with the program Hyper-
quad2008. For this, all 7 titrations were loaded into Hyperquad2008 and were
evaluated simultaneously with the same model. By comparing the two methods
we could show that the values obtained are in good agreement. They differ only
on the second decimal place. Another small difference is that the deviations for
the first values calculated with the standard deviation are somewhat higher
than those for the second set of values taken from Hyperquad2008. This can
be explained by the fact that Hyperquad2008 has 7 sets of data to calculate the
second set of values simultaneously. Which makes the values more accurate
and therefore the deviation ranges are smaller. Whereas, to obtain the mean
value of the first set of data each titration was evaluated separately.
Figure 6.2 shows a potentiometric titration curve of the pKa titration of
DCA with a total ligand concentration of 1.00 mmol/L. The titration was carried
out in water/DMSO with xDMSO = 0.20, with an ionic strength of I = 0.1 mol/L KCl
and at T = 298 K. The ligand solution was titrated with 0.1 mol/L potassium hy-
droxide solution from pH 3.4 to about pH 12.5. The high pH results from the
different solvation of protons and hydroxide ions in water/DMSO solution. Ac-
cordingly, the ionic product is considerably smaller in the water/DMSO system
than in pure water. For the molar fraction xDMSO = 0.20 the pKw is 15.58 and the
pH scale is extended to the pH range of 0 – 15.6. Resulting from this, neutral
solutions have a pH value of about 7.8 [40].
The titration curve in Figure 6.2 shows a distinct inflection at 2 equiva-
lents (millimoles of KOH added to millimoles of ligand present). This strong in-
crease in pH can be assigned to the complete deprotonation of the two carbox-
ylic acid groups. If we look carefully at the titration curve at 3 equivalents we
can identify a small increase of pH at about pH 11. This can be assigned to the
deprotonation of the hydroxyphenyl groups. The deprotonation of the ligand is
concluded at 4 equivalents.
6 The Ligand DCA
29
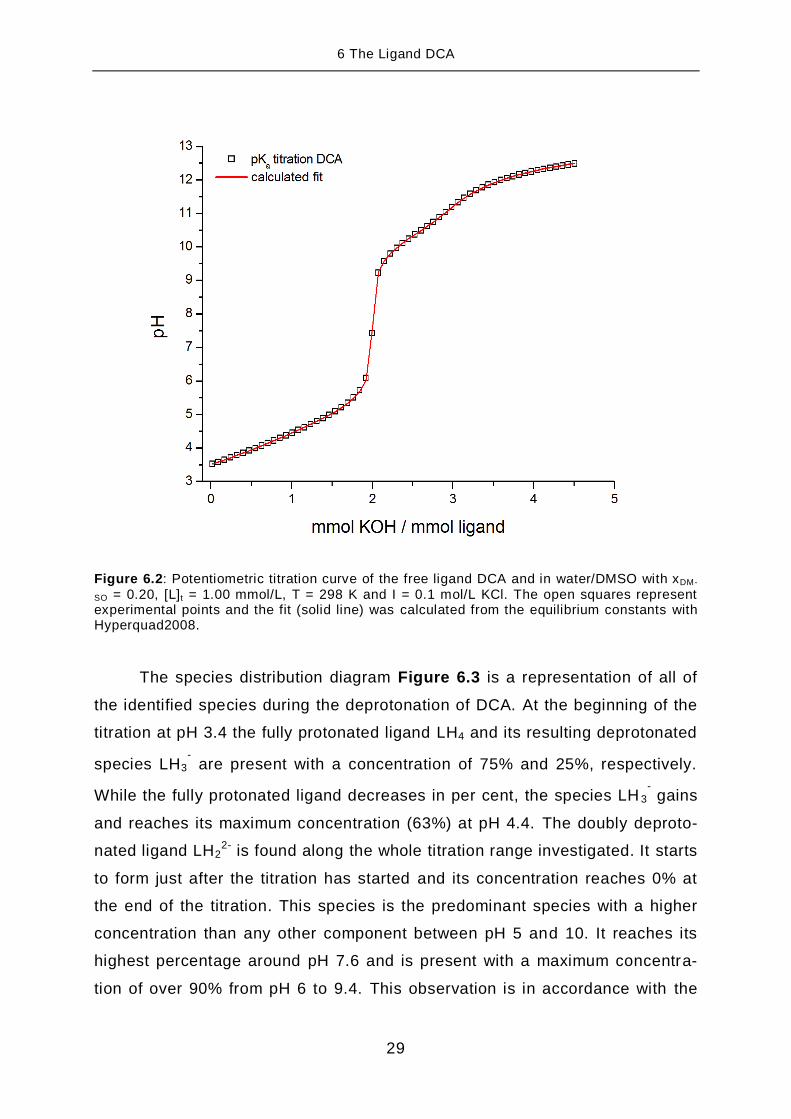
Figure 6.2: Potentiometric titration curve of the free ligand DCA and in water/DMSO with xDM-
SO = 0.20, [L]t = 1.00 mmol/L, T = 298 K and I = 0.1 mol/L KCl. The open squares represent experimental points and the fit (solid line) was calculated from the equilibrium constants with Hyperquad2008.
The species distribution diagram Figure 6.3 is a representation of all of
the identified species during the deprotonation of DCA. At the beginning of the
titration at pH 3.4 the fully protonated ligand LH4 and its resulting deprotonated
species LH3
- are present with a concentration of 75% and 25%, respectively.
While the fully protonated ligand decreases in per cent, the species LH 3
- gains
and reaches its maximum concentration (63%) at pH 4.4. The doubly deproto-
nated ligand LH22- is found along the whole titration range investigated. It starts
to form just after the titration has started and its concentration reaches 0% at
the end of the titration. This species is the predominant species with a higher
concentration than any other component between pH 5 and 10. It reaches its
highest percentage around pH 7.6 and is present with a maximum concentra-
tion of over 90% from pH 6 to 9.4. This observation is in accordance with the

6 The Ligand DCA
30
pKa values determined and the observed inflection at 2 equivalents lasting from
pH 6 to 9. At this point both carboxylic acid groups are fully deprotonated and
the pKa values of the hydroxyl phenyl rings dominate the species distribution.
At pH 8 the predominant component LH22- starts to deprotonate to LH3- which
reaches its highest peak (82%) at pH 11.3. The titration ends at pH 12.5 where
the fully deprotonated ligand L4- becomes the major species (62%) and the only
other species is LH3- (38%).
Figure 6.3: Species distribution diagram of the ligand DCA indicating the species present as a function of pH with xDMSO = 0.20 at T = 298 K and I = 0.1 mol/L KCl. % Species relative to L are defined as per cent of total concentration of ligand [L]t = 1.00 mmol/L set at 100%. The species concentrations were calculated from the equilibrium constants listed in Table 6.2 (mean values and standard deviations from 7 titrations) with the program Hyss2006.
It is vital that these findings need to be compared with the ligand defer-
asirox. In Table 6.3 logβ and pKa values of DCA and deferasirox are compared.
The main difference between both ligands is DCA has four pKa values and de-
ferasirox has three. If we look at the logβ values we see that the first three logβ

6 The Ligand DCA
31
are very similar. The logβ4 of DCA is a deprotonation of the second carboxylic
acid group which is missing in deferasirox.
Table 6.3: Comparison of the overall protonation constants logβx [a]
and acidity constants pKa,i
[b] for the ligand DCA with deferasirox. The constants are all arithmetic means with calc u-
lated standard deviations [c]
. All constants were studied in water/DMSO with xDMSO = 0.20, T = 298 K and I = 0.1 KCl.
DCA Deferasirox [d]
logβ1 12.27(2) logβ1 12.18(2)
logβ2 22.62(3) logβ2 22.36(3)
logβ3 27.57(4) logβ3 27.00(3)
logβ4 31.46(5) - -
pKa,1 3.90(2) - -
pKa,2 4.95(1) pKa,1 4.64(1)
pKa,3 10.35(1) pKa,2 10.18(1)
pKa,4 12.27(2) pKa,3 12.18(2)
[a] For the ligand L logβx is defined as: βx = [LHx] × [L]
-1× [H]
-x.
[b] For the ligand LHx the pKa,i is defined as: pKa,i = -logKa,i and Ka,i = [LHx-i] × [H] ×
[LH(x+1)-i]-1
.
[c] The standard deviations in brackets were calculated with: √
∑ ( )
( ) ; measured
value; mean value; n number of values. [d]
Values from section 8.1.1.
As a result, the pKa,1 = 3.90 of DCA is very acidic compared to the
pKa,1 = 4.64 which is assigned to the deprotonation of the carboxylic acid group
of deferasirox. The ligand DCA (LH4) is neutral in charge and can easily depro-
tonate as demonstrated on the left side in Scheme 6.1. Since deferasirox only
has one carboxylic acid group the ligand LH3 deprotonates with a higher pKa,1
as shown on the right side of Scheme 6.1.

6 The Ligand DCA
32
Scheme 6.1: Stepwise deprotonation of the ligands DCA (aLH4) and deferasirox (
bLH3).
Thus, the pKa,2 = 4.95(1) of DCA can be compared to the pKa,1 = 4.64(1)
of deferasirox. The second pKa of DCA is higher than the corresponding pKa,1
of deferasirox. This can easily be explained by the charge of the ligand. The
second deprotonation occurs from the ligand species LH3
- which has a negative
charge. This causes a weaker acidity of the second carboxylic proton. Where-
as, the ligand species for deferasirox is LH3 which is neutral of charge and the
deprotonation is caused more easily. The protonation steps of deferasirox are
given on the left side in Scheme 6.1. Once deprotonated, DCA will always
have a higher negative charge than deferasirox and therefore deprotonation is
hampered.
Taken together, we state that all comparable logβ and pKa values of DCA
(except pKa,1) are slightly higher than those of deferasirox due to the higher
negative charge of DCA.
The complex formation of DCA was not investigated in detail. However,
the ligand DCA forms dark violet complexes with Fe3+ in acidic solution and red
complexes in alkaline solution just like deferasirox.
In conclusion, the ligand DCA was not suitable as an auxiliary ligand for
further investigations of the complex formation of deferasirox. In essence, the
ligand shows the same difficulty as deferasirox, too low water solubility for titra-
tion experiments in pure water solution.

7 The ligand DSA
33
7 The ligand DSA
The previously discussed ligand DCA was not sufficiently water soluble.
As a result, we needed to design a ligand that fulfils the criteria for higher water
solubility. The ligand MSA, having a sulfonic acid group instead of a carboxylic
acid group, was just soluble enough in pure water to perform titration experi-
ments. Its solubility in water is 0.7 g/L [37]. Even though being soluble in pure
water precipitation still occurred during titration experiments. If we add a se-
cond sulfonic acid group we should enhance water solubility to a great extent.
The disulfonic acid ligand DSA presented in Figure 7.1 has two sulfonic acid
groups and a water solubility of about 8 g/L, which is about 10 times higher
than MSA and 20 times higher than deferasirox (0.4 g/L at pH 7.4 [38]).
Figure 7.1: The structural formula of the ligand 2-[3,5-bis(2-hydroxyphenyl)-1H-1,2,4-triazol-1-yl]benzene-1,4-disulfonic acid (disulfonic acid derivative of deferasirox DSA).
Subsequently, the ligand DSA was sufficiently soluble to keep all com-
plexes in solution. We used this ligand as an auxiliary ligand to elucidate the
complex formation behaviour of deferasirox in pure water.

7 The ligand DSA
34
7.1 Determination of the pKa values of DSA
The expected pKa values of DCA were well determined, as discussed
previously. The pKas of the carboxylic acid groups range from 3.5 to 5. For this
reason, they can easily be studied by continuous potentiometric titrations which
are restricted to the range pH 2 to 12 [48].
The ligands MSA and DSA are featuring sulfonic acid groups which are
much more acidic than carboxylic acid groups. Subsequently, the first pKa of
MSA needed to be determined by a spectrophotometric batch titration between
pH 1 and 2 [37, 40]. The two pKas of the hydroxyphenyl groups were investigated
by continuous potentiometric titrations (see section 8.1.1). According to the
studies with MSA we needed to determine the acidity constants of the ligand
DSA with both methods mentioned, in pure water. Preliminary studies on the
determination of the pKa values were performed by F. Teucke, under my guid-
ance [49].
7.1.1 Determination of the pKa,2 by spectrophotometric batch titration
The ligand DSA was synthesised as a fourfold protonated ligand LH 4. For
titration purposes the ligand was dissolved in pure water. As a consequence of
the strong acidity of two sulfonic acid groups the ligand is already partially
deprotonated at the beginning of the continuous potentiometric titration. To de-
termine these strong acidic equilibrium constants the pH range needed to be
extended to pH < 2. This was carried out by performing a discontinuous spec-
trophotometric batch titration experiment between pH 1 and 2, hence to main-
tain the ionic strength 0.1 mol/L HCl/KCl was applied. The batch titrations were
carried out by F. Teucke, under my supervision [49]. Each titration point was
prepared separately in a thermostated double-walled glass vessel (T = 298 K)
by the procedure described in section 11.2.3. The determined pKa,2 value and
the titration conditions chosen are given in Table 7.1.
This deprotonation step of the ligand DSA can be described by the reac-
tion:

7 The ligand DSA
35
Table 7.1: A spectrophotometric batch titration experiment of the ligand DSA for the determ i-nation of the acidity constants pKa,2
[a]. The standard deviation of the value is given in brack-
ets [b]
. The titration conditions are given at T = 298 K.
pKa,2 value of DSA
measuring method spectrophotometric
method type batch titration
solvent pure water
[L]t 40.0 μmol/L
titration volume 10.042 mL
titrant and supporting electrolyte c(HCl) + c(KCl) = 0.1 mol/L
pH range 1.00 – 2.00
volume of data points 10
equilibration time 24 h
range of wave length 290 < λ < 380 nm
pKa,2 1.37(5)
σabs[c] 1.9 10-3
σsquares[c]
1.5 10-3
[a] For the ligand LHx the pKa,i is defined as: pKa,i = -logKa,i and Ka,i = [LHx-i] × [H] ×
[LH(x+1)-i]-1
[b] The deviation given in brackets corresponds to the standard deviation taken from
Specfit. [c]
The σabs and σsquares values are taken from Specfit.
Furthermore, the experiment was repeated and a mean value calculated
from the results of four titration experiments. The mean value is given in
Table 7.2 and compared with the pKa,1 for MSA. U. Heinz has determined the
pKa,1 for MSA in his doctoral thesis under similar conditions as DSA: pure wa-
ter, T = 298 K and I = 0.1 mol/L KCl [37].

7 The ligand DSA
36
Table 7.2: Mean value of 4 batch titrations for the acidity constant pKa,2 [a]
for the ligand DSA in pure water, T = 298 K and I = 0.1 mol/L HCl/KCl. Comparison to the pKa,1 of MSA in pure water, T = 298 K and I = 0.1 mol/L KCl.
Comparison pKa value of DSA and MSA
measuring method spectrophotometric
method type batch titration
solvent pure water
supporting electrolyte 0.1 mol/L KCl
DSA MSA
pKa,1 <-2 - -
pKa,2 [b] 1.33(8) pKa,1 [b] 1.12(4) [c]
[a] For the ligand LHx the pKa,i is defined as: pKa,i = -logKa,i and Ka,i = [LHx-i] × [H] ×
[LH(x+1)-i]-1
[b] The standard deviations in brackets were calculated with: √
∑ ( )
( ) ; measured
value; mean value; n number of values. [c]
Value taken from doctoral thesis of U. Heinz [37]
.
The acidity constant pKa,2 of DSA has a low value indicating the strong
acidity of the deprotonation. If we compare the pKa,1 of MSA to this pKa,2 of
DSA we recognize that the MSA acidity constant is about 0.2 units smaller.
This can be explained by the fact that the ligand MSA is present before depro-
tonation as the neutral species LH3 which deprotonates more easily than the
already once deprotonated species LH3
- of DSA, with a negative charge.
The UV-VIS spectra measured for the determination of the pKa,2 of DSA
are given in Figure 7.2. The spectra were recorded in the range 230 < λ
< 380 nm. For evaluation we analysed the range 290 < λ < 380 nm with the
program Specfit. The deprotonated ligand species LH22- and the protonated
ligand LH3
- species were defined as coloured species in Specfit. This method is
applicable resulting from the delocalisation of electrons in the aromatic systems
of the ligand. Thus, we can ascertain there is a significant change in the spec-
tra due to the deprotonation.

7 The ligand DSA
37
Figure 7.2: UV-VIS spectra of the batch titration of DSA collected from pH 1.00 – 2.00 (pure water, [DSA]t = 40.0 µmol/L, T = 298 K, I = 0.1 mol/L HCl/KCl).
The individual spectra for the two species taken from Specfit are pre-
sented in Figure 7.3.
Figure 7.3: Individual spectra of the two species LH3
-
and LH22-
taken from Specfit.

7 The ligand DSA
38
The question is to which protonation site can this macroscopic protona-
tion constant be assigned to? The two possibilities are either one of the sul-
fonic acid groups of DSA or one of the triazole nitrogen atoms in either 2 or 4
position of the ligand. The sulfonic acid groups are known to have very acidic
protonation constants. Previous studies have reported on the determination of
the pKa values of arenesulfonic acids.In studies by Cerfontain et al. the pKa
values of arenesulfonic acids were investigated by UV spectroscopy [50] and 1H-
NMR-techniques [51]. In later studies by Crumrine et al. 33S-NMR chemical
shifts were employed to verify pKa values of arenesulfonic acids [52-53]. They
made use of the linear relation of the pKa values to 33S-NMR chemical shifts of
arenesulfonic acids. In these studies they prepared aqueous solutions of the
arenesulfonic acids and their sodium or potassium salts for NMR experiments.
The pKa values obtained for benzenesulfonic acid and its derivatives by
33S-NMR technique were verified by pKa values calculated from a Hammett
plot.
Cerfontain reports have in common that the pKa values needed to be ex-
amined in almost concentrated sulphuric acid. For this purpose the Hammett
acidity function was applied and the Hammett acidity H0 varied. The pKa values
are obtained by extrapolation to dilute solution.
A summary of the pKa values of benzenesulfonic acid and some deriva-
tives is given in Table 7.3. As expected, the pKa values are negative and there-
fore very acidic. The values have been determined with three different meth-
ods: UV spectroscopy, 33S-NMR chemical shifts and with a Hammett Plot as
reported by Crumrine et al. [53]. As a result these values seem to be very trust-
worthy.
A report by Benoit et al. also using 13C-NMR spectroscopy to determine
the acidity of benzenesulfonic acid suggests a pKa value of -2.5(1) determined
in H2O-H2SO4 mixtures [54]. This value differs from those reported by Cerfontain
and Crumrine. Benoit has only determined one arenesulfonic acid and it is not
sure if this report is reliable. Nevertheless, Benoit also determined a negative
pKa value which shows the strong acidity of benzenesulfonic acid.

7 The ligand DSA
39
Table 7.3: The pKa [a]
value of benzenesulfonic acid and its derivatives determined with the UV spectroscopy and
33S-NMR techniques at 312 K.
Substrate pKa pKa
UV method [b] 33S-NMR at 312 K [c]
C6H5SO3H -6.65(5) -6.66(4)
m-SO3-C6H5SO3Na2 _ -7.01(4)
p- SO3-C6H5SO3K2 _ -6.99(4)
o-CH3-C6H4SO3H -6.55(5) _
m-CH3-C6H4SO3H -6.56(5) -6.60(4)
p-CH3-C6H4SO3H -6.59(5) -6.57(4)
p-Br-C6H4SO3H -6.86(5) -6.87(4)
m-NO2-C6H4SO3H _ -7.28(4)
o-NO2-C6H4SO3H -6.68(5) _
p-NO2-C6H4SO3Na -6.57(5) -7.21(4)
p-NH2-C6H4SO3K _ -6.42(4)
[a] pKa is defined as -log Ka with Ka = [ArSO3
-] × [H] × [ArSO3H]
-1
[b] The pKas were taken from Cerfontain
[50]. All arenesulfonic acids were employed in the
acid form. [c]
The pKas were taken from Crumrine [53]
.
In conclusion, these reports have shown that pKa values of aromatic sul-
fonic acids cannot be determined in dilute aqueous solution. We suppose that
the pKa,2 of DSA determined with spectrophotometric batch titration carried out
in 0.1 mol/L HCl/KCl can be assigned to the protonation of the triazole unit.
The consequence of this assertion is that DSA is obtained as a zwitteri-
on. An overview of the zwitterions tautomeric forms is presented in
Scheme 7.1. The triazole ring could be protonated at the nitrogen atoms in po-
sition 2 or 4. Additionally, a protonation of the sulfonic acids could occur in po-
sition 1 or 4. Which of the tautomeric forms is favoured is not certain.

7 The ligand DSA
40
Scheme 7.1: Possible tautomeric forms of DSA as a zwitterion.
However, the protonation constant of the unsubstituted 1,2,4-triazole is
known to the literature as pKa = 2.38(5) (T = 298 K, I = 0.1 mol/L) [55]. The ben-
zene-1,4-disulfonic acid substituent at the nitrogen atom in position 1 should
have a strong influence on the triazole ring. The sulfonic acid group has elec-
tron withdrawing properties (-M resonance effect). In addition, there are two
electron withdrawing sulfonic acid groups which cause a decrease in electron
density in the triazole unit. Consequently, the pKa of the triazole nitrogen
should also be decreased. The pKa was determined to 1.33(8) for the deproto-
nation of the triazole unit of DSA. This pKa is about 1.0 unit smaller than the
pKa of the unsubstituted 1,2,4-triazole. The effect of the benzene-1,4-disulfonic
acid substituent seems to have influence on the electron density in the triazole
unit.
Taken together, we have examined the pKa,2 of DSA in the pH range
1 – 2 in pure water. The pKa,2 value was determined to 1.33(8) and the proto-
nation could be assigned to one of the triazole nitrogen atoms in position 2 or

7 The ligand DSA
41
4. From this confirmation we conclude that the structure of the ligand DSA is
that of a zwitterion with one sulfonic acid and one triazole nitrogen protonated.
This assumption is confirmed by a crystal structure discussed in section 7.1.3.
7.1.2 Determination of the pKa,3 and pKa,4 with potentiometric titrations
The ligand DSA has two other pKa values which could be investigated by
continuous potentiometric titrations. Preliminary titrations were carried out by F.
Teucke, under my supervision [49]. The titration experiments were carried out in
pure water at 298 K and with KCl as supporting electrolyte for constant ionic
strength I = 0.1 mol/L. Due to difficulties with the electrodes used by F. Teucke
new titrations were carried out later with the Schott IoLine electrode.
We have determined the pKa,2 by spectrophotometric batch titration.
However, we comprised the pKa,2 into the model used to calculate the pKa,3 and
pKa,4 with the program Hyperquad2008. The pKa,2 varied considerably so that
the value was obtained to improve the fit of the titration. For the determination
of complexation constants the value from the spectrophotometric titration was
applied.
An example titration with logβ and pKa values is given in Table 7.4. Four
protons are neutralised during the potentiometric titration. The first proton is
already entirely dissociated at the beginning of the titration. The second proton
is almost entirely dissociated subsequent the pKa,2 cannot be determined suffi-
ciently. The other two pKa values can be assigned to the deprotonations of the
hydroxyphenyl rings. These values are in the expected range.

7 The ligand DSA
42
Table 7.4: An example titration experiment of the ligand DSA with overall protonation co n-stants logβx
[a] and acidity constants pKa,i
[b]. The standard deviations of the values are given
in brackets [c]
. The titration conditions are given at T = 298 K.
logβ and pKa values of DSA
measuring method potentiometric
method type continuous
solvent pure water
[L]t 1.00 mmol/L
[H]t 4.00 mmol/L
titration volume 50.0 mL
titrant 0.1 mol/L KOH
supporting electrolyte 0.1 mol/L KCl
electrode Schott IoLine
pKW 13.78
pH range 2.7 – 10.9
volume of data points 80
time for mixing process 80 s
σ[d] 0.780
logβ1 11.33(2) pKa,1 <-2
logβ2 20.70(2) [pKa,2 1.79(6)] [e]
[logβ3 22.49(6)] [e] pKa,3 9.37(2)
logβ4 _ pKa,4 11.33(2)
[a] For the ligand L logβx is defined as: βx = [LHx] × [L]
-1× [H]
-x.
[b] For the ligand LHx the pKa,i is defined as: pKa,i = -logKa,i and Ka,i = [LHx-i] × [H] ×
[LH(x+1)-i]-1
. [c]
The deviations given in brackets correspond to the threefold standard deviation taken from Hyperquad2008. [d]
The σ value is taken from Hyperquad2008. [e]
Value refined with Hyperquad2008, but not taken into account.

7 The ligand DSA
43
The calculated mean values for eight titration experiments are presented
in Table 7.5. These mean values are calculated by arithmetic mean and stand-
ard deviation or by simultaneous evaluation of the 8 titrations with the program
Hyperquad2008. In this table the value for pKa,2 was taken from the batch titra-
tion experiment as explained in section 7.1.1.
Table 7.5: Mean values of the overall protonation constants logβx [a]
and acidity constants pKa,i
[b] for the ligand DSA determined by two methods in pure water, T = 298 K and
I = 0.1 mol/L KCl.
logβ and pKa values of DSA
mean values and standard deviations from 8 titrations[c]
logβ1 11.32(2) pKa,1 <-2
logβ2 20.67(3) pKa,2 [d] 1.33(8)
logβ3 [d] 22.00(8) pKa,3 9.35(1)
logβ4 _ pKa,4 11.32(2)
mean values by simultaneous evaluation of 8 titrations[e]
pH range 2.7 – 10.9
σ[f ] 0.649
logβ1 11.31(1) pKa,1 <-2
logβ2 20.66(1) pKa,2[d] 1.33(8)
logβ3 [d] 21.99(8) pKa,3 9.35(1)
logβ4 _ pKa,4 11.31(1)
[a] For the ligand L logβx is defined as: βx = [LHx] × [L]
-1× [H]
-x.
[b] For the ligand LHx the pKa,i is defined as: pKa,i = -logKa,i and Ka,i = [LHx-i] × [H] ×
[LH(x+1)-i]-1
.
[c] The standard deviations in brackets were calculated with: √
∑ ( )
( ) ; measured
value; mean value; n number of values.
[d] The pKa,2 was taken from the batch titration described in section 7.1.1.
[e] The titrations were evaluated simultaneously with the program Hyperquad2008. The
deviations given in brackets correspond to the threefold standard deviation taken from Hyperquad2008. [ f]
The σ value is taken from Hyperquad2008.

7 The ligand DSA
44
The calculated arithmetic mean values for pKa,3 = 9.35(1) and
pKa,4 = 11.32(2) are in very good agreement with the mean values calculated
with Hyperquad2008 pKa,3 = 9.35(1) and pKa,4 = 11.31(1). The low deviations
determined for both methods refer to the second decimal place. In addition, the
σ value for the Hyperquad2008 calculation is < 1 which demonstrates the good
accordance of the measured titration curve with the calculated fit.
The titration curve for the pKa titration of DSA is shown in Figure 7.4. A
distinct inflection appears at 2 equivalents. It ranges from pH 4 to 8 and is initi-
ated by the complete deprotonation of both strong acidic protons of the ligand.
Figure 7.4: Potentiometric titration curve of the free ligand DSA in pure water, [L] t = 1.00 mmol/L, T = 298 K and I = 0.1 mol/L KCl. The open squares represent experimental points and the fit (solid line) was calculated from the equilibrium constants with Hyper-quad2008.
The first proton, presumably corresponding to one of the sulfonic acids,
was completely dissociated at the beginning of the titration. The second proton
(pKa,2 = 1.33(8)), assigned to one of the triazole nitrogen atoms, is completely
deprotonated at pH 4 indicated by this inflection at 2 equivalents.

7 The ligand DSA
45
The two hydroxyphenyl protons of the ligand LH22- are deprotonated in
alkaline solution. Subsequently, at 4 equivalents the ligand is completely
deprotonated.
On the basis of the equilibrium constants in Table 7.5, the species distri-
bution diagrams of the ligand DSA are calculated as a function of pH, and the
results are illustrated in Figure 7.5. The pH range from 1.00 to 2.00 depicts the
batch titration performed for the determination of the pKa,2. The species LH3
- is
present at pH 1 by 68%. It is deprotonated to LH22- which is formed at pH 2 by
83%. The pH range between pH 2.0 and 2.7 was not investigated.
In the continuous potentiometric titration starting at pH 2.7 the twofold
protonated ligand LH22- is predominant species over a long pH range. It reach-
es its maximum concentration of 100% after the inflection at pH 4 which corre-
sponds to 2 equivalents in the titration curve. At pH 7 LH22- is deprotonated and
the species LH3- starts to form. This species reaches its highest peak 83% at
pH 10.3. As the pH is raised from 9.3 to 10.9 the fully deprotonated ligand L4- is
formed. In essence, at the end of the titration LH3- (72%) and L4- (27%) are the
dominant species and LH22- only appears in low abundance.
In summary, for the evaluation of complexation constants of the ligand
DSA the pKa values are needed. We used the arithmetic mean values
pKa,3 = 9.35(1) and pKa,4 = 11.32(2) from the potentiometric titration and the
pKa,2 = 1.33(8) from the batch titration for all further evaluations of DSA titration
experiments.

7 The ligand DSA
46
Figure 7.5: Species distribution diagram as a function of pH for the ligand DSA, batch titration experiment (top, [L]t = 40.0 μmol/L, pure water, T = 298 K and I = 0.1 mol/L KCl) for pH 1.00 - 2.00 and continuous potentiometric titration (bottom, [L] t = 1.00 mmol/L, pure water, T = 298 K and I = 0.1 mol/L KCl) for pH 2.7 to 10.9. The species concentration were calculat-ed from the equilibrium constants listed in Table 7.5 (mean values from 8 titrations) with the program Hyss2006.

7 The ligand DSA
47
7.1.3 Crystal structures of the ligand DSA
The ligand DSA crystallized in two different structures. One structure
shows the deprotonated ligand with Cs+ as counterions. The other structure
shows the zwitterionic form of the ligand in the solid state.
The crystal structure [DSA-H4] · 1.5 MeOH as zwitterion
A crystal structure of the zwitterionic form of the ligand DSA was ob-
tained by crystallization of the fourfold protonated ligand in methanol. The crys-
tal structure was obtained by F. Teucke, under my supervision [49]. For crystal-
lization the solution was kept in an exsiccator over ethyl acetate. Suitable sin-
gle crystals were employed for X-ray analysis. The crystal structure is present-
ed in Figure 7.6.
O4A
O6A
S2A
C14
O5A
C15
C13
C16
C45
C46
C12
C11
N25
C21
C44
O11
H11O
C41
N24
O2'
N22
O1'
H22N
C23
C43
S1'
C42
C31
O32
H1M
O3'
C32
H32O
C36
O1M
O3
C33
C35
C42'
S1
C34
C1M
O1
O2
Figure 7.6: ORTEP-plot of the crystal structure of [DSA-H4] · 1.5 MeOH. The atomic dis-placement ellipsoids are drawn at the 30% probability level (C = grey, H = white, N = blue, O = red and S = yellow). CH-hydrogen atoms are omitted for clarity. OH- and NH-hydrogen atoms are displayed with defined radius. In addition to the ligand entity the illustration shows an adjacent S1-sulfonic acid group and one molecule methanol. Hydrogen bonding interac-tions and weak interactions are depicted as dotted lines and dashed lines, respectively.

7 The ligand DSA
48
The ligand crystallizes in the monoclinic space group C2/c. The structure
solution was found to be rather difficult attributed to the description of certain
solvent molecules that crystallized with the ligand. Accordingly, the X-ray re-
flexes were revised with the corresponding electron density of the solvent mol-
ecules by the Squeeze option of the program Platon [56-57]. The subtracted elec-
tron density per ligand molecule was 44 electrons. It is difficult to assign these
electrons to specific solvent molecules such as H2O, methanol or ethyl acetate.
Yet, we can confirm that this electron density corresponds to four positions in
the unit cell and all four positions note about equal amounts of electrons. The
resulting R values (R1 = 6.74 % and wR2 = 21.04%) obtained by refinement
without the solvent molecules are acceptable.
The high R values are also associated with the disorder of the S2-
sulfonic acid group. For clarity, only the main position (70%) is presented in
Figure 7.6. Perhaps, this disorder of the S2-sulfonic acid group can be at-
tributed to the absence of hydrogen bonding interactions to stabilize it in a fixed
position. In contrast, the position of the sulfonic acid S1 is stabilised by hydro-
gen bonding interactions between O1’ and H-O11 of another DSA ligand mole-
cule as well as between O3’ and H1M of methanol. Moreover, the torsional an-
gle (C42-C41-N24-N25) between the benzene-1,4-disulfonic acid moiety and
the triazole plane is 91.6%. As a result, their positions are almost perpendicular
to each other causing less interaction between the benzene-1,4-disulfonic acid
moiety and the triazole plane. Further, the 2p-orbitals of the hydroxyphenyl
rings from different ligand molecules in the structure interact with each other.
Their arrangement is described by the term π -stacking. For this structure the
hydroxyphenyl rings assemble with the spacing between 3.33 and 3.68 Å along
the c-axis.
An isotropic refinement was possible for the hydrogen atoms H-O11,
H-O32, H-N22 and H1M. The two protons H-O11 and H-O32 stabilize the hy-
droxyphenyl rings in a downward position by hydrogen bond ing to O1’ (of a
neighbouring S1 sulfonic acid) and to O1M (methanol). Consequently, the hy-
droxyphenyl rings form a plane with the triazole unit in a torsional angle of
maximum 5° from this plane. Further we note weak interactions of O11 and
O32 of the hydroxyphenyl rings with H-N22 of the triazole unit also stabilizing

7 The ligand DSA
49
the almost flat geometry. Some bond distances and bond angles for the hydro-
gen bonding interactions and weak interactions are given in Table 7.6.
Table 7.6: Selected bond distances and bond angles [a]
for the hydrogen bonding interactions and weak interactions for the structure of [DSA-H4] · 1.5 MeOH.
atom bond distance [Å] bond angle [°]
N22 – H22N ··· O32 2.53 131.2
N22 – H22N ··· O11 2.62 123.4
O32 – H32O ··· O1M 2.53 156.7
O1M – H1M ··· O3’ 2.67 159.1
O11 – H11O ··· O1’ 2.67 172.5
[a] Determined with Diamond.
Special attention is to be paid to the protonation of the triazole nitrogen
N22. The protonation at the nitrogen in position 4 of the 1,2,4-triazole unit was
found by isotropic refinement. This is consistent with the assignment of the
pKa,2 to a protonation at one of the triazole nitrogen atoms. The nitrogen N22
seems to be protonated more easily due to the weak interactions with the hy-
droxyphenyl rings. As a result, the ligand has a positive charge at this N22 n i-
trogen atom. Since there are no counterions in solution and the solvent mole-
cule methanol of the structure is also protonated, one of the sulfonic acid
groups must also be protonated. We could not refine any proton at either one
of the sulfonic acids. We assume this is a result of the disorder of the sulfonic
acid group S2.
Taken together, the ligand crystallized as a zwitterion protonated at the
1,2,4-triazole nitrogen N22 in position 4 and at one of the sulfonic acids. This
confirms our prediction of the ligands structure in aqueous solution suggested
in section 7.1.1.

7 The ligand DSA
50
The crystal structure Cs4[DSA-H2]2 · (H2O)13/6 · MeOH
The ligand DSA also crystallized as partly deprotonated ligand LH22- with
two Cs+ as counterions. The following structure crystallizes in the triclinic space
group P from a methanol solution kept over ethyl acetate in an exsiccator. In
the unit cell there are 4 ligand molecules and 8 Cs+ counterions and in the
asymmetric unit presented in Figure 7.7 two ligand molecules with 4 Cs+ coun-
terions are displayed.
O2
O1
S1O3
Cs4
C45C46
C44
O11
C41
N25
C11
N24
C12
C21
C16
C43
C13
C23
C42N22
C15
C35
C14
C36
C34
C31
O6O31
C33
Cs3
S2
O4
C32
O5
O9
Cs2O7
C52
C53
O51
S3
C51
Cs1
C54
O8
C56
C55
C85
C86
N65
C61
C84
N64
C81
N62
C63
C83
C82
C76
C75
O13
O71
C71
S4
C74
C72
O10
C73
O12
Figure 7.7: ORTEP-plot of the crystal structure of Cs4[DSA-H2]2 · (H2O)13/6 · MeOH. The atomic displacement ellipsoids are drawn at the 50% probability level (C = grey, N = blue, O = red, S = yellow and Cs = petrol). CH-hydrogen atoms and solvent molecules are omitted for clarity.
The structure was solved and refined with 13/6 water and one methanol
solvent molecules embedded into the structure. The R values we received for
this solution of the structure with the programs SHELXS-97 and SHELXL-97
were: R1 = 5.79% and wR2 = 15.19%. Despite the good R values, the structure
was not satisfying on account of the strong disorder of the solvent molecule

7 The ligand DSA
51
which could only be refined isotropic. For this reason, the X-ray reflexes were
revised with the residual electron density in the structure by the Squeeze op-
tion of the program Platon. As a result, the new R values improved to
R1 = 5.43% and wR2 = 11.83%. The residual electron density subtracted was
104.5 electrons corresponding to two ligand molecules. The solvent molecules
mentioned above generate 44 electrons. We assume the remaining 60.5 elec-
trons can be assigned to further solvent molecules which could not be located
and refined. Figure 7.7 shows this new refined crystal structure without the
disordered solvent molecules.
In this structure the hydroxyphenyl rings also form a plane with the tria-
zole unit. They are slightly tilted out of the plane by an angle of 5.0° for the lig-
and with the S1 and S2, 8.9° for the ligand with S3 and S4 sulphur atoms.
Looking at the positions of the hydroxylic oxygen of the phenyl rings we will
assess that one is pointing to the nitrogen atom in position 4 and one to the
nitrogen atom in position 2 of the central 1,2,4-triazole unit at both ligands. Ac-
cording to the total charge of the ligand entities and the amount of Cs+ counter-
ions we suggest that all hydroxyphenyl groups are protonated, even though the
protons could not be refined. This explains their positions pointing towards the
nitrogen atoms of the triazole unit presumably caused by hydrogen bonding
interactions. The donor-accepter distances between the hydroxylic oxygen and
the triazole nitrogen atoms are as expected for hydrogen bonding interactions
and confirm our suggestion. These are summarized in Table 7.7.
Table 7.7: Donor-acceptor distances [a]
for hydrogen bonding interactions between hydroxy-phenyl rings and triazole nitrogen atoms of Cs4[DSA-H2]2 · (H2O)13/6 · MeOH.
atom Donor-accepter distance [Å]
O11 – N25 2.66
O31 – N22 2.54
O51 – N65 2.66
O131 – N62 2.56
[a] Determined with Diamond.

7 The ligand DSA
52
The position of the benzene-1,4-disulfonic acid moiety of each of the two
ligands is almost perpendicular to the triazole plane. The angle the two rings
enclose is 89.8° for the ligand with S1 and S2 sulphur atoms and 88.7° with S3
and S4. Effectively, the rather bulky sulfonic acid groups gain maximum spac-
ing to the hydroxyphenyl rings to inhibit steric interaction. Further the sulfonic
acids arrange towards the Cs+ counterions since they are all deprotonated and
negative in charge. This causes a layer like arrangement in the structure if we
look along the b-axis as demonstrated in Figure 7.8. The four Cs+ counterions
align in one layer with the sulfonic acids towards them. The triazole plains form
the next layer with two stacked ligands generated by an inversion centre.
Figure 7.8: Layers in the structure Cs4[DSA-H2]2 · (H2O)13/6 · MeOH (C = grey, N = blue, O = red, S = yellow and Cs = petrol). View along the b-axis.
The ligand DSA crystallized as twice deprotonated ligand LH22- when Cs+
is present as counterions. In contrast to the structure without counterions men-
tioned above, the triazole nitrogen is not protonated, consequently the proto-
nated hydroxyphenyl rings turn towards the nitrogen atoms in position 2 and 4
of the 1,2,4-triazole unit initiated by hydrogen bonding interactions. In both
structures the benzene-1,4-disulfonic acid is nearly perpendicular to the tria-
zole plane and achieves less steric hindrance.

7 The ligand DSA
53
7.2 Complex formation of DSA with iron (III)
The ligand DSA was designed to resemble the iron chelating ligand de-
ferasirox in all its characteristics yet it is improved regarding water solubility of
the ligand itself and its metal complexes. The complexation chemistry of the
ligand deferasirox with Fe3+ has been investigated by U. Heinz and S. Stucky
(formerly S. Steinhauser) [37, 39]. Since the ligand was poorly soluble in pure
water the complexation constants were first determined by U. Heinz [37] in wa-
ter/DMSO medium with a molar fraction of xDMSO = 0.20 and then extrapolated
to pure water by S. Stucky [39]. The results of these investigations are summa-
rized in an article in the European Journal of Inorganic Chemistry [40].
7.2.1 Determination of the stability constant of the [Fe(DSA)]- complex
by spectrophotometric batch titration in pure water
The strong complexation of deferasirox with Fe3+ made it necessary to
determine the complexation constant of the mono-complex below pH 2 due to
complete complex formation at the beginning of the titrations. The complexa-
tion of DSA with Fe3+ is in accordance with deferasirox. It shows very strong
complexation with Fe3+ and forms a violet 1:1 complex at very low pH. Conse-
quently, this stability constant was determined with spectrophotometric batch
titrations from pH 1.00 to 2.03 as described in section 11.2.3. The titration ex-
periments were carried out by F. Teucke, under my guidance [49]. For the de-
termination of the stability constant of the [Fe(L)]- (110) complex of DSA the
hydrolysis of the [Fe(H2O)6]3+ complex was taken into account. The following
formation constants presented in Scheme 7.2 were calculated from values tak-
en from the NIST Database [55].
Scheme 7.2: Formation constants logβ10-1 (H2O, T = 298 K, I = 0.1 mol/L) and logβ10-2 (H2O, T = 298 K, I = 0.5 mol/L *) of the hydrolysis products of [Fe(H2O)6]
3+ [55]
. (* I = 0.1 mol/L was not available).

7 The ligand DSA
54
The stability constant of an example batch titration and the titration conditions
is summarized in Table 7.8.
Table 7.8: A spectrophotometric batch titration experiment of Fe3+
with DSA for the determi-nation of the stability constant logβxyz
[a] for the complex [Fe(DSA)]
-. The titration conditions
are given at T = 298 K.
Stability constant for [Fe(DSA)]-
measuring method spectrophotometric
method type batch titration
solvent pure water
molar ratio M:L 1:1
[M]t 0.20 mmol/L
[L]t 0.20 mmol/L
titration volume 10.266 mL
Titrant and supporting electrolyte c(HCl) + c(KCl) = 0.1 mol/L
pH range 1.00 – 2.03
volume of data points 10
equilibration time 24 h
range of wave length 400 < λ < 900 nm
logβ10-1 [b] -2.51
logβ10-2 [b] -5.76
logβ110 [c] 23.54(1)
σabs[d] 1.7 10-3
σsquares[d]
1.5 10-2
[a] For the ligand L logβxyz is defined as: βxyz = [MxLyHz] × [M]
-x × [L]
-y × [H]
-z.
[b] Values were calculated from overall formation constants taken from the NIST Dat a-
base [55]
. [c]
The deviation given in brackets corresponds to the standard deviation taken from Specfit.
[d] The σabs and σsquares values are taken from Specfit.

7 The ligand DSA
55
A mean value of the stability constant was calculated from 5 batch titra-
tion experiments all carried out with the same conditions as described above.
This mean value is given in the Table 7.9 and compared to the [Fe(MSA)] (110)
complex of the monosulfonic acid derivative MSA.
Table 7.9: Mean value of 5 batch titrations for the stability constant logβxyz [a]
for [Fe(DSA)]- in
pure water, T = 298 K and I = 0.1 mol/L HCl/KCl. Comparison to the [Fe(MSA)] complex.
Mean logβ110 value of the [Fe(DSA)]- complex
measuring method spectrophotometric
method type batch titration
solvent pure water
supporting electrolyte 0.1 mol/L KCl
DSA MSA
logβ110 [b] 23.54(4) logβ110 [c] 21.30(4)
[a] For the ligand L logβxyz is defined as: βxyz = [MxLyHz] × [M]
-x × [L]
-y × [H]
-z.
[b] The standard deviations in brackets were calculated with: √
∑ ( )
( ) ; measured
value; mean value; n number of values. [c]
Value taken from S. Steinhauser [40]
.
The stability constant of the 110 complex of DSA is slightly higher and
therefore more stable than the 110 complex of MSA. The geometry of the
[Fe(DSA)]- complex is depict in Scheme 7.3. It has a negative charge in con-
trast to the [Fe(MSA)] complex. Protonated [Fe(LH)]z- (111) complexes were
not verified for both ligands. To form a 111 complex both ligands need to be
protonated at either a sulfonic acid group or a triazole nitrogen atom. The sul-
fonic acids are much too acidic and the triazole nitrogen has a protonation con-
stant of pKa,2 = 1.33(8) for DSA and pKa,1 = 1.12(1) for MSA. The favoured co-
ordination mode of the ligand with Fe3+ is a tridentate meridional coordination
mode. Consequently, it is unfavourable to protonate the triazole nitrogen. A
model with a 111 complex for DSA could not be calculated for all batch titration

7 The ligand DSA
56
experiments. Possible values for a 111 complex were not consistent. As a con-
sequence, we decided not to take this complex into account.
Scheme 7.3: Possible tridentate meridional coordination of the [Fe(DSA)]- complex (110;
solv = solvent molecule).
If we compare the complexation of DSA with Fe3+ between pH 1 and 2
with that of deferasirox, the sole species found with deferasirox is a [Fe(LH)]+
complex instead of a [Fe(L)] complex. The ligand deferasirox has a carboxylic
acid functional group which has a pKa,1 = 4.64(1) (xDMSO = 0.20, T = 298 K,
I = 0.1 mol/L KCl, section 8.1.1). Accordingly, the carboxylic acid is protonated
between pH 1 – 2. As a result, the ligand species forming the complex with
Fe3+ is LH2- which forms the complex in a tridentate meridional coordination
mode. Further, all three ligands deferasirox, MSA and DSA arrange in the
same coordination mode, yet deferasirox is protonated at the peripheral benzo-
carboxylic acid group.
The absorption spectra for the batch titration of Fe3+ with DSA were col-
lected in the range 200 < λ < 1000 nm and analysed in the range
400 < λ < 900 nm as presented in Figure 7.9. The [Fe(DSA)]- complex exhibits
an absorption maximum at 516 nm. For evaluation with the program Specfit a
spectrum of a 0.2 mmol/L Fe3+ solution was also collected and provided to
Specfit as a known spectrum. In Specfit Fe3+ and the 110 complex were de-
fined as coloured species. All ligand species and the iron hydroxo complexes
were defined as non-coloured. The individual spectra of the [Fe(L)]- complex
and free Fe3+ are illustrated in Figure 7.10.

7 The ligand DSA
57
Figure 7.9: UV-VIS spectra of the batch titration of the [Fe(DSA)]- complex collected from pH
1.00 – 2.03 (pure water, [Fe3+
]t = 0.20 mmol/L, [DSA] t = 0.20 mmol/L, T = 298 K, I = 0.1 mol/L HCl/KCl).
Figure 7.10: Individual spectra of the batch titration of the [Fe(DSA)]- complex generated with
the program Specfit.
400 450 500 550 600 650 700 750 800 850 900
0.0
0.1
0.2
0.3
0.4
0.5
0.6pH 2.03
pH 1.00
ab
so
rption
[A
U]
[nm]
400 450 500 550 600 650 700 750 800 850 900
0.0
5.0x10²
1.0x10³
1.5x10³
2.0x10³
2.5x10³
3.0x10³
3.5x10³
Fe3+
[Fe(L)]-
[(
mo
l/L
)-1cm
-1]
[nm]

7 The ligand DSA
58
The spectra give rise to only one species [Fe(L)]- in solution. Further, the
Fe3+ spectrum with its maximum absorbance at 315 nm has little influence on
the spectra of the [Fe(DSA)]- complex.
Taken together, the ligand DSA forms a violet [Fe(DSA)]- complex (λmax
at 516 nm) with Fe3+ in acidic aqueous solution. Its stability constant is
logβ110 = 23.54(4). It forms the 110 complex like MSA, attributed to the unfa-
vourable protonation of this 110 complex. Deferasirox differs from these two
ligands only in the protonation at the peripheral carboxylic acid group which
forms a [Fe(LH)]+ complex in acidic solution. The 110 complex of deferasirox
and Fe3+ is formed above pH 2 in water/DMSO solution with a molar fraction of
xDMSO = 0.20. Further, the stability constant for this deferasirox complex in pure
water is logβ110 = 22.0 [40], therefore somewhat smaller than the stability con-
stant of the [Fe(DSA)]- complex. In essence, we suggest that all three ligands
deferasirox, MSA and DSA adopt the same tridentate meridional coordination
mode with Fe3+ in solution. As a result, DSA is very similar to deferasirox in its
complex formation with Fe3+ in acidic solution.
7.2.2 Continuous potentiometric and spectrophotometric titrations of
DSA with iron (III)
To investigate the complex formation of DSA with iron (III) above pH 2
continuous potentiometric titrations were performed in aqueous solution. The
ligand deferasirox and MSA form bis-complexes with Fe3+ in which two ligands
are bound to one Fe3+ central ion. As a consequence, titration experiments
were carried out with a Fe3+:DSA 1:2 and 1:3 molar ratio. Spectrophotometric
titration data was collected simultaneously to the potentiometric titrations. Pre-
liminary titrations were carried out by F. Teucke [49]. Owing to difficulties with
the applied electrodes, the titrations were repeated with a new electrode Schott
IoLine. For the evaluation of both potentiometric and spectrophotometric titr a-
tions the hydrolysis of the [Fe(H2O)6]3+ complex was taken into account (see
Scheme 7.2). Titration conditions and values of the potentiometric titrations for
both molar ratios are listed in Table 7.10.

7 The ligand DSA
59
Table 7.10: Example titration experiments of the complexation of Fe3+
with DSA. Overall sta-bility constants logβxyz
[a] are listed. The titration conditions are given at T = 298 K.
logβ values for the complexation of Fe3+ with DSA
molar ratio of M:L 1:2 1:3
measuring method potentiometric potentiometric
method type continuous continuous
solvent pure water pure water
[M]t 0.48 mmol/L 0.33 mmol/L
[L]t 1.00 mmol/L 1.00 mmol/L
titration volume 50.0 mL 50.0 mL
titrant 0.1 mol/L KOH 0.1 mol/L KOH
supporting electrolyte 0.1 mol/L KCl 0.1 mol/L KCl
electrode Schott IoLine Schott IoLine
pKW 13.78 13.78
pH range 3.0 – 5.3 3.0 – 4.8
volume of data points 54 50
time for mixing process 900 s 900 s
σ [b] 0.865 0.656
logβ10-1 [c]
-2.51 -2.51
logβ10-2 [c]
-5.76 -5.76
logβ110 [d]
23.54(4) 23.54(4)
logβ120 [e] 39.51(2) 39.44(2)
logβ121 [e] 43.71(4) 43.50 (4)
[a] For the ligand L logβxyz is defined as: βxyz = [MxLyHz] × [M]
-x × [L]
-y × [H]
-z.
[b] The σ value is taken from Hyperquad2008.
[c] Values were calculated from overall formation constants taken from the NIST Database
[55].
[d] Value determined by spectrophotometric batch titration (section 7.1.1).
[e] The deviations given in brackets correspond to the threefold standard deviation taken from
Hyperquad2008.

7 The ligand DSA
60
The [Fe(DSA)]- complex has already been formed at the beginning of the
continuous potentiometric titration for evaluations with the programs Hyper-
quad2008 and Specfit the known stability constant of the [Fe(DSA)] - complex
was set as a constant value. Mean values of the stability constants of each mo-
lar ratio were calculated. Additionally, all 12 titrations from both molar ratios
were evaluated simultaneously. The mean values are summarized in
Table 7.11. All mean values are very similar however the values studied by
simultaneous evaluation are more precise due to both molar ratios being taken
into account. Nevertheless, all evaluations lead to the same model with the two
species [Fe(L)2]5- (120 complex) and [Fe(L)(LH)]4- (121 complex).
Table 7.11: Mean values of the overall stability constants logβxyz [a]
from potentiometric titra-tions of Fe
3+ with DSA determined by two methods in pure water, T = 298 K and I = 0.1 mol/L
KCl.
logβ values for the complexation of Fe3+:DSA
1:2 1:3
mean values of 6 titrations [b] mean values of 6 titrations [b]
logβ120 39.53(7) logβ120 39.5(1)
logβ121 43.76(7) logβ121 43.6(1)
mean values by simultaneous evaluation of all 12 titrations [c]
σ [d] 1.626
logβ120 39.50(2)
logβ121 43.67(3)
[a] For the ligand L logβxyz is defined as: βxyz = [MxLyHz] × [M]
-x × [L]
-y × [H]
-z.
[b] The standard deviations in brackets were calculated with: √
∑ ( )
( ) ; measured
value; mean value; n number of values. [c]
The titrations were evaluated simultaneously with the program Hyperquad2008. The deviations given in brackets correspond to the threefold standard deviation taken from Hyperquad2008. [d]
The σ value is taken from Hyperquad2008.

7 The ligand DSA
61
The bis-complex [Fe(L)2]5- with two ligands bound to one central Fe3+ ion
and a protonated form [Fe(L)(LH)]4- of it were determined. The suggested coor-
dination geometry of these complexes is illustrated in Scheme 7.4.
Scheme 7.4: Suggested coordination geometries of the Fe3+
-DSA bis-complexes [Fe(L)2]5-
(120) and [Fe(L)(LH)]
4- (121).
The [Fe(DSA)2]5- complex adopts a tridentate meridional coordination ge-
ometry which is consistent with a crystal structure described in section 7.2.3.
The protonation of the 120 complex can only occur at one of the phenolate
groups thus the sulfonic acids, and the triazole nitrogen are too acidic. An ap-
parent pKa = 4.17 value was determined for the deprotonation of the
[Fe(L)(LH)]4- complex of DSA. It is noteworthy that this is only an apparent pKa
owing to the combination of two steps. For once the phenolate group is depro-
tonated and second the Fe-O bond is formed resulting in a tridentate coordina-
tion mode from the bidentate. The apparent pKa value of the deprotonation of
the 121 complex comprehends both of these reactions. Further, this type of
deprotonation will be referred to as an apparent pKa value in this thesis. We
assume that the phenolate group in position 3 of the triazole ring will be fa-
voured by the protonation since it can rotate towards the nitrogen atom in posi-

7 The ligand DSA
62
tion 2 and form hydrogen bonding interactions as depicted above. Consequent-
ly, one ligand is bound tridentate and one ligand bidentate to the Fe3+ central
ion. The free binding site is occupied by a solvent molecule.
The strong complexation of DSA with Fe3+ can also be deduced from the
titration curves of both molar ratios compared to the pKa titration curve as
demonstrated in Figure 7.11. The titrations start at about pH 3 and were car-
ried out to about pH 5 to prevent formation of iron hydroxide in solution.
Figure 7.11: Potentiometric titration curves of the free ligand DSA and Fe3+
with DSA with the molar ratios 1:2 ([Fe
3+]t = 0.48 mmol/L, [L] t = 1.00 mmol/L) and 1:3 ([Fe
3+]t = 0.33 mmol/L,
[L] t = 1.00 mmol/L) in pure water, T = 298 K and I = 0.1 mol/L KCl. The open squares, circles and triangles represent experimental points and the fit (solid line) was calculated from the equilibrium constants with Hyperquad2008.
The potentiometric titration with a Fe3+:DSA 1:2 molar ratio has an inflec-
tion point at four equivalents. The inflection points were not evaluated and are
not displayed in the graph. The strong pH decrease of the 1:2 molar ratio titra-
tion curve compared to the pKa titration curve shows that complexation pro-
ceeds throughout the titration. As a consequence, all four protons were re-

7 The ligand DSA
63
leased into solution causing the inflection at four equivalents. The titration with
the 1:3 molar ratio has an inflection at 3.33 equivalents also indicating the
strong complexation with two ligands bound to one Fe3+ central ion and one
excess ligand in solution. We could not find any evidence for complexes with
more than 2 ligands bound to the Fe3+ central ion.
On the basis of the equilibrium constants of the Fe3+:DSA 1:1 molar ratio
spectrophotometric batch titration and the 1:2 molar ratio continuous potenti-
ometric titrations the species distributions were calculated as a function of the
pH and the results are presented in Figure 7.12. The mono-hydroxo complex
[Fe(OH)]2+ is only present in the batch titration as a minor species. Subse-
quently, the hydroxo complexes of Fe3+, taken into account for the calculation,
do not play an important role in this species distribution. The batch titration be-
gins at pH 1 with 36% free Fe3+ and 64% readily formed [Fe(DSA)] - complex.
This 110 complex becomes the predominant complex to pH 2 with a maximum
concentration of 96% at this pH. The pH range between pH 2.0 – 3.0 was not
investigated.
The continuous potentiometric titrations were performed beginning at
pH 3 and the [Fe(DSA)]- complex is present with a concentration of 87%. At
this pH a protonated bis-complex [Fe(L)(LH)]4- has already formed with a con-
centration of 12%. As the pH is raised this protonated bis-complex reaches a
maximum concentration of 33% at pH 4 and then deprotonates to the bis-
complex [Fe(DSA)2]5-. The [Fe(DSA)2]5- complex starts to form at pH 3 and is
predominant complex at the end of the evaluated titration at about pH 5.3 with
92% of [Fe(DSA)2]5- complex formed. The species distribution was calculated
to pH 9 to show that this complex becomes the sole complex in solution from
physiological pH 7.4 to pH 9. Consequently, the [Fe(DSA) 2]5- complex is the
active complex at physiological pH. If we compare the species distribution of
DSA to that calculated for deferasirox extrapolated for pure water (see S.
Steinhauser [40]), we will find that the 120 complex of both ligands is the sole
complex with a concentration of 100% at physiological pH 7.4. As a result, DSA
shows the same complex behaviour as deferasirox regarding the iron (III) com-
plex present at physiological pH.

7 The ligand DSA
64
Figure 7.12: Species distribution diagrams as a function of pH for Fe3+
with the ligand DSA, batch titration experiment (top, [Fe
3+]t = 0.20 mmol/L, [L]t = 0.20 mmol/L, pure water,
T = 298 K and I = 0.1 mol/L KCl) for pH 1.00 – 2.00 and continuous potentiometric titration (bottom, [Fe
3+]t = 0.48 mmol/L, [L]t = 1.00 mmol/L, pure water, T = 298 K and I = 0.1 mol/L
KCl) for pH 3.00 – 9.00. The species concentration were calculated from the equilibrium con-stants listed in Table 7.11 (mean values from simultaneous evaluation of 12 titrations) with the program Hyss2006.
1.0 1.2 1.4 1.6 1.8 2.0
0
20
40
60
80
100
0
20
40
60
80
100
[Fe(OH)]2+
Fe3+
[Fe(L)]-
% S
pecie
s r
ela
tive to F
e3+
pH
3 4 5 6 7 8 9
0
20
40
60
80
100
0
20
40
60
80
100
[Fe(L)(LH)]4-
[Fe(L)2]
5-
[Fe(L)]-
% S
pe
cie
s r
ela
tive to F
e3+
pH

7 The ligand DSA
65
Table 7.12: Example titration experiments of the complexation of Fe3+
with DSA. Overall sta-bility constants logβxyz
[a] are listed. The titration conditions are given at T = 298 K.
logβ values for the complexation of Fe3+ with DSA
molar ratio of M:L 1:2 1:3
measuring method spectrophotometric spectrophotometric
method type continuous continuous
solvent pure water pure water
[M]t 0.48 mmol/L 0.33 mmol/L
[L]t 1.00 mmol/L 1.00 mmol/L
titration volume 50.0 mL 50.0 mL
titrant 0.1 mol/L KOH 0.1 mol/L KOH
supporting electrolyte 0.1 mol/L KCl 0.1 mol/L KCl
electrode Schott IoLine Schott IoLine
range of wave length 400 < λ < 900 nm 400 < λ < 900 nm
volume of data points 51 43
time for mixing process 900 s 900 s
σabs[b] 2.3 10-3 1.4 10-3
σsquares[b]
1.3 10-1 4.2 10-2
logβ10-1 [c]
-2.51 -2.51
logβ10-2 [c]
-5.76 -5.76
logβ110 [d]
23.54(4) 23.54(4)
logβ120 [e] 39.05(5) 39.39(4)
logβ121 [e] 43.51(4) 43.72 (4)
[a] For the ligand L logβxyz is defined as: βxyz = [MxLyHz] × [M]
-x × [L]
-y × [H]
-z.
[b] The σabs and σsquares values are taken from Specfit.
[c] Values were calculated from overall formation constants taken from the NIST Database
[55].
[d] Value determined by spectrophotometric batch titration (section 7.1.1).
[e] The deviation given in brackets corresponds to the standard deviation taken from Specfit.

7 The ligand DSA
66
The stability constants of DSA with Fe3+ were verified by spectrophoto-
metric titrations carried out simultaneously with some of the potentiometric t i-
trations. The determined stability constants and conditions are listed in
Table 7.12. They were performed in two molar ratios Fe3+:DSA 1:2 and 1:3 un-
der the same conditions as the potentiometric titrations described previously.
Further, the UV-VIS spectra recorded were evaluated with the program Specfit.
The calculated mean values of the stability constants determined by spectro-
photometric titrations are summarized in Table 7.13. For comparison the poten-
tiometric stability constants are also displayed.
Table 7.13: Mean values of the overall stability constants logβxyz [a]
of the complexation of Fe
3+ with DSA determined by spectrophotometric titrations in pure water, T = 298 K and
I = 0.1 mol/L KCl. Comparison to the overall stability constants determined by potentiometric titration.
logβ values for the complexation of Fe3+:DSA
1:2 1:3
measuring method spectrophotometric
mean values of 4 titrations [b] mean values of 5 titrations [b]
logβ120 39.3(5) logβ120 39.5(6)
logβ121 43.7 (4) logβ121 43.8(5)
mean values by simultaneous evaluation of all 12 titrations [c]
measuring method potentiometric
σ [d] 1.626
logβ120 39.50(2)
logβ121 43.67(3)
[a] For the ligand L logβxyz is defined as: βxyz = [MxLyHz] × [M]
-x × [L]
-y × [H]
-z.
[b] The standard deviations in brackets were calculated with: √
∑ ( )
( ) ; measured
value; mean value; n number of values. [c]
The titrations were evaluated simultaneously with the program Hyperquad2008. The deviations given in brackets correspond to the threefold standard deviation t aken from Hyperquad2008. [d]
The σ value is taken from Hyperquad2008.
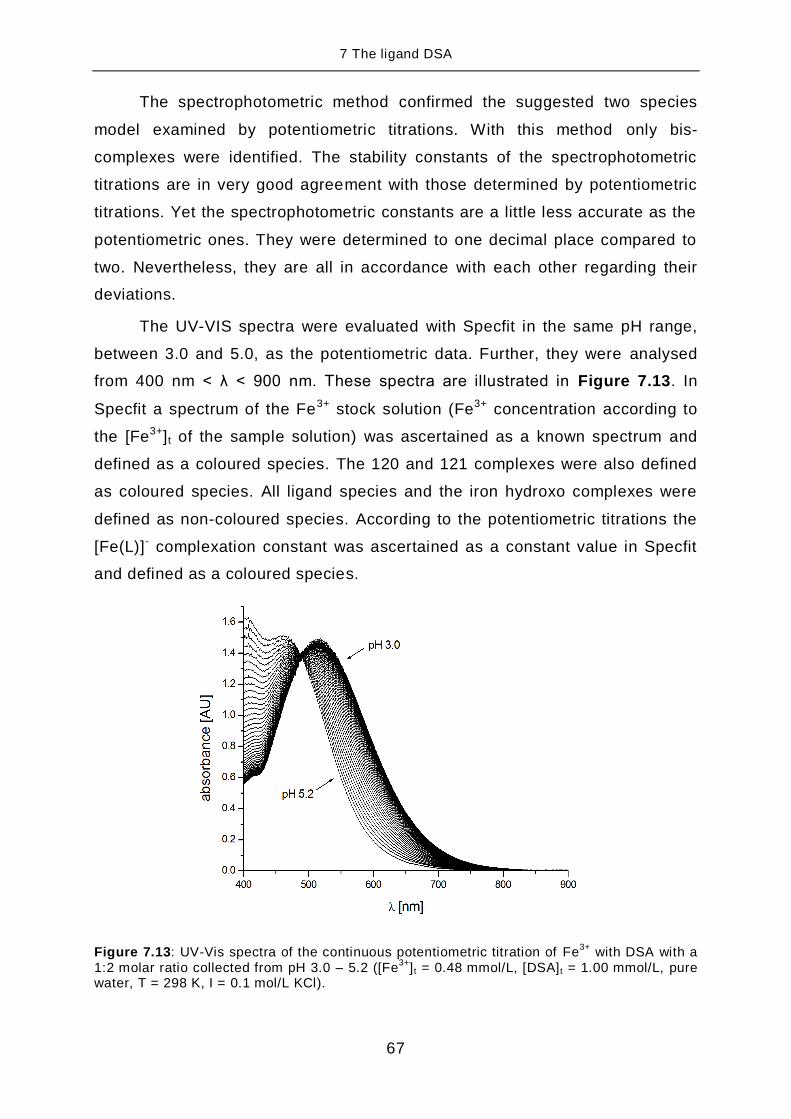
7 The ligand DSA
67
The spectrophotometric method confirmed the suggested two species
model examined by potentiometric titrations. With this method only bis-
complexes were identified. The stability constants of the spectrophotometric
titrations are in very good agreement with those determined by potentiometric
titrations. Yet the spectrophotometric constants are a little less accurate as the
potentiometric ones. They were determined to one decimal place compared to
two. Nevertheless, they are all in accordance with each other regarding their
deviations.
The UV-VIS spectra were evaluated with Specfit in the same pH range,
between 3.0 and 5.0, as the potentiometric data. Further, they were analysed
from 400 nm < λ < 900 nm. These spectra are illustrated in Figure 7.13. In
Specfit a spectrum of the Fe3+ stock solution (Fe3+ concentration according to
the [Fe3+]t of the sample solution) was ascertained as a known spectrum and
defined as a coloured species. The 120 and 121 complexes were also defined
as coloured species. All ligand species and the iron hydroxo complexes were
defined as non-coloured species. According to the potentiometric titrations the
[Fe(L)]- complexation constant was ascertained as a constant value in Specfit
and defined as a coloured species.
Figure 7.13: UV-Vis spectra of the continuous potentiometric titration of Fe3+
with DSA with a 1:2 molar ratio collected from pH 3.0 – 5.2 ([Fe
3+] t = 0.48 mmol/L, [DSA] t = 1.00 mmol/L, pure
water, T = 298 K, I = 0.1 mol/L KCl).

7 The ligand DSA
68
The individual spectra of the examined complexes are shown in
Figure 7.14. The spectra of all three complexes differ due to changes in the
coordination sphere. Thus, the coordination sphere changes when a second
ligand is added to the [Fe(L)]- complex. This second ligand is initially protonat-
ed at one of the phenolate groups, we presume, to form a [Fe(L)(LH)]4- com-
plex. The spectrum of the [Fe(L)(LH)]4- complex differs significantly from that of
the [Fe(L)2]5- complex indicating again a change in the coordination sphere. As
we suggested in Scheme 7.4, this would be the case when one phenolate
group of the [Fe(L)(LH)]4- complex is protonated and the Fe3+ central ion is co-
ordinated by one tridentate ligand, one bidentate ligand and a solvent molecule
that takes the place at the free octahedral binding site. By deprotonation of the
[Fe(L)(LH)]4- complex the [Fe(L)2]5- complex is formed with both ligands bound
in a meridional tridentate coordination mode.
Figure 7.14: Individual spectra of the continuous spectrophotometric titration of Fe3+
with DSA in a 1:2 molar ratio generated with the program Specfit.

7 The ligand DSA
69
The significant change of the individual spectra of the 121 and 120 com-
plex supports our theory on the protonation site at one of the phenolate groups
of the ligand DSA.
In summary, the stability constant of the [Fe(DSA)] - complex was deter-
mined by spectrophotometric batch titration. Further, two bis -complexes
[Fe(L)2]5- and [Fe(L)(LH)]4- for the ligand DSA were identified by potentiometric
and spectrophotometric titrations. In Table 7.14 these stability constants of the
Fe3+-DSA system are compared to stability constants of Fe3+-deferasirox com-
plexes extrapolated to pure water.
Table 7.14: Comparison of the overall stability constants logβxyz [a]
of Fe3+
-DSA complexes measured in pure water with Fe
3+-deferasirox complexes extrapolated to pure water.
DSA deferasirox [d]
solvent pure water
supporting electrolyte 0.1 mol/L KCl
logβ110 [b] 23.54(4) logβ110 22.0
logβ111 - logβ111 24.3
logβ120 [c] 39.50(2) logβ120 36.9
logβ121 [c] 43.67(3) logβ121 41.2
logβ122 - logβ122 43.4
[a] For the ligand L logβxyz is defined as: βxyz = [MxLyHz] × [M]
-x × [L]
-y × [H]
-z.
[b] The standard deviations in brackets were calculated with: √
∑ ( )
( ) ; measured
value; mean value; n number of values.
[c] The titrations were evaluated simultaneously with the program Hyperquad2008. The
deviations given in brackets correspond to the threefold standard dev iation taken from Hyperquad2008. [d]
Values were taken from S. Steinhauser [40]
.
We note that two complexes formed by deferasirox [Fe(LH)]+ (111) and
[Fe(LH)2]- (122) with Fe3+ are not formed by DSA with Fe3+. It has been dis-
cussed in section 7.2.1 why the [Fe(LH)] complex for DSA was not taken into

7 The ligand DSA
70
account. In summary, the main difference is that the free ligand deferasirox has
a carboxylic acid group with a pKa of 3.65(6) (pure water, T = 298 K,
I = 0.1 mol/L KCl, section 8.1.1) compared to DSA having a protonation con-
stant of pKa = 1.33(8) assigned to one of the triazole nitrogen atoms. The sul-
fonic acids are much too acidic to be protonated in aqueous solution. The
[Fe(LH)]+ complex of deferasirox can be formed due to a protonation at the
carboxylic acid causing a tridentate meridional coordination mode as shown in
Scheme 7.5. This is very favourable for this ligand system therefore the
[Fe(LH)]+ complex already forms in acidic solution between pH 1 and 2.
Scheme 7.5: Suggested coordination geometries of the deferasirox complexes [Fe(L)] (110), [Fe(LH)]
+ (111), [Fe(L)2]
3- (120), [Fe(L)(LH)]
2- (121) and [Fe(LH)2]
- (122).
To form a [Fe(LH)] complex with DSA the ligand can only adopt a biden-
tate coordination mode with one phenolate group protonated which is unfa-
vourable and could not be verified by the batch titration. As a consequence, the
formation of a [Fe(LH)] complex of DSA is dependent on the protonation site
and its protonation constant.

7 The ligand DSA
71
The other complex not formed by DSA is the 122 complex. The spectrum
of the [Fe(LH)2]- complex of deferasirox shows only a minor difference to that of
the [Fe(L)(LH)]2- (121) complex, with the consequence that the 122 complex
could only be determined by potentiometric not by spectrophotometric titration .
In contrast, the spectrum of the [Fe(L)2]3- (120) complex and the 121 complex
of deferasirox differ immensely. Accordingly, the coordination sphere must
change by protonating the 120 complex. We assume the protonation takes
place at one of the phenolate groups causing one of the tridentate meridional
ligands to coordinate bidentate as illustrated in Scheme 7.5. The hydroxy-
phenyl group can form hydrogen bonding interaction with a triazole nitrogen
atom stabilizing this kind of coordination mode. The same coordination mode
has been suggested for the [Fe(L)(LH)]2- complex of Fe3+ with DSA in
Scheme 7.4. If we take a look at the apparent pKa value of the deprotonation of
the 121 complexes for both ligands we can observe they are in the same
range. The apparent pKa value for the deprotonation of the 121 complex for
DSA is 4.17 and for deferasirox 4.3 (pure water). This supports the assumption
that for both ligands the protonation occurs at one of the phenolate rings. It is
noteworthy, that this is only an apparent deprotonation constant which origi-
nates from two reactions, the formation of the Fe-O bond and the deprotonation
of the hydroxyphenyl group, combined in the constant.
Again, only deferasirox forms a 122 complex. The spectra of both proto-
nated complexes 121 and 122 are very similar therefore the coordination
sphere should also be very similar. This would imply that the second protona-
tion occurs at one of the carboxylic acid groups of the ligand also shown in
Scheme 7.5. The pKa value of the deprotonation of the 122 complex of defer-
asirox is 2.2 (pure water) indicating a more acidic site being deprotonated for
example a carboxylic acid. The species distribution of deferasirox with Fe3+ is
given in Figure 7.15 and shows that the 122 complex is present to less than
5%. This complex is not very relevant for the species distribution .

7 The ligand DSA
72
Figure 7.15: Species distribution for the Fe3+
-deferasirox system in pure water calculated with the values from Table 7.14 with the program Hyss2006 at the following conditions [Fe] t = 0.48 mmol/L, [L] t = 1.00 mmol/L; pure water, T =298 K and I = 0.1 mol/L KCl.
In conclusion, the 121 complex of the ligands DSA and deferasirox is as-
sumingly protonated at the phenolate group causing a mixed tridentate and bi-
dentate coordination mode of the ligands. If DSA had formed a 122 complex
both ligands would need to coordinate bidentate which is clearly not favoura-
ble. For this reason, we suppose that the formation of a 122 complex for the
Fe3+-DSA system was not found.
The important complexes formed by both ligands are the 110 and the 120
complexes. If we compare the complexation constants for the 110 complexes,
the DSA constant is slightly higher by 1.54 units. The individual 120 complexa-
tion constant is logK120 = 15.96 (logK120 = [ML2] / [ML] × [L]) for DSA and
logK120 = 14.9 for deferasirox which is 1.06 units lower. Accordingly, the com-
plex stability of Fe3+ with DSA seems to be somewhat higher than with defer-
asirox. However, the difference is not immense and moreover the complex for-
mation of the 110 and 120 complexes seem to be very similar for both ligands.
Taken together, the ligand DSA can be well employed to elucidate the Fe3+
complexation chemistry of deferasirox.
1 2 3 4 5 6 7 8 9
0
20
40
60
80
100
0
20
40
60
80
100
[Fe(LH)2]
-
[Fe(L)2]
3-
[Fe(L)(LH)]2-
[Fe(L)]
[Fe(LH)]+
Fe3+
% S
pe
cie
s r
ela
tive
to
Fe
3+
pH

7 The ligand DSA
73
7.2.3 The Crystal structure Cs5[Fe(DSA)2] · 10.74 H2O
A crystal structure of the ligand DSA with Fe3+ was obtained by T. Nico-
lai, under my supervision [58]. The dark red crystals were grown from a solution
mixture of DSA with iron(III)-acetylacetonate in methanol. Caesium hydroxide
functions as a base and provides the necessary counterions. The solution was
kept in an exsiccator over ethyl acetate. Suitable single crystals were employed
for X-ray analysis. The coordination chemistry of the [Fe(DSA)2]5- complex is
presented in Figure 7.16.
C15
C14
C16
O6'
C13
O5'
C11
C12
S2'
O4'
O11
O2
C21
N25
N25'
N22
S1
O1
N24'
O32'
Fe1
N22'
O11'
C42
N24
O3
C23
C43 C41
O1'
O5
C44
C46
O32
C31
S1'
O2'
C32
C45
S2
C36
O6
O3'
C33
O4
C35
C34
ab
c
Figure 7.16: ORTEP-plot of the [Fe(DSA)2]5-
complex of the crystal structure Cs5[Fe(DSA)2] · 10.74 H2O. The atomic displacement ellipsoids are drawn at the 50% probability level (C = grey, Fe = orange, N = blue, O = red and S = yellow). CH-hydrogen atoms, solvent mole-cules and Cs
+ counterions are omitted for clarity.
The [Fe(DSA)2]5- complex crystallizes in the monoclinic space group C2/c
with the R values R1 = 6.82% and wR2 = 15.88%. Two completely deprotonated
ligands are bound to one Fe3+ central ion with a tridentate meridional coordina-

7 The ligand DSA
74
tion mode forming a bis-structure. The ligand DSA coordinates as expected
with the two phenolate groups O11 and O32 as well as with the triazole nitro-
gen N22 in an O-N-O coordination mode. The Fe3+ central ion was located at a
special position in the crystal structure. It encloses the crystallographic C2 axis
which generates one ligand molecule from the other by symmetry. The iron
central ion is also situated on the edge of the asymmetric unit. There are two
whole Cs+ counterions and one Cs+ situated at the edge of the asymmetric unit.
If we take a look at the [Fe(DSA)2]5- complexes charge we will find that alto-
gether there are 5 Cs+ counterions to compensate it. In Figure 7.16 the caesi-
um counterions and water molecules were omitted for clarity since one of the
caesium ions and some of the 10.74 water molecules are disordered.
Further, the bis-complex with its meridional coordination mode adopts a
distorted octahedral coordination geometry as shown in Figure 7.17.
Figure 7.17: Coordination polyhedron of the distorted octahedral geometry of the Cs5[Fe(DSA)2] · 10.74 H2O structure. Benzene-1,4-disulfonic acids are only indicated.

7 The ligand DSA
75
The distortion of the octahedron is closely related to the possible stereoi-
somers for a ML2 complex. When complexing a metal cation the phenolate
rings twist out of the plane of the triazole unit. As a consequence, the O11 -
Fe3+-O32 line formed by the complexation of one ligand entity can cause the
two phenolate rings to twist clockwise relative to the central triazole unit form-
ing the λ enantiomer or counter-clockwise forming the δ enantiomer as shown
in Scheme 7.6.
Scheme 7.6: Schematic illustration of the two possible ML enantiomers. [40]
In the bis-complex the combination of both ligand entities can result in
the formation of the λδ isomer or the λλ/δδ isomer. The geometry of the iso-
mers differs explicitly. Thus, in the λδ conformer the two ligands arrange almost
perpendicular to each other. The λλ/δδ conformer usually has a rather flat ge-
ometry allowing the phenolate rings to arrange somewhat parallel to each other
causing some intermolecular π-stacking interactions. Accordingly, the
[Fe(DSA)2]5- anion adopts the λλ/δδ conformation. In essence, the rather flat
geometry of the structure can be attributed to some intermolecular π-stacking
interactions occurring between the phenolate rings of the ligands. [40]
Interestingly, the two benzene-1,4-disulfonic acid substituents arrange
cisoid in the [Fe(DSA)2]5- anion. The crystal structure of the 1N-phenyl deriva-
tive ligand of deferasirox with the composition Na[Fe(L)]2 · 4EtOH also forms a
bis-complex [Fe(L)2]- with a λλ/δδ conformation, yet the phenyl substituents ar-
range transoid [40].
Further, a crystal structure Li3[Fe(deferasirox)2] · MeOH of the Fe3+-
deferasirox bis-complex has been obtained [59]. This [Fe(deferasirox)2]3- bis-
complex also adopts the λλ/δδ conformation with the benzoic acid substituents

7 The ligand DSA
76
transoid like for the 1N-phenyl derivative. However, the ligands arrange rather
perpendicular to each other in the [Fe(deferasirox)2]3- anion causing little to no
π-stacking interaction.
The crystal structure of the [Fe(DSA)2]5- complex is concordant with the
iron structure of the 1N-phenyl derivative in many characteristics. For example
the corresponding bond lengths and angles listed in Table 7.15 are very similar
to those of the 1N-phenyl derivative. The crystal structure of the
[Fe(deferasirox)2]3- complex shows many similarities to the [Fe(DSA)2]5- com-
plex, yet differs in some bond lengths and angles.
Table 7.15: Selected bond lengths and bond angles for the structure Cs5[Fe(DSA)2] · 10.74 H2O.
atom
bond
length [Å] atom
bond
length [Å] atom
bond
angle [°]
Fe1 – O11 1.963(6) Cs1 – O(6W) 3.64(2) O11 – Fe – O11’ 93.7(4)
Fe1 – O32 2.003(7) Cs1 – O32 3.233(6) O32 – Fe1 – O32’ 88.3(4)
Fe1 – N22 2.109(7) Cs2 – O1’ 3.100(8) O11 – Fe1 – O32 164.7(2)
Cs1 – O4 3.248(8) Cs2 – O(1W) 3.207(11) O11 – Fe1 – O32’ 91.0(3)
Cs1 – O5 3.161(7) Cs2 – O6’ 3.241(9) O11 – Fe1 – N22 83.0(3)
Cs1 – O11’ 2.952(6) Cs2 – O2’ 3.254(10) O11 – Fe1 – N22’ 93.0(3)
Cs1 – O3’ 3.034(9) Cs2 – O1’’ 3.313(9) O32 – Fe1 – N22 82.2(3)
Cs1 – O6’ 3.044(8) Cs2 – O3’ 3.359(11) O32 – Fe1 – N22’ 102.0(3)
Cs1 – O(5A) 3.20(2) Cs2 – O5’ 3.717(7) N22 – Fe1 – N22’ 174.1(4)
Cs1 – O(5B) 3.253(19) Cs2 – O4 2.922(8)
The rather short Fe1 – N22 bond length of 2.109(7) for [Fe(DSA)2]5- is in
the same range as the Fe1 – N1 bond length for the 1N-phenyl derivative com-
plex [Fe(L)2]- which is 2.092(5) [40] and the Fe1 – N11 for [Fe(deferasirox)2]3-
with 2.094(2) or Fe1 – N12 with 2.096(2) [59]. Additionally, the Fe – O bond

7 The ligand DSA
77
lengths are at the short end of the range expected for high-spin Fe3+. The cor-
responding Fe – O distances are Fe1 – O11 of DSA with 1.963(6) compared to
Fe1 – O11 of the 1N-phenyl derivative with 1.958(4) [40] and Fe1 – O11 of de-
ferasirox with 1.962(2) and Fe1 – O22 with 1.985(2) [59]. Further, the Fe1 – O32
of DSA with 2.003(7) compared to Fe1 – O1 of the 1N-phenyl derivative with
2.002(4) [40] are very similar, while the deferasirox distances Fe1 – O12 with
1.982(2) and Fe1 – O21 with 1.981(2) [59] are somewhat smaller.
Another similarity of the three structures: DSA, the 1N-phenyl derivative
and deferasirox with Fe3+ is that the ligands in all complexes are not planar as
already discussed. All crystal structures of the complexes adopt the λλ/δδ con-
formation. If we compare the torsional angles 12.4° and 23.5°, of the phenolate
rings with regard to the central triazole unit, of the ligand DSA with those of the
1N-phenyl derivative 14.1° and 23.5° [40], we conclude that they are in good
agreement. However, the torsional angles of the [Fe(deferasirox)2]3- complex
are different with 0.03°, 1.2°, 33.4° and 30.8° [59]. These reveal that one phenyl
ring is almost planar with the central triazole unit and one is twisted out of the
plane. Further, the N22 – Fe1 – N22’ angle for DSA is 174.1° and correlates
well with the corresponding angle 172.7° [40] of the 1N-phenyl derivative. In
contrast, the angle for the Fe3+-deferasirox structure is 165.9° [59].
The five Cs+ counterions in the crystal structure compensate the
[Fe(DSA)2]5- anions charge. The Cs1 ion has a sevenfold coordination envi-
ronment. Accordingly, the Cs1 ion is coordinated to the two phenolate oxygen
atoms O11’ and O32. Further coordination sites of the Cs1 ion are occupied by
four sulfonic acid oxygen atoms and by a distorted water oxygen atom. The
Cs2 ion also has a sevenfold coordination environment with 6 sulfonic acid ox-
ygen atoms and one water molecule coordinating. The disordered Cs3 – Cs4
ion binds predominantly to water molecules which are partly disordered.
The sulfonic acid groups orientate towards the Cs+ counterions causing a
twisting angle of 69.3° between the benzene-1,4-disulfonic acid entity and the
triazole unit. Nevertheless, the phenolate groups also coordinate with the Cs+
counter ions. As a consequence the Cs+ ions arrange on both sides of the ra-
ther flat geometry of the [Fe(DSA)2]5- complex forming layers as illustrated in
Figure 7.18.

7 The ligand DSA
78
Figure 7.18: Formation of layers in the crystal structure Cs5[Fe(DSA)2] · 10.74 H2O. View along the b-axis.
Viewing along the b-axis we observe alternating layers of Cs+ counteri-
ons coordinated to the benzene-1,4-disulfonic acids and layers of the iron cen-
tral ion coordinating with the triazole unit and its phenolate rings. The benzene -
1,4-disulfonic acids rise alternately into the layer, with the Cs+ counterions,
above and beneath the iron complex. In these layers the benzene-1,4-
disulfonic acids are orientated in a way causing some π-stacking interactions.
In the layers with the iron complex entities there are cavities between the com-
plexes in which water molecules are intercalated. In fact, the distance between
two Fe3+ atoms on the a-axis is about 12 Å and on the b-axis about 11 Å.
Subsequently, the crystal structure Cs5[Fe(DSA)2] · 10.74 H2O gives evi-
dence to the complexes structure in solution. We assumed the dark red bis-
complex forms a tridentate meridional coordination mode in alkaline solution.
The structure has proven this coordination mode in the solid state. Since this
coordination mode seems to be favoured in the solid state we suggest this co-
ordination mode should be also favoured in aqueous solution.

7 The ligand DSA
79
7.2.4 Investigation of the redox chemistry of the iron (II) / iron (III)-DSA
system by cyclic voltammetry
The redox chemistry of deferasirox was investigated in detail by S.
Stucky (formerly S. Steinhauser) [39]. The results of these investigations have
been published in S. Steinhauser 2004 [40]. In that report, the redox behaviour
of the two important complexes [Fe(LH)]+ and [Fe(L)2]3- of deferasirox has been
studied by cyclic voltammetry in acidic and alkaline water/DMSO solution, re-
spectively. It is essential to draw special attention to the redox potential of an
iron chelating agent since, depending on the range of the redox potential , it can
enhance oxidative stress in the human body. Iron has the catalytic ability to
cycle between two stabile oxidation states which are the ferric (Fe3+) and the
ferrous (Fe2+) iron. Reactive oxygen species (ROS) such as the hydroxyl radi-
cal OH˙ are generated by redox cycling caused by labile and redox-active
iron (II) components which originate from a reduction by e.g. the superoxide
radicals (equation a) presented in Scheme 7.7. The overall oxidation-reduction
process is known as the Haber-Weiss reaction (equation c) [60-62]. These ROS
which arise from the Fenton reaction (equation b) can be responsible for the
induction of cell death by initiating chemical reactions with biomolecules for
example mitochondrial damage or oxidation of DNA [29]. For this reason we in-
vestigated the redox activity of the important Fe3+-DSA complexes [Fe(L)]- and
[Fe(L)2]5- to examine whether DSA shows similar redox behaviour as defer-
asirox.
Scheme 7.7: Iron catalysed redox reactions associated with oxidative stress. Equation (a) Fe
3+ is reduced by the superoxide radical. Equation (b) Fe
2+ reduces hydrogen peroxide to the
hydroxyl radical and hydroxide anion known as the Fenton reaction. Equation (c) is the iron-catalysed Haber-Weiss reaction.

7 The ligand DSA
80
7.2.4.1 Redox chemistry in acidic solutions
The redox chemistry of the ligand DSA with iron (II/III) in acidic solution
was investigated in pure water. On account of the species distribution we know
that the [Fe(DSA)]- complex is the predominant species in acidic solution and
reaches its maximum concentration at pH 2. For this reason, all cyclic voltam-
mograms in acidic solution were recorded at pH 1.9. They were measured in a
0.5 mol/L KCl solution using an Au working electrode and Ag/AgCl as reference
electrode. Scanning was always started at about 800 mV. The cyclic voltam-
mograms are presented in Figure 7.19.
An irreversible peak from +100 mV to -300 mV (versus Ag/AgCl) was ob-
served in all cyclic voltammograms recorded at different scan rates. This peak
can be assigned to the reduction of the ferric complex [Fe III(DSA)]- to the cor-
responding ferrous [Fe II(DSA)]2- complex based on the following reaction of
equation 1.
Since there is no oxidation peak in the appropriate range, we assert that the
ferrous [Fe II(DSA)]2- complex is not stable and decomposes according to the
reaction given in equation 2.
This reaction is also a consequence of the low pH. If the ferrous complex is not
very stable, as shown in studies of deferasirox with Fe 2+ [39-40], the protons in
solution compete against the complexes central metal ion Fe 2+ and protonate
the phenolate groups of the ligand DSA at pH 2. Accordingly, the decomposi-
tion of the ferrous complex is a pH dependent reaction.

7 The ligand DSA
81
Figure 7.19: Cyclic voltammograms of [Fe(DSA)]- at scan rates as indicated measured using
an Au working electrode (pure water, pH = 1.9, [Fe] t = 2.3 mmol/L, [L] t = 5.0 mmol/L and I = 0.5 mol/L KCl).
-0.4 -0.2 0.0 0.2 0.4 0.6 0.8 1.0
-5.0µ
-4.0µ
-3.0µ
-2.0µ
-1.0µ
0.0
1.0µ
2.0µ
3.0µ
(eq 2)
(eq 1)
(eq 4)
(eq 3)
v = 50 mV/s
I [A
]
U [V]
-0.4 -0.2 0.0 0.2 0.4 0.6 0.8
-10.0µ
-8.0µ
-6.0µ
-4.0µ
-2.0µ
0.0
2.0µ
4.0µ
6.0µ
v = 200 mV/s
I [A
]
U [V]
-0.6 -0.4 -0.2 0.0 0.2 0.4 0.6 0.8 1.0
-20.0µ
-15.0µ
-10.0µ
-5.0µ
0.0
5.0µ
10.0µ
15.0µ
(eq 2)
(eq 1)
(eq 5)
(eq 4)
(eq 3)v = 500 mV/s
I [A
]
U [V]

7 The ligand DSA
82
A linear correlation, see Figure 7.20, was found between the cathodic
peak current of the reduction of the ferric complex [Fe III(DSA)]- and the square
root of the scan rate indicating a diffusion controlled reaction. The potential of
the reduction peak shifts towards negative values by increasing the scan rate.
This observation is confirmed with an irreversible reaction as we assumed, re-
sulting from equation 2.
Figure 7.20: Linear correlation of the cathodic peak current with the square root of the scan rate for the irreversible diffusion controlled reaction in equation 1 (pH = 1.9).
On account of the complex decomposing to the twofold protonated ligand
LH22- and free Fe2+ we observe an oxidation peak at about +600 mV (versus
Ag/AgCl) during the reverse scan. This oxidation peak can be attributed to the
oxidation of Fe2+ as presented in equation 3.
To confirm this assumption we recorded a cyclic voltammogram of the
free Fe3+ at pH 1.9 which is depicted in Figure 7.21. The oxidation peak of the
Fe2+/Fe3+ system appears at about +600 mV (versus Ag/AgCl) which is in ac-
cordance with the peak observed in the Fe-DSA voltammograms.
0 5 10 15 20 25 30
-16.0µ
-14.0µ
-12.0µ
-10.0µ
-8.0µ
-6.0µ
-4.0µ
-2.0µ
v1/2
[(mV/s)1/2
]
I cath [A
]

7 The ligand DSA
83
Figure 7.21: Cyclic voltammogram of FeCl3 at pH = 1.9 with a scan rate of 200 mV/s meas-ured using an Au working electrode (pure water, [Fe]t = 2.3 mmol/L, I = 0.5 mol/L KCl).
After Fe2+ has been re-oxidised to Fe3+ the complex formation is favoured
due to the strong complex affinity of ferric iron to DSA. When a new scan be-
gins the ferric complex is re-formed (equation 4).
This interpretation of the cyclic voltammograms is supported by meas-
urements at different scan rates. At slow scan rate (50 mV/s) the ferric complex
has enough time for complete reformation. However, if the scan rate is in-
creased to 200 mV/s and 500 mV/s an additional reduction peak appears at
about +400 mV (versus Ag/AgCl). At these higher scan rates the ferric complex
is not entirely formed subsequently remaining free Fe3+ still in solution is re-
duced to Fe2+ (equation 5).
The first cycle at a scan rate of 500 mV/s shows no reduction peak of
free Fe3+. Whereas, in the following cycles the ferric complex is not completely
0.2 0.3 0.4 0.5 0.6 0.7 0.8
-15.0µ
-10.0µ
-5.0µ
0.0
5.0µ
10.0µ
v = 200 mV/s
I [A
]
U [V]

7 The ligand DSA
84
formed the reduction peak of Fe3+ is observed. The intensities of the two ob-
served reduction peaks are closely related. If less ferric complex is formed by
equation 4 the reduction peak at +100 to -300 mV decreases while the other
reduction peak at +400 mV increases caused by more free Fe3+ in solution.
Further cycles are very well reproduced. The reduction peak at about +400 mV
assigned to equation 5 is therefore only observed at higher scan rates it disap-
pears at low scan rates. Further, the comparison to the cyclic vol tammogram in
Figure 7.21 of the free Fe3+ confirms this observation. Accordingly, the reduc-
tion peak of the Fe2+/Fe3+ system is also located at +400 mV.
This redox behaviour of the [Fe(DSA)] - complex is generally in very good
agreement with that observed for deferasirox. The cyclic voltammograms are
very similar. Even though, one needs to distinguish between the two different
ligand complexes active in redox cycling. The Fe2+/Fe3+-deferasirox system
was measured in a water/DMSO mixture at pH = 2.9 which means that the ac-
tive complex is [Fe(LH)]+. This is a protonated form of the 1:1 complex. The
complex studied in this work by cyclic voltammetry is the 110 complex
[Fe(DSA)]-. Yet, the coordination geometry of both complexes is tridentate me-
ridional and since the proton does not take part in any reactions concerning the
redox chemistry, we suggest that both complexes are suitable for comparison.
All reactions discussed above in equations 1 – 5 were also found for the corre-
sponding deferasirox complex [Fe(LH)]+. Yet, we have to take into considera-
tion that oxidation and reduction peak potentials of the Fe-DSA system are
shifted enormously in comparison to the Fe-deferasirox system. The reduction
peak assigned to equation 1 appears at about -200 mV for DSA and about
-100 mV [39] for deferasirox. A possible explanation could be attributed to the
significant difference in charge of the two 1:1 complexes of the ligands. The
DSA complex [Fe(DSA)]- has a negative charge while the deferasirox complex
[Fe(LH)]+ has a positive charge. Accordingly, the Fe-deferasirox complex is
much easier to reduce then the Fe-DSA complex causing its reduction peak to
shift to more negative potential. However, the oxidation and reduction peaks
assigned to equation 3 and 5 are also shifted. We observed the oxidation peak
at +600 mV and the reduction peak at +400 mV for the DSA measurements.
For the deferasirox system this oxidation peak was found at +400 mV and the

7 The ligand DSA
85
corresponding reduction peak at +300 mV [39]. To confirm these oxidation and
reduction peaks in the DSA measurements we performed a comparative meas-
urement with the free Fe2+/Fe3+ system which verified the oxidation and reduc-
tion peaks of the free Fe2+/Fe3+ system found in the Fe-DSA cyclic voltammo-
grams. To explain the shifting of the peaks we also need to take the experi-
mental conditions into account. The cyclic voltammetric investigations of both
ligands have been performed in different solvent media, at different pH and for
the Fe-DSA system potassium chloride was used as a supporting electrolyte.
In summary, we note that DSA shows very similar redox behaviour in
comparison to deferasirox, despite the different protonation state and charge of
the 1:1 complexes of both ligands. Fact is however the values of the oxidation
and reduction peaks differ significantly. Nevertheless, all character istic reac-
tions found in the Fe-deferasirox system are also found in the Fe-DSA system
hence we conclude that the redox behaviour of the Fe-DSA system in acidic
solution is closely related to that of the Fe-deferasirox system.

7 The ligand DSA
86
7.2.4.2 Redox chemistry in alkaline solutions
Investigations of the [Fe III/II(DSA)2]5-/6- system were carried out in alkaline
solution. This bis-complex is the sole species in solution from pH > 7. Its redox
behaviour was studied at pH 11.1 in pure water with KCl as supporting electro-
lyte with a concentration of 0.5 mol/L. The cyclic voltammograms needed to be
studied with a hanging mercury drop electrode (HMDE) as working electrode.
Accordingly, investigations of the [Fe III/II(L)2]3-/4- system of deferasirox also
needed to be determined with the HMDE. S. Stucky (formerly S. Steinhauser)
reports in his doctoral thesis that the determination of the stability constant of
the [FeII(L)2]4- complex of MSA and deferasirox is in particular hampered by the
strong reductive effect of the ferrous complex [39]. Thus, the ferrous complex
seems to be a better reducing agent then H2. The use of a HMDE enables the
investigation of strongly negative reduction potentials by suppressing the fo r-
mation of hydrogen.
The cyclic voltammogram recorded for the [Fe III/II(DSA)2]5-/6- system is
presented in Figure 7.22.
Figure 7.22: Cyclic voltammogram of the [FeI II/II
(DSA)2]5-/6-
system with a scan rates of 50 mV/s measured using a HMDE working electrode (pure water, pH = 11.1, [Fe]t = 2.3 mmol/L, [L]t = 5.0 mmol/L and I = 0.5 mol/L KCl).
-1.2 -1.1 -1.0 -0.9 -0.8 -0.7 -0.6 -0.5
-500.0n
-400.0n
-300.0n
-200.0n
-100.0n
0.0
100.0n
200.0n
I [A
]
U [V]

7 The ligand DSA
87
The reduction of the ferric complex [Fe III(DSA)2]5- is a quasi-reversible
reduction reaction. As expected, the reaction is not pH dependent as demon-
strated in equation 6.
The redox cycling can be attributed to a purely diffusion-controlled pro-
cess confirmed by the linear relation between the cathodic peak current and
the square root of the scan rate illustrated in Figure 7.23.
Figure 7.23: Linear correlation of the cathodic peak current with the square root of the scan rate for the quasi-reversible diffusion controlled reaction in equation 6 (pH = 11.1).
The peak separation ΔEP found was 83 mV (for comparison deferasirox
93 mV and MSA 102 mV [40]). The reduction potential for the [Fe III/II(DSA)2]5-/6-
couple versus NHE was calculated, related to the potential of the Ag/AgCl ref-
erence electrode, to be -0.67 V. Further, the reduction potential calculated in
relation to the iron(III/II)-hexacyanoferrate system [63] has the same value:
-0.67 V.
The redox chemistry observed for the [Fe(DSA)2]5- complex is consistent
with the investigations of the [Fe(L)2]3- complex of deferasirox. Yet, the reduc-
tion potential of the [Fe III(L)2]3- deferasirox complex determined in pure water is
5 10 15 20 25 30 35
-1.6µ
-1.4µ
-1.2µ
-1.0µ
-800.0n
-600.0n
-400.0n
v1/2
[(mV/s)1/2
]
I ca
th [A
]

7 The ligand DSA
88
-0.58 V [40]. The reduction potential found for the [Fe III/II(DSA)2]5-/6- couple is
more negative than the one found for the deferasirox [Fe III/II(L)2]3-/4- couple.
This finding can be explained by the fact that the Fe III-DSA complex has a neg-
ative charge of 5- and the Fe III-deferasirox of 3- which hampers the reduction of
the FeIII-DSA complex causing the reduction potential to shift towards a more
negative value.
It is of great importance that the reduction potential of the ferric [Fe(L) 2]x-
complexes of deferasirox and DSA are found to be in the negative range past
about -0.4 V with regard to oxidative stress and redox cycling. With the reduc-
tion potentials in this range, Fe3+ cannot be reduced to Fe2+ in physiological
medium and the ligand complexes used as iron chelating agents cannot induce
oxidative stress in the human body [40].

7 The ligand DSA
89
7.3 Complex formation of DSA with copper (II)
Copper (II) is one of 11 essential trace elements indispensable to life.
Trace elements are present in low concentrations in the human body associa t-
ed with their main function as catalysts in enzymatic processes in cells. Ac-
cordingly, copper (II) is important for protein enzymes such as the metalloen-
zymes copper oxidases. Further the divalent transition metal has the ability to
change its oxidation state easily and thereof the coordination geometry with the
protein ligand changes between copper (I) and copper (II) complexes. Proteins
use the dependence of the geometry on the oxidation state to control the redox
potential of specific Cu-protein complexes. [4]
An important copper-protein and enzyme is caeruloplasmin which is a
ferrioxidase. Caeruloplasmin plays a key role in iron metabolism. It converts
Fe2+ to Fe3+ and increases the rate of loading onto transferrin [64]. Consequent-
ly, there is a strong connection between iron and copper metabolism.
The trace element copper is found in all tissues in the human body. High
levels of copper concentration are found in the liver and brain. Absorbed cop-
per is immediately bound to the amino acid histidine or the proteins albumin
and transcuprin. Intracellular so called “chaperones” escort copper to specific
cellular sites and enzymes. Since free copper is toxic in high concentrations
ATPase-dependent copper transport proteins in the liver help regulate the cop-
per level in the human body. In fact, the human body has about 40 – 80 mg of
total copper. The human diet provides about 2 – 5 mg which covers the daily
requirements of 2.5 mg. [4, 64-65]
A genetic defect of a copper transport protein in the liver causes copper
overload resulting in a disease called Morbus Wilson. The redox properties of
the copper I/II system in excess are responsible for crucial cellular malfunc-
tions which result in liver cirrhosis and brain damage. Patients need a lifelong
treatment in form of chelation therapy with D-penicillamine or trien · 2HCl (tri-
entine) to excrete excessive copper. The structure of the chelating ligands is
given in Figure 7.24. D-Penicillamine forms a purple coloured complex with
copper (I) and copper (II) in form of a cluster with chloride as central ion. The
cluster anion has the formula [CuI8CuII
6(D-Pen)12Cl]5- [66]. In addition, Morbus

7 The ligand DSA
90
Wilson is treated with zinc salts which are applied to block the intestinal copper
uptake [65]. The copper overload caused by Morbus Wilson disease has severe
consequences to life expectancy comparable to iron overload caused by hae-
mochromatosis or regular blood transfusions.
Figure 7.24: Copper chelating ligands a) D-penicillamin (β,β-dimethylcysteine) and b) trien-tine (Triethyltetramine dihydrochloride, trien · 2HCl) applied in copper overload therapy.
In summary, copper (II) is an important biometal thus it is of great inter-
est to know the complexation properties of deferasirox and Cu 2+ to identify any
interference in chelation therapy of iron overload. Continuous potentiometric
titration experiments were performed to identify the species of the Cu 2+-DSA
system in solution. EPR experiments were carried out on deferasirox and DSA
Cu2+ complexes to underline results found by potentiometric titrations. The
main question to be clarified is whether deferasirox and its derivatives form d i-
mer or even polymer species with divalent metals such as copper (II).
7.3.1 Investigation of the complex formation of DSA with copper (II) in
pure water by potentiometric titrations
The deferasirox-copper (II) system was studied by U. Heinz in his doctor-
al thesis [37]. The determination of stability constants of the copper (II) defer-
asirox complexes was difficult due to precipitation during the titration experi-
ments. For this reason, he carried out competitive titrations in water/DMSO so-
lution (xDMSO = 0.20) with nitrilotriacetic acid (NTA) as competitive ligand to

7 The ligand DSA
91
keep all complexes in solution. The ligand DSA showed no precipitation for the
Cu2+:DSA 1:1 and 1:2 titrations in pure water and therefore its complexation
chemistry could be successfully investigated by potentiometric titrations.
Preliminary studies on the Cu2+-DSA system were performed by F.
Teucke, under my surveillance [49]. Further studies were necessary due to
measurement difficulties resulting from the previously applied electrodes. New
titration experiments in pure water were carried out with 3 different Cu2+:DSA
molar ratios with the electrode Schott IoLine. Conditions for the titration exper-
iments are given in Table 7.16.
Table 7.16: Titration experiment conditions of the complexation of Cu2+
with DSA given at
T = 298 K.
Conditions for the Cu2+-DSA titrations
molar ratio of M:L 1:1 1:2 2:1
measuring method potentiometric potentiometric potentiometric
method type continuous continuous continuous
solvent pure water pure water pure water
[M]t 1.00 mmol/L 0.50 mmol/L 2.00 mmol/L
[L]t 1.00 mmol/L 1.00 mmol/L 1.00 mmol/L
titration volume 50.0 mL 50.0 mL 50.0 mL
titrant 0.1 mol/L KOH 0.1 mol/L KOH 0.1 mol/L KOH
supporting electrolyte 0.1 mol/L KCl 0.1 mol/L KCl 0.1 mol/L KCl
electrode Schott IoLine Schott IoLine Schott IoLine
pKW 13.78 13.78 13.78
pH range 2.7 – 11.0 2.6 – 10.9 2.6 – 3.7
volume of data points 100 90 30
time for mixing process 600 s 600 s 600 s

7 The ligand DSA
92
The titrations performed in the ratios 1:1 and 1:2 showed no precipitation
over the whole pH range. Yet, during titration experiments carried out at a 2:1
ratio a green/grey precipitate was observed above pH 4. The composition of
the precipitate was not identified.
The purpose of performing titration experiments in different molar ratios
is to identify a species model that fits all titrations. Equilibrium constants should
be independent from the molar ratio applied. The model and mean values de-
termined are listed in Table 7.17.
Table 7.17: Mean values of the overall stability constants logβxyz [a]
from potentiometric titra-tions of Cu
2+ with DSA determined by simultaneous evaluation with Hyperquad2008 in pure
water, T = 298 K and I = 0.1 mol/L KCl.
logβ values for the complexation of Cu2+:DSA
four 1:1 titrations four 1:2 titrations
mean values by simultaneous evaluation of 8 titrations [b]
σ [c] 1.770
pH range 2.7 – 11.0
logβ110 17.93(2)
logβ111 20.4(1)
logβ120 21.8(2)
logβ121 32.7(1)
logβ22-1 29.01(5)
logβ22-2 17.3(1)
[a] For the ligand L logβxyz is defined as: βxyz = [MxLyHz] × [M]
-x × [L]
-y × [H]
-z.
[b] The titrations were evaluated simultaneously with the program Hyperquad2008. The
deviations given in brackets correspond to the threefold standard deviation taken from Hyperquad2008. [c]
The σ value is taken from Hyperquad2008.
At first, titrations of all three molar ratios were evaluated simultaneously
with Hyperquad2008. The titration data of the 2:1 molar ratio, before precipita-

7 The ligand DSA
93
tion occurred, was used for evaluation with the other ratios. Unfortunately, the
fit was not satisfactory applying the 2:1 data. We assume the pH range from
2.6 to 3.7 was too small for evaluation. Therefore, only the titrations with 1:1
and 1:2 ratios were implemented for evaluation of the stability constants of the
Cu2+-DSA complexes. Four titration data sets of each molar ratio were used for
simultaneous evaluation of the overall stability constants.
Two mononuclear complexes [Cu(L)]2- (110 complex) and a protonated
complex [Cu(LH)]- (111 complex) were identified. In contrast to the Fe3+ com-
plexes of DSA a 111 complex is formed with Cu2+. We assume the protonation
occurs at the hydroxyphenyl ring in position 3 which can rotate and form hydr o-
gen bonding interactions with the triazole nitrogen atom in position 2 as illus-
trated in Scheme 7.8. The copper central ion adopts an octahedral environ-
ment with a bidentate coordination mode with DSA and solvent molecules tak-
ing the place at the free coordination sites.
Scheme 7.8: Suggested coordination geometries of the complexes [Cu(L)]2-
(110), [Cu(LH)]-
(111), [Cu(L)2]6-
(120) and [Cu(L)(LH)]5-
(121).
The hydrogen bonding interaction contributes to the stabilisation of this
coordination, yet the apparent pKa value (deprotonation and formation of Cu-O

7 The ligand DSA
94
bond) for the deprotonation of the [Cu(LH)]- complex is 2.5 which originates
from the low negative charge of the complex and shows that the tridentate co-
ordination of the 110 complex is the favoured coordination sphere for this kind
of ligand. The logβ110 = 17.93(2) for the [Cu(DSA)]2- complex is evidence for a
strong complexation. Yet, the stability constant of the [Fe(DSA)] - was still much
stronger with a value of 23.54(4).
The bis-complexes [Cu(L)2]6- (120 complex) and [Cu(L)(LH)]5- (121 com-
plex) determined for Cu2+-DSA system are at first sight similar to the complex-
es found for the Fe3+-DSA system. They only differ in charge. Suggestions for
the coordination geometry are given in Scheme 7.8. The stability constant
logK120 is 3.9 (logK120 = [ML2] / [ML] × [L]) which is very low and indicates that
this complex is not very stable (vs. stability constant logK120 for [Fe(DSA)2]5- is
15.96). This is not surprising since copper (II) has a d9 electronic configuration
which is known for geometrical distortion by the Jahn-Teller effect. Accordingly,
the elongation of the bonds lying axial can occur for the two mononuclear com-
plexes 110 and 111. However, when a second ligand is bound to the Cu 2+ ion a
strain of the Cu-O and/or Cu-N distances needs to occur if the complex follows
the Jahn-Teller effect. Consequently, the mononuclear complexes experience
an energetic stabilisation through the Jahn-Teller effect, in contrast to the bis-
complexes which are destabilised by either bond stain through the Jahn-Teller
effect or by not distorting the octahedron. For this reason the 120 complex has
a very low stability constant and its formation is not favoured.
The apparent pKa value of the deprotonation of the [Cu(L)(LH)]5- complex
is 10.9. This deprotonation value is higher in contrast to the apparent
pKa = 4.17 for the previously discussed [Fe(L)(LH)]4- complex. In fact, the ap-
parent pKa value (10.9) for the [Cu(L)(LH)]5- lies between the two pKa values of
the hydroxyphenyl groups of the ligand DSA pKa,3 = 9.35(1) and
pKa,3 = 11.32(2). This means that the Cu-O bond of the second ligand in the
120 complex is very weak, if it exists at all. As a consequence, the [Cu(L) 2]6-
complex consists most probably of a tridentate and a bidentate coordinated li g-
and rather than of two ligands bound tridentate, as illustrated in Scheme 7.8.
This result differs from the bis-tridentate coordination mode observed for

7 The ligand DSA
95
[Fe(DSA)2]5-. An EPR spectrum in section 7.3.2.3 at pH 10.8 (Figure 7.38)
gives some evidence for the weak Cu-O coordination in the 120 complex.
Further, these titration experiments were carried out to bring clarity to the
question whether the ligand deferasirox and its derivatives forms dimers or pol-
ymers with divalent metal ions as asserted for the 1N-phenyl derivative of de-
ferasirox in literature by Ryabukhin [41]. The best possible fit in Hyperquad2008
was found by adding two complexes of the composition [Cu2(L)2(OH)x] (22-X
complexes) to the species model. The σ value of the fit with a [Cu2(L)2(OH)]5-
(22-1) and a [Cu2(L)2(OH)2]6- (22-2) complex was σ = 1.770. In contrast, if the-
se two complexes were excluded from the model the σ value increased to
11.171 indicating a strong contradiction of the model and the experimental titra-
tions. Another model included a [Cu2(L)2]4- (220 complex) and a 22-1 complex
with a σ value of 1.937 (values of the simultaneous evaluation of the 8 titrations
as described above: logβ110 = 17.89(3), logβ111 = 20.5(1), logβ120 = 21.8(2),
logβ121 = 32.6(1), logβ220 = 38.0(4), logβ22-1 = 29.13(6)). A 220 complex would
most probably adopt a phenoxo-bridged coordination geometry. Yet, the visual
verification of the fit was better for the 22-1 and 22-2 model.
Hydroxo-bridged copper (II) dinuclear complexes of the composition 22-X
have been reported in literature. Structures of mono-hydroxo-bridged dicop-
per(II) complexes of the composition 22-1 are found in literature for example
with the ligand tren as a [Cu2(tren)2(OH)](ClO4)3 · H2O complex [67] or with dia-
mino-bis(2-methylpyridyl) and diamino-bis(2-methylbenzimidazolyl) ligands [68].
Di-bridged-hydroxo dinuclear copper(II) complexes like the 22-2 complex are
also reported in literature for example for the ligand 1,10-phenanthroline [69] or
the ligands tetramethylethylenediamine and 2,2’-bipyridine [70]. Yet, we should
note that these ligands all coordinate by nitrogen atoms in contrast to DSA
which has an O-N-O coordination. Nevertheless, the principle molecular struc-
ture with the hydroxo-bridges should be similar to the ones reported as the
structure suggestions in Scheme 7.9 show.

7 The ligand DSA
96
Scheme 7.9: Molecular structure suggestions for the [Cu2(DSA)2(OH)]5-
(22-1) and the [Cu2(DSA)2(OH)2]
6- (22-2) complexes.
In general these structures should be regarded as suggestions as a con-
sequence of too little experimental evidence for their assignment . The 22-X
complexes found can originate from [Cu(L)(OH)x] (11-X) complexes that com-
bine to dinuclear copper (II) complexes. We assume that these complexes do
not originate from bidentate coordinating dimers as reported by Ryabukhin. He
claims that precipitation observed by adding the divalent metal ions Co2+, Ni2+
and Cu2+ to the 1N-phenyl derivative of deferasirox are caused by polymeric
structures as illustrated in Scheme 7.10 [41]. In this polymeric structure the lig-
ands would coordinate bidentate and two Cu2+ ions can coordinate to one lig-
and molecule forming a [Cu2(DSA)] (210) species monomer. One Cu2+ ion co-
ordinates to the nitrogen atom in position 2 of the 1,2,4-triazole unit and with
the phenolate ring in position 3 twisted towards the copper ion coordinating it.
The other Cu2+ ion is coordinated to the nitrogen atom in position 4 of the
1,2,4-triazole unit and the phenolate in position 5.

7 The ligand DSA
97
Scheme 7.10: Possible polymeric structure of deferasirox (R = Ph-COOH) and its derivatives (R = Ph, Ph-SO3H, Ph-(SO3H)2) with divalent metal ions such as copper (II).
The 22-X complexes differ from this kind of polymeric structure since
they are presumably aggregation compounds of 11-X complexes. In contrast to
the polymeric structure, 22-X compounds adopt a tridentate coordination mode
of the ligands and the Cu2+ ions are connected by hydroxo-bridges. We as-
sume, the twisting of the phenolate group in position 3 is not favoured and
therefore the formation of polymeric structures is hampered.
The simultaneous evaluation of the titrations with a molar ration of
Cu2+:DSA 1:1 and 1:2 could not be evaluated with 210 or 21-X complexes.
However, the individual evaluation of each titration of the three molar rations
showed that a 210 complex could be calculated into the model if the 111 com-
plex was excluded. Yet, not all titrations with the 1:1 molar ratio could be eval-
uated with the 210 complex. Further, the mean value for the overall stability
constant (about logβ210 ≈ 21.7) obtained for this 210 complex varied up to 1.2
units between the molar ratios. However, the species distribution calculated for
the model with the 210 complex for a 1:2 molar ratio shows that the 210 com-
plex reaches a maximum concentration (< 40%) at about pH 2.8 and is present
from the beginning of the titration until pH 4.5. As a result, this complex is not
present at physiological pH 7.4.

7 The ligand DSA
98
Consequently, we have decided in favour of the model with the hydroxo-
bridged 22-1 and 22-2 dinuclear copper (II) complexes. Accordingly, 8 titrations
with two different molar ratios were successfully evaluated simultaneously with
this model with the best achieved σ value of 1.770. Nevertheless, we cannot
exclude the possibility that 21X complexes exist in solution.
The titration curves performed in two molar ratios Cu2+:DSA 1:1 and 1:2
are illustrated in Figure 7.25. They are depicted in comparison to the ligand
titration curve. All titration curves with Cu2+ show a pH decrease compared to
the pKa titration curve of DSA. This can be attributed to the complexation of the
ligands with Cu2+ which is also observed in the light green colour of the solution
prior to the titration. During the titration the solutions colour turns to bright
green and at the end to dark green.
Figure 7.25: Potentiometric titration curves of the free ligand DSA and Cu2+
with DSA with the molar ratios 1:2 ([Cu
2+]t = 0.50 mmol/L, [L]t = 1.00 mmol/L) and 1:1 ([Cu
2+]t = 1.00 mmol/L,
[L] t = 1.00 mmol/L) in pure water, T = 298 K and I = 0.1 mol/L KCl. The open squares, circles and triangles represent experimental points and the fit (solid line) was calculated from the equilibrium constants with Hyperquad2008.

7 The ligand DSA
99
The titration performed in a Cu2+:DSA 1:2 molar ratio shows an inflection
point at 3 equivalents revealing that the [Cu(L)]2- complex has formed to its
maximum concentration (100% at pH 6) as illustrated in the species distribution
diagram in Figure 7.26. This complex is the predominant complex from pH 3 to
10 which is found in the whole titration range investigated. At the beginning of
the titration about 62% free Cu2+ ion is present in solution, yet 24% [Cu(L)]2-
complex and 14% [Cu(LH)]- complex have already formed causing the light
green colour of the solution. From pH 5 to 7 we observe a completion of the
[Cu(L)]2- complex formation. In alkaline solution the two dinuclear hydroxo-
bridged copper (II) complexes are present. The mono-hydroxo-bridged
[Cu2(L)2(OH)]5- complex starts to form at pH 7.5 and reaches its highest con-
centration of 45% at the end of the titration at pH 11.
Figure 7.26: Species distribution diagram as a function of pH for Cu2+
with the ligand DSA. Calculated for the continuous potentiometric titration performed with a 1:2 molar ratio ([Cu
2+]t = 0.50 mmol/L, [L]t = 1.00 mmol/L, pure water, T = 298 K and I = 0.1 mol/L KCl) from
pH 2.7 to 11.0. The species concentration were calculated from the equilibrium constants listed in Table 7.17 (mean values from simultaneous evaluation of 8 titrations) with the pro-gram Hyss2006.

7 The ligand DSA
100
Further, the di-bridged [Cu2(L)2(OH)2]6- complex is only present at pH 10
to 11 with a concentration of 9% at the end of the titration. Accordingly, the
[Cu2(L)2(OH)]5- complex plays a dominant role in alkaline solution. At physio-
logical pH 7.4 hardly any dinuclear complexes exist. Whereas, the
[Cu2(L)2(OH)2]6- complex is only present in strong alkaline solution with a con-
centration less than 10%. This complex plays no role at physiological pH. A
considerable amount of the bis-complex [Cu(L)(LH)]5- starts forming at pH 7
and reaches a maximum concentration of 31% at pH 9.7. It then deprotonates
to the bis-complex [Cu(L)2]6- which is only formed to a concentration of 15% at
the end of the titration. The low concentration of the [Cu(L)2]6- complex at high
pH underlines our prediction that these 1:2 complexes are not favoured due to
the impact of the Jahn-Teller effect.
Another titration curve illustrated in Figure 7.25 was performed with a 1:1
molar ratio. The inflection point appears at 4 equivalents also indicating the
completion of the formation of the [Cu(L)]2- complex. The species distribution
diagram for the 1:1 molar ratio is given in Figure 7.27.

7 The ligand DSA
101
Figure 7.27: Species distribution diagram as a function of pH for Cu2+
with the ligand DSA. Calculated for the continuous potentiometric titration performed with a 1:1 molar ratio ([Cu
2+]t = 1.00 mmol/L, [L]t = 1.00 mmol/L, pure water, T = 298 K and I = 0.1 mol/L KCl) from
pH 2.7 to 11.0. The species concentration were calculated from the equilibrium const ants listed in Table 7.17 (mean values from simultaneous evaluation of 8 titrations) with the pro-gram Hyss2006.
At the start pH 2.7 of the titration 66% free Cu2+ ion, 21% [Cu(L)]2- com-
plex and 12% [Cu(LH)] - complex are present. The [Cu(L)]2- complex in this spe-
cies distribution is the major component throughout the whole titration range. It
is predominant species from pH 3 to 9.7. The bis-complexes [Cu(L)2]6- and
[Cu(L)(LH)]5- are not present in this species distribution. Instead, the dinuclear
hydroxo-bridged Cu2+ complexes are more present. The [Cu2(L)2(OH)]5- com-
plex begins to form at pH 7.5 and reaches its highest concentration of 71% at
pH 10.8.
The [Cu2(L)2(OH)2]6- complex begins to form at pH 9.5 and reaches a
concentration of 13.3% at the end of the titration. Thus, the 1:2 complexes are
not favoured by the given molar ratio in contrast to the 22-1 and 22-2 dinuclear
7 The ligand DSA
102
complexes which are the dominant species in alkaline solution. This observa-
tion correlates with the hypothesis that 22-X complexes are aggregation com-
pounds of 11-X complexes since these are favoured in a Cu2+:DSA 1:1 molar
ratio titration.
Taken together, the model found for the Cu2+:DSA 1:2 and 1:1 molar ratio
titrations with the best minimized σ value comprehends a [Cu2(L)2(OH)]5- and a
[Cu2(L)2(OH)2]6- complex in addition to the expected mono and bis-complexes.
We need to point out that we cannot exclude that any 21X or 220 species also
exist in solution. Of special importance is the complexation of Cu2+ with DSA at
physiological pH 7.4. A possible 210 complex would only be found in acidic so-
lution and not at pH 7.4. The [Cu2(L)2(OH)]5- complex just begins to form at
pH 7.4 and is therefore not relevant since its concentration is below 2%. Addi-
tionally, the [Cu2(L)2(OH)2]6- complex is only found in alkaline solution pH > 10.
If we regard the model with the 220 and [Cu2(L)2(OH)]5- complexes the 220
complex is present at pH 7.4 with 12%. The dominant complex at physiological
pH in all models is however the [Cu(L)]2- complex which is present to more than
80%.
It was a great achievement to be able to investigate copper (II) complex-
es of the ligand DSA in pure water. These investigations have brought more
insight into the complex behaviour of the deferasirox system with the help of a
related water soluble ligand.

7 The ligand DSA
103
7.3.2 EPR-Experiments with copper (II) complexes of deferasirox and
DSA
Electron paramagnetic resonance (EPR) spectroscopy is a high-
frequency method used to study compounds with one or more unpaired elec-
trons. Hence, this method is only applicable to paramagnetic substances for
example organic or inorganic free radicals or complexes with transition metal
ions. The basic physical principle is similar to that of NMR spectroscopy, yet in
this case electron spins are excited instead of nuclear spins. In EPR spectros-
copy the g-factor corresponds to the chemical shift δ in NMR spectroscopy and
the hyperfine coupling constant to the internuclear coupling constant J. All EPR
spectra were performed by Prof. P. Strauch at the University of Potsdam. [71]
7.3.2.1 EPR-spectra of the powdered deferasirox copper (II) precipitate
The attempt to study deferasirox complexes with Cu2+ in water/DMSO so-
lutions with potentiometric titrations resulted in precipitation of a green solid
throughout the whole titration range. The green precipitate started to form at
pH 2 and did not dissolve until pH 12.5 (water/DMSO xDMSO = 0.20). The stabil-
ity constants determined by U. Heinz were obtained by competitive titration ex-
periments with nitrilotriacetic acid (NTA) as competitive ligand [37].
For clarity, it is still of interest to study the composition of the green pre-
cipitate. For this reason, EPR spectroscopy was performed with the isolated
and dried green precipitate. The EPR spectrum of a freshly prepared sample is
given in Figure 7.28. In the EPR spectrum we can identify four lines on the left
assigned to the parallel part of the spectrum and one large line pointing down-
wards which is the perpendicular part of the spectrum. This splitting of the
spectrum is typical for an isolated Cu2+ centre with axial symmetry. This is not
unlikely, since Cu2+ is known for Jahn-Teller distortion of the octahedron caus-
ing a tetragonal environment. The four lines of the parallel section contribute to
the hyperfine coupling of the copper (II) nuclear spin I = 3/2 with the electron
spin S = 1/2. Further, parameters of the spectrum could be evaluated as for
example the hyperfine coupling constant for the parallel section is

7 The ligand DSA
104
AII = 121(2) G and the g-factor is gII = 2.325(5). The g-factor for the perpen-
dicular section is g┴ = 2.06(1) and the hyperfine coupling constant is A┴ ≈ 10 G.
Figure 7.28: X-band EPR-spectrum of the freshly prepared sample of the green Cu2+
-deferasirox precipitate with AII = 121(2) G, gII = 2.325(5), g┴ = 2.06(1) and A┴ ≈ 10 G.
A hypothesis for the composition of the green insoluble solid is that it
might be a solvated [Cu(LH)] complex. This complex is neutral in charge which
hampers solubility. In addition, it is a mononuclear complex wi th tendency to
axial geometry which is in agreement with the EPR spectrum. A simulated EPR
spectrum generated with the given parameters, by Prof. P. Strauch, and the
experimental spectrum are shown in Figure 7.29. The simulated spectrum cor-
relates very well with the measured spectrum.
Effectively, after a period of about two months the samples EPR spec-
trum begins to undergo changes. The signal observed at 3250 G is replaced by
a new broad and badly resolved signal at 3110 G of lower intensity. According-
ly, this broad signal with its low intensity is coupled with the changes within the
solid we might attribute to copper (II) – copper (II) interactions with significant
antiferromagnetic coupling [72].
2600 2800 3000 3200 3400 3600
magnetic field [G]

7 The ligand DSA
105
Figure 7.29: Experimental and simulated spectrum of the freshly prepared sample of the green Cu
2+-deferasirox precipitate. The simulated spectrum was calculated with the given
experimental parameters (AII hyperfine coupling constant, gII and g┴ g-factors for the parallel and perpendicular part of the spectrum, exp is the experimental spectrum and calc the simu-lated spectrum, B0 magnetic field in mT)
[72].
The changes in the solid can also be induced by raising the temperature
during EPR measurements. Spectra collected at variable temperatures be-
tween 296 K and 434 K show a strong decrease of the signal as illustrated in
Figure 7.30.
Figure 7.30: EPR spectra of the freshly prepared sample of the green Cu2+
-deferasirox pre-cipitate at variable temperatures.
2400 2600 2800 3000 3200 3400 3600
434 K
296 K
magnetic field [G]

7 The ligand DSA
106
In conclusion, the green precipitate is a mononuclear species with axial
geometry, presumably the [Cu(LH)] complex. This complex seems to age which
causes a significant change in the EPR spectrum. The badly resolved broad
signal can be explained by an increase in antiferromagnetic coupling as ex-
pected for a polymeric structure as shown in Scheme 7.10 with copper (II) –
copper (II) interactions. It is noteworthy, that this is just one interpretation of
these spectra. Yet, there is no definite proof to confirm the formation of a poly-
meric structure.
7.3.2.2 EPR-spectra of the deferasirox copper (II) complexes in frozen so-
lutions
The green precipitate was observed from pH 2 until about pH 12.5 in a
water/DMSO solution (xDMSO = 0.20). Accordingly, the precipitate dissolves
again in alkaline solution. For this reason, the pH of a freshly prepared solution
([Cu2+]t = 2.0 mmol/L and [L] t = 2.0 mmol/L) was adjusted to pH 13.0 until all
precipitate was dissolved and an EPR spectrum was measured of the dark
green solution frozen at 126 K. Unfortunately, the spectra were badly resolved
and no hyperfine coupling could be identified. The sample was to dilute, con-
sequently a doubly concentrated sample ([Cu2+]t = 4.0 mmol/L and
[L]t = 4.0 mmol/L) was prepared with a molar fraction of xDMSO = 0.22 to ensure
solubility. The EPR spectrum recorded at 126 K and pH 13.9 is presented in
Figure 7.31. In this spectrum one component seems to predominate. One de-
fined set of 4 lines is observed for the parallel part of the spectrum indicating
one isolated copper (II) centre. The EPR parameters of this species are
AII = 156(3), gII = 2.285(5). In comparison to the spectrum of the green solid in
Figure 7.28 this is a different species according to the different EPR parame-
ters. Further, the perpendicular line of the signal is split. This can be explained
by a reduction of the axial symmetry to rhombic symmetry. This spectrum indi-
cates a mononuclear copper (II) complex with rhombic symmetry.

7 The ligand DSA
107
Figure 7.31: EPR spectrum of the frozen solution of the Cu2+
-deferasirox system at pH 13.9 (T = 126 K, [Cu
2+]t = 4.0 mmol/L, [L]t = 4.0 mmol/L and xDMSO = 0.22). The parameters are
AII = 156(3), gII = 2.285(5).
Another spectrum collected at 126 K, from a second sample of the solu-
tion at pH 13.9 is given in Figure 7.32. This EPR spectrum seems to contain
the same species observed in the spectrum in Figure 7.31. Curiously, it also
reveals the set of lines for at least one or even two other species. These spe-
cies also have isolated Cu2+ centres, unfortunately their spectra strongly inter-
fere with each other. Two sets of lines are marked with black and blue arrows.
Additionally, the perpendicular line also splits up. The green marked split ting of
this line may originate from a hyperfine coupling interaction caused by molecu-
lar orbitals formed with the p-orbital of a nitrogen atom (S = 1, expecting 3 lines
in the spectrum) interacting with the electron density of Cu 2+. The other splitting
may again refer to the decrease of symmetry to rhombic symmetry. Unfortu-
nately, the spectra all overlie each other consequently their parameters cannot
be identified.
2400 2600 2800 3000 3200 3400 3600 3800
magnetic field [G]

7 The ligand DSA
108
Figure 7.32: EPR spectrum of the frozen solution of the Cu2+
-deferasirox system at pH 13.9 (T = 126 K, [Cu
2+]t = 4.0 mmol/L, [L]t = 4.0 mmol/L and xDMSO = 0.22).
Taken together, the EPR spectra of a frozen solution of Cu 2+ and defer-
asirox at pH 13.9 in water/DMSO (xDMSO = 0.22) revealed one dominant spe-
cies with different EPR parameters than the species found in the powdered
precipitate. A second spectrum showed that at least one other species is pre-
sent in solution. We deduce from both spectra that the copper (II) centres of all
species are isolated. However the parameters of these additional species could
not be identified due to overlapping of the spectra. Despite the above, the
spectra indicate that the axial symmetry is decreased to a slightly rhombic dis-
tortion of the symmetry which is evidence for the change in the coordination
sphere of the copper (II) centres of the complexes in solution.
It seems that the precipitate consisting of an insoluble complex (or poly-
meric structure) dissolves in alkaline solution by changing its coordination envi-
ronment from axial to rhombic. At least two mononuclear copper (II) complexes
form and are significantly soluble in the water/DMSO solution at pH 13.9.

7 The ligand DSA
109
7.3.2.3 EPR-spectra of the DSA copper (II) complexes in frozen solutions
A sample of a Cu2+ and DSA solution with a 1:2 molar ratio was prepared
in pure water for EPR measurements. EPR spectra collected at ambient tem-
perature were unsuitable due to strong interactions between the molecules in
solution. To suppress intermolecular interactions the EPR spectra were record-
ed in frozen solutions. Since these samples were diluted by the solvent the so-
lution needed to be more concentrated. The sample solutions were prepared
with a concentration of 5.0 mmol/L of Cu2+ and 10.0 mmol/L of the ligand DSA.
Four samples of the given concentration at selected pH values were prepared
and their EPR spectra recorded.
A species distribution diagram calculated with the stability constants de-
termined in section 7.3.1 for the given concentrations is presented in
Figure 7.33.
Figure 7.33: Species distribution diagram as a function of pH for Cu2+
with the ligand DSA. Calculated for a 1:2 molar ratio ([Cu
2+] t = 5.0 mmol/L, [L] t = 10.0 mmol/L, pure water,
T = 298 K and I = 0.1 mol/L KCl) from pH 2.7 to 11.0. The species concentration were calc u-lated from the equilibrium constants listed in Table 7.17 (mean values from simultaneous evaluation of 8 titrations) with the program Hyss2006.

7 The ligand DSA
110
The first EPR spectrum was recorded at pH 2.7 as a frozen sample at
180 K. The EPR spectrum is illustrated in Figure 7.34.
Figure 7.34: EPR spectrum of the Cu2+
-DSA system at pH 2.7 in frozen solution at 180 K (pure water, [Cu
2+]t = 5.0 mmol/L and [L] t = 10.0 mmol/L).
The hyperfine coupling observed in this spectrum shows at least 7 or 8
lines in the parallel part. These lines do not seem to be equally spaced. For an
isolated Cu2+ centre we would expect four equally spaced lines with a distinct
hyperfine coupling constant. For the attempt to interpret this spectrum there are
two theories. One is that at least two species are present in this spectrum form-
ing two sets of the expected four lines for isolated Cu 2+ centres. A look at the
species distribution in Figure 7.33 shows that at pH 2.7, the very beginning of
the species distribution, two predominant complexes [Cu(L)]2- (52%) and
[Cu(LH)]- (29%) and about 19% free Cu2+ (aq) ion are present. The spectrum
could be explained by these two complexes present in solution forming two
sets of four lines. However, a clear determination of the EPR parameters
g-factor and AII was not possible since these lines overlap and cannot be allo-
cated. The free Cu2+ ion should also induce a set of lines in the EPR spectrum.
A possible explanation is that this set of lines overlaps with those of the com-
plexes and cannot be identified separately. The perpendicular part of the spec-
2200 2400 2600 2800 3000 3200 3400 3600 3800
magnetic field [G]

7 The ligand DSA
111
trum shows strong line broadening and is badly resolved. Consequently, a pre-
diction of the geometry of the species is hindered. The broad line in the per-
pendicular part does not distinctly split which may be evidence for axial geome-
try or only very little rhombic distortion.
A second interpretation for this multi-lined spectrum could be the pres-
ence of two neighbouring Cu2+ centres interacting. If two Cu2+ centres are co-
ordinated to the same complex their nuclear spins S = 3/2 will interact with
each other causing a hyperfine coupling observed as a septet signal in the EPR
spectrum. Seven lines of the observed EPR spectrum at pH 2.7 could fulfil this
criterion. An additional half field signal assigned to the forbidden transition
Δms = ±2 was observed as shown in Figure 7.35. This badly resolved signal
could be evidence for a Cu2+-Cu2+ interaction.
Figure 7.35: Half field EPR spectrum observed for the EPR spectrum at pH 2.7.
In section 7.3.1 a possible [Cu2(DSA)] complex was discussed which, if
existent, would be present in acidic solution. We cannot exclude that this signal
could be assigned to a dimeric [Cu2(DSA)] complex.
A second sample of the Cu2+-DSA system was prepared at pH 5.8. The
EPR spectrum is given in Figure 7.36.
1300 1400 1500 1600 1700
magnetic field [G]
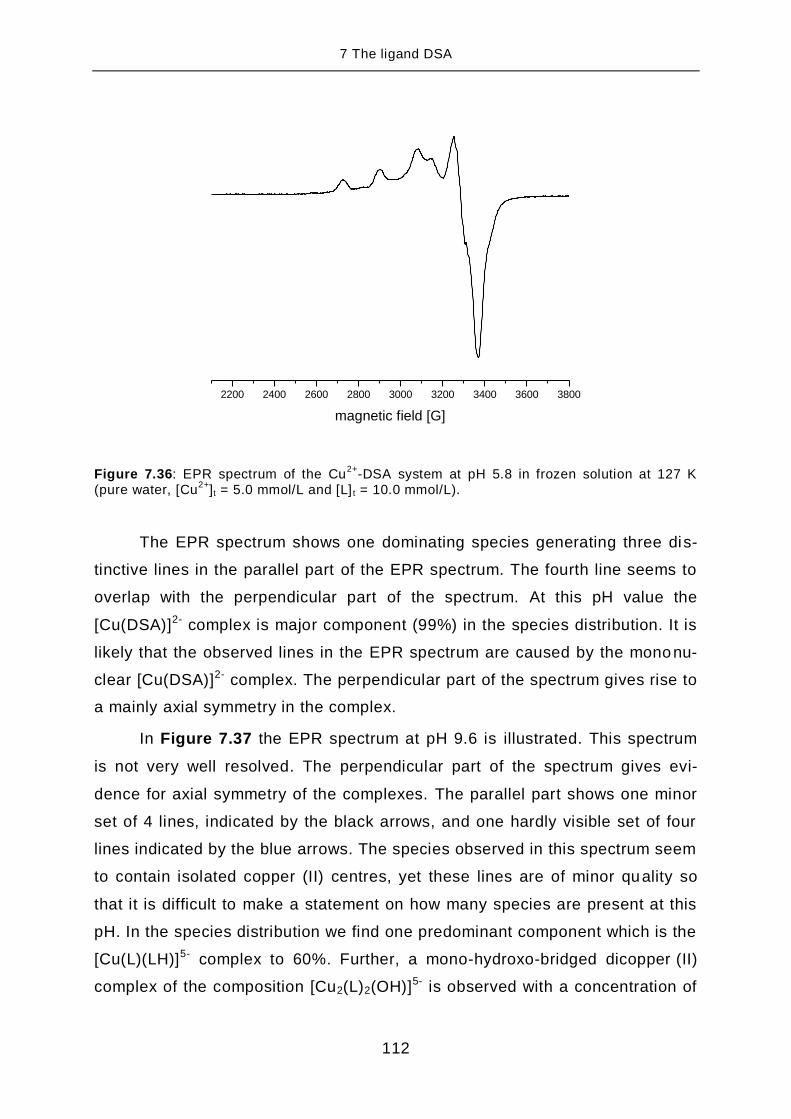
7 The ligand DSA
112
Figure 7.36: EPR spectrum of the Cu2+
-DSA system at pH 5.8 in frozen solution at 127 K (pure water, [Cu
2+]t = 5.0 mmol/L and [L] t = 10.0 mmol/L).
The EPR spectrum shows one dominating species generating three dis-
tinctive lines in the parallel part of the EPR spectrum. The fourth line seems to
overlap with the perpendicular part of the spectrum. At this pH value the
[Cu(DSA)]2- complex is major component (99%) in the species distribution. It is
likely that the observed lines in the EPR spectrum are caused by the mononu-
clear [Cu(DSA)]2- complex. The perpendicular part of the spectrum gives rise to
a mainly axial symmetry in the complex.
In Figure 7.37 the EPR spectrum at pH 9.6 is illustrated. This spectrum
is not very well resolved. The perpendicular part of the spectrum gives evi-
dence for axial symmetry of the complexes. The parallel part shows one minor
set of 4 lines, indicated by the black arrows, and one hardly visible set of four
lines indicated by the blue arrows. The species observed in this spectrum seem
to contain isolated copper (II) centres, yet these lines are of minor quality so
that it is difficult to make a statement on how many species are present at this
pH. In the species distribution we find one predominant component which is the
[Cu(L)(LH)]5- complex to 60%. Further, a mono-hydroxo-bridged dicopper (II)
complex of the composition [Cu2(L)2(OH)]5- is observed with a concentration of
2200 2400 2600 2800 3000 3200 3400 3600 3800
magnetic field [G]

7 The ligand DSA
113
18%, also the [Cu(L)]2- complex is present with 18%. A di-bridged hydroxo di-
nuclear copper (II) complex of the composition [Cu2(L)2(OH)2]6- is not of rele-
vance since it just begins to form at pH 9.6.
Figure 7.37: EPR spectrum of the Cu2+
-DSA system at pH 9.6 in frozen solution at 180 K (pure water, [Cu
2+]t = 5.0 mmol/L and [L] t = 10.0 mmol/L).
If we speculate on the EPR spectrum containing two species with isolat-
ed copper (II) centres we could assign these to the [Cu(L)(LH)] 5- complex as
major species and the [Cu(L)]2- complex as a minor species. According to liter-
ature hydroxo-bridged dinuclear copper (II) complexes can be EPR silent on
account of strong Cu2+-Cu2+ interactions resulting from antiferromagnetic inter-
actions (Lee2005, Kawata1987) [73-74]. Subsequently, the [Cu2(L)2(OH)]5- com-
plex might be silent in the EPR spectrum.
A final EPR spectrum of the Cu2+-DSA system was recorded at pH 10.8.
The spectrum is given in Figure 7.38. There are three lines in the parallel part
of the spectrum. The fourth line seems to overlap with the perpendicular part.
Further, the spectrum indicates only one species as dominating species in so-
lution. EPR parameters for this species were calculated to A II = 166(5) G and
gII = 2.257(5). In addition, the perpendicular part gives evidence for an axial
geometry.
2200 2400 2600 2800 3000 3200 3400 3600 3800
2.
2.2.
1.1.
1.
magnetic field [G]

7 The ligand DSA
114
Figure 7.38: EPR spectrum of the Cu2+
-DSA system at pH 10.8 in frozen solution at 180 K (pure water, [Cu
2+]t = 5.0 mmol/L and [L] t = 10.0 mmol/L).
The species distribution reveals that three complexes coexist in solution
at pH 10.8. The concentration of the [Cu(L)(LH)]5- complex decreased to 30%
while the formation of the [Cu2(L)2(OH)]5- has increased to 35%. The 1:2 com-
plex [Cu(L)2]6- has also been formed to 24%. We assume the EPR signal of the
hydroxo-bridged complex is silent. Still two bis-complexes coexist in solution
but only one set of lines has been identified in the spectrum. In Scheme 7.8 in
section 7.3.1 two coordination geometries are suggested for the [Cu(L)2]6-
complex. Due to the high apparent pKa (10.9) of the 121 complex it has been
assumed that the phenolate group, resulting from the deprotonation of the 121
complex, does not coordinate to the Cu2+ central ion in the 120 complex. As a
consequence, the coordination geometry of the Cu2+ central ion does not
change by deprotonating the 121 complex to the 120 complex. Accordingly, the
EPR spectrum of both the 121 and the 120 complex might not differ. The ob-
servation of only one species in the EPR spectrum at pH 10.8 may be evidence
for the bidentate coordination mode of one ligand DSA in the [Cu(L) 2]6- complex
as suggested in Scheme 7.8.
2200 2400 2600 2800 3000 3200 3400 3600 3800
magnetic field [G]

7 The ligand DSA
115
In summary, we note that most of the EPR spectra of the Cu2+-DSA sys-
tem are not very well resolved, especially in the perpendicular part. As a con-
sequence, it is difficult to determine the Spin Hamiltonian Parameters of the
individual species. In conclusion, the first spectrum at pH 2.7 showed seven
lines which may be assigned to a dimeric copper (II) complex. The half field
signal could be assigned to the forbidden transition Δms = ±2 which would sup-
port this hypothesis. Yet, the lines are not equidistant and another eighth line is
also present in the spectrum. This might be evidence for the generation of two
sets of four lines each assigned to the two main complexes [Cu(L)]2- and
[Cu(LH)]- of DSA in acidic solution found by potentiometric titrations. The other
spectra give rise to only mononuclear isolated copper (II) centres of mostly
more than one species in each of the samples. The spectra should be seen as
fingerprint spectra only indicating the kind of species in solu tion, yet a specific
assignment of the complexes in the species distribution, calculated from stabil-
ity constants of potentiometric titrations, to the observed lines was not possible.

7 The ligand DSA
116
7.3.3 The crystal structures Na3[Cu(DSA)(HCO3)] · 2.5 H2O · 1.5 MeOH
and Na3[Cu(DSA)(HCO3)] · (H2O)25/6 · 3 MeOH
The Cu2+-DSA system forms green complexes in aqueous solution.
Green complexes are also formed in methanol as solvent which is more perti-
nent for crystal growth. Two different coloured single crystals were separated
from a dark green methanol/ethyl acetate solution to which sodium hydroxide
was added as a base. The violet and green small plate shaped prisms were
both passed on to single crystal X-ray analysis. To affirm both the violet and
the green crystals containing copper (II) as central ion microscopic X-ray fluo-
rescence was performed. The spectra revealed only the element copper as
central metal ions present in both crystals.
The crystal structure Na3[Cu(DSA)(HCO3)] · 2.5 H2O · 1.5 MeOH
The structure of the violet coloured crystals Na3[Cu(DSA)(HCO3)] ·
2.5 H2O · 1.5 MeOH is depicted in Figure 7.39. These crystals consist of the
[Cu(DSA)]2- complex which crystallizes in the triclinic space group P with the
following R values: R1 = 5.75% and wR2 = 15.89%. The coordination environ-
ment of the Cu2+ central ion is square planar. In essence, the ligand DSA is
coordinated as the fourfold deprotonated ligand L4- in a tridentate ONO-
coordination mode occupying three coordination sites of the square plane. Fur-
ther, one oxygen atom of a bicarbonate molecule completes the square plane.
The bicarbonate was presumably formed by CO2 from the air in basic solution.
Moreover, three sodium counterions, of which one is disordered, complete the
structure in addition with 2.5 water molecules and 1.5 molecules of methanol.
Interestingly, for every second Cu2+ central ion a water molecule is
placed almost perpendicularly above the centre of the square plane. According-
ly, the water molecule could form the apex of a square pyramid. However, only
every second Cu2+ central ion would be coordinated by a square pyramidal co-
ordination environment. For the other 50% of the Cu2+ centres the water mole-
cule is replaced by a molecule methanol. The coordination of the methanol
molecule would cause a distorted “4+1” square pyramidal geometry.

7 The ligand DSA
117
O1
S1
O2
O3
C35C36
C43
C34
C44
C42
N24
C31
C45
C33
C41C23
C46
N25C32
O5
N22
C21
S2
O32
H2L2
O4
C13C12
C2LM
O6
Cu1C14
O3W
O2LM
C11O11
O3C
O2C
C1CC15C16O1C
a
bc
Figure 7.39: ORTEP-plot of the main [Cu(DSA)(HCO3)]3-
complex of the crystal structure Na3[Cu(DSA)(HCO3)] · 2.5 H2O · 1.5 MeOH. The atomic displacement ellipsoids are drawn at the 50% probability level (C = grey, Cu = violet, N = blue, O = red and S = yellow). CH-hydrogen atoms, solvent molecules and Na
+ counterions are omitted for clarity.
The angles enclosed by the water molecule as apex with the square
plane are O3W – Cu – O11 = 84.92°, O3W – Cu – N22 = 84.15°, O3W – Cu –
O32 = 93.26° and O3W – Cu – O2C = 94.12°. The distance between the water
molecule at the apical position and the Cu2+ central ion is Cu1 – O3W 2.715 Å.
According to the literature, typical examples for Cu-OH2 bond lengths for a
square pyramidal coordination of the Cu2+ central ion by N,O coordinating lig-
ands are 2.141 Å [75] and 2.276 Å [76] or 2.294 Å [77]. The distance in this struc-
ture here is significantly elongated by at least 0.4 Å. Despite the nearly per-
pendicularly centred position of the water molecule, the Cu1 – O3W distance is
too long for a common square pyramidal coordination. However, it is evident
that there are interactions between the water molecule and the copper (II) cen-
tre, due to the nearly perpendicular position of the water molecule.

7 The ligand DSA
118
Further, the distance to the oxygen atom of the methanol molecule is
even longer 3.590 Å and the square pyramid would be strongly distorted. A
square pyramidal Cu2+ coordination geometry with methanol in apical position
is known in the literature though the bond lengths are much shorter, for in-
stance 2.168 Å [78] or 2.275 Å [79] .
As a consequence the coordination environment of the copper (II) central
ion in this structure is considered as square planar. Some selected bond
lengths and angles for the corresponding structure are summarized in
Table 7.18.
Table 7.18: Selected bond lengths and bond angles for the structure Na3[Cu(DSA)(HCO3)] · 2.5 H2O · 1.5 MeOH.
atom bond length [Å] atom bond angle [°]
Cu1 – O32 1.914(3) O32 – Cu1 – O2C 85.54(15)
Cu1 – N22 1.923 (4) O32 – Cu1 – N22 93.86(15)
Cu1 – O11 1.916(4) O11 – Cu1 – N22 91.08(16)
Cu1 – O2C 1.972(4) O11 – Cu1 – O2C 89.46(16)
C1C – O1C 1.236(6) O32 – Cu1 – O11 174.53(14)
C1C – O2C 1.283(6) N22 – Cu1 – O2C 178.10(13)
C1C – O3C 1.514(7)
The bond angles are close to an ideal angle of 90° forming a square pla-
nar coordination environment. The square plane is slightly distorted with a
twisting angle of maximum 3°. The bond lengths of Cu2+ with the ligand DSA
are in the expected range. Of special interest is the coordinating bicarbonate
molecule. The coordination occurs by only one of the oxygen atoms of the bi-
carbonate causing a monodentate coordination mode which is rarely observed
in literature [80-81]. The Cu1 – O2C bond with a length of 1.972 Å is a normal
value for a Cu – O bond. Supporting the monodentate coordination mode are
the too long distances between the Cu2+ ion and the other bicarbonate oxygen

7 The ligand DSA
119
atoms O1C and O3C which are 4.049 Å and 3.251 Å, respectively. Unfortunate-
ly, the hydrogen atom of the bicarbonate molecule could not be refined. A com-
parison of the bond lengths in the bicarbonate molecule shows that two bonds
are very similar with a length of 1.236 Å and 1.283 Å and one is longer with
1.514 Å. We presume this elongated bond is protonated. The proton is also es-
sential for the total charge of the complex since there are only three sodium
ions as counterions.
The fully deprotonated L4- ligand DSA in this structure adopts a rather flat
geometry referring to the central triazole unit with the two phenolate rings. Ac-
cordingly, the angles between the phenolate planes and the triazole unit are
10.7° and 11.6°. The benzene-1,4-disulfonic acid moiety is aligned rather per-
pendicular to the triazole unit with a twisting angle of 81.0°.
All sodium counterions coordinate exclusively with oxygen atoms in their
near coordination environment. Only the Na1 and Na2 counterions adopt de-
fined coordination geometries. Na1 arranges towards five oxygen atoms form-
ing a distorted square pyramidal coordination with O1C, O1LM, O3 and O1 in
the square plane and O4 of a sulfonic acid as apex. However, Na2 adopts a
strongly distorted octahedral geometry with O1W, O32, O3 and O2 in the equa-
torial positions and O2C and O5 in axial positions. The disordered ions Na3
and Na4 are coordinated by 4 oxygen atoms and 5 oxygen atoms, respectively.
Furthermore, the square planar complexes form layers which are gener-
ated by the inversion centres. The space between two layers is occupied by the
alternating water O3W and methanol O2LM molecules forming the nearly
square pyramidal coordination. The layer beneath the complex does not con-
tain any lattice solvent molecules so that the phenolate rings arrange closer to
form some π-stacking interactions with distances of 3.6 Å – 4.4 Å between the
rings.

7 The ligand DSA
120
The crystal structure Na3[Cu(DSA)(HCO3)] · (H2O)25/6 · 3 MeOH
Besides the violet crystals, green plate shaped prisms were also isolated
from the dark green solution in single crystalline form. These green crystals
consist of the [Cu(DSA)]2- complex crystalizing in the monoclinic space group
P21/c. The main complex is depicted in Figure 7.40. The complex adopts a
square planar coordination geometry with the fully deprotonated L4- ligand DSA
coordinating in a tridentate ONO-coordination mode. The fourth position is oc-
cupied by an oxygen atom of a bicarbonate molecule (the hydrogen atom of the
bicarbonate molecule could not be refined).
C35C34
C33 C36
O1
C32
C31
O3
S1
O2
O32
C23 N24
C42 C43
N22
O2C
N25Cu1
C41
C1C
O3C
C44
C21
O1C
C46 C45
O4
C12O11
C13C11
S2
C14C16
O5
O6
C15
a
b
c
Figure 7.40: ORTEP-plot of the main [Cu(DSA)(HCO3)]3-
complex of the crystal structure Na3[Cu(DSA)(HCO3)] · (H2O)25/6 · 3 MeOH. The atomic displacement ellipsoids are drawn at the 50% probability level (C = grey, Cu = green, N = blue, O = red and S = yellow). CH-hydrogen atoms, solvent molecules and Na
+ counterions are omitted for clarity.
The crystal structure comprehends three sodium counterions to compen-
sate the charge of the complex. Additionally, 25/6 water molecules and three
molecules of methanol are enclosed within the crystal lattice which are partially

7 The ligand DSA
121
disordered. These disordered molecules contribute to the higher wR2 value of
23.72%. The R1 value is 7.50%. Further, bond lengths and angles of special
interest are given in Table 7.19.
Table 7.19: Selected bond lengths and bond angles for the structure Na3[Cu(DSA)(HCO3)] · (H2O)25/6 · 3 MeOH.
atom bond length [Å] atom bond angle [°]
Cu1 – O32 1.898(4) O32 – Cu1 – O3C 87.27(15)
Cu1 – N22 1.926(4) O32 – Cu1 – N22 94.08(16)
Cu1 – O11 1.905(4) O11 – Cu1 – N22 90.31(17)
Cu1 – O3C 1.961(4) O11 – Cu1 – O3C 88.75(16)
C1C – O1C 1.246(6) O32 – Cu1 – O11 171.23(17)
C1C – O2C 1.486(9) N22 – Cu1 – O3C 176.79(17)
C1C – O3C 1.281(6)
In both the violet and the green crystals the copper (II) central ion is co-
ordinated square planar with bicarbonate to complete the geometry. In accord-
ance with the violet crystals the bicarbonate molecule coordinates monodentate
in this structure which seems to be an infrequent way of coordination as men-
tioned for the violet crystal structure above. The bond lengths in the bicar-
bonate molecule are similar to those found for the violet crystals. Two bond
lengths in the green crystal structure are shorter 1.246 Å and 1.281 Å and one
is longer with 1.486 Å, which gives rise to this oxygen atom being protonated.
Further, the square plane in this structure is slightly distorted with a twis t-
ing angle of maximum 8°. The bond lengths and angles of both structures are
in good agreement.
By way of comparison the ligand DSA adopts a rather f lat geometry in
both structures. In this structure the twisting angles between the phenolate
planes and the central triazole unit are 5.2° and 13.2°. These differ slightly
from those observed for the violet crystals (10.7° and 11.6°). The benzene-1,4-

7 The ligand DSA
122
disulfonic acid moiety twists against the triazole plane by an angle of 72.4°. In
the violet structure this angle was closer to a perpendicular position (81.0°). In
general, all three sodium counterions are surrounded by oxygen atoms of the
solvent molecules, the sulfonic acids or the ligand DSA.
One difference between the violet and the green crystals is the violet
ones have either a water molecule or a molecule of methanol interacting with
the square plane of the complex. The comparison of the Cu-O distances from
the plane to the apex of a possible square pyramidal coordination mode with
other square pyramidal copper (II) complexes, however showed that the dis-
tance in the violet crystals are too long. Yet, a square pyramidal coordination
environment would explain the difference in colour since a change in the coor-
dination mode would imply a colour change. The violet crystals are somewhere
between a square planar and a square pyramidal coordination. Particularly, the
square pyramidal coordination would be rather special since every second Cu2+
complex has either a water molecule or a molecule of methanol in apical posi-
tion. We presume this might be the cause for the difference in colour.
In conclusion, both crystal structures obtained from the same solution
show a very similar square planar coordination geometry of the [Cu(DSA)] 2+
complex with bicarbonate coordinating monodentate. The main difference be-
tween the crystals is the possible square pyramidal coordination interaction
observed for the violet crystals. It is of special interest that the [Cu(DSA)]2-
complex crystallized from an alkaline solution with a square planar coordination
environment. This coordination mode can be considered as a consequence of
the Jahn-Teller effect. The square planar coordination is an extreme example
of the Jahn-Teller distorted octahedral coordination environment of the Cu 2+
complex. In this coordination the ligand DSA is able to coordinate in the fa-
voured tridentate meridional mode in equatorial position of the distorted octa-
hedron. The axial positions seem to be elongated in such a way that the coor-
dination changes from a distorted octahedron to a square planar geometry. The
[Cu(DSA)]2- is the preferred copper (II) complex which is consistent with the
species distributions of the potentiometric titration studies where it is the domi-
nant species throughout almost the whole titration range.

7 The ligand DSA
123
7.4 Complex formation of DSA with nickel (II)
The transition metal ion nickel (II) might be a potentially essential trace
element though it is not one of the 11 essential trace elements important for
human life [4]. The question whether nickel is of importance to higher organisms
is still to be answered [82].
However, it has been reported that nickel is required by microorganisms
which need nickel-depending enzymes for their existence [83-84]. At least nine
nickel-containing enzymes are known of which some have been structurally
characterised [84]. For instance, some NiFe-hydrogenases have been character-
ised which catalyse the reversible oxidation of hydrogen gas which is a central
reaction in microbial energy metabolism [85]. In addition, subgroups such as
NiFeSe-hydrogenases have been studied in which a selenocysteine ligand co-
ordinates the nickel atom at the active site [86].
On the contrary, nickel is better known for its harmfulness to health. An
allergy to nickel can cause contact dermatitis. This is a major issue since nickel
is present in everyday life for example in drinking water, food, jewellery, but-
tons and much more. Further, it is commonly present in implanted medical de-
vices, dental fillings and prostheses. [87]
Nickel can be toxic and carcinogenic depending on exposure and the
type of nickel compound being exposed to [82]. There are reports on nickel
compounds inducing oxidative stress in the human body [88] for example caus-
ing DNA damage in human lymphocytes [89].
Despite the fact that nickel is harmful to health, it is found in the human
body serum/plasma (0.14 – 0.63 µg/L), in urine (0.9 – 3.2 µg/L) and in the
blood (< 0.05 – 3.8 µg/L) in low concentrations [90]. For this reason, it was of
interest for us to study the complex formation of DSA with Ni2+. Previously,
Ryabukhin has reported the formation of polymeric structures of an 1N-phenyl
derivative of deferasirox with divalent nickel in solution [41]. Indeed, the complex
formation of deferasirox or MSA with Ni2+ has not yet been investigated pre-
sumably due to possible insoluble compounds in solution. However, preliminary
studies with potentiometric titration experiments were carried out with Ni 2+ and
the ligand DSA in pure water by T. Nicolai, under my supervision [58]. As a re-

7 The ligand DSA
124
sult, no precipitation was observed during titration experiments with the Ni2+-
DSA system. Further potentiometric titrations of the Ni2+-DSA system needed
to be performed with a new electrode (Schott IoLine) in three different molar
ratios Ni2+:DSA 1:1, 1:2 and 2:1 to investigate the formation of dimeric species.
The titration conditions are given in Table 7.20.
Table 7.20: Titration experiment conditions of the complexation of Ni2+
with DSA given at
T = 298 K.
Conditions for the Ni2+-DSA titrations
molar ratio of M:L 1:1 1:2 2:1
measuring method potentiometric potentiometric potentiometric
method type continuous continuous continuous
solvent pure water pure water pure water
[M]t 1.00 mmol/L 0.50 mmol/L 2.00 mmol/L
[L]t 1.00 mmol/L 1.00 mmol/L 1.00 mmol/L
titration volume 50.0 mL 50.0 mL 50.0 mL
titrant 0.1 mol/L KOH 0.1 mol/L KOH 0.1 mol/L KOH
supporting electrolyte 0.1 mol/L KCl 0.1 mol/L KCl 0.1 mol/L KCl
electrode Schott IoLine Schott IoLine Schott IoLine
pKW 13.78 13.78 13.78
pH range 2.7 – 11.1 2.7 – 11.2 2.7 – 10.6
volume of data points 50 60 60
time for mixing process 400 s 400 s 400 s
Four titration data sets were used of each of the three molar ratios. Un-
fortunately, we could not find a species model consistent with all titration
curves. The largest deviation was observed for the Ni2+:DSA 2:1 molar ratio.

7 The ligand DSA
125
Therefore, we obtained a major improvement of the fit by omitting the 2:1 ratio
titration curves. Simultaneous evaluation of the 1:1 and 1:2 titrations resulted in
the mean values presented in Table 7.21.
Table 7.21: Mean values of the overall stability constants logβxyz [a]
from potentiometric titra-tions of Ni
2+ with DSA determined by simultaneous evaluation with Hyperquad2008 in pure
water, T = 298 K and I = 0.1 mol/L KCl.
logβ values for the complexation of Ni2+:DSA
four 1:1 titrations four 1:2 titrations
mean values by simultaneous evaluation of 8 titrations [b]
σ [c] 1.807
pH range 2.7 – 11.2
logβ110 11.76(9)
logβ111 18.28(4)
logβ120 17.24(6)
logβ121 27.15(9)
logβ220 26.8(2)
logβ22-1 15.5(1)
[a] For the ligand L logβxyz is defined as: βxyz = [MxLyHz] × [M]
-x × [L]
-y × [H]
-z.
[b] The titrations were evaluated simultaneously with the program Hyperquad2008. The
deviations given in brackets correspond to the threefold standard deviation taken from Hyperquad2008. [c]
The σ value is taken from Hyperquad2008.
The species model comprises two mononuclear complexes [Ni(L)]2- (110
complex) and [Ni(LH)]- (111 complex) and two bis-complexes [Ni(L)2]6- (120
complex) and [Ni(L)(LH)]5- (121 complex). These complexes were also ob-
served in Cu2+-DSA titration experiments. They can adopt a regular octahedral
coordination environment since there is no Jahn-Teller effect in the Ni2+ d8
electronic state. As expected the [Ni(DSA)]2- complex with a stability constant
of logβ110 = 11.76(9) is less stable as the [Cu(DSA)]2- complex with a

7 The ligand DSA
126
logβ110 = 17.93(2). The apparent pKa = 6.52 of the [Ni(LH)] - complex is signifi-
cantly higher than the apparent pKa for the corresponding Cu2+ complex
(pKa = 2.5). The equilibrium constant of the [Ni(DSA)2]6- complex is
logK120 = 5.48 (logK120 = [ML2] / [ML] × [L]) and therefore higher than the value
determined for the corresponding [Cu(DSA)2]6- complex (logK120 = 3.9). This
observation can be attributed to the Jahn-Teller effect which destabilises the
[Cu(DSA)2]6- complex. Whereas, the [Ni(DSA)2]6- complex is not influenced by
the Jahn-Teller effect.
Suggestions for the favoured coordination geometries are given in
Scheme 7.11. The coordination of the [Ni(LH)] - complex is bidentate with one
phenolate group protonated. It can form hydrogen bonding interactions with the
triazole nitrogen atom in position 2. Through deprotonation of the [Ni(LH)]-
complex the ligand coordinates tridentate meridional and the [Ni(L)]2- complex
is formed. The suggested protonation of the [Ni(L)(LH)]5- complex of DSA oc-
curs at one of the hydroxyphenyl rings causing it to coordinate bidentate. The
other ligand in this complex is coordinated tridentate.
Scheme 7.11: Suggested coordination geometries of the complexes [Ni(L)]2-
(110), [Ni(LH)]-
(111), [Ni(L)2]6-
(120) and [Ni(L)(LH)]5-
(121).

7 The ligand DSA
127
The apparent pKa = 9.91 of the 121 complex is rather high, which is simi-
lar to the corresponding apparent deprotonation of the [Cu(L)(LH)]5- complex.
This high apparent pKa value gives evidence for a weak Ni-O bond of the phe-
nolate group in the resulting 120 complex. The bis-complex [Ni(L)2]6- with two
fully deprotonated DSA ligands L4- bound to one Ni2+ central ion might rather
coordinate with one ligand bidentate and one tridentate meridional forming an
octahedral geometry as depicted in Scheme 7.11.
The species model applicable for the simultaneous evaluation of both
molar ratios Ni2+:DSA 1:1 and 1:2 was best with two further complexes
[Ni2(L)2]4- (220 complex) and [Ni2(L)2(OH)]5- (22-1 complex). In contrast to the
copper (II) titrations a [Ni2(L)2(OH)2]6- (22-2) complex was not present in this
evaluation. We note that the single evaluation of each titration with a 1:2 molar
ratio could be evaluated with a [Ni2(L)] (210) species instead of the 220 and
22-1 complexes. Yet the 210 complex could not be evaluated in the single titra-
tions of the 1:1 molar ratio and also not in the simultaneous evaluations of both
molar ratios.
Structure suggestions for the [Ni2(L)2]4- and [Ni2(L)2(OH)]5- complexes are
illustrated in Scheme 7.12.
Scheme 7.12: Molecular structure suggestions for the [Ni 2(DSA)2]4-
(a) and the [Ni2(DSA)2(OH)]
5- (b,c,) complex. Possible coordinating solvent molecules are omitted for clar-
ity.

7 The ligand DSA
128
The most likely coordination of the fully deprotonated ligand DSA in a
220 complex is tridentate meridional to one Ni2+ ion with one phenolate group
functioning as phenoxo-bridge. Two entities of this coordination mode combine
to form the di-phenoxo-bridged dinuclear Ni2+ complex 220 as depicted in
Scheme 7.12 complex a. This type of coordination has been observed for
Schiff base ligands which show a similar O-N-O tridentate coordination forming
di-phenoxo-bridged dinuclear Ni2+ complexes [91-92]. The covalency of the nickel
ion in the [Ni2(DSA)2]4- complex is not certain, yet it is likely that some solvent
molecules could be coordinated as well.
Further, the coordination sphere of the 22-1 complex b (Scheme 7.12) is
most probably not complete. Both Ni2+ ions are each coordinated by one triden-
tate ligand molecule DSA and connected by one hydroxo-bridge. This type of
complex is very rarely found in the literature. Another rare coordination would
be a combination of a phenoxo-bridge and a hydroxo-bridge as shown in
Scheme 7.12 complex c. This would be a new coordination for a Ni2+-DSA
complex as observed for example for a sevenfold coordinating ligand forming a
hydroxo- and phenoxo-bridged dinuclear Ni2+ complex reported by Gultneh [93].
These coordination modes have been observed for 21-1 complexes of at least
hexadentate ligands. This differs from the ligand DSA which coordinates triden-
tate with two ligands forming dinuclear Ni2+ complexes. However, the complex-
es reported in the literature give evidence to the possible geometry of the
[Ni2(DSA)2(OH)]5- complex. Which geometry is favoured in solution is just
speculation since it cannot be determined by potentiometric titrations.
The potentiometric titration curves of the evaluated molar ratios for the
Ni2+-DSA system are illustrated in Figure 7.41. In comparison to the ligand ti-
tration curve the complex titration curves differ after two equivalents have been
added. After the inflection at 2 equivalents a considerable pH decrease is ob-
served. The titration curve carried out with a molar ratio of Ni2+:DSA 1:2 has an
inflection at 2 equivalents and at 3 equivalents. The first inflection indicates
that only the very acidic protons, forming the ligand species LH 22-, are present
in solution prior to pH 4.

7 The ligand DSA
129
Figure 7.41: Potentiometric titration curves of the free ligand DSA and Ni2+
with DSA with the molar ratios 1:2 ([Ni
2+]t = 0.50 mmol/L, [L] t = 1.00 mmol/L) and 1:1 ([Ni
2+]t = 1.00 mmol/L,
[L] t = 1.00 mmol/L) in pure water, T = 298 K and I = 0.1 mol/L KCl. The open squares, circles and triangles represent experimental points and the fit (solid line) was calculated from the equilibrium constants with Hyperquad2008.
The inflection at three equivalents at about pH 7.5 corresponds to the
formation of the [Ni(DSA)]2- and [Ni2(DSA)2]4- complexes. This can be conclud-
ed from the species distribution diagram in Figure 7.42. The 110 and 220 com-
plexes reach their highest concentrations 48% and 43% at about pH 7.5. At the
beginning of the titration 100% Ni2+ is present and complex formation has not
yet occurred.
The [Ni(LH)]- complex begins to form at about pH 3.5 and reaches its
maximum concentration (56%) at pH 5.9. In alkaline solution the bis-complexes
[Ni(L)(LH)]5- and [Ni(L)2]6- are formed with a maximum of 41% at pH 9.4 and
82% at pH 11.2, respectively. The dinuclear [Ni2(L)2(OH)]5- complex appears in
the species distribution with a 1:2 molar ration in low abundance as a minor
species.

7 The ligand DSA
130
Figure 7.42: Species distribution diagram as a function of pH for Ni2+
with the ligand DSA. Calculated for the continuous potentiometric titration performed with a 1:2 molar ratio ([Ni
2+]t = 0.50 mmol/L, [L]t = 1.00 mmol/L, pure water, T = 298 K and I = 0.1 mol/L KCl) from
pH 2.7 to 11.2. The species concentration were calculated from the equilibrium constants listed in Table 7.21 (mean values from simultaneous evaluation of 8 titrations) with the pro-gram Hyss2006.
The species distribution diagram for the Ni2+-DSA system with a 1:1 mo-
lar ratio in Figure 7.43 differs from the 1:2 molar ratio diagram. Conspicuous is
that no bis-complexes appear in this diagram. They are clearly not favoured by
the 1:1 molar ratio. Accordingly, at the beginning of the titration the Ni2+ ion is
again present to 100%. In the titration curve in Figure 7.41 for the 1:1 molar
ratio an inflection appears at 2 equivalents indicating that no complex has been
formed at this pH. This is in accordance with the species distribution diagram.
The [Ni(LH)]2- complex reaches its highest concentration 46% at pH 5.9.
Further, the complexes [Ni(L)]2- and [Ni2(L)2]4- start to form at about pH 5 and
are present until pH 11.2. Due to the absence of bis-complexes the dinuclear
[Ni2(L)2]4- complex is the predominant complex with a maximum concentration
of 60% in the titration range from pH 7 to 11.2.

7 The ligand DSA
131
Figure 7.43: Species distribution diagram as a function of pH for Ni2+
with the ligand DSA. Calculated for the continuous potentiometric titration performed with a 1:1 molar ratio ([Ni
2+]t = 1.00 mmol/L, [L]t = 1.00 mmol/L, pure water, T = 298 K and I = 0.1 mol/L KCl) from
pH 2.7 to 11.2. The species concentration were calculated from the equilibrium constants listed in Table 7.21 (mean values from simultaneous evaluation of 8 titrations) with the pro-gram Hyss2006.
The [Ni(L)]2- complex coexists in the same titration range with a maxi-
mum concentration of 40%. Moreover the inflection at four equivalents reveals
the maximum formation of the two complexes [Ni(L)]2- and [Ni2(L)2]4-. In con-
trast to the species distribution diagram of the Ni2+:DSA 1:2 molar ratio the
[Ni2(L)2(OH)]5- complex is not a minor species and is formed to 30% at pH 11.2.
The complex formation of Ni2+ with DSA has been investigated by poten-
tiometric titrations with the molar ratios 1:1 and 1:2. A model used to evaluate
both molar ratios comprehends a 220 and 22-1 complex. These complexes are
dinuclear nickel (II) complexes with presumably either phenoxo- and/or hy-
droxo-bridges. All complexes during the evaluated titration experiments stayed
in solution. We could not find any evidence for polymeric structures as reported
by Ryabukhin. However, we cannot exclude the possible existence of polymeric
structures at different experimental conditions.

7 The ligand DSA
132
7.5 Complex formation of DSA with zinc (II)
Zinc (II) is one of the 11 essential trace elements vital for humans. It is of
great importance due to its role as cofactor for more than 300 enzymes [94-96].
A healthy adult has about 2 – 3 g of zinc in the body. High concentrations
of zinc are found in the pancreas where insulin is stored, in the iris and retina
in the eye, as well as in the liver, lungs and teeth. Further, zinc is part of DNA
binding proteins such as zinc finger proteins that coordinate zinc with the help
of cysteine and histidine residues for example the steroid hormone receptor
superfamily. [4]
Zinc is incorporated in the intestine by an unknown mechanism. Re-
sorbed zinc is bound to serum proteins such as albumin which represents
about 22% of the zinc in the blood. The other 75% are bound to the erythro-
cytes and 3% to leukocytes. The daily uptake of zinc is 10 – 15 mg. In contrast
to iron there is an active mechanism for excreting zinc through the intestine . [4]
The investigations of zinc enzymes in the past were hampered by the
poor spectroscopic properties of Zn2+. As a result, the design of ligands as
functional mimics and the investigation of their Zn2+ complexes is of great in-
terest as they are useful synthetic analogues that imitate the active sites of en-
zymes which are difficult to study. [97-98]
As a consequence of the obvious importance of Zn2+ for the human body,
we investigated the complex formation of DSA with zinc (II) in aqueous solu-
tion. Former studies of the stability constants of zinc (II) with deferasirox and
MSA were hampered by precipitation during potentiometric titration exper i-
ments. U. Heinz carried out competitive titration experiments to determine the
stability constants of the Zn2+-deferasirox system in water/DMSO solution with
nitrilotriacetic acid as competitive ligand to keep all complexes in solution [37].
Preliminary studies with potentiometric titrations of the Zn2+-DSA system
carried out by F. Teucke [49], under my supervision, were hampered due to diff i-
culties with the applied electrodes. Titration experiments were performed with a
new electrode (Schott IoLine) to further investigate the Zn 2+-DSA system. Dur-
ing titration experiments with a molar ratio Zn2+:DSA of 1:1 and 1:2 no precipi-
tation occurred. Yet, during titrations with a 2:1 molar ratiogreyish-white precip-

7 The ligand DSA
133
itate was observed starting at pH 7 to alkaline solution. All three molar ratios
were applicable for simultaneous evaluations. However, only the pH region of
the 2:1 titrations before precipitation occurred was used for evaluation. The ti-
tration conditions for all molar ratios are listed in Table 7.22.
Table 7.22: Titration experiment conditions of the complexation of Zn2+
with DSA given at
T = 298 K.
Conditions for the Zn2+-DSA titrations
molar ratio of M:L 1:1 1:2 2:1
measuring method potentiometric potentiometric potentiometric
method type continuous continuous continuous
solvent pure water pure water pure water
[M]t 0.90 mmol/L 0.48 mmol/L 2.00 mmol/L
[L]t 1.00 mmol/L 1.00 mmol/L 1.00 mmol/L
titration volume 50.0 mL 50.0 mL 50.0 mL
titrant 0.1 mol/L KOH 0.1 mol/L KOH 0.1 mol/L KOH
supporting electrolyte 0.1 mol/L KCl 0.1 mol/L KCl 0.1 mol/L KCl
electrode Schott IoLine Schott IoLine Schott IoLine
pKW 13.78 13.78 13.78
pH range 2.7 – 11.0 2.7 – 11.1 2.7 – 6.8
volume of data points 70 70 46
time for mixing process 150 s 150 s 150 s
Four titration experiments of each molar ratio Zn2+:DSA 1:1, 1:2 and 2:1
were applied for simultaneous evaluation with the program Hyperquad2008.
The mean values of this evaluation are summarized in Table 7.23. A proper
species model with a very good σ value of 1.207 was found to fit all molar rati-

7 The ligand DSA
134
os. The model comprises the mononuclear complexes [Zn(L)]2- (110) and
[Zn(LH)]- (111) as well as the two bis-complexes [Zn(L)2]6- (120) and
[Zn(L)(LH)]5- (121). These complexes have also been obtained for the ligand
DSA with the divalent metal ions Cu2+ and Ni2+.
Table 7.23: Mean values of the overall stabili ty constants logβxyz [a]
from potentiometric titra-tions of Zn
2+ with DSA determined by simultaneous evaluation with Hyperquad2008 in pure
water, T = 298 K and I = 0.1 mol/L KCl.
logβ values for the complexation of Zn2+:DSA
four 1:1 titrations four 1:2 titrations four 2:1 titrations
pH 2.7 – 11.0 pH 2.7 – 11.1 pH 2.7 – 6.8
mean values by simultaneous evaluation of 12 titrations [b]
σ [c] 1.207
logβ110 11.00(1)
logβ111 16.36(8)
logβ120 15.37(6)
logβ121 25.90(6)
logβ22-1 14.47(6)
logβ22-2 3.61(4)
[a] For the ligand L logβxyz is defined as: βxyz = [MxLyHz] × [M]
-x × [L]
-y × [H]
-z.
[b] The titrations were evaluated simultaneously with the program Hyperquad2008. The
deviations given in brackets correspond to the threefold standard deviation taken from Hyperquad2008. [c]
The σ value is taken from Hyperquad2008.
An overall stability constant of logβ110 = 11.00(1) was determined for the
mononuclear complex with Zn2+ and the fully deprotonated ligand DSA (cp.
[Ni(DSA)]2-, logβ110 = 11.76(9) ). The apparent deprotonation constant for the
[Zn(LH)]- complex is pKa = 5.36 and slightly more acidic than the pKa deter-
mined for the corresponding [Ni(LH)] - complex (pKa = 6.52). Further, the equi-

7 The ligand DSA
135
librium constant for the [Zn(DSA)2]6- complex was determined to logK120 = 4.37
(logK120 = [ML2] / [ML] × [L]) . The value for the corresponding [Ni(DSA)2]6-
complex (logK120 = 5.48) was somewhat higher. This is not surprising since Ni2+
complexes are stabilized by the ligand-field stabilization energy. These octahe-
dral zinc (II) complexes experience no stabilisation by the ligand-field theory
since Zn2+ is one of the divalent transition metal ions with a d10 electronic con-
figuration.
The apparent pKa value found for the [Zn(L)(LH)]5- complex is
pKa = 10.53 which is somewhat higher than for the [Ni(L)(LH)]5- complex
(pKa = 9.91) and slightly lower than for the [Cu(L)(LH)]5- complex (pKa = 10.9).
This apparent pKa value for the deprotonation of the 121 complex of Zn2+ im-
plies a rather weak Zn2+-O bond in the 120 complex. Therefore the bidentate
coordination mode of one of the ligands of the [Zn(L)2]6- complex is assumingly
more favourable, in accordance with the corresponding Cu2+ and Ni2+ complex
(Scheme 7.11). The coordination mode for the other three complexes should
be very similar to the Ni2+ complexes of DSA, depicted in Scheme 7.11. The
[Zn(DSA)]2- complex adopts the favoured tridentate meridional coordination
mode while the protonated [Zn(LH)] - complex coordinates bidentate with the
hydroxyphenyl group twisted towards the 1,2,4-triazole nitrogen atom in posi-
tion 2 of the ring. The [Zn(L)LH)]5- complex has one ligand coordinating triden-
tate and one ligand molecule bidentate.
Additionally, the species model employed to evaluate all titrations simul-
taneously contains two dinuclear complexes of the composition
[Zn2(DSA)2(OH)]5- (22-1 complex) and [Zn2(DSA)2(OH)2]6- (22-2 complex). The-
se complexes have also been determined for the Cu2+-DSA system. The most
likely coordination geometry is by hydroxo-bridges between the two zinc (II)
ions as suggested for copper (II) in Scheme 7.9. The dinuclear mono-hydroxo-
bridged complex with two ligands and two Zn2+ metal ions forming a complex is
a common coordination in the literature. For example the tridentate nitrogen
coordinating ligands dpt (bis(3-aminopropyl) amine) [99] and tempt (2,4,6-tris[4-
(imidazole-1-ylmethyl)phenyl]-1,3,5-trazine) [100] form Zn2L2(OH) complexes.
However, also a derivative of the mixed tetradentate N,N,O,O-coordinating lig-
and salphen (N,N’-bis(salicylidene)-1,2-phenylenediamine) [101] is known to

7 The ligand DSA
136
form mono-hydroxo-bridged dinuclear complexes of the composition
Zn2L2(OH).
A similar coordination mode as suggested for the di-bridged dinuclear
hydroxo complex [Zn2(DSA)2(OH)2]6- (cp. Scheme 7.9) has been discussed in
the literature. For instance, a complex of the tridentate nitrogen coordinating
ligand 1,4,7-trimethyl-1,4,7-triazacylononane with Zn2+ with the composition
Zn2L2(OH)2 has been reported [102]. Further, also a bidentate [103] and a tetra-
dentate [104] nitrogen coordinating ligands are known to form this type of
Zn2L2(OH)2 complex. The synthesis of hydroxo-bridged Zn2+ complexes with
specially designed ligands has gained importance particularly because these
complexes are used as model components for the study of the active site of
Zn2+ containing enzymes [102]. Consequently, the 22-1 and 22-2 complexes of
the ligand DSA with Zn2+ are very reasonable complexes.
The titration curves of the Zn2+-DSA system for all three molar ratios are
depicted in Figure 7.44 in comparison to the pKa titration curve of the ligand.
Figure 7.44: Potentiometric titration curves of the free ligand DSA and Zn2+
with DSA with the molar ratios 1:2 ([Zn
2+]t = 0.48 mmol/L, [L] t = 1.00 mmol/L), 1:1 ([Zn
2+]t = 0.90 mmol/L,
[L] t = 1.00 mmol/L) and 2:1 ([Zn2+
]t = 2.00 mmol/L, [L] t = 1.00 mmol/L) in pure water, T = 298 K and I = 0.1 mol/L KCl. The open squares, circles and triangles represent experi-mental points and the fit (solid line) was calculated from the equilibrium constants with Hyper-quad2008.
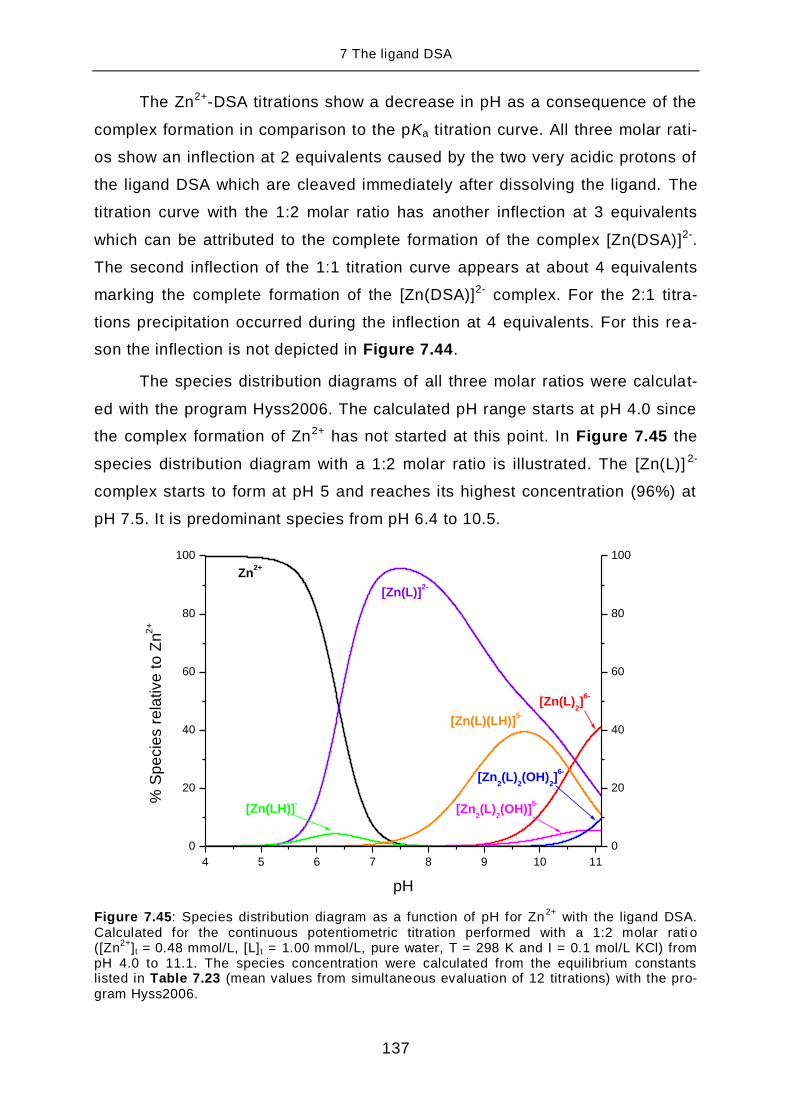
7 The ligand DSA
137
The Zn2+-DSA titrations show a decrease in pH as a consequence of the
complex formation in comparison to the pKa titration curve. All three molar rati-
os show an inflection at 2 equivalents caused by the two very acidic protons of
the ligand DSA which are cleaved immediately after dissolving the ligand. The
titration curve with the 1:2 molar ratio has another inflection at 3 equivalents
which can be attributed to the complete formation of the complex [Zn(DSA)]2-.
The second inflection of the 1:1 titration curve appears at about 4 equivalents
marking the complete formation of the [Zn(DSA)]2- complex. For the 2:1 titra-
tions precipitation occurred during the inflection at 4 equivalents. For this rea-
son the inflection is not depicted in Figure 7.44.
The species distribution diagrams of all three molar ratios were calculat-
ed with the program Hyss2006. The calculated pH range starts at pH 4.0 since
the complex formation of Zn2+ has not started at this point. In Figure 7.45 the
species distribution diagram with a 1:2 molar ratio is illustrated. The [Zn(L)] 2-
complex starts to form at pH 5 and reaches its highest concentration (96%) at
pH 7.5. It is predominant species from pH 6.4 to 10.5.
Figure 7.45: Species distribution diagram as a function of pH for Zn2+
with the ligand DSA. Calculated for the continuous potentiometric titration performed with a 1:2 molar rati o ([Zn
2+]t = 0.48 mmol/L, [L]t = 1.00 mmol/L, pure water, T = 298 K and I = 0.1 mol/L KCl) from
pH 4.0 to 11.1. The species concentration were calculated from the equilibrium constants listed in Table 7.23 (mean values from simultaneous evaluation of 12 titrations) with the pro-gram Hyss2006.
4 5 6 7 8 9 10 11
0
20
40
60
80
100
0
20
40
60
80
100
[Zn2(L)
2(OH)
2]
6-
[Zn2(L)
2(OH)]
5-
[Zn(L)2]
6-
[Zn(L)(LH)]5-
[Zn(LH)]-
[Zn(L)]2-
Zn2+
% S
pe
cie
s r
ela
tive
to
Zn
2+
pH

7 The ligand DSA
138
The [Zn(LH)]- complex is a minor species which is present to a maximum
content of 4.5% at pH 6.3. The bis-complex [Zn(L)(LH)]5- starts to form at about
pH 7 and reaches its highest concentration 39% at pH 9.7. At the end of the
titration this complex is still present with 11%. The formation of the [Zn(L) 2]6-
complex starts at pH > 9 and reaches its highest concentration (41%) at the
end of the titration. Moreover, the hydroxo-bridged dinuclear complexes
[Zn2(L)2(OH)]5- (22-1) and [Zn2(L)2(OH)2]6- (22-2) are present only in strong al-
kaline solution. The formation of the 22-1 complex starts at pH > 9 while the
22-2 complex forms at pH > 10. At pH 11.1 the 22-1 complex reaches a con-
centration of 9% and the 22-2 complex of 6%.
The species distribution diagram of the 1:1 molar ratio is presented in
Figure 7.46.
Figure 7.46: Species distribution diagram as a function of pH for Zn2+
with the ligand DSA. Calculated for the continuous potentiometric titration performed with a 1:1 molar ratio ([Zn
2+]t = 0.90 mmol/L, [L]t = 1.00 mmol/L, pure water, T = 298 K and I = 0.1 mol/L KCl) from
pH 4.0 to 11.0. The species concentration were calculated from the equilibrium constants listed in Table 7.23 (mean values from simultaneous evaluation of 12 titrations) with the pr o-gram Hyss2006.
4 5 6 7 8 9 10 11
0
20
40
60
80
100
0
20
40
60
80
100
[Zn2(L)
2(OH)
2]6-
[Zn2(L)
2(OH)]
5-
[Zn(LH)]-
[Zn(L)]2-
Zn2+
% S
pe
cie
s r
ela
tive
to
Zn
2+
pH

7 The ligand DSA
139
In accordance to the 1:2 molar ratio diagram the [Zn(LH)] - complex is a
minor species (4% at pH 6.3) and the [Zn(L)]2- complex is present throughout
almost the whole titration range from pH 5 to 11.1. The 110 complex reaches a
maximum concentration of 97% at pH 8.3 as predominant species.
A significant difference to the diagram of the 1:2 molar ratio is that the
bis-complexes [Zn(L)(LH)]5- and [Zn(L)2]6- are not present. Therefore, the hy-
droxo-bridged dinuclear complexes have taken their place forming at pH > 8
[Zn2(L)2(OH)]5- and pH > 9.5 [Zn2(L)2(OH)2]6-. The mono-hydroxo-bridged
[Zn2(L)2(OH)]5- complex reaches a maximum concentration (38%) at pH 10.6
and has a concentration of 31% at the end of the titration. The [Zn 2(L)2(OH)2]6-
complex reaches its highest concentration 44% at pH 11.1.
Figure 7.47 shows the species distribution diagram of the 2:1 molar ratio
titrations of the Zn2+-DSA system.
Figure 7.47: Species distribution diagram as a function of pH for Zn2+
with the ligand DSA. Calculated for the continuous potentiometric titration performed with a 2:1 molar ratio ([Zn
2+]t = 2.00 mmol/L, [L]t = 1.00 mmol/L, pure water, T = 298 K and I = 0.1 mol/L KCl) from
pH 4.0 to 6.8. The species concentration were calculated from the equilibrium constants listed in Table 7.23 (mean values from simultaneous evaluation of 12 titrations) with the program Hyss2006.
4.0 4.5 5.0 5.5 6.0 6.5
0
20
40
60
80
100
0
20
40
60
80
100
[Zn(LH)]-
[Zn(L)]2-
Zn2+
% S
pe
zie
s r
ela
tive
to
Zn
2+
pH

7 The ligand DSA
140
The pH range is only displayed to pH 6.8 due to precipitation occurring at
higher pH. Hence, only the two mononuclear species are present. The [Zn(LH)]-
complex is still minor species with a maximum concentration of 3% at pH 6.2.
The [Zn(DSA)]2- complex appears at about pH 5 and reaches its highest con-
centration (44%) at pH 6.8.
The best fit for the evaluation of the Zn2+-DSA system was achieved with
the species model in Table 7.23. The species model was suitable for the simul-
taneous evaluation of all titrations of the three molar ratios Zn2+:DSA 1:1, 1:2
and 2:1 with a very good σ value of 1.207. It needs to be noted that a
[Zn2(L)2]4- (220) complex could be added to the model, yet this complex ap-
peared only as a minor species with less than 3% concentration in the 1:2 spe-
cies distribution and < 1% for the 1:1 and 2:1 molar ratios.
The question accompanied by this study is always whether polymeric or
dimeric complexes of the composition [Zn2(L)] (210 complex) are present in
solutions with divalent transition metal ions. The simultaneous evaluation of the
three molar ratio titrations could not be evaluated with a 210 complex. Howev-
er, we note that only the titrations with 1:2 molar ratio could be evaluated with
this type of complex, when the titrations were evaluated separately. In addition,
the [Zn(LH)]- complex needed to be excluded to be able to add the 210 com-
plex to the model. Taken together, we could not confirm the existence of any
polymeric structures in our titration experiments. This does not mean that di-
meric or polymeric species do not exist under these or different conditions.
In conclusion, we suggest the presented species model with the two di-
nuclear [Zn2(L)2(OH)]5- (22-1) and [Zn2(L)2(OH)2]6- (22-2) complexes is the most
likely for the complexation of Zn2+ with DSA. The hydroxo-bridged coordination
of Zn2+-ligand complexes is of importance in mimicking the active site of metal-
loenzymes [105-106]. Consequently, the common appearance of hydroxo-bridged
complexes in nature confirms our suggested model. However, these complexes
are only present in alkaline solution. At physiological pH 7.4 the [Zn(DSA)]-
complex is predominant species (1:2 molar ratio 95%, 1:1 molar ratio 91%) in
solution.

7 The ligand DSA
141
7.6 Complex formation of DSA with cadmium (II)
Cadmium (II) is a group 12 element like zinc (II). We might expect cadmi-
um (II) is also a biological relevant transition metal ion, yet the toxicity and car-
cinogenicity are regarded as main causes by exposure to cadmium. It is evi-
dent that cadmium can cause tumours in the lung and kidney. [107]
Uptake of cadmium is contributed to environmental pollution. A reason for
the toxicity of cadmium is its interaction with the metabolism of three essential
trace elements: calcium, zinc and iron. The main interaction with calcium is in
the kidney and in bones resulting in the decrease in bone density, multiple
bone fractures and pain as observed for osteoporosis [108]. The latter symptoms
have been reported as the Itai-itai disease in Japan by mainly middle aged and
elderly women in the late 1940’s living in the rural Jinzu basin [109]. The basin
was polluted by cadmium waste from a zinc mine contaminating the rice fields
which was the main source of nutrition.
In addition, the interference with the zinc metabolism is attributed to the
binding of cadmium to metallothionein, a low-molecular-weight protein that
binds zinc and copper. [4, 108]
Despite the toxic impact of cadmium, the substitution of zinc in proteins
and enzymes by cadmium resulted in a new opportunity for research to investi-
gate the spectroscopic inactive zinc complex sites in these proteins by for ex-
ample 113Cd-NMR and 111Cd-PAC (perturbed angular correlation of γ-rays) [110].
Surprisingly, the discovery of the first cadmium enzyme, in marine diatoms, has
been reported [111].
It has been reported that iron deficiency increases cadmium absorption
from the gastrointestinal tract, yet the mechanism for this relationship is not
known [108]. However, a study by Saljooghi has been published 2010 concern-
ing the administration of deferasirox to cadmium loaded Wistar rats [112]. The
results of the study seem to show that “iron concentration after administration
of cadmium was significantly decreased”. The iron chelating ligand deferasirox
seems to have reduced serum cadmium levels and led to a normal iron level.
As a consequence, Sal jooghi states the “use of deferasirox as a chelator is a
potential treatment for complication of cadmium intoxication”.
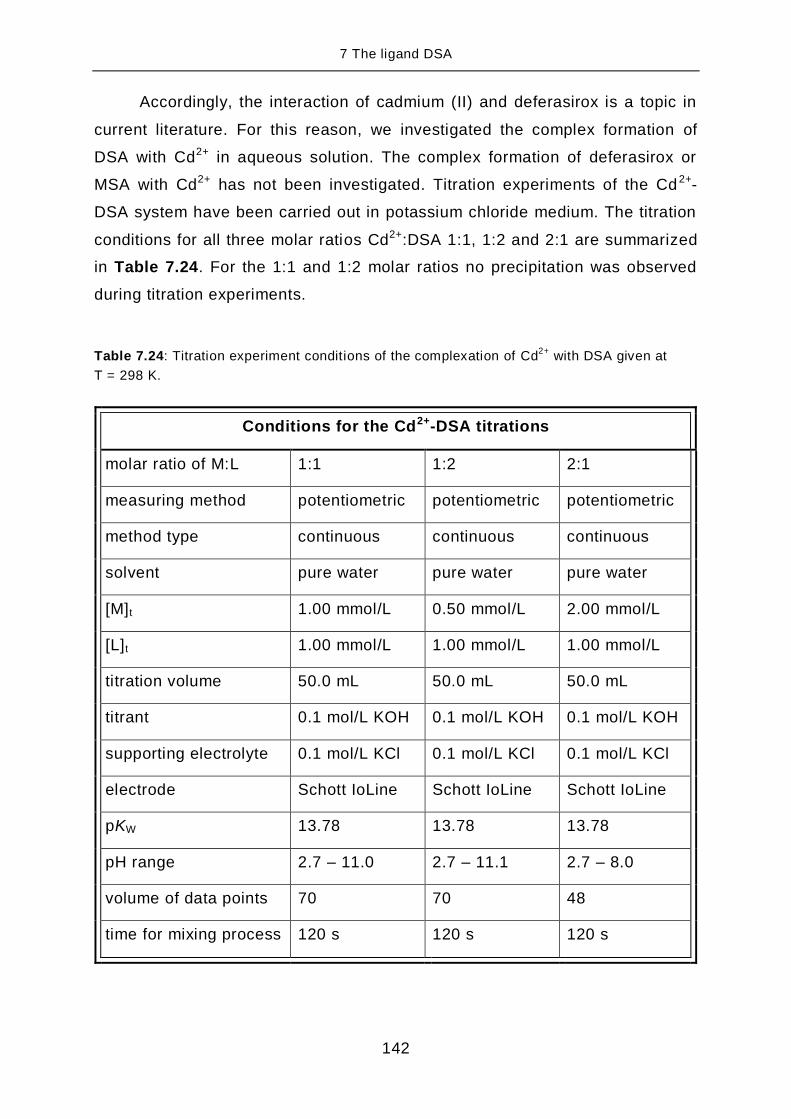
7 The ligand DSA
142
Accordingly, the interaction of cadmium (II) and deferasirox is a topic in
current literature. For this reason, we investigated the complex formation of
DSA with Cd2+ in aqueous solution. The complex formation of deferasirox or
MSA with Cd2+ has not been investigated. Titration experiments of the Cd 2+-
DSA system have been carried out in potassium chloride medium. The titration
conditions for all three molar ratios Cd2+:DSA 1:1, 1:2 and 2:1 are summarized
in Table 7.24. For the 1:1 and 1:2 molar ratios no precipitation was observed
during titration experiments.
Table 7.24: Titration experiment conditions of the complexation of Cd2+
with DSA given at
T = 298 K.
Conditions for the Cd2+-DSA titrations
molar ratio of M:L 1:1 1:2 2:1
measuring method potentiometric potentiometric potentiometric
method type continuous continuous continuous
solvent pure water pure water pure water
[M]t 1.00 mmol/L 0.50 mmol/L 2.00 mmol/L
[L]t 1.00 mmol/L 1.00 mmol/L 1.00 mmol/L
titration volume 50.0 mL 50.0 mL 50.0 mL
titrant 0.1 mol/L KOH 0.1 mol/L KOH 0.1 mol/L KOH
supporting electrolyte 0.1 mol/L KCl 0.1 mol/L KCl 0.1 mol/L KCl
electrode Schott IoLine Schott IoLine Schott IoLine
pKW 13.78 13.78 13.78
pH range 2.7 – 11.0 2.7 – 11.1 2.7 – 8.0
volume of data points 70 70 48
time for mixing process 120 s 120 s 120 s

7 The ligand DSA
143
However, the titrations with a Cd2+:DSA 2:1 molar ratio showed a grey-
ish-white precipitation above pH 8.5. As a consequence, only the pH range
2.7 < pH < 8.0 was employed for evaluation.
To elucidate the complex behaviour of deferasirox related ligands like
DSA with Cd2+ different molar ratios were applied to find a species model com-
patible with all titrations. Four titrations of all three molar ratios were evaluated
simultaneously with the program Hyperquad2008. The mean values for the
complexes found are given in Table 7.25.
Table 7.25: Mean values of the overall stability constants logβxyz [a]
from potentiometric titra-tions of Cd
2+ with DSA determined by simultaneous evaluation with Hyperquad2008 in pure
water, T = 298 K and I = 0.1 mol/L KCl.
logβ values for the complexation of Cd2+:DSA
four 1:1 titrations four 1:2 titrations four 2:1 titrations
pH 2.7 – 11.0 pH 2.7 – 11.1 pH 2.7 – 8.0
mean values by simultaneous evaluation of 12 titrations [b]
σ [c] 1.035
logβ110 7.87(1)
logβ111 14.78(6)
logβ120 12.24(3)
logβ121 22.16(9)
logβ22-1 7.1(1)
logβ22-2 -3.65(4)
[a] For the ligand L logβxyz is defined as: βxyz = [MxLyHz] × [M]
-x × [L]
-y × [H]
-z.
[b] The titrations were evaluated simultaneously with the program Hyperquad2008. The
deviations given in brackets correspond to the threefold standard deviation taken from Hyperquad2008. [c]
The σ value is taken from Hyperquad2008.

7 The ligand DSA
144
The titrations were carried out in a potassium chloride medium with the
concentration I = 0.1 mol/L KCl. We need to note that the Cd2+ ion has a possi-
bly stronger tendency to form chlorocomplexes than some of the other metal
ions. Especially the [CdCl]+ complex with a formation constants of
logK110 = 1.52(7) (T = 298 K, I = 0.1 mol/L) [55] could take influence on the
Cd2+-DSA system resulting from the average 100-fold excess of the chloride
ion caused by the KCl supporting electrolyte. However, the formation of possi-
ble mixed DSA and chlorocomplexes was not taken into account. The determi-
nation of the stability constants of the Cd2+-DSA system are therefore condi-
tional stability constants even more dependent on the chloride medium. This
should be kept in mind while comparing the Cd2+-DSA system to other metal
ion DSA systems.
Nevertheless, the model calculated for the Cd2+-DSA system is in ac-
cordance with the model found for the Zn2+-DSA system. Two mono complexes
are present with a stability constant of logβ110 = 7.87(1) for the [Cd(L)]2- (110)
complex and logβ111 = 14.78(6) for the protonated complex [Cd(LH)] - (111). The
apparent pKa value for the deprotonation is 6.91. Further, two bis-complexes
were determined a [Cd(L)2]6- (120) and a [Cd(L)(LH)]5- (121) complex. The
[Cd(L)2]6- complex has an overall stability constant of logβ120 = 12.24(3) and a
logK120 = 4.37 (logK120 = [ML2] / [ML] × [L]). The apparent deprotonation of the
[Cd(L)(LH)]5- complex occurs at the hydroxyphenyl group and results in an ap-
parent pKa value of 9.92. This value implicates a rather weak Cd2+-O bond of
the 120 complex which might result in a bidentate coordination mode for one
ligand. The principle coordination geometry of these four Cd2+ complexes is in
accordance with those described for the Ni2+-DSA system in Scheme 7.11.
To complete the species model for all three molar ratio titrations
Cd2+:DSA 1:1, 1:2 and 2:1 the dinuclear complexes [Cd2(L)2(OH)]5- (22-1) and
[Cd2(L)2(OH)2]6- (22-2) were included. The calculated fit improved from a value
σ > 3 to σ = 1.035. These two complexes concur with those found for the Zn2+-
DSA model. The hydroxo-bridged coordination geometry as described for the
corresponding Cu2+-DSA complexes in Scheme 7.9 is suggested. The overall
stability constants determined for the [Cd2(L)2(OH)]5- complex is
logβ22-1 = 7.1(1) and for the [Cd2(L)2(OH)2]6- complex logβ22-2 = -3.65(4). The

7 The ligand DSA
145
mono-hydroxo-bridged complex is not common in literature, yet the di-bridged
hydroxo complex is found, however for ligands coordinating with nitrogen at-
oms and sulphur atoms as described by Allred [113-114]. In these complexes a
Cd2L2(OH)2 moiety with two hydroxo bridges between the Cd2+ ions as we pro-
posed is reported.
The titration curves of all three molar ratios are plotted with the pKa titra-
tion curve of DSA in Figure 7.48. The inflection at two equivalents can be at-
tributed to the two strong acidic protons of the ligand DSA. In the titration curve
with a 2:1 molar ratio an inflection appears at three equivalents which can be
assigned to the complete formation of the [Cd(L)]2- complex. Accordingly, the
inflection of the 1:1 molar ratio titration at 4 equivalents is also assigned to the
maximum formation of the [Cd(L)]2- complex. Due to precipitation above pH 8.5
no further inflection appears in the 2:1 molar ratio titration curve.
Figure 7.48: Potentiometric titration curves of the free ligand DSA and Cd2+
with DSA with the molar ratios 1:2 ([Cd
2+]t = 0.50 mmol/L, [L] t = 1.00 mmol/L), 1:1 ([Cd
2+]t = 1.00 mmol/L,
[L] t = 1.00 mmol/L) and 2:1 ([Cd2+
]t = 2.00 mmol/L, [L]t = 1.00 mmol/L) in pure water, T = 298 K and I = 0.1 mol/L KCl. The open squares, circles and triangles represent experi-mental points and the fit (solid line) was calculated from the equilibrium constants with Hyper-quad2008.

7 The ligand DSA
146
The species distribution diagram of the 1:2 molar ratio titrations is de-
picted in Figure 7.49. Formation of the [Cd(L)]2- complex begins at about pH 7
and the complex reaches a maximum concentration (86%) at pH 8.8. The
[Cd(L)]2- complex is predominant species in the pH range 8.0 < pH < 10.5. At
the end of the titration at pH 11 the complex is still present with 34%. The pro-
tonated [Cd(LH)]- complex only appears between pH 7 and 9 with a maximum
concentration of 4%. It is a minor species of little relevance. The protonated
bis-complex [Cd(L)(LH)]5- is present from pH 8 to 11 with a highest concentra-
tion (17%) at pH 9.7. The bis-complex [Cd(L)2]6- begins to form at pH 9 its con-
centration rises with increase of pH to a maximum concentration of 53% at the
end of the titration.
Figure 7.49: Species distribution diagram as a function of pH for Cd2+
with the ligand DSA. Calculated for the continuous potentiometric titration performed with a 1:2 molar ratio ([Cd
2+]t = 0.50 mmol/L, [L]t = 1.00 mmol/L, pure water, T = 298 K and I = 0.1 mol/L KCl) from
pH 6.0 to 11.0. The species concentration were calculated from the equilibrium constants listed in Table 7.25 (mean values from simultaneous evaluation of 12 titrations) with the pr o-gram Hyss2006.
6 7 8 9 10 11
0
20
40
60
80
100
0
20
40
60
80
100
[Cd2(L)
2(OH)
2]
6-
[Cd2(L)
2(OH)]
5-
[Cd(L)(LH)]5-
[Cd(L)2]
6-
[Cd(LH)]-
[Cd(L)]2-
Cd2+
% S
pe
cie
s r
ela
tive
to
Cd
2+
pH

7 The ligand DSA
147
The two dinuclear hydroxo-bridged complexes [Cd2(L)2(OH)]5- and
[Cd2(L)2(OH)2]6- appear only in strong alkaline solution with concentrations less
than 5% as minor species.
In Figure 7.50 the species distribution is illustrated for the titrations with
a 1:1 molar ratio. In the diagram for this molar ratio the [Cd(DSA)]2- complex is
predominant species from pH 7 to 11. It reaches its highest concentration of
92% at pH 9.7. At the end of the titration it is still the dominating species with
56%. Again, the [Cd(LH)] - complex is only present as a minor species with less
than 5%. The two bis-complexes [Cd(L)2]6- and [Cd(L)(LH)]5- are clearly not fa-
voured by this molar ratio. As a result, they only appear as minor species with
a concentration less than 5%.
Figure 7.50: Species distribution diagram as a function of pH for Cd2+
with the ligand DSA. Calculated for the continuous potentiometric titration performed with a 1:1 molar ratio ([Cd
2+]t = 1.00 mmol/L, [L]t = 1.00 mmol/L, pure water, T = 298 K and I = 0.1 mol/L KCl) from
pH 6.0 to 11.0. The species concentration were calculated from the equilibrium constants listed in Table 7.25 (mean values from simultaneous evaluation of 12 titrations) with the pr o-gram Hyss2006.
6 7 8 9 10 11
0
20
40
60
80
100
0
20
40
60
80
100
[Cd(L)2]
6-
[Cd2(L)
2(OH)
2]
6-
[Cd2(L)
2(OH)]
5-
[Cd(L)(LH)]5-
[Cd(LH)]-
[Cd(L)]2-
Cd2+
% S
pe
cie
s r
ela
tive
to
Cd
2+
pH

7 The ligand DSA
148
The dinuclear hydroxo-bridged complexes form in alkaline solution and
appear in higher concentrations for the 1:1 molar ratio than for the 1:2 molar
ratio. The mono-hydroxo-bridged complex [Cd2(L)2(OH)]5- begins to form at pH
9.5 and reaches a concentration of 15% at the end of the titration. Further, the
di-hydroxo bridged complex [Cd2(L)2(OH)2]6- starts to form at pH 10 and is pre-
sent with a concentration of 27% at pH 11.
The species distribution diagram of the 2:1 molar ratio titrations is illus-
trated in Figure 7.51. The pH range is given from pH 6 to 8. In this pH range
only the two mononuclear complexes [Cd(L)]2- and [Cd(LH)]- are present. The
[Cd(LH)]- complex is still a minor species. The [Cd(L)]2- complex appears with a
concentration of 31% at pH 8.
Figure 7.51: Species distribution diagram as a function of pH for Cd2+
with the ligand DSA. Calculated for the continuous potentiometric titration performed with a 2:1 molar ratio ([Cd
2+]t = 2.00 mmol/L, [L]t = 1.00 mmol/L, pure water, T = 298 K and I = 0.1 mol/L KCl) from
pH 6.0 to 8.0. The species concentration were calculated from the equilibrium constants listed in Table 7.25 (mean values from simultaneous evaluation of 12 titrations) with the program Hyss2006.
6.0 6.5 7.0 7.5 8.0
0
20
40
60
80
100
0
20
40
60
80
100
[Cd(LH)]-
[Cd(L)]2-
Cd2+
% S
pe
cie
s r
ela
tive
to
Cd
2+
pH

7 The ligand DSA
149
In conclusion, the species model presented in Table 7.25 was the model
with the best fit (σ 1.035). A [Cd2(L)2]4- (220) complex could not be added to
this model. The titrations with a 1:2 molar ratio could be evaluated with a
[Cd2(L] (210) complex by single evaluation of each titration experiment. A
[Cd2(L] complex could not be determined by simultaneous evaluation of all
three molar ratios.
The recent report by Saljooghi suggests the removal of cadmium (II) in
rats by the iron-chelator deferasirox [112]. Our investigations with the ligand
DSA show a rather weak complexation of Cd2+ in comparison to Fe3+. Complex
formation in the Cd2+-DSA system begins at pH 7 and at physiological pH 7.4
only 8% [Cd(L)]2- and 3% [Cd(LH)]- complex are present in solution. In contrast
to the Fe3+-DSA system where at pH 7.4 the [Fe(DSA)2]5- has completely
formed. Our results would not support a preferential coordination of the cadmi-
um (II) ion to the iron (III) ion. The reported decrease of cadmium concentration
in rats by administration of deferasirox might be attributed to a more complicat-
ed mechanism in vitro than to the unlikely preferential complexation of Cd2+ to
Fe3+ by the ligand deferasirox.

7 The ligand DSA
150
7.7 Complex formation of DSA with magnesium (II)
Magnesium is an important biometal as a result of its high concentration
11.5 – 16.5 mmol/kg in the human body (an adult with a body weight of 70 kg
has a total of 25 g magnesium). The high abundance is attributed to magnesi-
um taking an active part in more than 300 reactions concerning the transfer of
phosphate groups and the cleavage and formation of phosphate esters. This
can be explained by the fact that the substrate of the enzymes involved in the-
se reaction processes is an ATP2--Mg2+ complex (ATP = adenosine triphos-
phate). [4]
Magnesium is incorporated through the intestine by an unknown mecha-
nism. Yet, the uptake is only 30% while 70% is excreted without i ncorporation.
Further, 95% of the total magnesium in the human body is in the intracellular
space. High magnesium concentrations are found in proteins in the skeleton
and in organs with high metabolic activity such as the heart, liver, central nerv-
ous system and muscles. In plasma only 7% of the total magnesium is bound in
complex form. Most of the magnesium bound in plasma is bound to proteins. In
addition, there is an active mechanism to excrete excessive magnesium by re-
nal excretion (3 – 6 mmol/d). [4]
Due to the high abundance of magnesium in the human body it was of in-
terest to know the affinity of deferasirox towards this biometal ion. U. Heinz in-
vestigated the complex formation of deferasirox with Mg 2+ in water/DMSO solu-
tions (xDMSO = 0.20). Deferasirox and MSA form rather weak complexes with
Mg2+, as one might expect. [37]
First investigations of the complex formation of the ligand DSA with Mg2+
were carried out in pure water by T. Nicolai, under my guidance [58]. He carried
out potentiometric titrations in a Mg2+:DSA 1:2 and 1:4 molar ratio. Models ap-
plied for the evaluation of the 1:2 molar ratio titrations were always lacking a
[Mg(DSA)2]6- (120) complex. This was rather surprising to us, since titrations of
deferasirox and MSA by U. Heinz revealed this type of complex [37]. To favour
the formation of this [Mg(DSA)2]6- complex the ligand concentration in the titra-
tion experiments was increased further to a 1:6 molar ratio. An evaluation of all
three molar ratios 1:2, 1:4 and 1:6 was difficult. As a consequence, only titra-

7 The ligand DSA
151
tions with a Mg2+:DSA 1:4 and 1:6 molar ratio were evaluated and the determi-
nation of a [Mg(DSA)2]6- complex was successful. The titration conditions for
these experiments are given in Table 7.26.
Table 7.26: Titration experiment conditions of the complexation of Mg2+
with DSA given at
T = 298 K.
Conditions for the Mg2+-DSA titrations
molar ratio of M:L 1:4 1:6
measuring method potentiometric potentiometric
method type continuous continuous
solvent pure water pure water
[M]t in mmol/L 0.50 0.25 0.25 0.17
[L]t in mmol /L 2.00 1.00 1.50 1.00
titration volume 50.0 mL 50.0 mL
titrant 0.1 mol/L KOH 0.1 mol/L KOH
supporting electrolyte 0.1 mol/L KCl 0.1 mol/L KCl
electrode Sen Tix / Schott IoLine Schott IoLine
pKW 13.78 13.78
pH range 2.3 – 11.2 2.6 – 11.2 2.5 – 11.3
volume of data points 100 70 70
time for mixing process 120 s 160 s
The overall stability constants determined by simultaneous evaluation of
the 1:4 and 1:6 molar ratio titrations are presented in Table 7.27. The species
model consists of mononuclear complexes of the composition [Mg(L)]2- (110)
and [Mg(LH)]- (111) in addition to the desired [Mg(L)2]6- (120) complex and a
protonated [Mg(L)(LH)]5- (121) complex (for geometry see Scheme 7.11).

7 The ligand DSA
152
Table 7.27: Mean values of the overall stability constants logβxyz [a]
from potentiometric titra-tions of Mg
2+ with DSA determined by simultaneous evaluation with Hyperquad2008 in pure
water, T = 298 K and I = 0.1 mol/L KCl.
logβ values for the complexation of Mg2+:DSA
six titrations 1:4 six titrations 1:6
pH 2.3 (or 2.6) – 11.2 pH 2.5 – 11.3
mean values by simultaneous evaluation of 12 titrations [b]
σ [c] 1.415
logβ110 6.74(2)
logβ111 14.7(1)
logβ120 9.1(2)
logβ121 20.7(8)
[a] For the ligand L logβxyz is defined as: βxyz = [MxLyHz] × [M]
-x × [L]
-y × [H]
-z.
[b] The titrations were evaluated simultaneously with the program Hyperquad2008. The
deviations given in brackets correspond to the threefold standard deviation taken from Hyperquad2008. [c]
The σ value is taken from Hyperquad2008.
The stability constant for the [Mg(L)]2- complex is logβ110 = 6.74(2). The
apparent pKa value for the deprotonation of the [Mg(LH)] - complex is 8.0. In
comparison to other apparent pKa values of the 111 complexes with the diva-
lent transition metal ions discussed before, this apparent pKa for the Mg2+-DSA
system is higher. With excess ligand provided in the titration experiments, we
were able to determine an overall stability constant of logβ120 = 9.1(2) for the
[Mg(L)2]6- complex. The corresponding logK120 = 2.4 (logK120 = [ML2] / [ML] ×
[L]) indicates the rather weak complexation of a second ligand bound to the
Mg2+ central ion. The apparent deprotonation constant of the [Mg(L)(LH)]5-
complex is quite high with a pKa of 11.6 implicating that the bidentate coordina-
tion of one ligand might be favoured (see Scheme 7.11). The Mg2+-DSA titra-
tion curves compared to the pKa titration curve of DSA are illustrated in
Figure 7.52.

7 The ligand DSA
153
Figure 7.52: Potentiometric titration curves of the free ligand DSA and Mg2+
with DSA with the molar ratios 1:4 ([Mg
2+]t = 0.25 mmol/L, [L] t = 1.00 mmol/L) and 1:6 ([Mg
2+]t = 0.17 mmol/L,
[L] t = 1.00 mmol/L) in pure water, T = 298 K and I = 0.1 mol/L KCl. The open squares, circles and triangles represent experimental points and the fit (solid line) was calculated from the equilibrium constants with Hyperquad2008.

7 The ligand DSA
154
The low affinity of the ligand DSA to the metal ion Mg2+ is evident in the
small pH decrease observed for the Mg2+-DSA titrations. The inflection at two
equivalents can be attributed to the two strong acidic protons of the ligand
DSA. At this inflection little complex has been formed.
Only minor changes in concentration distinguish between the 1:4 and 1:6
molar ratio species distributions. As a consequence, only the 1:6 molar ratio
species diagram is illustrated in Figure 7.53. The complex [Mg(LH)]- begins to
form at pH 7 and reaches its highest concentration 12% at pH 8.5.
Figure 7.53: Species distribution diagram as a function of pH for Mg2+
with the ligand DSA. Calculated for the continuous potentiometric titration performed with a 1:6 molar ratio ([Mg
2+] t = 0.17 mmol/L, [L] t = 1.00 mmol/L, pure water, T = 298 K and I = 0.1 mol/L KCl) from
pH 6.0 to 11.2. The species concentration were calculated from the equilibrium constants listed in Table 7.27 (mean values from simultaneous evaluation of 12 titrations) with the pr o-gram Hyss2006.
The [Mg(L)]2- complex is a major component which is present at a higher
concentration than any other species from pH 8 to 11.2. It reaches a maximum
concentration of 80% at pH 9.4 and maintains a concentration above 75% to

7 The ligand DSA
155
the end of the titration range. A considerable amount of the protonated bis-
complex [Mg(L)(LH)]5- is formed in the solution from pH 8.5 to 11.2 with a max-
imum concentration of 22% at pH 10.3. The [Mg(L)2]6- complex is only present
from pH 10 to 11.2. At the end of the titration range this [Mg(L)2]6- complex has
a concentration of 7%.
In conclusion, the species distribution shows that the [Mg(L) 2]6- complex
only forms in strong alkaline solution with a very low abundance which explains
the difficulty we had to determine its stabi lity constant. However, by enhancing
the equilibrium conditions towards the bis-complexes with increasing ligand
concentrations, a stability constant of logK120 = 2.4 was determined for this
Mg2+-DSA complex. In comparison, the [Mg(DSA)]2- has a higher stability con-
stant logβ110 = 6.74(2) than its corresponding [Mg(MSA)]- complex with
logβ110 = 5.25(1) (pure water, T = 298 K and I = 0.1 mol/L KCl) [37]. In contrast,
the [Mg(DSA)2]6- complex has a lower stability constant logK120 = 2.4 compared
to the logK120 = 3.68 for [Mg(MSA)2]4- (pure water, T = 298 K and I = 0.1 mol/L
KCl) [37]. It seems that the formation of the 120 complex with magnesium (II)
and DSA is not favoured which might be attributed to the higher charge (6-) of
the Mg2+-DSA 120 complex. The geometry of these complexes should be like
those suggested for the Ni2+-DSA system in Scheme 7.11.
In essence, at physiological pH 7.4 hardly any complex formation has oc-
curred. The only complexes present are the mononuclear [Mg(L)]2- and
[Mg(LH)]- complexes with concentrations below 5%. Accordingly, the complex
formation of Fe3+ at pH 7.4 should not be influenced by the presents of magne-
sium (II) ions.

7 The ligand DSA
156
7.8 Complex formation of DSA with calcium (II)
It is evident that calcium is a biometal vital for the human body. It is well
known that 99% of the total body calcium is in our bones. Calcium is together
with phosphate the inorganic material bones and teeth are made of. One per
cent of the calcium in our bones provides calcium as a mobile pool which can
be activated in case of deficiency. Therefore, bones function as a storage or-
gan for calcium. The daily requirement of calcium for an adult is about 0.8 g
and the incorporation of calcium by the intestine has been very well investiga t-
ed. For example, the key position of vitamin-D and its metabolites in the regula-
tion of intestinal calcium uptake. Between 25% and 40% of by nutrition provid-
ed calcium is incorporated. Excessive calcium is excreted by the kidneys or the
intestine. The human body is able to excrete 1.0 g/d. As a consequence, if
higher amounts are transported to the kidneys over a longer period they can
cause renal calculi. [4]
Besides the accumulation of calcium in the bones, 1% of the total body
calcium is in the blood plasma in either ionised form, bound to proteins or in
small amounts in complex form with citrate or phosphate. Calcium in the ion-
ised form plays an important role in the activation of extra- and intravascular
systems of the blood coagulation by forming complexes with phospholipids and
coagulation factors. [4]
Calcium has a signal function in cell activation. In numerous processes
calcium can act as a transmitter for information from the activated cell mem-
brane to the receptor molecule in the cell. An example for such a receptor pro-
tein is troponin C (part of the protein troponin) in the myocardial muscle and
skeletal muscles. Troponin C is a calcium-receptor responsible for the regula-
tion of muscle contractions. [4, 115]
To confirm very little to no interaction of the biometal ion Ca2+ with the
iron chelating ligand deferasirox, titration experiments were carr ied out with
deferasirox in water/DMSO (xDMSO = 0.20, T = 298 K, I = 0.1 mol/l KCl) and with
MSA in pure water (T = 298 K, I = 0.1 mol/L KCl) by U. Heinz in his doctoral
thesis [37]. In accordance, first investigations on the complex formation of DSA
with Ca2+ in pure water were performed by T. Nicolai, under my supervision [58].

7 The ligand DSA
157
The titration curves differ not much from the pKa titration curve, revealing a
very weak complexation of Ca2+ with DSA. On account of the weak complexa-
tion only a [Ca(L)]2- (110) complex was found in, the difficult to evaluate, 1:2
molar ratio titrations. To enhance the formation of bis-complexes titrations were
performed by T. Nicolai in a 1:4 molar ratio. Only the protonated bis-complex
[Ca(L)(LH)]5- (121) and not the desired [Ca(L)2]6- (120) complex was deter-
mined. Later titration experiments with a 1:6 molar ratio were performed to en-
hance the formation of the [Ca(L)2]6- complex. The conditions for these two mo-
lar ratios applied for evaluation are given in Table 7.28.
Table 7.28: Titration experiment conditions of the complexation of Ca2+
with DSA given at
T = 298 K.
Conditions for the Ca2+-DSA titrations
molar ratio of M:L 1:4 1:6
measuring method potentiometric potentiometric
method type continuous continuous
solvent pure water pure water
[M]t in mmol/L 0.50 0.25 0.25 0.17
[L]t in mmol /L 2.00 1.00 1.50 1.00
titration volume 50.0 mL 50.0 mL
titrant 0.1 mol/L KOH 0.1 mol/L KOH
supporting electrolyte 0.1 mol/L KCl 0.1 mol/L KCl
electrode Sen Tix / Schott IoLine Schott IoLine
pKW 13.78 13.78
pH range 2.3 – 11.3 2.5 – 11.2 2.6 – 11.2 2.5 – 11.0
volume of data points 100 70 70
time for mixing process 120 s 120 s

7 The ligand DSA
158
The simultaneous evaluation of both molar ratios 1:4 and 1:6 is present-
ed in Table 7.29. The two species found to fit the titration curves were the
[Ca(DSA)]2- complex and the protonated bis-complex [Ca(L)(LH)]5-.
Table 7.29: Mean values of the overall stability constants logβxyz [a]
from potentiometric titra-tions of Ca
2+ with DSA determined by simultaneous evaluation with Hyperquad2008 in pure
water, T = 298 K and I = 0.1 mol/L KCl.
logβ values for the complexation of Ca2+:DSA
six titrations 1:4 six titrations 1:6
pH 2.3 – 11.3 2.5 – 11.2 pH 2.6 – 11.2 2.5 – 11.0
mean values by simultaneous evaluation of 12 titrations [b]
σ [c] 1.873
logβ110 4.53(6)
logβ121 18.3(2)
[a] For the ligand L logβxyz is defined as: βxyz = [MxLyHz] × [M]
-x × [L]
-y × [H]
-z.
[b] The titrations were evaluated simultaneously with the program Hyperquad2008. The
deviations given in brackets correspond to the threefold standard deviation taken from Hyperquad2008. [c]
The σ value is taken from Hyperquad2008.
The overall stability constant logβ110 = 4.53(6) for the [Ca(DSA)]2- com-
plex was very well determined. Further, the overall stability constant of the pro-
tonated bis-complex was determined to logβ121 = 18.3(2).
A protonated [Ca(LH)]- (111) complex could be added to the model with-
out any change in the σ value of the fit. This can be explained by the fact that
this 111 complex appeared as a minor species with a maximum concentration
less than 3%. The overall stability constant of this complex was
logβ111 = 12.9(8). A stability constant of a minor species is very unsure. This is
the reason why we decided to omit this complex from the species model.
Further, a [Ca(L)2]6- (120) complex could also be added to the species
model, yet this complex appeared to less than 1%. The estimated overall stabil-
ity constant logβ120 would have been about 6, however the deviation calculated

7 The ligand DSA
159
by Hyperquad2008 was higher than the value i tself. The determination of a sta-
bility constant for the 120 complex is not possible with our method. It is indeed
unsure if this complex forms at all. If we compare the stability constants of the
110 complex of the Mg2+-DSA system logβ110 = 6.74(2) to the one determined
with the Ca2+-DSA system logβ110 = 4.53(6) we conclude that the complexation
with Ca2+ is about 2 units weaker. The equilibrium constant for the formation of
a 120 complex with Mg2+ was logK120 = 2.4 (logK120 = [ML2] / [ML] × [L]), indi-
cating the instability of this complex. Consequently, the equilibrium constant for
the 120 complex with Ca2+ will be even smaller than 2.4. We assume that a
[Ca(DSA)2]6- complex with such a small formation constant will be too instable
and for this reason this complex was not found in our titrations .
The possibility of calculating an overall stability constant for the
[Ca(DSA)2]6- complex with less than 1% in Hyperquad2008 may be a calcula-
tion artefact of the program due to the low pH decrease in comparison to the
pKa titration curve. This minor difference of the 1:4 molar ratio titration curve of
Ca2+-DSA to the pKa titration curve of DSA is shown in Figure 7.54.
Figure 7.54: Potentiometric titration curves of the free ligand DSA and Ca2+
with DSA with the molar ratio 1:4 ([Ca
2+]t = 0.25 mmol/L, [L] t = 1.00 mmol/L) in pure water, T = 298 K and
I = 0.1 mol/L KCl. The open squares and circles represent experimental points and the fit (sol-id line) was calculated from the equilibrium constants with Hyperquad2008.

7 The ligand DSA
160
Further, Figure 7.55 shows the titration curve with a 1:6 molar ratio in
comparison to the pKa titration curve of DSA.
Figure 7.55: Potentiometric titration curves of the free ligand DSA and Ca2+
with DSA with the molar ratio 1:6 ([Ca
2+]t = 0.17 mmol/L, [L]t = 1.00 mmol/L) in pure water, T = 298 K and
I = 0.1 mol/L KCl. The open squares and circles represent experimental points and the fit (sol-id line) was calculated from the equilibrium constants with Hyperquad2008.
It is evident that these titrations depict a low complex behaviour between
Ca2+ and the ligand DSA. The pH decrease begins between pH 8 – 9 and is a
degree for the weak complexation.
The species distribution diagram in Figure 7.56 for the 1:6 molar ratio ti-
trations confirms that the complex formation for the Ca 2+-DSA system begins at
pH 8.5. The species distribution for the 1:4 molar ratio is not displayed since it
differs only in the concentrations to a minor degree. The [Ca(L)]2- complex is
formed in the pH range from 8.5 to 11.0 and reaches a maximum concentration
of 79% at the end of the titration. The only other complex present in solution is
the [Ca(L)(LH)]5- complex which begins to form at pH 9.0 and reaches its high-
est concentration 13% at pH 10.7.

7 The ligand DSA
161
Figure 7.56: Species distribution diagram as a function of pH for Ca2+
with the ligand DSA. Calculated for the continuous potentiometric titration performed with a 1:6 molar ratio ([Ca
2+]t = 0.17 mmol/L, [L]t = 1.00 mmol/L, pure water, T = 298 K and I = 0.1 mol/L KCl) from
pH 6.0 to 11.0. The species concentration were calculated from the equilibrium constants listed in Table 7.29 (mean values from simultaneous evaluation of 12 titrations) with the pr o-gram Hyss2006.
The stability constant logβ110 = 4.53(6) of the [Ca(DSA)]2- complex is
higher than the stability constant logβ110 = 3.42(2) of the [Ca(MSA)]- complex
(pure water, T = 298 K, I = 0.1 mol/L KCl) [37], by means of comparison. Fur-
ther, the [Ca(L)(LH)]5- bis-complex was determined for the Ca2+-DSA system. In
contrast, only the 110 complex was determined for the Ca2+-MSA (pure water)
and the Ca2+-deferasirox systems (water/DMSO, xDMSO = 0.20) and no bis-
complexes could be determined [37].
In conclusion, the complex formation of Ca2+ with DSA is only relevant in
alkaline solution above pH 8.5. There is no complex formation at physiological
pH 7.4. As a consequence, the biometal ion Ca2+ will not interfere with complex
formation with Fe3+ and the ligand DSA.
6 7 8 9 10 11
0
20
40
60
80
100
0
20
40
60
80
100
[Ca(L)(LH)]5-
[Ca(L)]2-
Ca2+
% S
pe
cie
s r
ela
tive
to
Ca
2+
pH

7 The ligand DSA
162
7.9 Complex formation of DSA with aluminium (III)
Aluminium is the most abundant metal in the earth’s crust. Interestingly,
even though it is omnipresent in nature it is a non-essential trace element for
human life [116]. Consequently, aluminium has no known biological function [117].
Yet, the chemical properties of aluminium show the affinity of Al3+ to-
wards negatively charged oxygen-donor ligands which are commonly found in
biological processes. For example, Al3+ can bind to phosphate groups of the
DNA and RNA inducing topological changes to the DNA and affecting gene
transcription. Further, Al3+ can also bind to nucleoside di- and triphosphates,
such as adenosine triphosphate (ATP) which results in Al 3+ affecting the energy
metabolism. Aluminium (III) and iron (III) both have a three-fold charge yet ra-
ther different ionic radii when comparing the Al3+ ion (CN:6, r = 0.535 Å) [118] to
the Fe3+ ion (high-spin, CN: 6, r = 0.645 Å) [118]. However, it is well investigated
that Al3+ can also bind to the iron-binding protein transferrin and affect iron-
homeostasis [116]. In fact, approximately 90% of the total aluminium in the hu-
man body is bound to transferrin and the other 10% is believed to be associa t-
ed with low molecular mass biocompounds such as citrate. [117]
Further, Al3+ has a rather slow water exchange rate constant
(kex = 1.29 s-1, T = 298 K) [2] compared to important biometals such as Ca2+
(kex ≈ 108 s-1) [2] and Mg2+ (kex = 5.3 × 10⁵ s-1) [2]. Apparently, Al3+ can replace
Mg2+ in many biological systems causing for example inhibition of enzymes
with Mg2+ cofactors on account of the slow ligand-exchange rate. As mentioned
above Al3+ has an affinity to phosphate groups which can result in the inhibition
of biological processes involving a rapid Ca2+ exchange. As a consequence, it
has been reported that aluminium (III) affects more than 200 biologically i m-
portant reactions. [116, 119]
The daily intake of aluminium by the human body can proceed by foods
and beverages. However, even higher quantities (several grams) are consumed
by common over-the-counter medications containing aluminium compounds
such as antacids and buffered analgesics (for example, aspirin, diclofenac and
ibuprofen). [119]

7 The ligand DSA
163
However, the effectively absorbed percentage of Al 3+ by the human body
from these sources is not known. The uptake is dependent on the composition
and the acidity of the diet which influences the availability of aluminium (III).
The major route of excretion of normal dietary levels of incorporated Al 3+
seems to be by the biliary system. [117]
The toxicity of aluminium (III) is attributed to its capability of crossing the
blood-brain barrier. Additionally, the clearance of aluminium from the brain
seems to be very slow with a calculated elimination half -life of seven years. [117]
Aluminium plays a role in dialysis encephalopathy disease which is a progres-
sive brain disease that occurs in some patients who undergo chronic haemodi-
alysis. The sources of the elevated aluminium levels found in the brain of long-
term dialysis patients were presumably the use of unpurified water for dialysis
and the administration of aluminium containing phosphate binders. [119-120]
Further, in the literature there is a controversy whether aluminium plays a
role in the pathogenesis of Alzheimer’s disease. [117]
As a consequence of the similar coordination characteristics of Al3+ and
Fe3+ it was of interest to investigate complex formation of Al3+ with deferasirox.
U. Heinz has determined the overall stability constants of Al3+ with deferasirox
in water/DMSO medium (xDMSO =0.20, T= 298 K, I = 0.1 mol/L KNO3) as well as
the overall stability constants of Al3+ with MSA in pure water (T = 298 K,
I = 0.1 mol/L KCl) [37]. His investigations demonstrated a strong complexation of
deferasirox and MSA towards Al3+, yet not as strong as towards Fe3+. In con-
trast to the potentiometric titrations of Fe3+ with deferasirox and MSA those
with Al3+ still showed free Al3+ ion at the beginning of the titrations. Conse-
quently, discontinuous batch titrations were not required.
Some preliminary titration experiments with Al3+ and the ligand DSA were
performed in pure water by T. Nicolai, under my supervision [58]. Due to some
variance between the values determined with the WTW electrode, Further titra-
tion experiments were performed with two molar ratios Al3+:DSA 1:2 and 1:4
with the new electrode Schott IoLine. These titrations showed very little vari-
ance.

7 The ligand DSA
164
The Al3+ aqua ion [Al(H2O)6]3+ has a very slow water exchange rate
(kex = 1.29 s-1, T = 298 K) [2], as described above. Nevertheless, the equilibrium
needed to perform continuous potentiometric titrations with the Al3+:DSA sys-
tem was achieved rather fast. Further, in aqueous solutions the [Al(H2O)6]3+
aqua ion is a strong Lewis acid which hydrolysis easily. For this reason, we
took the hydrolysis constants of Al3+ into account for the evaluation of the po-
tentiometric titrations. The formation constants for the hydrolysis products of
Al3+ in aqueous solution are given in Table 7.30. These logβx,y values were
added to the model in Hyperquad2008 as constant values.
Table 7.30: Formation constants of the Al3+
hydrolysis products at 298 K. [121]
logβ values for the Al3+ hydrolysis products
species [Alx(OH)y]3x-y logβx,y
[a]
[Al(OH)]2+ (aq) [c] -4.97
[Al(OH)2]+ (aq)
[d] -9.3
[Al(OH)4]- (aq)
[c] -23.0
[Al2(OH)2]4+ (aq)
[d] -7.7
[Al3(OH)4]5+ (aq)
[d] -13.94
[Al13O4(OH)24]7+ (aq)
[b] [d] -98.73
[a] logβx,y is defined as: βx,y = [Alx(OH)y]
3x-y × [H]
y × [Al]
-x
[b] logβx,y is defined as: β13,32 = [Al13O4(OH)24]
7+ × [H]
32 × [Al]
-13
[c] For ionic strength I = 0.0 mol/L.
[d] Ionic strength not defined.
The hydrolysis formation constants of Al3+ are associated with the reac-
tions in Scheme 7.13.

7 The ligand DSA
165
Scheme 7.13: Reaction equations for the overall formation constants of the hydrolysis of Al3+
in aqueous solution.
[121]
To investigate the types of complexes formed in aqueous solution by Al3+
with the ligand DSA we performed potentiometric titrations with two molar ratios
1:2 and 1:4 of Al3+:DSA. The conditions for the continuous potentiometric titra-
tions of both molar ratios are listed in Table 7.31.

7 The ligand DSA
166
Table 7.31: Titration experiment conditions of the complexation of Al3+
with DSA given at
T = 298 K.
Conditions for the Al3+-DSA titrations
molar ratio of M:L 1:2 1:4
measuring method potentiometric potentiometric
method type continuous continuous
solvent pure water pure water
[M]t 0.48 mmol/L 0.25 mmol/L
[L]t 1.00 mmol/L 1.00 mmol/L
titration volume 50.0 mL 50.0 mL
titrant 0.1 mol/L KOH 0.1 mol/L KOH
supporting electrolyte 0.1 mol/L KCl 0.1 mol/L KCl
electrode Schott IoLine Schott IoLine
pKW 13.78 13.78
pH range 2.5 – 5.8 2.6 – 5.3
volume of data points 100 100
time for mixing process 600 s 600 s
The overall stability constants of two complexes were determined by
simultaneous evaluation of 12 titrations, six from each molar ratio, with the
program Hyperquad2008. The resulting stability constants are summarized in
Table 7.32.

7 The ligand DSA
167
Table 7.32: Mean values of the overall stability constants logβxyz [a]
from potentiometric titra-tions of Al
3+ with DSA determined by simultaneous evaluation with Hyperquad2008 in pure
water, T = 298 K and I = 0.1 mol/L KCl.
logβ values for the complexation of Al3+:DSA
six titrations 1:2 six titrations 1:4
pH 2.5 – 5.8 pH 2.6 – 5.3
mean values by simultaneous evaluation of 12 titrations [b]
σ [c] 0.663
logβ110 18.77(1)
logβ120 32.45(1)
[a] For the ligand L logβxyz is defined as: βxyz = [MxLyHz] × [M]
-x × [L]
-y × [H]
-z.
[b] The titrations were evaluated simultaneously with the program Hyperquad2008. The
deviations given in brackets correspond to the threefold standard deviation taken from Hyperquad2008. [c]
The σ value is taken from Hyperquad2008.
The two complexes identified by potentiometric titrations are an [Al(L)]-
(110) complex with logβ110 = 18.77(1) and a bis-complex of the composition
[Al(L)2]5- (120) with logβ120 = 32.45(1) which reveals a logK120 = 13.68
(logK120 = [ML2] / [ML] × [L]). Aluminium (III) forms very strong complexes with
DSA in aqueous solution. However, the stability constants of the corresponding
Fe3+-DSA complexes were still higher with logβ110 = 23.54(4) (see
Table 7.9) and logβ120 = 39.50(2) (see Table 7.11). The formation constant
logK120 (logK120 = [ML2] / [ML] × [L]) for the [Fe(DSA)2]5- complex is also more
stable with a value of 15.96. The Fe3+ ion and the Al3+ ion have the same
charge, yet different ionic radii. The Fe3+ ionic radius (high-spin, CN: 6,
r = 0.645 Å) [118] is significantly larger than the Al3+ ionic radius (CN: 6,
r = 0.535 Å) [118]. The stability constants show a higher affinity to the Fe3+ ion.
The mixed ONO- coordination mode of the ligand DSA comprehends the oxy-
gen atoms as hard donor atoms, according to the HSAB principle, and the n i-
trogen atom resembling a rather soft than hard donor atom character. The Al3+
ion is a particularly hard cation compared to the Fe3+ ion which is considered

7 The ligand DSA
168
as a hard cation with soft characteristics. As a consequence, the partly soft
character of the ligand matches the partly soft character of the Fe 3+ as central
ion.
As for the Al3+-DSA system, the two complexes 110 and 120 were also
found for the Al3+-MSA system investigated by U. Heinz. The [Al(MSA)] com-
plex had a logβ110 = 16.27(2) and a logβ120 = 29.62(6) (pure water, T = 298 K,
I = 0.1 mol/L KCl) [37]. The formation constant logK120 = 13.35 (logK120 = [ML2] /
[ML] × [L]) for the [Al(MSA)2]3- complex is only 0.33 units smaller than the cor-
responding value logK120 value of 13.68 for the Al3+-DSA system. However, the
difference in the stability constants of the 110 complexes of MSA and DSA with
Al3+ is much higher with 2.5 units.
Interestingly, no protonated complexes such as a [Al(LH)] (111 complex)
and [Al(L)(LH)] (121 complex) were found for Al3+ with the sulfonic acid deriva-
tives MSA and DSA by potentiometric titrations. The 110 and 120 complexes
found with Al3+-DSA adopt the favoured meridional tridentate coordination
mode as depicted in Scheme 7.14.
Scheme 7.14: Suggested coordination geometries of the DSA complexes [Al(L)]- (110) and
[Al(L)2]5-
(120).

7 The ligand DSA
169
To form a 111 or 121 complex one of the phenolate oxygen atoms would
need to be protonated since the sulfonic acid groups and the triazole nitrogen
atoms are too acidic. The tendency to form bidentate complexes with one hy-
droxyphenyl ring not coordinating to Al3+ seems to be not favoured for either
complex. In contrast, the 121 species was found for Fe3+ complexes of both
sulfonic acid derivatives. A possible explanation could be the smaller ionic ra-
dius of Al3+ which causes less strain in the tridentate coordination than Fe3+. As
seen in the crystal structure of the [Fe(DSA)2]5- anion (see section 7.2.3) the
phenolate rings are slightly twisted out of the plain for an optimal coordination
of the Fe3+ ion. As a consequence, some strain occurs to the complex and a
protonation of the phenolate ring and with it a bidentate coordination mode will
take the strain. We assume the smaller Al3+ ion might reduce the twisting of the
phenolate groups in the tridentate coordination mode and apparently there is
no need to form a bidentate protonated species. The titration curves of both
molar ratios are given in Figure 7.57.
Figure 7.57: Potentiometric titration curves of the free ligand DSA and Al3+
with DSA with the molar ratios 1:2 ([Al
3+]t = 0.48 mmol/L, [L] t = 1.00 mmol/L) and 1:4 ([Al
3+] t = 0.25 mmol/L,
[L] t = 1.00 mmol/L) in pure water, T = 298 K and I = 0.1 mol/L KCl. The open squares, circles and triangles represent experimental points and the fit (solid line) was calculated from the equilibrium constants with Hyperquad2008.

7 The ligand DSA
170
The strong complexation of Al3+ by the ligand DSA is displayed by the
considerable decrease in pH of the Al3+-DSA titration curves in comparison to
the pKa titration curve of DSA. The titration curve with a 1:2 molar ratio
Al3+:DSA exhibits an inflection at 3 equivalents at pH 4 owing to the completion
of the formation of the [Al(L)]- complex. Accordingly, one equivalent of the dou-
bly protonated ligand LH22- is still present in solution. Further, an inflection ap-
pears in the titration curve with a 1:4 molar ratio at 2.5 equivalents also indicat-
ing the complete complex formation of the [Al(L)]- complex.
The species distribution diagram of the 1:2 molar ratio in Figure 7.58
gives rise to the species in solution in relation to the pH scale. The species dis-
tribution for the 1:4 molar ratio changes only to a minor degree and is not dis-
played.
Figure 7.58: Species distribution diagram as a function of pH for Al3+
with the ligand DSA. Calculated for the continuous potentiometric titration performed with a 1:2 molar ratio ([Al
3+]t = 0.48 mmol/L, [L]t = 1.00 mmol/L, pure water, T = 298 K and I = 0.1 mol/L KCl) from
pH 2.5 to 9.0. The species concentration were calculated from the equilibrium constants listed in Table 7.29 (mean values from simultaneous evaluation of 12 titrations) with the program Hyss2006.
3 4 5 6 7 8 9
0
20
40
60
80
100
0
20
40
60
80
100
[Al(L)2]
5-
[Al(L)]-
Al3+
% S
pe
cie
s r
ela
tive
to
Al3
+
pH

7 The ligand DSA
171
The hydrolysis products of Al3+ in Table 7.30 were employed for the cal-
culation of the species distribution diagram however they do not appear in the
species distribution. At the beginning of the titration at pH 2.5 the [Al(DSA)] -
(110) complex has been formed to 50% and 50% free Al 3+ is present in solu-
tion. The species distribution shows that at pH 3.9, where the inflection is ob-
served, the [Al(DSA)]- complex is formed to 99%. As the pH is raised above
pH 4 the [Al(DSA)2]5- (120) complex starts to form. At pH 5.3 both the 110 and
the 120 complex coexist to equal amounts. Above pH 5.3 the 120 complex be-
comes the predominant species and reaches a maximum concentration of
100% from pH > 7.2. As a consequence, the sole species at physiological pH
7.4 is the [Al(DSA)2]5- complex.
In conclusion, we have shown that the ligand DSA forms rather strong
complexes with Al3+. However, the ligand DSA forms stronger complexes with
the metal ion Fe3+ as demonstrated by the formation constants and species dis-
tribution. The [Fe(DSA)]- complex needed to be determined in acidic solution
between pH 1 – 2 and was formed to 96% at pH 2. In contrast, the [Al(DSA)] -
complex has only formed to 50% at pH 2.5. The [Al(DSA) 2]5- complex is the on-
ly species in solution at physiological pH 7.4. Even though the ligand DSA
forms stronger complexes with Fe3+, Al3+ might also compete against Fe3+ for
complex formation. However, since Al3+ is a non-essential trace element and
should be found in low abundance in the body the ligand DSA should prefera-
bly complex Fe3+. However, due to the possible toxic effects of Al3+, DSA might
also function as a ligand for detoxification of Al3+ in the body.

8 Complex formation of magnesium (II), calcium (II) and aluminium (III) with deferasirox in
pure water
172
8 Complex formation of magnesium (II), calcium (II)
and aluminium (III) with deferasirox in pure water
The complex formation of the iron-chelating ligand deferasirox has been
investigated with several biometal ions by U. Heinz in his doctoral thesis [37].
Unfortunately, the ligand deferasirox is not sufficiently soluble in pure water.
Consequently, titration experiments needed to be carried out in a water/DMSO
mixture with a molar fraction xDMSO = 0.20. The water/DMSO solution medium
was appropriate to keep the ligand deferasirox in solution. However, the values
determined in water/DMSO solution are somewhat different than the values in
pure water. U. Heinz has investigated the relation between the molar fraction of
DMSO and the equilibrium constants measured. As a result, the overall stability
constants have a roughly linear relation to the molar fraction of DMSO present
in solution. Determination of stability constants of the ligand deferasirox in pure
water is hampered by the poor solubility. Yet, they can be estimated by meas-
uring the stability constants in solutions with different molar fractions of DMSO
and extrapolating the linear relation to pure water.
In this study, the pKa values of deferasirox as well as the overall stability
constants of the ligand with Mg2+, Ca2+ and Al3+ were investigated in wa-
ter/DMSO solution with four molar ratios (xDMSO = 0.20, 0.18, 0.16 and 0.14).
The values of the stability constants in pure water were estimated by linear ex-
trapolation.

8 Complex formation of magnesium (II), calcium (II) and aluminium (III) with deferasirox in
pure water
173
8.1 Investigation of the pKa values of deferasirox
The pKa values of the ligand deferasirox in pure water have been investi-
gated in the past by potentiometric titrations (T = 298 K, I = 0.1 KCl/ or KNO3)
with different molar fractions of DMSO and extrapolation to pure water [37, 39-40].
In this study the determination has been repeated for four molar fractions of
DMSO (xDMSO = 0.20, 0.18, 0.16 and 0.14). The structural formula of the ligand
deferasirox is illustrated in Figure 8.1. The three pKa values found were as-
signed to the carboxylic acid group and the two hydroxyphenyl groups. In this
study, investigations in acidic solution revealed another pKa value which could
be assigned to the protonation of a nitrogen atom of the triazole unit. The de-
termination of this acidic protonation constant of the ligand deferasirox was
performed with spectrophotometric batch titrations in acidic solution and
1H-NMR spectroscopy. Further, a kinetic study, revealing precipitation of the
ligand deferasirox, was performed in water/DMSO solution with the rather low
molar fraction xDMSO = 0.06.
Figure 8.1: The structural formula of the ligand 4-[3,5-bis(2-hydroxyphenyl)-1H-1,2,4-triazol-1-yl]benzoic acid (deferasirox, ICL670).

8 Complex formation of magnesium (II), calcium (II) and aluminium (III) with deferasirox in
pure water
174
8.1.1 Determination of the pKa values of deferasirox in pure water by
continuous potentiometric titrations
The determination of the pKa values of deferasirox in pure water is diffi-
cult due to the low solubility of the ligand in pure water. However , the pKa val-
ues in pure water can be estimated by a linear extrapolation of values meas-
ured at different molar fractions of DMSO in pure water. The pKa values have
been determined for the molar fractions xDMSO = 0.20, 0.18, 0.16 and 0.14 at
T = 298 K and with potassium chloride (0.1 mol/L KCl) as supporting electro-
lyte. The ligand deferasirox was applied with a concentration of 0.50 mmol/L
based on a better solubility in all molar fractions. The molar fractions
xDMSO = 0.20 and 0.18 can be titrated with a 1.00 mmol/L concentration of de-
ferasirox. Whereas occasionally a slight turbidity, caused by ligand precipita-
tion, was observed for the solutions prepared with the xDMSO = 0.16 and 0.14
molar fractions. To prevent the ligand from precipitating overnight a small vol-
ume of potassium hydroxide 0.1 mol/L was added to the flask to raise the pH.
It is important to note that the pKw differs in water/DMSO solutions with
different molar fractions [122-123]. Based on the procedure described in section
11.2.4 the pKw values for each molar fraction were determined by potentiom-
etric titrations. Dependent on the pKw value the pH scale is extended for
xDMSO = 0.20 to range from pH 0 to 15.6 [40].
The overall stability constants logβx and acidity constants pKa values in
Table 8.1 were calculated as mean values with standard deviations from at
least 6 titrations. The titration conditions are also listed in Table 8.1.

8 Complex formation of magnesium (II), calcium (II) and aluminium (III) with deferasirox in
pure water
175
Table 8.1: Determination of the mean values of the overall protonation constants logβx [a]
and acidity constants pKa
[b] with standard deviations
[d] of the ligand deferasirox in water/DMSO
solution with different molar fractions xDMSO at T = 298 K and I = 0.1 mol/L KCl.
xDMSO 0.20 0.18 0.16 0.14
[L]t 0.50 mmol/L 0.50 mmol/L 0.50 mmol/L 0.50 mmol/L
pKw 15.58 15.39 15.20 15.01
pH range 4.0 – 12.6 3.9 – 12.5 4.3 – 12.0 4.6 – 11.9
No. of titrations 7 6 6 6
No. data points 50 50 40 / 60 50
time mixing [s] 120 120 120 120
σ [c] 0.781 0.687 0.265 0.408
logβ1 12.18(2) 12.05(3) 11.94(4) 11.80(2)
logβ2 22.36(3) 22.12(4) 21.93(4) 21.66(1)
logβ3 27.00(3) 26.65(3) 26.35(4) 26.01(2)
pKa,1 4.64(1) 4.53(3) 4.42(1) 4.35(2)
pKa,2 10.18(1) 10.07(1) 9.99(1) 9.86(1)
pKa,3 12.18(2) 12.05(3) 11.94(4) 11.80(2)
[a] For the ligand L logβx is defined as: βx = [LHx] × [L]
-1× [H]
-x.
[b] For the ligand LHx the pKa,i is defined as: pKa,i = -logKa,i and Ka,i = [LHx-i] × [H] × [LH(x+1)-i]
-1.
[c] The σ value is taken from the titration with the highest σ value in Hyperquad2008.
[d] The standard deviations in brackets were calculated with: √
∑ ( )
( ) ; measured value;
mean value; n number of values.

8 Complex formation of magnesium (II), calcium (II) and aluminium (III) with deferasirox in
pure water
176
The mean pKa values from Table 8.1 were plotted against the molar frac-
tion and the linear regression was calculated for the four pKa values. Extrapola-
tion of the linear regression to xDMSO = 0.00 resulted in the estimated pKa val-
ues for deferasirox in pure water. Figure 8.2 shows the linear regression and
extrapolation as calculated.
Figure 8.2: Dependence of the pKa values of deferasirox on the molar fraction xDMSO. Linear regression (solid line) of the mean pKa values (black squares) listed in Table 8.1 and extrapo-lation to xDMSO = 0.00. The red circles indicate the extrapolated values at x DMSO = 0.00.
The red circles in Figure 8.2 show the estimated three pKa values by lin-
ear extrapolation of the in different molar fractions measured pKa values of de-
ferasirox.
The estimated pKa values for the ligand deferasirox in pure water, the
linear regression equation and the regression coefficient are presented in
Table 8.2.
0.00 0.04 0.08 0.12 0.16 0.20
3
4
5
6
7
8
9
10
11
12
13
pKa,3
pKa,2
pKa,1
pK
a
molar fraction xDMSO

8 Complex formation of magnesium (II), calcium (II) and aluminium (III) with deferasirox in
pure water
177
Table 8.2: Estimated pKa,i [a]
values of deferasirox in pure water calculated by linear regres-sion of the pKa,i values measured in four molar fractions and extrapolation to x DMSO = 0.00 (T = 298 K).
Estimated pKa,i values of deferasirox in pure water
solvent pure water
supporting electrolyte 0.1 mol/L KCl
xDMSO = 0.00 R [c] regression equation [b]
pKa,1 [d] 3.65(6) 0.99504 pKa,1 = 4.9(3) × [xDMSO] + 3.65(6)
pKa,2 [d] 9.14(6) 0.99614 pKa,2 = 5.2(3) × [xDMSO] + 9.14(6)
pKa,3 [d] 10.93(3) 0.99904 pKa,3 = 6.25(2) × [xDMSO] + 10.93(3)
[a] For the ligand LHx the pKa,i is defined as: pKa,i = -logKa,i and Ka,i = [LHx-i] × [H] ×
[LH(x+1)-i]-1
[b]
Linear regression equation was taken from the program Origin 6.0G. [c]
R is the regression coefficient taken from Origin 6.0G. [d]
The deviations in brackets were taken from the regression equation from Origin 6.0G .
The linear dependence of the pKa value on the molar fraction xDMSO is
good with respect to the linear regression coefficient R. The pKa,1 = 3.65(6) and
pKa,2 = 9.14(6) are in good agreement with those (pKa,1 = 3.7(1) and
pKa,2 = 9.0(1)) reported by S. Steinhauser [40]. The pKa,3 = 10.93(3) is some-
what higher than the one reported by S. Steinhauser pKa,3 = 10.6(1) [40].
With the decrease of the molar fraction of DMSO the pKa values also de-
crease. As a result, the estimated pKa values in pure water are smaller than the
measured pKa values in water/DMSO. This observation is in accordance to the
determination of the pKa values in pure water by U. Heinz and S. Stucky (for-
merly S. Steinhauser) [37, 39-40]. It is known, that DMSO solvates cations better
than anions [124]. S. Stucky has discussed the solvation of different functional
groups according to their charge before and after the deprotonation in pure wa-
ter compared to DMSO, in his doctoral thesis [39]. He has shown that the depro-
tonation of a neutral functional group forming an anion after deprotonation of-
ten causes the pKa values in DMSO solution to rise compared to those in pure

8 Complex formation of magnesium (II), calcium (II) and aluminium (III) with deferasirox in
pure water
178
water. Further, the pKa value is also higher in DMSO when anions are deproto-
nated to a higher negative charge. An explanation for this observation is that
the solvation of anions by DMSO is rather weak causing the proton to be less
acidic.
In conclusion, the pKa values in Table 8.1 measured with the four molar
fractions of DMSO xDMSO = 0.20, 0.18, 0.16 and 0.14 were used for the calcula-
tion of the stability constants of Mg2+, Ca2+ and Al3+ with deferasirox in the par-
ticular molar fraction.

8 Complex formation of magnesium (II), calcium (II) and aluminium (III) with deferasirox in
pure water
179
8.1.2 Investigation of the protonation of deferasirox in acidic solutions
in pure water by spectrophotometric batch titration
The three pKa values assigned to the carboxylic acid and the two hydrox-
yphenyl groups were successfully determined by potentiometric titrations in the
pH range 4 – 12. However, the batch titration in acidic solution with the disul-
fonic acid derivative DSA in section 7.1 has shown that the pKa,2 value is very
acidic 1.33(8) and can be assigned to a protonation of one of the nitrogen at-
oms of the 1,2,4-triazole unit. Accordingly, it should be possible to protonate
the 1,2,4-triazole unit of the ligand deferasirox at one of the nitrogen atoms in
position 2 or 4 in acidic solution as shown in Scheme 8.1. The results present-
ed and discussed in this section have been published in Stucky 2008 [125].
Scheme 8.1: Protonation sites of the 1,2,4-triazole unit of deferasirox in acidic solution.
S. Stucky (formerly S. Steinhauser) reported in his doctoral thesis of a
significant shift of the absorption maximum in the UV-VIS spectra of deferasirox
measured in water/DMSO with a molar fraction of xDMSO = 0.06 in acidic solu-
tions with increasing acidity [39]. This observation is evidence for a protonation
at the 1,2,4-triazole unit in acidic solution. The pKa value for the protonation of
the unsubstituted 1,2,4-triazole as shown in Scheme 8.2 is 2.38(5) (T = 298 K,
I = 0.1 mol/L) [55]. The ligand deferasirox is a 1,2,4-triazole ligand substituted
by two hydroxyphenyl substituents in position 3 and 5 and a benzoic acid moie-

8 Complex formation of magnesium (II), calcium ( II) and aluminium (III) with deferasirox in
pure water
180
ty in position 1. The benzoic acid withdraws electron density from the triazole
ring (-M resonance effect) and will probably cause the pKa value to decrease.
S. Stucky (formerly S. Steinhauser) estimated the pKa to be < 1 due to a
significant shift of the absorption maximum occurring in very acidic HCl
(3.6 mol/L) solution [39].
Scheme 8.2: Deprotonation of the unsubstituted 1,2,4-triazole.
To determine the pKa value estimated < 1 of this deprotonation a pH
range from 0.0 < pH < 2.0 was needed which was implemented by a 1.0 mol/L
HCl/KCl medium with a molar fraction of xDMSO = 0.06. The determination in this
pH range needs to be carried out as a spectrophotometric batch titration.
Further, the pKa value in pure water was of interest. For this reason,
batch titrations with different molar ratios xDMSO = 0.20, 0.18, 0.16, 0.10 and
0.06 were to be performed and an extrapolation to pure water should be calcu-
lated to estimate the pKa value. However, solutions prepared with an ionic
strength of 1.0 mol/L KCl with a high amount of DMSO such as the molar frac-
tions with xDMSO = 0.20 and 0.18 showed crystallization of the KCl. Potassium
chloride is not soluble enough in these molar fractions to keep a 1.0 mol/L KCl
concentration in solution. Consequently, only the molar fractions xDMSO = 0.16,
0.10 and 0.06 were applied for the extrapolation to pure water.
The preparation of the samples was performed differently to the batch t i-
trations described previously. The samples were prepared in 25.0 mL volumet-
ric flasks which were thermostated to T = 298 K. The calculated amount of
1.0 mol/L HCl, with the appropriate molar fraction DMSO, was weighed into the
flask instead of adding it by means of the needed volume. This procedure was
applied to achieve a more precise regulation of the pH values which could only
be calculated and not measured. The ligand deferasirox was added as a pre-

8 Complex formation of magnesium (II), calcium (II) and aluminium (III) with deferasirox in
pure water
181
cise volume with a micropipette. Then the flasks were filled with a 1.0 mol/L
KCl solution with the appropriate molar fraction. The UV-VIS spectra were
evaluated with the program Specfit. The determined pKa values and batch titra-
tion conditions are given in Table 8.3.
Table 8.3: Spectrophotometric batch titration experiments of the ligand deferasirox for the determination of the acidity constants pKa
[a] in acidic water/DMSO solution with three molar
ratios xDMSO. The standard deviation of the value is given in brackets [b]
. The titration condi-tions are given at T = 298 K.
xDMSO 0.16 0.10 0.06
[L]t 40.0 µmol/L 20.0 µmol/L 40.0 µmol/L
pH range 0.10 – 2.00 0.10 – 1.30 0.10 – 2.00
No. of titrations 1 1 2
No. data points 9 8 9
titration volume 25.0 mL 25.0 mL 25.0 mL
titrant and c(HCl) + c(KCl) = 1.0 mol/L
supp. electrolyte
equilibration time 1h 1h 5 min
pKa [b] 0.3(1) 0.5(1) 0.72(4)
σabs [c] 2.8 10-3 1.4 10-3 1.7 10-3
σsquares [c] 8.6 10-3 1.2 10-3 3.2 10-3
[a] For the ligand LHx the pKa,i is defined as: pKa,i = -logKa,i and Ka,i = [LHx-i] × [H] × [LH(x+1)-i]
-1
[b] The deviation given in brackets corresponds to the standard deviation taken from Specfit.
[c] The σabs and σsquares values are taken from Specfit.
The linear dependence of the pKa value on the molar fraction xDMSO was
calculated in form of a linear regression for the given values. The linear regres-
sion and extrapolation to xDMSO = 0.00 is illustrated in Figure 8.3.

8 Complex formation of magnesium (II), calcium (II) and aluminium (III) with deferasirox in
pure water
182
Figure 8.3: Plot of the dependence of the pKa value of deferasirox on the molar fraction xDMSO. Linear regression (solid line) of the pKa values (black squares) listed in Table 8.3 and extrapolation to xDMSO = 0.00.
The estimated pKa values for the ligand deferasirox in pure water, the re-
gression equation and the regression coefficient R are given in Table 8.4.
Table 8.4: Estimated pKa [a]
value of deferasirox in pure water calculated by linear regression of the pKa values measured in three molar fractions and extrapolation to xDMSO = 0.00 (T = 298 K).
[125]
Estimated pKa value of deferasirox in pure water
solvent pure water
titrant and supporting electrolyte c(HCl) + c(KCl) = 1.0 mol/L
xDMSO = 0.00 R [c] regression equation [b]
pKa [d] 0.98(4) 0.99364 pKa = -4.3(9) × [xDMSO] + 0.98(4)
[a] For the ligand LHx the pKa,i is defined as: pKa,i = -logKa,i and Ka,i = [LHx-i] × [H] ×
[LH(x+1)-i]-1
[b]
Linear regression equation was taken from the program Origin 6.0G. [c]
R is the regression coefficient taken from Origin 6.0G. [d]
The deviations in brackets were taken from the regression equation from Origin 6.0G .
0.00 0.05 0.10 0.15
0.2
0.4
0.6
0.8
1.0
molar fraction xDMSO
pK
a

8 Complex formation of magnesium (II), calcium (II) and aluminium (III) with deferasirox in
pure water
183
The estimated pKa value in pure water is 0.98(4) [125]. We note that this
value is higher than the values in the water/DMSO mixtures. The resulting pKa
values decrease with increase of the molar fraction of DMSO. This observation
is contradictory to the determined pKa values in section 8.1.1 by potentiometric
titrations. A possible explanation is associated with the different solvation of
cations and anions in DMSO in contrast to pure water. The protonation of the
1,2,4-triazole unit of deferasirox results in a positive charge at the nitrogen a t-
om. The ligand is now a cation LH4+ in solution which deprotonates to the neu-
tral ligand LH3. Protons are well solvated by DMSO and withdrawn from the
equilibrium. This effect influences the pKa value by increasing the acidity with
the higher molar fraction of DMSO. Additionally, the neutral organic ligand de-
ferasirox resulting from the deprotonation is probably better soluble in DMSO.
S. Stucky has shown, in his doctoral thesis [39], examples of ligand deprotona-
tions from a cation to a neutral ligand with a smaller pKa value in DMSO than in
pure water.
Additionally, U. Heinz has investigated the protonation constants of the
ligand MSA in water/DMSO solution with increasing molar fractions of
DMSO [37]. He found, that the pKa,1 = 1.12(1) of MSA determined in pure water
by spectrophotometric batch titration (T = 298 K, 0.1 mol/L KCl) decreases with
increase of the molar fraction of DMSO in solution. Accordingly, the pKa,1 could
only be determined with the lowest molar fraction xDMSO = 0.06 to a value of
0.9(2). Determination of the pKa,1 in any higher molar fraction resulted in a too
low pKa,1 value which could not be studied in a 0.1 mol/L HCl/KCl medium. This
observation is consistent with the decrease of the pKa in strong acidic solution
for deferasirox by increasing DMSO concentration in this work. As discussed in
section 7.1 the pKa,2 of DSA was assigned to a protonation of the 1,2,4-triazole
unit nitrogen atom. Consequently, the pKa,1 of MSA can most probably also be
assigned to a deprotonation of the 1,2,4-triazole unit. This would explain the
concordant behaviour of both the deferasirox pKa value in acidic solution and
the pKa,1 of MSA decreasing with higher DMSO concentration in contrast to the
hydroxyphenyl pKa values which increase with higher concentration of DMSO.

8 Complex formation of magnesium (II), calcium (II) and aluminium (III) with deferasirox in
pure water
184
The solubility of the LH4+ species in the water/DMSO mixtures plays an
essential role. The measured UV-VIS spectra of the batch titration with a molar
fraction of xDMSO = 0.10 are given in Figure 8.4.
Figure 8.4: UV-VIS spectra of the batch titration of deferasirox collected from pH 0.10 – 1.30 (xDMSO = 0.10, [L]t = 20.0 µmol/L, T = 298 K, I = 1.0 mol/L HCl/KCl).
The individual spectra, of this molar fraction xDMSO = 0.10, of the two de-
ferasirox species LH4+ and LH3 are presented in Figure 8.5.

8 Complex formation of magnesium (II), calcium (II) and aluminium (III) with deferasirox in
pure water
185
Figure 8.5: Individual spectra of the two species LH4
+
and LH3 (L = deferasirox) taken from Specfit (xDMSO = 0.10, T =298 K, I = 1.0 mol/L HCl/KCl).
Usually, the UV-VIS spectra were measured about an hour after prepar-
ing the solutions. However, some of the prepared samples with a molar fraction
of xDMSO = 0.06 showed a decrease of the absorption after about one day which
was attributed to the precipitation of deferasirox due to solubility problems in
the low molar fraction. This observation was investigated by measuring the ab-
sorption at 290 nm as a function of time. The absorption is dependent on the
concentration of the ligand deferasirox in solution. The samples were prepared
with a total ligand concentration of 40.0 µmol/L. The diagram in Figure 8.6 il-
lustrates the absorption A290 measured at 290 nm as a function of time for four
measured pH values pH = 0.26, 0.70, 1.00 and 2.00.
Apparently, in strong acidic solution the absorption remains nearly con-
stant. However, the absorption decreases even more as the pH rises. The pro-
tonated form LH4+ of the ligand is mainly present at pH 0.26 and is responsible
for enhanced solubility in acidic solution. At higher pH the ligand is deprotona t-
ed and precipitates to form solid LH3 after a few days.
240 260 280 300 320 340 360
0.0
5.0x10³
1.0x10⁴
1.5x10⁴
2.0x10⁴
LH3
LH4
+
[(
mol/L)-1
cm
-1]
[nm]

8 Complex formation of magnesium (II), calcium (II) and aluminium (III) with def erasirox in
pure water
186
Figure 8.6: Measured absorption A290 at 290 nm as a function of time for four samples of the batch titration of deferasriox with xDMSO = 0.06 ([L]t = 40.0 µmol/L, T = 298 K, I = 1.0 mol/L HCl/KCl). Squares, circles and triangles represent the experimental data. The solid lines are added only for illustration.
In summary, a further protonation to LH4+ of the ligand deferasirox in
strong acidic solution was elucidated. Related to the weak solubility of defer-
asirox in acidic solution the new pKa value could not be determined directly in
pure water, yet it was estimated to 0.98(4) by extrapolation to pure water. Low
molar fractions of DMSO such as xDMSO = 0.16, 0.10 and 0.06 were chosen to
perform the linear regression and extrapolation. The investigation was restrict-
ed to low molar fractions of DMSO by the solubility of a 1.0 mol/L KCl in the
water/DMSO mixtures. The new pKa value could only be assigned to a protona-
tion of one of the 1,2,4-triazole nitrogen atoms since there is no other function-
al group in deferasirox which could be protonated. The pKa value 0.98(4)
(T = 298 K, I = 1.0 mol/L HCl/KCl) for deferasirox is smaller than the corre-
sponding deprotonation for MSA pKa,1 = 1.12(1) (T = 298 K, I = 0.1 mol/L KCl)
and DSA pKa,2 = 1.33(8) (T = 298 K, I = 0.1 mol/L HCl/KCl) which were deter-
mined in pure water.
0 20 40 60 80 100 120 140 160
0.1
0.2
0.3
0.4
0.5
0.6
pH 2.00
pH 1.00pH 0.70
pH 0.26
t [h]
absorp
tion A
290

8 Complex formation of magnesium (II), calcium (II) and aluminium (III) with deferasirox in
pure water
187
8.1.3 1H-NMR spectroscopic measurements of the ligand deferasirox in
acidic D2O/D6-DMSO solution
The ligand deferasirox was investigated in acidic solution by 1H-NMR
spectroscopy. A NMR-titration experiment was performed in the range
0 ≤ pD ≤ 1. Six samples were prepared according to the procedure described in
section 11.2.5. Small shifts in the expected six NMR signals of the benzocar-
boxylic acid and the two hydroxyphenyl groups were observed, allowing the
calculation of a pKaD value for the protonation of one of the 1,2,4-triazole nitro-
gen atoms with the help of the program NMR-Tit [126]. The results presented
and discussed in this section have been published in Stucky 2008 [125]. The
conditions of the NMR-titration and the determined pKaD value are given in
Table 8.5.
Table 8.5: Determination of the pKaD
[a] value of the system LH4
+/LH3 for the ligand defer-
asirox in acidic D2O-DCl/D6-DMSO solution mixture at T = 294 ±2 K. [125]
pKaD value of deferasirox
measuring method 1H-NMR titration
solvent D2O-DCl/D6-DMSO
molar fraction xDMSO = 0.20
supporting electrolyte none
pD range 0.0 – 1.0
No. of samples 6
pKaD [b] 0.89(2)
[a] For the ligand LH4
+ the pKa
D is defined as: pKa
D = -logKa
D and Ka
D = [LD3] × [D] ×
[LD4]-1
[b]
The pKaD value was calculated with the program NMR-Tit
[126].
The dependence of the measured 1H-NMR resonances on the pD for the
ligand system LH4+/LH3 is illustrated in Figure 8.7.

8 Complex formation of magnesium (II), calcium (II) and aluminium (III) with deferasirox in
pure water
188
Figure 8.7: Shifts of the 1H-NMR resonances dependent on pD for the ligand species
LH4+/LH3 of deferasirox (T = 294 ±2 K, no supporting electrolyte, D2O-DCl/D6-DMSO mixture
with xDMSO = 0.20, TMS = 0 ppm). Squares, triangles and circles represent experimental val-ues, the solid lines were calculated with the program NMR-Tit
[126].
The pKaD = 0.89(2) determined by 1H-NMR-titration with a molar fraction
of xDMSO = 0.20 is smaller than the pKa = 0.98(4) calculated for xDMSO = 0.00 by
spectrophotometric titration in section 8.1.2 [125]. This is in accordance with the
previously discussed solvation differences of anions and cations in DMSO
compared to water. The pKaD value was measured in a water/DMSO medium
with a high molar ratio xDMSO = 0.20 causing it to decrease. However, one
needs to keep in mind that the pKaD value was also measured without support-
ing electrolyte.
In summary, both methods reveal a pKa value < 1 for the protonation of
the 1,2,4-triazole nitrogen atom of the ligand deferasirox in strong acidic solu-
tion.

8 Complex formation of magnesium (II), calcium (II) and aluminium (III) with deferasirox in
pure water
189
8.2 Complex formation of deferasirox with magnesium (II) in
pure water solution
The complex behaviour of Mg2+ with deferasirox in water/DMSO with
xDMSO = 0.20 (T = 298 K, I = 0.1 mol/L KNO3) has been investigated by U.
Heinz in his doctoral thesis with potentiometric titrations [37]. As expected he
found a rather weak complexation of deferasirox with the biometal ion Mg2+.
Attributed to the low solubility of deferasirox in pure water the stability con-
stants with Mg2+ could only be measured in water/DMSO mixtures.
In this study the stability constants of the Mg2+-deferasirox system was
determined with potentiometric titrations (T = 298 K, I = 0.1 mol/L KCl) in wa-
ter/DMSO medium with four molar fractions xDMSO = 0.20, 0.18, 0.16 and 0.14.
These values for the stability constants showed a linear relation and as a result
we could estimate a value for the [Mg(L)] - and the [Mg(L)2]4- complex with de-
ferasirox in pure water. The experiment was limited by the solubility of the
Mg2+-deferasirox complexes. Titration experiments with a molar fraction of
DMSO xDMSO < 0.14 were not performed due to precipitation of deferasirox ow-
ing to its poor solubility. The samples were prepared by the procedure de-
scribed in section 11.2.2 and were left standing over night for equilibration of
the water/DMSO mixture. However, the solutions prepared with a molar
ratio < xDMSO = 0.20 often showed precipitation of the ligand deferasirox over-
night and were discarded. The amount of DMSO seems to be not high enough
to keep the ligand in solution. To circumvent precipitation these flasks were
prepared with a higher pH value by adding a small precise amount of 0.1 mol/L
KOH to the flasks. The added aliquot KOH was taken into account for the eval-
uation. Consequently, the start pH value of the titrations with each molar frac-
tion rises while the pH value at the end of the titration decreases as expected
by lowering the molar fraction of DMSO.
The titration conditions and stability constants for the three complexes
[Mg(L)]- (110), [Mg(L)(LH)]3- (121) and [Mg(L)2]4- (120) are given in Table 8.6.
The logβ110 was well determined in all four molar fractions. Its value decreases
with decreasing the molar fraction xDMSO.

8 Complex formation of magnesium (II), calcium (II) and aluminium (III) with deferasirox in
pure water
190
Table 8.6: Mean values of the overall stability constants logβxyz [a]
with standard deviations [b]
from potentiometric titrations of Mg
2+ with deferasirox in water/DMSO solution with different
molar fractions xDMSO at T =298 K and I = 0.1 mol/L KCl.
xDMSO 0.20 0.18 0.16 0.14
[L]t 0.50 mmol/L 0.50 mmol/L 0.50 mmol/L 0.50 mmol/L
[M]t 0.23 mmol/L 0.23 mmol/L 0.23 mmol/L 0.23 mmol/L
pKw 15.58 15.39 15.20 15.01
pH range 3.3 – 12.2 4.3 – 12.1 4.4 – 12.0 4.8 – 11.8
No. of titrations 4 5 4 6
No. data points 70 70 70 70
time mixing [s] 160 120/160 120 160
σ [c] 0.752 0.436 0.492 0.371
logβ110 7.68(3) 7.41(1) 7.21(2) 6.96(1)
logβ120 11.2(1) 11.25(5) 10.7(1) 10.4(2)
logβ121 22.3(2) 22.5(1) 22.1(3) 21.0(4)
[a] For the ligand L logβxyz is defined as: βxyz = [MxLyHz] × [M]
-x × [L]
-y × [H]
-z.
[b] The σ value is taken from the titration with the highest σ value in Hyperquad2008.
[c] The standard deviations in brackets were calculated with: √
∑ ( )
( ) ; measured value;
mean value; n number of values.
Contrary to our expectations, the logβ120 and logβ121 values for the molar
fraction xDMSO = 0.20 are smaller than expected. The values should increase in
comparison to xDMSO = 0.18, yet they decrease. Yet, all titrations with the molar
fraction xDMSO = 0.20 showed lower values. Further, not all titrations with the
molar fraction xDMSO = 0.20 could be evaluated with the [Mg(L)(LH)]3- complex.
Though excluding the 121 complex from the model did not change the stability
constant for the [Mg(L)2]4- complex. The two stability constants of the
[Mg(L)(LH)]3- and [Mg(L)2]4- complexes with a molar ratio xDMSO = 0.20 deviate

8 Complex formation of magnesium (II), calcium (II) and aluminium (III) with deferasirox in
pure water
191
strongly from the expected values in comparison with the other molar fractions
of DMSO. We have no apparent explanation for this deviation.
Consequently, only the three molar fractions xDMSO < 0.20 were applied
for the linear regression of the stability constants of the [Mg(L)2]4- complex. The
linear regression calculated from the stability constants in Table 8.6 for the
[Mg(L)]- and the [Mg(L)2]4- complex and the extrapolation to xDMSO = 0.00 is
presented in Figure 8.8.
Figure 8.8: Dependence of the overall stability constants logβxyz of the [Mg(L)]- and [Mg(L2)]
4-
complexes on the molar fraction xDMSO. Linear regression (solid line) of the mean logβxyz val-ues (black squares) listed in Table 8.1 and extrapolation to xDMSO = 0.00. The red circles indi-cate the extrapolated values at xDMSO = 0.00.
The stability constants of the two complexes estimated for pure water are
highlighted with red circles. The estimated stability constants and correspond-
ing regression equations and R values for the [Mg(L)]- and the [Mg(L)2]4- com-
plex are presented in Table 8.7. The stability constant of the [Mg(L)] - complex
is estimated to logβ110 = 5.31(8) with a good R value. Whereas, the R value of
the calculated regression equation for the [Mg(L)2]4- complex is not as good
due to only three values being applied for the linear regression.
0.00 0.04 0.08 0.12 0.16 0.20
5
6
7
8
9
10
11
12
log110
log120
log
xyz
molar fraction xDMSO

8 Complex formation of magnesium (II), calcium (II) and aluminium (III) with deferasirox in
pure water
192
Table 8.7: Estimated logβxyz [a]
values of Mg2+
-deferasirox in pure water calculated by linear regression of the logβxyz values measured in three (120 complex) and four (110 complex) molar fractions and extrapolation to xDMSO = 0.00 (T = 298 K).
Estimated logβxyz [a] values for Mg2+-deferasirox in pure water
solvent pure water
supporting electrolyte 0.1 mol/L KCl
xDMSO = 0.00 R [c] regression equation [b]
logβ110 [d] 5.31(8) 0.99853 logβ110 = 11.8(5) × [xDMSO] + 5.31(8)
logβ120 [d] 7.4(6) 0.98589 logβ120 = 21.3(36) × [xDMSO] + 7.4(6)
[a] For the ligand L logβxyz is defined as: βxyz = [MxLyHz] × [M]
-x × [L]
-y × [H]
-z.
[b] Linear regression equation was taken from the program Origin 6.0G.
[c] R is the regression coefficient taken from Origin 6.0G.
[d] The deviations in brackets were taken from the regression equation from Origin 6.0G .
In conclusion, the stability constants of the [Mg(L)] - and the [Mg(L)2]4-
complex were estimated by linear regression and extrapolation. Complex for-
mation of deferasirox with Mg2+ begins in alkaline solution but is rather weak.
Therefore, the stability constant of the 120 complex was more difficult to de-
termine than the one for the 110 complex. The rather weak formation of the
[Mg(L)2]4- complex with an individual stability constant of logK120 = 2.1 (logK120
= [ML2] / [ML] × [L]) in pure water renders the determination difficult.

8 Complex formation of magnesium (II), calcium (II) and aluminium (III) with deferasirox in
pure water
193
8.3 Complex formation of deferasirox with calcium (II) in pure
water solution
The first determination of the stability constants of deferasirox with Ca 2+
by potentiometric titration experiments (xDMSO = 0.20, T = 298 K, I = 0.1 mol/L
KNO3) were performed by U. Heinz, in his doctoral thesis [37]. He reports that
the complex formation of the Ca2+-deferasirox system is even weaker than the
Mg2+ complexes with deferasirox. To estimate the stability constants of the
Ca2+-deferasirox system in pure water we further investigated the complex for-
mation with potentiometric titrations (T = 298 K, I = 0.1 mol/L KCl) in four molar
ratios xDMSO = 0.20, 0.18, 0.16 and 0.14.
Accordingly, in this study the complex formation of Ca2+ with deferasirox
begins in strong alkaline solution. However, the evaluation of the titration ex-
periments resulted in two complexes a [Ca(L)] - and a [Ca(L)2]4- complex. The
stability constant of the [Ca(L)2]4- complex estimated by extrapolation to pure
water (xDMSO = 0.00) however adopted a higher logK120 value (of ≈ 4,
logK120 = [ML2] / [ML] × [L]) than the estimated value logβ110 = 3.3 for the
[Ca(L)]- complex in pure water. All investigations of the complexation of the lig-
and deferasirox with metal ions in the past have shown that the 120 complex is
less stable than the 110 complex owing to steric and statistic effects. We could
not find any reason why the [Ca(L)2]4- complex in pure water should be more
stable than the [Ca(L)] - complex. The rather weak complexation of the Ca2+-
deferasirox system is evident in the low pH decrease of the titration curve in
comparison to the ligand pKa titrations curve. Yet, in strong alkaline solution
above pH 11 a further significant pH decrease is detected in all titrations. We
assume this pH decrease is an artefact caused by some other reaction, maybe
due to carbon dioxide in alkaline solution, rather than complex formation. Con-
sequently, we only used the titration curve prior to pH 11.5 for evaluation where
a pH decrease was detected and assigned to the formation of the [Ca(L)] - com-
plex.
The titration conditions and stability constant of the [Ca(L)] - complex are
presented in Table 8.8. The titrations with a molar fraction xDMSO < 0.20
showed precipitation after preparation and standing overnight. To prevent the

8 Complex formation of magnesium (II), calcium (II) and aluminium (III) with deferasirox in
pure water
194
ligand from precipitating from the samples with a lower molar fraction a precise
volume of 0.1 mol/L KOH was added to raise the pH. Accordingly, the start pH
of each molar fraction rises with decrease of the molar fraction xDMSO. The add-
ed aliquot KOH was taken into account for the evaluation.
Table 8.8: Mean values of the overall stability constants logβxyz [a]
with standard deviations [b]
from potentiometric titrations of Ca
2+ with deferasirox in water/DMSO solution with different
molar fractions xDMSO at T = 298 K and I = 0.1 mol/L KCl.
xDMSO 0.20 0.18 0.16 0.14
[L]t 0.50 mmol/L 0.50 mmol/L 0.50 mmol/L 0.50 mmol/L
[M]t 0.23 mmol/L 0.23 mmol/L 0.23 mmol/L 0.23 mmol/L
pKw 15.58 15.39 15.20 15.01
pH range 3.0 – 10.9 3.8 – 10.9 4.4 – 11.2 4.7 – 10.8
No. of titrations 8 6 6 6
No. data points 37 29/40 35 35
time mixing [s] 120 120 120 120
σ [c] 1.256 0.590 0.614 0.490
logβ110 5.62(2) 5.36(3) 5.16(1) 4.91(1)
[a] For the ligand L logβxyz is defined as: βxyz = [MxLyHz] × [M]
-x × [L]
-y × [H]
-z.
[b] The σ value is taken from the titration with the highest σ value in Hyperquad2008.
[c] The standard deviations in brackets were calculated with: √
∑ ( )
( ) ; measured value;
mean value; n number of values.
As observed for the stability constants of the Mg2+-deferasirox system,
the stability constants determined for the [Ca(L)] - complex decrease with de-
creasing molar fraction of DMSO. The linear dependence of the overall stability
constant logβ110 on the molar fraction is illustrated in Figure 8.9. The red circle
indicates the estimated logβ110 value for pure water.

8 Complex formation of magnesium (II), calcium (II) and aluminium (III) with deferasirox in
pure water
195
Figure 8.9: Dependence of the overall stability constants logβxyz of the [Ca(L)]- complex on
the molar fraction xDMSO. Linear regression (solid line) of the mean logβxyz values (black squares) listed in Table 8.8 and extrapolation to xDMSO = 0.00. The red circles indicate the extrapolated values at xDMSO = 0.00.
Based on the plot in Figure 8.9 the linear regression was calculated. The
regression equation and regression coefficient R are given together with the
estimated logβ110 value for the [Ca(L)] - complex for pure water in Table 8.9.
The regression coefficient R reflects the good agreement of the linear depend-
ence between the logβ110 value and the molar fractions xDMSO. The estimated
logβ110 value for the [Ca(L)] - complex is 3.28(7) in pure water. As U. Heinz pre-
viously reported the complex formation of Ca2+ with deferasirox is very weak
which is obviously also reflected in the low stability constant estimated for pure
water.
0.00 0.04 0.08 0.12 0.16 0.20
3.0
3.5
4.0
4.5
5.0
5.5
6.0
log110
log
xyz
molar fraction xDMSO

8 Complex formation of magnesium (II), calcium ( II) and aluminium (III) with deferasirox in
pure water
196
Table 8.9: Estimated logβxyz [a]
values of Ca2+
-deferasirox in pure water calculated by linear regression of the logβxyz values measured in four molar fractions and extrapolation to xDMSO = 0.00 (T = 298 K).
Estimated logβxyz [a] values for Ca2+-deferasirox in pure water
solvent pure water
supporting electrolyte 0.1 mol/L KCl
xDMSO = 0.00 R [c] regression equation [b]
logβ110 [d] 3.28(7) 0.99884 logβ110 = 11.7(4) × [xDMSO] + 3.28(7)
[a] For the ligand L logβxyz is defined as: βxyz = [MxLyHz] × [M]
-x × [L]
-y × [H]
-z.
[b] Linear regression equation was taken from the program Origin 6.0G.
[c] R is the regression coefficient taken from Origin 6.0G.
[d] The deviations in brackets were taken from the regression equation from Origin 6.0G .
Taken together, the stability constant of the [Ca(L)] - complex has been
estimated in pure water. In accordance with the study by U. Heinz, a [Ca(L)2]4-
complex was not determined with the applied potentiometric titration exper i-
ments.

8 Complex formation of magnesium (II), calcium (II) and aluminium (III) with deferasirox in
pure water
197
8.4 Complex formation of deferasirox with aluminium (III) in
pure water solution
The complex formation of Al3+ with deferasirox reveals a strong affinity of
the ligand for the trivalent metal ion. The complex formation was first studied
by potentiometric titrations in water/DMSO solution with a molar fraction
xDMSO = 0.20 (T = 298 K, I = 0.1 mol/L KNO3) by U. Heinz in his doctoral the-
sis [37]. A strong pH decrease of the Al3+-deferasirox titration curve in compari-
son to the pKa titration curve displayed the strong complex formation.
In accordance with the previously discussed results for Mg 2+ and Ca2+ we
examined the complex formation of the Al3+-deferasirox system by potentiom-
etric titrations (T = 298 K, I = 0.1 mol/L KCl) with water/DMSO mixtures with
four molar fractions xDMSO = 0.20, 0.18, 0.16 and 0.14. Of special interest were
the [Al(L)] (110) and [Al(L)2]3- (120) complexes with the ligand deferasirox. The
stability constants determined by potentiometric titrations with different molar
fractions showed a roughly linear relation which was extrapolated to
xDMSO = 0.00 to estimate the value for the stability constants of the two com-
plexes [Al(L)] and [Al(L)2]3- in pure water.
The solubility of the ligand deferasirox in pure water increases with in-
creasing pH. The ligand precipitated from the samples prepared with a molar
fraction of DMSO < 0.20 after preparation and standing over night. These molar
fractions seem to have not enough DMSO to keep the ligand and its complexes
entirely in solution. To prevent precipitation in these samples a precise volume
of 0.1 mol/L KOH was added to the flasks with xDMSO < 0.20 to raise the pH.
The added aliquot KOH was taken into account for the evaluation.
The titration conditions and mean values of the overall stability constants
are given in Table 8.10. The titrations with a molar fraction xDMSO = 0.20 were
performed without any difficulties. They were evaluated with the program
Hyperquad2008 without problems. As the molar fraction was decreased to
xDMSO = 0.18 and 0.16 the stability constants of the single titrations varied
stronger than for xDMSO = 0.20. Despite of the higher variance of the single titra-
tions, the evaluations with Hyperquad2008 were still good. Yet, as a result, the
mean values can only be determined to one decimal point.

8 Complex formation of magnesium (II), calcium (II) and aluminium (III) with deferasirox in
pure water
198
Table 8.10: Mean values of the overall stability constants logβxyz [a]
with the standard devia-tions
[b] from potentiometric titrations of Al
3+ with deferasirox in water/DMSO solution with dif-
ferent molar fractions xDMSO at T = 298 K and I = 0.1 mol/L KCl.
xDMSO 0.20 0.18 0.16 0.14
[L]t in mmol/L 0.50 0.50 0. 0.50
[M]t in mmol/L 0.25 0.24/0.25 0.24/0.25 0.24/0.25
pKw 15.58 15.39 15.20 15.01
pH range 3.0 – 6.5 3.3 – 6.3 3.3 – 6.3 3.3 – 10.8
No. of titrations 6 6 4 -
No. data points 63 69 72 63
time mixing [s] 1200 1200 1200 1200
σ [c] 0.648 0.349 0.329 -
logβ110 20.14(9) 19.7(1) 19.3(2) -
logβ111 24.29(4) 23.9(1) 23.5(1) -
logβ120 35.0(1) 34.3(2) 33.8(4) -
logβ121 40.3(2) 39.7(1) 39.2(6) -
logβ122 46.1(1) 45.3(2) 44.7(6) -
[a] For the ligand L logβxyz is defined as: βxyz = [MxLyHz] × [M]
-x × [L]
-y × [H]
-z.
[b] The σ value is taken from the titration with the highest σ value in Hyperquad2008.
[c] The standard deviations in brackets were calculated with: √
∑ ( )
( ) ; measured value;
mean value; n number of values.
In contrast to the prior molar fractions the titration experiments performed
with a molar fraction xDMSO = 0.14 showed precipitation already during the first
20 titration points. The greyish-white precipitate dissolved again in alkaline so-
lution leaving a clear solution at the end of the titration. As the titration pro-
ceeds to higher pH the neutral [Al(L)] complex is increasingly being formed. We
assume this complex is not sufficiently soluble in water and precipitates when

8 Complex formation of magnesium (II), calcium (II) and aluminium (III) with deferasirox in
pure water
199
the DMSO concentration in solution is reduced to xDMSO = 0.14. In alkaline solu-
tion the concentration of the [Al(L)] complex decreases and the [Al(L)2]3- com-
plex becomes the dominant species in solution. The [Al(L) 2]3- complex is pre-
sumably much better soluble in water. As a consequence, a clear solution is
observed at the end of the titration at pH 10.8.
Accordingly, the stability constants of the [Al(L)] and [Al(L)2]3- complexes
determined with the three molar fractions xDMSO = 0.20, 0.18 and 0.16 were ap-
plied for the linear regression and extrapolation to pure water as illustrated in
Figure 8.10.
Figure 8.10: Dependence of the overall stability constants logβxyz of the [Al(L)] and [Al(L)2]3-
complex on the molar fraction xDMSO. Linear regression (solid line) of the mean logβxyz values (black squares) listed in Table 8.8 and extrapolation to xDMSO = 0.00. The red circles indicate the extrapolated values at xDMSO = 0.00.
The linear regression equations, regression coefficients R and the stabil-
ity constants for all complexes calculated by extrapolation of the linear regres-
sion to xDMSO = 0.00 are given in Table 8.11.
0.00 0.04 0.08 0.12 0.16 0.20
16
18
20
26
28
30
32
34
36
log110
log120
log
xyz
molar fraction xDMSO

8 Complex formation of magnesium (II), calcium (II) and aluminium (III) with deferasirox in
pure water
200
Table 8.11: Estimated logβxyz [a]
values of Al3+
with deferasirox in pure water calculated by linear regression of the logβxyz values measured in three molar fractions and extrapolation to xDMSO = 0.00 (T = 298 K).
Estimated logβxyz [a] values for Al3+-deferasirox in pure water
solvent pure water
supporting electrolyte 0.1 mol/L KCl
xDMSO = 0.00 R [c] regression equation [b]
logβ110 [d] 15.9(1) 0.99962 logβ110 = 21.0(6) × [xDMSO] + 15.9(1)
logβ111 [d] 20.34(3) 0.99997 logβ111 = 19.8(1) × [xDMSO] + 20.34(3)
logβ120 [d] 29.0(5) 0.99540 logβ120 = 30.0(29) × [xDMSO] + 29.0(5)
logβ121 [d] 34.8(3) 0.99863 logβ121 = 27.5(14) × [xDMSO] + 34.8(3)
logβ122 [d] 39.1(5) 0.99662 logβ122 = 35.0(29) × [xDMSO] + 39.1(5)
[a] For the ligand L logβxyz is defined as: βxyz = [MxLyHz] × [M]
-x × [L]
-y × [H]
-z.
[b] Linear regression equation was taken from the program Origin 6.0G.
[c] R is the regression coefficient taken from Origin 6.0G.
[d] The deviations in brackets were taken from the regression equation from Origin 6.0G .
The stability constants of the complexes formed by the Al 3+-deferasirox
system have been investigated with three molar ratios xDMSO = 0.20, 0.18 and
0.16. By extrapolation of the linear regression the stability constants of the
complexes were estimated in pure water. The overall stability constants of the
[Al(L)] complex logβ110 = 15.9(1) and of the [Al(L)2]3- complex logβ120 = 29.0(5)
were of special interest.

9 Interaction of deferasirox, MSA and DSA with gadolinium (III) and gallium (III) in contrast
agents
201
9 Interaction of deferasirox, MSA and DSA with
gadolinium (III) and gallium (III) in contrast agents
9.1 Complex formation of deferasirox and its water soluble
derivatives with gadolinium (III)
Gadolinium (III) is one of the most widely used metal ions in paramagnet-
ic complexes for magnetic resonance imaging (MRI) in clinical practice. The
technique of MRI is applied for visualising the soft tissues for diagnostic pur-
poses [127]. The images are generated by the lipid and water protons in the tis-
sue of a patient introduced into a magnetic field [127-128]. To receive a good im-
age contrast the relaxation time T1 and T2 of the different tissues are of im-
portance as well as the proton density [127]. Tissue types vary in their relaxation
properties, which in fact is used by MRI to reconstruct images of organ struc-
tures [129]. To improve image contrast, T1-agents such as gadolinium (III) com-
pounds have been introduced [130]. These contrast agents are paramagnetic
ions that decrease the proton relaxation time of bound water molecules en-
hancing the contrast of the images [129]. As a result, the dipolar interaction be-
tween the water molecule protons and the unpaired electrons of the metal ion
is responsible for the paramagnetic efficacy [127].
The interest in the trivalent lanthanide ion Gd3+ is due to its seven un-
paired electrons promising a strong paramagnetic character [127]. It is the lan-
thanide with the largest number of unpaired electrons. Further, it has a relative-
ly long electronic relaxation time [128]. Yet, gadolinium (III) is very toxic and
needs to be strongly bound to a chelating agent to avoid toxicity in the human
body [131]. The two ligands DOTA (2,2’,2’’,2’’’-(1,4,7,10-tetraazacyclododecane-
1,4,7,10-tetrayl)-tetraacetic acid) and DTPA (diethylenetriaminepentaacetic ac-
id) are commonly used as Gd3+ complexes in contrast agents. The structures of
the ligands are given in Figure 9.1.

9 Interaction of deferasirox, MSA and DSA with gadolinium (III) and gallium (III) in c ontrast
agents
202
Figure 9.1: Structures of the Gd3+
complexing agents DOTA and DTPA.
These ligands are examples of two classes of complexing agents. DOTA
is a macrocyclic ligand and DTPA has an acyclic structure. The ligand classes
are further differentiated by charge: ionic or neutral complexes. The contrast
agent Gd-DOTA known by the trade mark Dotarem® (Guerbet, France) and Gd-
DTPA by the trade mark Magnevist® (Bayer Schering, Germany) are commonly
used contrast agents applied in clinical practice [131]. Both ligands are octaden-
tate ligands and therefore occupy eight coordination sites of the Gd3+ ion leav-
ing one coordination site for the necessary coordinating water molecule. Cur-
rently there are 8 approved gadolinium (III) based MRI contrast agents com-
mercially available. Two are derivatives of DOTA and four other Gd3+-
complexes are derivatives of DTPA [129]. All Gd3+-complexes have high thermo-
dynamic stability constants, however the macrocyclic complexes such as DOTA
are more stable than the acyclic [132]. At physiological pH 7.4 the ionic com-
plexes are more stable than the neutral complexes [127]. The stability of the
complexes is of great importance since the free metal ion Gd 3+ and the free
ligand DOTA are both very toxic [127]. The toxicity is attributed for example to
the similar ionic radii of Gd3+ r = 1.107 Å (CN 9) [118] and Ca2+ r = 1.18 Å
(CN 9) [118]. As a consequence, free gadolinium (III) can interfere with calcium
(II) mediated processes in the human body [132]. The Gd-DOTA and Gd-DTPA
complexes are very stable and are excreted unaltered [130]. However, there are
discussions about the possibility of transmetallation of Gd 3+-complexes in the
human body for example by zinc (II) [133], copper (II), calcium (II) and
iron(II/III) [132].

9 Interaction of deferasirox, MSA and DSA with gadolinium (III) and gallium (III) in contrast
agents
203
In general, Gd-DOTA and Gd-DTPA are called “non-specific” compounds
as they are very hydrophilic, they do not bind to proteins or receptors and are
excreted unmetabolized in urine [127]. These contrast agents are considered as
extracellular fluid markers, meaning they distribute nonspecifically throughout
the plasma and interstitial space of the body (space that surrounds the cells of
a given tissue) [130]. Gadolinium (III) complexes do not diffuse through plasma
membranes and are therefore unable to cross the intact blood-brain-
barrier [132]. An application resulting from this is the detection of tumours in the
brain [130].
There are an increasing number of reports on the development of con-
trast agents for specific applications [129]. Most of these new compounds are
macromolecules binding the known mononuclear complexes such as Gd-DTPA
or Gd-DOTA. For instance the targeting of tumours by gadolinium(III)-
conjugated dendrimer nanoclusters (Gd-DTPA based) [134] or cell imaging with
the help of cyclodextrin-based bimodal fluorescence/MRI contrast agents (Gd-
DOTA based) [135].
Our interest was to provide an insight into a possible simultaneous ad-
ministration of a gadolinium (III) containing MRI contrast agent with the iron-
chelating ligand deferasirox. The question we asked ourselves is how strong
are the complexes formed by Gd3+ with deferasirox and could deferasirox pre-
fer complexation with Gd3+ vs. Fe3+?
In this study we investigated the complex formation of deferasirox with
gadolinium (III) with potentiometric titrations in a water/DMSO solution mixture.
Unexpectedly, the titration experiments were hampered by precipitation. On
account of these difficulties we also investigated the complex formation of the
water soluble derivatives MSA and DSA to elucidate the complex formation of
this ligand class in pure water. With these water soluble ligands no precipita-
tion occurred during the titration experiments and stability constants were de-
termined for the Gd3+ complexes.

9 Interaction of deferasirox, MSA and DSA with gadolinium (III) and gallium (III) in contrast
agents
204
9.1.1 Complex formation of deferasirox with gadolinium (III) in
water/DMSO solution xDMSO = 0.20
On account of the low solubility of deferasirox in pure water solution the
potentiometric titration experiments needed to be performed in a water/DMSO
mixture with a molar fraction of xDMSO = 0.20. Unfortunately, greyish-white pre-
cipitation occurred during the ti tration experiment in the pH range from about
4 – 8. As a result, the main titration range including the physiological pH 7.4
could not be investigated. To receive at least little information about the com-
plex formation of deferasirox with Gd3+ we carried out acidimetric titrations with
0.1 mol/L HCl (containing xDMSO = 0.20) in the pH range 12.5 – 9. Yet, we could
not find a proper species model to evaluate these titrations, which is not sur-
prising. Usually, in alkaline solution the bis-complexes [M(LH)2]-, [M(L)(LH)]2- or
[M(L)2]3- are formed for trivalent metal ions, as observed for the Al3+- and Fe3+-
deferasirox system [37, 39]. To determine the overall stability constants with aci-
dimetric titrations we need a known stability constant in alkaline solution, for
example of a soluble hydroxo complex, as known value. For the metal ion Gd3+
we do not know any soluble hydroxo complexes in water/DMSO solution. This
implicates a nearly impossible determination of the stability constants, with po-
tentiometric titrations, of the bis-complexes because they have presumably al-
ready sufficiently been formed in alkaline solution.
The investigation of the acidic pH range from 3.1 – 4.6 was very difficult
leaving only one pH unit for evaluation. However, evaluation of a titration ex-
periment performed with the conditions described in Table 9.1 resulted in a
model with two complexes [Gd(LH)]+ (111) and [Gd(LH2)]2+ (122) calculated
with Hyperquad2008. These stability constants given in Table 9.1 should be
regarded as roughly determined values since the pH range was only one unit.
Unfortunately, the [Gd(L)] complex which would have been of special interest
was not determined. The pH range was assumingly to acidic. We suppose that
the uncharged mononuclear complex [Gd(L)] might be less soluble in solution
and could be the cause for precipitation throughout the pH range. Yet, we have
no evidence for this proposal since the analysis of the precipitate was not suc-
cessful.

9 Interaction of deferasirox, MSA and DSA with gadolinium (III) and gallium (III) in contrast
agents
205
Table 9.1: Titration experiment in acidic solution with Gd3+
and deferasirox. Titration condi-tions and the overall protonation constants logβx
[a] used for the evaluation with Hyper-
quad2008 are given as well as the overall stability constants logβxyz [b]
at T = 298 K.
Gd3+-deferasirox titration in acidic solution
molar ratio of M:L 1:2
measuring method potentiometric
method type continuous
solvent water/DMSO xDMSO = 0.20
[M]t 0.50 mmol/L
[L]t 1.00 mmol/L
titration volume 50.0 mL
titrant 0.1 mol/L KOH/DMSO
supporting electrolyte 0.1 mol/L KCl/DMSO
electrode Möller
pKW 15.59
pH range 3.1 – 4.6
volume of data points 30
time for mixing process 500 s
logβx [d] logβ1 = 12.18(2) logβ2 = 22.36(3) logβ3 = 27.00(3)
σ [c] 0.239
logβ111 [d] 19.4(3)
logβ112 [d] 25.05(4)
[a] For the ligand L logβx is defined as: βx = [LHx] × [L]
-1× [H]
-x.
[b] For the ligand L logβxyz is defined as: βxyz = [MxLyHz] × [M]
-x × [L]
-y × [H]
-z.
[c] The σ value is taken from Hyperquad2008.
[d] The deviations given in brackets correspond to the threefold standard deviation tak-
en from Hyperquad2008.

9 Interaction of deferasirox, MSA and DSA with gadolinium (III) and gallium (III) in contrast
agents
206
In conclusion, the two protonated complexes [Gd(LH)]+ and [Gd(LH2)]2+
are formed to less than 20% and the stability constants should be considered
as only roughly determined and judged critically.
9.1.2 Complex formation of MSA with gadolinium (III) and determination
of the pKa values of MSA in pure water
On account of the difficulties with precipitation during titration experi-
ments with the Gd3+-deferasirox system we employed the water soluble deriva-
tive MSA to elucidate the complex behaviour of this class of hydroxyphenyl -
1,2,4-triazole ligands with Gd3+. With the help of water soluble derivatives we
have the opportunity to determine stability constants with Gd 3+ in pure water.
No precipitation was observed during the potentiometric titration experiments
with Gd3+ and MSA. Consequently, the entire pH range was investigated with
potentiometric titrations in three molar ratios Gd3+:MSA 1:2, 1:3 and 1:5. Gado-
linium (III) has the tendency to form complexes not only with the coordination
number six but also with eight or nine. By providing excess ligand in titration
experiments we investigated whether only two ligands are bound to one Gd3+
central ion or if a third ligand can be bound.
Essential for the evaluation of the stability constants of the Gd3+-MSA
system are the pKa values of the ligand MSA (previously determined by U.
Heinz [37, 40]). However, we decided to determine the pKa values by potentiom-
etric titrations due to the application of a new pH electrode (Ross Ultra). Ac-
cordingly, all potentiometric studies of MSA have been performed with this pH
electrode. The pKa,1 for MSA has been determined by U. Heinz with a discon-
tinuous spectrophotometric batch titration [37]. This value was used for our
evaluations and was not redetermined. The pKa values of MSA used for all cal-
culations with Hyperquad2008 are presented in Table 9.2.
The determined pKa values for MSA are in good agreement with those
determined previously. The pKa,2 = 8.75(5) is very close to the previously pub-
lished pKa,2 = 8.74(1) [40] and the pKa,3 = 10.75(7) is also in the same range as
the pKa,3 = 10.63(1) [40].

9 Interaction of deferasirox, MSA and DSA with gadolinium (III) and gallium (III) in contr ast
agents
207
Table 9.2: Mean values of the overall protonation constants logβx [a]
and acidity constants pKa,i
[b] for the ligand MSA in pure water, T = 298 K and I = 0.1 mol/L KCl.
logβ and pKa values of MSA
measuring method potentiometric
method type continuous
solvent pure water
[L]t 0.50 mmol/L
[H]t 1.50 mmol/L
titration volume 50.0 mL
titrant 0.1 mol/L KOH
supporting electrolyte 0.1 mol/L KCl
electrode Ross Ultra
pKW 13.78
pH range 3.3 – 10.7
volume of data points 100
time for mixing process 120 s
mean values and standard deviations [c] from 7 titrations
logβ1 [c] 10.75(7) pKa,1 [d] 1.12(4)
logβ2 [c] 19.50(7) pKa,2 [c] 8.75(5)
logβ3 [d] 20.62(4) pKa,3 [c] 10.75(7)
[a] For the ligand L logβx is defined as: βx = [LHx] × [L]
-1× [H]
-x.
[b] For the ligand LHx the pKa,i is defined as: pKa,i = -logKa,i and Ka,i = [LHx-i] × [H] ×
[LH(x+1)-i]-1
.
[c] The standard deviations in brackets were calculated with: √
∑ ( )
( ) ; measured
value; mean value; n number of values. [d]
Value taken from doctoral thesis of U. Heinz [37]
.

9 Interaction of deferasirox, MSA and DSA with gadolinium (III) and gallium (III) in contrast
agents
208
The titrations of MSA were performed with slightly lower concentrations
than the titrations with DSA which is associated with the lower solubility
(0.7 g/L [37]) of MSA in pure water. Titrations with a total ligand concentration of
1.00 mmol/L were performed for a better comparison of the titration curves, yet
at lower concentration the ligand was easier to solubilize. The applied titration
conditions for all three molar ratios are given in Table 9.3.
Table 9.3: Titration experiment conditions of the complexation of Gd3+
with MSA given at
T = 298 K.
Conditions for the Gd3+-MSA titrations
molar ratio of M:L 1:2 1:3 1:5
measuring method potentiometric potentiometric potentiometric
method type continuous continuous continuous
solvent pure water pure water pure water
[M]t 0.25 mmol/L 0.25 mmol/L 0.20 mmol/L
[L]t 0.50 mmol/L 0.75 mmol/L 1.00 mmol/L
titration volume 50.0 mL 50.0 mL 50.0 mL
titrant 0.1 mol/L KOH 0.1 mol/L KOH 0.1 mol/L KOH
supporting electrolyte 0.1 mol/L KCl 0.1 mol/L KCl 0.1 mol/L KCl
electrode Ross Ultra Ross Ultra Ross Ultra
pKW 13.78 13.78 13.78
pH range 3.1 – 10.7 2.9 – 11.0 2.9 – 9.5
volume of data points 80 48 73
time for mixing process 360 s 380 s 550 s

9 Interaction of deferasirox, MSA and DSA with gadolinium (III) and gallium (III) in contrast
agents
209
Three individual titrations were performed for each of the three molar ra-
tios and evaluated simultaneously with the program Hyperquad2008. Interest-
ingly, we found two species models which both deliver a good σ value. The
stability constants calculated for both models are summarized in Table 9.4.
Table 9.4: Mean values of the overall stability constants logβxyz [a]
from potentiometric titra-tions of Gd
3+ with MSA determined by simultaneous evaluation with Hyperquad2008 in pure
water, T = 298 K and I = 0.1 mol/L KCl.
logβ values for the complexation of Gd3+:MSA
three 1:2 titrations three 1:3 titrations three 1:5 titrations
mean values by simultaneous evaluation of 9 titrations [b]
model 1 model 2
σ [c] 1.161 σ [c] 1.210
logβ110 10.38(3) logβ110 10.36(5)
logβ111 16.0(2) logβ122 32.1(5)
logβ120 18.9(3) logβ120 18.85(3)
logβ121 25.8(1) logβ121 25.6(1)
[a] For the ligand L logβxyz is defined as: βxyz = [MxLyHz] × [M]
-x × [L]
-y × [H]
-z.
[b] The titrations were evaluated simultaneously with the program Hyperquad2008. The
deviations given in brackets correspond to the threefold standard deviation taken from Hyperquad2008. [c]
The σ value is taken from Hyperquad2008.
The evaluation of the titration experiments did not result in one distinct
species model as we had expected. Instead, we were able to calculate two
quite similar species models. Both model 1 and model 2 comprehend a [Gd(L)]
(110), a [Gd(L)2]3- (120) and a [Gd(L)(LH)]2- (121) complex. The models differ-
entiate by a [Gd(LH)]+ (111) complex for model 1 and a [Gd(LH)2]- (122) com-
plex for model 2. An evaluation of the titrations with both a 111 and a 122 com-
plex was not possible. The σ value of the model 1 is slightly smaller which im-
plies a somewhat more suitable fit calculated with these stability constants. A

9 Interaction of deferasirox, MSA and DSA with gadolinium (III) and gallium (III) in contrast
agents
210
[Gd(L)3]6- (130) complex could be calculated with both models resulted in a
formation of the complex to less than 1% and was discarded.
The complex formation of the trivalent metal ions Fe3+ and Al3+ with the
ligand MSA has been investigated previously in pure water (T = 298 K,
I = 0.1 mol/L KCl) [37]. The complexes found in solution were a 110, 120 and
121 complex for Fe3+ with MSA and a 110 and 120 complex for Al3+ with MSA.
Thus a 111 and a 122 complex is not favoured by these trivalent metal ions. It
might be though that these protonated complexes are favoured by the some-
what larger Gd3+ ion which has an ionic radius of 0.938 Å (CN 6) in comparison
to Fe3+ with 0.645 Å (CN 6) and Al3+ 0.535 Å (CN 6) [118]. Structure suggestions
for the possible complexes found in both models are illustrated in Scheme 9.1.
The pKa,1 = 1.12(4) of the ligand MSA is very acidic and causes deprotonation
already in acidic solution. This protonation will not play any role in protonated
species of the Gd3+-MSA complexes. As a consequence, protonated species
such as a 111, 121 and 122 complex are most probably protonated at one of
the phenolate groups.
Scheme 9.1: Suggested coordination geometries of the MSA complexes [Gd(L)] (110), [Gd(LH)]
+ (111), [Gd(L)2]
3- (120), [Gd(L)(LH)]
2- (121) and [Gd(LH)2]
- (122).

9 Interaction of deferasirox, MSA and DSA with gadolinium (III) and gallium (III) in contrast
agents
211
The protonated ligand MSA coordinates bidentate with the phenolate
group and the triazole nitrogen atom in position 4. The hydroxyphenyl group
can form hydrogen bonding interactions with the triazole nitrogen in position 2
which gives rise to the structure suggestions in Scheme 9.1. The ligand can
coordinate bidentate in all three protonated complexes 111, 121 and 122.
The titration curves of all three molar ratios are depicted in Figure 9.2.
The inflection at one equivalent is caused by the deprotonation of the very
acidic proton with a pKa,1 = 1.12(4). After this inflection a significant pH de-
crease is observed in comparison to the pKa titration curve of the ligand MSA.
The titration curves were all obtained with a total ligand concentration of
1.00 mmol/L for comparison.
Figure 9.2: Potentiometric titration curves of the free ligand MSA and Gd3+
with MSA with the molar ratio 1:2 ([Gd
3+]t = 0.50 mmol/L, [L] t = 1.00 mmol/L), 1:3 ([Gd
3+]t = 0.33 mmol/L,
[L] t = 1.00 mmol/L) and 1:5 ([Gd3+
]t = 0.20 mmol/L, [L] t = 1.00 mmol/L) in pure water, T = 298 K and I = 0.1 mol/L KCl. The open squares, circles and triangles represent experi-mental points and the fit (solid line) was calculated from the equilibrium constants with Hyper-quad2008.
In example, the species distributions for both models in the molar ratio
1:3 are illustrated in Figure 9.3.

9 Interaction of deferasirox, MSA and DSA with gadolinium (III) and gallium (III) in contrast
agents
212
Figure 9.3: Species distribution diagram as a function of pH for Gd3+
with the ligand MSA. Calculated for the continuous potentiometric titrations performed with a 1:3 molar ratio for model 1 (top) and model 2 (bottom) ([Gd
3+]t = 0.25 mmol/L, [L] t = 0.75 mmol/L, pure water,
T = 298 K and I = 0.1 mol/L KCl). The species concentration were calculated from the equilib-rium constants listed in Table 9.4 (mean values from simultaneous evaluation of 9 titrations) with the program Hyss2006.

9 Interaction of deferasirox, MSA and DSA with gadolinium (III) and gallium (III) in contrast
agents
213
Complex formation begins in solution at about pH 5. The dominating spe-
cies in both models are the [Gd(L)] (110) and the [Gd(L)2]3- (120) complex. The
mononuclear 110 complex appears with a maximum concentration of 66% at
pH 6.7 in the model 1 species distribution and to 69% at pH 6.7 in the model 2.
Further, the 120 complex is predominant species from pH 7.3 with a concentra-
tion of 44% (model 1) and 46% (model 2). In alkaline solution (pH 9 – 11) the
120 complex is the only complex present. The protonated complexes appear to
less than 20% in both models. They do not play a dominant role in the species
distribution which indicates that the bidentate coordination mode is not the fa-
vourable coordination mode and that these complexes rather deprotonate to
form the tridentate 110 and 120 complexes. In addition, the [Gd(LH)2]- (122)
complex only reaches a maximum concentration of 6% at pH 6.5 and can be
considered as a minor species. In this 122 complex two ligands MSA would
both be coordinated bidentate which is clearly not favoured and therefore the
existence of the 122 complex is questionable.
Taken together, only minor differences are found for the stability con-
stants of the [Gd(MSA)] (110), [Gd(MSA)2]3- (120) and [Gd(L)(LH)]2- (121) com-
plexes both models have in common. Model 1 has a better calculated fit
(σ = 1.161) and the formation of the [Gd(LH)]+ complex reaches at least a
highest concentration of 12% at pH 6.1. The [Gd(L)] complex has a
logβ110 = 10.38(3) and the [Gd(L)2]3- complex an individual stability constant
logK120 = 8.5 (logK120 = [ML2] / [ML] × [L]) which shows a weaker complexation
of the Gd3+ ion in comparison to the Fe3+-MSA system (logβ110 = 21.30(4) and
logK120 = 14.65; T = 298 K, I = 0.1 mol/L KCl) [40] or the Al3+-MSA system
(logβ110 = 16.3 and logK120 = 13.4; T = 298 K, I = 0.1 mol/L KCl) [37]. Further,
there was only little but not convincing evidence for the complexation of more
than two ligands to one Gd3+ central ion found by this potentiometric study.

9 Interaction of deferasirox, MSA and DSA with gadolinium (III) and gallium (III) in contrast
agents
214
9.1.3 Complex formation of DSA with gadolinium (III) in pure water
Potentiometric titration experiments were performed by T. Nicolai, under
my guidance, with the ligand DSA and Gd3+ in three molar ratios Gd3+:DSA 1:2,
1:3 and 1:5 to investigate the complex formation [58]. The ligand DSA is far
more soluble in pure water than MSA and thus titrations could be performed
with sufficiently higher concentrations. Further, all complexes formed were sol-
uble and no precipitation was observed. The titration conditions are presented
in Table 9.5.
Table 9.5: Titration experiment conditions of the complexation of Gd3+
with DSA given at
T = 298 K.
Conditions for the Gd3+-DSA titrations
molar ratio of M:L 1:2 1:3 1:5
measuring method potentiometric potentiometric potentiometric
method type continuous continuous continuous
solvent pure water pure water pure water
[M]t in mmol/L 0.50 0.33 0.50 0.20 0.40
[L]t in mmol/L 1.00 1.00 1.50 1.00 2.00
titration volume 50.0 mL 50.0 mL 50.0 mL
titrant 0.1 mol/L KOH 0.1 mol/L KOH 0.1 mol/L KOH
supporting electrolyte 0.1 mol/L KCl 0.1 mol/L KCl 0.1 mol/L KCl
electrode SenTix / IoLine SenTix / IoLine SenTix / IoLine
pKW 13.78 13.78 13.78
pH range 2.8 – 11.2 2.5 – 10.8 2.9 – 10.8
volume of data points 86 80 80
time for mixing process 550 s /350 s 350 s 350 s

9 Interaction of deferasirox, MSA and DSA with gadolinium (III) and gallium (III) in contrast
agents
215
One combined species model was calculated through simultaneous eval-
uation of all three molar ratios with the program Hyperquad2008. The overall
stability constants of the determined complexes are given in Table 9.6.
Table 9.6: Mean values of the overall stability constants logβxyz [a]
from potentiometric titra-tions of Gd
3+ with DSA determined by simultaneous evaluation with Hyperquad2008 in pure
water, T = 298 K and I = 0.1 mol/L KCl.
logβ values for the complexation of Gd3+:DSA
five 1:2 titrations five 1:3 titrations five 1:5 titrations
mean values by simultaneous evaluation of 15 titrations [b]
σ 1.717
logβ110 12.01(3)
logβ111 17.1(1)
logβ120 20.61(2)
logβ121 27.7(1)
logβ122 34.6(4)
logβ130 23.2(2)
[a] For the ligand L logβxyz is defined as: βxyz = [MxLyHz] × [M]
-x × [L]
-y × [H]
-z.
[b] The titrations were evaluated simultaneously with the program Hyperquad2008. The
deviations given in brackets correspond to the threefold standard deviation taken from Hyperquad2008. [c]
The σ value is taken from Hyperquad2008.
The model found for the simultaneous evaluation of all three molar ratios
is a model containing the expected [Gd(L)] - (110) and [Gd(L)2]5- (120) complex
as well as all three protonated complexes [Gd(LH)] (111), [Gd(L)(LH)]4- (121)
and [Gd(LH)2]3- (122). Additionally, a [Gd(L)3]9- (130) complex was also calcu-
lated with this model.
The titration curves of all three molar ratios in comparison to the pKa ti-
tration curve of DSA are illustrated in Figure 9.4.

9 Interaction of deferasirox, MSA and DSA with gadolinium (III) and gallium (III) in contrast
agents
216
Figure 9.4: Potentiometric titration curves of the free ligand DSA and Gd3+
-DSA with the mo-lar ratio 1:2 ([Gd
3+]t = 0.50 mmol/L, [L] t = 1.00 mmol/L), 1:3 ([Gd
3+]t = 0.33 mmol/L,
[L] t = 1.00 mmol/L) and 1:5 ([Gd3+
]t = 0.20 mmol/L, [L] t = 1.00 mmol/L) in pure water, T = 298 K and I = 0.1 mol/L KCl. The open squares, circles and triangles represent experi-mental points and the fit (solid line) was calculated from the equilibrium constants with Hyper-quad2008.
The Gd3+-DSA titration curves (Figure 9.4) show three inflections. The
first inflection at two equivalents is caused by the two very acidic protons of
DSA. In the 1:2 molar ratio titrations further inflections appear at three and four
equivalents. A look at the species distributions in Figure 9.5 gives rise to the
presence of the determined complexes. The dominant species in solution are
the [Gd(L)]- (110) complex and the [Gd(L)2]5- (120) complex. The inflection at
three equivalents is caused by the maximum formation of the 110 complex with
a concentration of 89% at pH 6.8. Further the third inflection at four equivalents
is caused by the formation of the 120 complex in alkaline solution. The 120
complex is the sole complex in alkaline solution.

9 Interaction of deferasirox, MSA and DSA with gadolinium (III) and gallium (III) in contrast
agents
217
Figure 9.5: Species distribution diagram as a function of pH for Gd3+
with the ligand DSA. Calculated for the continuous potentiometric titrations performed with a 1:2 molar ratio (top diagram, [Gd
3+] t = 0.50 mmol/L, [L] t = 1.00 mmol/L, T = 298 K and I = 0.1 mol/L KCl) and 1:5
(bottom diagram, [Gd3+
]t = 0.40 mmol/L, [L] t = 2.00 mmol/L, T = 298 K and I = 0.1 mol/L KCl) in pure water. The species concentration were calculated from the equilibrium constants listed in Table 9.6 (mean values from simultaneous evaluation of 15 titrations) with the program Hyss2006.

9 Interaction of deferasirox, MSA and DSA with gadolinium (III) and gallium (III) in contrast
agents
218
According, to the species distribution of the 1:2 molar ratio the protona t-
ed complexes [Gd(LH)], [Gd(L)(LH)]4- and [Gd(LH)2]3- appear with less than
10%. These species are minor species and should be regarded critically. The
calculated fit of the model improves by adding these minor species. Yet , one
needs to keep in mind that the existence of minor species may also result from
the compensation of protons by the program Hyperquad2008 which might have
been caused by measurement artefacts. The possible existence of the proto-
nated complexes would implicate a bidentate coordination mode of the ligand
DSA with one phenoxo group protonated owing to the strong acidity of the
pKa,2 1.33(8). The geometry of the complexes would be similar to those previ-
ously discussed for Gd3+-MSA and illustrated in Scheme 9.1
Additionally, the [Gd(L)3]9- (130) complex appears in strong alkaline solu-
tion in the species distribution with a 1:3 (not displayed since very similar to
1:2) and 1:5 molar ratio. A 130 complex is imaginable when either all ligands
coordinate bidentate to from a Gd3+ ion with a coordination number of six or
with the ligands bound tridentate and Gd3+ having a coordination number of
nine. However, the complex reaches 9% at the end of the titration at pH 10.8.
Accordingly, this complex needs to be seen as a minor species. The pH de-
crease observed in strong alkaline solution can be assigned to the formation of
a 130 complex by calculations with the program Hyperquad2008. Yet, this
complex needs to be viewed critically.
Taken together, we have determined the stability constants of two domi-
nant complexes in solution. The stability constant of the [Gd(L)] - complex was
determined to logβ110 = 12.01(3) which is higher than the corresponding value
for the Gd3+-MSA system (logβ110 = 10.38(3)). Further, the dominating complex
from pH 7.5 to alkaline solution is the [Gd(L)2]5- complex with a logK120 = 8.60
(logK120 = [ML2] / [ML] × [L]). This value is very similar to the [Gd(MSA)2]3-
complex with logK120 = 8.52. The 110 and 120 Gd3+-DSA complexes have been
very well determined. The formation of all other complexes should be judged
with critically.

9 Interaction of deferasirox, MSA and DSA with gadolinium (III) and gallium (III) in contrast
agents
219
9.1.4 Summary and discussion
Gadolinium (III) complexes such as Gd3+-DOTA are often used as con-
trast agents for MRI examinations on patients. We were interested in the ques-
tion whether a simultaneous administration of a contrast agents containing
Gd3+ and chelation therapy with deferasirox causes interactions between the
complex formations. The ligand deferasirox is a specific ligand for Fe 3+ chela-
tion, however the stability of the Gd3+ complexes have, to our knowledge, not
been investigated. Accordingly, our aim was to determine the stability of the
complexes formed by the iron-chelating ligand deferasirox with gadolinium (III).
Unfortunately, the determination of the stability constants by potentiometric t i-
trations in water/DMSO (xDMSO = 0.20) were extremely hampered by precipitate
throughout most of the titration range (pH 4 – 8). Two protonated complexes of
the composition [Gd(LH)]+ and [Gd(LH2)]2+ were identified in a very small titra-
tion range (pH 3.1 – 4.6) with the overall stability constants logβ111 = 19.4(3)
and logβ112 = 25.05(4). These stability constants were determined with great
difficulties and need to be judged critically.
The water soluble derivatives MSA and DSA of the iron-chelating ligand
deferasirox were used to elucidate the complex behaviour with metal ions that
have caused precipitation with deferasirox. Potentiometric titration experiments
with the mono- and disulfonic acid derivatives MSA and DSA showed no pre-
cipitation during the experiments and stability constants of the complexes
formed with Gd3+ in solution were determined in pure water. These can now be
compared to the complexes of Gd3+-DOTA. The overall stability constants of
the Gd3+ complexes determined in this thesis and the overall stability constants
of Gd3+-DOTA from Clarke and Martell [136] are summarized in Table 9.7. All
stability constants were investigated at T = 298 K and an ionic strength of
I = 0.1 mol/L KCl. Consequently, we may use them for means of comparison.
Gd3+-DOTA only forms a [Gd(DOTA)]- (110) and [Gd(DOTA-H)] (111) complex
which were both taken into account. It is apparent, that the stability constant of
the [Gd(DOTA)]- complex is at least double the value of the 110 stability con-
stant of MSA or DSA.

9 Interaction of deferasirox, MSA and DSA with gadolinium (III) and gallium (III) in contrast
agents
220
Table 9.7: Overall stability constants logβxyz [a]
of Gd3+
complexes with the listed ligands (T = 298 K, I = 0.1 mol/L KCl).
Overall stability constants logβxyz [a] of Gd3+ complexes
deferasirox MSA DSA DOTA [b]
solvent xDMSO = 0.20 pure water pure water pure water
logβ110 - 10.38(3) 12.01(3) 24.0(1)
logβ111 19.4(3) 16.0(2) 17.1(1) 26.3
logβ112 25.05(4) - - -
logβ120 - 18.9(3) 20.61(2) -
logβ121 - 25.8(1) 27.7(1) -
logβ122 - - 34.6(4) -
logβ130 - - 23.2(2) -
[a] For the ligand L logβxyz is defined as: βxyz = [MxLyHz] × [M]
-x × [L]
-y × [H]
-z.
[b] Values taken from Clarke and Martell
[136].
Species distribution diagrams have been calculated for the Gd3+ com-
plexes of DOTA and MSA, respectively DSA, with the stability constants listed
in Table 9.7. Species distributions calculated for about equal amounts of the
metal ion Gd3+, MSA or DSA with DOTA showed only Gd-DOTA complexes
with [Gd(DOTA)] as dominant species with a concentration 80 – 100% through-
out the pH range. In conclusion, DOTA forms much stronger complexes with
Gd3+ than MSA or DSA. If both ligands MSA (or DSA) and DOTA are present in
solution in about equal amounts with Gd3+ metal ions the Gd3+ will always pre-
fer the DOTA ligand forming the [Gd(DOTA)] - complex to 100% at physiological
pH 7.4. The iron-chelating ligands will still be free to bind excess Fe3+.
Species distribution diagrams calculated with a large excess of MSA or
DSA in comparison to DOTA and Gd3+ are shown in Figure 9.6.

9 Interaction of deferasirox, MSA and DSA with gadolinium (III) and gallium (III) in contrast
agents
221
Figure 9.6: Species distribution diagrams as a function of pH for Gd3+
with the ligands MSA and DOTA (top, [Gd
3+]t = 0.50 mmol/L, [DOTA] t = 0.50 mmol/L, [MSA]t = 0.5 mol/L, T = 298 K
and I = 0.1 mol/L KCl) and DSA and DOTA (bottom, [Gd3+
]t = 0.50 mmol/L, [DOTA]t = 0.50 mmol/L, [DSA]t = 0.5 mol/L, T = 298 K and I = 0.1 mol/L KCl) in pure water. The species concentration were calculated from the equilibrium constants listed in Table 9.7 with the program Hyss2006.
9 Interaction of deferasirox, MSA and DSA with gadolinium (III) and gallium (III) in contrast
agents
222
An interesting question is whether MSA or DSA complexes appear if the
ligand is present in excess. Calculations have shown that MSA and DSA com-
plexes begin to appear with very low concentrations at an excess 1:200
([Gd]t = 0.5 mmol/L, [DOTA] t = 0.5 mmol/L, [MSA/DSA]t = 0.2 mol/L). The spe-
cies distribution diagrams in Figure 9.6 are calculated for a 1:1000 ratio
([Gd]t = 0.5 mmol/L, [DOTA] t = 0.5 mmol/L, [MSA/DSA]t = 0.5 mol/L) to achieve
sufficient [Gd(MSA)2]3- complex which is the only Gd-MSA complex. It is only
present at pH > 8 with a maximum concentration of 4%. The Gd-DSA distribu-
tion diagram is somewhat different due to the presence of a [Gd(DSA) 2]5- and a
[Gd(DSA3)]9- complex. Both complexes appear at pH > 8.5 with a maximum
concentration of 3% [Gd(DSA)2]5- and 19% [Gd(DSA3)]9- at pH 10. The
[Gd(DOTA)] complex has a maximum concentration of 78% at pH 10. As a con-
sequence, the [Gd(DSA)3]9- complex has gained importance in alkaline solu-
tion, yet at physiological pH 7.4 still no Gd-DSA or Gd-MSA complexes appear.
Even a 1:1000 excess MSA or DSA to DOTA cannot cause these ligand com-
plexes to appear at pH = 7.4.
This result is in good agreement to the following characteristics of
Gd3+-DOTA complexes. Accordingly, the Gd3+-DOTA complex has a high ther-
modynamic stability constant (logβ110 = 24.0) and a very high kinetic stability.
The kinetic stability has been estimated through the half-life T1/2 of the dissoci-
ation of the complex which is T1/2 > one month (T = 298 K, 0.1 N HCl) for the
Gd3+-DOTA complex [132]. These two factors make the Gd3+-DOTA complex al-
most inert once formed. Further, one needs to keep in mind that Gd 3+-DOTA is
administered to the patient as the ready formed complex, which will probably
not decompose. In conclusion, the investigations with MSA and DSA have
shown that a simultaneous administration of the iron-chelating ligand defer-
asirox and a Gd3+ containing contrast agent, from a chemist point of view,
should be without any problems. The Gd3+-DOTA complex is much too stable to
decompose and form complexes with deferasirox. Further, even if Gd3+ is free
in solution and DOTA and deferasirox are competing ligands, the Gd3+-DOTA
complexes will preferably form, owing to their high stability, compared to Gd3+-
deferasirox complexes.

9 Interaction of deferasirox, MSA and DSA with gadolinium (III) and gallium (III) in contrast
agents
223
9.2 Complex formation of deferasirox and its water soluble
derivatives with gallium (III)
The radio isotope 68Ga (III) is gaining presence as a promising radionu-
clide in radiopharmaceuticals in positron emission tomography (PET) which is
often combined with X-Ray computed tomography (CT). Radiopharmaceuticals
consist of two main compounds: a molecular structure (ligand, biomolecule)
which is designed for specific targeting within the organism and a positron -
emitting radionuclide which is responsible for a signal detectible outside of the
patient. In some cases a spacer is added between radionuclide and the molec-
ular structure. [137]
In PET the molecular structure is implemented as a targeting group which
is meant to interact with a specific target surface receptor on the surface of a
cell. The radionuclide attached to the targeting molecule decays by emitting a
positron. The positron travels through the electron-rich tissue until it recom-
bines with an electron by annihilation. Through the annihilation process the
mass of the electron and positron are converted into two high-energy photons
with 511 keV in form of γ-rays. These γ-rays are energetic enough to leave the
organism and are detected by a PET scanner. [138]
Important factors that need to be taken into consideration for the design
of radiometal-based radiopharmaceuticals are the half-life of the radionuclide,
the mode of decay, cost and availability of the isotope [139]. The radionuclides
usually have rather short half-lives (T1/2 = 2 – 110 min [137]) which makes it
necessary to produce them only a short time before administration.
Gallium-68 has a half-life of T1/2 = 67.71 min and is easily produced by a
68Ge/68Ga generator. The germanium-68 parent nuclide has a much longer
half-life T1/2 = 270.95 days and can be stored up to 1 year in clinics and applied
to the 68Ga generator when needed. There are numerous commercial compact
generator systems available. [138]
The daughter nuclide 68Ga can be efficiently separated from the parent
nuclide 68Ge with ion exchange chromatography which has been optimized with
many variations [140].

9 Interaction of deferasirox, MSA and DSA with gadolinium (III) and gallium (III) in contrast
agents
224
The complex formation of Ga3+ also needs to be taken into account when
applying the trivalent metal ion as a radiopharmaceutical . The free metal ion
Ga3+ is toxic and can only be applied as radionuclide when bound to a ligand
which forms strong complexes with the metal ion. Two requirements deserve
special attention when designing a Ga3+ radiopharmaceutical. For once the
Ga3+-complex should be stable to hydrolysis. The ion Ga3+ prefers to form sol-
uble, for example [Ga(OH)4]-, and insoluble Ga(OH)3 compounds with hydrox-
ide ions throughout the pH region which should be suppressed as far as poss i-
ble. The other requirement in vivo is the complexes should be more stable than
the Ga3+-transferrin complex. Transferrin is an iron-transport plasma protein
which forms very stable Ga3+ complexes with a very high thermodynamic stabil-
ity constant logK1 = 20.3 [141]. In fact the Ga3+ ion has similar complexation
characteristics as the Fe3+ ion, such as the ionic radius of Ga3+ r = 0.620 Å
(CN 6) [118] compared to Fe3+ r = 0.645 Å (CN 6) [118]. Thus, the high plasma
concentration of transferrin (0.25 g/100 mL) and the large formation constant of
the Ga3+-transferrin complex could induce that radiopharmaceutical Ga3+-
complexes could be labile to transferrin ligand exchange in vivo. However,
most multidentate ligands form strong complexes with Ga 3+ which are kinetical-
ly stable and do not exchange with transferrin. The determination of high ther-
modynamic stability constants does not necessarily indicate that the complexes
formed are also stabile in vivo. However, they are often used as a first criterion
for suitable radiopharmaceuticals. [139]
The multidentate ligand DOTA forms very stable complexes with the tr i-
valent metal ion Ga3+ which makes it an ideal complex for PET imaging.
Whereas Gd-DOTA complexes, previously discussed in section 9.1, were readi-
ly used as non-specific contrast agents for MRI, in PET more specific mole-
cules are needed to yield special targeting agents. As a consequence, so
called bifunctional chelating agents (BFC) were developed which consist of a
ligand which complexes the radiometal ion, and a functional group for attach-
ment to the biomolecule which functions as targeting agent [139]. Further, pep-
tides such as somatostatin, a peptide involved in the regulation and release of
a number of hormones, were attached to the 68Ga-DOTA complexes to gener-
ate specific tumour targeting agents [139]. Tumours that have receptors for the-

9 Interaction of deferasirox, MSA and DSA with gadolinium (III) and gallium (III) in contrast
agents
225
se added peptides can be targeted by 68Ga-DOTA-peptide compounds and
therefore detected by PET.
A well-known peptide derivative of the 68Ga-DOTA system is the complex
[68Ga-DOTA-Tyr3]octreotide called DOTA-TOC which targets subtypes of the
somatostatin receptors of tumours [140]. Several other radiopeptides have been
developed for receptor targeting and tumour localisation [142].
Curiously, the iron-chelating ligand deferoxamine (desferrioxamine-B,
DFO) forms very stable complexes with Ga3+ and has been used to complex
68Ga (III) and to connect the peptide octreotide as a tumour targeting receptor.
This 68Ga-DFO-octreotide complex was stabile in vivo and showed high affinity
to the somatostatin receptors. [139-140, 142]
On account of the similar characteristics of Ga3+ and Fe3+ we investigat-
ed the complex behaviour of the iron-chelating ligand deferasirox and its water
soluble derivatives with Ga3+ by potentiometric titrations. The determination of
the stability constants is of special interest with regard to the question whether
the simultaneous administration of deferasirox in chelation therapy and a
68Ga3+ containing radiopharmaceutical might cause interaction in form of
transmetalation or ligand exchange reactions.

9 Interaction of deferasirox, MSA and DSA with gadolinium (III) and gallium (III) in contrast
agents
226
9.2.1 Complex formation of deferasirox with gallium (III) in pure water
and water/DMSO solution xDMSO = 0.20
The complex formation of the iron-chelating ligand deferasirox with the
trivalent metal ion Ga3+ is expected to be strong since deferasirox forms strong
complexes with the similar trivalent metal ion Fe3+. Due to the low solubility of
the ligand deferasirox in pure water the titration experiments needed to be car-
ried out in a water/DMSO solution with a molar fraction of xDMSO = 0.20. The
first titrations in the water/DMSO medium revealed some precipitation occurring
in the pH range 3.5 – 4.5. However, above pH 4.6 the precipitate had dissolved
and titrations could be evaluated. The evaluations showed a very strong com-
plexation between deferasirox and Ga3+ resulting in almost 100% [Ga(LH)]+
complex formation already in acidic solution. As a consequence, the first com-
plexes formed in acidic solution could not be determined. In contrast to the
Fe3+-deferasirox system these complexes cannot be investigated by spectro-
photometric batch titrations due to the lack of a coloured solut ion.
A method introduced by Motekaitis and Martell [143] is based on the strong
tendency of Ga3+ to hydrolyse in aqueous solution. Instead of using competitive
ligands to determine the stability constants the displacement of the ligand from
Ga3+ by hydroxide ions in alkaline solution is used. In aqueous solution the
constants of some well-defined mononuclear hydroxo complexes of the compo-
sition [Ga(OH)n]3-n (1 ≤ n ≤ 4) are known and with acidimetric titrations the sta-
bility constants of any Ga3+-ligand system can be investigated.
Unfortunately, this method can only be applied to pure water solutions
since the constants of Ga3+ are not known in water/DMSO solution. Therefore,
the determination of the stability constants of the Ga3+-deferasirox system was
limited. A possibility was to define the stability constants that could be calcula t-
ed with the program Hyperquad2008 on the basis of the unknown monomeric
complex in strong acidic solution.
The determination of these individual stability constants has been per-
formed previously and the results were summarised in a Final Report for the
Novartis Pharma AG. [72]

9 Interaction of deferasirox, MSA and DSA with gadolinium (III) and gallium (III) in contrast
agents
227
The equilibrium reactions and the resulting stability constants are pre-
sented in Table 9.8.
Table 9.8: Individual stability constants logKxyz for the complex formation of the ligand defer-asirox with Ga
3+ in water/DMSO solution (xDMSO = 0.20, T = 298 K, I = 0.1 KCl).
[72]
individual equilibrium constants for Ga3+-deferasirox
equilibrium logKxyz
4.1
14.8
4.8
5.9
Mostly deprotonation constants were determined by this method, yet also
an individual stability constant of the [Ga(L)2]3- complex was calculated with a
value of logK120 = 14.8 (logK120 = [ML2] / [ML] × [L]). In water/DMSO solution
the hydrolysis constants of Ga3+ are not known so the advantage of a calcula-
tion on the basis of the [Ga(OH)4]- complex with its known constant could not
be applied. In acidic solution precipitation of a white solid occurred which could
be isolated and analysed by ESI+ mass spectroscopy. The spectra revealed
characteristic peaks in the range of m/z = 518 – 520, m/z = 596 – 598 and
m/z = 624 - 626 which could be assigned to the ions [Ga(LH)(DMSO)]+,
[Ga(LH)(DMSO)2]+and [Ga(L)K(DMSO)(H2O)(CH3OH)]+, respectively [72]. The
characteristic pattern of the 69Ga/71Ga ratio of 1.0 to 0.66 was observed. Fur-
ther, a very weak signal at m/z = 813 could be assigned to [Ga(LH 2)2]+ [72].
In conclusion, the precipitate consists mostly of mononuclear Ga3+-
deferasirox species that seem to have a lower solubility in solution than the
corresponding Fe3+ and Al3+ complexes, since no precipitation was observed
during these titrations. However, the Ga3+-deferasirox stability constants in
Table 9.8 should be viewed critically, due to: i) the difficulties with precipitate in

9 Interaction of deferasirox, MSA and DSA with gadolinium (III) and gallium (III) in contrast
agents
228
acidic solution, ii) readily formed 100% complex at the beginning of the titration
and iii) the fact that these constants could not be calculated on the basis of the
[Ga(OH)4]- complex.
The Ga3+-deferasirox system in pure water
Despite the low solubility of deferasirox on pure water the ligand is rea-
sonably soluble in strong alkaline aqueous solution. A titration experiment of a
strong alkaline Ga3+-deferasirox solution with hydrochloric acid has been previ-
ously performed in pure water [72]. Since this experiment was carried out in
pure water the hydroxo complexes of Ga3+ as described by Motekaitis and Mar-
tell [143] can be applied for the calculation of the equilibrium constant of Ga3+-
deferasirox complexes. The overall stability constants and corresponding reac-
tion equations of the gallium (III) hydroxo complexes implemented in the calcu-
lation with Hyperquad2008 are depict in Scheme 9.2
Scheme 9.2: Reaction equations for the overall formation constants of the gallium (III) hy-droxo complexes in aqueous solution
[143].
These hydroxo complexes were applied as constant values for the calcu-
lation. The constant values for the gallium (III) hydroxo complexes and the de-
termined overall stability constant for the [Ga(L)2]3- complex of deferasirox are
given in Table 9.9.

9 Interaction of deferasirox, MSA and DSA with gadolinium (III) and gallium (III) in contrast
agents
229
Table 9.9: Acidimetric titration experiment for the determination of the complex formation of Ga
3+ with deferasirox in strong alkaline solution, pH range 10.3 – 11.3.
[72]
logβ value for Ga3+-deferasirox in pure water
species logβxyz [a] value
[Ga(OH)]2+ logβ10-1 [b] -2.91
[Ga(OH)2]+ logβ10-2 [b] -6.61
[Ga(OH)3] logβ10-3 [b] -11.01
[Ga(OH)4]- logβ10-4 [b] -16.78
[Ga(L)2]3- logβ120 [c] 33.8(1)
[a] For the logβxyz is defined as: βxyz = [MxLyHz] × [M]
-x × [L]
-y × [H]
-z.
[b] Values were taken from Motekaitis and Martell
[143] and defined as constant
values. [c]
Value taken from the Novartis Pharma AG Final Report [72]
.
The overall stability constant of the [Ga(L)2]3- complex was determined to
logβ120 = 33.8(1) according to the equation:
.
In conclusion, some individual stability constants of the Ga3+-deferasirox
system in water/DMSO (xDMSO = 0.20) were determined on the basis of the un-
known [Ga(LH)]+ complex. The individual constant of the [Ga(L)2]3- complex
was determined to logK120 = 14.8 (logK120 = [ML2] / [ML] × [L], water/DMSO
xDMSO = 0.20). In pure water the overall stability constant of this [Ga(L)2]3- com-
plex has been determined to logβ120 = 33.8(1) by acidimetric titrations with the
help of the stability constant of the known gallium (III) tetrahydroxo complex
[Ga(OH)4]-.

9 Interaction of deferasirox, MSA and DSA with gadolinium (III) and gallium (III) in contrast
agents
230
9.2.2 Complex formation of MSA with gallium (III) in pure water
The titration experiments with the ligand deferasirox and Ga 3+ revealed
very strong complex behaviour with 100% complex formation at the beginning
of the titration. To be able to investigate the stability constants of this system
the method described by Motekaitis and Martell [143] needs to be applied. The
method takes advantage of the conversion of almost all complexes in alkaline
solution to the known gallium (III) hydroxo complexes. This was rather difficult
with Ga3+-deferasirox since the method can only be applied in pure water
where the gallium (III) hydroxo complexation constants are known. The ligand
MSA however is sufficiently soluble in pure water and therefore this method
carried out with acidimetric titrations was performed with the Ga 3+-MSA system.
We use the ligand MSA to elucidate the complex behaviour of the deferasirox
ligand system, which is often difficult to investigate due to its poor solubility in
pure water.
Acidimetric titrations with HCl (0.1 mol/L) were carried out with Ga3+ and
the ligand MSA in pure water with two different molar ratios Ga3+:MSA 1:2 and
1:4. The evaluation of the titrations with a 1:4 molar ratio was better than the
1:2 titrations. The titration experiments were evaluated simultaneously with the
program Hyperquad2008 to find a suitable species model for all titrations. No
precipitation was observed during these titration experiments. The titration
conditions for both molar ratios are given in Table 9.10.

9 Interaction of deferasirox, MSA and DSA with gadolinium (III) and gallium (III) in contrast
agents
231
Table 9.10: Titration conditions for the acidimetric titration experiments of Ga3+
with MSA, given at T = 298 K.
Conditions for the Ga3+-MSA acidimetric titrations
molar ratio of M:L 1:2 1:4
measuring method potentiometric potentiometric
method type continuous continuous
solvent pure water pure water
[M]t 0.50 mmol/L 0.50 mmol/L
[L]t 1.00 mmol/L 2.00 mmol/L
titration volume 50.0 mL 50.0 mL
titrant 0.1 mol/L HCl 0.1 mol/L HCl
supporting electrolyte 0.1 mol/L KCl 0.1 mol/L KCl
electrode Ross Ultra Ross Ultra
pKW 13.78 13.78
pH range 10.8 – 2.1 11.1 – 2.3
volume of data points 100 100
time for mixing process 550 s 600 s
The Ga3+-MSA titrations with the molar ratios 1:2 and 1:4 were evaluated
simultaneously with the program Hyperquad2008. Further, the determined pKa
values of MSA in Table 9.2 (section 9.1.2) were used for the calculation as well
as the known gallium (III) hydroxo overall stability constants from Table 9.9.
The mean values for the overall stability constants of the Ga 3+-MSA sys-
tem are presented in Table 9.11.

9 Interaction of deferasirox, MSA and DSA with gadolinium (III) and gallium (III) in contrast
agents
232
Table 9.11: Mean values of the overall stability constants logβxyz [a]
from acidimetric titrations of Ga
3+ with MSA determined by simultaneous evaluation with Hyperquad2008 in pure water,
T = 298 K and I = 0.1 mol/L KCl.
logβ values for the complexation of Ga3+:MSA
two titrations 1:2 four titrations 1:4
pH 10.8 – 2.1 pH 11.1 – 2.1
mean values by simultaneous evaluation of 6 titrations [b]
σ [c] 3.284
logβ110 19.8(1)
logβ111 22.2(3)
logβ120 33.8(3)
logβ121 39.1(3)
logβ11-2 9.3(3)
[a] For the ligand L logβxyz is defined as: βxyz = [MxLyHz] × [M]
-x × [L]
-y × [H]
-z.
[b] The titrations were evaluated simultaneously with the program Hyperquad2008. The
deviations given in brackets correspond to the threefold standard deviation taken from Hyperquad2008. [c]
The σ value is taken from Hyperquad2008.
The species model comprehends the expected [Ga(L)] (110) complex
with a logβ110 = 19.8(1) and a protonated complex [Ga(LH)]+ (111) with a very
acidic apparent pKa = 2.4. The [Ga(L)2]3- (120) complex has an individual sta-
bility constant of logK120 = 14.0 (logK120 = [ML2] / [ML] × [L]). Further, a proto-
nated bis-complex [Ga(L)(LH)]2- (121) was determined with an apparent
pKa = 5.3. These are all complexes well known for this type of ligand system.
Yet, in alkaline solution there was still a complex missing besides the galli-
um (III) hydroxo complexes to ensure a good fit of the measured titration curve.
The complex found to improve the fit was a [Ga(L)(OH) 2]2- (11-2) complex. The
σ value with 3.284 of the simultaneous evaluation of all six titrations was higher
than expected. However, this was the model with the best σ value.

9 Interaction of deferasirox, MSA and DSA with gadolinium (III) and gallium (III) in contrast
agents
233
Scheme 9.3 illustrates the possible coordination geometries of the de-
termined complexes. The 11-2 complex is presumably a monomeric complex of
Ga3+ with MSA where two water molecules coordinated to Ga3+ are deprotonat-
ed. Gallium (III) has a strong tendency to form hydroxo complexes and it is not
unlikely that this mixed ligand and hydroxo complex forms in solution.
Scheme 9.3: Suggested coordination geometries of the MSA complexes [Ga(L)] (110), [Ga(LH)]
+ (111), [Ga(L)2]
3- (120), [Ga(L)(LH)]
2- (121) and [Ga(L)(OH)2]
2- (11-2).
The titration curves of both molar ratios are depicted in Figure 9.7. The
Ga3+:MSA 1:4 titrations were also carried out with a total concentration of
[Ga3+]t = 0.25 mmol/L to [MSA] t = 1.00 mmol/L to be able to compare both titra-
tion curves. However, for better evaluations, titrations with higher total concen-
trations ([Ga3+]t = 0.50 mmol/L and [MSA] t = 2.00 mmol/L) were performed for
the determination of the stability constants.
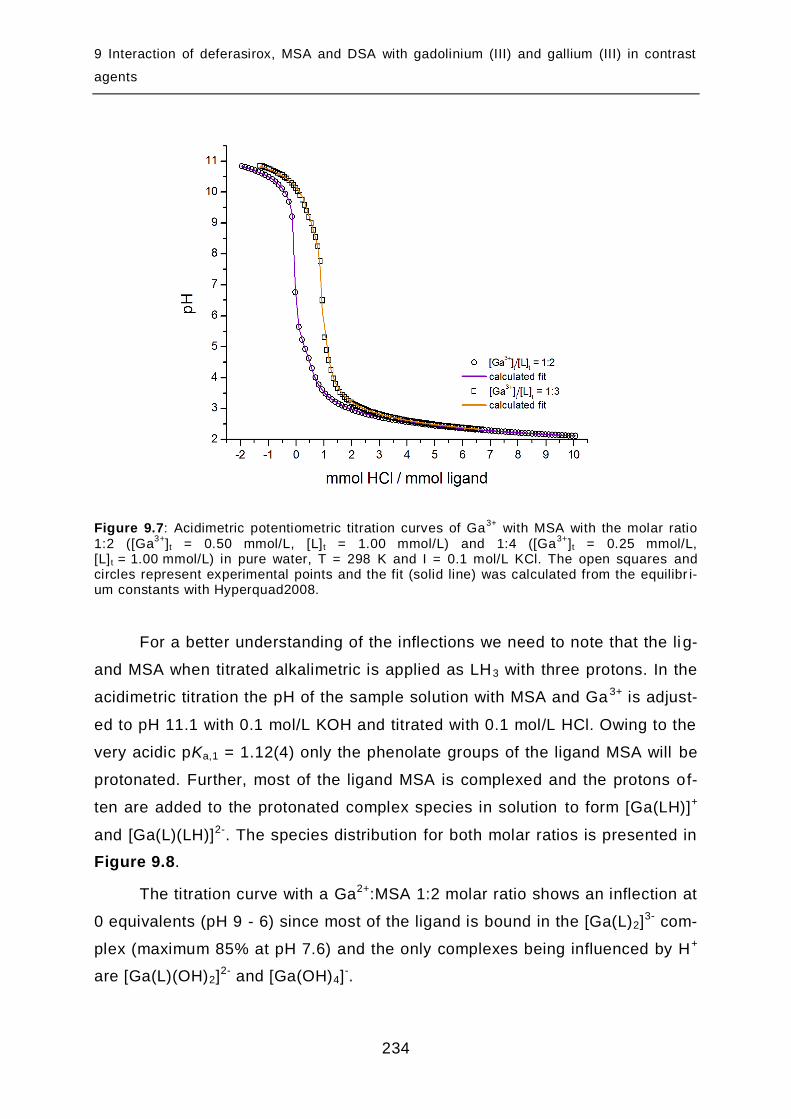
9 Interaction of deferasirox, MSA and DSA with gadolinium (III) and gallium (III) in contrast
agents
234
Figure 9.7: Acidimetric potentiometric titration curves of Ga3+
with MSA with the molar ratio 1:2 ([Ga
3+]t = 0.50 mmol/L, [L] t = 1.00 mmol/L) and 1:4 ([Ga
3+]t = 0.25 mmol/L,
[L] t = 1.00 mmol/L) in pure water, T = 298 K and I = 0.1 mol/L KCl. The open squares and circles represent experimental points and the fit (solid line) was calculated from the equilibr i-um constants with Hyperquad2008.
For a better understanding of the inflections we need to note that the li g-
and MSA when titrated alkalimetric is applied as LH3 with three protons. In the
acidimetric titration the pH of the sample solution with MSA and Ga 3+ is adjust-
ed to pH 11.1 with 0.1 mol/L KOH and titrated with 0.1 mol/L HCl. Owing to the
very acidic pKa,1 = 1.12(4) only the phenolate groups of the ligand MSA will be
protonated. Further, most of the ligand MSA is complexed and the protons of-
ten are added to the protonated complex species in solution to form [Ga(LH)]+
and [Ga(L)(LH)]2-. The species distribution for both molar ratios is presented in
Figure 9.8.
The titration curve with a Ga2+:MSA 1:2 molar ratio shows an inflection at
0 equivalents (pH 9 - 6) since most of the ligand is bound in the [Ga(L)2]3- com-
plex (maximum 85% at pH 7.6) and the only complexes being influenced by H+
are [Ga(L)(OH)2]2- and [Ga(OH)4]-.

9 Interaction of deferasirox, MSA and DSA with gadolinium (III) and gallium (III) in contrast
agents
235
Figure 9.8: Species distribution diagrams as a function of pH for Ga3+
with the ligand MSA. Calculated for the continuous acidimetric titration performed with a 1:2 molar ratio (top) ([Ga
3+]t = 0.50 mmol/L, [L] t = 1.00 mmol/L) and 1:4 (bottom) ([Ga
3+] t = 0.50 mmol/L,
[L] t = 2.00 mmol/L) in pure water, T = 298 K and I = 0.1 mol/L KCl. The species concentration were calculated from the equilibrium constants listed in Table 9.11 (mean values from simul-taneous evaluation of 6 titrations) with the program Hyss2006.

9 Interaction of deferasirox, MSA and DSA with gadolinium (III ) and gallium (III) in contrast
agents
236
A very small second inflection at 0.5 equivalents (pH 5 – 4) can be as-
signed to the protonation of the [Ga(L)2]3- complex to form [Ga(L)(LH)]2- with a
maximum concentration of 64% at pH 4.6. In acidic solution the [Ga(L)] com-
plex forms at pH 3.1 to a maximum concentration of 66%. At the end of the t i-
tration at pH 2.1 the protonated complex [Ga(LH)]+ is dominant species with
63%, the [Ga(L)] complex is present with 33% and the free Ga3+ ion with less
than 5%. The species distribution shows that there is practically no free Ga3+ in
acidic solution. However, there is 23% [Ga(OH)4]- in alkaline solution at pH
11.1 with a known stability constants which was used as basis for the calcula-
tion of the stability constants of the Ga3+-MSA system.
The titration curve in Figure 9.7 of the 1:4 molar ratio has an inflection at
1 equivalent due to the excess ligand. Even though excess ligand was provided
no species were found with more than two ligands per Ga3+ ion. The species
distribution in Figure 9.8 (bottom) for the 1:4 molar ratio is very similar to the
1:2 molar ratio. An exception is the formation of the [Ga(L)(OH)2]2- complex
which appears at significant concentration in the titration range from pH 11.1 to
9 in contrast to the 1:2 molar ratio which shows significant concentrations of
the [Ga(L)(OH)2]2- complex already in acidic solution (pH 11.1 – 5). Therefore,
this complex is the main species at the beginning of the titration at pH 11.1 with
75% and the [Ga(OH)4]- complex is present at this point with 14%.
In summary, we have been able to determine the stabili ty constants of
the Ga3+-MSA system on the basis of the gallium (III) tetrahydroxo complex in
pure water. Further Ga3+ hydroxo complexes do not appear in the species dis-
tribution. The fact that practically no free Ga3+ is present in acidic solution
gives rise to the strong complexation of Ga3+ with MSA. The [Ga(MSA)] com-
plex has a logβ110 = 19.8(1) which is only 1.5 units smaller compared to the
[Fe(MSA)] with a logβ110 = 21.30(4). Further the [Ga(MSA)2]3- complex has a
logK120 = 14.0 (logK120 = [ML2] / [ML] × [L]) in comparison to the [Fe(MSA)2]3-
complex with a logK120 = 14.65 [40]. As a result the Fe3+ complexes are some-
what more stable, yet the stability constants of the Ga 3+ complexes are very
close to them. Assumingly, the Ga3+ ion could be a potential competitor to Fe3+
for the complexation of the iron-chelating ligand MSA or deferasirox.

9 Interaction of deferasirox, MSA and DSA with gadolinium (III) and gallium (III) in contrast
agents
237
9.2.3 Complex formation of DSA with gallium (III) in pure water
The complex formation of the water soluble ligand DSA with Ga3+ was in-
vestigated. Alkaline samples prepared with potassium hydroxide for the acidi-
metric titrations showed absorption of CO2 and were difficult to evaluate. For
this reason, the titrations were carried out alkalimetric to decrease errors in the
titration experiments. The stability constants of the Ga3+-DSA system were de-
termined on the basis of the gallium (III) tetrahydroxo complex [Ga(OH)4]- due
to the strong complex formation. The titration conditions for the Ga3+-DSA sys-
tem are given in Table 9.12.
Table 9.12: Titration conditions for the potentiometric titration experiments of Ga3+
with DSA, given at T = 298 K.
Conditions for the Ga3+-DSA titrations
molar ratio of M:L 1:2
measuring method potentiometric
method type continuous
solvent pure water
[M]t 0.50 mmol/L
[L]t 1.00 mmol/L
titration volume 50.0 mL
titrant 0.1 mol/L KOH
supporting electrolyte 0.1 mol/L KCl
electrode Schott IoLine
pKW 13.78
pH range 2.0 – 11.6
volume of data points 90
time for mixing process 600 s

9 Interaction of deferasirox, MSA and DSA with gadolinium (III) and gallium (III) in contrast
agents
238
Further, the titration experiments were evaluated simultaneously with the
program Hyperquad2008. The gallium (III) hydroxo complexes were added to
the model as constant values. The results of the evaluation are presented in
Table 9.13.
Table 9.13: Mean values of the overall stability constants logβxyz [a]
from potentiometric titra-tions of Ga
3+ with DSA determined by simultaneous evaluation with Hyperquad2008 in pure
water, T = 298 K and I = 0.1 mol/L KCl.
logβ values for the complexation of Ga3+:DSA
titrations with a 1:2 molar ratio
pH 2.0 – 11.6
mean values by simultaneous evaluation of 7 titrations [b]
σ [c] 1.283
logβ10-1 [d] -2.91
logβ10-2 [d] -6.61
logβ10-3 [d] -11.01
logβ10-4 [d] -16.78
logβ110 21.68(6)
logβ120 36.74(5)
logβ121 40.7(2)
[a] For the ligand L logβxyz is defined as: βxyz = [MxLyHz] × [M]
-x × [L]
-y × [H]
-z.
[b] The titrations were evaluated simultaneously with the program Hyperquad2008. The
deviations given in brackets correspond to the threefold standard deviation taken from Hyperquad2008. [c]
The σ value is taken from Hyperquad2008. [d]
The values of the gallium (III) hydroxo complexes were taken from Motekaitis and Martell and defined as constant values
[143].

9 Interaction of deferasirox, MSA and DSA with gadolinium (III) and gallium (III) in contrast
agents
239
The species model with the best possible fit (σ value of 1.283) compre-
hends a [Ga(L)]- (110), a [Ga(L)2]5- (120) and a [Ga(L)(LH)]4- (121) complex.
The [Ga(L)]- complex has a high stability constant of logβ110 = 21.68(6). The
[Ga(L)2]5- complex has an individual stability constant of logK120 = 15.06
(logK120 = [ML2] / [ML] × [L]) which gives rise to a very stable Ga3+-DSA com-
plex. The deprotonation constant of the 121 complex i s quite acidic with an ap-
parent pKa = 4.0. In contrast to the Ga3+-MSA system no mixed ligand and hy-
droxo complexes were found.
A very large pH range was chosen to ensure sufficient formation of
[Ga(OH)4]- in alkaline solution and to investigate if any free Ga3+ is still present
in acidic solution. The titration curve of the Ga3+-DSA system is depicted in
Figure 9.9 in comparison to the pKa titration curve of the ligand DSA.
Figure 9.9: Potentiometric titration curves of the free ligand DSA and of Ga3+
with DSA with the molar ratio 1:2 ([Ga
3+]t = 0.50 mmol/L, [L] t = 1.00 mmol/L) in pure water, T = 298 K and
I = 0.1 mol/L KCl. The open squares and cirlces represent experimental points and the fit (sol-id line) was calculated from the equilibrium constants with Hyperquad2008.
The Ga3+-DSA titration curve has an obvious inflection at 4 equivalents
and a small inflection at 3 equivalents. The small inflection can be assigned to
the readily formed [Ga(L)]- complex in strong acidic solution which is present to

9 Interaction of deferasirox, MSA and DSA with gadolinium (III) and gallium (III) in contrast
agents
240
98% at pH 2.0, as illustrated in Figure 9.10. Only 2% free Ga3+ are present at
the beginning of the titration at pH 2.0. The [Ga(L)(LH)]4- complex reaches a
maximum concentration of 10% at pH 4.4. From pH 5 to 11.6 the [Ga(L)2]5-
complex is the dominating species in solution. Its concentration reaches nearly
100% over a large pH range (about pH 6 – 10) resulting in the inflection at 4
equivalents. However, in alkaline solution (about pH > 10) the ligand DSA is
exchanged by the hydroxide ions forming the [Ga(OH)4]- complex which is pre-
sent to 45% at the end of the titration (pH 11.6).
Figure 9.10: Species distribution diagram as a function of pH for Ga3+
with the ligand DSA. Calculated for the continuous potentiometric titration performed with a 1:2 molar ratio ([Ga
3+]t = 0.50 mmol/L, [L] t = 1.00 mmol/L) in pure water, T = 298 K and I = 0.1 mol/L KCl. The
species concentration were calculated from the equilibrium constants listed in Table 9.13 (mean values from simultaneous evaluation of 7 titrations) with the program Hyss2006.
The species distribution reveals a strong affinity of the ligand DSA to the
Ga3+ ion with almost 100% complex formation [Ga(DSA)]- at the beginning of
the titration. The complexation constants of the formed complexes could be de-
termined in pure water by the known [Ga(OH)4]- complex which is formed in
alkaline solution from the [Ga(DSA)2]5- complex.

9 Interaction of deferasirox, MSA and DSA with gadolinium (III) and gallium (III) in contrast
agents
241
9.2.4 Summary and discussion
The 68Ga3+ ion is a promising radionuclide used in complexes for PET
imaging. The question arises whether the simultaneous administration of defer-
asirox during iron chelation therapy and a 68Ga3+ containing complex as radio-
pharmaceutical to a patient may cause interactions. The Ga 3+ ion has very
similar characteristics compared to the Fe3+ ion due to the half populated
d5-orbital of Fe3+ and the full populated d10-orbital for Ga3+ and the similar ionic
radius (Ga3+ r = 0.620 Å (CN 6) [118] compared to Fe3+ r = 0.645 Å (CN 6) [118])
which makes Ga3+ a possible competitive ion for deferasirox.
For this reason we investigated the complex formation of the iron-
chelating ligand deferasirox and its water soluble derivatives MSA and DSA
with the metal ion gallium (III) with potentiometric titration experiments. Indeed,
first investigations with the ligand deferasirox in water/DMSO solution
(xDMSO = 0.20) revealed a very strong affinity of Ga3+ to deferasirox. We ob-
served almost 100% complex formation at the beginning of the titration . How-
ever, to be able to determine the stability constants with potentiometric titr a-
tions we need sufficient free metal ion at the beginning of the titration.
Fortunately, Ga3+ has the strong tendency to form hydroxo complexes in
alkaline solution. On account of the known stabi lity constants of these galli-
um (III) hydroxo complexes, mainly the [Ga(OH)4]- complex, we are able to cal-
culate the complex stability constants of the Ga3+-ligand system. This method
could not be applied to the water/DMSO titration evaluations since the gallium
(III) hydroxo complex stability constants are not known in this medium. Addi-
tionally, the titrations were hampered by precipitate in the pH range between
3.5 and 4.5 which made it difficult to determine the stability constants. As a
consequence, only some individual stability constants of the Ga3+-deferasirox
system were determined on the basis of the unknown [Ga(LH)]+ deferasirox
complex.
Of special interest was the individual stability constant of the [Ga(L)2]3-
complex with deferasirox in water/DMSO (xDMSO = 0.20, T = 298 K,
I = 0.1 mol/L KCl) with a logK120 = 14.8 (logK120 = [ML2] / [ML] × [L]) [72]. This
value reveals a strong affinity of the Ga3+ ion for the ligand deferasirox. In

9 Interaction of deferasirox, MSA and DSA with gadolinium (III) and gallium (III) in contrast
agents
242
comparison to the [Fe(L)2]3- complex of the ligand deferasirox with a
logK120 = 15.23 (logK120 = [ML2] / [ML] × [L], xDMSO = 0.20, T = 298 K,
I = 0.1 mol/L KNO3) [40] the affinity of deferasirox towards Fe3+ is still higher.
The stability constants with this determination method in water/DMSO solution
(xDMSO = 0.20) should be regarded as roughly determined due to the difficulties
with precipitation and the evaluation without the knowledge of neither the sta-
bility constant of the readily formed [Ga(LH)]+ complex nor the gallium (III) tet-
rahydroxo complex [Ga(OH)4]-.
Even though deferasirox is generally poorly soluble in pure water, it is
sufficiently soluble in strong alkaline solution. Consequently, a successful de-
termination of the overall stability constant logβ120 = 33.8(1) of the [Ga(L)2]3-
complex in pure water was achieved. This constant was calculated on the basis
of the well-known stability constant of the [Ga(OH)4]- complex in pure water.
On account of the low solubility of deferasirox in pure water and the diff i-
culties of the determination in water/DMSO solution we investigated the water
soluble derivatives MSA and DSA with the metal ion Ga3+. With the help of the-
se investigations we have the opportunity to study this type of ligand system
without precipitation in pure water. By means of comparison to deferasirox we
can bring insight into the complex behaviour of the Ga3+-deferasirox system.
Further, we wanted to study the possibility of metal ion exchange reac-
tions between a Ga3+ radiopharmaceutical and the water soluble derivatives. A
common ligand which forms strong complexes with Ga3+ is DOTA. Ga3+-DOTA
complexes are often used as compounds for new radiopharmaceuticals for PET
imaging.
The stability constants of the investigated ligands deferasirox, MSA and
DSA with Ga3+ from this work and the Ga3+-DOTA system from Clarke and Mar-
tell [136] are summarised in Table 9.14. All stability constants were determined
at T = 298 K and I = 0.1 mol/L KCl for comparison. Gallium (III) forms a
[Ga(DOTA-H)] (111) complex with logβ111 = 25.33 and a [Ga(DOTA)]- (110)
complex with logβ110 = 21.33(5) which were both taken into account.

9 Interaction of deferasirox, MSA and DSA with gadolinium (III) and gallium (III) in contrast
agents
243
Table 9.14: Overall stability constants logβxyz [a]
of Ga3+
complexes with the listed ligands (T = 298 K, I = 0.1 mol/L KCl).
Overall stability constants logβxyz [a] of Ga3+ complexes
deferasirox MSA DSA DOTA [b]
solvent pure water pure water pure water pure water
logβ110 - 19.8(1) 21.68(6) 21.33(5)
logβ111 - 22.2(3) - 25.33
logβ120 33.8(1) 33.8(3) 36.74(5) -
logβ121 - 39.1(3) 40.7(2) -
logβ11-2 - 9.3(3) - -
[a] For the ligand L logβxyz is defined as: βxyz = [MxLyHz] × [M]
-x × [L]
-y × [H]
-z.
[b] Values taken from Clarke and Martell
[136].
The only determined overall stability constants of the Ga3+-deferasirox
system in pure water is for the [Ga(L)2]3- (120) complex which has the same
value logβ120 = 33.8(1) as the overall stability constant for the [Ga(MSA)2]3-
complex of the Ga3+-MSA system logβ120 = 33.8(3). This is rather uncommon,
yet we do not know the value for the overall stability constant of the [Ga(L)]
complex for deferasirox so we cannot calculate the individual stability constant
logK120 (logK120 = [ML2] / [ML] × [L]) for deferasirox. The individual stability
constant of the [Ga(L)2]3- complex of deferasirox would be necessary for a sig-
nificant comparison to the corresponding complex of MSA or DSA.
The stability constants of the Ga3+-MSA system are somewhat smaller
than those of the Ga3+-DSA system. The individual stability constant of the
[Ga(MSA)2]3- complex is logK120 = 14.0 (logK120 = [ML2] / [ML] × [L]) which is
about one unit smaller than the corresponding [Ga(DSA) 2]5- complex with
logK120 = 15.06. To display the species in solution of each one of the iron-
chelating ligands MSA and DSA with DOTA the species distribution diagrams in
Figure 9.11 were calculated.

9 Interaction of deferasirox, MSA and DSA with gadolinium (III) and gallium (III) in contrast
agents
244
Figure 9.11: Species distribution diagram as a function of pH for Ga3+
with the ligand MSA and DOTA (top: [Ga
3+]t = 0.50 mmol/L, [DOTA] t = 0.50 mmol/L and [MSA] t = 1.00 mmol/L) and
Ga3+
with the ligand DSA and DOTA (bottom: [Ga3+
] t = 0.50 mmol/L, [DOTA] t = 0.50 mmol/L and [DSA] t = 1.00 mmol/L) in pure water, T = 298 K and I = 0.1 mol/L KCl. The species con-centrations were calculated from the equilibrium constants listed in Table 9.14 with the pro-gram Hyss2006.

9 Interaction of deferasirox, MSA and DSA with gadolinium (III) and gallium (III) in contrast
agents
245
By comparing the Ga3+ 110 complexes of MSA and DSA to the
[Ga(DOTA)]- complex with a logβ110 = 21.33(5), we find the order [Ga(DSA)] - >
[Ga(DOTA)]- > [Ga(MSA)]. Yet the values only differ by 0.35 units DSA and
DOTA and by 1.53 MSA to DOTA.
In the diagram for the Ga3+-MSA system (Figure 9.11 top) the complex
[Ga(DOTA-H)] reaches a maximum concentration of 6% at pH 3.9 and the
[Ga(DOTA)]- complex of 13% at pH 4.8. For the Ga3+-DSA system (Figure 9.11
bottom) these complexes reach even less with 2% at pH 4.2 for [Ga(DOTA-H)]
and 8% at pH 5.0 for [Ga(DOTA)]-. At the physiologically important pH 7.4 the
[Ga(MSA)2]3- complex is the dominating species with 86% next to the
[Ga(MSA)(OH)2]2- complex with 14%. For the Ga3+-DSA system the
[Ga(DSA)2]5- is the sole species with 100% at pH 7.4. The species diagrams of
the Ga3+-MSA and the Ga3+-DSA system have in common that throughout the
pH range the MSA and DSA containing species are clearly dominating.
We can conclude that if the ligand MSA or DSA is present in solution next
to the free ligand DOTA and the metal ion Ga3+ is added, the ligands MSA/or
DSA clearly complex the majority of the Ga3+ ion. Further, at physiological
pH 7.4 the Ga3+-DOTA complexes do not appear at all and the 120 complex of
Ga3+-MSA and Ga3+-DSA is the dominating species. The ligands MSA and DSA
are very good models for the ligand deferasirox and therefore we may draw
conclusions from these ligands to deferasirox.
As a consequence, these results give room for the assumption that the
simultaneous presence of Ga3+-DOTA and the free ligand deferasirox, respec-
tively MSA and DSA, could result in a ligand exchange reaction forming Ga 3+-
deferasirox complexes. Presumably, the [Ga(L)2]3- complex of deferasirox will
be favoured at physiological pH 7.4. Hence, the toxic ligand DOTA will be free
to form complexes with other biometal ions. Patients treated with deferasirox
suffer from elevated levels of unbound Fe3+ in the body. The ligand DOTA also
forms very stable complexes with the Fe3+ ion logβ110 = 29.4(1) [136]. According-
ly, a new question arises: if both deferasirox and DOTA are present in solution
which ligand will preferably form complexes with the Fe3+ biometal ion?

9 Interaction of deferasirox, MSA and DSA with gadolinium (III) and gallium (III) in contrast
agents
246
To answer this question we need to take the stability constants of DOTA
and the iron-chelating ligands with the Fe3+ ion into consideration. These over-
all stability constants for the Fe3+-complexes of the iron-chelating ligands de-
ferasirox, MSA and DSA as well as the stability constants of DOTA with Fe 3+
are given in Table 9.15.
Table 9.15: Overall stability constants logβxyz [a]
of Fe3+
complexes with the listed ligands (T = 298 K, I = 0.1 mol/L KCl).
Overall stability constants logβxyz [a] of Fe3+ complexes
Deferasirox [b] MSA [c] DSA [d] DOTA [e]
solvent pure water pure water pure water pure water
logβ110 22.0 21.30(4) 24.54(4) 29.4(1)
logβ111 24.0 - - 32.63
logβ120 36.9 35.95(5) 39.50(2) -
logβ121 41.2 40.89(3) 43.67(3) -
logβ122 43.4 - - -
[a] For the ligand L logβxyz is defined as: βxyz = [MxLyHz] × [M]
-x × [L]
-y × [H]
-z.
[b] Values extrapolated for xDMSO = 0.00 taken from Steinhauser
[40].
[c] Values measured by potentiometric titration taken from Steinhauser
[40].
[d] Values from this thesis section 7.2.1 and 7.2.2.
[e] Values taken from Clarke and Martell
[136].
These stability constants were used for the calculation of species distr i-
butions with the iron-chelating ligands deferasirox or DSA and DOTA in the
presents of Fe3+ which are illustrated in Figure 9.12. The calculation of the
species distribution diagram for the ligand deferasirox and DOTA with Fe 3+ in
pure water (Figure 9.12, top) is based on the stability constants of the Fe3+-
deferasirox system determined by extrapolation to xDMSO = 0.00 which has been
reported previously [39-40]. The [Fe(DOTA-H)] and [Fe(DOTA)]- complexes dom-
inate clearly in acidic solution.

9 Interaction of deferasirox, MSA and DSA with gadolinium (III) and gallium (III) in contrast
agents
247
Figure 9.12: Species distribution diagram as a function of pH for Fe3+
with the ligand defer-asirox and DOTA (top: [Fe
3+] t = 0.50 mmol/L, [DOTA] t = 0.50 mmol/L and [deferasirox] t
= 1.00 mmol/L) and Fe3+
with the ligand DSA and DOTA (bottom: [Fe3+
]t = 0.50 mmol/L, [DOTA]t = 0.50 mmol/L and [DSA] t = 1.00 mmol/L) in pure water, T = 298 K and I = 0.1 mol/L KCl. The species concentrations were calculated from the equilibrium constants listed in Table 9.15 with the program Hyss2006.
9 Interaction of deferasirox, MSA and DSA with gadolinium (III) and gallium (III) in contrast
agents
248
The Fe3+-deferasirox complexes do not appear until about pH 5. At this
pH the [Fe(deferasirox)2]3- complex starts to form and a ligand exchange reac-
tion is observed. The Fe3+ central ion which is bound to nearly 100% as
[Fe(DOTA)]- complex at pH 5 starts to exchange the ligand DOTA by two lig-
ands deferasirox forming the [Fe(deferasirox)2]3- complex. At physiological
pH 7.4 the exchange has taken place to 50% so that both the [Fe(DOTA)] -
complex and the [Fe(deferasirox)2]3- complex are present to equal amounts.
In conclusion, we suppose that if DOTA is set free by preferred complex
formation of Ga3+ with deferasirox, DOTA will be a competitive ligand to defer-
asirox for the complexation of unbound Fe3+.
In contrast to the Fe3+-deferasirox system the species distribution dia-
gram of DSA and DOTA with Fe3+ (Figure 9.12, bottom) shows 10% of the
monocomplex [Fe(DSA)] - at pH 2. Yet, the [Fe(DOTA-H)] and [Fe(DOTA)]-
complexes are still clearly dominant species in acidic solution. At physiological
pH 7.4 the [Fe(DSA)2]5- is the dominating species with 77% and only 23% of
the [Fe(DOTA)]- complex is present. This observation reveals the somewhat
stronger complex behaviour of DSA with Fe3+ to deferasirox.
We conclude, the iron-chelators deferasirox, MSA and DSA could cause
ligand exchange reactions with radiopharmaceuticals containing Ga3+-comp-
lexes such as Ga3+-DOTA. As a consequence, the iron-chelator is blocked by
Ga3+ and free unbound Fe3+ might be complexed by DOTA. Depending on the
concentrations of both deferasirox and DOTA in vivo they will be competing
ligands for the Fe3+ ion. A simultaneous administration of the iron-chelator de-
ferasirox and a 68Ga3+-containing radiopharmaceutical should consider the lig-
and exchange reaction which might influence the targeting of PET imaging. Al-
so chelating therapy with deferasirox might be influenced by free DOTA forming
complexes with unbound Fe3+.
On account of the high affinity of Ga3+ to deferasirox, perhaps deferasirox
could function as a promising 68Ga3+-chelator for future radiopharmaceuticals.
Accordingly, the Novartis Pharma AG [CH] has patented deferasirox and the
[Ga(L)2]3- complex of deferasirox as “gallium uptake enhancers” for diagnostic
purposes such as scintigraphy [144].

10 Linear free energy relation and discussion
249
10 Linear free energy relation and discussion
In the past the complex behaviour of the iron-chelating ligand deferasirox
and its water soluble derivative MSA has been studied with trivalent (Fe3+, Al3+)
and divalent (Cu2+, Zn2+, Mg2+, Ca2+) biometal ions [37, 40]. The main difficulty of
the investigations with potentiometric and spectrophotometric titrations was the
poor solubility of deferasirox in pure water (0.4 g/L, pH 7.4 [38]). Hence, titration
experiments were carried out in water/DMSO solution. Yet, still some titrations
experiments with deferasirox especially with the divalent biometal ions Cu 2+
and Zn2+ [37] and with the trivalent Ga3+ and Gd3+ ion, as shown in this work,
were hampered by precipitation. Therefore, the studies on the complexation of
deferasirox with these metal ions were hampered.
We developed ligands with the same structure as deferasirox only vary-
ing in the functional groups at the peripheral benzocarboxylic acid to enhance
water solubility. Yet, the coordination site of the ligands is st ill identical to de-
ferasirox preferring the tridentate meridional coordination mode. First the ligand
MSA with one sulfonic acid instead of the carboxylic acid in deferasirox was
designed and investigated [37, 40]. It was just soluble enough (0.7 g/L pure wa-
ter [37]) to perform titration experiments in pure water, however still precipitation
occurred during titration experiments with the metal ions Cu2+ and Zn2+.
Whereas, titrations with the ions Ga3+ and Gd3+, in this work, showed no pre-
cipitation and investigations were successful.
To further enhance water solubility and design a ligand with sufficient wa-
ter solubility to keep all complexes during titrations in solution we added a se-
cond sulfonic acid to the peripheral phenyl ring. The resulting ligand was DSA,
with its two sulfonic acids it is sufficiently soluble in pure water (8 g/L) even at
high concentrations. With the ligand DSA complexation with the divalent metal
ions Cu2+, Ni2+, Zn2+ and Cd2+ could be investigated in detail without precipita-
tion. Further, the trivalent metal ions Fe3+, Al3+, Ga3+ and Gd3+ have been suc-
cessfully studied without difficulties as well as the electrolytes Mg2+ and Ca2+.
By way of comparison, the complexes formed by deferasirox and DSA
are in the majority of cases very similar. Usually, mononuclear complexes of

10 Linear free energy relation and discussion
250
the composition [M(L)]z- (110), with one ligand and one metal ion, are formed
before a second ligand is bound to form bis-complexes of the composition
[M(L)2]z- (120). Protonated forms of both mono-complexes and bis-complexes
are observed for deferasirox and DSA depending on the type of central metal
ion. These protonated complexes can differ in coordination geometry influ-
enced by the different pKa value of the carboxylic acid functional group of de-
ferasirox pKa,1 =3.65(6) (extrapolated to pure water, T = 298 K, I = 0.1 KCl, see
8.1.1) in contrast to the strong acidity of the sulfonic acids, respectively the
pKa,2 = 1.33(8) (pure water, T = 298 K, I =0.1 KCl, see section 7.1.1) of the tri-
azole nitrogen of DSA. The sulfonic acids are not protonated in the investigated
pH range (pH 2 - 11) and the pKa,2 of DSA, is also too acidic for a protonation
in DSA-complexes. Therefore, DSA complexes are most likely protonated at
the phenolate group coupled with a bidentate coordination mode of DSA. That
is contrary to deferasirox which can form protonated complexes with a triden-
tate or a bidentate coordination mode with the proton found at the carboxylic
acid or hydroxyphenyl ring. Nevertheless, the coordination site of both ligands
is the ONO-site of the ligand.
The main complexes present in almost all investigations of deferasirox
and DSA with biometal ions are the [M(L)]z- and [M(L)2]z- complexes due to the
favoured tridentate meridional coordination mode. These two types of com-
plexes are especially suitable for a correlation by a linear free energy relation.
Linear free energy relations for stability constants of metal -ligand complexes
have been described and summarised very early by Irving and Rossotti [145].
They report on linear relationships between the stability constants of several
ligands L and P, with a series of metal ions, by plotting logKML as a function of
logKMP. The linear relationships are especially promising if the ligands com-
pared are very similar in stereochemistry, coordination properties and pKa val-
ues. The ligands deferasirox and DSA meet these requirements very well. The
pKa values relevant for the complexation of the 110 and 120 complexes are
primarily those of the hydroxyphenyl groups which have only minor differences.
Accordingly, we can correlate the stability constants of deferasirox to
DSA for those complexes that were investigated without difficulties in form of a
linear free energy relation. Of special interest is a linear free energy relation

10 Linear free energy relation and discussion
251
between deferasirox and DSA with stability constants in pure water solution.
Since stability constants of deferasirox cannot be measured in pure water, we
needed to estimate them by a linear extrapolation. The results of the extrapol a-
tion to xDMSO = 0.00 of the stability constants of deferasirox with the metal ions
Al3+, Mg2+ and Ca2+ were discussed in section 8. The main focus is on the 110
and 120 complexes. Yet a 120 complex for Ca2+ with deferasirox and DSA was
not found. However, the 120 complex of the Ga3+-deferasirox and Ga3+-DSA
system has been determined previously by acidimetric and alkalimetric titration
in pure water (see section 9.2.1 and 9.2.3) and is added to the linear free ener-
gy relation of the 120 complexes. The values applied for the linear free energy
relations are given in Table 10.1.
Table 10.1: Summary of the logβxyz [a]
values of deferasirox and DSA with selected metal ions used for the linear free energy relation for pure water, T = 298 K and I = 0.1 mol/L KCl.
logβxyz values for the linear free energy relation
deferasirox DSA
Mz+ logβ110 logβ120
logβ110 [e] logβ120 [e]
Fe3+ 22.0 [b] 36.9 [b] 23.54(4) 39.50(2)
Al3+ 15.9(1) [c] 29.0(5) [c] 18.77(1) 32.45(1)
Ga3+ - 33.8(1) [d] - 36.74(5)
Mg2+ 5.31(8) [c] 7.4(6) [c] 6.74(2) 9.1(2)
Ca2+ 3.28(7) [c] - 4.53(6) -
[a] For the ligand L logβxyz is defined as: βxyz = [MxLyHz] × [M]
-x × [L]
-y × [H]
-z.
[b] Values extrapolated for xDMSO = 0.00, taken from S. Steinhauser
[40].
[c] Values extrapolated for xDMSO = 0.00, this thesis section 8.
[d] Value taken from the Novartis Pharma AG Final Report
[72].
[e] Values determined in this thesis.
The linear free energy relations according to Irving and Rossotti [145] are
illustrated in Figure 10.1.

10 Linear free energy relation and discussion
252
Figure 10.1: Linear free energy relation obtained by plotting logβ110 (top), respectively logβ120 (bottom), for complexes of deferasirox as a function of the corresponding logβ for complexes of DSA with selected metal ions in pure water, T = 298 K and I = 0.1 mol/L KCl. Values ap-plied for the linear relationships are given in Table 10.1.
0 5 10 15 20 25
0
5
10
15
20
25
Fe3+
Al3+
Mg2+
Ca2+
log
110[d
efe
rasir
ox]
log110
[DSA]
5 10 15 20 25 30 35 40 45
0
5
10
15
20
25
30
35
40
Ga3+
Fe3+
Al3+
Mg2+
log
120[d
efe
rasir
ox]
log120
[DSA]

10 Linear free energy relation and discussion
253
As the diagram in Figure 10.1 shows, the two ligands are well correlated
in form of the linear free energy relation for the 110 complex (R = 0.99741) and
the 120 complex (R = 0.99936). The correlation is described by the calculated
linear regression equations in Table 10.2. For each linear relationship four
metal ions were applied. The linear relationship of the 110 complexes consists
of the metal ions Fe3+, Al3+, Mg2+ and Ca2+. Attributed to the absence of a 120
complex with the Ca2+ ion for both ligands the linear free energy relation is cal-
culated with the 120 complex of the Ga3+ ion in addition to Fe3+, Al3+ and Mg3+.
Unfortunately, only the 120 complex of the Ga3+-deferasirox system was de-
termined in pure water, so that we cannot apply the Ga3+ ion for the linear rela-
tion of the 110 complex.
Table 10.2: Linear regression equations calculated for the linear free energy relations of de-ferasirox and DSA illustrated in Figure 10.1 for pure water, T = 298 K and I = 0.1 mol/L KCl.
linear free energy relation between deferasirox and DSA
R [a] linear regression equation [b]
0.99741 logβ110 [deferasirox] = 0.96(5) × logβ110 [DSA] -1.2(8)
0.99936 logβ120 [deferasirox] = 0.96(2) × logβ120 [DSA] -1.5(8)
[a] R is the regression coefficient taken from Origin 6.0G.
[b] Linear regression equation was taken from the program Origin 6.0G.
This correlation may now be used to estimate values of stability con-
stants of deferasirox with biometal ions that cannot be determined directly in
pure water. As a result we have calculated the overall stability constants
logβ110 and logβ120 for deferasirox in pure water from the determined corre-
sponding complexes with DSA discussed in this work. The measured overall
stability constants of DSA with the metal ions Mz+ and the calculated values for
deferasirox are presented in Table 10.3.

10 Linear free energy relation and discussion
254
Table 10.3: Estimation of the overall stability constants logβxyz [a]
of deferasirox with the metal ions M
z+ by calculation from the corresponding overall stability constants of DSA with the line-
ar regression equations of the linear free energy relation (Table 10.2). Conditions for the sta-bility constants are pure water, T = 298 K and I = 0.1 mol/L KCl.
estimated logβxyz [a] values for deferasirox in pure water
deferasirox DSA
Mz+ logβ110 [b] logβ120 [b] logβ110 [d] logβ120 [d]
Ga3+ 19.6 33.8(1) [c] 21.68(6) 36.74(5)
Gd3+ 10.3 18.3 12.01(3) 20.61(2)
Cu2+ 16.0 19.4 17.93(2) 21.8(2)
Ni2+ 10.1 15.1 11.76(9) 17.24(6)
Zn2+ 9.4 13.3 11.00(1) 15.37(6)
Cd2+ 6.4 10.3 7.87(1) 12.24(3)
[a] For the ligand L logβxyz is defined as: βxyz = [MxLyHz] × [M]
-x × [L]
-y × [H]
-z.
[b] Calculated values with the linear regression equations in Table 10.2, except logβ120 Ga
3+.
[c] Value taken from the Novartis Pharma AG Final Report
[72].
[d] Values determined in this thesis.
In general, the linear free energy relations illustrate that the stability con-
stants of DSA are always somewhat higher than those of deferasirox. This can
be attributed to the higher negative charge of the DSA complexes due to the
higher charge of the fully deprotonated ligand L4- in contrast to the fully depro-
tonated ligand L3- deferasirox.
By means of comparison the stability constants logβ110 and logβ120 of the
trivalent metal ions are in the order Fe3+ > Ga3+ > Al3+ >> Gd3+ for both ligands.
The individual stability constants for these [M(deferasirox)2]3- complexes are
logK120 14.9 > 14.2 > 13.1 >> 8.0 (logK120 = [ML2] / [ML] × [L]). This Ga3+ com-
plex is only 0.7 units smaller than the Fe3+ complex making Ga3+ a strong com-
petitor for complex formation with the ligand deferasirox. This issue deserves
special attention when administration of Ga3+ containing radiopharmaceuticals
is intended for PET imaging to a patient during iron-chelation therapy with de-

10 Linear free energy relation and discussion
255
ferasirox. The much lower stability constant of the Gd3+-deferasirox system
makes a simultaneous administration of a Gd3+ containing MRI contrast agent
and deferasirox rather unproblematic with regard to ligand exchange reactions.
The important complex at physiological pH 7.4 is usually the [M(L)2]z- complex
which is present to > 95% for Fe3+, Ga3+ and Al3+ with DSA. The Gd3+ ion with
the weakest stability in this order is found to about 75% as [M(L)] z- complex
and only 15% [M(L)2]z- complex at pH 7.4. The corresponding deferasirox com-
plexes will be present at similar high concentrations.
The divalent metal ions form [M(L)]z- complexes with both ligands with
decreasing stability in the order Cu2+ > Ni2+ > Zn2+ > Cd2+ > Mg2+ > Ca2+. This
order is concordant with our expectations with regard to ligand-field stabilisa-
tion energy of the transition metal ions and ionic size.
The [Cu(L)]z- complexes of both deferasirox and DSA most probably
adopt a tridentate meridional coordination which allows the octahedral coord i-
nation geometry to distort according to the Jahn-Teller effect which is typical
for the d9 electronic configuration. Through the Jahn-Teller effect the Cu2+
complexes gain on stability compared to the d8 electronic configuration of the
[Ni(L)]z- complex which is stabilised itself by ligand-field stabilisation energy.
The tridentate meridional coordination mode is supported by two crystal struc-
tures obtained of the [Cu(DSA)(HCO3)]3- complex (see section 7.3.3).
In contrast, Zn2+ and Cd2+ do not experience ligand-field stabilisation en-
ergy due to the fully populated d10 electronic state resulting in lower values for
the overall stability constants compared to the Cu2+ and Ni2+ ion complexes.
The metal ion Cd2+ (logβ110 = 6.4) forms a somewhat less stabile 110 complex
than Zn2+ (logβ110 = 9.4) with the iron-chelating ligand deferasirox which is to a
high extent attributed to the larger ionic radius of Cd 2+ (CN: 6, r = 0.95 Å [118])
compared to Zn2+ (CN: 6, r = 0.740 Å [118]) causing higher strain [40] to the tri-
dentate coordination mode of the iron-chelators deferasirox and DSA. However
we need to note that possible chlorocomplexes of Cd2+, influencing the stability
constants, have not been taken into account.
In general, Mg2+ and Ca2+ ions are not dedicated to forming stabile com-
plexes with the ligands deferasirox [37-38] and DSA. The smaller Mg2+ ion

10 Linear free energy relation and discussion
256
(CN: 6, r = 0.720 Å [118]) fits better into the ONO-coordination site and forms
stronger complexes with the iron-chelators than the much larger Ca2+ ion
(CN: 6, r = 1.00 Å [118]) [40]. The complex formation of deferasirox and DSA with
these electrolytes is rather weak preferably forming the [M(L)]z- complex at ele-
vated pH > 7.
The order of the individual stability constants logK120 (logK120 = [ML2] /
[ML] × [L]) of the [M(L)2]z- complexes of both iron-chelating ligands deferasirox
and DSA with the divalent metal ions Ni2+ > Zn2+ = Cd2+ > Cu2+ > Mg2+ deviates
from the order of the [M(L)]z- complexes discussed above. Unfortunately, no
bis-complexes were determined of deferasirox and DSA with the metal ion
Ca2+. The individual stability constant of the Cu2+ complex with deferasirox
logK120 = 3.4 (logK120 = [ML2] / [ML] × [L]) is much smaller than the correspond-
ing Ni2+ complex with logK120 = 5.0 and even somewhat smaller than the Zn2+
and Cd2+ complexes with both logK120 = 3.9. Only the Mg2+ ion forms a weaker
[M(L)2]z- complex (logK120 = 2.1). This observation can be explained by the
Jahn-Teller effect on the [Cu(L)2]z- complex. Two ligands deferasirox (or DSA)
in the bis-complex presumably adopt the tridentate meridional coordination
mode and all four positions of the octahedron are occupied. If the octahedron
follows the Jahn-Teller effect stretching the two axial bonds the ligand will also
need to stretch. In this Cu2+ bis-complex the ligand deferasirox (or DSA) is ei-
ther strained by the Jahn-Teller effect or the Jahn-Teller effect is suppressed
by the ligand geometry. In either case it is obvious that the [Cu(L) 2]z- complex
is clearly not favoured resulting in a low formation constant. The Ni 2+-
deferasirox and -DSA systems are not distorted by the Jahn-Teller effect and
accordingly the 120 complex is much more stable.
Interestingly, the two transition metal ions Zn2+ and Cd2+ with a d10 elec-
tronic configuration adopt the same value for the individual stability constant
logK120 = 3.9 (T = 298 K, I = 0.1 mol/L KCl) of the [M(L)2]4- complex of defer-
asirox. In contrast, the stability constant of the [Cd(L)]- complex of the Cd2+-
deferasirox system is 3.0 units smaller than the corresponding Zn 2+-deferasirox
complex, the [Cd(DSA)]2- complex differs by 3.13 units from the [Zn(DSA)]2-
complex. The determination of the stability constants of the Cd2+-deferasirox
system are based on the ones determined with the Cd2+-DSA system which

10 Linear free energy relation and discussion
257
were measured in a potassium chloride medium (T = 298 K, I = 0.1 mol/L KCl).
As pointed out in section 7.6 the metal ion Cd2+ has a stronger tendency to
form chlorocomplexes ([CdCl]+ complex with logK110 = 1.52(7), T = 298 K,
I = 0.1 mol/L) [55]) than for example the Zn2+ ion ([ZnCl]+ complex with
logK110 = 0.4(1), T = 298 K, I = 0.1 mol/L) [55]). For the evaluation of the
Cd2+-DSA titrations the chlorocomplexes were not taken into account. Which
means that possible individual formation constants logKxyzq of mixed Cd2+-
chloro-DSA complexes [Cdx(L)y(H)z(Cl)q] could be included in the overall stabil-
ity constants logβ110 and logβ120. The formation constant of the [Cd(DSA)]2-
complex is 3.13 units smaller in comparison to the [Zn(DSA)]2- complex. This
order is in accordance with our expectations. In contrast, the stability constant
of the [Cd(DSA)2]6- complex logK120 = 4.37 (logK120 = [ML2] / [ML] × [L]) is obvi-
ously elevated in contrast to the corresponding [Zn(DSA) 2]6- complex with the
same logK120 = 4.37 value. This result is rather unusual and may be clarified by
titration experiments in a chloride free medium.
In conclusion, possible mixed DSA and chloro-complexes are assumingly
responsible for the elevated logβ120 = 4.37 value of the [Cd(DSA)2]6- complex.
Since the Cd2+-deferasirox system is based on the Cd2+-DSA system the ele-
vated values calculated for Cd2+-deferasirox can be explained by the same
origin. For future investigations with the metal ion Cd2+ the stability constants
of the Cd2+-DSA system should be measured in a chloride free supporting elec-
trolyte such as KNO3 to avoid chlorocomplexes.
The ligand deferasirox is the active component in the pharmaceutical
Exjade® applied for the treatment of iron overload. Our investigations have led
to the order of the stability constants of deferasirox with the trivalent and diva-
lent metal ions presented in Scheme 10.1. The order confirms that the highest
stability constants of deferasirox have been found with the metal ion Fe 3+.

10 Linear free energy relation and discussion
258
deferasirox
logK110 = log ([ML] / [M] × [L]):
Fe3+ > Ga3+ > Cu2+ > Al3+ >> Gd3+ > Ni2+ > Zn2+ > Cd2+ > Mg2+ > Ca2+
22.0 > 19.6 > 16.0 > 15.9 >> 10.3 > 10.1 > 9.4 > 6.4 > 5.3 > 3.3
logK120 = log ([ML2] / [ML] × [L]):
Fe3+ > Ga3+ > Al3+ >> Gd3+ > Ni2+ > Zn2+ = Cd2+ > Cu2+ > Mg2+
14.9 > 14.2 > 13.1 >> 8.0 > 5.0 > 3.9 = 3.9 > 3.4 > 2.1
Scheme 10.1: Descending order of the metal ion complex stability constants [M(L)]z-
or [M(L)2]
z- of deferasirox in pure water, T = 298 K and I = 0.1 mol/L KCl. Values were estimated
either by extrapolation for xDMSO = 0.00 or by calculation from the linear free energy relation based on the DSA stability constants.
However, the stability constants logK110 and logK120 do not reveal much
about the effectiveness of the ligand deferasirox binding Fe3+ in contrast to the
other metal ions at physiological pH 7.4. A suitable standard for comparing the
affinity of a ligand for a metal ion is the pM value [146]. The pM value describes
the concentration of free [M(H2O)6]z+ in a solution with a total metal ion concen-
tration [M]t = 1.0 µmol/L and a total ligand concentration [L]t = 10.0 µmol/L at
the physiologically important pH 7.4. The higher the pM value the less free Mz+
is in solution and the higher is the affinity of the ligand to forming complexes
with the specific metal ion. The pM values for the ligand deferasirox and DSA
with the investigated trivalent and divalent metal ions, calculated with the de-
termined stability constants of all complexes, are given in Table 10.4.

10 Linear free energy relation and discussion
259
Table 10.4: Calculated pM [a]
values for the ligand deferasirox and DSA for pure water, pH = 7.4, [M]t = 1.0 µmol/L and [L] t = 10.0 µmol/L. Calculations were performed with the pro-gram Hyss2006
[147].
estimated pM [a] values
Mz+ pM for deferasirox pM for DSA [d]
Fe3+ 22.2 [b] ; 23.5 [c] 23.6
Ga3+ 19.1 [e] 20.8
Al3+ 14.3 [f ] 16.5
Gd3+ 6.3 [e] 7.1
Cu2+ 11.7 [e] 13.0
Ni2+ 6.2 [e] 7.0
Zn2+ 6.1 [e] 6.4
Cd2+ 6.0 [e] 6.0
Mg2+ 6.0 [f ] 6.0
Ca2+ 6.0 [f ] 6.0
[a] Definition pM = -log[M
z+].
[b] The pM values were calculated from the stability constants in Table 9.15
taken from S. Steinhauser [40]
and the pKa values in Table 8.2. [c]
Value taken from S. Steinhauser [148]
. Calculated with stability constants for pure water (see also Table 9.15) and pKa,1 = 3.7(1), pKa,2 = 8.80(1) and pKa,3 = 10.61(1) from S. Steinhauser
[40].
[d] The pM values were calculated from the stability constants and pKa val-
ues from this thesis. [e]
The pM values were calculated from the stability constants in Table 10.3 and the pKa values in Table 8.2. [ f]
The pM values were calculated from the stability constants in Table 10.1 and the pKa values in Table 8.2.
The main advantage of the comparison by pM value is that all complexes
are taken into account not just one complex as in Scheme 10.1. As we ex-
pected the pFe value is the highest pM value for both ligands deferasirox and
DSA. This value shows the strong affinity of the ligand deferasirox towards the
metal ion Fe3+ even at low concentrations. The pFe = 22.2 is calculated with

10 Linear free energy relation and discussion
260
the pKa values for deferasirox determined in this thesis (Table 8.2) and the
stability constants for pure water determined by extrapolation from S. Stein-
hauser [40]. The previously reported pFe = 23.5 has been calculated by the
same stability constants from S. Steinhauser [40] but with the previously in pure
water determined pKa values also from S. Steinhauser [40]. In comparison, the
pM values of DSA are somewhat higher than those of deferasirox which is pre-
sumably attributed to the higher negative charge of the ligand DSA. The pM
values are also strongly dependent on the pKa values of the ligand which have
been considered in the calculation. The pGa, pAl and pCu values are also quite
high, yet not as high as the pFe. A pM value of 6 for example calculated for
Cd2+, Mg2+ and Ca2+ reveals that no complex has been formed at all. Other pM
values somewhat higher than the value 6 such as Gd3+, Ni2+ and Zn2+ show on-
ly little complex formation.
Further, our study aimed at investigating the complex behaviour towards
divalent transition metal ions in particular essential trace elements such as
Cu2+ and Zn2+. The formation of polymeric structures has first been reported by
Ryabukhin for the Cu2+, Ni2+ and Co2+ complexes of the 1N-phenyl derivative of
deferasirox [41]. Further, Liu and Hider [149] have applied the tendency of the
1N-phenyl derivative to form polymers on the iron-chelator deferasirox and
claim it has a high affinity to Zn2+. Owing to precipitation during titration exper-
iments of Cu2+ and Zn2+ with deferasirox this assertion has not been clarified.
Our titration experiments of the ligand DSA with Cu2+ and Zn2+ were not ham-
pered by precipitation so that the complex formation was elucidated with differ-
ent molar ratios in pure water.
The titration experiments with DSA and the divalent metal ions Cu 2+, Zn2+
and Cd2+ gave rise to hydroxo-bridged dinuclear complexes of the composition
[M2(DSA)2(OH)]5- and [M2(DSA)2(OH)2]6- next to the well-known mononuclear
complexes with one central metal ion. The divalent metal ion Ni2+ prefers a
phenoxo-bridged [M2(DSA)2]4- and a hydroxo-bridged [M2(DSA)2(OH)]5- com-
plex. These complexes are presumably aggregation compounds of the mono-
nuclear complexes. A suggestion is a tridentate coordination mode of the lig-
and DSA with one or two hydroxo-bridges, respectively phenoxo-bridges, con-
necting two monomeric ligand entities. These complexes do not show any ten-

10 Linear free energy relation and discussion
261
dency to form polymeric structures. Most of these complexes appear in alkaline
solution and are, if present at all at physiological pH 7.4 , only minor species.
The dominant species in DSA solutions with the divalent metal ions Cu2+ and
Zn2+ at pH 7.4 is the [M(DSA)]2- complex with a concentration > 95%. An ex-
ception is the Ni2+-DSA system where at pH 7.4 the [Ni(DSA)]2- complex ap-
pears with a concentration of ≈ 50% and the [Ni 2(DSA)2]4- complex with ≈ 45%.
The Cd2+-DSA system only has little complex formation of mono-complexes at
pH 7.4 and > 80% free Cd2+ ion. The species models found with the best calcu-
lated fit for the simultaneous evaluation of the titrations with different molar ra-
tios all show only mononuclear and dinuclear complexes. The crystal structures
from an alkaline solution of Cu2+-DSA also confirm the favoured tridentate co-
ordination of the ligand DSA in the [Cu(DSA)]2- complex entity.
However, it needs to be mentioned that some individual titrations of the
Cu2+-DSA system and the Zn2+-DSA system could be evaluated with a dinucle-
ar [Cu2(DSA)] or [Zn2(DSA)] complex. This type of complex affords a bidentate
coordination mode of the ligand DSA and might be a prerequisite for polymeric
structures. Since these dinuclear [Cu2(DSA)] or [Zn2(DSA)] complexes could
not be calculated from the simultaneous evaluations they were not taken into
account for the final species models. Despite the above, we need to note that
we cannot exclude the formation of a [Cu2(DSA)] or [Zn2(DSA)] complex in so-
lution. The investigations of a frozen solution of the Cu2+-DSA system at pH 2.7
with EPR spectroscopy revealed an additional half field signal assigned to the
forbidden transition Δms = ±2. This might be evidence for a Cu2+-Cu2+ interac-
tion as expected for the [Cu2(DSA)] complex.
The conclusion we can draw from the Cu2+-DSA investigations for the
Cu2+-deferasirox system is that only indirect evidence for polymeric structures
was found. This confirms the results of the EPR spectroscopic investigations of
the green precipitate from Cu2+-deferasirox titrations. Freshly precipitated solid
showed a mononuclear structure in the EPR spectrum which we suggest re-
sults from the uncharged [Cu(LH)] complex of deferasirox. It is not unlikely that
this mononuclear uncharged complex exists over a large pH range (precipitate
was observed from pH 2 – 12.5 water/DMSO xDMSO = 0.20) and finally dis-
solves in alkaline solution by forming the bis-complex, which is less stable due

10 Linear free energy relation and discussion
262
to the Jahn-Teller effect. However, evidence for a change in the structure, per-
haps to a polymer, was found when the spectra of an altered probe (two
months old) of the solid were recorded. Concluding, we have found little evi-
dence for polymeric structures. The majority of our investigations on the M2+-
DSA/-deferasirox systems confirm the formation of only mononuclear or hy-
droxo-/phenoxo-bridged dinuclear complexes.
Our investigations show that the iron-chelating ligand deferasirox has the
highest pFe value. Additionally, the investigations with divalent transition metal
ions could not confirm the formation of polymeric structures in solution, which
does not mean they do not exist. Some evidence for the possible existence of
polymeric structure cannot be denied. Whereas it seems, as if the impact of
polymeric structures on the complex behaviour of deferasirox with metal ions is
rather negligible.

11 Experimental Section
263
11 Experimental Section
11.1 Ligand synthesis
11.1.1 Synthesis of 2-(2-hydroxyphenyl)-benzo-4H-[1,3]-oxazin-4-one
Salicylic acid (24.90 g, 0.18 mol) and salicylamide (20.90 g, 0.15 mol)
were dissolved in 30 mL xylene (an isomeric mixture) with 1.5 mL pyridine un-
der reflux (oil bath temperature 160°C). Over a period of 4 h, thionyl chloride
(23.7 mL, 0.33 mol; ρ25°C = 1.631 g/cm3) was added slowly under reflux to the
vigorously stirred mixture. During the addition an evolution of sulphur dioxide
and hydrochloric acid was observed. After completion of adding the thionyl
chloride the reaction mixture was stirred for another 30 min. While the solution
cooled to ambient temperature the product started to crystallize. The obtained
solid was filtered and suspended in a mixture of 60 mL ethanol and 1.5 mL ace-
tic acid. The suspension was shortly refluxed (at an oil bath temperature of
40°C) and allowed to cool to ambient temperature. The received yellow col-
oured precipitate had been filtered and recrystallized from 70 mL
2-methoxyethanol to give bright yellow needles of 2-(2-hydroxyphenyl)-benzo-
4H-[1,3]-oxazin-4-one, yielding 17.59 g (73.53 mmol; 49% referring to salic-
ylamide).

11 Experimental Section
264
Characterisation:
1H-NMR (D6-DMSO, TMS):
2-(2-hydroxyphenyl)-benzo-4H-[1,3]-oxazin-4-one
δ (ppm) = 7.06 - 7.11 (m, 2H); 7.59 - 7.65 (m, 2H); 7.79 (d, 1H, 3J = 8.3 Hz);
7.94 (dt, 1H, 3J = 8.3 Hz, 4J = 1,7 HZ); 8.07 (dd, 1H, 3J = 7.8 Hz, 4J = 1.7 Hz);
8.20 (dd, 1H, 3J = 8.1 Hz, 4J = 1.7 Hz)
13C-NMR (D6-DMSO, TMS):
2-(2-hydroxyphenyl)-benzo-4H-[1,3]-oxazin-4-one
δ (ppm) = 111.39; 117.41; 117.76; 117.91; 119.51; 126.70; 127.13; 128.92;
135.94; 135.65; 153.81; 161.79; 163.38; 164.75
1H-NMR (D6-DMSO, TMS):
2-hydroxy-N-(2-hydroxybenzoyl)-benzamide
δ (ppm) = 6.98 (t, 2H, 3J = 7.8 Hz); 7.02 (d, 2H, 3J = 8.3 Hz); 7.46 (dt, 2H,
3J = 8.3 Hz, 4J = 1.7 Hz); 7.84 (dd, 2H, 3J = 7.8 Hz, 4J = 1.8 Hz)
13C-NMR (D6-DMSO, TMS):
2-hydroxy-N-(2-hydroxybenzoyl)-benzamide
δ (ppm) = 117.00; 118.85; 119.59; 130.56; 134.20; 156.82; 164.46
Elemental analysis:
of a mixture of 2-(2-hydroxyphenyl)-benzo-4H-[1,3]-oxazin-4-one and
2-hydroxy-N-(2-hydroxybenzoyl)-benzamide
M [C14H9NO3] = 239.23 g/mol
% calculated: C: 70.29; H: 3.80; N: 5.86
% found: C: 69.51; H: 3.86; N: 5.90
ESI-mass spectroscopy:
2-(2-hydroxyphenyl)-benzo-4H-[1,3]-oxazin-4-one
ESI+-MS: [m/z] = 240 [LH2]+; ESI--MS: [m/z] = 238 [L]-
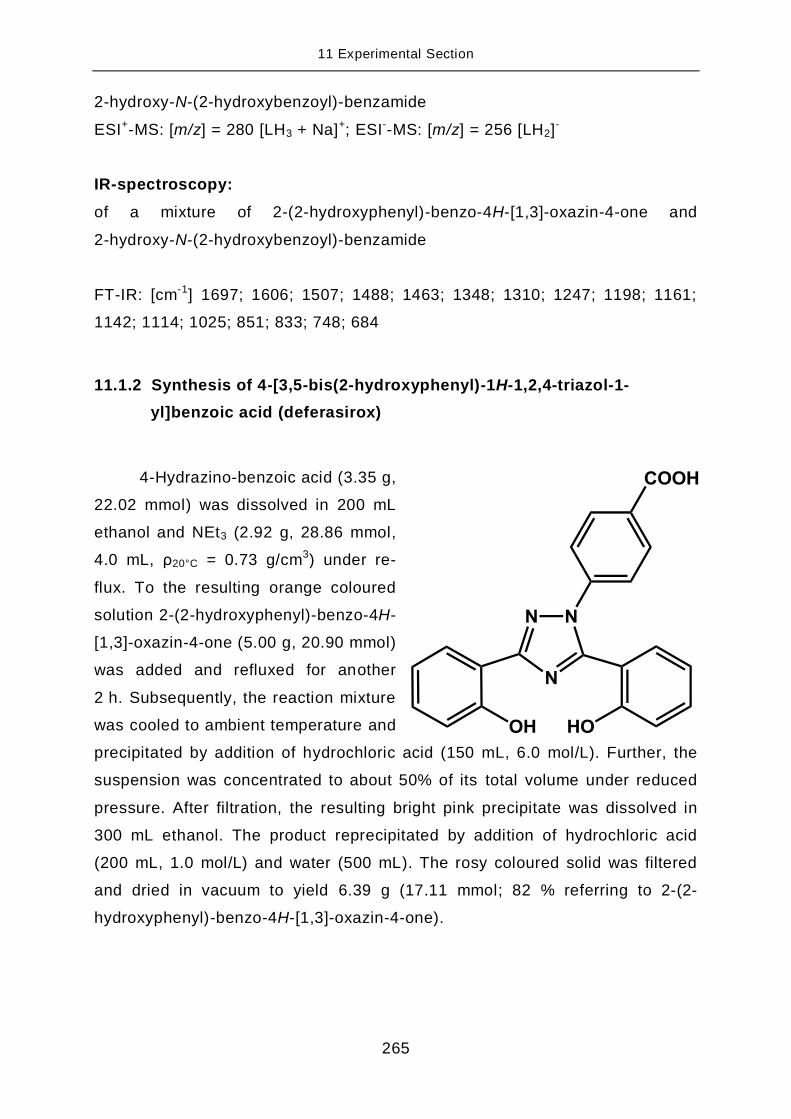
11 Experimental Section
265
2-hydroxy-N-(2-hydroxybenzoyl)-benzamide
ESI+-MS: [m/z] = 280 [LH3 + Na]+; ESI--MS: [m/z] = 256 [LH2]-
IR-spectroscopy:
of a mixture of 2-(2-hydroxyphenyl)-benzo-4H-[1,3]-oxazin-4-one and
2-hydroxy-N-(2-hydroxybenzoyl)-benzamide
FT-IR: [cm-1] 1697; 1606; 1507; 1488; 1463; 1348; 1310; 1247; 1198; 1161;
1142; 1114; 1025; 851; 833; 748; 684
11.1.2 Synthesis of 4-[3,5-bis(2-hydroxyphenyl)-1H-1,2,4-triazol-1-
yl]benzoic acid (deferasirox)
4-Hydrazino-benzoic acid (3.35 g,
22.02 mmol) was dissolved in 200 mL
ethanol and NEt3 (2.92 g, 28.86 mmol,
4.0 mL, ρ20°C = 0.73 g/cm3) under re-
flux. To the resulting orange coloured
solution 2-(2-hydroxyphenyl)-benzo-4H-
[1,3]-oxazin-4-one (5.00 g, 20.90 mmol)
was added and refluxed for another
2 h. Subsequently, the reaction mixture
was cooled to ambient temperature and
precipitated by addition of hydrochloric acid (150 mL, 6.0 mol/L). Further, the
suspension was concentrated to about 50% of its total volume under reduced
pressure. After filtration, the resulting bright pink precipitate was dissolved in
300 mL ethanol. The product reprecipitated by addition of hydrochloric acid
(200 mL, 1.0 mol/L) and water (500 mL). The rosy coloured solid was filtered
and dried in vacuum to yield 6.39 g (17.11 mmol; 82 % referring to 2-(2-
hydroxyphenyl)-benzo-4H-[1,3]-oxazin-4-one).

11 Experimental Section
266
Characterisation:
1H-NMR (D6-DMSO, TMS):
δ (ppm) = 6.88 (d, 1H, 3J = 8.3 Hz); 6.98 - 7.05 (m, 3H); 7.36 - 7.43 (m, 2H);
7.55 - 7.58 (m, 3H); 8.01 (d, 2H, 3J = 8.3 Hz); 8.08 (dd, 1H, 3J = 7.9 Hz,
4J = 1.7 Hz); 10.07 (s, 1H, OH); 10.81 (s, 1H, OH)
13C-NMR (D6-DMSO, TMS):
δ (ppm) = 113.55; 114.30; 116.03; 116.97; 119.36; 119.60; 123.23 (2C);
126.68; 130.20 (2C); 130.44; 130.97; 131.37; 132.46; 141.10; 151.93; 155.08;
156.24; 159.80; 166.33
Elemental analysis:
M [C21H15N3O4] = 373.37 g/mol
% calculated: C: 67.56; H: 4.05; N: 11.26
% found: C: 67.41; H: 4.28; N: 11.13
ESI-mass spectroscopy:
ESI+-MS: [m/z] = 374 [LH4]+; ESI--MS: [m/z] = 372 [LH2]-
IR-spectroscopy:
FT-IR: [cm-1] 3316; 1678; 1607; 1585; 1517; 1495; 1479; 1451; 1431; 1416;
1351; 1278; 1223; 1155; 1037; 991; 948; 905; 852; 827; 807; 752; 705; 686;
660

11 Experimental Section
267
11.1.3 Synthesis of 4-[3,5-bis(2-hydroxyphenyl)-1H-1,2,4-triazol-1-
yl]benzenesulfonic acid (MSA)
4-Hydrazino-benzosulfonic acid
hemihydrate (2.51 g, 12.75 mmol) dis-
solved under reflux in a solution of
300 mL ethanol with NEt3 (1.29 g,
12.75 mmol, 1.77 mL, ρ20°C = 0.73
g/cm3). Addition of 2-(2-hydroxyphenyl)-
benzo-4H-[1,3]-oxazin-4-one (3.00 g,
12.54 mmol) to the boiling solution was
followed by further reflux of the reaction
mixture for 24 h. After cooling the solu-
tion to ambient temperature the crude product precipitated by addition of hy-
drochloric acid (80 mL, 6 mol/L). For sufficient precipitation the suspension was
concentrated to about 50% of its total volume under reduced pressure. The
product was filtered and washed with a small amount of cold water to result a
white solid which was dried in vacuum to yield 4.27 g (9.99 mmol, 80 % refer-
ring to 2-(2-hydroxyphenyl)-benzo-4H-[1,3]-oxazin-4-one).
Characterisation:
1H-NMR (D6-DMSO, TMS):
δ (ppm) = 6.88 (d, 1H, 3J = 8.1 Hz); 6.96 - 7.05 (m, 3H); 7.36 - 7.43 (m, 4H);
7.52 (dd, 1H, 3J = 7.5 Hz, 4J = 1.7 Hz); 7.67 (dd, 2H, 3J = 7.1 Hz, 4J = 1.7 Hz);
8.05 (dd, 1H, 3J = 7.8 Hz, 4J = 1.5 Hz)
13C-NMR (D6-DMSO, TMS):
δ (ppm) = 113.68; 114.23; 116.24; 117.10; 119.45; 119.79; 123.16 (2C); 126.56
(2C); 126.95; 131.16; 131.57; 132.60; 137.73; 148.23; 151.80; 155.39; 156.39;
159.31

11 Experimental Section
268
Elemental analysis:
M [C20H15N3O5S · H2O] = 427.43 g/mol
% calculated: C: 56.20 ; H: 4.01; N: 9.83
% found: C: 56.07; H: 4.10; N: 9.69
ESI-mass spectroscopy:
ESI+-MS: [m/z] = 409 [LH4]+; ESI--MS: [m/z] = 410 [LH2]-
IR-spectroscopy:
FT-IR: [cm1-] 3198; 2901(bs); 2688; 2572; 1608; 1556; 1525; 1482; 1403; 1358;
1315; 1211; 1166; 1130; 1079; 1038; 1013; 975; 821; 768; 749; 706; 688
11.1.4 Synthesis of 2-hydrazinylbenzene-1,4-disulfonic acid · HCl (DSH)
Aniline-2,5-disulfonic acid (15.00 g,
59.23 mmol) was dissolved in a solution of so-
dium carbonate (3.14 g, 29.63 mmol) in pure
water (60 mL). After filtration, the solution
cooled down to 0°C in an ice bath and concen-
trated hydrochloric acid (1.18 g) was added.
Within 15 min a solution of sodium nitrite
(3.02 g, 43.77 mmol) dissolved in 20 mL pure water was slowly added to pre-
vent the temperature from rising above 12°C. Occasionally, addition of concen-
trated hydrochloric acid adjusted the pH to 0, if necessary. After the complete
addition of sodium nitrite and a final adjustment of the pH to 0 the solution was
stirred at 0°C for an additional 30 min. The resulting precipitate was filtered and
the moist pale white diazonium salt was passed on to the next step without fu r-
ther purification.
Sodium sulphite (20.63 g, 163.68 mmol) was dissolved in pure water
(140 mL) and cooled to 0°C in an ice bath. Addition of the moist diazonium salt
in portions to the vigorously stirred solution kept the temperature below 5°C.
The reddish solution was stirred for an hour at 0°C. Subsequently, the tempera-

11 Experimental Section
269
ture was allowed to rise to ambient temperature and then refluxed for an hour.
After adding concentrated hydrochloric acid (52.5 mL) carefully, the mixture
was again refluxed for an additional hour. The reaction mixture was cooled to
ambient temperature and stirred for 12 h. Further, the suspension was concen-
trated to about 50% of its total volume under reduced pressure. The obtained
pale white precipitate was filtered and dried for 24 h in vacuum to yield 11.22 g
(32.98 mmol, 75 % relating to sodium nitrite).
Characterisation:
1H-NMR (D2O, D4-TMPS):
δ (ppm) = 7.49 (d, 1H, 4J = 1.7 Hz); 7.56 (dd, 1H, 3J = 8.0 Hz, 4J = 1.7 Hz);
7.94 (d, 1H, 3J = 8.1 Hz)
13C-NMR (D2O, D4-TMPS):
δ (ppm) = 113.64; 122.19; 131.92; 134.09; 144.05; 149.25
Elemental analysis:
M [C6H8N2O6S2 · (HCl) · (Na2SO4)1/10] = 316.63 g/mol
% calculated: C: 22.76 ; H: 2.87; N: 8.85
% found: C: 22.77; H: 2.71; N: 8.78
ESI-mass spectroscopy:
[m/z] = 267 (M-H)
IR-spectroscopy:
FT-IR: [cm-1] 3302; 2960; 1604; 1541; 1412; 1187; 1059; 1016; 857; 837; 663;
628; 589; 545; 519; 504

11 Experimental Section
270
11.1.5 Synthesis of 2-[3,5-bis(2-hydroxyphenyl)-1H-1,2,4-triazol-1-
yl]benzene-1,4-disulfonic acid (DSA)
To a solution mixture of NEt3
(3.74 g, 36.96 mmol, 5.12 mL, ρ20°C =
0.73 g/cm3) in 600 mL of boiling metha-
nol 2-hydrazinylbenzene-1,4-disulfonic
acid hydrochloride (5.40 g, 17.05 mmol)
was added in portions and dissolved
sufficiently. A slight turbidity of the solu-
tion could be observed. To the boiling
reaction mixture 2-(2-Hydroxyphenyl)-
benzo-4H-[1,3]-oxazin-4-one (4.46 g,
18.64 mmol) was added and refluxed for 24 h. The reaction mixture was al-
lowed to cool to ambient temperature and hydrochloric acid (500 mL, 6 mol/L)
was added carefully until some white precipitate was observed. Further, the
mixture was concentrated to a total volume of 50% under reduced pressure and
the white precipitate was filtered off, suspended in hydrochloric acid (100 mL,
6 mol/L) and heated gently. After cooling the suspension to ambient tempera-
ture the precipitate was filtered and washed with cold hydrochloric acid
(6 mol/L) and dried in vacuum for 24 h. To reprecipitate the product the white
solid was added to just enough methanol to entirely dissolve it. After filtering
the clear solution, ethyl acetate was added until quantitative precipitation had
occurred. The product was filtered off again and dried in vacuum for 48 h. Sub-
sequently, the product was exposed to the air for several days to achieve an
equilibrium state of water absorption. The product obtained as a white solid
forming the pentahydrate yielded 4.08 g (7.04 mmol, 40 % relating to
2-hydrazinylbenzene-1,4-disulfonic acid hydrochloride).

11 Experimental Section
271
Characterisation:
1H-NMR (D2O/NaOD, D4-TMPS):
δ (ppm) = 6.41 (dt, 1H, 3J = 8.3 Hz, 4J = 1.2 Hz); 6.61 (d,1H, 3J = 7.6 Hz); 6.70
(dt, 1H, 3J = 8.3, Hz, 4J = 1.2 Hz); 6.80 (dd, 1H, 3J = 8.3 Hz, 4J = 0.9 Hz); 7.13 -
7.20 (m, 2H); 7.29 (dt, 1H, 3J = 8.3 Hz, 4J = 2.0 Hz); 7.69 (dd, 1H, 3J = 7.6 Hz,
4J = 2.0 Hz); 7.94 (d, 1H, 4J = 2.0 Hz); 7.97 (dd, 1H, 3J = 8.3 Hz, 4J = 1.7 Hz);
8.12 (d, 1H, 4J = 8.3)
1H-NMR (D6-DMSO, TMS):
δ (ppm) = 6.74 (dt, 1H, 3J = 7.6 Hz, 4J = 1.0 Hz); 6.97 (dd, 1H, 3J = 8.5 Hz,
4J = 1.0 Hz); 7.01 (dt, 1H, 3J = 8.3 Hz, 4J = 1.0 Hz); 7.05 (dd, 1H, 3J = 8.3 Hz,
4J = 0.9 Hz); 7.30 - 7.34 (m, 2H); 7.40 (dt, 1H, 3J = 8.3 Hz, 4J = 1.7 Hz); 7.63
(d, 1H, 4J = 1.7 Hz); 7.79 (dd, 1H, 3J = 8.3 Hz, 4J = 1.7 Hz); 7.92 (d, 1H,
3J = 8.3 Hz); 7.94 (dd, 1H, 3J = 7.8 Hz, 4J = 1.7 Hz)
13C-NMR (D2O/NaOD, D4-TMPS):
δ (ppm) = 115.58; 116.86; 118.98; 122.03; 122.89; 123.31; 129.73; 130.32;
132.56; 133.53; 133.84; 134.11; 134.85; 136.95; 145.11; 148.36; 159.64;
164.40; 168.10; 169.34
13C-NMR (D6-DMSO, TMS):
δ (ppm) = 110.36; 112.70; 116.35; 116.62; 118.66; 119.50; 125.18; 127.63;
127.77; 128.80; 130.25; 131.85; 131.91; 132.71; 144.54; 149.53; 151.36;
154.28; 155.82; 156.37
Elemental analysis:
M [C20H15N3O8S2 · 5 H2O] = 579.56 g/mol
% calculated: C: 41.49 ; H: 4.35; N: 7.25
% found: C: 41.57; H: 4.50; N: 7.29

11 Experimental Section
272
ESI-mass spectroscopy:
ESI+-MS: [m/z] = 490 [LH5]+, 512 [(LH4)Na]+; ESI--MS: [m/z] = 243.6 [LH2]2-,
488 [LH3]-
IR-spectroscopy:
FT-IR: [cm-1] 3202; 1611; 1563; 1532; 1506; 1408; 1199; 1123; 1059; 1040;
1016; 861; 812; 767; 738; 654; 595; 548; 537; 510
11.1.6 Synthesis of 5-hydrazinylisophthalic acid hydrochloric acid (DCH)
5-Aminoisophthalic acid (5.00 g,
27.60 mmol) was dissolved in a solution of so-
dium carbonate (2.00g, 18.87 mmol) in 60 mL
of pure water. After filtration, the solution was
cooled in an ice bath to 0°C and 10 mL of con-
centrated hydrochloric acid was added to ad-
just to pH 0. This caused the reactant to pre-
cipitate. Within 15 min a solution of sodium nitrite (1.90 g, 27.60 mmol) in
10 mL pure water was added slowly to prevent the temperature from rising
above 12°C. After the complete addition of sodium nitrite, and a final adjust-
ment of the pH to 0, if necessary, the solution was stirred at 0°C for an addi-
tional 30 min. The resulting precipitate was filtered and the moist pale white
diazonium salt was passed on to the next step without further purification.
A solution of sodium sulphite (6.88 g, 54.59 mmol) in 70 mL of pure water
was cooled to 0°C in an ice bath. The moist diazonium salt was added in por-
tions to the vigorously stirred solution to keep the temperature below 5°C. The
solution was stirred for 1.5 h at 0°C. Subsequently, the temperature was a l-
lowed to rise to ambient temperature and then refluxed for 30 min. Concentrat-
ed hydrochloric acid (18.0 mL) was added carefully and the mixture was again
refluxed for an additional hour. The reaction mixture was cooled to ambient
temperature and stirred for 12 h. The resulting suspension was further concen-
trated to about 50% of its total volume under reduced pressure and the ob-

11 Experimental Section
273
tained beige white precipitate was filtered and dried for 24 h in vacuum to yield
4.61 g (16.47 mmol, 60 % relating to sodium nitrite).
Characterisation:
1H-NMR (D6-DMSO, TMS):
δ (ppm) = 7.73 (s, 2H); 7.98 (s, 1H)
13C-NMR (D6-DMSO, TMS):
δ (ppm) = 118.33 (2C); 122.16; 131.90 (2C); 146.76; 166.74 (2C)
Elemental analysis:
M [C8H8N2O4 · (HCl) · (Na2SO4)1/3] = 279.97 g/mol
% calculated: C: 34.32; H: 3.24; N: 10.01
% found: C: 34.08; H: 3.29; N: 9.73
ESI-mass spectroscopy:
ESI+-MS: [m/z] = 197 [LH3]+; ESI--MS: [m/z] = 195 [LH]-
IR-spectroscopy:
FT-IR: [cm-1] 1703; 1674; 1607; 1563; 1515; 1461; 1300; 1241; 1206; 1097;
1063; 1041; 976; 899; 831; 757; 718; 689; 668

11 Experimental Section
274
11.1.7 Synthesis of 5-[3,5-bis(2-hydroxyphenyl)-1H-1,2,4-triazol-1-
yl]isophthalic acid (DCA)
5-Hydrazinylisophthalic acid
hydrochloride (2.50 g, 8.93 mmol)
was dissolved in a boiling solution
of 300 mL ethanol and NEt3
(4.75 g, 46.89 mmol, 6.5 mL,
ρ20°C = 0.73 g/cm3). A slight tur-
bidity of the solution could be ob-
served. To the boiling solution 2-
(2-hydroxyphenyl)-benzo-4H-[1,3]-
oxazin-4-one (2.44 g, 10.20 mmol)
was added and the solution mixture refluxed for 24 h. The solution cooled to
ambient temperature and hydrochloric acid (500 mL, 6 mol/L) was slowly added
until some precipitation was observed. The mixture was concentrated to about
50 % of its total volume under reduced pressure. The beige precipitate was fi l-
tered and washed with pure water. The crude product was obtained as a beige
coloured solid to yield 2.47 g (5.83 mmol, 65 % relating to 5-hydrazinyl-
isophthalic acid hydrochloride).
For further purification 1.0 g of the crude product was passed on to pre-
parative HPLC. The crude product was dissolved in a mixture of 22.0 mL meth-
anol and 2.0 mL pure water and the separation was carried out with methanol
and pure water, both containing 0.1% formic acid, as eluents with a flow rate of
20 mL/min. The gradient composition changed from 80% to 40% and to 90%
methanol. The 90% methanol eluent mixture was kept isocratic until all ligand
eluted. The ligand containing fraction was collected and the methanol evapo-
rated under reduced pressure. The white solid was suspended in pure water,
washed with pure water and filtered. After drying the product in vacuum for
about 48 h a white solid was obtained with the yield 0.66 g (1.56 mmol, 66%
relating to 1.0 g crude product).

11 Experimental Section
275
Characterisation:
1H-NMR (D6-DMSO, TMS):
δ (ppm) = 6.87 (d, 1H, 3J = 8.3 Hz); 6.99 - 7.05 (m, 3H); 6.74 (m, 2H); 7.60 (dd,
1H, 3J = 7.6 Hz, 4J = 1.7 Hz); 8.08 (dd, 1H, 3J = 7.8 Hz, 4J = 1.7 Hz); 8.20 (dd,
2H, 4J = 1.7 Hz, 4J = 0.8 Hz); 8.47 (dt, 1H, 4J = 1.7 Hz, 4J = 0.8 Hz); 10.11 (s,
1H, OH); 10.85 (s, 1H, OH)
13C-NMR (D6-DMSO, TMS):
δ (ppm) = 113.57; 114.06; 116.10; 117.00; 119.49; 119.63; 126.77;
127.55 (2C); 129.28; 131.01; 131.42; 132.36; 132.59; 138.39 (2C); 152.04;
154.94; 156.28; 159.88; 165.44 (2C)
Elemental analysis:
M [C22H15N3O6 · (H2O)1/3] = 423.38 g/mol
% calculated: C: 62.41; H: 3.73; N: 9.93
% found: C: 62.33; H: 3.63; N: 9.72
ESI-mass spectroscopy:
ESI+-MS: [m/z] = 418 [LH5]+
IR-spectroscopy:
FT-IR: [cm-1] 1698; 1622; 1589; 1514; 1493; 1462; 1406; 1359; 1294; 1210;
1154; 1120; 1037; 1014; 911; 842; 822; 749; 716; 677; 660

11 Experimental Section
276
11.1.8 Crystal growth of [deferasirox] · H2O
The ligand deferasirox (6.03302 g of a stock solution in DMSO
c = 0.0091024 mmol/g, 0.025 mmol), DMSO (41.9752 g), potassium chloride
(0.81879 g, 0.10983 mmol) and potassium hydroxide (0.7 mL, 0.1 mol/L,
0.07 mmol) were given in a volumetric flask (109.83 mL) which was filled up
with pure water. After one week colourless prisms were obtained which were
suitable for single crystal X-ray analysis.
Elemental analysis was not possible since the crystals dissolved when
dried in vacuum.
IR-spectroscopy:
FT-IR: [cm-1] 3310; 1677; 1607; 1584; 1516; 1495; 1479; 1450; 1431; 1416;
1351; 1277; 1222; 1154; 1037; 991; 947; 908; 851; 826; 807; 751; 704; 686;
660
11.1.9 Crystal growth of [DSA-H4] · 1.5 MeOH
The Ligand DSA (0,20 g, 0.35 mmol) was dissolved in 20.0 mL methanol.
The solution was placed in an exsiccator filled with ethyl acetate. After about
four weeks cubical shaped colourless crystals were received which could be
employed for single crystal X-ray analysis.
Characterisation of the crystals was not possible. Precipitate settled on
the crystals when taken out of the solution.

11 Experimental Section
277
11.1.10 Crystal growth of Cs4[DSA-H2]2 · (H2O)13/6 · MeOH
The Ligand DSA (0.050 g, 0.086 mmol) was dissolved in 4.0 mL metha-
nol. To this stirred solution a solution of caesium hydroxide monohydrate
(0.058 g, 0.345 mmol) in 4.0 mL methanol was added drop wise. The pH of the
alkaline solution was adjusted to pH 5 with aqueous hydrochloric acid
(0.1 mol/L). This clear solution was stored in an exsiccator filled with ethyl ace-
tate. After four weeks colourless rhombic leaflets had grown which could be
employed for single crystal X-ray analysis.
Elemental analysis:
M [Cs4(C20H13N3O8S2)2 · (H2O)13/6 · (MeOH)] = 1577.62 g/mol
% calculated: C: 31.21 ; H: 2.20; N: 5.33
% found: C: 30.39; H: 2.32; N: 5.20
IR-spectroscopy:
FT-IR: [cm-1] 1623; 1589; 1495; 1470; 1370; 1297; 1207; 1143; 1120; 1064;
1042; 1024; 1000; 836; 816; 754; 702
11.1.11 Crystal growth of Cs5[Fe(DSA)2] · 10.74 H2O
A solution of iron(III)-acetylacetonate (0.034 g, 0.069 mmol) in 4.0 mL
methanol was added drop wise to a solution of DSA (0.1 g, 0.173 mmol) in
4.0 mL methanol. The resulting dark violet solution was stirred for 30 min.
Then, a solution of caesium hydroxide monohydrate (0.128 g, 0.762 mmol) in
4.0 mL pure water was added drop wise. The colour of the dark violet solution
turned to bright red indicating the formation of the bis-complex with two ligands
bound to one Fe3+ centre. The solution was stirred for 1 h and placed in an ex-
siccator filled with ethyl acetate. Overnight, single crystals were obtained in
form of dark red prisms. These were suitable for single crystal X-ray analysis.

11 Experimental Section
278
Elemental analysis:
M [Cs5 (C20H11N3O8S2)2 · 10.74 H2O ] = 1884.75 g/mol
% calculated: C: 25.49 ; H: 2.33; N: 4.46
% found: C: 25.95; H: 2.30; N: 4.51
IR-spectroscopy:
FT-IR: [cm-1] 1598; 1558; 1514; 1457; 1312; 1195; 1145; 1121; 1062; 1039;
1018; 989; 845; 759; 660; 590; 559; 538; 529; 501
11.1.12 Crystal growth of Na3[Cu(DSA)(HCO3)] · 2.5 H2O · 1.5 MeOH
(violet) and Na3[Cu(DSA)(HCO3)] · (H2O)25/6 · 3 MeOH (green)
A solution of copper(II)-acetylacetonate (0.011 g, 0.042 mmol) in 4.0 mL
methanol was added drop wise to a solution of DSA (0.050 g, 0.086 mmol) in
4.0 mL methanol. To this mixture a solution of sodium hydroxide (0.014 g,
0.35 mmol) in 4.0 mL methanol and 1.0 mL pure water was also added drop
wise causing the colour to intensify from light green to dark green. This mixture
was kept in an exsiccator filled with ethyl acetate. After two weeks, green and
violet rhombic plates grew from the dark green solution. Both the green and
violet crystals were suitable for single crystal X-ray analysis.
Elemental analysis: violet crystals
M [Na3 (C20H11N3O8S2) · (HCO3) · (H2O)5/2 · (MeOH)3/2] = 772.08 g/mol
% calculated: C: 35.00 ; H: 3.00; N: 5.44
% found: C: 35.04; H: 3.10; N: 5.60
Microscopic X-ray fluorescence - MXRFA:
violet and green crystals reveal the same values: Cu Kα 8 keV; Cu Kβ 9 keV

11 Experimental Section
279
Elemental analysis: green crystals
M [Na3 (C20H11N3O8S2) · (HCO3) · (H2O)25/6 · (MeOH)3] = 850.22 g/mol
% calculated: C: 33.91; H: 3.83; N: 4.94
% found: C: 34.37; H: 3.67; N: 6.06
IR-spectroscopy:
a mixture of green and violet crystals, causes the following spectrum:
FT-IR: [cm-1] 1602; 1567; 1519; 1482; 1461; 1390; 1310; 1197; 1148; 1123;
1066; 1044; 1022; 992; 844; 757; 710; 658

11 Experimental Section
280
11.2 Titration experiments
Several methods based on titration experiments were used to study equi-
librium constants. If possible, the titration experiment conditions were chosen
very similar. In the following paragraphs conditions and procedures are de-
scribed in detail.
11.2.1 Potentiometric titration experiments
Titration instrumentation
Potentiometric titrations were performed computer assisted with a piston
burette 665 or 765 (dosimeter) with exchange unit 806 and pH/mV meter 713 or
780 from Metrohm AG. The exchange unit was equipped with a burette tip with
antidiffusion stopper which can be immerged into the measurement solution.
The titration experiment was controlled by the program Messlabor [150].
pH electrodes
The pH measurements were carried out with the following single-rod
measuring cell electrodes:
SCHOTT® Instruments IoLine IL-pH-A120MF-R from SI Analytics
GmbH, a double junction electrode with 3 mol/L KCl as bridge elec-
trolyte, platinum diaphragm, iodine/iodide reference and Metrohm
connector
SenTix® 62 from WTW GmbH, a double junction electrode with
3 mol/L KCl as bridge electrolyte, platinum diaphragm, Ag/AgCl
reference and BNC connector used with a Metrohm adapter, later
distributed by SI Analytics GmbH as BlueLine 17 pH-R with
Metrohm connector
ROSS Ultra® pH electrode 8102 BNUWP from Orion Thermo Sci-
entific, a double junction electrode with 3 mol/L KCl as bridge elec-
trolyte, ceramic diaphragm, iodine/iodide reference and BNC con-
nector with a Metrohm adapter

11 Experimental Section
281
Möller pH electrode, from Willi Möller AG, combined pH and refer-
ence electrode with an Ag/AgCl reference, ceramic diaphragm and
Metrohm connector
Experimental procedure for continuous potentiometric titration experi-
ments
All solutions were prepared with deionised water (Millipore Synergy®, Mil-
lipore GmbH). Further, to ensure a constant ionic strength all solutions were
prepared with KCl as supporting electrolyte at a concentration 0.1 mol/L KCl
(puriss. p.a. ≥ 99.5 %, Sigma Aldrich).
A sample of 50.0 mL (50.0 mL volumetric pipette) of the prepared solu-
tion was thermostated at 298 K (thermostat ecoline 103 or ecoline 003 from
Lauda Dr. R. Wobser GmbH & CO. KG) in a double-walled glass vessel. The
glass vessel was flushed with nitrogen gas that has been passed through a
0.1 mol/L KCl solution. Prior to and after all measurements the standard elec-
trode potential E° and the ionic product pKw needed to be determined by a po-
tentiometric titration of 50.0 mL of a 2.0 mmol/L HCl solution with
0.1 mol/L KOH (TitriPUR®, Merck KGaA) as titrant. The HCl was prepared with
0.1 mol/L HCl from a dosimeter (TitriPUR®, Merck KGaA). Both values were
calculated with the program TITKURVE [151]. The mean values of E° from the
titrations prior to and after the actual measurement were used for the evalua-
tion of the equilibrium constants. The ionic product was only used to monitor
the electrode measurement, for further calculations the published value was
used.
The sample solution was prepared in a 110 mL volumetric flask. All com-
ponents were weighed in on a precision balance. If needed, the metal ion stock
solution (with the concentration in mmol/g) was added to the flask first. Further,
the ligand was added mostly as a solid or a stock solution. If necessary, the
ligand could be well dissolved by ultrasonic treatment. In the next step, for a
constant ionic strength solid KCl (puriss. p.a. ≥ 99.5 %, Sigma Aldrich) was
added. Some titration experiments, for example those in water/DMSO with a
molar fraction xDMSO < 0.20, needed to be adjusted to a specific pH prior to ti-

11 Experimental Section
282
tration. This is carried out by adding 0.1 mol/L KOH or HCl (both TitriPUR®,
Merck KGaA) to the flask with a dosimeter. The titration experiments are car-
ried out alkalimetric with 0.1 mol/L KOH (TitriPUR®, Merck KGaA) or acidimet-
ric with 0.1 mol/L HCl (TitriPUR®, Merck KGaA).
11.2.2 Potentiometric titrations in water/DMSO solution mixture
Equilibrium constants of deferasirox needed to be measured in a wa-
ter/DMSO medium because of its low solubility in pure water. Titration experi-
ments in water/DMSO solution mixtures were performed with certain molar
fractions. By measuring the equilibrium constants for different molar fractions
and extrapolation of the values we were able to estimate the constants for pure
water. It is of importance for the preparation of all these solutions to consider
the volume contraction during the mixing of DMSO with pure water since it is
not an ideal solution. The DMSO volumes necessary for the preparation of 1.0
litre solution are summarized in Table 11.1 [39]. All solutions were prepared with
pure water (Millipore) that was degassed with argon prior to use.
Table 11.1: Partial excess molar volumes, partial molar volumes and necessary volumes of DMSO for the preparation of 1.0 litre solvent (in mL at 298 K).
0.06 -3.69 0.032 67.622 18.100 203.06 806.02 20.12
0.10 -3.84 0.043 67.472 18.111 309.42 705.56 30.48
0.12 -3.78 0.036 67.532 18.104 356.04 661.52 34.98
0.14 -3.67 0.019 67.642 18.087 398.95 620.93 39.11
0.16 -3.51 -0.010 67.802 18.058 438.56 583.35 42.91
0.18 -3.32 -0.052 67.992 18.016 475.21 548.49 46.42
0.20 -3.10 -0.104 68.212 17.964 509.12 515.98 49.66
0.22 -2.86 -0.169 68.452 17.899 540.60 485.62 52.68

11 Experimental Section
283
As titrant a solution of 0.1 mol/L KOH or 0.1 mol/L HCl was used with the
appropriate amount of DMSO for the desired molar ratio. First the DMSO sol-
vent (ρDMSO = 1.09566 g/cm3) [37] was weighed into a 1.0 litre volumetric flask.
Then KOH or HCl (both Titrisol®, Merck KGaA) was added in the presence of
nitrogen. Subsequent, the flask was filled with water to the calibration mark.
The warm mixture was left in the presence of nitrogen to cool to 293 K. Opti-
mally the flask was gradually filled to the calibration mark at this temperature
several times. The solution was then left to stand overnight at 293 K and filled
one more time before use. A constant volume should have been achieved.
The determination of the standard electrode potential E° and pKw was al-
so performed in the same molar fraction of DMSO as the measurement. To
prepare the 2.0 mmol/L HCl solution DMSO was weighed in a 1.0 litre volumet-
ric flask. Then 20 mL 0.1 mol/L HCl was added with a dosimeter and the need-
ed amount of solid KCl to achieve an ionic strength of 0.1 mol/L was added to
the flask. The flask was filled to the calibration mark with water. It was left to
cool to 293 K which causes volume contraction. Therefore, the solution needed
to be gradually filled to the calibration mark with water. After standing over
night, the solution was filled as described one last time prior to use.
The conditions described above were employed to prepare the sample
solutions. If needed, first the metal ion stock solution was weighed into the
110 mL flask. Then DMSO was weighed into the flask. Further, ligand and then
KCl (c = 0.1 mol/L) was weighed in and added to the solution mixture. As men-
tioned above, the ligand and KCl could well be dissolved by ultrasonic treat-
ment. The flask was thermostated at 293 K, filled to the calibration mark sever-
al times, left to stand overnight and filled once more prior to use.

11 Experimental Section
284
11.2.3 Spectrophotometric titrations
Continuous spectrophotometric titration experiments
Continuous spectrophotometric titrations were performed simultaneous
with a continuous potentiometric titration. While the potentiometric titration was
carried out as previously described in section 11.2.1 the immersion probe was
dived into the sample solution. With the titration computer a trigger signal was
sent to the spectrophotometer to record a spectrum just prior to the add-on of
each new aliquot of titrant. Absorption data were recorded in the range
220 < λ < 900 nm, however the range 400 < λ < 900 nm was used for evalua-
tion. Both titration experiments could be used for the determination of the equi-
librium constants. These continuous titrations were studied with a total Fe3+
concentration of 0.48 mmol/L and 0.33 mmol /L and a total ligand concentration
of 1.00 mmol/L, respectively.
Experimental procedure for the spectrophotometric batch titration exper-
iments
The investigation of the pKa values and the stability constant of the
[Fe(L)] and [Fe(L)]- complex of deferasirox and DSA in strong acidic solution
needed to be performed as a discontinuous batch titration. For this method
each sample was prepared in a 10 mL double-walled glass vessel at 298 K.
The pKa batch titration of DSA was carried out with 10 samples and a to-
tal ligand concentration of 40.0 or 80.0 μmol/L. The pH was adjusted (1.0 < pH
< 2.0) by adding the appropriate amount of 0.1 mol/L HCl solution (TitriPUR®,
Merck KGaA) to a 0.1 mol/L KCl solution (prepared with solid KCl) to receive a
total volume of 10.0 mL with the desired pH. The ligand was added to the
10.0 mL solution by an aliquot from a stock solution of DSA in pure water. The
volume was taken into account for the total volume calculation. The absorption
data were recorded (T = 298 K, I = 0.1 mol/L HCl/KCl) in the range 230 < λ <
380 nm. Further, the spectra were evaluated in the range 290 < λ < 380 nm for
the determination of the acidity constant.

11 Experimental Section
285
To study the stability constant of the [Fe(DSA)] - complex a batch titration
was performed in the pH range 1.00 < pH < 2.00 with 10 samples. The pH was
adjusted as previously described above for the pKa batch titration. The total
Fe3+ and DSA concentration was 0.2 mmol/L. For both the metal ion and ligand,
a stock solution was used and an aliquot of each was added to the 10.0 mL
solution. The volumes of these aliquots were taken into account for the calcula-
tion of the total volume. The absorption data were collected (T = 298 K,
I = 0.1 mol/L HCL/KCl) in the range 200 < λ < 1000 nm. However, the spectra
were evaluated in the range 400 < λ < 900 nm. A spectrum of a 0.2 mmol/L
Fe3+ solution, prepared with the iron stock solution was also collected. The
complexation constant was calculated with the program Specfit [152-153].
The protonation of the ligand deferasirox was investigated in the pH
range 0 < pH < 2.0 in water/DSMO solution. Three different molar fractions
(xDMSO = 0.06 ; 0.10 ; 0.16) were chosen for examination. To adjust the pH a
1.0 mol/L KCl and a 1.0 mol/L HCl solution with the appropriate molar fraction
of DMSO were necessary. The 1.0 mol/L HCl and KCl water/DMSO solutions
were prepared according to the procedure described in section 11.2.2, however
with Titrisol® (Merck KGaA) for HCl and solid KCl. In contrast to the other batch
titrations, the 10 samples were prepared in 25 mL volumetric flasks. All solu-
tions used were thermostated at 293 K. First, the 1.0 mol/L HCl solution
(converted into c = mmol/g) was weighed into the flask. Then, an aliquot (total
ligand concentration 40.0 μmol/L) of a deferasirox stock solution in pure DMSO
was added with a micropipette and the exact weight was noted. The flasks
were filled with the 1.0 mol/L KCl solution to the calibration mark several times
at 293 K, left to stand overnight and filled one last time prior to use. The ab-
sorption data were collected (T = 298 K, I = 1.0 mol/L HCl/KCl) in the range
200 < λ < 1000 nm. However, the spectra were evaluated in the range
240 < λ < 360 nm.

11 Experimental Section
286
Kinetic measurement of the xDMSO = 0.06 deferasirox solution
The 10 samples of deferasirox prepared in xDMSO = 0.06 at pH 0.26, 0.70,
1.00 and 2.00, according to the procedure described above, were studied with
a kinetic measurement over a period of 6.5 days. The measurements were car-
ried out on a UV/VIS spectrometer Uvikon 940/941 (Kontron Instruments) with
a quartz cuvette with 1.0 cm cell path length. The absorption spectra were col-
lected (T = 298 K, I = 1.0 mol/L HCL/KCL) in the range 190 < λ < 500 nm. In
effect, the spectra were evaluated at λ = 290 nm.
11.2.4 Calculation of equilibrium constants
All equilibrium constants were calculated as concentration constants.
Further, the pH was defined as -log[H+]. The equilibrium constants were deter-
mined with the help of computer programs. For the evaluation of potentiometric
titrations and spectrophotometric titrations the program Hyperquad2008 [154]
and Specfit [152-153] were employed, respectively.
To evaluate titration experiments with the program Hyperquad2008 the
pKw, the ionic product of water, as a constant value for the given titration condi-
tions is required. For aqueous solution, with 0.1 mol/L KCl and 298 K, the value
for the pKw is 13.78 according to the literature [55]. For the different molar frac-
tions used in water/DMSO solutions the pKw (pKw = -logKw, Kw = [H+] × [OH-])
was determined by the titrations carried out prior to and after the measure-
ments as described in section 11.2.2. The values obtained with the program
TITKURVE [151] were: xDMSO = 0.20 with a pKw 15.58 (mean value of 34 titrations),
xDMSO = 0.18 with a pKw 15.38 (mean value of 34 titrations), xDMSO = 0.16 with a
pKw 15.20 (mean value of 35 titrations) and xDMSO = 0.14 with a pKw 15.01 (mean
value of 43 titrations). These values concur with those obtained from the litera-
ture [122-123]. The E°, pKw and the total concentrations of the ligand and metal ion
were ascertained as fixed values. Furthermore, when refining complex formation
constants the pKa values previously determined are also defined as fixed values.
Equilibrium constants investigated with spectrophotometric titration experi-
ments were calculated with the program Specfit [152-153]. For the determination of pKa
values the pH was calculated and the total concentrations were ascertained as fixed

11 Experimental Section
287
values. The ligand species were all defined as coloured species. For the determina-
tion of complex formation constants a spectrum of the Fe3+ stock solution was col-
lected (the conditions were described above in section 11.2.3, batch titration experi-
ments) and defined in the program as a known spectrum and a coloured species. All
metal-containing species were defined as coloured species. In contrast, the ligand
and its protonation products were treated as non-coloured species.
Species distributions for all titration experiments were calculated with the pro-
gram Hyss2006 [147].
11.2.5 NMR-titration experiments
The protonation of deferasirox in the range 0 ≤ pD ≤ 1.0 was studied by
an NMR-titration experiment in D2O-DCl/D6-DMSO with a molar fraction of
xDMSO = 0.20. The study was carried out dependent on pD [155-156]. The samples
were prepared without an inert supporting electrolyte by mixing the appropriate
amount of DCl (stock solution 20% in D2O) and D2O to adjust the pD. The total
volume of D2O-DCl and D6-DMSO were obtained from Table 11.1. The ligand
(0.005 g) was dissolved in the necessary volume of D6-DMSO and then D2O
and last DCl was added. The samples were left to stand overnight. Subse-
quently, the NMR spectra were recorded with TMS as internal standard at
294 ±2 K. The pKaD value was calculated with the program NMR-Tit [126].

11 Experimental Section
288
11.3 Instrumentation
The following instruments were employed for analytical measurements
reported in this thesis.
11.3.1 NMR-spectroscopy
The NMR spectra were performed on a Bruker Avance Ultrashield 400
with a resonance frequency of 400.13 MHz for 1H-NMR spectra and 100.6 MHz
for 13C-NMR spectra. The measurements were carried out at 294 K, if not stat-
ed differently. As deuterated solvents D6-DMSO with tetramethylsilan (TMS) as
internal standard and D2O with 3-(trimethylsilyl)propionic-2,2,3,3-D4 acid sodi-
um salt (D4-TMPS) were used. The unit for the chemical shift δ is ppm referring
to the internal standard. Further, the solvent employed for each particular NMR
is remarked in brackets. The multiplicities are abbreviated as follows: s = sin-
glet, d = doublet, t = triplet, dd = double doublet, dt = double triplet and
m = multiplet. Moreover, the unit for the coupling constant J is Hz.
11.3.2 Elemental analysis (C,H,N)
The elemental analyses were performed on a Vario EL elemental analys-
er from Elementar Analysensysteme GmbH (instrument belongs to the research
group of Prof. D. Volmer, Saarland University; formerly Prof. C. Huber, Univer-
sity of Salzburg) by A. Zaschka (research group of Prof. K. Hegetschweiler) or
S. Harling (research group of Prof. G. Kickelbick, Saarland University; formerly
research group of senior Prof. M. Veith, Saarland University).
11.3.3 UV-VIS-spectroscopy
Spectrophotometric titration experiments were carried out on a Tidas UV-
NIR/100-1 or Tidas 100 diode array spectrophotometer from J&M Analytik AG
at 298 K. The instrument was equipped with an immersion probe from HELLMA
GmbH & Co.KG, with 1 cm cell path length.

11 Experimental Section
289
The kinetic measurements were performed on a double-beam UV/VIS
spectrometer Uvikon 940/941 (Kontron Instruments) with a quartz cuvette with
1.0 cm cell path length.
11.3.4 IR-spectroscopy
IR-spectra were collected on a FT-IR spectrometer Vector 22 MIR with a
golden-gate ATR-unit from Bruker. The spectra were generated with OPUS NT
3.1 software. The signal band positions are stated in the unit cm-1.
11.3.5 ESI-mass spectroscopy
ESI-mass spectra were performed by Dr. Mathias Großer (magrochem,
Saarland University) on a Micromass ZQ-4000 ESI-mass spectrometer (single-
quadrupole) from Waters GmbH.
11.3.6 Preparative HPLC
Purification of the ligand DCA was performed on a preparative HPLC
from Gilson Inc. equipped with a Valvemate® II Valve Actuator, high pressure
pumps 306, 333 and 334 and a PrepFC™ fraction collector. A UV/VIS-155 de-
tector from Gilson Inc. was applied to observe the separation. The separation
was monitored by the TRILUTION® LC Software v2.1 (Gilson Inc.). The re-
versed phase chromatographic column Sep Tech ST60-10 C18 (Dynamax 250
x 41.4 mm) from Varian Inc. was used as preparative HPLC column.
11.3.7 EPR-spectroscopy
The EPR experiments were carried out by Prof. P. Strauch at the Univer-
sity of Potsdam in his research group for Inorganic Material Chemistry on an
EPR-Spectrometer ELEXSYS E500 CW-EPR-Series for X-band and S-band
from Bruker BioSpin GmbH. The EPR-spectra were recorded with X-band with
the frequency 9 - 10 GHz and a field strength of 0.34 tesla (g = 2).

11 Experimental Section
290
11.3.8 ICP-OES spectroscopy
The determination of the exact concentration of metal ion stock solutions
was performed on an Optical Emission Spectrometer Optima 2000 DV from
Perkin Elmer by T. Allgayer in the research group for Inorganic and Analytic
Chemistry of senior Prof. H.P. Beck, Saarland University.
11.3.9 Microscopic X-ray fluorescence - MXRFA
The μXRF spectra of the green and violet crystals of
Na3[Cu(DSA)(HCO3)] · 2.5H2O · 1.5MeOH and Na3[Cu(DSA)(HCO3)] · (H2O)25/6
· 3MeOH were investigated on a Micro-RFA model Eagle from the company
Röntgenanalytik, Taunusstein Germany. The instrument was equipped with a
polycapillary lense for very high resolution, to achieve spatial resolution of up
to 30 μm and a Si(Li)-semiconductor detector with 165 eV energy resolution.
The recording of the spectra was carried out by Dr. R. Haberkorn in the re-
search group for Inorganic and Analytic Chemistry of senior Prof. H.P. Beck,
Saarland University.
11.3.10 Crystal structure determination
X-ray diffraction data were collected on a Bruker X8 Apex or a Stoe IPDS
diffractometer by Dr. Volker Huch (research group of senior Prof. M. Veith,
Saarland University). The data sets were solved and refined with the programs
SHELXS-97 [157] and SHELXL-97 [158]. Residual electron density was subtracted
and revised with the Squeeze option of the program Platon [56-57], if necessary.
The program Diamond 3.2f [159] was used for the presentation of the crystal
structures as ORTEP-plots.
11.3.11 Cyclic voltammetry
Cyclic voltammetric studies were performed on a 797 VA Computrace
from Metrohm AG. A platinum pin was used as counter electrode and an
Ag/AgCl electrode as reference electrode with a potential versus normal hydro-
gen electrode of 208.7 mV (T = 298 K, determined by Metrohm AG) or the po-

11 Experimental Section
291
tential was determined with the help of an iron(III/II)-hexacyanoferrate solution
(E° = 0.46 V, c([K4(Fe(CN)6]) = 10.0 mmol/L in 0.01 mol/L NaOH, T = 298 K
and I = 0.1 mol/L KCl) [63]. For measurements in acidic solution a gold electrode
was applied as working electrode. Hence, a hanging mercury drop electrode
(HMDE) as working electrode was needed for measurements in alkaline solu-
tion. The cyclic voltammograms were recorded in water, using 0.5 mol/L KCl as
supporting electrolyte and a Fe3+ and DSA concentration of 2.3 mmol/L and
5.0 mmol/L, respectively. The pH of the sample solutions was adjusted with a
SenTix® 62 pH electrode from WTW GmbH and a 780 pH/mV meter from
Metrohm AG. The pH electrode was calibrated prior to use with three standard
buffer solutions (pH = 4.0, 7.0 and 10.0 from Fluka AG).
11.4 Chemicals and preparation of stock solutions
Chemicals
Chemicals applied for syntheses were commercially available products of
reagent grade quality and were used as obtained from the following suppliers:
Sigma-Aldrich, Fluka, Acros, Merck and Alfa-Aesar. Solvents were obtained
from the mentioned suppliers and from the central chemical depot of the Saa r-
land University and employed as received.
The DMSO used for titration experiments was analytical reagent grade
from Fisher Scientific and stored under nitrogen once opened. Potassium chlo-
ride for titration experiments was of puriss p.a. grade ≥ 99.5% from Sigma -
Aldrich.
Water used for synthesis and titrations was deionised and purified with a
Millipore Synergy® from Millipore GmbH.
Metal salts for crystal synthesis and stock solutions were obtained of
highest available quality.
The deuterated solvents for NMR-spectroscopy D6-DMSO (99.9 at-
om %D) and D2O (99.90 atom %D) were obtained from Aldrich and Euriso-top,

11 Experimental Section
292
respectively. Internal standards were added separately D4-TMPS (99 atom %D,
ABCR GmbH & Co. KG) and TMS (99.9+% NMR grade, Fluka).
Stock solutions
The metal ion stock solutions used for titration experiments were pre-
pared differently and additional acid added to the stock solutions to prevent
hydrolysis needed to be determined prior to use. The density of the stock solu-
tions was determined at 293 K and the concentration was stated in mmol/g.
Preparation of the stock solutions:
For the Fe3+, Mg2+ and Ca2+ stock solutions the protons in solution were
determined by potentiometric titration with EDTA (Titrisol ®, Merck KGaA).
The Al3+ stock solution did not contain protons and was prepared with an
ampoule of hydrochloric acid (Titrisol®, Merck KGaA) for a 0.1 mol/L so-
lution.
The protons in the Zn2+ solution needed to be determined with potenti-
ometric titrations with ethylenediamine prior to use.
The metal ion stock solutions of Cu2+, Ni2+ and Cd2+ were employed
without any further analysis.
The stock solutions of Ga3+ and Gd3+ were prepared by dissolving the
metal salts GdCl3 · 6H2O (Aldrich) and GaCl3 (ultra dry 99.999% am-
poule, Sigma-Aldrich) in pure water. The exact concentration was ana-
lysed by ICP-OES spectroscopy with the help of a calibration curve pre-
pared with standard solution for AAS of the metal ion obtained from Al-
drich. The Ga3+ solution was acidified to 0.5 mol/L HCl with Titrisol®
(Merck KGaA) and Gd3+ to 0.02 mol/L HCl by addition of 0.1 mol/L HCl
from a dosimeter.
Stock solutions of the ligand deferasirox were prepared in DMSO (analyt-
ical reagent grade, Fisher scientific).
Stock solutions of the ligand DSA were prepared in pure water.

12 Appendix
293
12 Appendix
Electrode tests
First potentiometric titrations were carried out with the Möller pH elec-
trode. Soon we noticed difficulties during titration experiments. The difficulties
were due to large changes in the standard potential E0 of the electrode during
titration experiments and strong deviations in alkaline solution from the calcu-
lated fit with Hyperquad2008. As a consequence, these titrations were not easy
to evaluate and often could not be evaluated at all. There was a need for an
appropriate electrode to carry out long term potentiometric titration experi-
ments. Fourteen electrodes were tested with respect to the following criteria:
equilibrium: acidimetric and alkalimetric titrations with HCl, MSA
(pKa titration) and the Fe(EDTA) system
ΔE0 [MV]: changes in standard potential should be ΔE0 < 2 other-
wise they were defined as bad
electrolyte loss: bridging electrolyte should need to be refilled only
once a week
evaluation: the evaluation of the MSA and Fe(EDTA) system
should be good and the values in the expected range
alkaline: evaluations should not deviate from the titration curve in
alkaline solution
Some of the electrode tests were performed by T. Nicolai, under my superv i-
sion, during his studies.
The following table lists the electrodes tested and their characteristics.

12 Appendix
294
co
nn
ecto
r
Lem
o (
Metr
ohm
)
Lem
o (
Metr
ohm
)
Lem
o (
Metr
ohm
)
ba
na
na
Lem
o (
Metr
ohm
)
Lem
o (
Metr
ohm
)
Lem
o (
Metr
ohm
)
ba
na
na
BN
C w
ith a
dap
ter
BN
C w
ith a
dap
ter
Pin
tip
with a
dap
ter
BN
C w
ith a
dap
ter
BN
C w
ith a
dap
ter
BN
C w
ith a
dap
ter
ba
na
na
BN
C w
ith a
dap
ter
ba
na
na
BN
C
Lem
o (
Metr
ohm
)
co
nd
itio
nin
g
3 m
ol/L
KC
l
3 m
ol/L
KC
l
0.5
mol/L K
Cl
-
0.5
mol/L K
Cl
no
ne
no
ne
-
3 m
ol/L
KC
l
sto
rage s
olu
tion
no
ne
no
ne
no
ne
-
no
ne
no
ne
sto
rage s
olu
tion
sto
rage s
olu
tion
ele
ctr
oly
te
3 m
ol/L
KC
l
3 m
ol/L
KC
l
3 m
ol/L
KC
l
3 m
ol/L
KC
l
-
3 m
ol/L
KC
l
-
3 m
ol/L
KC
l
3 m
ol/L
KC
l
-
3 m
ol/L
KC
l
3 m
ol/L
KC
l
satu
rate
d K
Cl
with
KC
l cry
sta
ls
-
satu
rate
d K
Cl
with
KC
l cry
sta
ls
gel
no r
efill
gel
no r
efill
-
3 m
ol/L
KC
l
pH
ra
ng
e
0-1
4
0-1
4
0-1
4
-
0-1
3
0-1
4
0-1
4
-
0-1
4
-
0-1
4
0-1
4
0-1
4 a
lka
line
0-1
4 a
lka
line
0-1
4 a
lka
line
0-1
4
0-1
4
-
0-1
4
dia
ph
rag
m
cera
mic
gla
ss g
rind
ing
flexib
le t
eflo
n
gla
ss g
rind
ing
-
cera
mic
-
cera
mic
cera
mic
-
cera
mic
pla
tinum
poro
us p
in
-
poro
us p
in
cera
mic
cera
mic
-
pla
tinum
refe
ren
ce
Ag/A
gC
l
Ag/A
gC
l
AR
GE
NT
HA
L
Ag/A
gC
l
-
InL
ab
InL
ab
InL
ab
Ross
® iodin
e/iod
ide
Ross
®
Ross
® iodin
e/iod
ide
Ag/A
gC
l
Red-R
od
Red-R
od
Red-R
od
K-S
eri
es
K-P
oly
me
r
K-S
eri
es
Ross
® iodin
e/iod
ide
iod
ine/io
did
e
typ
e
sin
gle
-rod
sin
gle
-rod
do
ub
le ju
nction
do
ub
le ju
nction
do
ub
le ju
nction
gla
ss e
lectr
ode
sin
gle
-rod
gla
ss e
lectr
ode
refe
rence e
lecto
de
sin
gle
-rod
do
ub
le ju
nction
gla
ss e
lectr
ode
refe
rence e
lecto
de
do
ub
le ju
nction
sin
gle
-rod
sin
gle
-rod
gla
ss e
lectr
ode
refe
rence e
lecto
de
sin
gle
-rod
do
ub
le ju
nction
refe
rence e
lecto
de
do
ub
le ju
nction
gla
ss e
lectr
ode
sin
gle
-rod
do
ub
le ju
nction
co
mp
an
y
Will
i M
ölle
r A
G
Will
i M
ölle
r A
G
Mettle
r T
ole
do
Mettle
r T
ole
do
Mettle
r T
ole
do
Mettle
r T
ole
do
Mettle
r T
ole
do
O
rion
The
rmo S
cie
ntific
Orion
The
rmo S
cie
ntific
WT
W
Rad
iom
ete
r
an
aly
tical
Rad
iom
ete
r
an
aly
tical
Russell
The
rmo S
cie
ntific
Russell
Orion
The
rmo S
cie
ntific
SI -A
na
lytics
ele
ctr
od
e
Mölle
r
pH
ele
ctr
od
e
CA
85
/2-S
C
pH
ele
ctr
od
e
DG
i11
2-P
ro
Ref D
X20
0
Gla
s D
G3
00-S
C
InL
ab
Ro
utin
e
InL
ab
Mon
o
InL
ab
Re
fere
nce
Ross U
ltra
81
02B
NU
WP
Ross 8
101
BN
WP
Ross 8
005
00
u
Sen
Tix
62
pH
C2
01
1
pH
G2
11-8
RE
F2
01
KC
W1
1/N
H/G
el
KR
5/G
el
Ross 8
101
BN
WP
IoL
ine
IL-p
H-A
120M
F-R

12 Appendix
295
The following table presents an overview of the test results. At first the
SenTix 62 electrode and the Ross Ultra 8102BNUWP were quite good and
used for titrations experiments while still searching for an even better elec-
trode. Finally, a new electrode was developed by SI-Analytics, the SCHOTT®
Instruments IoLine electrode, which turned out to be an excellent combination
of the SenTix 62 and the Ross Ultra. It combines the precise iodine/iodide re f-
erence system with a platinum diaphragm. This electrode was the best elec-
trode for performing potentiometric titration experiments.
alk
ali
ne
ba
d
ba
d
go
od
-
ba
d
ba
d
ba
d
ba
d
go
od
go
od
go
od
ba
d
-
go
od
ev
alu
ati
on
ba
d
ba
d
ba
d
ba
d
ba
d
ba
d
go
od
ba
d
go
od
ba
d
ba
d
ba
d
-
go
od
ele
ctr
oly
te l
os
s
go
od
ba
d
ba
d
ba
d
go
od
go
od
go
od
go
od
ba
d
go
od
go
od
go
od
go
od
go
od
ΔE
0 [
mV
]
ba
d
ba
d
ba
d
go
od
go
od
go
od
ba
d
ba
d
go
od
ba
d
ba
d
ba
d
ba
d
go
od
eq
uilib
riu
m
go
od
go
od
go
od
go
od
go
od
go
od
go
od
go
od
go
od
go
od
ba
d
go
od
ba
d
go
od
co
mp
an
y
Will
i M
ölle
r A
G
Will
i M
ölle
r A
G
Mettle
r T
ole
do
Mettle
r T
ole
do
Mettle
r T
ole
do
Mettle
r T
ole
do
Mettle
r T
ole
do
O
rion
The
rmo S
cie
ntific
Orion
The
rmo S
cie
ntific
WT
W
Rad
iom
ete
r
an
aly
tical
Rad
iom
ete
r
an
aly
tical
Russell
The
rmo S
cie
ntific
Russell
Orion
The
rmo S
cie
ntific
SI -A
na
lytics, S
ch
ott
ele
ctr
od
e
Mölle
r
pH
ele
ctr
od
e
CA
85
/2-S
C
pH
ele
ctr
od
e
DG
i11
2-P
ro
Ref D
X20
0
Gla
s D
G3
00-S
C
InL
ab
Ro
utin
e
InL
ab
Mon
o
InL
ab
Re
fere
nce
Ross U
ltra
81
02B
NU
WP
Ross 8
101
BN
WP
Ross 8
005
00
u
Sen
Tix
62
pH
C2
01
1
pH
G2
11-8
RE
F2
01
KC
W1
1/N
H/G
el
KR
5/G
el
Ross 8
101
BN
WP
IoL
ine
IL-p
H-A
120M
F-R

12 Appendix
296
Crystallographic data (further information on CD)
Crystal structure [DSA-H4] · 1.5 MeOH
Operator Dr. Volker Huch
Diffractometer Bruker X8 Apex
Identification code sh2725a
Empirical formula C21.50 H21 N3 O9.50 S2
Formula weight 537.53 g/mol
Temperature 100(2) K
Wavelength 0.71073 Å
Crystal system monoclinic
Space group C2/c
Unit cell dimensions a = 16.181(5) Å α = 90°
b = 16.416(5) Å β = 91.782(18)°
c = 21.898(7) Å γ = 90°
Volume 5814(3) Å3
Z 8
Density (calculated) 1.228 mg/m3
Absorption coefficient 0.233 mm-1
F(000) 2232
Crystal size 0.2 x 0.3 x 0.4 mm3
Theta range for data collection 1.77 to 26.00°
Index ranges -19 ≤ h ≤ 19, -20 ≤ k ≤ 20, -26 ≤ l ≤ 26
Reflections collected 48374
Independent reflections 5699 [R(int) = 0.0480]
Completeness to theta = 26.00° 99.8 %
Absorption correction Semi-empirical from equivalents
Refinement method Full-matrix least-squares on F2
Data / restraints / parameters 5699 / 7 / 348
Goodness-of-fit on F2 1.075
Final R indices [I > 2σ(I)] R1 = 0.0674, wR2 = 0.2021
R indices (all data) R1 = 0.0764, wR2 = 0.2104
Largest diff. peak and hole 1.360 and -0.609 e.Å-3

12 Appendix
297
Crystal structure Cs4[DSA-H2]2 · (H2O)13/6 · MeOH
Operator Dr. Volker Huch
Diffractometer Bruker X8 Apex
Identification code sh3040
Empirical formula C20.50 H17.17 Cs2 N3 O9.58 S2
Formula weight 788.80 g/mol
Temperature 100(2) K
Wavelength 0.71073 Å
Crystal system Triclinic
Space group P-1
Unit cell dimensions a = 10.8806(6) Å α = 91.971(3)°
b = 16.1975(9) Å β = 106.856(3)°
c = 16.3259(9) Å γ = 96.096(3)°
Volume 2731.6(3) Å3
Z 4
Density (calculated) 1.918 mg/m3
Absorption coefficient 2.876 mm-1
F(000) 1519
Crystal size 0.22 x 0.11 x 0.04 mm3
Theta range for data collection 1.97 to 30.00°
Index ranges -15 ≤ h ≤ 15, -22 ≤ k ≤ 22, -22 ≤ l ≤ 22
Reflections collected 60393
Independent reflections 15842 [R(int) = 0.0959]
Completeness to theta = 30.00° 99.6 %
Absorption correction Semi-empirical from equivalents
Max. and min. transmission 0.8936 and 0.5703
Refinement method Full-matrix least-squares on F2
Data / restraints / parameters 15842 / 0 / 633
Goodness-of-fit on F2 0.883
Final R indices [I >σ2(I)] R1 = 0.0543, wR2 = 0.1045
R indices (all data) R1 = 0.1103, wR2 = 0.1183
Largest diff. peak and hole 2.191 and -1.801 e.Å-3

12 Appendix
298
Crystal structure Cs5[Fe(DSA)2] · 10.74 H2O
Operator Dr. Volker Huch
Diffractometer Bruker X8 Area
Identification code sh2862a
Empirical formula C40 H43.48 Cs5 Fe N6 O26.74 S4
Formula weight 1884.77 g/mol
Temperature 133(2) K
Wavelength 0.71073 Å
Crystal system monoclinic
Space group C2/c
Unit cell dimensions a = 21.0813(6) Å α= 90°
b = 11.2287(4) Å β= 98.059(2)°
c = 26.4674(8) Å γ = 90°
Volume 6203.4(3) Å3
Z 4
Density (calculated) 2.018 mg/m3
Absorption coefficient 3.352 mm-1
F(000) 3618
Crystal size 0.59 x 0.23 x 0.19 mm3
Theta range for data collection 1.55 to 26.00°
Index ranges -26 ≤ h ≤ 26, -13 ≤ k ≤ 13, -32 ≤ l ≤ 32
Reflections collected 44730
Independent reflections 6104 [R(int) = 0.0322]
Completeness to theta = 26.00° 100.0 %
Absorption correction Semi-empirical from equivalents
Max. and min. transmission 0.5684 and 0.2445
Refinement method Full-matrix least-squares on F2
Data / restraints / parameters 6104 / 0 / 420
Goodness-of-fit on F2 1.256
Final R indices [I > 2 σ (I)] R1 = 0.0682, wR2 = 0.1524
R indices (all data) R1 = 0.0778, wR2 = 0.1588
Largest diff. peak and hole 1.896 and -1.060 e.Å-3

12 Appendix
299
Crystal structure Na3[Cu(DSA)(HCO3)] · 2.5 H2O · 1.5 MeOH
Operator Dr. Volker Huch
Diffractometer Stoe IPDS
Identification code sh2986
Empirical formula C22.50 H22 Cu N3 Na3 O15 S2
Formula weight 771.06 g/mol
Temperature 213(2) K
Wavelength 0.71073 Å
Crystal system triclinic
Space group P-1
Unit cell dimensions a = 10.343(4) Å α = 71.75(7)°
b = 10.962(8) Å β = 74.37(5)°
c = 14.304(7) Å γ = 76.27(7)°
Volume 1462.4(14) Å3
Z 2
Density (calculated) 1.751 mg/m3
Absorption coefficient 1.014 mm-1
F(000) 784
Crystal size 0.39 x 0.22 x 0.09 mm3
Theta range for data collection 2.30 to 27.00°
Index ranges -13 ≤ h ≤ 13, -14 ≤ k ≤ 14, -18 ≤ l ≤ 18
Reflections collected 16103
Independent reflections 5929 [R(int) = 0.0881]
Completeness to theta = 27.00° 93.0 %
Absorption correction None
Refinement method Full-matrix least-squares on F2
Data / restraints / parameters 5929 / 0 / 431
Goodness-of-fit on F2 0.945
Final R indices [I >2σ(I)] R1 = 0.0575, wR2 = 0.1449
R indices (all data) R1 = 0.0870, wR2 = 0.1589
Largest diff. peak and hole 1.254 and -0.811 e.Å-3

12 Appendix
300
Crystal structure Na3[Cu(DSA)(HCO3)] · (H2O)25/6 · 3 MeOH
Operator Dr. Volker Huch
Diffractometer Bruker X8 Area
Identification code sh3031
Empirical formula C24 H32.33 Cu N3 Na3 O18.17 S2
Formula weight 850.17 g/mol
Temperature 100(2) K
Wavelength 0.71073 Å
Crystal system monoclinic
Space group P2(1)/c
Unit cell dimensions a = 11.9315(7) Å α = 90°
b = 21.6062(12) Å β = 105.147(2)°
c = 14.9654(8) Å γ = 90°
Volume 3724.0(4) Å3
Z 4
Density (calculated) 1.516 mg/m3
Absorption coefficient 0.810 mm-1
F(000) 1747
Crystal size 0.29 x 0.19 x 0.19 mm3
Theta range for data collection 1.77 to 27.00°
Index ranges -15 ≤ h ≤ 14, -26 ≤ k ≤ 27, -16 ≤ l ≤ 19
Reflections collected 32384
Independent reflections 8119 [R(int) = 0.0504]
Completeness to theta = 27.00° 99.9 %
Absorption correction Semi-empirical from equivalents
Max. and min. transmission 0.8614 and 0.7991
Refinement method Full-matrix least-squares on F2
Data / restraints / parameters 8119 / 2 / 466
Goodness-of-fit on F2 1.025
Final R indices [I >2σ(I)] R1 = 0.0750, wR2 = 0.2131
R indices (all data) R1 = 0.1021, wR2 = 0.2372
Largest diff. peak and hole 2.555 and -0.780 e.Å-3

13 References
301
13 References
[1] R. Crichton, Inorganic Biochemistry of Iron Metabolism , 2. ed., John Wiley & Sons, Chichester, 2001.
[2] D. T. Richens, The chemistry of aqua ions, John Wiley & Sons, Chichester, 1997.
[3] F. Bou-Abdallah, BBA-GEN Subjects 2010, 1800, 719-731. [4] G. Löffler, P. E. Petrides, Biochemie und Pathobiochemie, 6. ed.,
Springer-Verlag, Berlin, 1998. [5] N. C. Andrews, P. J. Schmidt, Annu. Rev. Physiol. 2007, 69, 69-85. [6] A. L. Schade, R. W. Reinhard, H. Levy, Arch. Biochem. Biophys. 1949,
20, 170-172. [7] H. Z. Sun, H. Y. Li, P. J. Sadler, Chem. Rev. 1999, 99, 2817-2842. [8] H. A. Huebers, C. A. Finch, Physiol. Rev. 1987, 67, 520-582. [9] U. Schwertmann, J. Friedl, H. Stanjek, J. Colloid Interf. Sci. 1999, 209,
215-223. [10] P. M. Harrison, P. Arosio, BBA-Bioenergetics 1996, 1275, 161-203. [11] W. Wang, M. A. Knovich, L. G. Coffman, F. M. Torti, S. V. Torti, BBA-
GEN Subjects 2010, 1800, 760-769. [12] X. F. Liu, E. C. Theil, Accounts Chem. Res. 2005, 38, 167-175.
[13] M. Uchida, S. Kang, C. Reichhardt, K. Harlen, T. Douglas, BBA-GEN Subjects 2010, 1800, 834-845.
[14] R. J. Ward, M. H. Ramsey, D. P. E. Dickson, A. Florence, R. R. Crichton, T. J. Peters, S. Mann, Eur. J. Biochem. 1992, 209, 847-850.
[15] R. J. Ward, R. Legssyer, C. Henry, R. R. Crichton, J. Inorg. Biochem. 2000, 79, 311-317.
[16] J. E. Huheey, E. A. Keiter, R. L. Keiter, Anorganische Chemie, Prinzipien von Struktur und Reaktivität, 3. ed., Walter de Gruyter, Berlin, 2003.
[17] E. C. Theil, M. Matzapetakis, X. F. Liu, J. Biol. Inorg. Chem. 2006, 11, 803-810.
[18] R. R. Crichton, F. Roman, F. Roland, Febs Lett. 1980, 110, 271-274. [19] O. Kakhlon, Z. I. Cabantchik, Free Radical Bio. Med. 2002, 33, 1037-
1046. [20] F. Petrat, H. de Groot, R. Sustmann, U. Rauen, Biol. Chem. 2002, 383,
489-502. [21] J. A. Wang, K. Pantopoulos, Biochem. J. 2011, 434, 365-381. [22] A. Taher, M. D. Cappellini, Ther. Clin. Risk Manag. 2009, 5, 857-868. [23] A. Pietrangelo, Annu. Rev. Nutr. 2006, 26, 251-270. [24] http://www.exjade.com/Videos/exjade_moa_chapter_two.jsp , Exjade
international website, Iron Toxicity, 14.07.2011. [25] H. Nick, Curr. Opin. Chem. Biol. 2007, 11, 419-423. [26] M. D. Cappellini, A. Taher, Acta Haematol. 2009, 122, 165-173. [27] R. Galanello, R. Origa, Orphanet J. Rare Dis. 2010, 5.
[28] H. Nick, P. Acklin, R. Lattmann, P. Buehlmayer, S. Hauffe, J. Schupp, D. Alberti, Curr. Med. Chem. 2003, 10, 1065-1076.
[29] D. S. Kalinowski, D. R. Richardson, Pharmacol. Rev. 2005, 57, 547-583. [30] M. D. Cappellini, P. Pattoneri, Annu. Rev. Med. 2009, 60, 25-38.

13 References
302
[31] E. Vichinsky, Am. J. Hematol. 2008, 83, 398-402. [32] A. V. Hoffbrand, Best Pract. Res. Clin. Ha. 2005, 18, 299-317. [33] E. Jabbour, G. Garcia-Manero, A. Taher, H. M. Kantarjian, Oncologist
2009, 14, 489-496. [34] E. Vichinsky, O. Onyekwere, J. Porter, P. Swerdlow, J. Eckman, P. Lane,
B. Files, K. Hassell, P. Kelly, F. Wilson, F. Bernaudin, G. L. Forni, I. Okpala, C. Ressayre-Djaffer, D. Alberti, J. Holland, P. Marks, E. Fung, R. Fischer, B. U. Mueller, T. Coates, I. Deferasirox Sickle Cell, Brit. J. Haematol. 2007, 136, 501-508.
[35] A. Pietrangelo, P. Brissot, H. Bonkovsky, C. Niederau, L. Rojkjaer, R. Weitzman, P. Williamson, O. Schoenborn-Kellenberger, P. Phatak, J. Hepatol. 2009, 50, S24-S24.
[36] H. Glickstein, R. Ben El, M. Shvartsman, Z. I. Cabantchik, Blood 2005,
106, 3242-3250. [37] U. Heinz, Doctoral Thesis, Saarland University (Saarbrücken), 2001.
[38] U. Heinz, K. Hegetschweiler, P. Acklin, B. Faller, R. Lattmann, H. P. Schnebli, Angew. Chem. Int. Ed. 1999, 38, 2568-2570.
[39] S. Steinhauser, Doctoral Thesis, Saarland University (Saarbrücken), 2005.
[40] S. Steinhauser, U. Heinz, M. Bartholomä, T. Weyermüller, H. Nick, K. Hegetschweiler, Eur. J. Inorg. Chem. 2004, 4177-4192.
[41] Y. I. Ryabukhin, N. V. Shibaeva, A. S. Kuzharov, V. G. Korobkova, A. V. Khokhlov, A. D. Garnovskii, Sov. J. Cood. Chem. 1987, 13, 493-498.
[42] Y. I. Ryabukhin, L. N. Faleeva, V. G. Korobkova, Chem. Heter. Com. (Engl. Trans.) 1983, 19, 332-336.
[43] T. Eicher, S. Hauptmann, Chemie der Heterocyclen, Struktur, Reaktionen und Synthesen, Thieme, Stuttgart, 1994.
[44] J. Houben, E. Müller, H. Kropf, K. H. Büchel, T. Weyl, Methoden der Organischen Chemie, Vol. 10/2 Stickstoffverbindungen I, Methoden zur Herstellung und Umwandlung von Arylhydrazinen und Arylhydrazonen, Thieme, Stuttgart, 1967.
[45] G. Heinzelmann, Justus Liebigs Ann. Chem. 1878, 190, 222-228. [46] O. Zander, Justus Liebigs Ann. Chem. 1879, 198, 1-29.
[47] C. Hulme, T. E. V. Jr., T. Nixey, B. Chenera, V. Gore, M. D. Bartberger, Y. Sun, Molecular Diversity 2003, 7, 161-164.
[48] A. E. Martell, R. J. Motekaitis, Determination and Use of Stability Constants, VCH Verlagsgesellschaft mbH, Weinheim, 1988.
[49] F. Teucke, Staatsexamensarbeit, Saarland University (Saarbrücken), 2008.
[50] H. Cerfontain, B. W. Schnitger, Recl. Trav. Chim. Pays-Bas 1972, 91, 199-208.
[51] H. Cerfontain, A. Koeberg-Telder, J. Chem. Soc., Perkin Trans. 2 1975, 226-229.
[52] D. S. Crumrine, J. M. Shankweiler, R. V. Hoffman, J. Org. Chem. 1986, 51, 5013-5015.
[53] D. S. Crumrine, D. C. French, J. Org. Chem. 1990, 55, 5494-5496. [54] R. L. Benoit, M. Frechette, D. Boulet, Can. J. Chem. 1989, 67, 2148-
2152.

13 References
303
[55] R. M. Smith, A. E. Martell, R. J. Motekaitis, K. Hegetschweiler, S. Stucky, Critically Selected Stability Constants of Metal Complexes , NIST Standard Reference Database 46 (Version 9.0), Saarland University, Saarbrücken, 2009.
[56] A. L. Spek, PLATON, Utrecht University, Netherlands, 2006. [57] P. v. d. Sluis, A. L. Spek, Acta Cryst. 1990, A46, 194-201. [58] T. Nicolai, Staatsexamensarbeit, Saarland University (Saarbrücken),
2009. [59] S. Stucky, unpublished results 2007.
[60] P. T. Lieu, M. Heiskala, P. A. Peterson, Y. Yang, Mol. Aspects Med. 2001, 22, 1-87.
[61] B. Halliwell, J. M. C. Gutteridge, Arch. Biochem. Biophys 1986, 246, 501-514.
[62] E. Fibach, E. A. Rachmilewitz, Ann. N. Y. Acad. Sci. 2010, 1202, 10-16. [63] D. R. Lide, Handbook of Chemistry and Physics, 74 th Edition, CRC Press
Inc., Boca Raton, Florida, 1993 - 1994. [64] P. Sharp, P. Nutr. Soc. 2004, 63, 563-569. [65] D. Huster, H.-J. Hühn, J. Mössner, K.Caca, Der Internist 2005, 46, 731-
740. [66] P. J. M. W. L. Birker, H. C. Freeman, J. Am. Chem. Soc. 1977, 99, 6890-
6899. [67] M. S. Haddad, D. N. Hendrickson, Inorg. Chim. Acta 1978, 28, L121-
L122. [68] V. Pérez, I. Monsalvo, P. Demare, V. Gómez-Vidales, I. Regla, I.
Castillo, Inorg. Chem. Commun. 2011, 14, 389-391. [69] S. Iglesias, O. Castillo, A. Luque, P. Roman, Inorg. Chim. Acta 2003,
349, 273-278. [70] A. Prescimone, J. Sanchez-Benitez, K. K. Kamenev, S. A. Moggach, J.
E. Warren, A. R. Lennie, M. Murrie, S. Parsons, E. K. Brechin, Dalton Trans. 2010, 39, 113-123.
[71] R. Kirmse, J. Stach, ESR-Spektroskopie Anwendung in der Chemie, Akademie-Verlag, Berlin, 1985.
[72] S. Stucky, N. J. Koch, K. Hegetschweiler, Complex formation of ICL670 and related ligands with Fe III, GaIII, GdIII and CuII, Novartis Pharma AG Final Report, Saarbrücken, 2008.
[73] C. H. Lee, S. T. Wong, T. S. Lin, C. Y. Mou, J. Phys. Chem. B 2005, 109, 775-784.
[74] S. Kawata, M. Iwaizumi, H. Kosugi, H. Yokoi, Chem. Lett. 1987, 2321-2324.
[75] S. Noro, H. Miyasaka, S. Kitagawa, T. Wada, T. Okubo, M. Yamashita, T. Mitani, Inorg. Chem. 2005, 44, 133-146.
[76] X. Wang, Acta Cryst. 2009, E65, m1658. [77] S. Hazra, R. Koner, M. Nayak, H. A. Sparkes, J. A. K. Howard, S. Dutta,
S. Mohanta, Eur. J. Inorg. Chem. 2009, 4887-4894. [78] P. DeBurgomaster, J. Zubieta, Acta Cryst. 2010, E66, m1350-m1351.
[79] M. A. Ali, A. H. Mirza, F. H. Bujang, M. H. S. A. Hamid, P. V. Bernhardt, Polyhedron 2006, 25, 3245-3252.
[80] D. Petrovic, T. Bannenberg, S. Randoll, P. G. Jones, M. Tamm, Dalton Trans. 2007, 2812-2822.

13 References
304
[81] Z. W. Mao, G. Liehr, R. van Eldik, J. Am. Chem. Soc. 2000, 122, 4839-
4840. [82] E. Denkhaus, K. Salnikow, Crit. Rev. Oncol. Hemat. 2002, 42, 35-56. [83] R. P. Hausinger, Sci. Total Environ. 1994, 148, 157-166. [84] S. B. Mulrooney, R. P. Hausinger, Fems Microbiology Reviews 2003, 27,
239-261. [85] J. Kuchar, R. P. Hausinger, Chem. Rev. 2004, 104, 509-525.
[86] C. S. A. Baltazar, M. C. Marques, C. M. Soares, A. M. DeLacey, I. A. C. Pereira, P. M. Matias, Eur. J. Inorg. Chem. 2011, 948-962.
[87] S. E. Schram, E. M. Warshaw, A. Laumann, Int. J. Dermatol. 2010, 49, 115-125.
[88] M. Costa, K. Salnikow, J. E. Sutherland, L. Broday, W. Peng, Q. W. Zhang, T. Kluz, Mol.Cell. Biochem. 2002, 234, 265-275.
[89] C. Y. Chen, Y. F. Wang, W. R. Huang, Y. T. Huang, Toxicol. Appl. Pharm. 2003, 189, 153-159.
[90] R. F. M. Herber, Int. Arch. Occ. Env. Hea. 1999, 72, 279-283. [91] H. Elias, D. Hess, H. Paulus, Z. anorg. allg. Chem. 1990, 589, 101-114. [92] H. Liu, H. Wang, D. Niu, Z. Lu, Synth. React. Inorg. M. 2005, 35, 233-
236. [93] Y. Gultneh, A. R. Khan, B. Ahvazi, R. J. Butcher, Polyhedron 1998, 17,
3351-3360. [94] B. L. Vallee, D. S. Auld, Acc. Chem. Res. 1993, 26, 543-551. [95] W. N. Lipscomb, N. Strater, Chem. Rev. 1996, 96, 2375-2433. [96] J. E. Coleman, Curr. Opin. Chem. Biol. 1998, 2, 222-234. [97] C. Bergquist, T. Fillebeen, M. M. Morlok, G. Parkin, J. Am. Chem. Soc.
2003, 125, 6189-6199. [98] M. Subat, K. Woinaroschy, S. Anthofer, B. Malterer, B. Konig, Inorg.
Chem. 2007, 46, 4336-4356. [99] A. Mondal, G. Mostafa, A. Ghosh, N. R. Chaudhuri, W. T. Wong,
Polyhedron 1998, 17, 1217-1221. [100] S.-Y. Wan, Y.-Z. Li, T.-a. Okamura, J. Fan, W.-Y. Sun, N. Ueyama, Eur.
J. Inorg. Chem. 2003, 3783-3789. [101] D. Anselmo, E. C. Escudero-Adan, J. Benet-Buchhollz, A. W. Kleij,
Dalton Trans. 2010, 39, 8733-8740. [102] P. Chaudhuri, C. Stockheim, K. Wieghardt, W. Deck, R. Gregorzik, H.
Vahrenkamp, B. Nuber, J. Weiss, Inorg. Chem. 1992, 31, 1451-1457. [103] M. D. Hannant, M. Schormann, D. L. Hughes, M. Bochmann, Inorg.
Chim. Acta 2005, 358, 1683-1691. [104] N. N. Murthy, K. D. Karlin, J. Chem. Soc., Chem. Commun. 1993, 1236-
1238. [105] K. Selmeczi, C. Michel, A. Milet, I. Gautier-Luneau, C. Philouze, J.-L.
Pierre, D. Schnieders, A. Rompel, C. Belle, Chem. Eur. J. 2007, 13. [106] R. R. Buchholz, M. E. Etienne, A. Dorgelo, R. E. Mirams, S. J. Smith, S.
Y. Chow, L. R. Hanton, G. B. Jameson, G. Schenk, L. R. Gahan, Dalton Trans. 2008, 6045-6054.
[107] A. Hartwig, Biometals 2010, 23, 951-960. [108] R. A. Goyer, Annu. Rev. Nutr. 1997, 17, 37-50. [109] G. Kazantzis, Biometals 2004, 17, 493-498. [110] H. Strasdeit, Angew. Chem. Int. Ed. 2001, 40, 707-709.

13 References
305
[111] T. W. Lane, F. M. M. Morel, Proc. Natl. Acad. Sci. USA 2000, 97, 4627-
4631. [112] A. S. Saljooghi, S. J. A. Fatemi, Biometals 2010, 23, 707-712.
[113] R. A. Allred, L. H. McAlexander, A. M. Arif, L. M. Berreau, Inorg. Chem. 2002, 41, 6790-6801.
[114] R. A. Allred, S. A. Huefner, K. Rudzka, A. M. Arif, L. M. Berreau, Dalton Trans. 2007, 351-357.
[115] S. V. Perry, Biochem. Bioph. Res. Co. 2008, 369, 43-48. [116] M. Kawahara, K. Konoha, T. Nagata, Y. Sadakane, Biomed. Res. Trace
Elements 2007, 18, 211-220. [117] A. Becaria, A. Campbell, S. C. Bondy, Toxicol. Ind. Health 2002, 18, 309-
320. [118] R. D. Shannon, Acta Cryst. 1976, A32, 751-767. [119] C. M. Reinke, J. Breitkreutz, H. Leuenberger, Drug Safety 2003, 26,
1011-1025. [120] A. I. Arieff, Environ. Geochem. Health 1999, 12, 89-93. [121] C. F. Baes, R. E. Mesmer, The Hydrolysis of Cations, Wiley-Interscience,
New York, 1976. [122] P. Fiordiponti, F. Rallo, F. Rodante, Z. Phys. Chem. Neue Folge 1974,
88, 149-159. [123] E. M. Woolley, L. G. Hepler, Analytical Chemistry 1972, 44, 1520-1523. [124] D. Martin, A. Weise, H.-J. Niclas, Angew. Chem. 1967, 8, 340-357. [125] S. Stucky, N. J. Koch, U. Heinz, K. Hegetschweiler, Chemical Papers
2008, 62, 388-397. [126] A. Ries, K. Hegetschweiler, NMR-Tit, Program for the Simulation of pH
Dependent Shifts in NMR Spectra, Version 2.0, Saarbrücken, 1999. [127] M. Schaefer, Met Based Drugs 1997, 4, 159-171.
[128] S. Aime, W. Dastru, S. G. Crich, E. Gianolio, V. Mainero, Biopolymers 2002, 66, 419-428.
[129] A. J. L. Villaraza, A. Bumb, M. W. Brechbiel, Chem. Rev. 2010, 110, 2921-2959.
[130] P. Caravan, J. J. Ellison, T. J. McMurry, R. B. Lauffer, Chem. Rev. 1999, 99, 2293-2352.
[131] S. K. Morcos, Eur. J. Radiol. 2008, 66, 175-179. [132] J. M. Idee, M. Port, I. Raynal, M. Schaefer, S. Le Greneur, C. Corot,
Fundam. Clin. Pharm. 2006, 20, 563-576. [133] S. Laurent, L. V. Elst, F. Copoix, R. N. Muller, Invest. Radiol. 2001, 36,
115-122. [134] Z. L. Cheng, D. L. J. Thorek, A. Tsourkas, Angew. Chem. Int. Ed. 2010,
49, 346-350. [135] Z. Kotkova, J. Kotek, D. Jirak, P. Jendelova, V. Herynek, Z. Berkova, P.
Hermann, I. Lukes, Chem. Eur. J. 2010, 16, 10094-10102. [136] E. T. Clarke, A. E. Martell, Inorg. Chim. Acta 1991, 190, 37-46. [137] W. Wadsak, M. Mitterhauser, Eur. J. Radiol. 2010, 73, 461-469. [138] T. J. Wadas, E. H. Wong, G. R. Weisman, C. J. Anderson, Chem. Rev.
2010, 110, 2858-2902. [139] D. E. Reichert, J. S. Lewis, C. J. Anderson, Coord. Chem. Rev. 1999,
184, 3-66.

13 References
306
[140] M. Fani, J. P. Andre, H. R. Maecke, Contrast Media Mol. Imaging 2008,
3, 53-63. [141] W. R. Harris, V. L. Pecoraro, Biochemistry 1983, 22, 292-299.
[142] A. Heppeler, S. Froidevaux, A. N. Eberle, H. R. Maecke, Curr. Med. Chem. 2000, 7, 971-994.
[143] R. J. Motekaitis, A. E. Martell, Inorg. Chem. 1980, 19, 1646-1651. [144] H. Nick, R. Lattmann, Novartis AG [CH], Novartis Pharma GmbH [AT],
WO 2007/051773 A1, 2007. [145] H. Irving, H. Rossotti, Acta Chem. Scand. 1956, 10, 72-93. [146] W. R. Harris, K. N. Raymond, F. L. Weitl, J. Am. Chem. Soc. 1981, 103,
2667-2675. [147] P. Gans, L. Alderighi, A. Ienco, D. Peters, A. Sabatini, A. Vacca, Coord.
Chem. Rev. 1999, 184, 311-318.
[148] S. Steinhauser, U. Heinz, M. Bartholoma, T. Weyhermuller, H. Nick, K. Hegetschweiler, Eur. J. Inorg. Chem. 2005, 2262-2262.
[149] Z. D. Liu, R. C. Hider, Med. Res. Rev. 2002, 22, 26-64. [150] MESSLABOR, a computer program for the control of potentiometric and
spectrophotometric titrations, Scientec GmbH, Saarbrücken, 2002. [151] K. Hegetschweiler, TITKURVE, Version 1.1, 1993.
[152] R. A. Binstead, B. Jung, A. D. Zuberbühler, SPECFIT/32, Version 3.0, Spectrum Software Associates, Marlborough, MA 01752, USA, 2000.
[153] H. Gampp, M. Maeder, C. J. Meyer, A. D. Zuberbühler, Talanta 1985, 32, 1133-1139.
[154] P. Gans, A. Sabatini, A. Vacca, Talanta 1996, 43, 1739-1753. [155] R. Lumry, E. L. Smith, R. R. Glantz, J. Am. Soc. 1951, 73, 4330-4340.
[156] R. Delgado, J. J. R. F. D. Silva, M. T. S. Amorim, M. F. Cabral, S. Chaves, J. Costa, Anal. Chim. Acta 1991, 245, 271-282.
[157] G. M. Sheldrick, Program for Crystal Structure Solution, SHELXS-97, Version 2, Göttingen, 1997.
[158] G. M. Sheldrick, Program for Crystal Structure Refinement, SHELXL-97, Version 2, Göttingen, 1997.
[159] Diamond, Program for Crystal and Molecular Structure Visualisation , Crystal Impact GbR, Version 3.2 f, Bonn, 2010.