synthesis and characterization of novel ion sensor … · synthesis and characterization of novel...
TRANSCRIPT
SYNTHESIS AND CHARACTERIZATION OF NOVEL ION
SENSOR BASED ON 2, 6-FUNCTIONALIZED BODIPY
STRUCTURE
A THESIS
SUBMITTED TO THE MATERIALS SCIENCE AND
NANOTECHNOLOGY PROGRAM
AND THE GRADUATE SCHOOL OF ENGINEERING AND SCIENCES
OF BİLKENT UNIVERSITY
IN PARTIAL FULFILLMENT OF THE REQUIREMENTS
FOR THE DEGREE OF
MASTER OF SCIENCE
By
Taha Bilal Uyar
September 2012

I certify that I have read this thesis and that in my opinion it is fully adequate,
in scope and in quality, as a thesis of the degree of Master of Science.
………………………………….
Prof. Dr. Engin U. Akkaya (Principal Advisor)
I certify that I have read this thesis and that in my opinion it is fully adequate,
in scope and in quality, as a thesis of the degree of Master of Science.
………………………………….
Assoc. Prof. Dr. Mehmet Bayındır
I certify that I have read this thesis and that in my opinion it is fully adequate,
in scope and in quality, as a thesis of the degree of Master of Science.
………………………………….
Assist. Prof. Dr. Serdar Atılgan
Approved for the Graduate School of Engineering and Science:
………………………………….
Prof. Dr. Levent Onural
Director of the Graduate School
iii
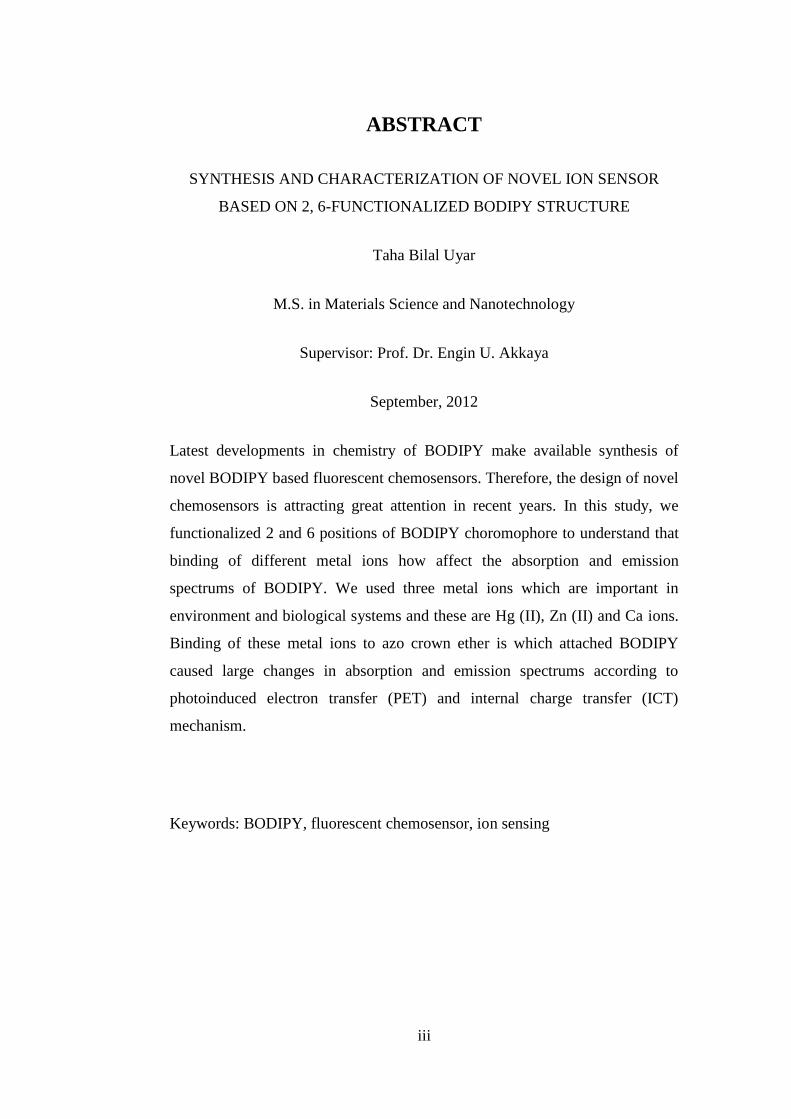
ABSTRACT
SYNTHESIS AND CHARACTERIZATION OF NOVEL ION SENSOR
BASED ON 2, 6-FUNCTIONALIZED BODIPY STRUCTURE
Taha Bilal Uyar
M.S. in Materials Science and Nanotechnology
Supervisor: Prof. Dr. Engin U. Akkaya
September, 2012
Latest developments in chemistry of BODIPY make available synthesis of
novel BODIPY based fluorescent chemosensors. Therefore, the design of novel
chemosensors is attracting great attention in recent years. In this study, we
functionalized 2 and 6 positions of BODIPY choromophore to understand that
binding of different metal ions how affect the absorption and emission
spectrums of BODIPY. We used three metal ions which are important in
environment and biological systems and these are Hg (II), Zn (II) and Ca ions.
Binding of these metal ions to azo crown ether is which attached BODIPY
caused large changes in absorption and emission spectrums according to
photoinduced electron transfer (PET) and internal charge transfer (ICT)
mechanism.
Keywords: BODIPY, fluorescent chemosensor, ion sensing
iv
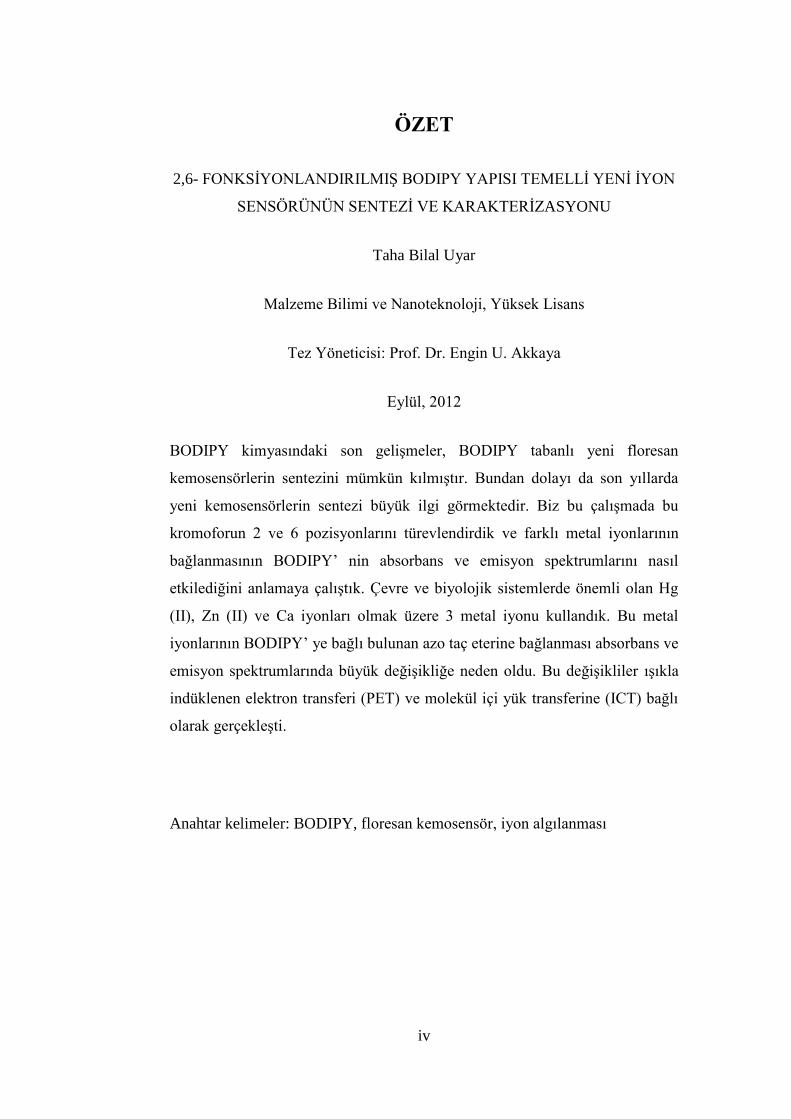
ÖZET
2,6- FONKSİYONLANDIRILMIŞ BODIPY YAPISI TEMELLİ YENİ İYON
SENSÖRÜNÜN SENTEZİ VE KARAKTERİZASYONU
Taha Bilal Uyar
Malzeme Bilimi ve Nanoteknoloji, Yüksek Lisans
Tez Yöneticisi: Prof. Dr. Engin U. Akkaya
Eylül, 2012
BODIPY kimyasındaki son gelişmeler, BODIPY tabanlı yeni floresan
kemosensörlerin sentezini mümkün kılmıştır. Bundan dolayı da son yıllarda
yeni kemosensörlerin sentezi büyük ilgi görmektedir. Biz bu çalışmada bu
kromoforun 2 ve 6 pozisyonlarını türevlendirdik ve farklı metal iyonlarının
bağlanmasının BODIPY‟ nin absorbans ve emisyon spektrumlarını nasıl
etkilediğini anlamaya çalıştık. Çevre ve biyolojik sistemlerde önemli olan Hg
(II), Zn (II) ve Ca iyonları olmak üzere 3 metal iyonu kullandık. Bu metal
iyonlarının BODIPY‟ ye bağlı bulunan azo taç eterine bağlanması absorbans ve
emisyon spektrumlarında büyük değişikliğe neden oldu. Bu değişikliler ışıkla
indüklenen elektron transferi (PET) ve molekül içi yük transferine (ICT) bağlı
olarak gerçekleşti.
Anahtar kelimeler: BODIPY, floresan kemosensör, iyon algılanması

v
ACKNOWLEDGEMENT
I would like to express my sincere thanks to my supervisor Prof. Dr. Engin U.
Akkaya for his guidance, support, and patience during the course of this
research. I am also grateful to him for teaching us how to become a good
scientist. I will never forget his support throughout my life.
I would like to thank to Ahmet Selim Han for his partnership in this research. I
owe a special thank to Ahmet Atılgan for his support.
I want to thank to our group members Ruslan Guliyev, Yusuf Çakmak, Sündüs
Erbaş Çakmak, Ziya Köstereli, Asst. Prof. Ayşegül Gümüş, Bilal Kılıç, Tuğba
Özdemir, Dr. Murat Işık, Ahmet Bekdemir, Elif Ertem, Safacan Kölemen, Dr.
Esra Tanrıverdi Elçik, Dr. Fazlı Sözmen, Onur Büyükçakır, İlke Şimşek Turan,
Nisa Yeşilgül, Şeyma Öztürk, Fatma Pir, Gizem Çeltek, Tuğçe Durgut, F. Tuba
Yaşar, Yiğit Altay, Hatice Durgut, Ulvi Karaca, and rest of the SCL
(Supramolecular Chemistry Laboratory) members. It was wonderful to work
with them.
I would like to thank to TÜBİTAK (The Scientific and Technological Research
Council of Turkey) for financial support.
My special thanks go to my family and friends for their endless support, trust
and encouragement.
vi
TABLE OF CONTENTS
CHAPTER 1: INTRODUCTION ...................................................................... 1
1.1. Supramolecular Chemistry .................................................................. 1
1.1.1. Electrostatic Interactions .............................................................. 2
1.1.2. Hydrogen Bonding ....................................................................... 3
1.1.3. π Interactions ................................................................................ 3
1.1.4. Van der Waals Forces ................................................................... 4
1.1.5. Hydrophobic Effects ..................................................................... 5
1.2. Fluorescence ........................................................................................ 6
1.2.1. Fluorescent Dyes .......................................................................... 8
1.3. Molecular Sensors ............................................................................. 10
1.3.1. Fluorescent Sensors .................................................................... 12
1.3.1.1. Photoinduced Electron Transfer (PET) ............................... 13
1.3.1.2. Internal Charge Transfer (ICT) ........................................... 16
1.3.2. Sensing of Particular Metal Ions ................................................ 18
1.3.2.1. Mercury Ion Sensors ........................................................... 18
1.3.2.2. Zinc Ion Sensors .................................................................. 21
1.3.2.3. Calcium Ion Sensors ........................................................... 22
1.4. BODIPY ............................................................................................ 22
1.4.1. Applications of BODIPY ........................................................... 24
CHAPTER 2: EXPERIMENTAL .................................................................... 29
2.1. General ............................................................................................... 29
2.2. Synthesis of Compound 28 ................................................................ 30

vii
2.3. Synthesis of Compound 29 ................................................................ 30
2.4. Synthesis of Compound 30 ................................................................ 31
2.5. Synthesis of Compound 31 ................................................................ 32
2.6. Synthesis of Compound 32 ................................................................ 33
2.7. Synthesis of Compound 33 ................................................................ 34
2.8. Synthesis of Compound 34 ................................................................ 35
2.9. Synthesis of Compound 35 ................................................................ 36
CHAPTER 3: RESULTS AND DISCUSSIONS ............................................. 38
CHAPTER 4: CONCLUSION ......................................................................... 50
REFERENCES ................................................................................................. 51
APPENDIX A: NMR SPECTRA..................................................................... 56
APPENDIX B: MASS SPECTRA ................................................................... 73

viii
LIST OF FIGURES
Figure 1. Examples of electrostatic interaction .................................................. 3
Figure 2. In vapor phase, carboxylic acid usually form dimers by hydrogen
bonding ............................................................................................................... 3
Figure 3. Cation- interactions ........................................................................... 4
Figure 4. Face-to-face and edge-to-face interaction of benzene ........................ 4
Figure 5. Entropic hydrophobic effect ............................................................... 5
Figure 6. De-excitation pathways of excited molecules32
.................................. 6
Figure 7. The Jablonski Diagram ....................................................................... 7
Figure 8. Stokes‟ Shift ........................................................................................ 8
Figure 9. Common dyes in visible region .......................................................... 9
Figure 10. Structure of common dyes .............................................................. 10
Figure 11. Examples of molecular sensors for anion and cation ...................... 12
Figure 12. Schematic representations of fluorescent sensors ........................... 13
Figure 13. Schematic representation and mechanism of PET .......................... 14
Figure 14. Examples for PET based fluorescent sensors38–40
........................... 14
Figure 15. Schematic representation and mechanism of reverse PET ............. 15
Figure 16. An example of oxidative PET ......................................................... 16
Figure 17. Shifts of ICT based sensors ............................................................. 17
Figure 18. Some examples of ICT based sensors ............................................. 18
Figure 19. Hg (II) selective sensors .................................................................. 20
Figure 20. Some examples of Zn (II) sensors from literature .......................... 21
Figure 21. Photocleavage reaction of caged Ca2+
compound........................... 22
Figure 22. BODIPY has many positions for functionalization ........................ 23
Figure 23. Research groups that working on BODIPY .................................... 23
ix
Figure 24. Application areas of BODIPY ........................................................ 24
Figure 25. BODIPY based chemosensors ........................................................ 25
Figure 26. Photosensitizers for photodynamic therapy .................................... 26
Figure 27. Examples of light harvesting systems and energy transfer cassettes
.......................................................................................................................... 27
Figure 28. An example of BODIPY based photosensitizer .............................. 28
Figure 29. Synthesis of compound 28 .............................................................. 30
Figure 30. Synthesis of compound 29 .............................................................. 31
Figure 31. Synthesis of compound 30 .............................................................. 32
Figure 32. Synthesis of compound 31 .............................................................. 33
Figure 33. Synthesis of compound 32 .............................................................. 34
Figure 34. Synthesis of compound 33 .............................................................. 35
Figure 35. Synthesis of compound 34 .............................................................. 36
Figure 36. Synthesis of compound 35 .............................................................. 37
Figure 37. Structure of compund 35 ................................................................. 39
Figure 38. Absorption spectrums of 35 and complexes ................................... 40
Figure 39. Titration of 35+Ca (5 µM) with increasing Ca ion (perchlorate salt)
concentration (0-150 µM) in acetonitrile ......................................................... 41
Figure 40. Titration of 35+Hg (5 µM) with increasing Hg ion (perchlorate salt)
concentration (0-15 µM) in acetonitrile ........................................................... 41
Figure 41. Titration of 35+Zn (5 µM) with increasing Zn ion (perchlorate salt)
concentration (0-180 µM) in acetonitrile ......................................................... 42
Figure 42. Emission spectrums of 35 and complexes ...................................... 43
Figure 43. Probable structure of 35 according to absorption and emission
spectrums .......................................................................................................... 44
x
Figure 44. Energy minimized (Spartan‟08 geometry optimization) structure of
compound 35 .................................................................................................... 44
Figure 45. Emission spectrum (555 nm) of 35+Hg (5 µM) with increasing Hg
ion (perchlorate salt) concentration (5-15 µM) in acetonitrile ......................... 45
Figure 46. Excitation spectrum (590 nm) of 35+Hg (5 µM) with increasing Hg
ion (perchlorate salt) concentration (5-15 µM) in acetonitrile ......................... 46
Figure 47. Emission spectrum (555 nm) of 35+Zn (5 µM) with increasing Zn
ion (perchlorate salt) concentration (10-180 µM) in acetonitrile ..................... 46
Figure 48. Excitation spectrum (590 nm) of 35+Zn (5 µM) with increasing Zn
ion (perchlorate salt) concentration (10-180 µM) in acetonitrile ..................... 47
Figure 49. Absorption spectrums in different mole fractions of 35 ................. 48
Figure 50. Job‟s plot of complexe of 35 with Hg (II) ...................................... 48
Figure 51. Predicted structure of complex of 35 with Hg ................................ 49
Figure 52. 1H spectrum of compound 28 ......................................................... 57
Figure 53. 13
C spectrum of compound 28 ......................................................... 58
Figure 54. 1H spectrum of compound 29 ......................................................... 59
Figure 55. 13
C spectrum of compound 29 ........................................................ 60
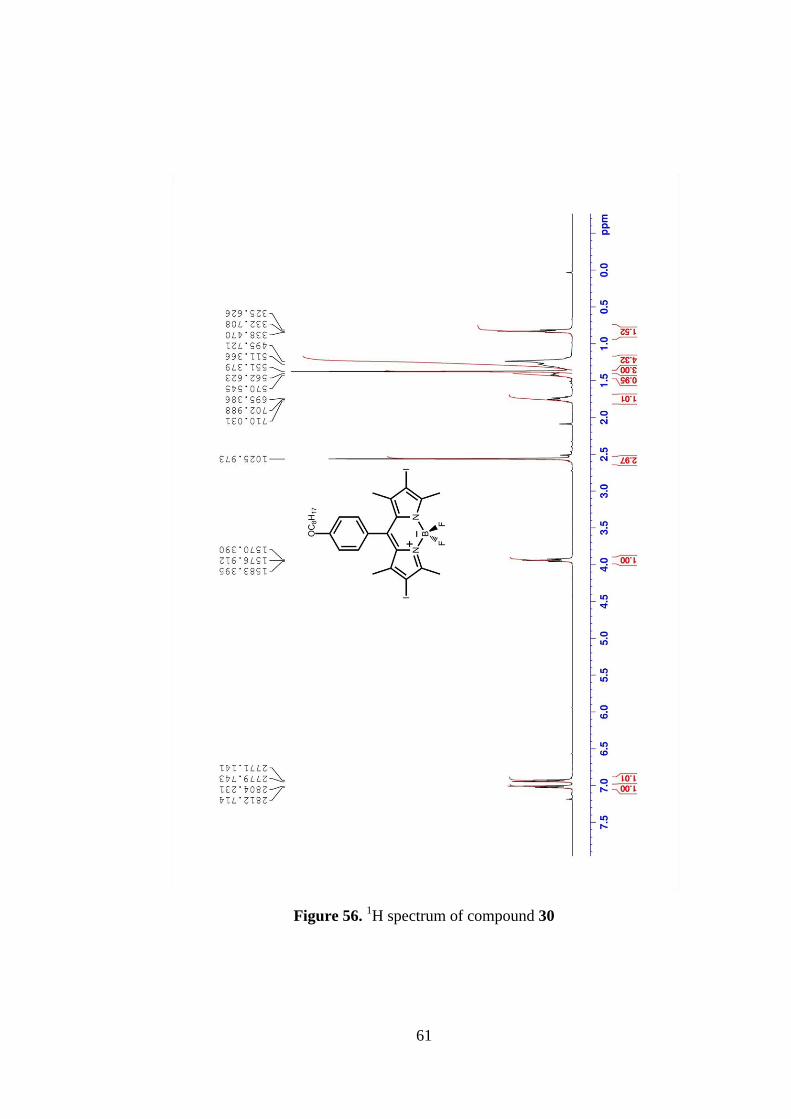
Figure 56. 1H spectrum of compound 30 ......................................................... 61
Figure 57. 13
C spectrum of compound 30 ........................................................ 62
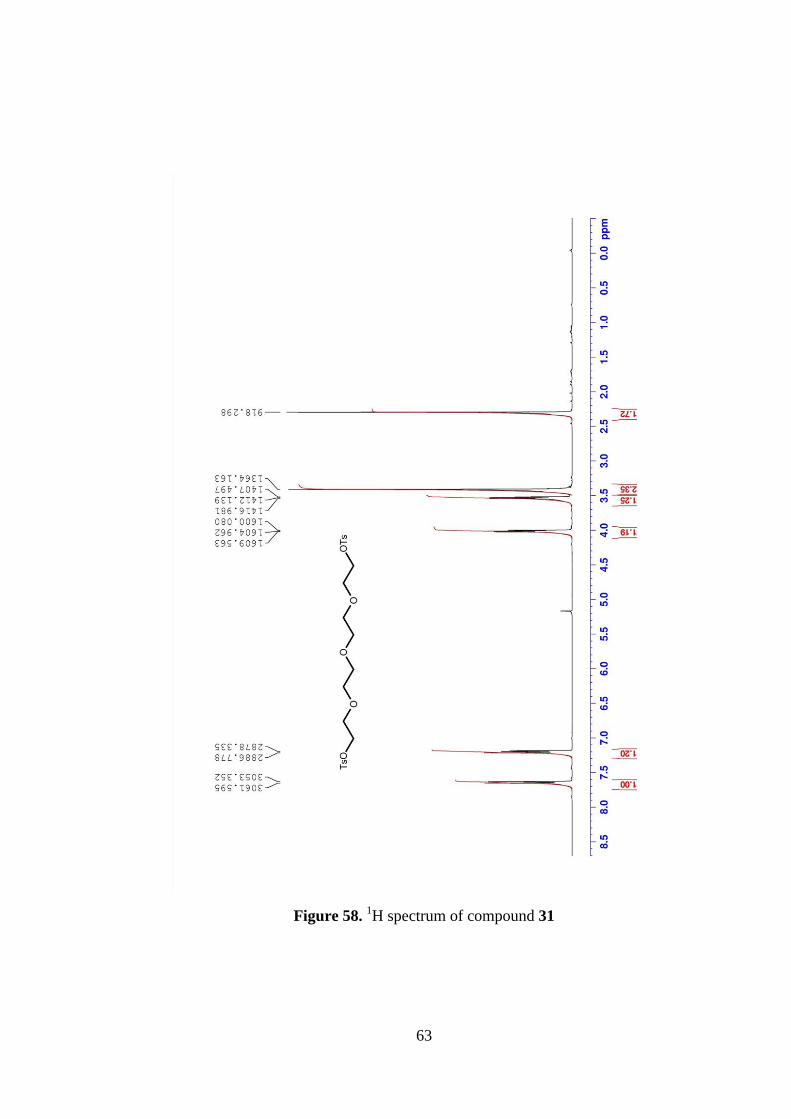
Figure 58. 1H spectrum of compound 31 ......................................................... 63
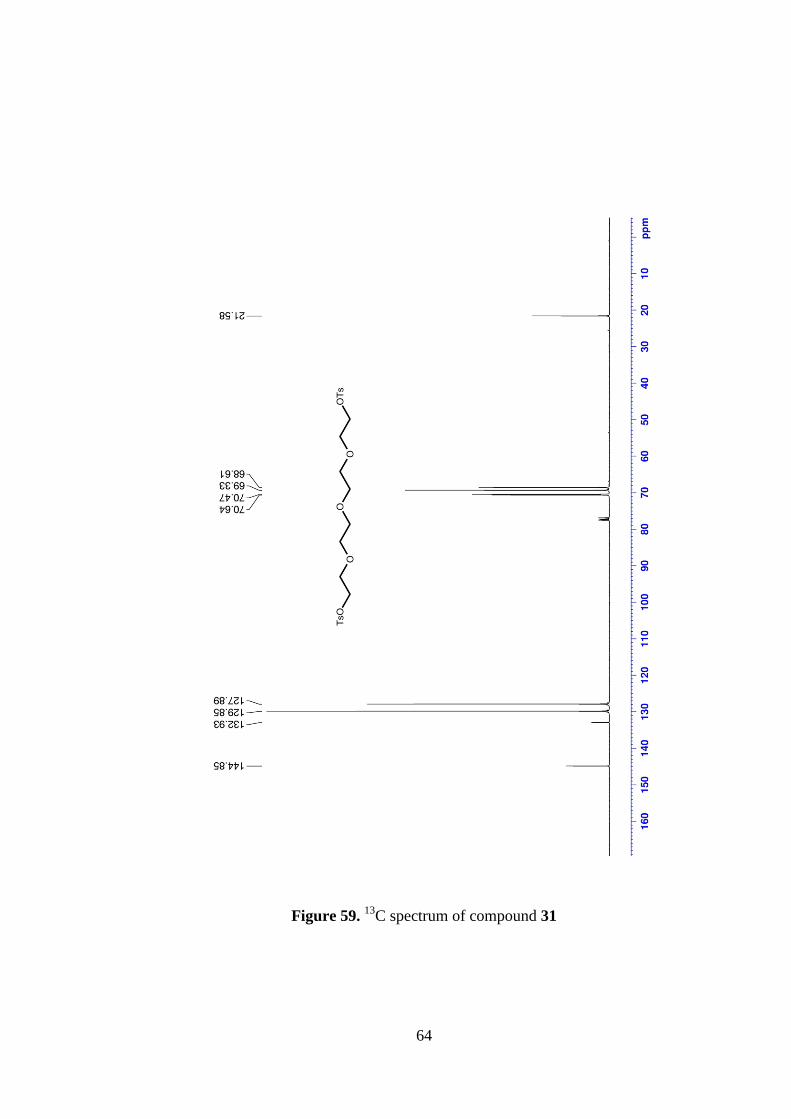
Figure 59. 13
C spectrum of compound 31 ........................................................ 64
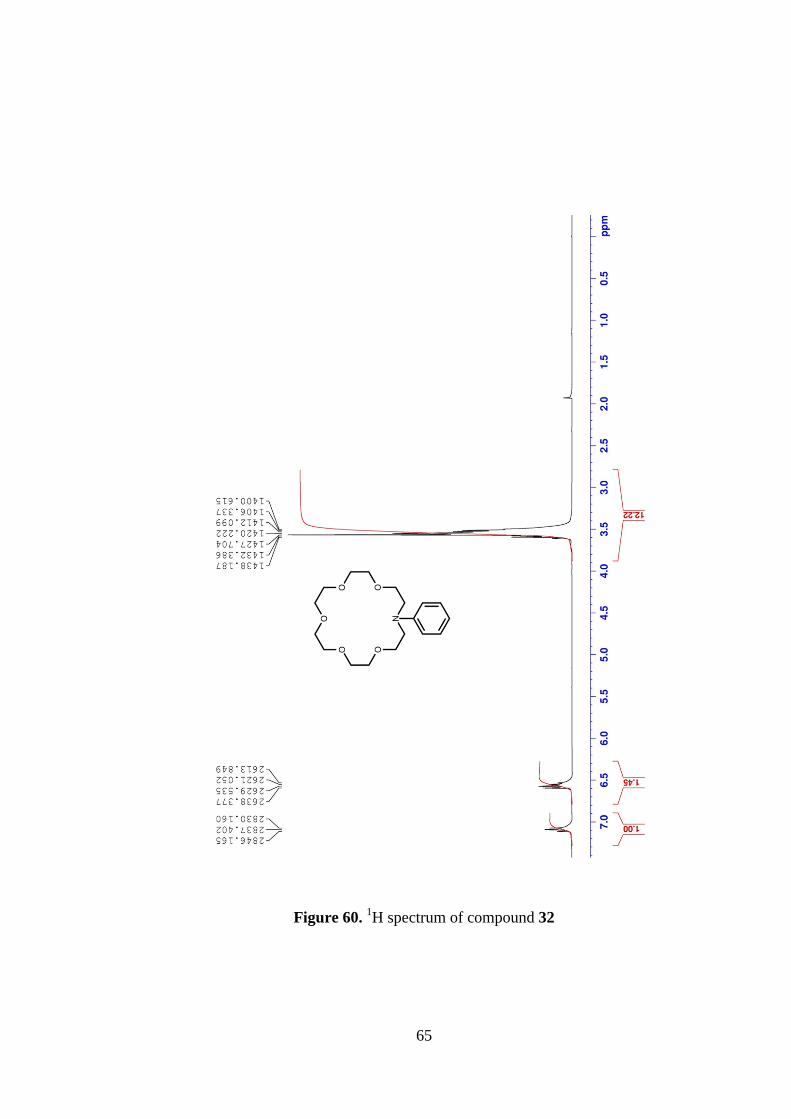
Figure 60. 1H spectrum of compound 32 ......................................................... 65
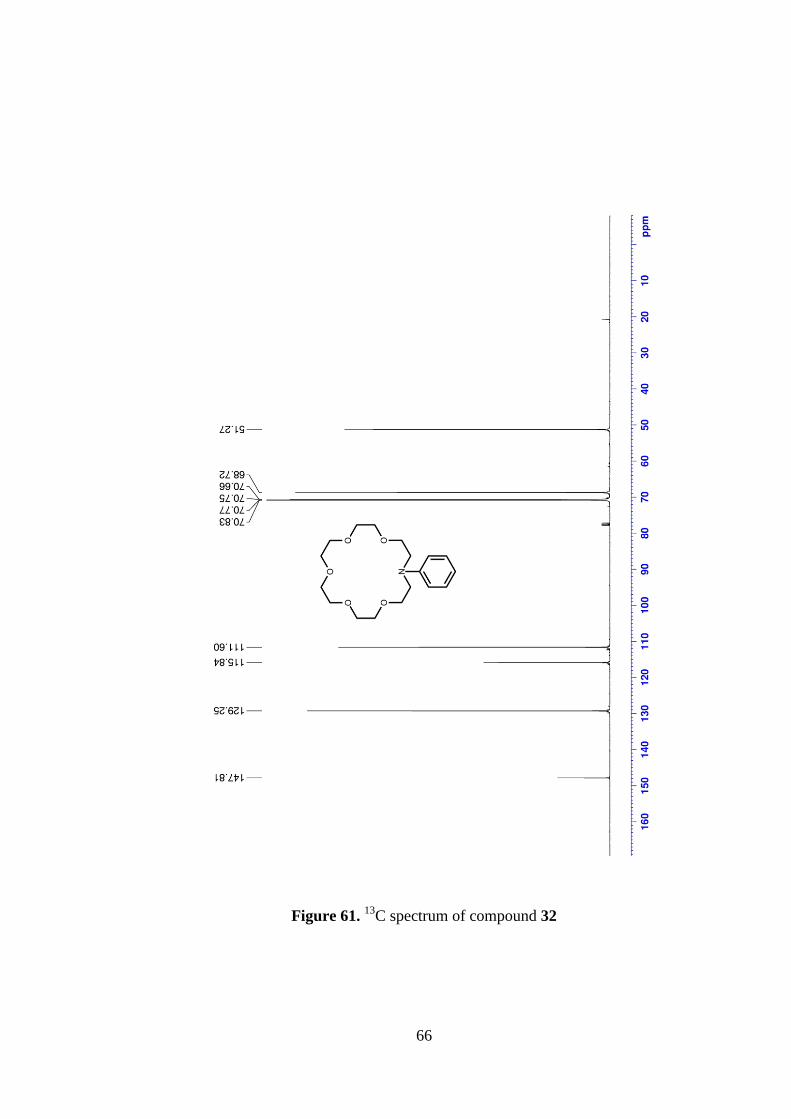
Figure 61. 13
C spectrum of compound 32 ........................................................ 66
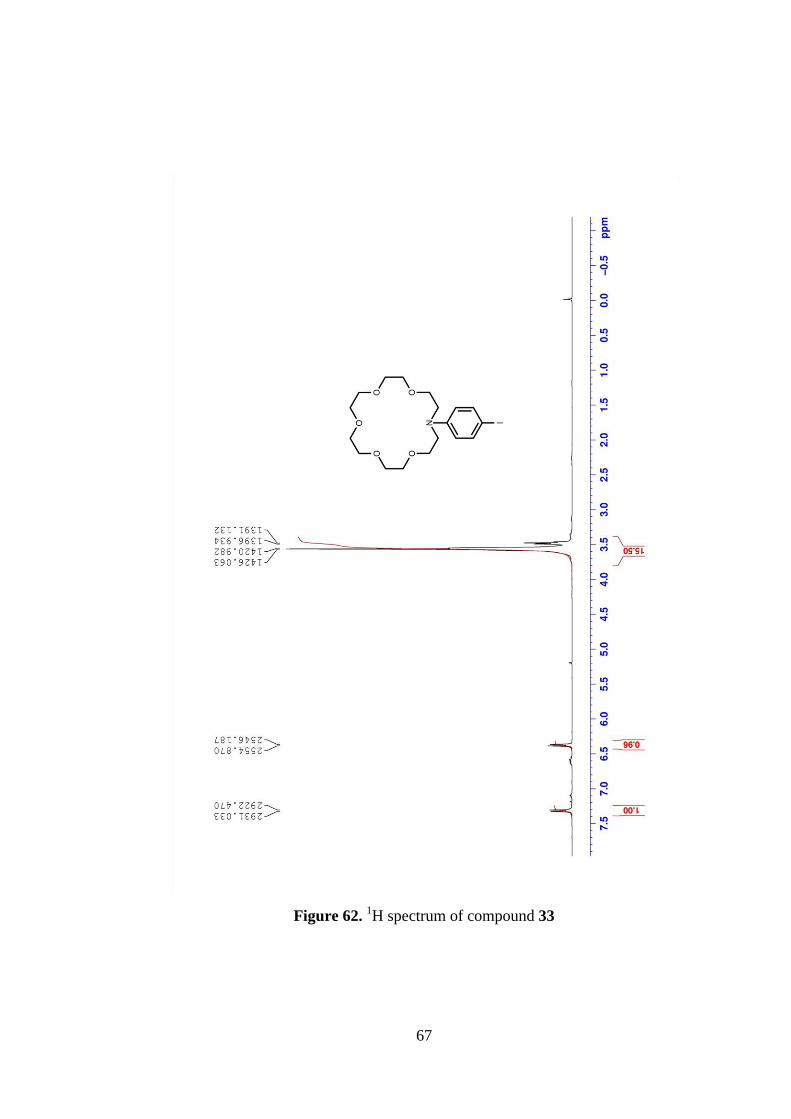
Figure 62. 1H spectrum of compound 33 ......................................................... 67
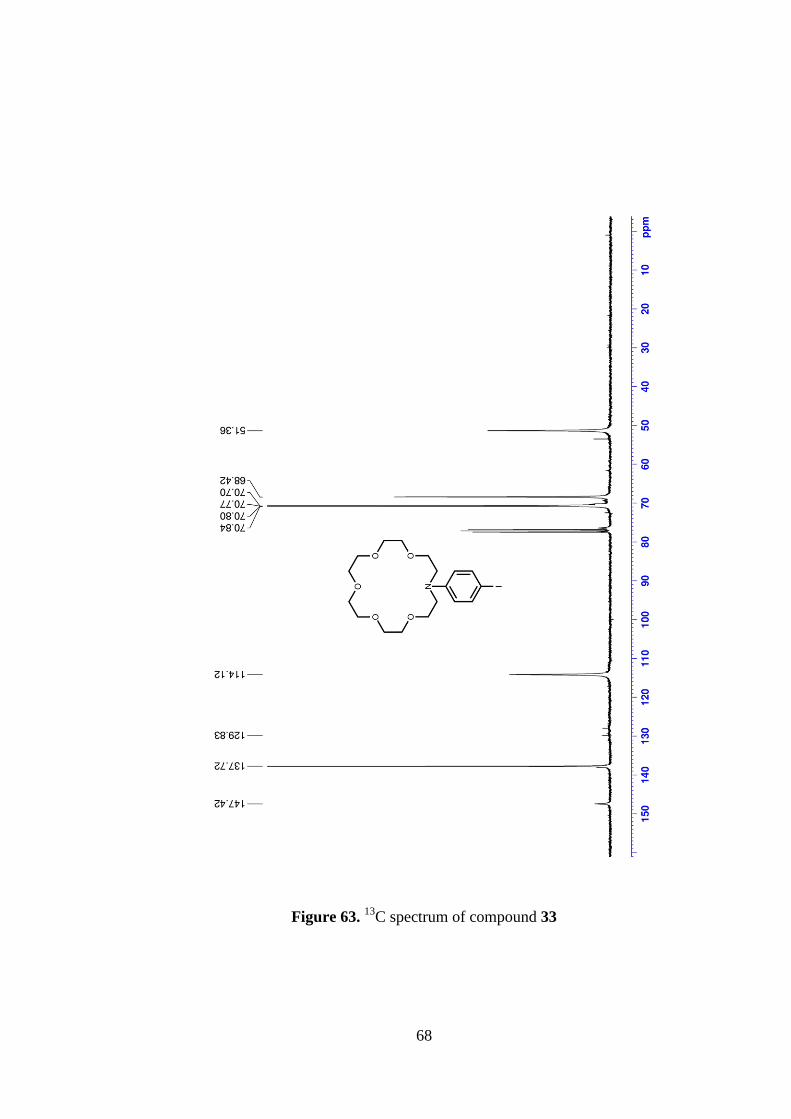
Figure 63. 13
C spectrum of compound 33 ........................................................ 68
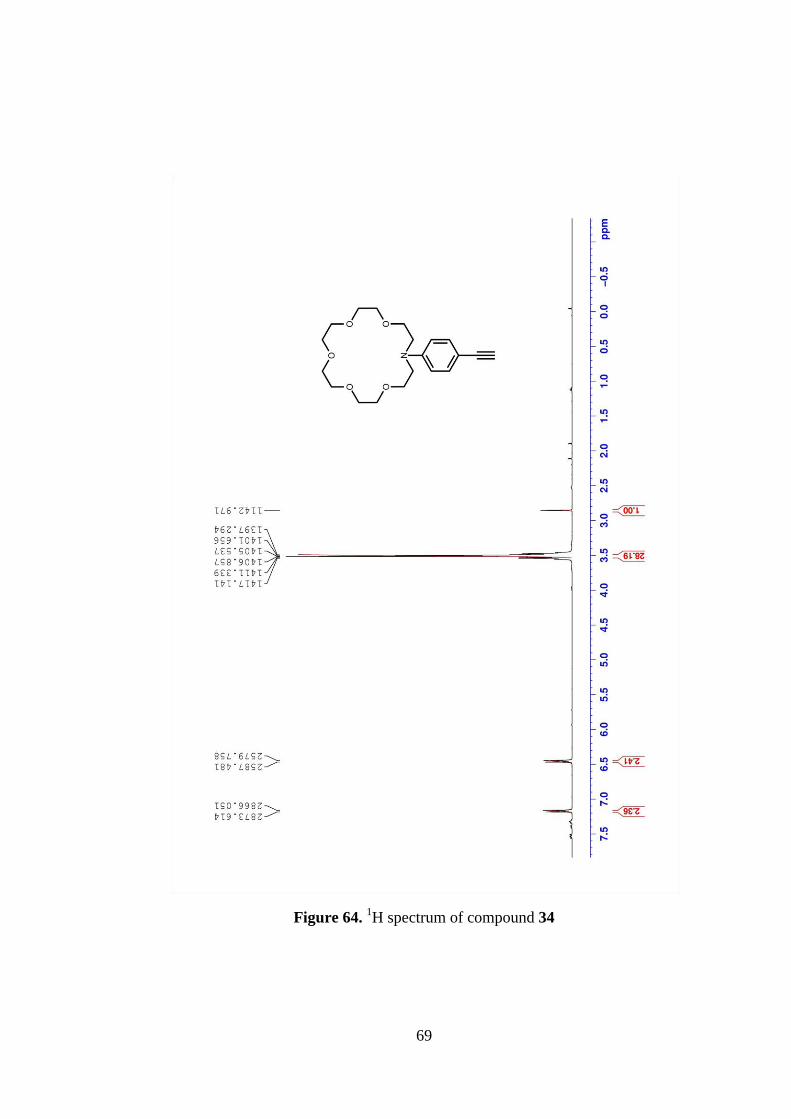
Figure 64. 1H spectrum of compound 34 ......................................................... 69
xi
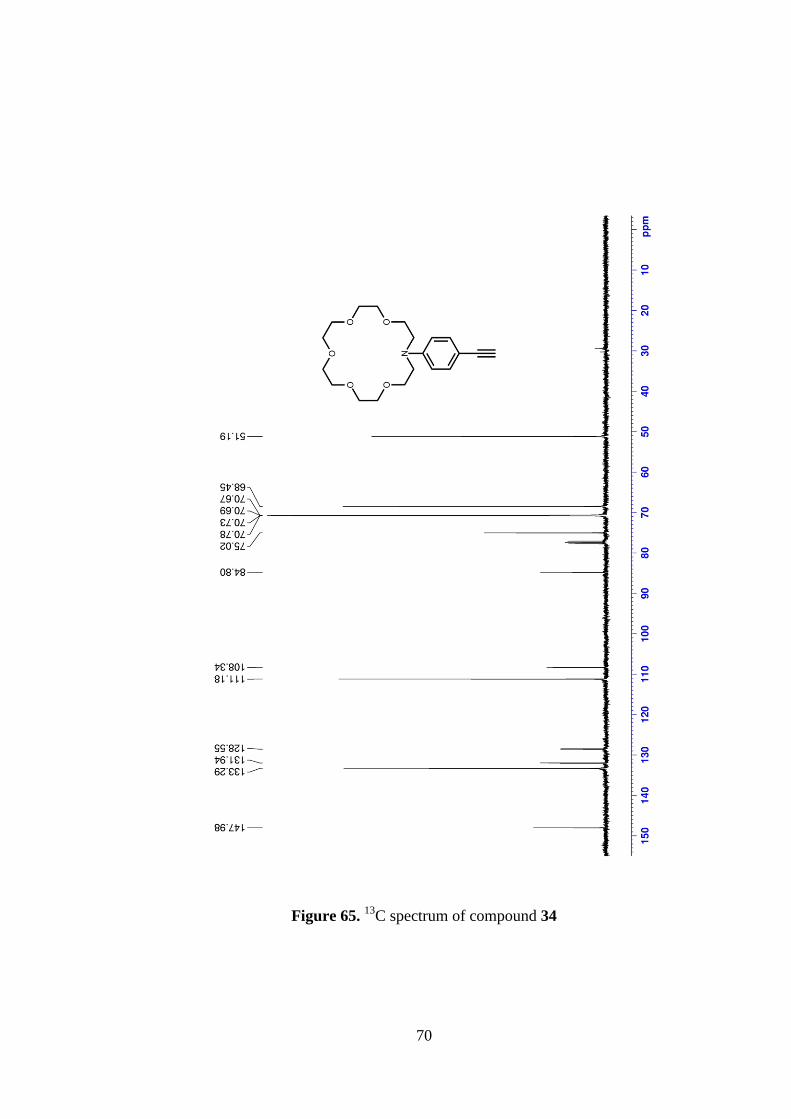
Figure 65. 13
C spectrum of compound 34 ........................................................ 70
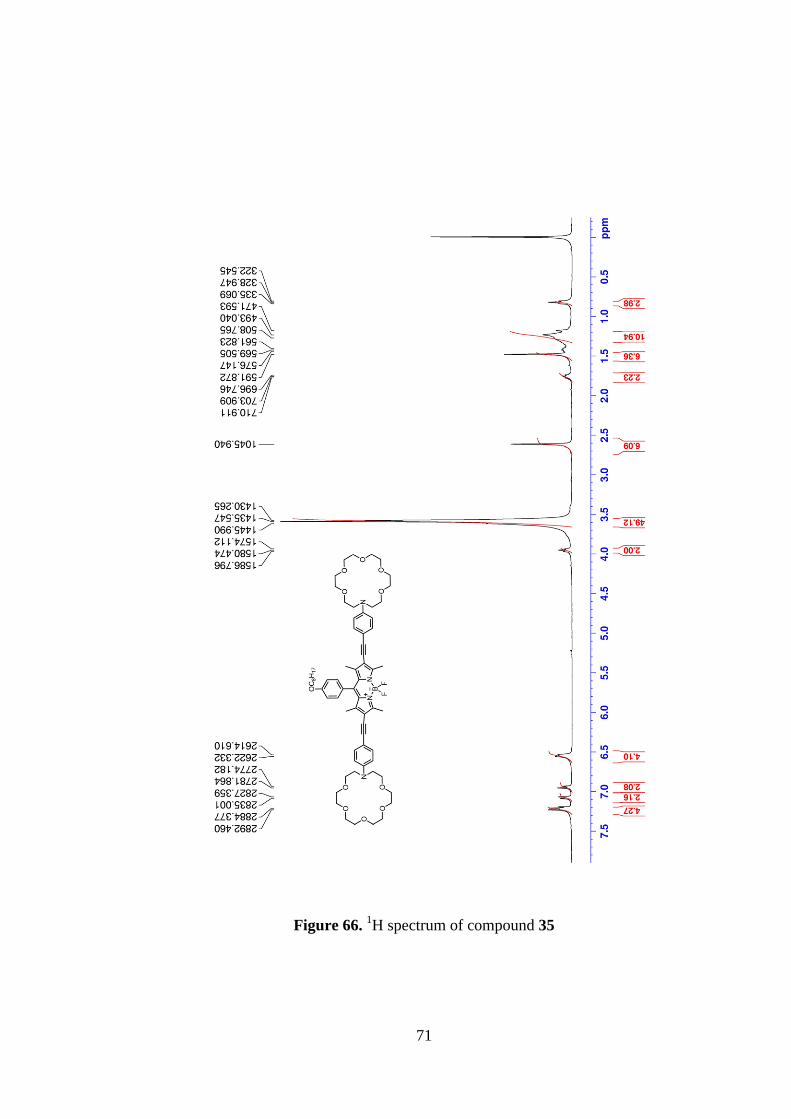
Figure 66. 1H spectrum of compound 35 ......................................................... 71
Figure 67. 13
C spectrum of compound 35 ........................................................ 72
Figure 68. ESI-HRMS of compound 28 ........................................................... 74
Figure 69. ESI-HRMS of compound 29 ........................................................... 74
Figure 70. ESI-HRMS of compound 30 ........................................................... 75
Figure 71. ESI-HRMS of compound 31 ........................................................... 75
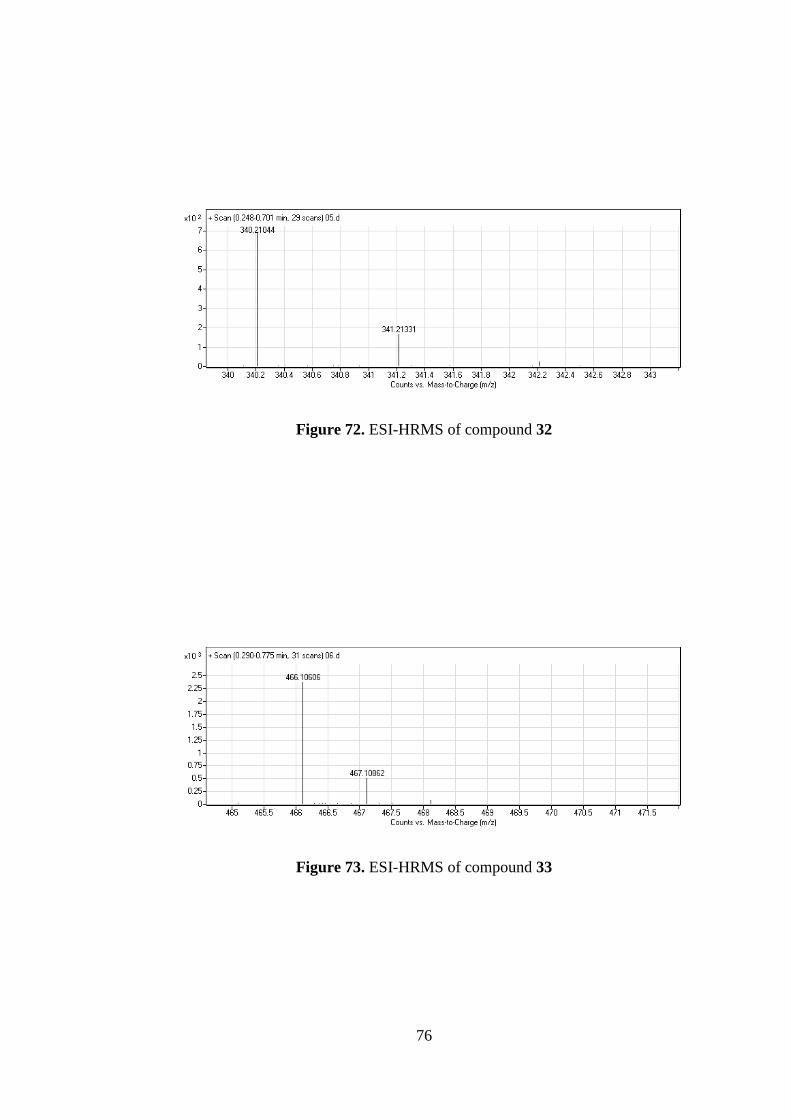
Figure 72. ESI-HRMS of compound 32 ........................................................... 76
Figure 73. ESI-HRMS of compound 33 ........................................................... 76
Figure 74. ESI-HRMS of compound 34 ........................................................... 77
Figure 75. ESI-HRMS of compound 35 ........................................................... 77
xii
LIST OF ABBREVIATIONS
ASTM : American Society for Testing and Materials
BODIPY : Boradiazaindacene
DDQ : Dichlorodicyanoquinone
DMF : Dimethylformamide
HOMO : Highest Occupied Molecular Orbital
ICT : Internal Charge Transfer
LUMO : Lowest Unoccupied Molecular Orbital
MS : Mass Spectroscopy
NMR : Nuclear Magnetic Resonance
PET : Photoinduced Electron Transfer
TFA : Trifluoroacetic Acid
THF : Tetrahydrofuran
TLC : Thin Layer Chromotography
1
CHAPTER 1
INTRODUCTION
1.1. Supramolecular Chemistry
Supramolecular chemistry is one of the new research areas of the chemistry
and growing rapidly.1–5
It has described as „chemistry beyond molecule‟ and
consists of the systems which hold together by reversible non-covalent
interactions.6 Another description of supramolecular chemistry is „lego
TM
chemistry‟ and each molecule which is like legoTM
brick build the
supramolecular structure by the intermolecular interactions.
Supramolecular chemistry is highly interdisciplinary area. Organic and
inorganic chemistry is used for synthesis of molecules, physical chemistry, to
explain properties of supramolecular structures, computational chemistry,
modeling of structures and understanding of behavior of supramolecular
systems. Supramolecular chemistry is also important for biology to mimic of
natural systems such as enzymes.7,8
Application areas of supramolecular chemistry are very wide. It has been used
for non-covalent synthesis and catalysis9,10
beside typical organic synthesis. It
is also important for molecular recognition by using luminescence11,12
and
electrochemistry13,14
. Moreover, rising of molecular devices is another hot
topic of supramolecular chemistry15,16
. Other application areas are light
harvesting systems,17,18
solar cells19,20
and logic gates21,22
, and surface

2
studies23,24
. Finally, supramolecular chemistry makes possible the artificial
biological agents25
such as enzymes, healing agents26
for particular diseases.
Supramolecular chemistry consists of two main groups; host-guest chemistry
and self-assembly.27
That classification is related to size and shape. In host-
guest chemistry, one of the molecules much larger than the other one and that
is called „host‟. The molecule which is smaller and surrounded by host is called
„guest‟. There are many examples for host-guest interactions. In biological
systems, enzymes and their substrates are examples for host-guest chemistry.
Also in coordination chemistry, large ligands are hosts and metals are guests
and interaction between them is electrostatic interaction. Binding sites are very
important in host-guest chemistry; their size, geometry and chemical natures
must be proper for complementarity. The other category in the supramolecular
chemistry is self-assembly. If the sizes of the host and guest are close to each
other, that is called self-assembly system. The self-assembly structures can
involve two or more components and formation of the supramolecular
structures usually spontaneous and reversible processes.
All of supramolecular structures are hold together by non-covalent interactions.
These are electrostatic interactions, hydrogen bonding, interactions, Van der
Waals forces and hydrophobic effects.
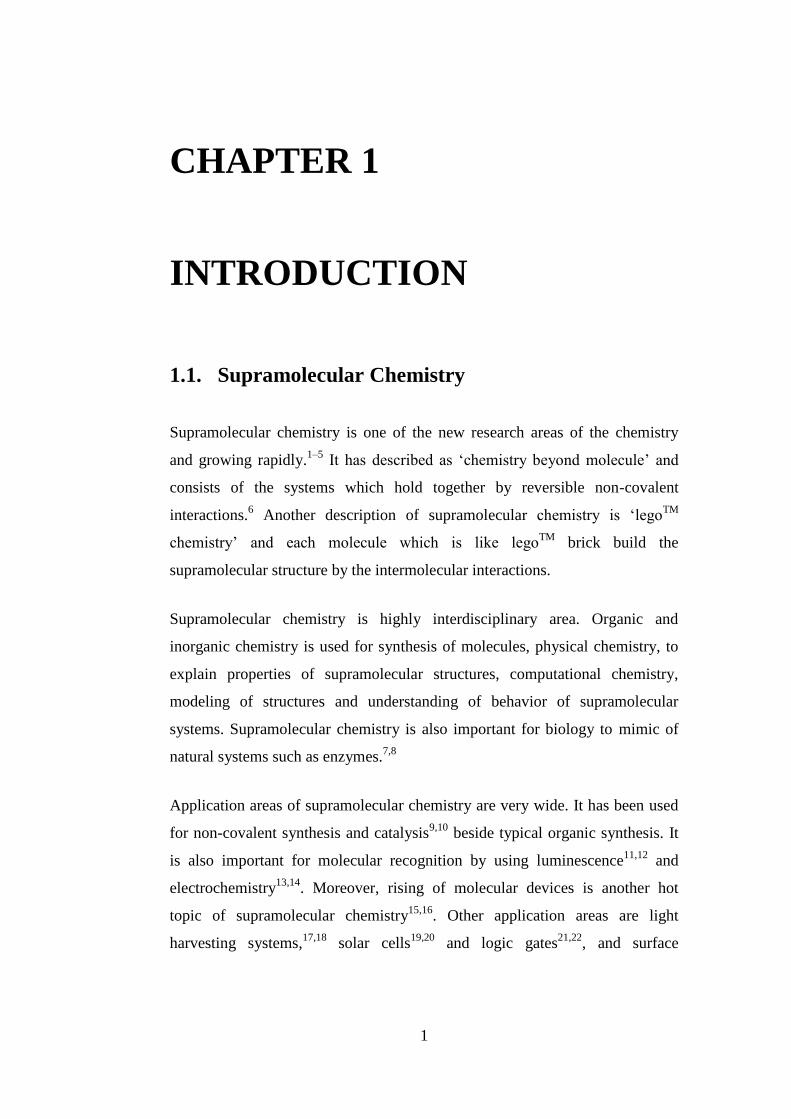
1.1.1. Electrostatic Interactions
These interactions are consists of three groups such as (i) ion-ion interactions
(ii) ion-dipole interactions and (iii) dipole-dipole interactions. The Coulombic
attractions which are between positive and negative charges play role in these
interactions. The strongest one is ion-ion interactions between them. It is as
strong as covalent bond and non-directional that means it can occur in sny
orientation. Ion-dipole and dipole-dipole interactions are orientation-dependant
and effective in only one direction. They are weaker compared to ion-ion
interactions.
3
Figure 1. Examples of electrostatic interaction.
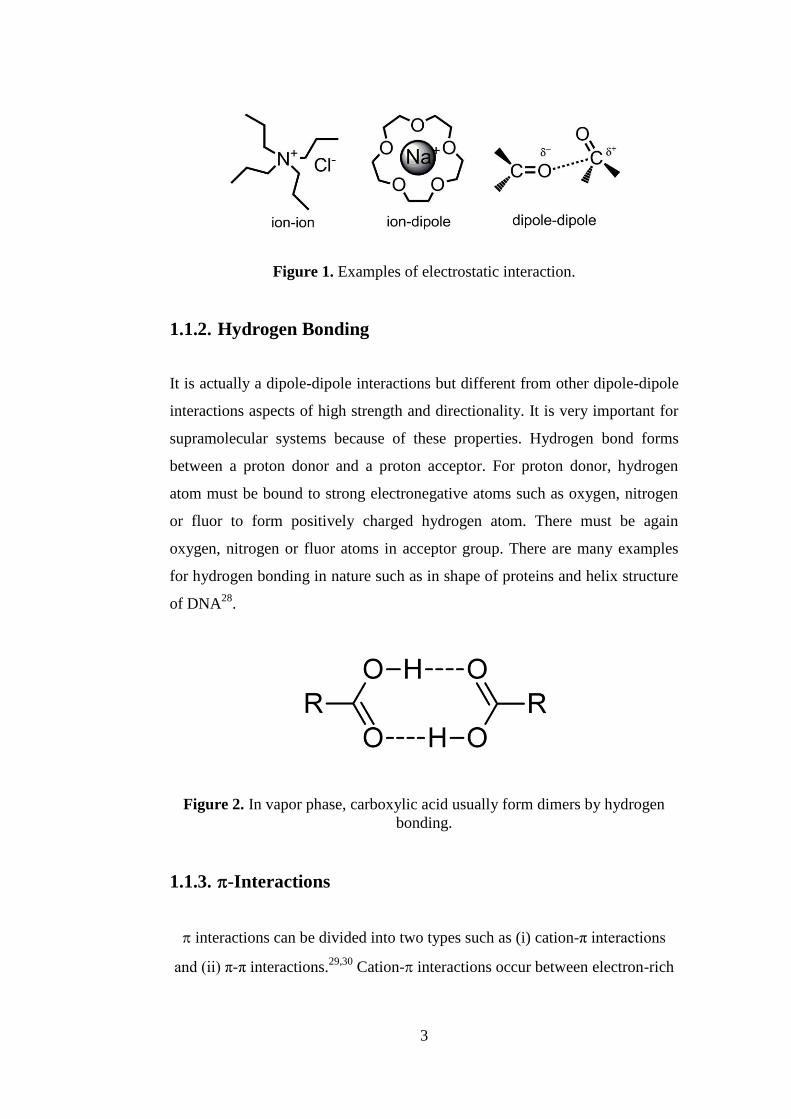
1.1.2. Hydrogen Bonding
It is actually a dipole-dipole interactions but different from other dipole-dipole
interactions aspects of high strength and directionality. It is very important for
supramolecular systems because of these properties. Hydrogen bond forms
between a proton donor and a proton acceptor. For proton donor, hydrogen
atom must be bound to strong electronegative atoms such as oxygen, nitrogen
or fluor to form positively charged hydrogen atom. There must be again
oxygen, nitrogen or fluor atoms in acceptor group. There are many examples
for hydrogen bonding in nature such as in shape of proteins and helix structure
of DNA28
.
Figure 2. In vapor phase, carboxylic acid usually form dimers by hydrogen
bonding.
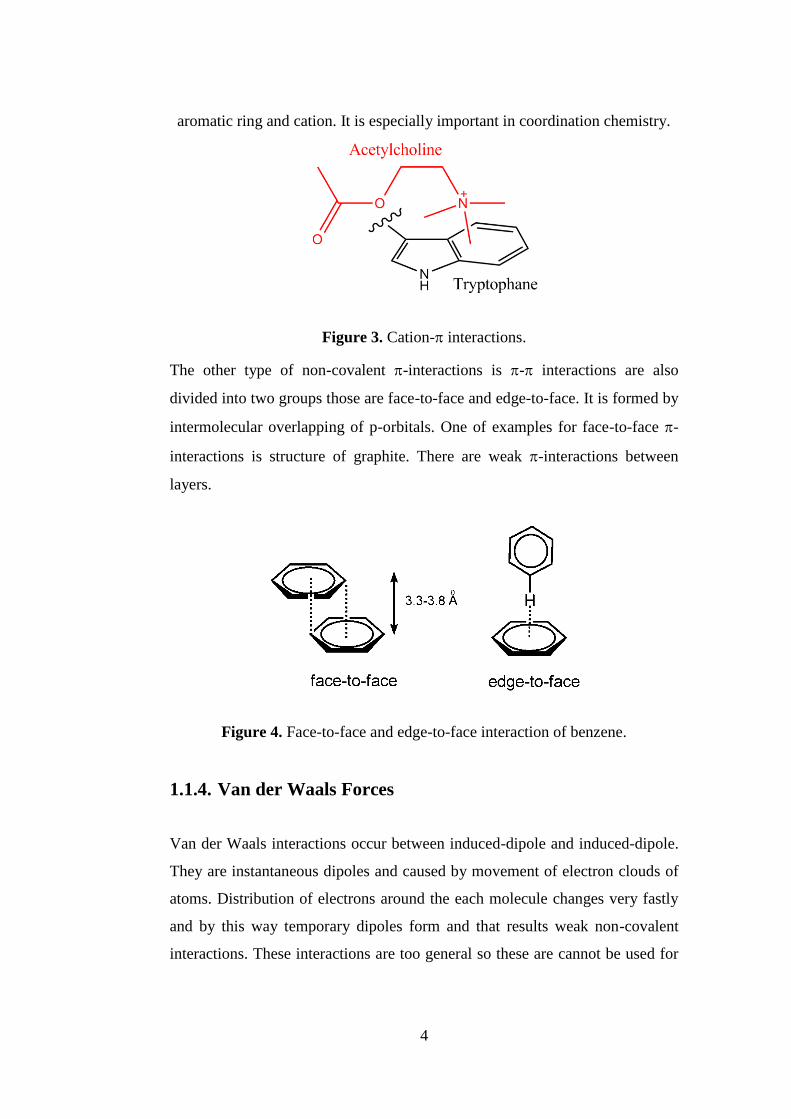
1.1.3. -Interactions
interactions can be divided into two types such as (i) cation-π interactions
and (ii) π-π interactions.29,30
Cation- interactions occur between electron-rich
4
aromatic ring and cation. It is especially important in coordination chemistry.
Figure 3. Cation- interactions.
The other type of non-covalent -interactions is - interactions are also
divided into two groups those are face-to-face and edge-to-face. It is formed by
intermolecular overlapping of p-orbitals. One of examples for face-to-face -
interactions is structure of graphite. There are weak -interactions between
layers.
Figure 4. Face-to-face and edge-to-face interaction of benzene.
1.1.4. Van der Waals Forces
Van der Waals interactions occur between induced-dipole and induced-dipole.
They are instantaneous dipoles and caused by movement of electron clouds of
atoms. Distribution of electrons around the each molecule changes very fastly
and by this way temporary dipoles form and that results weak non-covalent
interactions. These interactions are too general so these are cannot be used for

5
designing of supramolecular structures. Van der Waals interactions are much
dependant on distance and rapidly diminish by increasing of distance.
1.1.5. Hydrophobic Effects
There is a simple rule that polar dissolves in polar and non-polar dissolves in
non-polar. Reason of the hydrophobic effect is that exclusion of non-polar
groups from polar solvents. This more favorable aspect of energy because polar
molecules prefer to interact with other polar ones due to being of dipole-dipole
interaction is stronger than dipole-non dipole. Because of that reasons, water
and organic solvents such as dichloromethane, chloroform are immiscible.
Hydrophobic effect is important in supramolecular chemistry; binding of
organic molecules to cavity of cyclodextrins in water is example for that.
Figure 5. Entropic hydrophobic effect.
Hydrophobic effects are divided into two type according to energy; they are
enthalpic hydrophobic effect and entropic hydrophobic effect. Binding of
organic molecules instead of water to hydrophobic cavity is related to the
enthalpic hydrophobic effect. Since interaction between organic molecules and
hydrophobic cavity is stronger. Explanation for the entropic hydrophobic effect
is that organic molecules create hole or cage in water and that supramolecular
aggregation increases entropy.31
6
1.2. Fluorescence
At room temperature, most of elementary particles are in their ground states.
When the particles absorb the light which has suitable energy, electrons move
to excited state from the ground state. That process is called absorption.
𝑀 + ℎ𝑣 → 𝑀∗
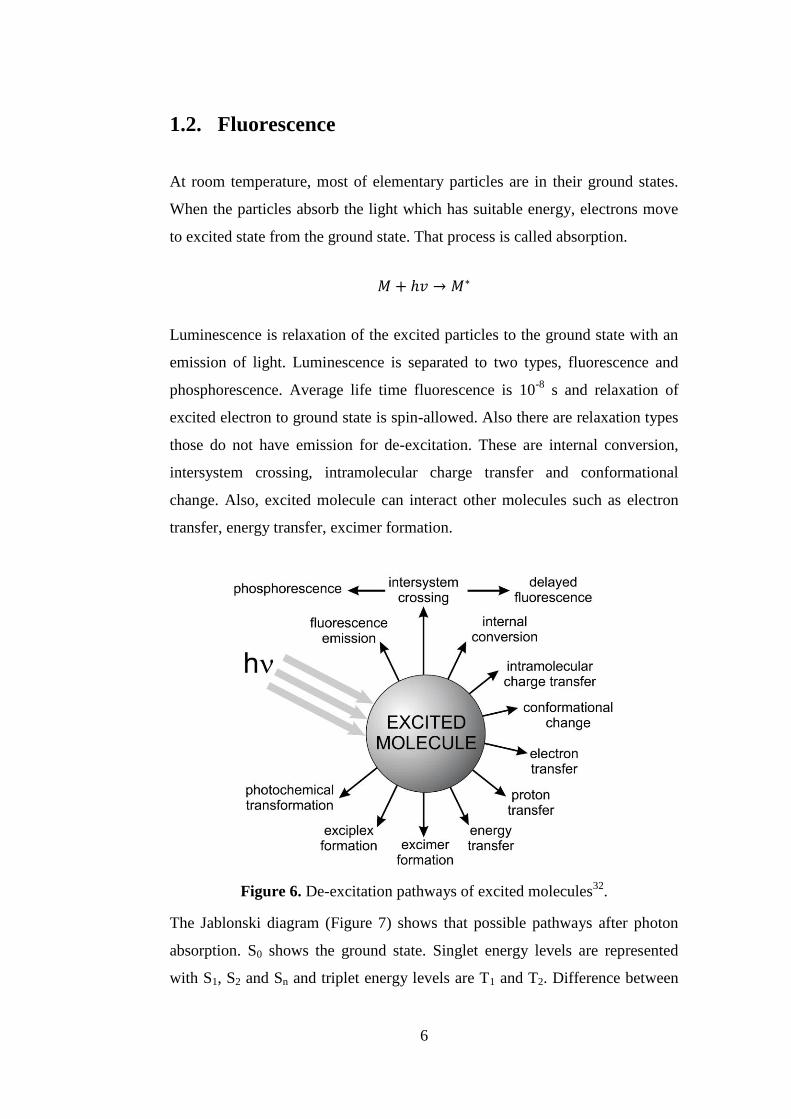
Luminescence is relaxation of the excited particles to the ground state with an
emission of light. Luminescence is separated to two types, fluorescence and
phosphorescence. Average life time fluorescence is 10-8
s and relaxation of
excited electron to ground state is spin-allowed. Also there are relaxation types
those do not have emission for de-excitation. These are internal conversion,
intersystem crossing, intramolecular charge transfer and conformational
change. Also, excited molecule can interact other molecules such as electron
transfer, energy transfer, excimer formation.
Figure 6. De-excitation pathways of excited molecules32
.
The Jablonski diagram (Figure 7) shows that possible pathways after photon
absorption. S0 shows the ground state. Singlet energy levels are represented
with S1, S2 and Sn and triplet energy levels are T1 and T2. Difference between
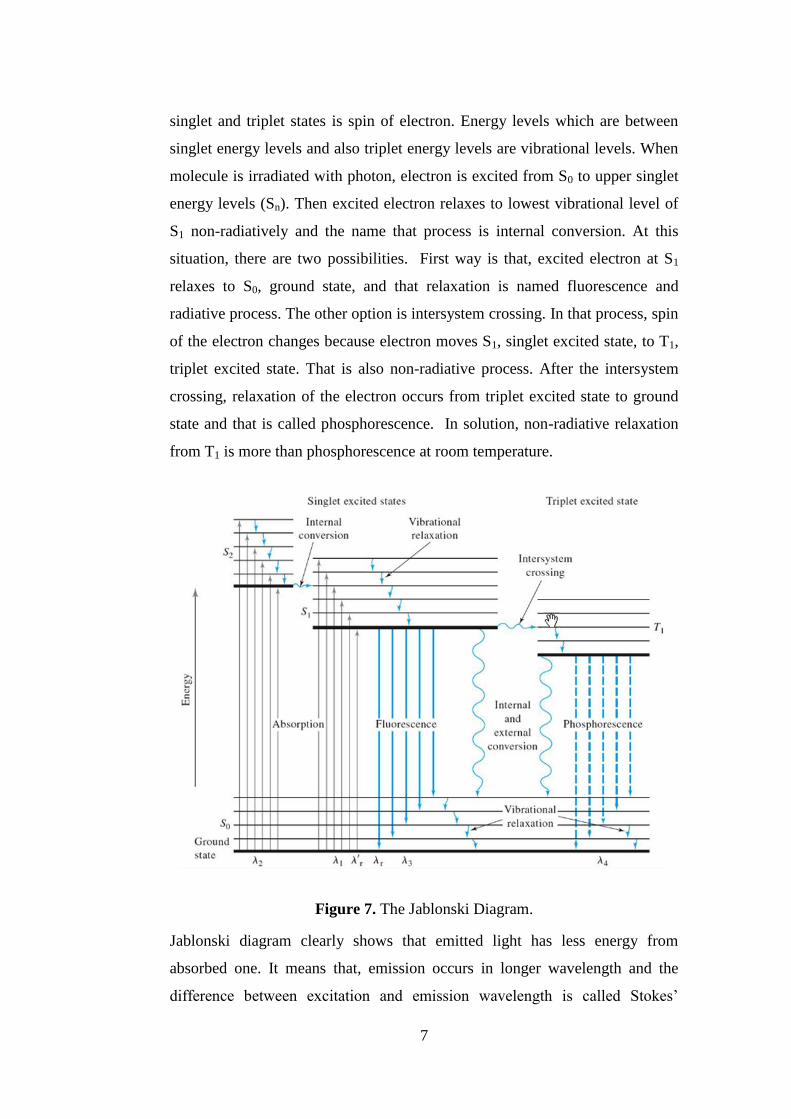
7
singlet and triplet states is spin of electron. Energy levels which are between
singlet energy levels and also triplet energy levels are vibrational levels. When
molecule is irradiated with photon, electron is excited from S0 to upper singlet
energy levels (Sn). Then excited electron relaxes to lowest vibrational level of
S1 non-radiatively and the name that process is internal conversion. At this
situation, there are two possibilities. First way is that, excited electron at S1
relaxes to S0, ground state, and that relaxation is named fluorescence and
radiative process. The other option is intersystem crossing. In that process, spin
of the electron changes because electron moves S1, singlet excited state, to T1,
triplet excited state. That is also non-radiative process. After the intersystem
crossing, relaxation of the electron occurs from triplet excited state to ground
state and that is called phosphorescence. In solution, non-radiative relaxation
from T1 is more than phosphorescence at room temperature.
Figure 7. The Jablonski Diagram.
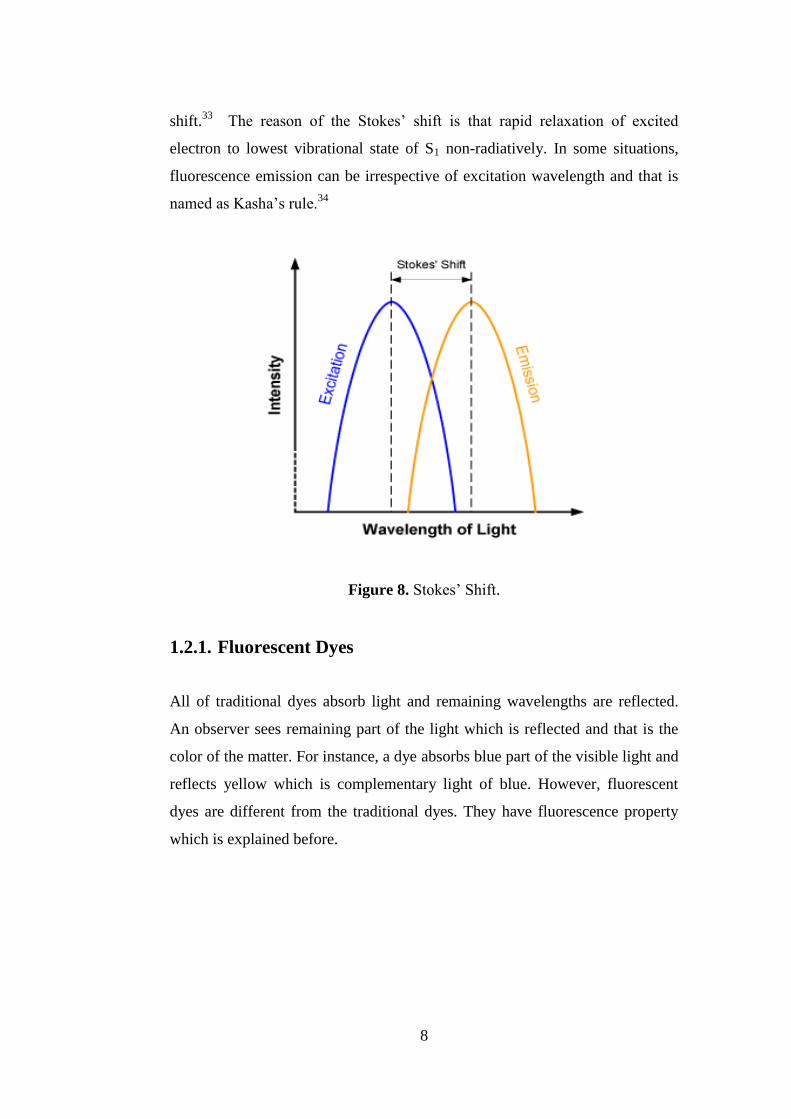
Jablonski diagram clearly shows that emitted light has less energy from
absorbed one. It means that, emission occurs in longer wavelength and the
difference between excitation and emission wavelength is called Stokes‟
8
shift.33
The reason of the Stokes‟ shift is that rapid relaxation of excited
electron to lowest vibrational state of S1 non-radiatively. In some situations,
fluorescence emission can be irrespective of excitation wavelength and that is
named as Kasha‟s rule.34
Figure 8. Stokes‟ Shift.
1.2.1. Fluorescent Dyes
All of traditional dyes absorb light and remaining wavelengths are reflected.
An observer sees remaining part of the light which is reflected and that is the
color of the matter. For instance, a dye absorbs blue part of the visible light and
reflects yellow which is complementary light of blue. However, fluorescent
dyes are different from the traditional dyes. They have fluorescence property
which is explained before.
9
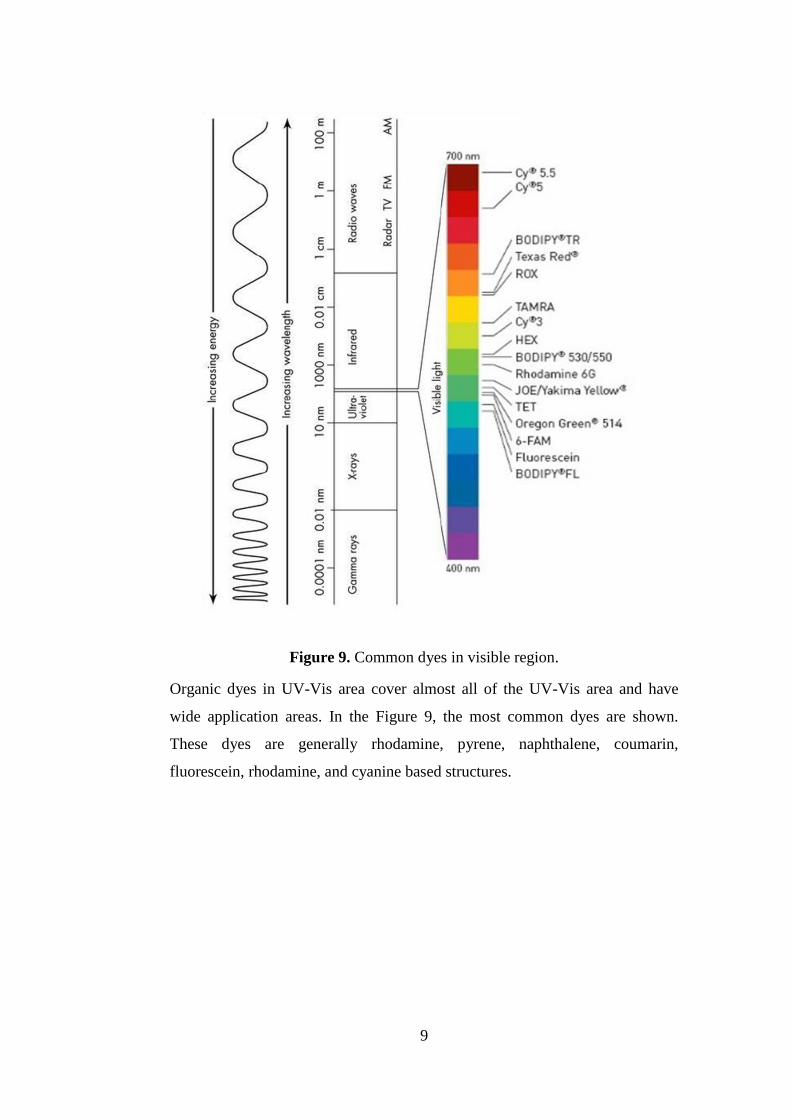
Figure 9. Common dyes in visible region.
Organic dyes in UV-Vis area cover almost all of the UV-Vis area and have
wide application areas. In the Figure 9, the most common dyes are shown.
These dyes are generally rhodamine, pyrene, naphthalene, coumarin,
fluorescein, rhodamine, and cyanine based structures.
10
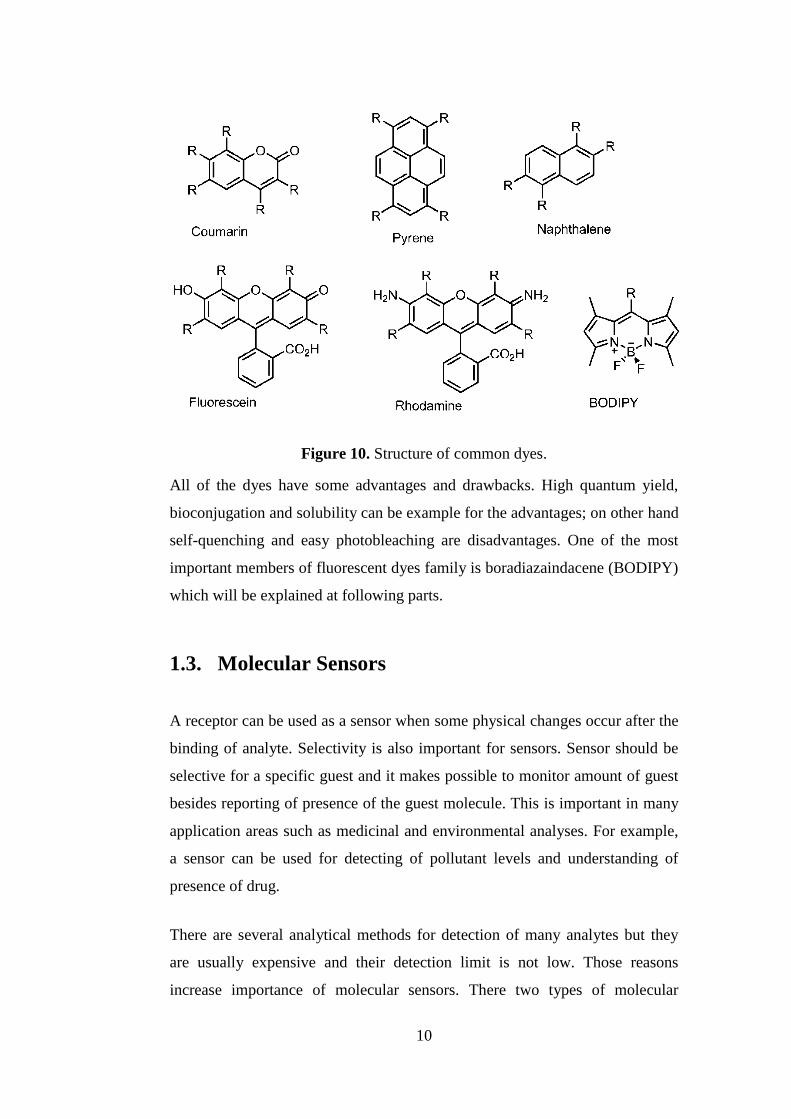
Figure 10. Structure of common dyes.
All of the dyes have some advantages and drawbacks. High quantum yield,
bioconjugation and solubility can be example for the advantages; on other hand
self-quenching and easy photobleaching are disadvantages. One of the most
important members of fluorescent dyes family is boradiazaindacene (BODIPY)
which will be explained at following parts.
1.3. Molecular Sensors
A receptor can be used as a sensor when some physical changes occur after the
binding of analyte. Selectivity is also important for sensors. Sensor should be
selective for a specific guest and it makes possible to monitor amount of guest
besides reporting of presence of the guest molecule. This is important in many
application areas such as medicinal and environmental analyses. For example,
a sensor can be used for detecting of pollutant levels and understanding of
presence of drug.
There are several analytical methods for detection of many analytes but they
are usually expensive and their detection limit is not low. Those reasons
increase importance of molecular sensors. There two types of molecular

11
sensors; these are electrochemical and optical sensors. Electrochemical sensors
consist of a redox active unit and a receptor. Binding of analyte to the receptor
changes charge separation of the sensor. This change can be monitored by an
electrochemical technique such as cyclic voltametry (CV).
The other type of sensors is optical sensors. Fluorescent sensors are most
common types of the optical sensors because of the advantages such as high
sensitivity, safety, and high speed. The most important advantage of
fluorescent sensors over other light-based methods such as absorbance is high
sensitivity. The sensitivity of fluorescent is related the difference between the
excitation and the emission wavelength. It can be used for biological systems
that very small concentration changes such as pico and even femtomolar ranges
can be important. On the other hand, absorbance which is different expression
of transmittance of light is used for measurements of concentration of
micromolar ranges and it is not as sensitive as fluorescent as it can be seen.
Another advantage is safety. There is no hazardous product in the process and
samples are not affected. The last advantage is high speed. Fluorescence is very
fast process therefore; changes in concentration can be displayed rapidly. On
the contrary, fluorescent sensors has a drawback which is they can be used
mainly in organic solvents. In the aqueous media they do not respond.
Figure 11 shows that some of examples for fluorescent sensors. For example,
compound 2 involves Lariat ether and it is used for K+ sensing. On the other
hand, there are also fluorescent sensors for anions. Compound 1 is one of the F-
sensors.35

12
Figure 11. Examples of molecular sensors for anion and cation.
1.3.1. Fluorescent Sensors
Fluorescent sensors are simply designed that receptor which is attached to
fluorophore. In the fluorescent sensors, selectivity and signaling is very
important. When analyte binds to receptor, changes occur in the fluorescence
of fluorophore. Those changes are converted to signals and monitored. The
fluorescent sensors can be used for many analytes such as neutral molecules,
cations and anions. For the all of these species, quantitative or qualitative
measurements can be possible. When analyte binds to the receptor,
fluorescence can be increased or decreased and quenched according to type of
analyte and fluorescent sensor.32
There are two types of fluorescent sensors.
First one is fluorophore-spacer-receptor, as it can be seen fluorophore and
receptor is separated by spacer such as alkyl chain. In other type, receptor is
linked directly to the fluorophore and because of that receptor participates in π-
system of fluorophore.36

13
Figure 12. Schematic representations of fluorescent sensors.
1.3.1.1. Photoinduced Electron Transfer (PET)
In photoinduced electron transfer, the system consists of fluorophore, spacer
and receptor which includes a electronegative donor atom. There is no
conjugation between fluorophore and receptor but they are close enough for
electronic interaction by the spacer. Absorbing of light causes excitation of
electron of fluorophore then electron of receptor jumps that hole to reduce its
energy.
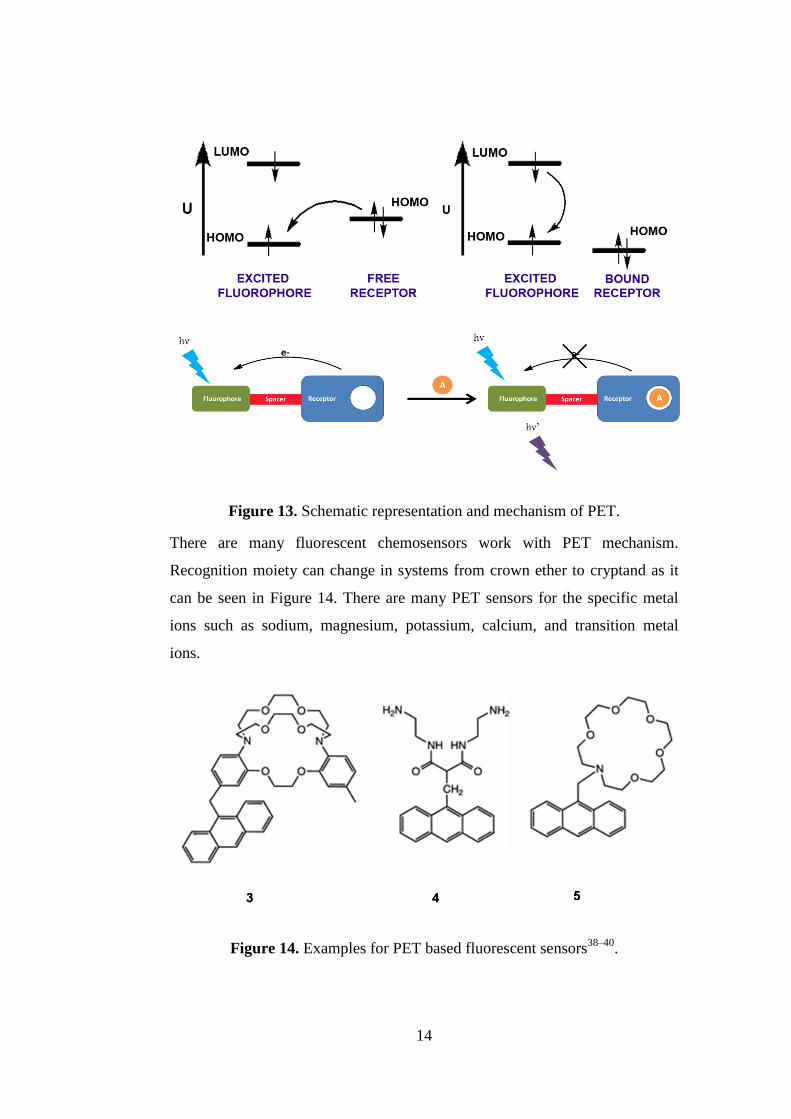
In the Figure 13, working principal of PET is shown. Firstly, electron of
fluorophore is excited from the highest occupied molecular orbital (HOMO) to
lowest unoccupied molecular orbital (LUMO). Energy level of HOMO of
donor atom (usually amine groups) which is part of receptor is between HOMO
and LUMO of the fluorophore. After excitation, an electron from HOMO of
the donor atom moves to HOMO of the fluorophore and that causes quenching
of fluorophore. However, when analyte such as metal cation binds to the
receptor that results decreasing energy of donor atom‟s HOMO. By this way
PET is prevented and quenching is finished.37
14
Figure 13. Schematic representation and mechanism of PET.
There are many fluorescent chemosensors work with PET mechanism.
Recognition moiety can change in systems from crown ether to cryptand as it
can be seen in Figure 14. There are many PET sensors for the specific metal
ions such as sodium, magnesium, potassium, calcium, and transition metal
ions.
Figure 14. Examples for PET based fluorescent sensors38–40
.
15
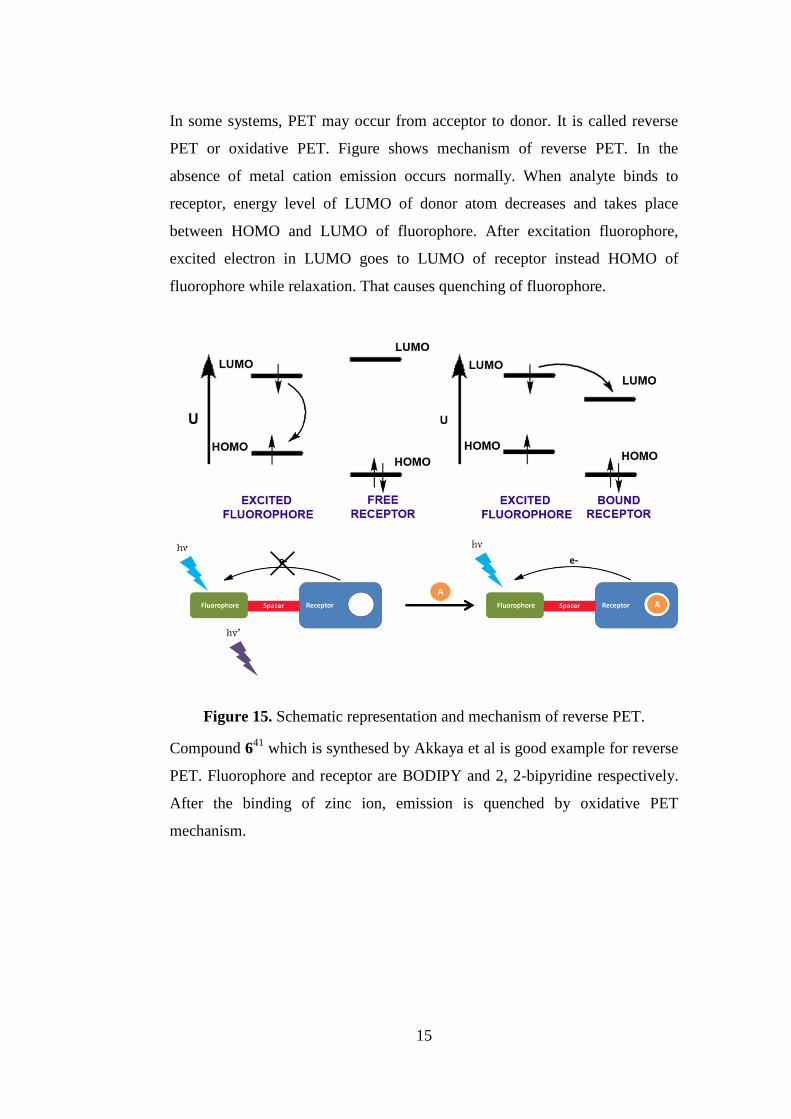
In some systems, PET may occur from acceptor to donor. It is called reverse
PET or oxidative PET. Figure shows mechanism of reverse PET. In the
absence of metal cation emission occurs normally. When analyte binds to
receptor, energy level of LUMO of donor atom decreases and takes place
between HOMO and LUMO of fluorophore. After excitation fluorophore,
excited electron in LUMO goes to LUMO of receptor instead HOMO of
fluorophore while relaxation. That causes quenching of fluorophore.
Figure 15. Schematic representation and mechanism of reverse PET.
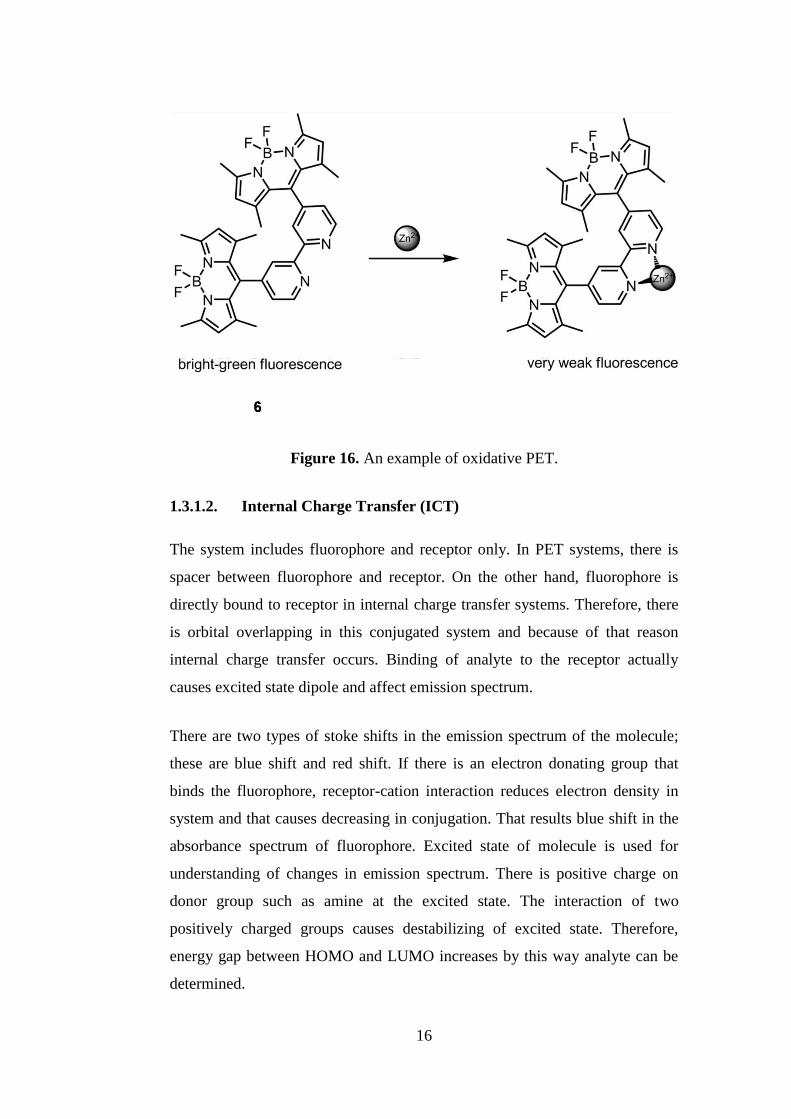
Compound 641
which is synthesed by Akkaya et al is good example for reverse
PET. Fluorophore and receptor are BODIPY and 2, 2-bipyridine respectively.
After the binding of zinc ion, emission is quenched by oxidative PET
mechanism.
16
Figure 16. An example of oxidative PET.
1.3.1.2. Internal Charge Transfer (ICT)
The system includes fluorophore and receptor only. In PET systems, there is
spacer between fluorophore and receptor. On the other hand, fluorophore is
directly bound to receptor in internal charge transfer systems. Therefore, there
is orbital overlapping in this conjugated system and because of that reason
internal charge transfer occurs. Binding of analyte to the receptor actually
causes excited state dipole and affect emission spectrum.
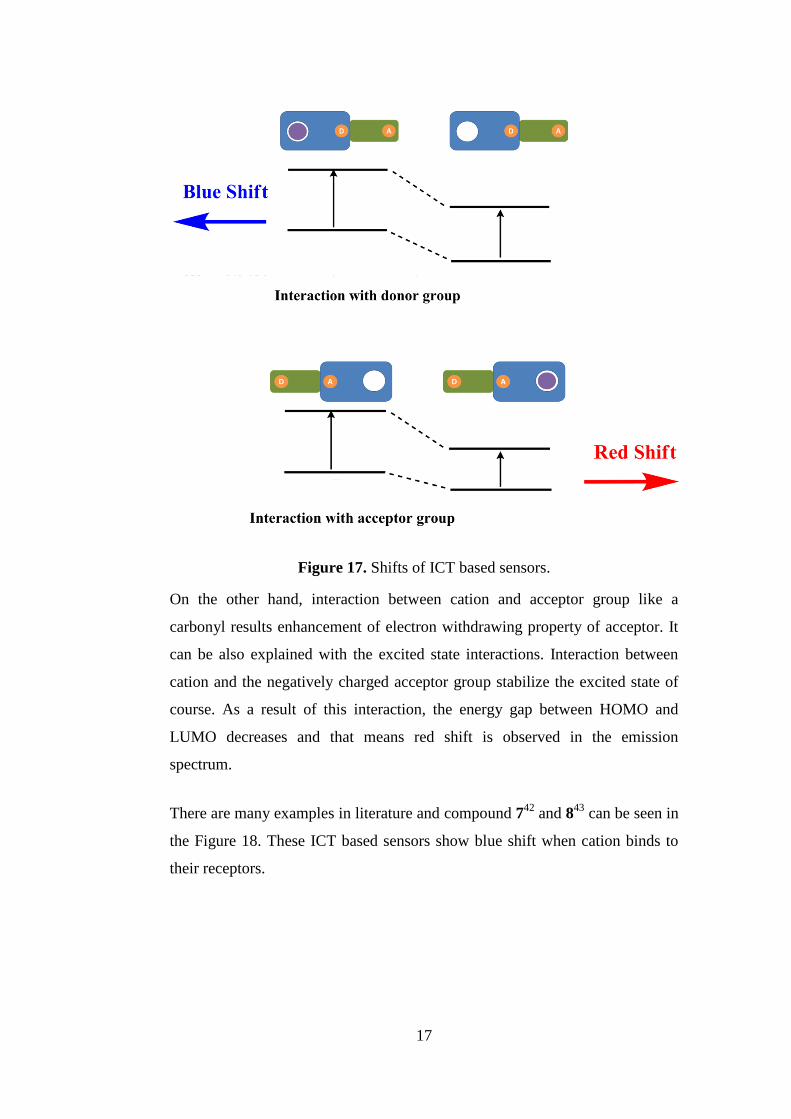
There are two types of stoke shifts in the emission spectrum of the molecule;
these are blue shift and red shift. If there is an electron donating group that
binds the fluorophore, receptor-cation interaction reduces electron density in
system and that causes decreasing in conjugation. That results blue shift in the
absorbance spectrum of fluorophore. Excited state of molecule is used for
understanding of changes in emission spectrum. There is positive charge on
donor group such as amine at the excited state. The interaction of two
positively charged groups causes destabilizing of excited state. Therefore,
energy gap between HOMO and LUMO increases by this way analyte can be
determined.
17
Figure 17. Shifts of ICT based sensors.
On the other hand, interaction between cation and acceptor group like a
carbonyl results enhancement of electron withdrawing property of acceptor. It
can be also explained with the excited state interactions. Interaction between
cation and the negatively charged acceptor group stabilize the excited state of
course. As a result of this interaction, the energy gap between HOMO and
LUMO decreases and that means red shift is observed in the emission
spectrum.
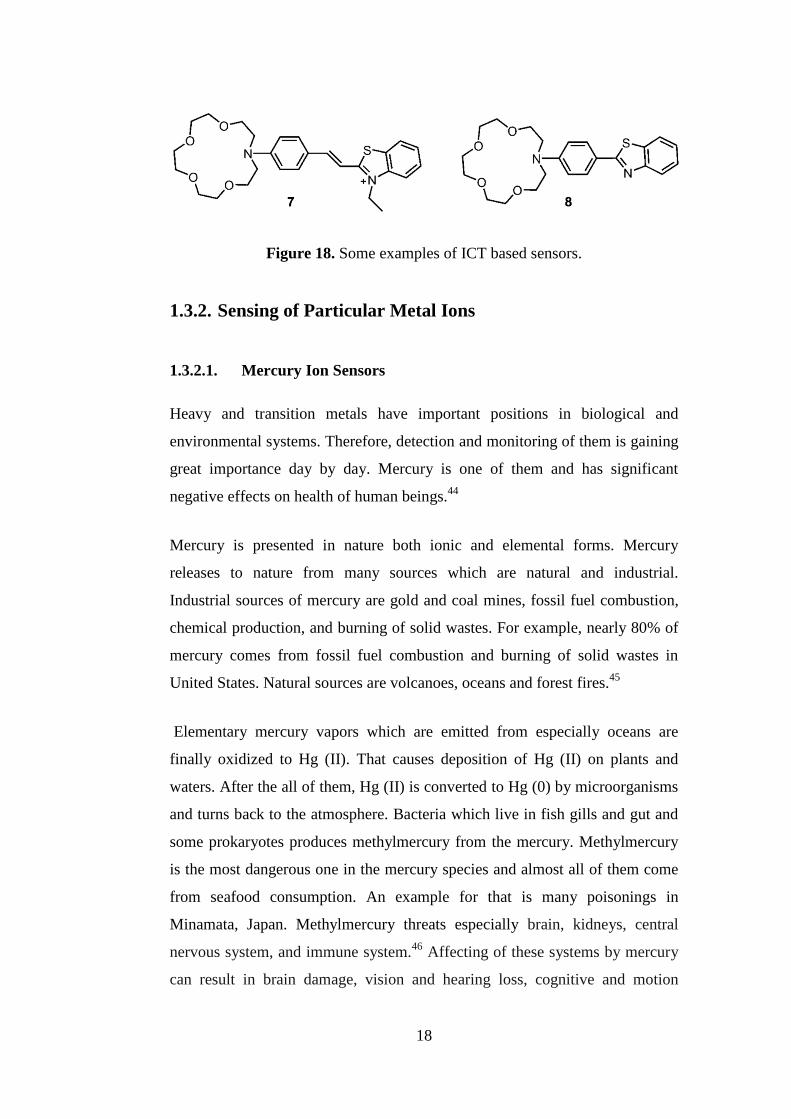
There are many examples in literature and compound 742
and 843
can be seen in
the Figure 18. These ICT based sensors show blue shift when cation binds to
their receptors.
18
Figure 18. Some examples of ICT based sensors.
1.3.2. Sensing of Particular Metal Ions
1.3.2.1. Mercury Ion Sensors
Heavy and transition metals have important positions in biological and
environmental systems. Therefore, detection and monitoring of them is gaining
great importance day by day. Mercury is one of them and has significant
negative effects on health of human beings.44
Mercury is presented in nature both ionic and elemental forms. Mercury
releases to nature from many sources which are natural and industrial.
Industrial sources of mercury are gold and coal mines, fossil fuel combustion,
chemical production, and burning of solid wastes. For example, nearly 80% of
mercury comes from fossil fuel combustion and burning of solid wastes in
United States. Natural sources are volcanoes, oceans and forest fires.45
Elementary mercury vapors which are emitted from especially oceans are
finally oxidized to Hg (II). That causes deposition of Hg (II) on plants and
waters. After the all of them, Hg (II) is converted to Hg (0) by microorganisms
and turns back to the atmosphere. Bacteria which live in fish gills and gut and
some prokaryotes produces methylmercury from the mercury. Methylmercury
is the most dangerous one in the mercury species and almost all of them come
from seafood consumption. An example for that is many poisonings in
Minamata, Japan. Methylmercury threats especially brain, kidneys, central
nervous system, and immune system.46
Affecting of these systems by mercury
can result in brain damage, vision and hearing loss, cognitive and motion

19
disorders, and death. The long-term exposure of methylmercury is also great
concern for human embryos, the developing fetus, and children. Because of the
reasons which are mentioned in above, sensing of mercury species has vital
importance.45
Advantages that are mentioned in molecular sensors part also available for Hg
(II) sensors. By using mercury chemosensors, detection can be made by naked
eye without any instrument. Simple design, selectivity and strong signal are
other important properties of Hg chemosensors.
It is known that interaction between hard acid and hard base or soft acid and
soft base is better than hard and soft interaction. Usually sulphur is used in Hg
(II) chemosensors because of the softness of mercury ion.
20
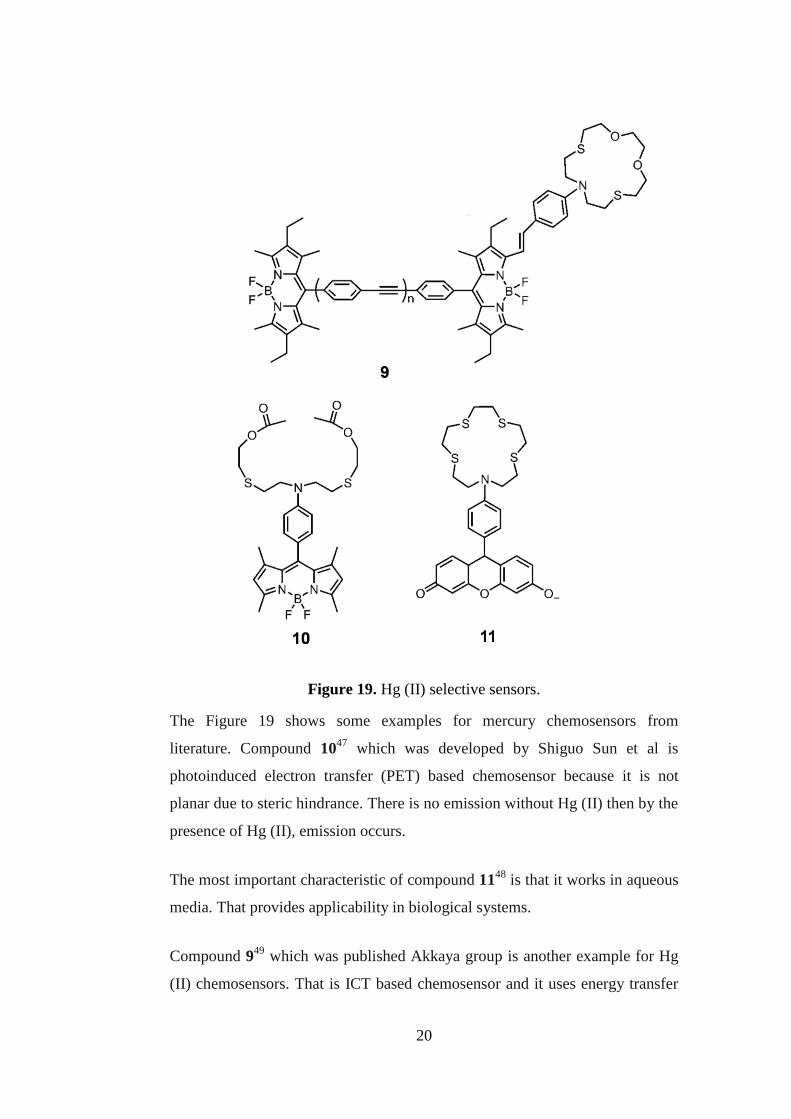
Figure 19. Hg (II) selective sensors.
The Figure 19 shows some examples for mercury chemosensors from
literature. Compound 1047
which was developed by Shiguo Sun et al is
photoinduced electron transfer (PET) based chemosensor because it is not
planar due to steric hindrance. There is no emission without Hg (II) then by the
presence of Hg (II), emission occurs.
The most important characteristic of compound 1148
is that it works in aqueous
media. That provides applicability in biological systems.
Compound 949
which was published Akkaya group is another example for Hg
(II) chemosensors. That is ICT based chemosensor and it uses energy transfer
21
mechanism as well. Binding of Hg (II) causes blue shift in acceptor part while
donor part remains same. As a result of that, increasing spectral overlap
between the absorbance of the acceptor and the emission of the donor parts
causes more effective FRET.
1.3.2.2. Zinc Ion Sensors
In human body, zinc is the second most abundant transition metal. Many
proteins and enzymes involve Zn (II). Zinc play important role in many
neurological diseases such as Alzheimer‟s disease, Parkinson‟s disease,
epilepsy, and amyotropic lateral sclerosis (ALS). Moreover, zinc has a
important role in insulin absorption. Zinc also affects the body functions such
as immune, gastroenterological, and endocrine systems besides growth of
children.50
In recent years, heavy metal ion pollution is one the most controversial
environmental problems. They are great concern for human health because of
their toxic properties. Zinc ion is one the heavy metals. Production of brass and
bronze alloys and galvanization are main sources of zinc in addition to paints,
rubber, plastics, cosmetics and pharmaceuticals. There is limit which is 5.0
mg/L for zinc in drinking water and beyond this limit it is toxic anymore.51
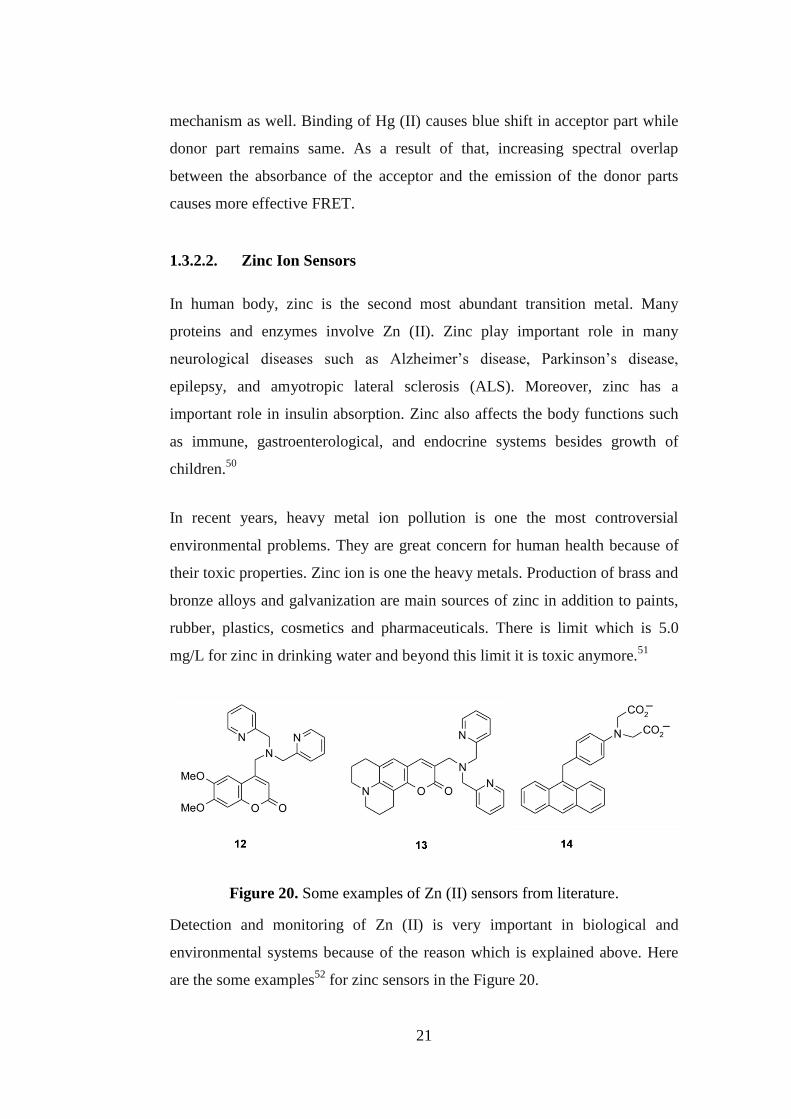
Figure 20. Some examples of Zn (II) sensors from literature.
Detection and monitoring of Zn (II) is very important in biological and
environmental systems because of the reason which is explained above. Here
are the some examples52
for zinc sensors in the Figure 20.
22
1.3.2.3. Calcium Ion Sensors
Recent studies show that some ions such as Ca2+
and Mg2+
have essential roles
in physiological processes.53
Calcium ion plays critical role as intercellular
messenger in body. Intercellular Ca2+
concentration is important for excitation-
contraction coupling in muscle and secretory cells. In many cellular processes,
Ca ion participated in as second messenger, therefore; many scientist show
great attention to calcium probes.54
In recent years, studies on monitoring of
Ca2+
concentration increases rapidly because of insufficiency of other
monitoring techniques.55
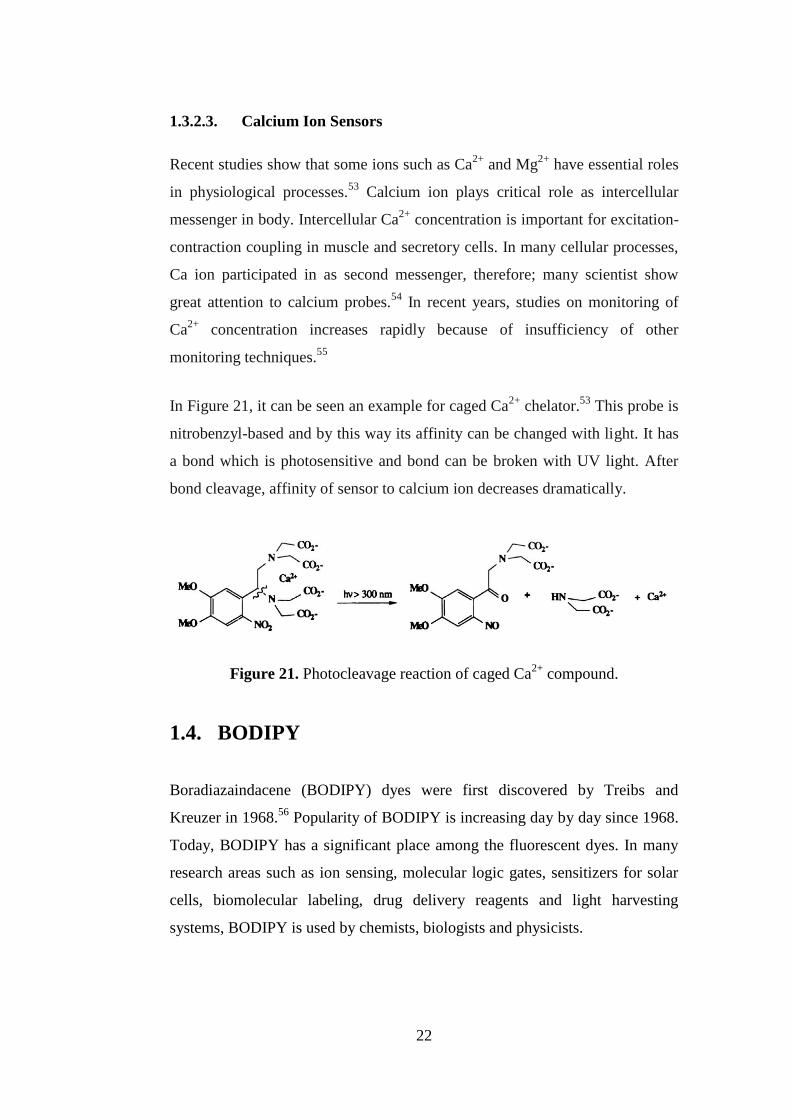
In Figure 21, it can be seen an example for caged Ca2+
chelator.53
This probe is
nitrobenzyl-based and by this way its affinity can be changed with light. It has
a bond which is photosensitive and bond can be broken with UV light. After
bond cleavage, affinity of sensor to calcium ion decreases dramatically.
Figure 21. Photocleavage reaction of caged Ca2+
compound.
1.4. BODIPY
Boradiazaindacene (BODIPY) dyes were first discovered by Treibs and
Kreuzer in 1968.56
Popularity of BODIPY is increasing day by day since 1968.
Today, BODIPY has a significant place among the fluorescent dyes. In many
research areas such as ion sensing, molecular logic gates, sensitizers for solar
cells, biomolecular labeling, drug delivery reagents and light harvesting
systems, BODIPY is used by chemists, biologists and physicists.
23
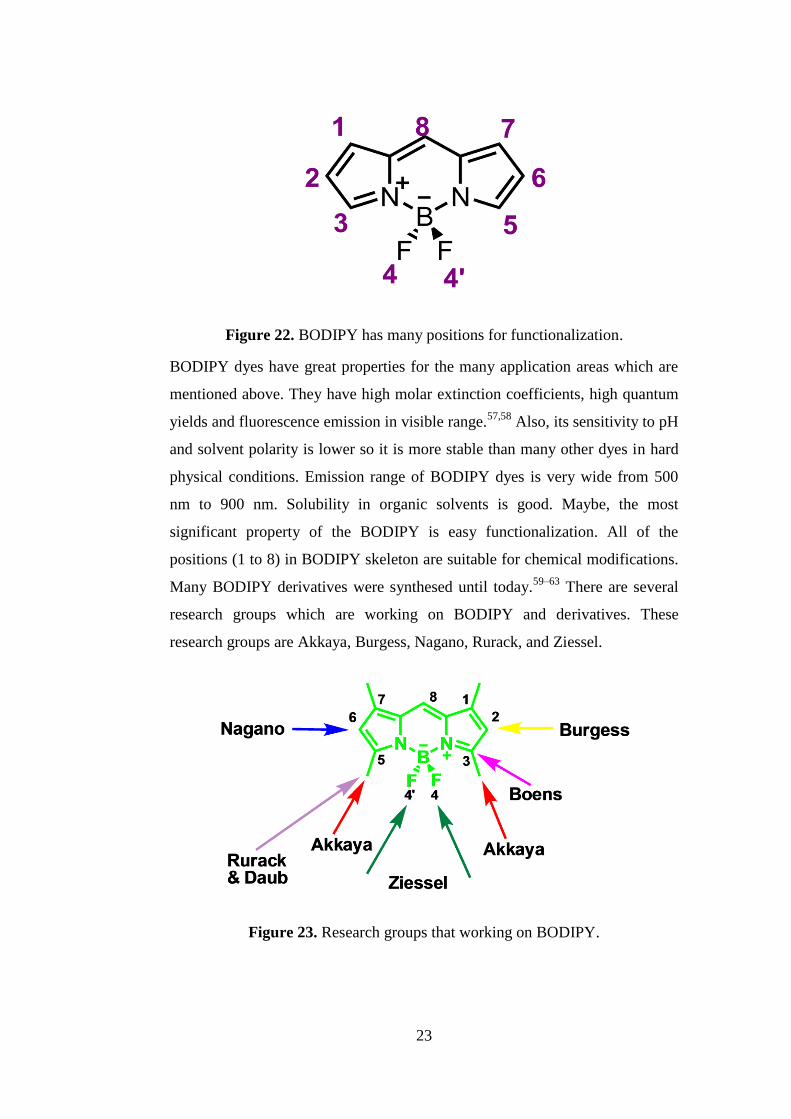
Figure 22. BODIPY has many positions for functionalization.
BODIPY dyes have great properties for the many application areas which are
mentioned above. They have high molar extinction coefficients, high quantum
yields and fluorescence emission in visible range.57,58
Also, its sensitivity to pH
and solvent polarity is lower so it is more stable than many other dyes in hard
physical conditions. Emission range of BODIPY dyes is very wide from 500
nm to 900 nm. Solubility in organic solvents is good. Maybe, the most
significant property of the BODIPY is easy functionalization. All of the
positions (1 to 8) in BODIPY skeleton are suitable for chemical modifications.
Many BODIPY derivatives were synthesed until today.59–63
There are several
research groups which are working on BODIPY and derivatives. These
research groups are Akkaya, Burgess, Nagano, Rurack, and Ziessel.
Figure 23. Research groups that working on BODIPY.
24
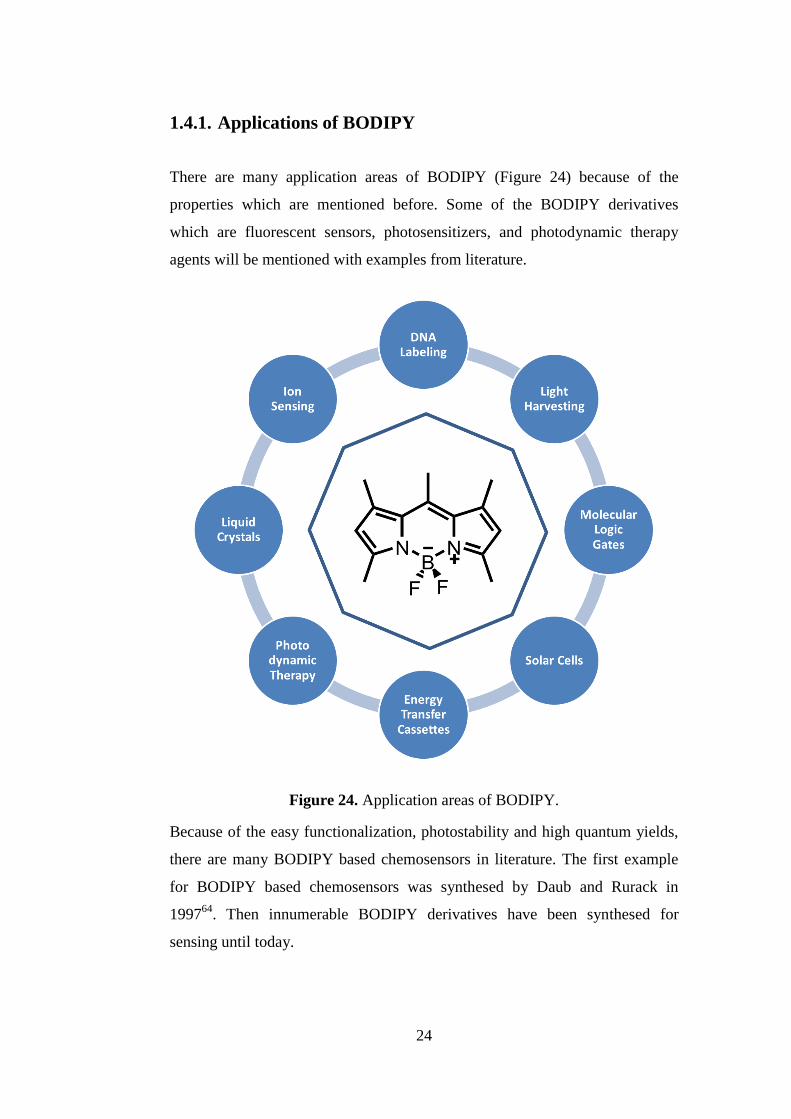
1.4.1. Applications of BODIPY
There are many application areas of BODIPY (Figure 24) because of the
properties which are mentioned before. Some of the BODIPY derivatives
which are fluorescent sensors, photosensitizers, and photodynamic therapy
agents will be mentioned with examples from literature.
Figure 24. Application areas of BODIPY.
Because of the easy functionalization, photostability and high quantum yields,
there are many BODIPY based chemosensors in literature. The first example
for BODIPY based chemosensors was synthesed by Daub and Rurack in
199764
. Then innumerable BODIPY derivatives have been synthesed for
sensing until today.
25
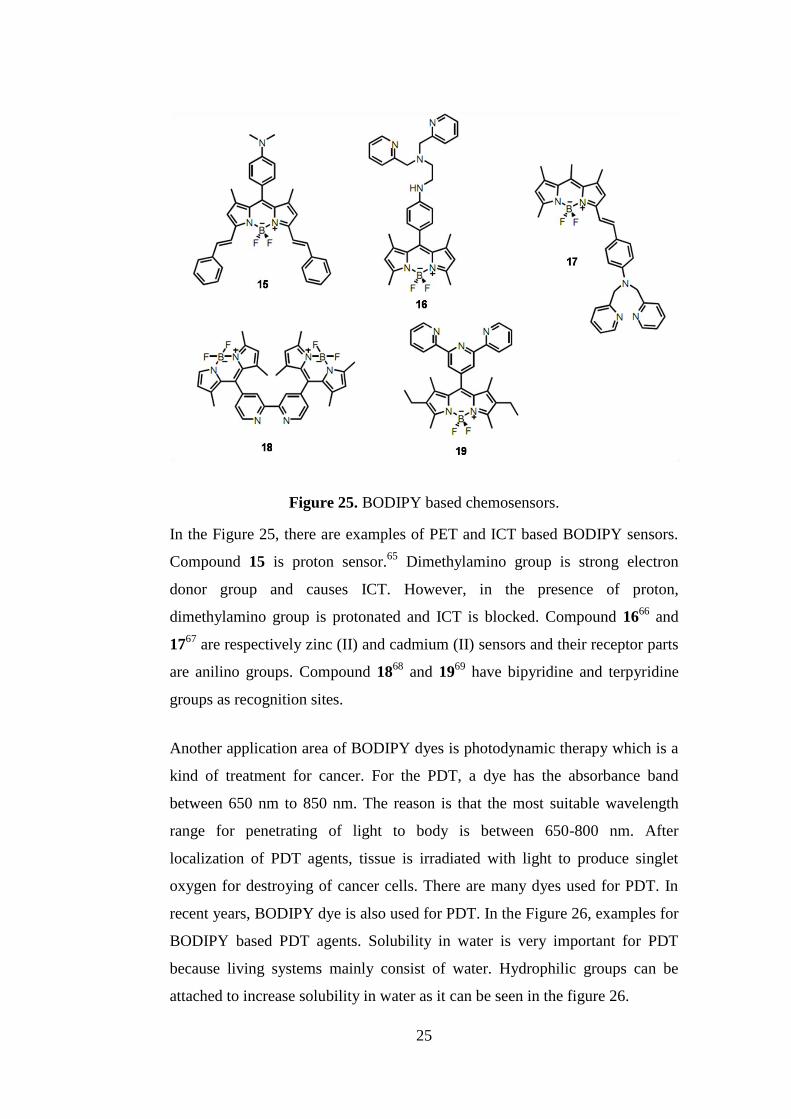
Figure 25. BODIPY based chemosensors.
In the Figure 25, there are examples of PET and ICT based BODIPY sensors.
Compound 15 is proton sensor.65
Dimethylamino group is strong electron
donor group and causes ICT. However, in the presence of proton,
dimethylamino group is protonated and ICT is blocked. Compound 1666
and
1767
are respectively zinc (II) and cadmium (II) sensors and their receptor parts
are anilino groups. Compound 1868
and 1969
have bipyridine and terpyridine
groups as recognition sites.
Another application area of BODIPY dyes is photodynamic therapy which is a
kind of treatment for cancer. For the PDT, a dye has the absorbance band
between 650 nm to 850 nm. The reason is that the most suitable wavelength
range for penetrating of light to body is between 650-800 nm. After
localization of PDT agents, tissue is irradiated with light to produce singlet
oxygen for destroying of cancer cells. There are many dyes used for PDT. In
recent years, BODIPY dye is also used for PDT. In the Figure 26, examples for
BODIPY based PDT agents. Solubility in water is very important for PDT
because living systems mainly consist of water. Hydrophilic groups can be
attached to increase solubility in water as it can be seen in the figure 26.
26
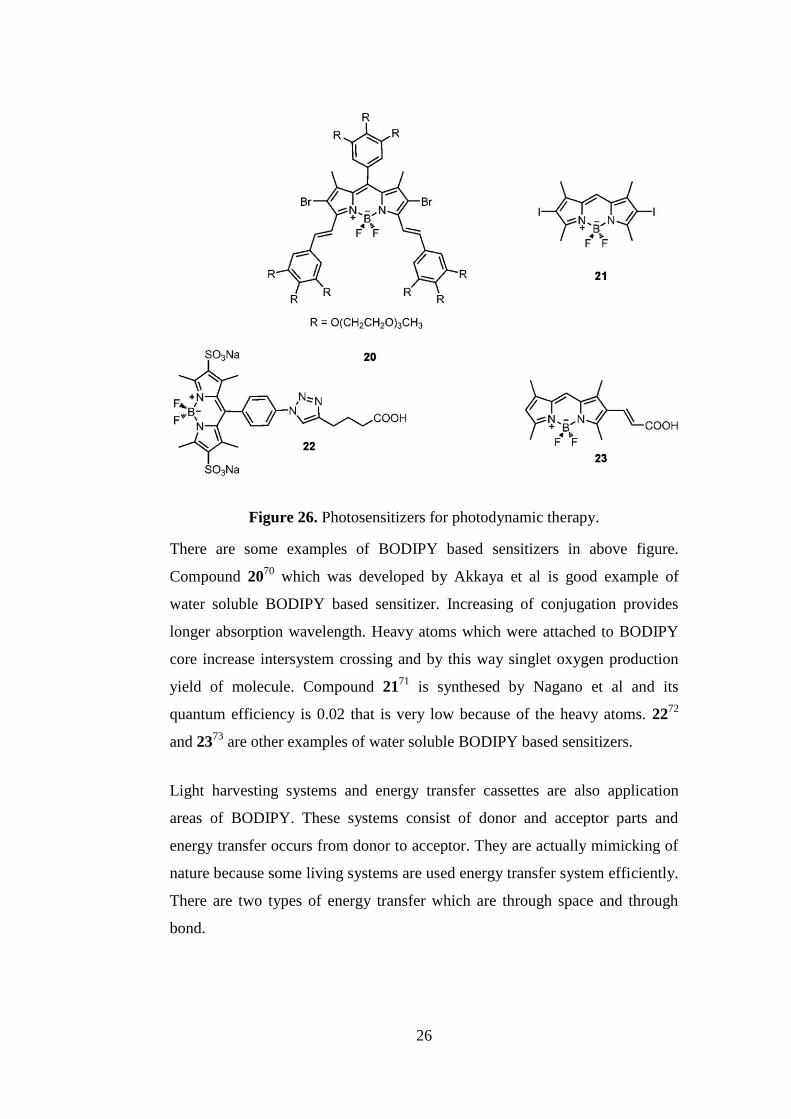
Figure 26. Photosensitizers for photodynamic therapy.
There are some examples of BODIPY based sensitizers in above figure.
Compound 2070
which was developed by Akkaya et al is good example of
water soluble BODIPY based sensitizer. Increasing of conjugation provides
longer absorption wavelength. Heavy atoms which were attached to BODIPY
core increase intersystem crossing and by this way singlet oxygen production
yield of molecule. Compound 2171
is synthesed by Nagano et al and its
quantum efficiency is 0.02 that is very low because of the heavy atoms. 2272
and 2373
are other examples of water soluble BODIPY based sensitizers.
Light harvesting systems and energy transfer cassettes are also application
areas of BODIPY. These systems consist of donor and acceptor parts and
energy transfer occurs from donor to acceptor. They are actually mimicking of
nature because some living systems are used energy transfer system efficiently.
There are two types of energy transfer which are through space and through
bond.
27
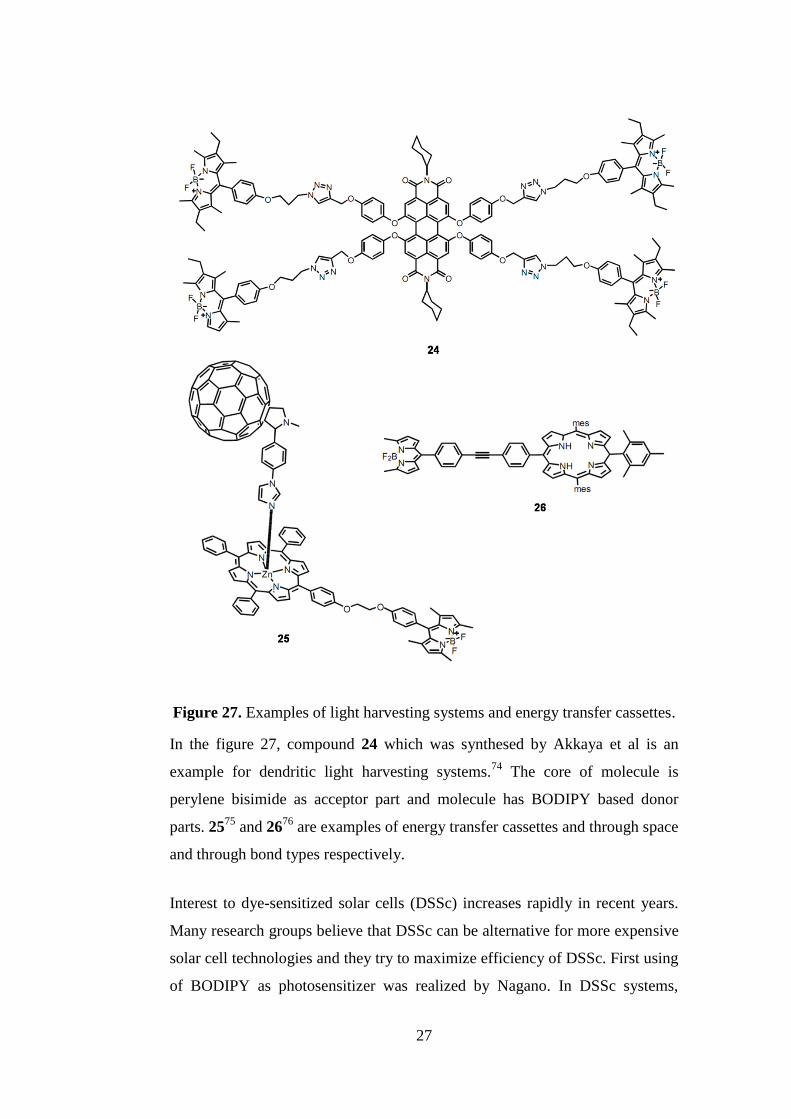
Figure 27. Examples of light harvesting systems and energy transfer cassettes.
In the figure 27, compound 24 which was synthesed by Akkaya et al is an
example for dendritic light harvesting systems.74
The core of molecule is
perylene bisimide as acceptor part and molecule has BODIPY based donor
parts. 2575
and 2676
are examples of energy transfer cassettes and through space
and through bond types respectively.
Interest to dye-sensitized solar cells (DSSc) increases rapidly in recent years.
Many research groups believe that DSSc can be alternative for more expensive
solar cell technologies and they try to maximize efficiency of DSSc. First using
of BODIPY as photosensitizer was realized by Nagano. In DSSc systems,

28
carboxylate (-COOH) group on BODIPY derivative is attached TiO2 surface
and electron transfer occurred by irradiation of sunlight. In the figure, an
example of BODIPY based photosensitizer can be seen.
Figure 28. An example of BODIPY based photosensitizer.
As it can be seen in the above figure, compound 27 which was developed by
Akkaya group is novel example of BODIPY based photosensitizer. Its reported
conversion efficiency was 1.66%.77
29
CHAPTER 2
EXPERIMENTAL
2.1. General
All chemicals and solvents purchased from Aldrich were used without further
purification. Column chromatography of all products was performed using
Merck Silica Gel 60 (particle size: 0.040–0.063 mm, 230–400 mesh ASTM).
Thin layer chromatography by Merck TLC Silica gel 60 F254 was used to
monitor reactions.
1H NMR and
13C NMR spectra were recorded on Bruker DPX-400 (operating
at 400 MHz for 1H NMR and 100 MHz for
13C NMR) in CDCl3 with
tetramethylsilane as internal standard. All spectra were recorded at 25 oC and
coupling constants (J values) are given in Hz. Chemical shifts are given in
parts per million (ppm). Splittings in the spectra are shown as s (singlet), d
(doublet), t (triplet), q (quartet), m (multiplet).
Absorption spectrometry was performed using a Varian spectrophotometer.
Fluorescence spectra were determined on a Varian Eclipse spectrofluorometer.
All spectroscopy experiments were performed using spectrophotometric grade
solvents.
Mass spectroscopy measurements were conducted using MSBQTOF at Bilkent
University, UNAM, Mass Spectrometry Facility.

30
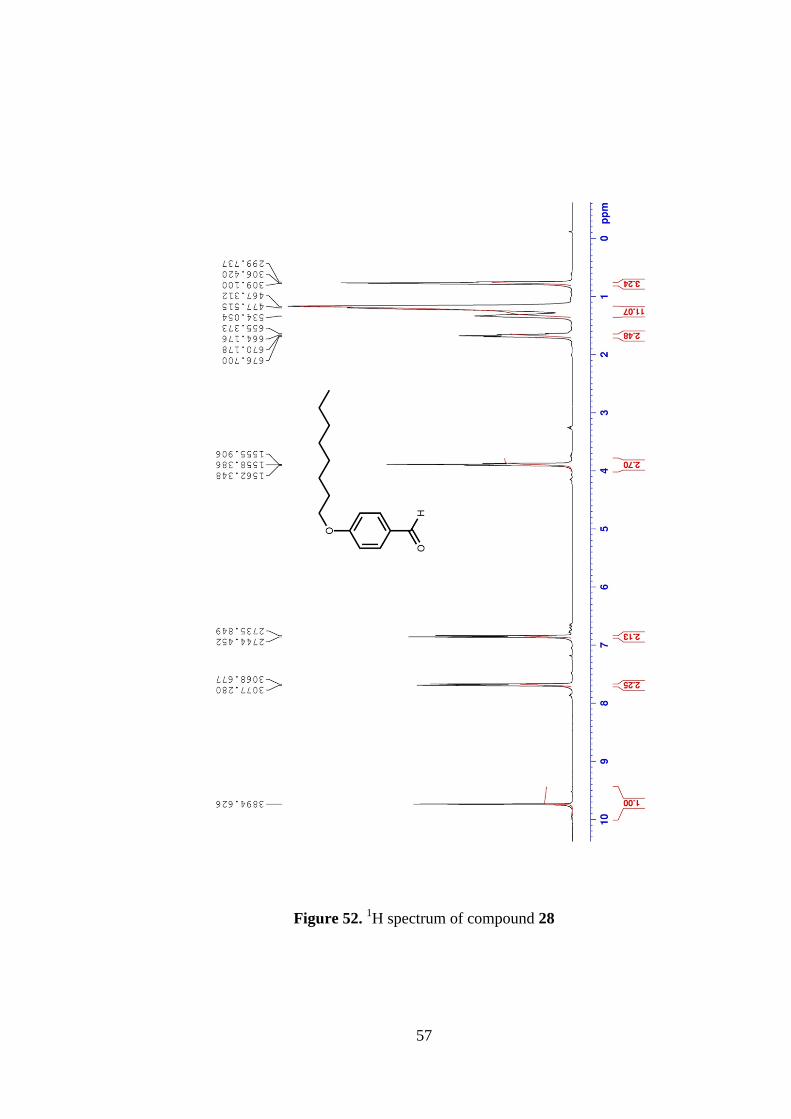
2.2. Synthesis of Compound 28
K2CO3 (53.5 mmol, 7.40 g) was added to solution of 4-hydroxybenzazdehyde
(16.4 mmol, 2.00 g) in 40 ml of acetonitrile. Catalytic amount of 18-crown-6
was added. 1.5 equivalent of 1-bromooctane (24.6 mmol, 4.75 g) was added to
the reaction. Then it was stirred and refluxed over night. The solvent was
evaporated and extracted with CH2Cl2. Organic layers were dried over Na2SO4.
The crude product was purified with silica gel column chromatography
(CHCl3/Hexane, 1:1) . White solid was acquired (3.54 g, 93%).
1H NMR (400 MHz, CDCl3) δ 9.74 (s, 1H), 7.68 (d, J = 8.7 Hz, 2H), 6.85 (d, J
= 8.7 Hz, 2H), 3.97 (t, J = 3.2 Hz, 2H), 1.67 (m, 2H), 1.18 (m, 11H), 0.77 (t, J
= 4.7 Hz, 3H).
13C NMR (100 MHz, CDCl3) δ 190.72, 164.26, 131.94, 129.76, 114.73, 68.41,
31.75, 29.30, 29.27, 29.05, 25.96, 22.61, 14.07.
HRMS-ESI: calculated for M+H 235.1698, found 235.1674, = -7.68 ppm.
Figure 29. Synthesis of compound 28.
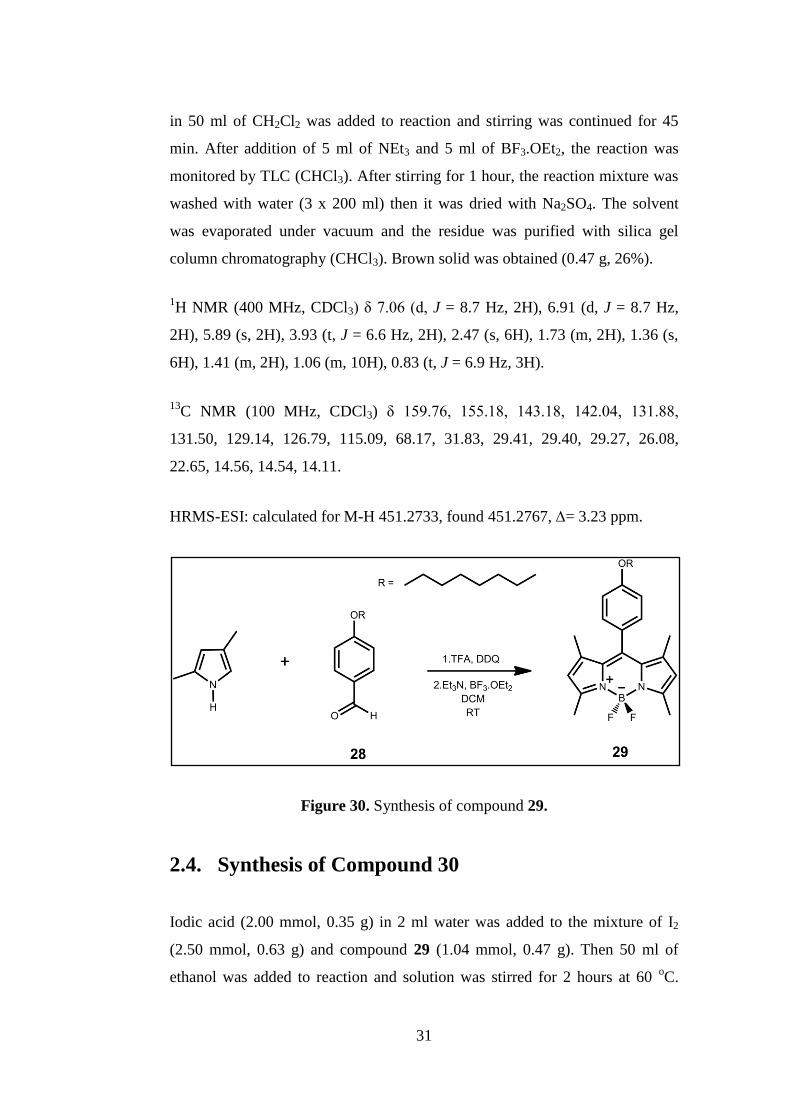
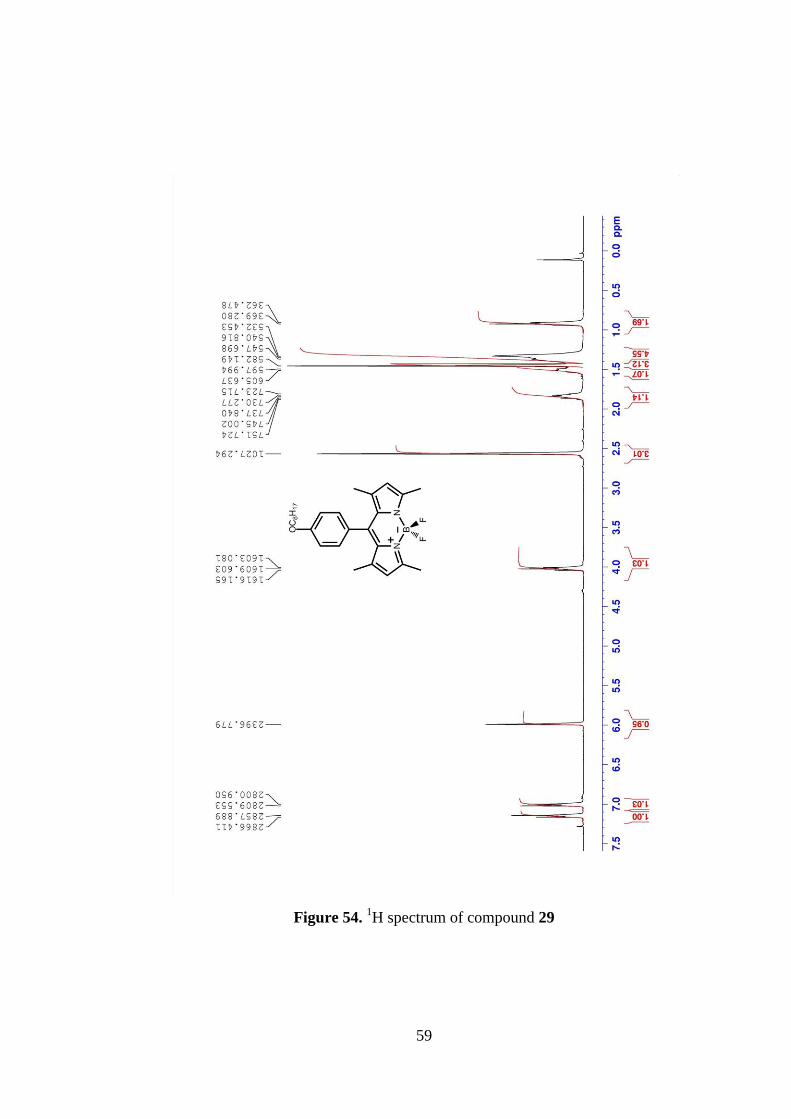
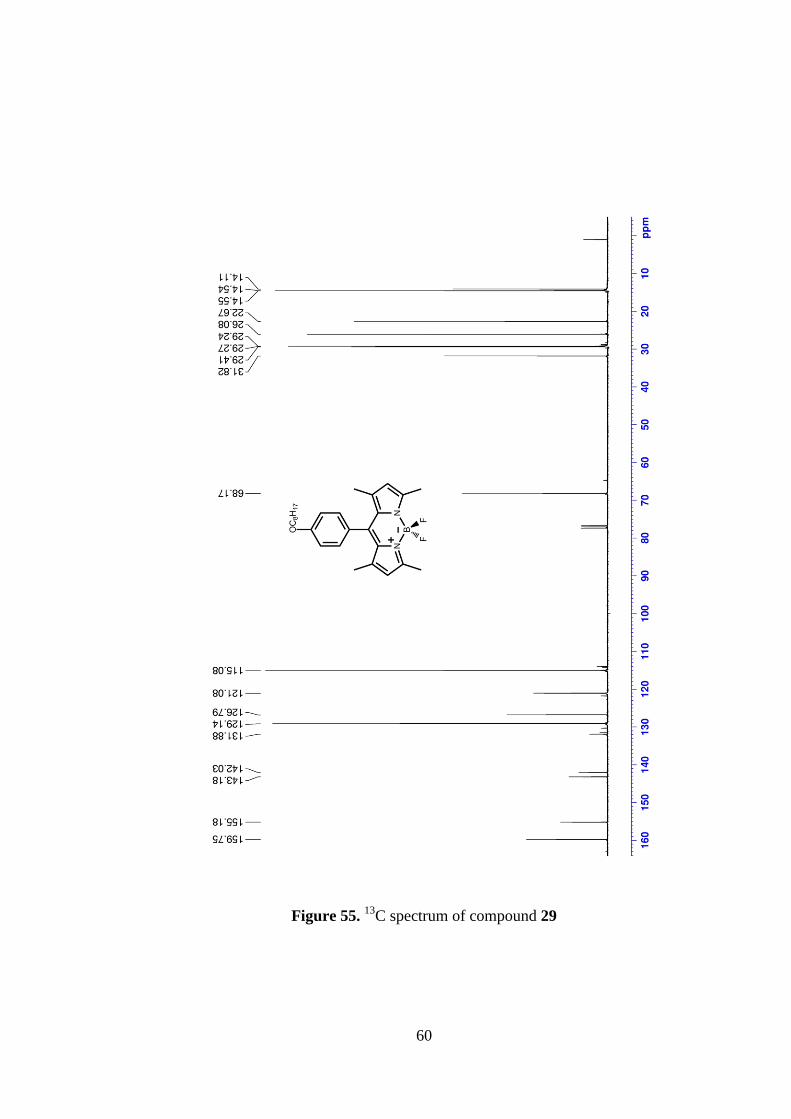
2.3. Synthesis of Compound 29
2,4-dimethyl pyrrole (8.40 mmol, 0.80 g) and compound 28 (4.00 mmol, 0.94
g) were dissolved in 200 mL of CH2Cl2 which was bubbled with argon gas for
25 min. One drop of Trifluoroacetic acid was added and the solution was
stirred for 1 day at room temperature. A solution of DDQ (4.00 mmol, 0.90 g)
31
in 50 ml of CH2Cl2 was added to reaction and stirring was continued for 45
min. After addition of 5 ml of NEt3 and 5 ml of BF3.OEt2, the reaction was
monitored by TLC (CHCl3). After stirring for 1 hour, the reaction mixture was
washed with water (3 x 200 ml) then it was dried with Na2SO4. The solvent
was evaporated under vacuum and the residue was purified with silica gel
column chromatography (CHCl3). Brown solid was obtained (0.47 g, 26%).
1H NMR (400 MHz, CDCl3) δ 7.06 (d, J = 8.7 Hz, 2H), 6.91 (d, J = 8.7 Hz,
2H), 5.89 (s, 2H), 3.93 (t, J = 6.6 Hz, 2H), 2.47 (s, 6H), 1.73 (m, 2H), 1.36 (s,
6H), 1.41 (m, 2H), 1.06 (m, 10H), 0.83 (t, J = 6.9 Hz, 3H).
13C NMR (100 MHz, CDCl3) δ 159.76, 155.18, 143.18, 142.04, 131.88,
131.50, 129.14, 126.79, 115.09, 68.17, 31.83, 29.41, 29.40, 29.27, 26.08,
22.65, 14.56, 14.54, 14.11.
HRMS-ESI: calculated for M-H 451.2733, found 451.2767, = 3.23 ppm.
Figure 30. Synthesis of compound 29.
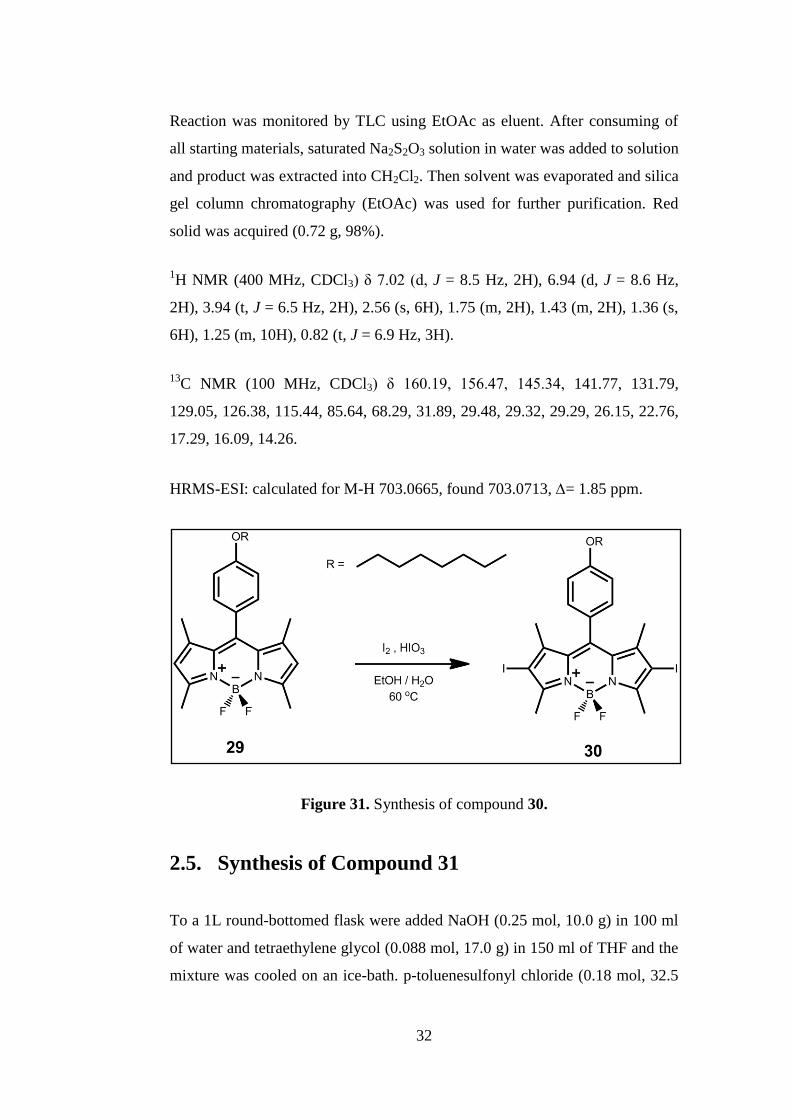
2.4. Synthesis of Compound 30
Iodic acid (2.00 mmol, 0.35 g) in 2 ml water was added to the mixture of I2
(2.50 mmol, 0.63 g) and compound 29 (1.04 mmol, 0.47 g). Then 50 ml of
ethanol was added to reaction and solution was stirred for 2 hours at 60 oC.
32
Reaction was monitored by TLC using EtOAc as eluent. After consuming of
all starting materials, saturated Na2S2O3 solution in water was added to solution
and product was extracted into CH2Cl2. Then solvent was evaporated and silica
gel column chromatography (EtOAc) was used for further purification. Red
solid was acquired (0.72 g, 98%).
1H NMR (400 MHz, CDCl3) δ 7.02 (d, J = 8.5 Hz, 2H), 6.94 (d, J = 8.6 Hz,
2H), 3.94 (t, J = 6.5 Hz, 2H), 2.56 (s, 6H), 1.75 (m, 2H), 1.43 (m, 2H), 1.36 (s,
6H), 1.25 (m, 10H), 0.82 (t, J = 6.9 Hz, 3H).
13C NMR (100 MHz, CDCl3) δ 160.19, 156.47, 145.34, 141.77, 131.79,
129.05, 126.38, 115.44, 85.64, 68.29, 31.89, 29.48, 29.32, 29.29, 26.15, 22.76,
17.29, 16.09, 14.26.
HRMS-ESI: calculated for M-H 703.0665, found 703.0713, = 1.85 ppm.
Figure 31. Synthesis of compound 30.
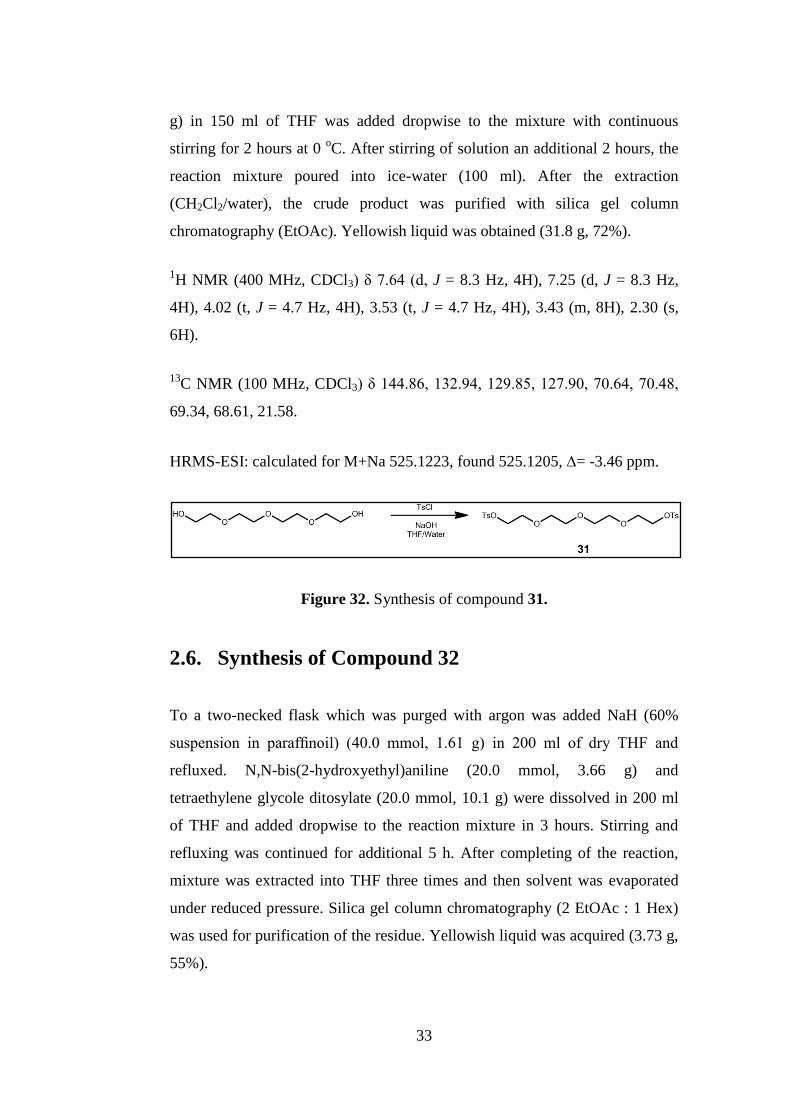
2.5. Synthesis of Compound 31
To a 1L round-bottomed flask were added NaOH (0.25 mol, 10.0 g) in 100 ml
of water and tetraethylene glycol (0.088 mol, 17.0 g) in 150 ml of THF and the
mixture was cooled on an ice-bath. p-toluenesulfonyl chloride (0.18 mol, 32.5
33
g) in 150 ml of THF was added dropwise to the mixture with continuous
stirring for 2 hours at 0 oC. After stirring of solution an additional 2 hours, the
reaction mixture poured into ice-water (100 ml). After the extraction
(CH2Cl2/water), the crude product was purified with silica gel column
chromatography (EtOAc). Yellowish liquid was obtained (31.8 g, 72%).
1H NMR (400 MHz, CDCl3) δ 7.64 (d, J = 8.3 Hz, 4H), 7.25 (d, J = 8.3 Hz,
4H), 4.02 (t, J = 4.7 Hz, 4H), 3.53 (t, J = 4.7 Hz, 4H), 3.43 (m, 8H), 2.30 (s,
6H).
13C NMR (100 MHz, CDCl3) δ 144.86, 132.94, 129.85, 127.90, 70.64, 70.48,
69.34, 68.61, 21.58.
HRMS-ESI: calculated for M+Na 525.1223, found 525.1205, = -3.46 ppm.
Figure 32. Synthesis of compound 31.
2.6. Synthesis of Compound 32
To a two-necked flask which was purged with argon was added NaH (60%
suspension in paraffinoil) (40.0 mmol, 1.61 g) in 200 ml of dry THF and
refluxed. N,N-bis(2-hydroxyethyl)aniline (20.0 mmol, 3.66 g) and
tetraethylene glycole ditosylate (20.0 mmol, 10.1 g) were dissolved in 200 ml
of THF and added dropwise to the reaction mixture in 3 hours. Stirring and
refluxing was continued for additional 5 h. After completing of the reaction,
mixture was extracted into THF three times and then solvent was evaporated
under reduced pressure. Silica gel column chromatography (2 EtOAc : 1 Hex)
was used for purification of the residue. Yellowish liquid was acquired (3.73 g,
55%).

34
1H NMR (400 MHz, CDCl3) δ 7.07 (t, J = 7.7 Hz, 2H), 6.55 (m, 3H), 3.52 (m,
24H).
13C NMR (100 MHz, CDCl3) δ 147.81, 129.26, 115.85, 111.61, 70.83, 70.78,
70.75, 70.67, 68.72, 51.27.
HRMS-ESI: calculated for M+H 340.2119, found 340.2104, = -4.29 ppm.
Figure 33. Synthesis of compound 32.
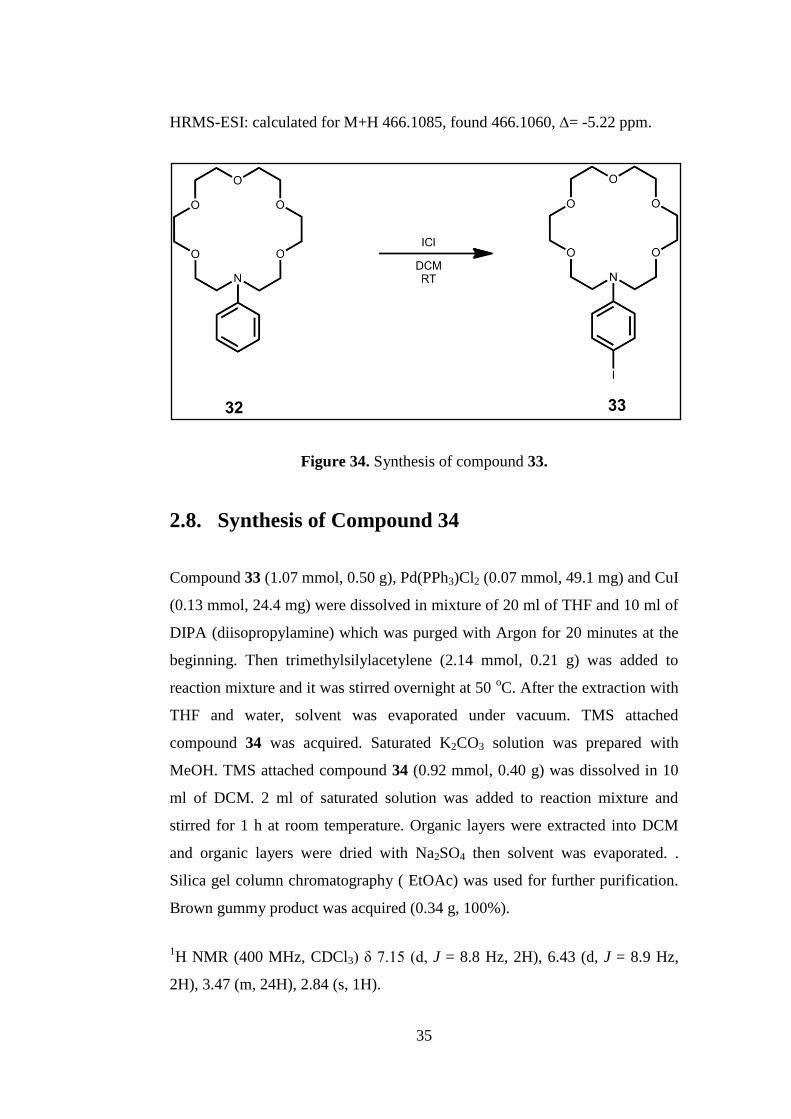
2.7. Synthesis of Compound 33
Compound 32 (1.47 mmol, 0.50 g) was dissolved in 10 ml of DCM. ICl (2.21
mmol, 0.36 g) in 10 ml of DCM was added dropwise to solution at room
temperature. After stirring 1 h, saturated Na2S2O3 solution in water was added
to reaction mixture. Then mixture was extracted into CH2Cl2 and it was dried
over Na2SO4. The residue was purified by silica gel column chromatography
(EtOAc). Brown liquid was obtained (0.55 g, 80%).
1H NMR (400 MHz, CDCl3) δ 7.31 (d, J = 8.6 Hz, 2H), 6.37 (d, J = 8.7 Hz,
2H), 3.57 (m, 24H).
13C NMR (100 MHz, CDCl3) δ 147.52, 137.72, 129.84, 114.12, 70.80, 70.77,
70.70, 70.54, 68.42, 51.36.
35
HRMS-ESI: calculated for M+H 466.1085, found 466.1060, = -5.22 ppm.
Figure 34. Synthesis of compound 33.
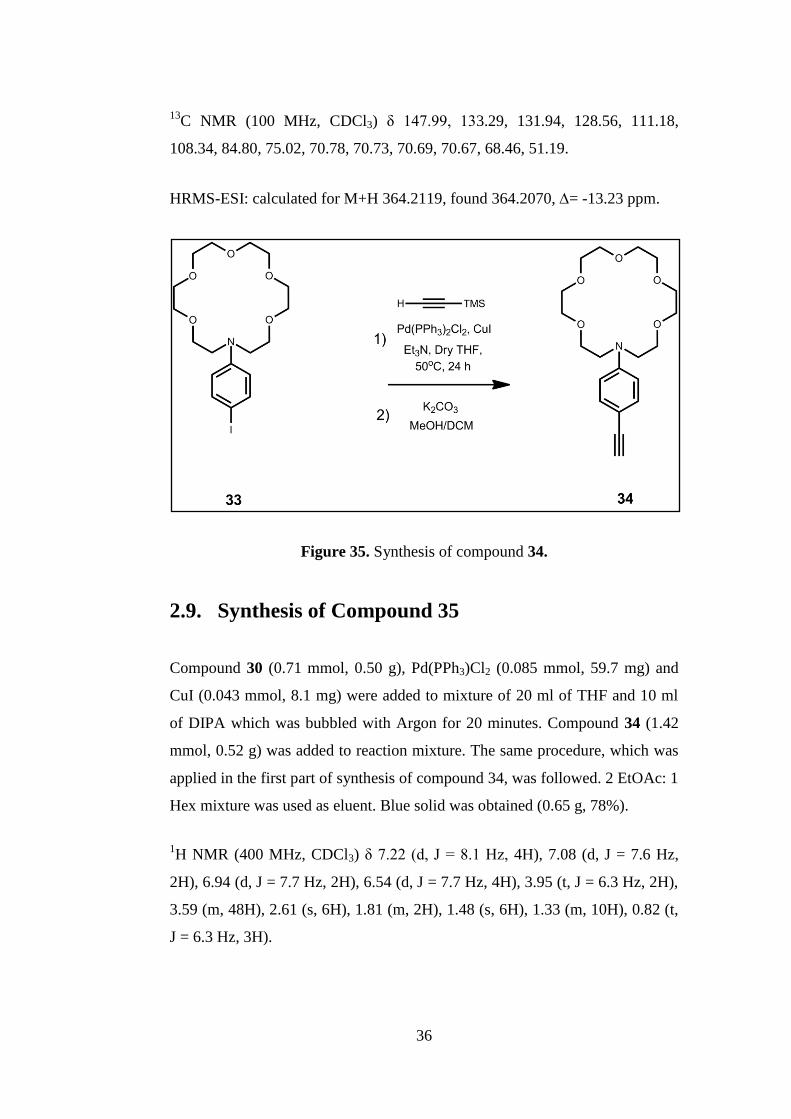
2.8. Synthesis of Compound 34
Compound 33 (1.07 mmol, 0.50 g), Pd(PPh3)Cl2 (0.07 mmol, 49.1 mg) and CuI
(0.13 mmol, 24.4 mg) were dissolved in mixture of 20 ml of THF and 10 ml of
DIPA (diisopropylamine) which was purged with Argon for 20 minutes at the
beginning. Then trimethylsilylacetylene (2.14 mmol, 0.21 g) was added to
reaction mixture and it was stirred overnight at 50 oC. After the extraction with
THF and water, solvent was evaporated under vacuum. TMS attached
compound 34 was acquired. Saturated K2CO3 solution was prepared with
MeOH. TMS attached compound 34 (0.92 mmol, 0.40 g) was dissolved in 10
ml of DCM. 2 ml of saturated solution was added to reaction mixture and
stirred for 1 h at room temperature. Organic layers were extracted into DCM
and organic layers were dried with Na2SO4 then solvent was evaporated. .
Silica gel column chromatography ( EtOAc) was used for further purification.
Brown gummy product was acquired (0.34 g, 100%).
1H NMR (400 MHz, CDCl3) δ 7.15 (d, J = 8.8 Hz, 2H), 6.43 (d, J = 8.9 Hz,
2H), 3.47 (m, 24H), 2.84 (s, 1H).
36
13C NMR (100 MHz, CDCl3) δ 147.99, 133.29, 131.94, 128.56, 111.18,
108.34, 84.80, 75.02, 70.78, 70.73, 70.69, 70.67, 68.46, 51.19.
HRMS-ESI: calculated for M+H 364.2119, found 364.2070, = -13.23 ppm.
Figure 35. Synthesis of compound 34.
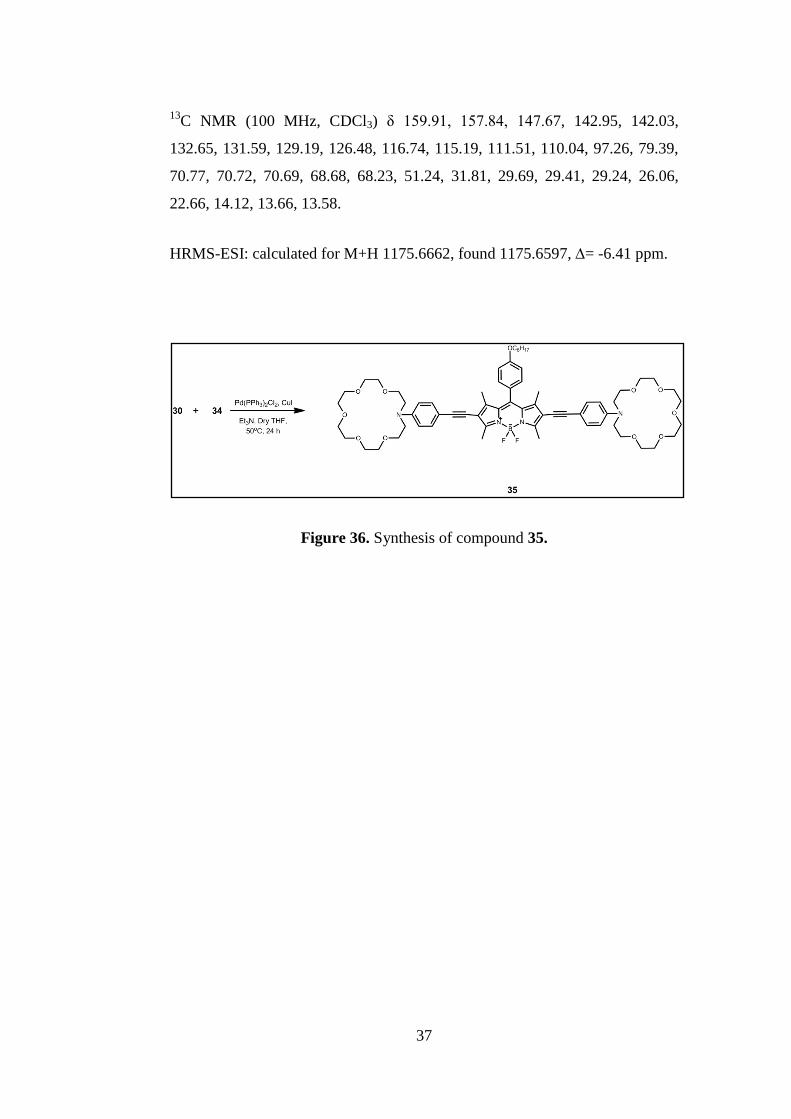
2.9. Synthesis of Compound 35
Compound 30 (0.71 mmol, 0.50 g), Pd(PPh3)Cl2 (0.085 mmol, 59.7 mg) and
CuI (0.043 mmol, 8.1 mg) were added to mixture of 20 ml of THF and 10 ml
of DIPA which was bubbled with Argon for 20 minutes. Compound 34 (1.42
mmol, 0.52 g) was added to reaction mixture. The same procedure, which was
applied in the first part of synthesis of compound 34, was followed. 2 EtOAc: 1
Hex mixture was used as eluent. Blue solid was obtained (0.65 g, 78%).
1H NMR (400 MHz, CDCl3) δ 7.22 (d, J = 8.1 Hz, 4H), 7.08 (d, J = 7.6 Hz,
2H), 6.94 (d, J = 7.7 Hz, 2H), 6.54 (d, J = 7.7 Hz, 4H), 3.95 (t, J = 6.3 Hz, 2H),
3.59 (m, 48H), 2.61 (s, 6H), 1.81 (m, 2H), 1.48 (s, 6H), 1.33 (m, 10H), 0.82 (t,
J = 6.3 Hz, 3H).
37
13C NMR (100 MHz, CDCl3) δ 159.91, 157.84, 147.67, 142.95, 142.03,
132.65, 131.59, 129.19, 126.48, 116.74, 115.19, 111.51, 110.04, 97.26, 79.39,
70.77, 70.72, 70.69, 68.68, 68.23, 51.24, 31.81, 29.69, 29.41, 29.24, 26.06,
22.66, 14.12, 13.66, 13.58.
HRMS-ESI: calculated for M+H 1175.6662, found 1175.6597, = -6.41 ppm.
Figure 36. Synthesis of compound 35.
38
CHAPTER 3
RESULTS AND
DISCUSSIONS
Fluorescent chemosensors are very beneficial for environmental and biological
systems and therefore designing of fluorescent chemosensors are promising
area of supramolecular chemistry. Although there are some techniques for
detection of particular ions or compounds, fluorescent chemosensors have
significant advantages. They are cheap besides high sensitivity and selectivity.
In recent years, fame of BODIPY has been increased rapidly between
fluorescent dyes because of the great photophysical properties of BODIPY.
There a lot of BODIPY based chemosensors in literature. Especially
chemosensors for heavy and transition metals such as Hg (II), Zn (II) and Ag
(I) are remarkable between scientist. Moreover, sensing of metals which play
important role in living systems such as Ca and Mg ions is important.
Fluorescent chemosensors have two type of working mechanism and these are
photoinduced electron transfer (PET) and internal charge transfer (ICT).
Majority of chemist prefer PET based chemosensors. In ICT based sensors,
receptor is directly attached to fluorophore. In PET based chemosensors, there
is spacer between fluorophore and receptor. We designed our chemosensor as
ICT based. It can be seen in the figure 37, receptors were directly attached to
BODIPY core. Receptors are part of the conjugation and there is no spacer.

39
Figure 37. Structure of compund 35.
In this study, we designed and synthesed 2, 6-functionalized BODIPY based
chemosensor. In literature, there are many examples BODIPY based
chemosensors but almost all of them 1, 3, 5, 7 and 8-functionalized. Therefore,
we synthesed 2, 6-functionalized BODIPY based chemosensor and examined
spectral properties of this molecule.
We used azo crown ether as receptor because it can sense wide range of metal
ions. We did not choose selective receptor since we wanted to investigate how
different metals affect the emission and absorption spectrum of 2, 6-
functionalized BODIPY. We used Hg2+
, Zn2+
and Ca2+
ions as analytes because
of the different roles in environment and living systems. Then we determined
detection limit, metal-ligand ratio and binding constants for these metal ions.
In this study, 8 compounds were synthesed. Compound 28 was synthesized by
using simple substitution nucleophilic reaction. In Argon atmosphere from 2,4-
dimethyl pyrrole and compound 28, compound 29 which is a BODIPY
derivative was synthesized. BF3.OEt2 was used to form BF2 bridge. In the
synthesis of the compound 30, ionic acid and I2 were used for iodination.
Synthesis of compound 31 was completed by tosylatin of tetraethylene glycol
in THF. Reaction of N,N-bis(2-hydroxyethyl)aniline and tetraethylene glycole
ditosylate in very diluted THF solution made possible the synthesis of
compound 32. For the iodination of phenyl azo crown, iodic acid was used
firstly but it did not work efficiently. Therefore, ICl was used for iodination of
phenyl ring and synthesis was occurred with almost 100 % efficiency.
Sonagashira coupling was used to attach trimethylsilylacetylene to compound

40
33. Then TMS was removed by saturated K2CO3 solution. Finally to synthese
compound 35 again Sonagashira coupling was used and yield was 78 %.
As it can be seen in absorption spectrums (Figure 38), there were blue shifts for
three metal ions. Shift in absorption spectrum means that our chemosensor is
ICT based and worked for all of three metal ions. If receptor is part of
conjugative system of the fluorophore, this system is ICT based fluorescent
chemosensor. Because of the orbital overlapping, internal charge transfer
occurs and that causes shifts in absorption and emission spectrums. In ICT
based system, there is no increasing; decreasing or quenching of emission
different from PET based chemosensors.
Figure 38. Absorption spectrums of 35 and complexes.
Absorption wavelengths shifted from 601 nm to 560 nm for Hg2+
and Zn2+
.
That is blue shift and nearly 40 nm. However, that is 30 nm for calcium ion.
The reason is related to interaction between metal ion and donor atoms
especially nitrogen in crown ether. Interaction with Hg and Zn ions are
stronger, so internal charge transfer occurs better.
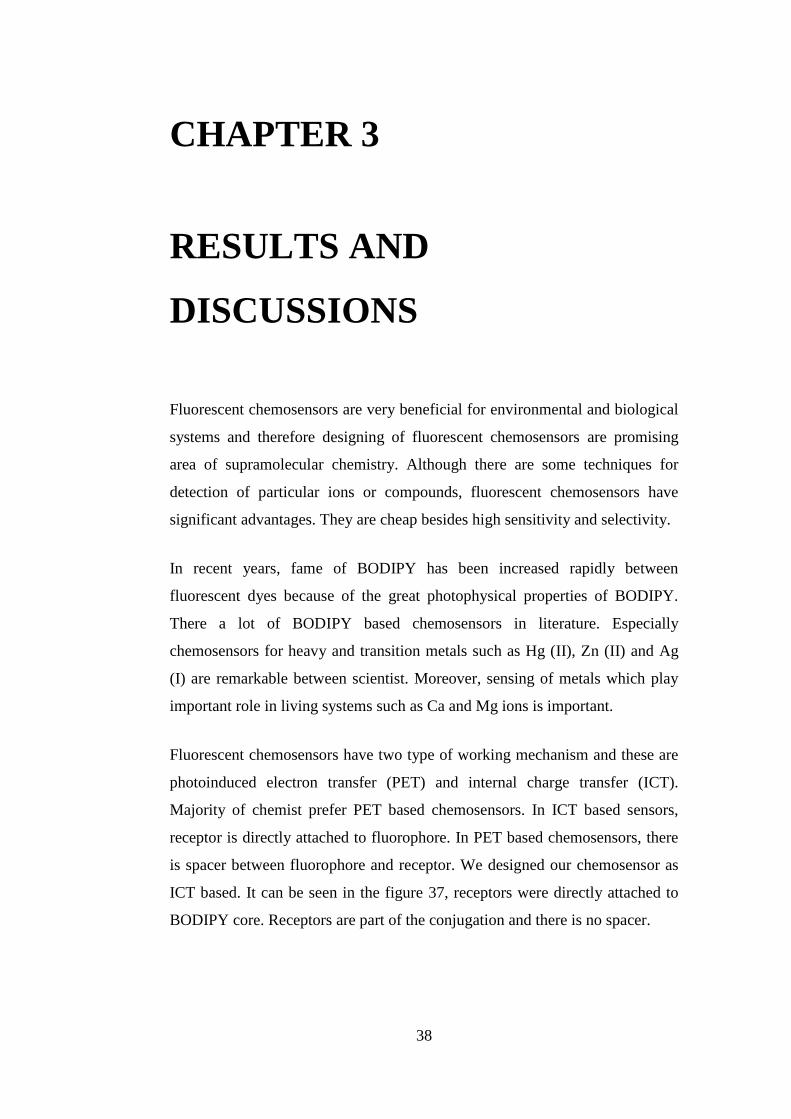
41
Figure 39. Titration of 35+Ca (5 µM) with increasing Ca ion (perchlorate salt)
concentration (0-150 µM) in acetonitrile.
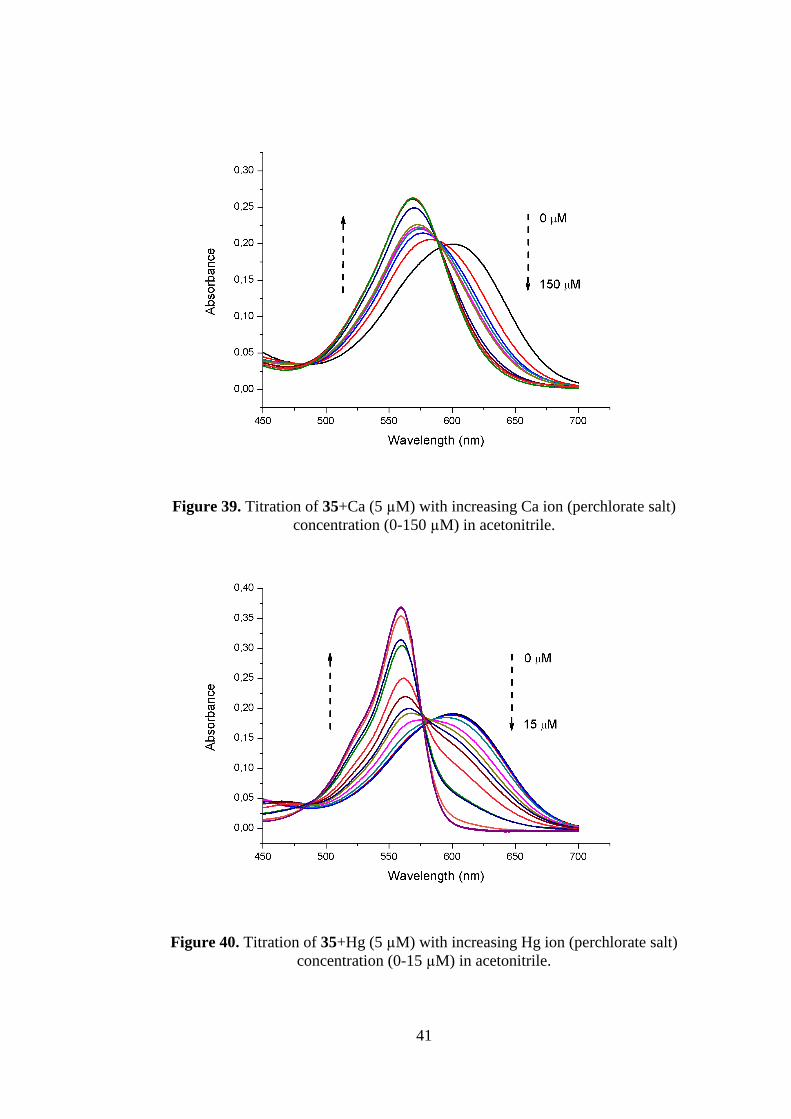
Figure 40. Titration of 35+Hg (5 µM) with increasing Hg ion (perchlorate salt)
concentration (0-15 µM) in acetonitrile.
42
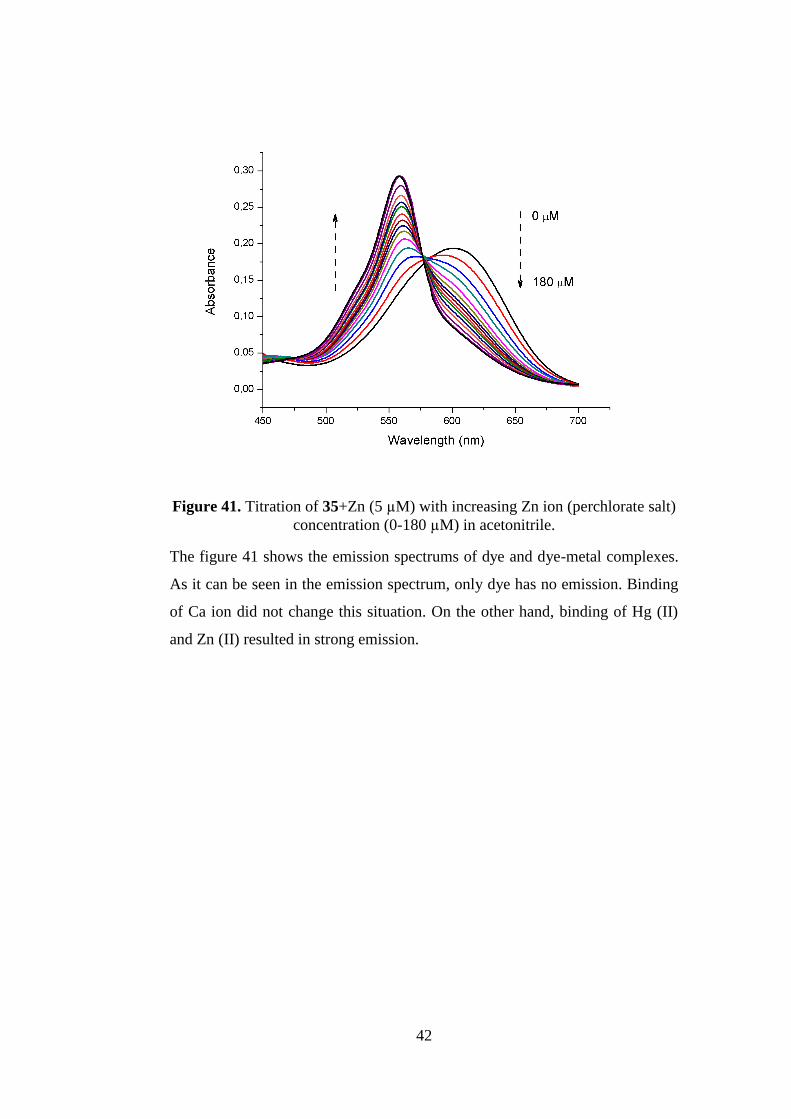
Figure 41. Titration of 35+Zn (5 µM) with increasing Zn ion (perchlorate salt)
concentration (0-180 µM) in acetonitrile.
The figure 41 shows the emission spectrums of dye and dye-metal complexes.
As it can be seen in the emission spectrum, only dye has no emission. Binding
of Ca ion did not change this situation. On the other hand, binding of Hg (II)
and Zn (II) resulted in strong emission.
43
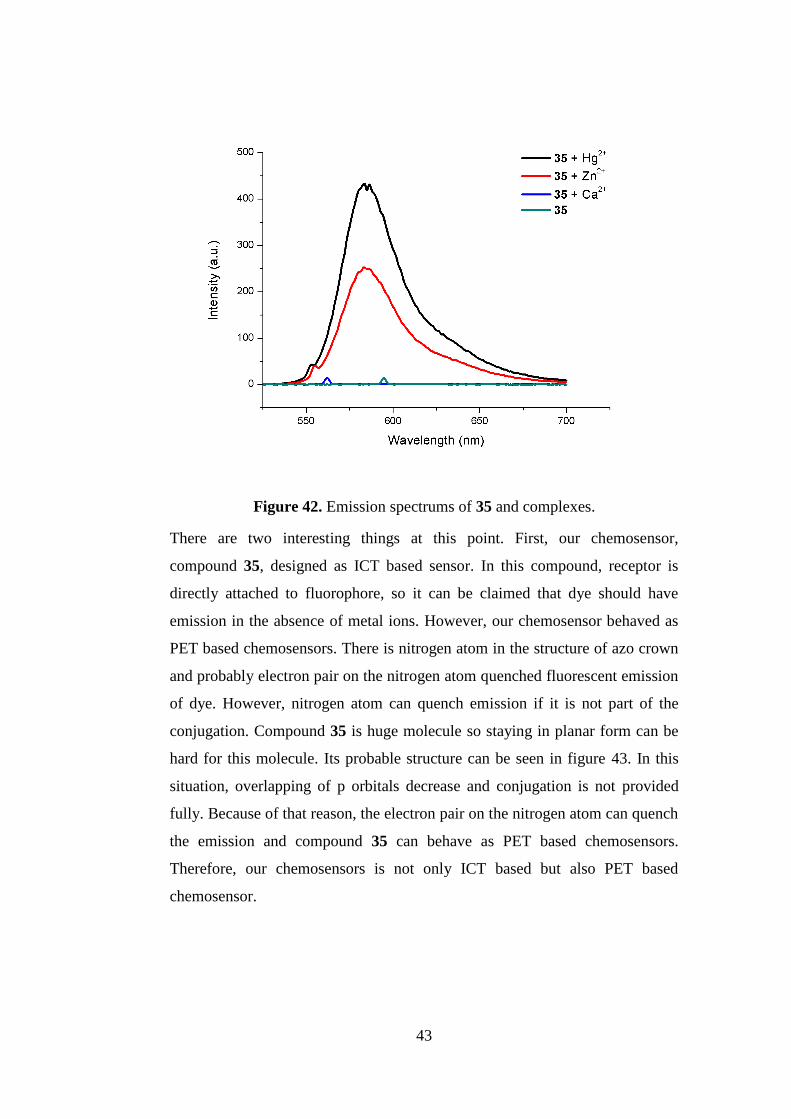
Figure 42. Emission spectrums of 35 and complexes.
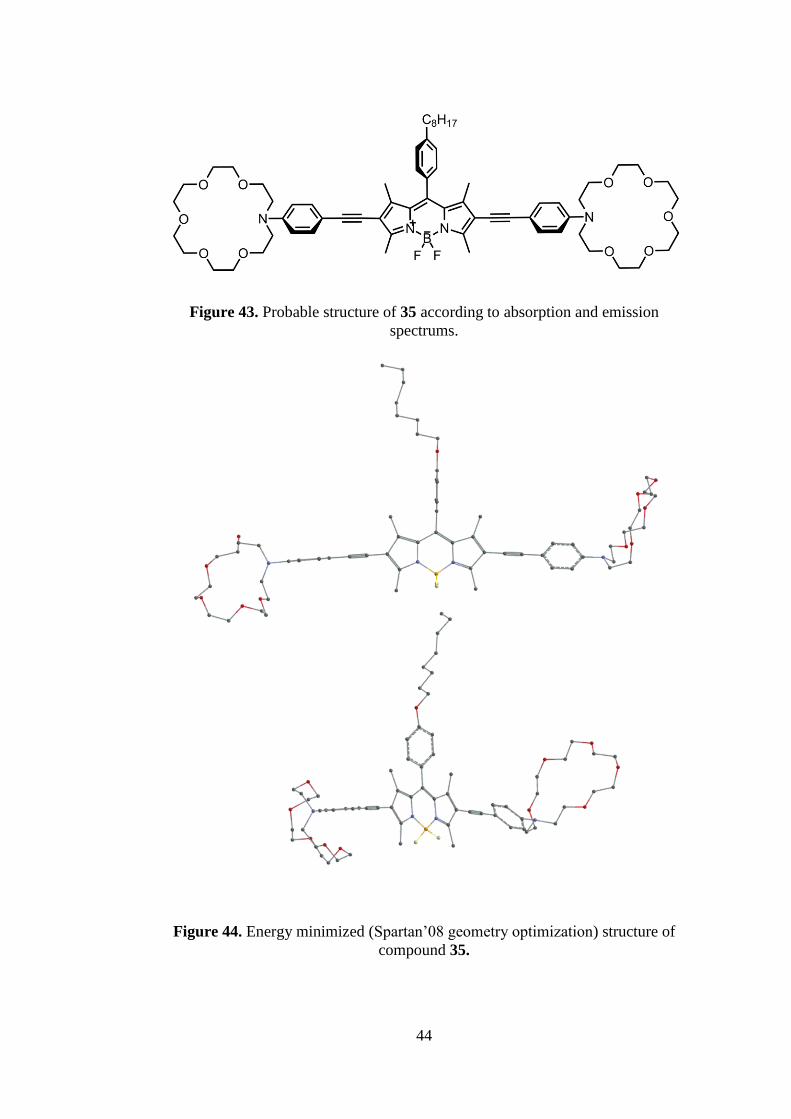
There are two interesting things at this point. First, our chemosensor,
compound 35, designed as ICT based sensor. In this compound, receptor is
directly attached to fluorophore, so it can be claimed that dye should have
emission in the absence of metal ions. However, our chemosensor behaved as
PET based chemosensors. There is nitrogen atom in the structure of azo crown
and probably electron pair on the nitrogen atom quenched fluorescent emission
of dye. However, nitrogen atom can quench emission if it is not part of the
conjugation. Compound 35 is huge molecule so staying in planar form can be
hard for this molecule. Its probable structure can be seen in figure 43. In this
situation, overlapping of p orbitals decrease and conjugation is not provided
fully. Because of that reason, the electron pair on the nitrogen atom can quench
the emission and compound 35 can behave as PET based chemosensors.
Therefore, our chemosensors is not only ICT based but also PET based
chemosensor.
44
Figure 43. Probable structure of 35 according to absorption and emission
spectrums.
Figure 44. Energy minimized (Spartan‟08 geometry optimization) structure of
compound 35.
45
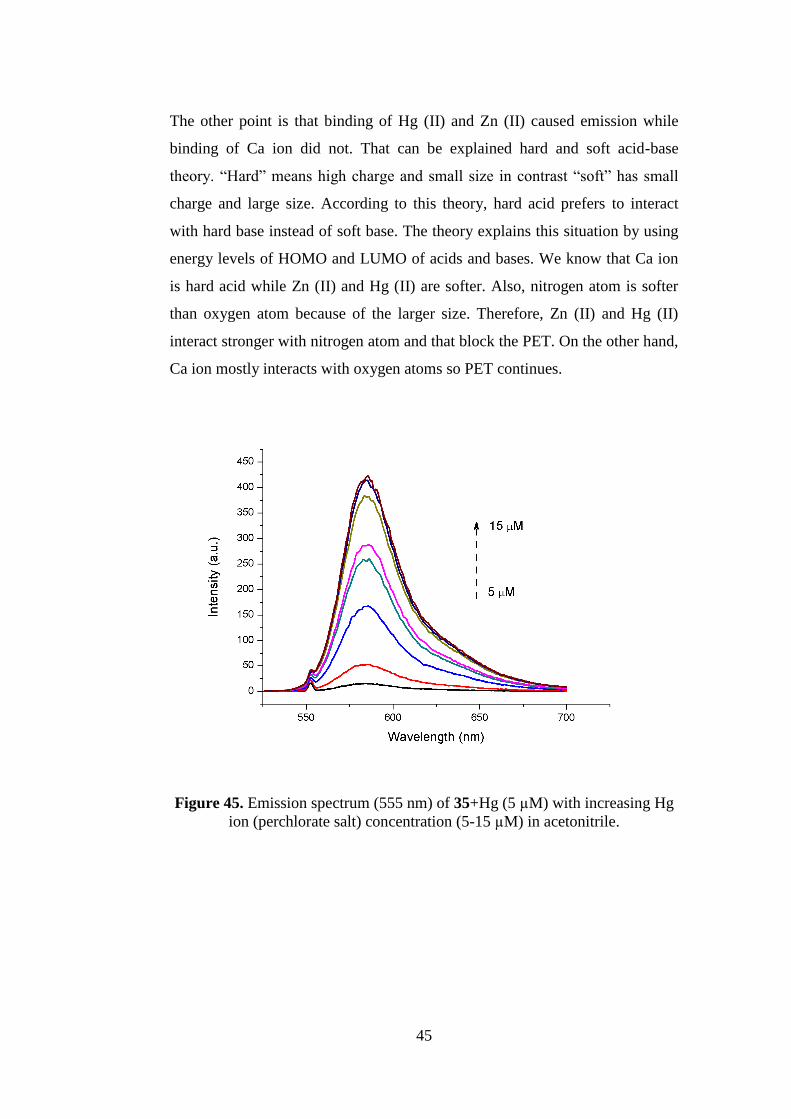
The other point is that binding of Hg (II) and Zn (II) caused emission while
binding of Ca ion did not. That can be explained hard and soft acid-base
theory. “Hard” means high charge and small size in contrast “soft” has small
charge and large size. According to this theory, hard acid prefers to interact
with hard base instead of soft base. The theory explains this situation by using
energy levels of HOMO and LUMO of acids and bases. We know that Ca ion
is hard acid while Zn (II) and Hg (II) are softer. Also, nitrogen atom is softer
than oxygen atom because of the larger size. Therefore, Zn (II) and Hg (II)
interact stronger with nitrogen atom and that block the PET. On the other hand,
Ca ion mostly interacts with oxygen atoms so PET continues.
Figure 45. Emission spectrum (555 nm) of 35+Hg (5 µM) with increasing Hg
ion (perchlorate salt) concentration (5-15 µM) in acetonitrile.

46
Figure 46. Excitation spectrum (590 nm) of 35+Hg (5 µM) with increasing Hg
ion (perchlorate salt) concentration (5-15 µM) in acetonitrile.
Figure 47. Emission spectrum (555 nm) of 35+Zn (5 µM) with increasing Zn
ion (perchlorate salt) concentration (10-180 µM) in acetonitrile.
47
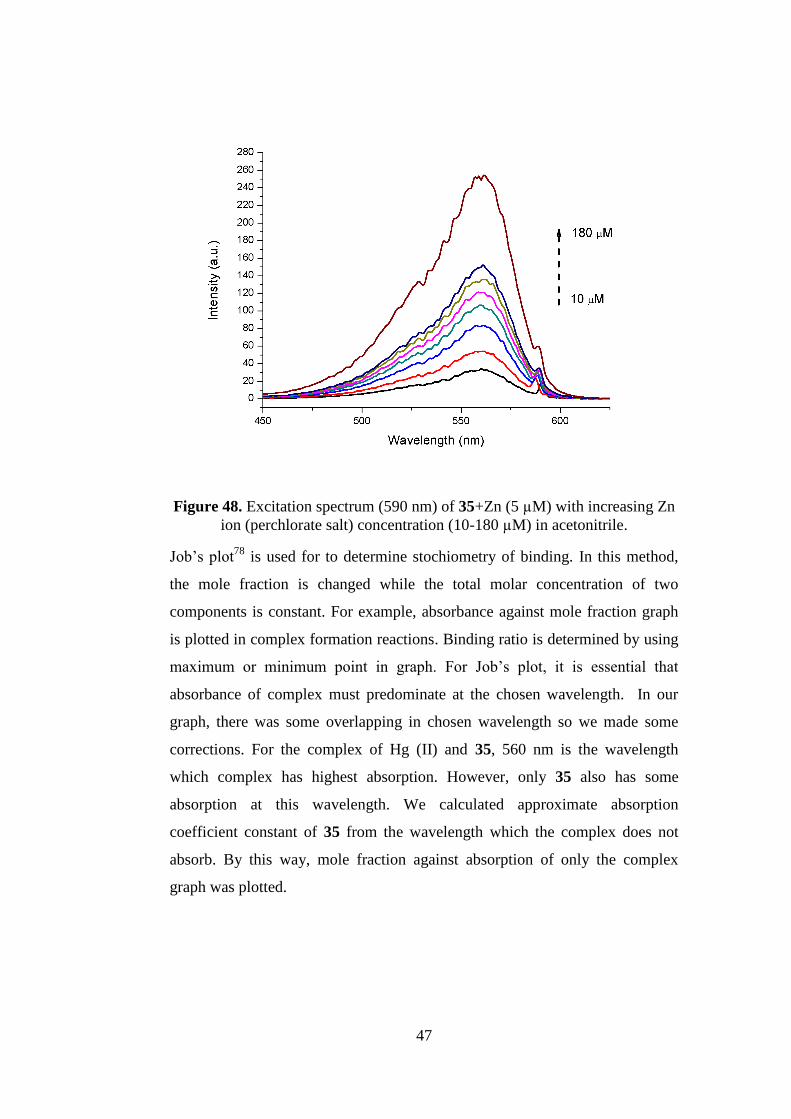
Figure 48. Excitation spectrum (590 nm) of 35+Zn (5 µM) with increasing Zn
ion (perchlorate salt) concentration (10-180 µM) in acetonitrile.
Job‟s plot78
is used for to determine stochiometry of binding. In this method,
the mole fraction is changed while the total molar concentration of two
components is constant. For example, absorbance against mole fraction graph
is plotted in complex formation reactions. Binding ratio is determined by using
maximum or minimum point in graph. For Job‟s plot, it is essential that
absorbance of complex must predominate at the chosen wavelength. In our
graph, there was some overlapping in chosen wavelength so we made some
corrections. For the complex of Hg (II) and 35, 560 nm is the wavelength
which complex has highest absorption. However, only 35 also has some
absorption at this wavelength. We calculated approximate absorption
coefficient constant of 35 from the wavelength which the complex does not
absorb. By this way, mole fraction against absorption of only the complex
graph was plotted.
48
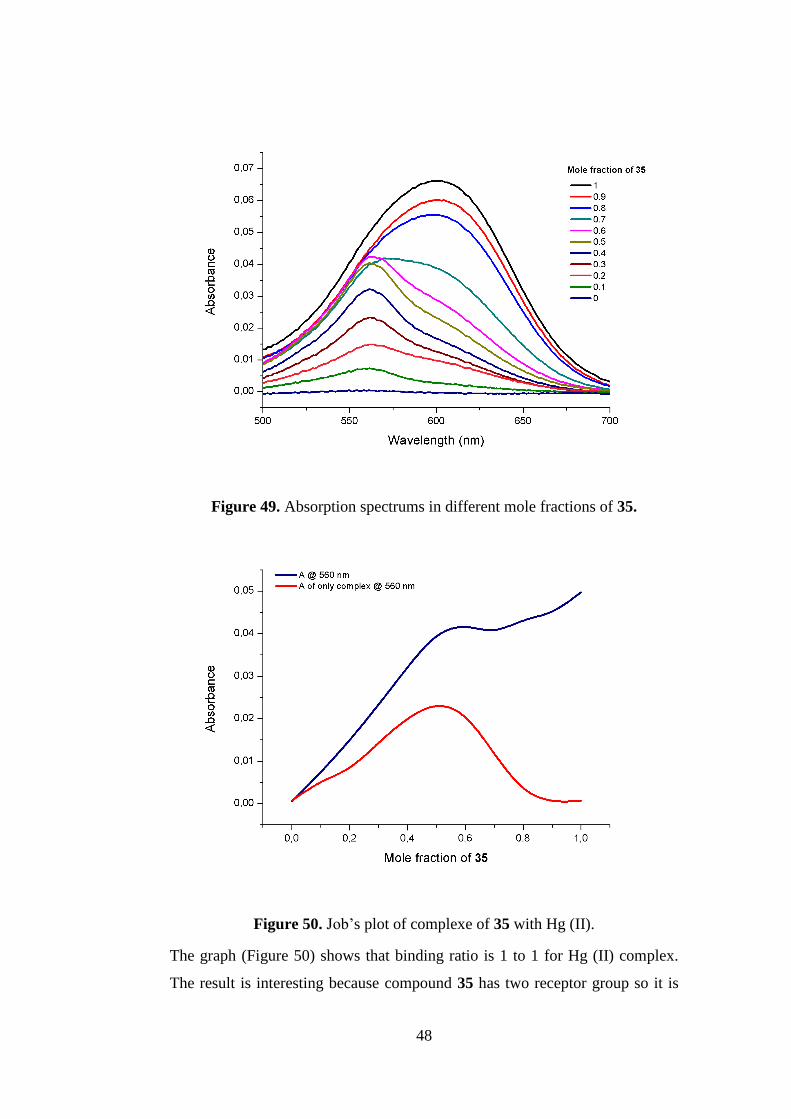
Figure 49. Absorption spectrums in different mole fractions of 35.
Figure 50. Job‟s plot of complexe of 35 with Hg (II).
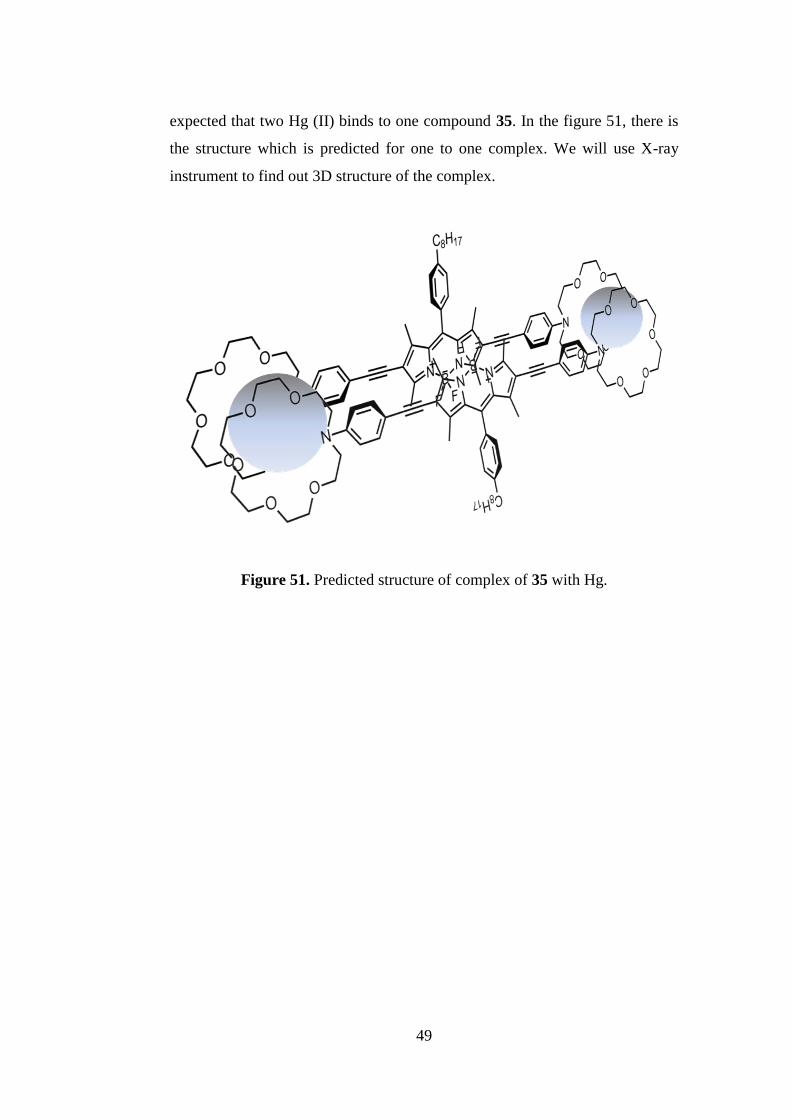
The graph (Figure 50) shows that binding ratio is 1 to 1 for Hg (II) complex.
The result is interesting because compound 35 has two receptor group so it is
49
expected that two Hg (II) binds to one compound 35. In the figure 51, there is
the structure which is predicted for one to one complex. We will use X-ray
instrument to find out 3D structure of the complex.
Figure 51. Predicted structure of complex of 35 with Hg.
50
CHAPTER 4
CONCLUSION
In this study, we functionalized 2 and 6 positions of BODIPY and
characterized different complexes of this chemosensor. We used three metal
ions which are important in environment and biological systems. We analyzed
all of absorption and emission spectrums of the chemosensor and it was
determined that our chemosensor worked successfully. Our chemosensor have
both PET (photoinduced electron transfer) and ICT (internal charge transfer)
properties while almost all of the chemosensors have only of them.
Actually this project is proof of principle and after this study, many
chemosensor can be synthesed based on 2, 6-functionalized BODIPY structure.
We show that 2, 6-functionalized BODIPY structures can be used for sensing
in some biological and environmental applications.

51
REFERENCES
(1) Lehn, J. M. Supramolecular Chemistry: Concepts and Perspectives;
VCH: Weinheim, 1995.
(2) Balzani, V., Scandola, F. Supramolecular Photochemistry; Horwood:
Chichester, 1991.
(3) Lindsey, J. S. New J. Chem. 1991, 15, 153.
(4) Whitesides, G.M.; Mathias, J.P.; Seto, C. T. Science 1991, 254, 1312.
(5) F., V. Supramolecular Chemistry An Introduction; Wiley: Chichester,
1991.
(6) Lehn, J. M. Proc. Natl. Acad. Sci. USA 2002, 99, 4763–4768.
(7) Ziener, U.; Lehn, J.M.; Mourran, A.; Möller, M. Chem. Eur. J. 2002, 8,
951.
(8) Rebek, J. Chem. Commun. 2000, 637.
(9) Philip, D.; Stoddart, J. F. Angew. Chem. Int. Ed. 1996, 35, 1155.
(10) Lehn, J.M.; Ball, P. The New Chemistry; Cambridge Univ. Press:
Cambridge, 1995; pp. 300–351.
(11) Beer, P. D. Chem. Commun. 1996, 689–696.
(12) Beer, P.D.; Szemes, F.; Balzani, V.; Sala, C.M.; Drew, M.G.B; Dent,
S.W.; Maestri, M. J. Am. Chem. Soc. 1997, 119, 11864 – 11875.
(13) Slone, R.V.; Benkstein, K.D.; Belanger, S.; Hupp, J.T.; Guzei, I.A.;
Rheingold, A. L. Coord. Chem. Rev. 1998, 171, 221 – 243.
(14) Manez, R.M.;Sancenon, F. Chem. Rev. 2003, 103, 4419–4476.
(15) Leung, K.C.-F.; Nguyen, T.D.; Stoddart, J.F.; Zink, J. I. Chem. Matter.
2006, 18, 5919.
(16) Feringa, B. L. J. Org. Chem. 2007, 72, 6635.
(17) Sugou, K.; Sasaki, K.; Kitajima, K.; Iwaki, T.; Kuroda, Y. J. Am. Chem.
Soc. 2002, 124, 1182.
52
(18) McQuade, D. T.; Hegedus, A. H.; Swager, T. M. J. Am. Chem. Soc.
2000, 122, 12389.
(19) Kim, S.; Choi, H.; Kim, D.; Song, K.; Kang, S.O.; Ko, J. Tetrahedron
2007, 63, 9206.
(20) Lo, S.-C.; Burn, P. L. Chem. Rev. 2007, 107, 1097.
(21) Pischel, U. Angew. Chem. Int. Ed. 2007, 46, 4026.
(22) Credi, A. Angew. Chem. Int. Ed. 2007, 46, 5472.
(23) Nijhuis, C. A.; Huskens, J.; Reinhoudt, D. N. J. Am. Chem. Soc. 2004,
126, 12266.
(24) Credo, G. M.; Boal, A. K.; Das, K.; Galow, T. H.; Rotello, V. M. . F.; D.
L.; Gorman, C. B. J. Am. Chem. Soc. 2002, 124, 9036.
(25) Pauvert, M.; Laine, P.; Jonas, M.; Wiest, O. J. Org. Chem. 2004, 69,
543.
(26) Regehly, M.; Greish, K.; Rancan, F.; Maeda, H.; Bohm, F.; Roder, B.
Bioconjugate Chem. 2007, 18, 494.
(27) Steed, J. W.; Turner, D. R.; Wallace, K. J. Core Concepts in
Supramolecular Chemistry and Nanochemistry; Wiley: Chichester,
2007.
(28) Sessler, J. L.; Lawrence, C. M. . J. J. Chem. Soc. Rev. 2007, 36, 314–
325.
(29) Ma, J. C.; Dougherty, D. A. Chem. Rev. 1997, 97, 1303–1324.
(30) Hunter, C. A.; Lawson, K. R.; Perkins, J.; Urch, C. J. J. Chem. Soc.,
Perkin Trans. 2 2001, 651–669.
(31) Southall, N.T.; Dill, K.A.; Haymet, A. D. J. J. Phys. Chem. 2006, 106,
521–523.
(32) Valeur, B. Molecular Fluorescence Principles and Applications; 2001;
Vol. 8.
(33) Stokes, G. G. Phil. Trans. R. Soc. London 1852, 142, 463.
(34) Kasha, M. Disc. Faraday Soc. 1950, 9.

53
(35) de Silva, a. P.; Gunaratne, H. Q. N.; Gunnlaugsson, T.; Huxley, A. J. M.;
McCoy, C. P.; Rademacher, J. T.; Rice, T. E. Chemical reviews 1997,
97, 1515–1566.
(36) Rurack, K.; Resch-Genger, U. Chem. Soc. Rev. 2002, 31, 116–127.
(37) Valeur, B.; Leray, I. Coord. Chem. Rev. 2000, 205, 3–40.
(38) De Silva, A.P.; de Silva, S. A. J. Chem. Soc. Chem. Commun. 1986,
1709.
(39) De Silva, A.P.; Gunaratne, H.Q.N.; Sandanayake, K. R. A. S.
Tetrahedron Lett. 1990, 31, 5193.
(40) Fabbrizzi, L.; Lichelli, M.; Pallavicini, P.; Perotti, A. and Sacchi, D.
Angew. Chem. Int. Ed. 1194, 33, 1975.
(41) Turfan, B.; Akkaya, E. U. Org. Lett. 2002, 4, 2857–2859.
(42) Mateeva, N.; Enchev, V.; Antonv, L.; Deligeorgiev, T.; Mitewa, M. J.
Incl. Phenom. 1995, 93, 323.
(43) Martin, M.M.; Be´gin, L.; Bourson, J.; Valeur, B. J. Fluoresc. 1994, 4,
271.
(44) Huang, C.; Chang, H. 2006, 78, 8332–8338.
(45) Nolan, E. M.; Lippard, S. J. Chemical reviews 2008, 108, 3443–80.
(46) Von Burg, R. J Appl Toxicol 1995, 15, 483–493.
(47) Du, J.; Fan, J.; Peng, X.; Li, H.; Wang, J.;Sun, S. J.Fluoresc. 2008, 18,
919–924.
(48) Nolan, E.M.; Lippard, S. J. J. Am. Chem. Soc. 2003, 125, 14270–14271.
(49) Coskun, A.; Akkaya, E. U. J. Am. Chem. Soc. 2006, 128, 14474–14475.
(50) Carol, P.; Sreejith, S.; Ajayaghosh, A. Chemistry, an Asian journal
2007, 2, 338–48.
(51) Sen, T. K.; Gomez, D. Desalination 2011, 267, 286–294.
(52) Callan, J. F.; de Silva, a. P.; Magri, D. C. Tetrahedron 2005, 61, 8551–
8588.
(53) Kaplan, J. H.; Ellis-davies, G. C. R. 1988, 85, 6571–6575.
54
(54) Adams 1989 JACS - Biologically useful chelators.pdf.
(55) Scheenenl, W. J. J. M.; Tsien, R. Y.; Makings, L. R.; Gross, L. R.;
Pozzanl, T. .
(56) Treibs A., Kreuzer F. H., J. L. Ann. Chem. 1968, 718, 208–223.
(57) Thoresen, L. H.; Kim, H.; Welch, M. B.; Burghart, A.; Burgess, K.
Synlett 1998, 1276.
(58) Wada, S.; Ito, S.; Uno, H.; Murashima, T.; Ono, N.; Urano, T.; Urano,
Y. Tetrahedron Lett. 2001, 42, 6711.
(59) Boyer J. H., Haag A. M., Sathyamoorthi G., Soong M. L., T. K.
Heteroat. Chem. 1993, 4, 39–49.
(60) Yogo T., Urano Y., Ishitsuka Y., Maniwa F., N. T. J. Am. Chem. Soc.
2005, 127, 12162 – 12163.
(61) Baruah, M., Qin, W., Vallee, R. A. L., Beljonne, D., Rohand, T., D.; W.,
Boens, N. Org. Lett. 2005, 7, 4377.
(62) Dost, Z., Atilgan, S., Akkaya, E. U. Tetrahedron 2006, 62, 8484–8488.
(63) Goze C., Ulrich G., Z. R. Org. Lett. 2006, 8, 4445 – 4448.
(64) Kollmannsberger M., Gareis T., Heinl S., Breu J., D. J. Angew. Chem.
Int. Ed. 1997, 109, 1391 – 1393.
(65) Rurack K., Kollmannsberger M., D. J. New J. Chem. 2001, 25, 289–292.
(66) Koutaka H., Kosuge J., Fukasaku N., Hirano T., Kikuchi K., U. Y.;
Kojima H., N. T. Chem. Pharm. Bull. 2004, 52, 700–703.
(67) Peng X., Du J., Fan J., Wang J., Wu Y., Zhao J., Sun S., X. T. J. Am.
Chem. Soc. 2007, 129, 1500 – 1501.
(68) Coskun A., Baytekin B. T., A. E. U. Org. Lett. 2002, 4, 2857 – 2859.
(69) Goze C., Ulrich G., CharbonniRre L., Cesario M., P. T. Chem. Eur. J.
2003, 9, 3748 – 3755.
(70) Atilgan, S.; Ekmekci, Z.; Dogan, A.L.; Guc, D.; Akkaya, E. U. Chem.
Commun. 2006, 4398.
(71) Yogo, T.; Urano, Y.; Ishitsuka, Y.; Maniwa, F.; Nagano, T. J. Am.
Chem. Soc. 2005, 127, 12162.
55
(72) Li, L.; Han, J.; Nguyen, B.; Burgess, K. J. Org. Chem. 2008, 73, 1963.
(73) Thivierge, C.; Bandichhor, R.; Burgess, K. Org. Lett. 2007, 9, 2135.
(74) Yilmaz, M. D.; Bozdemir, O. A.; Akkaya, E. U. Org. Lett. 2006, 8,
2871.
(75) D‟Souza, F., Smith P. M., Zandler M. E.; McCarty A. L., Itou, M., A.;
Y., I. O. J. Am. Chem. Soc. 2004, 126, 7898.
(76) Li, F., Yang S. I., Ciringh Y., Seth J., Martin C. H., Singh D. L., Kim,
D.; Birge R. R., Bocian D. F., Holten D., L. J. S. J. Am. Chem. Soc.
1998, 120, 10001.
(77) Erten-Ela, S., Yilmaz, M. D., Icli, B., Dede, Y., Icli, S., Akkaya, E. U.
Org. Lett. 2008, 10, 3299–3302.
(78) Job, P. Annali di Chimica Applicata 1928, 9, 113–203.

56
APPENDIX A
NMR SPECTRA
57
Figure 52. 1H spectrum of compound 28

58
Figure 53. 13
C spectrum of compound 28
59
Figure 54. 1H spectrum of compound 29
60
Figure 55. 13
C spectrum of compound 29
61
Figure 56. 1H spectrum of compound 30

62
Figure 57. 13
C spectrum of compound 30
63
Figure 58. 1H spectrum of compound 31
64
Figure 59. 13
C spectrum of compound 31
65
Figure 60. 1H spectrum of compound 32
66
Figure 61. 13
C spectrum of compound 32
67
Figure 62. 1H spectrum of compound 33
68
Figure 63. 13
C spectrum of compound 33
69
Figure 64. 1H spectrum of compound 34
70
Figure 65. 13
C spectrum of compound 34
71
Figure 66. 1H spectrum of compound 35

72
Figure 67. 13
C spectrum of compound 35

73
APPENDIX B
MASS SPECTRA

74
Figure 68. ESI-HRMS of compound 28
Figure 69. ESI-HRMS of compound 29

75
Figure 70. ESI-HRMS of compound 30
Figure 71. ESI-HRMS of compound 31
76
Figure 72. ESI-HRMS of compound 32
Figure 73. ESI-HRMS of compound 33

77
Figure 74. ESI-HRMS of compound 34
Figure 75. ESI-HRMS of compound 35