synthesis and characterisation of …bura.brunel.ac.uk/bitstream/2438/7694/1/fulltextthesis.pdf ·...
TRANSCRIPT
SYNTHESIS AND CHARACTERISATION
OF PHOSPHORESCENT COPPER (I)
COMPLEXES FOR LIGHT EMITTING
DEVICES
A thesis submitted for the degree of
Doctor of Philosophy
by
María Inmaculada Andrés‐Tomé
Wolfson Centre for Material Processing
Brunel University
June 2013

1
Abstract
Over the last decade, many significant developments have been made to
improve the active materials in a new generation of organic light emitting devices
(OLEDs). Current OLED technology is focused on organo-transition metal
complexes, which emit from the triplet excited state and exhibit bright
phosphorescence. Efficient in devices have been reported using these luminescent
materials, such as iridium and platinum complexes, however, rare metal abundance
concerns, high price and toxicology have inspired the study of alternative
phosphorescent materials, such as copper or silver complexes.
In this research, novel copper complexes have been synthesized, such as
trinuclear and mononuclear copper (I) complexes, using a range of ligands, such as
alkynyl, phosphine alkynyl and pyridine ligands. The synthesised complexes have
been characterised by with a range of techniques, such as UV/Vis absorption and
emission spectroscopy, nuclear magnetic resonance (NMR), thermogravimetric
analysis (TGA), differential scanning calorimetry (DSC), cyclic voltammetry (CV) and
scanning electron microscopy (SEM).
Most of the copper complexes have shown very interesting luminescent
properties in solution and solid state and some of them were studied for future
application in a device.

2
Agradecimientos
En primer lugar me gustaría dar las gracias a mis supervisores de doctorado,
Dr. Paolo Coppo y Prof. P. Kathirgamanathan por haberme dado la oportunidad de
trabajar on llos en este proyecto,por todos sus conocimientos y ayuda. También
quisiera dar mi más sentido agradecimiento a Researcg Council de Reino Unido por
la financiación de mi proyecto y a la coordinadora de Wolfson Centre Dr. Fiona
Cotterill.
Durante estos más de tres años de investigación he recibido el apoyo y la
ayuda desinteresada de muchísimos científicos, entre los que se encuentran
mienbros de diferentes universidades, compañías, etc. Por todo ello quisiera
agradecer a Dr. Peter Meadows, Dr. Naoyuki Fuji y Dr. Hiroaki Sasakawa de JEOL
por sus analisis de RMN, Prof. Andy P. Monkman, Dr. Fernando Baiao Dias y Khalid
Abdullah del Departamento de Ciencias Físicas de la Universidad de Durham por su
ayuda incondicional en mis análisis de días intesos en Durham, Dr. Giuliano
Jacobellis, Dr. Gianluca Farinola de la Universidad de Bari y NMSS de Swansea, por
sus análisis de RMN de Masas. Siempre habrá dos personas muy especiales que
nunca olvidaré por toda su ayuda, conociminetos cintíficos e impagable experiencia,
Prof. Chris Winscom y John Fyson, sin estos dos grandiosos científicos esta
investigación no hubiera sido possible.
Al igual que todo el conocimento y ayuda científica, yo no hubiera podido
terminar esta investigación sin la maravillosa ayuda de Dr. Diego Lanzarot Zúñiga,
desde pasar tardes ayudandome con a bioquímica de tercero de carrera, ayudarme
con mi ingles de principiante, hasta terminar leyendo mi tesis doctoral y lo que
siempre es más importante para mí, tu consejo. Quisiera destacar la gran ayuda
desde Graduate School, especialmente Dr. Tina Ramkalawan, Dr. Senthila Quirke y
la que fue mi jefa y ahora es mi gran amiga Mrs. Charlotte Zittel.
Durante todos estos años de soñar con la química, investigación y finalmente
con un doctorado he conocido a muchísima gente de differentes nacionalidades. Mis
amigas de España, con las que siempre he contado Rebeca (gracias por esas
intensas conversaciones telefónicas y tu apoyo), Laura y Lara (mis dos ELES y las
mejores “compis” de Universidad). A mi gran grupo de chicos de Wolfson Alex, Xiao

3
y Myles, nunca me lo podría haber pasado mejor en el despacho, gracias por
vuestro apoyo y ayuda cuando rompía el ordenador.
Quisiera especialmente dar las gracias a Nishan, quien me ha ayudado
desde el principio de mi aventura inglesa, quien me enseñó el divertido mundo de
los OLEDs y quien siempre me ayudado en los buenos y tantísimos malos
momentos. Gracias por aguantar.
Y finalmente, quisiera agradecer a las personas más importantes de mi vida,
nada de lo que tengo lo hubiera conseguido sin vosotros, mi familia, mi gran familia.
Mis hermanas, Ana por sus collejas ya que hora podemos ver los resultados y por
recordarme que yo pudo hacer lo que me propogan, Marise,por enseñarme que las
ciencias no es cosa de hombres. A mis tias Manoli e Ino, o major dicho a mis “titas”
Moli y Fefa, gracias por haber sido mas que unas titas. A mi abuela, y también mejor
dicho a mi Yaya, todo lo que soy empezó contigo y nunca se irá. Y por supuesto a
mis padres, José e Isi, gracias por enseñarme lo más importante. Nunca podré
expresar por escrito a mi familia lo agradecida que estoy a todos ellos. Gracias por
escucharme siempre.
A todos vosotros gracias por creer en mi.

4
Acknowledgements
I would like to thank my supervisors, Dr. Paolo Coppo and Prof. P.
Kathirgamanathan for giving me the opportunity to work on this project and their
knowledge and guidance. I am very grateful to the sponsor of my research,
Research Council of UK and the manager of Wolfson Centre Dr. Fiona Cotterill.
I want to express my sincere gratitude for their help to Dr. Peter Meadows,
Dr. Naoyuki Fuji and Dr. Hiroaki Sasakawa from JEOL, Prof. Andy P. Monkman, Dr.
Fernando Baiao Dias and Khalid Abdullah from the Department of Physics at
Durham University, Dr. Giuliano Jacobellis, Dr. Gianluca Farinola from University of
Bari and NMSS from Swansea. Especially, I would like to thank Prof. Chris Winscom
and John Fyson for their knowledge and their experience, without your help and
advice I would not have been able to finish this research. I would like to recognise
the wonderful and invaluable support from Dr. Diego Lanzarot Zuñiga and Graduate
School , especially to my dear friends Dr. Tina Ramkalawan, Dr. Senthila Quirke and
Mrs. Charlotte Zittel.
I would like to thank all my friends, from Spain especially Rebeca, Laura and
Lara; from England and other parts of the world, Olivier and my group of friends from
Wolfson Centre. I want to say the biggest thanks to Nishan, who showed me the
fantastic world of devices and who has supported me from the beginning of my life in
the UK.
And finally, thanks to the most important people in my life, all of this could not
be possible without the support and help from my family, my sisters Ana and Marise,
my aunties Manoli and Ino, my Yaya and my parents Isi and Jose. I will never be
able to express by writing how thankful I am. Thanks for always listening to me.
Thanks for believing in me!

5
Table of Contents
Chapter 1: Introduction to emitting materials for OLED’s ........................................ 10
1.1. Next generation of light emitting devices ...................................................... 11
1.1.1. Structure of OLED’s ...................................................................................... 12
1.1.1.1. Anode ...................................................................................................... 13
1.1.1.2. Cathode ................................................................................................... 15
1.1.1.3. Hole transport layer (HTL) ....................................................................... 15
1.1.1.4. Electron transport layer (ETL) ................................................................. 16
1.1.2. Device fabrication ......................................................................................... 17
1.2. Organic light-emitting diode operating mechanism ....................................... 18
1.2.1. Charge transport in organic materials ........................................................... 19
1.2.2. Band transport model .................................................................................... 19
1.2.3. Multiple trapping and release model ............................................................. 19
1.2.4. Hopping transport model ............................................................................... 20
1.3. Light emitting materials ................................................................................. 21
1.3.1. Luminescence ............................................................................................... 22
1.3.1.1. Factors influencing luminescence ........................................................... 25
1.3.2. Optical properties of metal complexes .......................................................... 26
1.3.2.1. Ruthenium complexes ............................................................................. 29
1.3.2.2. Osmium complexes ................................................................................. 31
1.3.2.3. Rhodium complexes ................................................................................ 32
1.3.2.4. Platinum complexes ................................................................................ 33
1.3.2.5. Iridium complexes .................................................................................... 35
1.3.2.6. Copper complexes ................................................................................... 36
1.3.2.7. Gold complexes ....................................................................................... 39
1.4. References .................................................................................................... 42
Chapter 2: Procedures for synthesis of trinuclear and mononuclear copper (I)
complexes ................................................................................................................ 51
2.1. Experimental procedures .............................................................................. 52
2.2. Synthesis of trinuclear copper (I) complexes ................................................ 52
2.2.1. Other ligands ................................................................................................. 55
2.3. Synthesis of mononuclear copper (I) complexes .......................................... 55

6
2.3.1. Other ligands ................................................................................................. 61
2.4. References .................................................................................................... 62
Chapter 3: Optical, thermal and electrochemical properties of novel trinuclear and
mononuclear copper (I) complexes ......................................................................... 64
3.1. Introduction ................................................................................................... 65
3.2. Photochemical studies .................................................................................. 65
3.2.1. Trinuclear copper (I) complexes ................................................................... 65
3.2.1.1. UV-vis absorption properties .............................................................. 65
3.2.1.2. Emission properties ............................................................................ 68
3.2.2. Mononuclear copper (I) complexes ............................................................... 74
3.2.2.1. UV-vis absorption properties .............................................................. 74
3.2.2.2. Emission properties ............................................................................ 75
3.3. Study of the thin films by scanning electron microscopy (SEM) ................... 79
3.4. Thermal studies ............................................................................................ 82
3.4.1. Thermogravimetric analysis (TGA) ............................................................... 82
3.4.2. Differential scanning calorimetry (DSC) ........................................................ 85
3.5. Processed fibres ........................................................................................... 88
3.6. Electrochemical studies ................................................................................ 89
3.6.1. Trinuclear copper (I) complexes ................................................................... 89
3.6.2. Mononuclear copper (I) complexes ............................................................... 90
3.7. Study of a mononuclear copper (I) complex with different dopants .............. 91
3.8. References .................................................................................................... 96
Chapter 4: Conclusions and future investigations ................................................. 100
Appendix 1: Lifetime curves of trinuclear copper (I) complexes ............................ 103
Appendix 2: Lifetime curves of mononuclear copper (I) complexes ...................... 108
Appendix 3: Different scanning calorimetry graphs of trinuclear copper (I)
complexes .............................................................................................................. 113
Appendix 4: Different scanning calorimetry graphs of mononuclear copper (I)
complexes .............................................................................................................. 118
Appendix 5: Cyclic voltammetry graphs of trinuclear copper (I) complexes .......... 123
Appendix 6: Cyclic voltammetry graphs of mononuclear copper (I) complexes .... 128
Appendix 7: Publications ....................................................................................... 133

7
List of Figures
Figure 1. Basic structure of an OLED ...................................................................... 12
Figure 2. Multilayer structure of an OLED ............................................................... 13
Figure 3. Schematic description of the processing sequence for the fabrication of the
light-emitting field-effect device structure: (a) situation before the deposition of the
organic layers with the insulator; (b) deposition of the organic layers; (c) deposition of
the metal cathode..................................................................................................... 17
Figure 4. Basic operation of an OLED ..................................................................... 18
Figure 5. The light generating mechanism of OLEDs .............................................. 21
Figure 6. The Jablonski diagram shows the photophysical processes in a typical
molecule A-B. The processes, which are shown in the molecular system, are: (1)
light absorption, (2) vibrational relaxation, (3) internal conversion (IC), (4) intersystem
crossing (ISC), (5) radiative transition and (6) nonradiative transition
.................................................................................................................................. 22
Figure 7. Energy level relationship in a phosphorescent guest-host system, where: a)
relationship between the band gap of the guest and the host; b) poor energy transfer
between guest-host system; c) efficient energy transfer between guest-host system.
The ground state was taken as
zero.……………………………………………………………………………................. 24
Figure 8. Molecular orbital (MO) diagram for an octahedral complex of a transition
metal ........................................................................................................................ 26
Figure 9. Molecular orbital diagram for a tetrahedral ML4 complex.The possible
ligand to metal charge transferences (LMCT) are showing by red arrows………… 28
Figure 10. Molecular orbital diagram for octahedral ML8 complex. The possible metal
to ligand charge transferences (MLCT) are shown by red arrows………………….. 29
Figure 11. Molecular structure formula of [Ru(bpy)3]2+ ............................................ 30
Figure 12. Molecular orbital diagram for Ru (II) polypyridine complexes in octahedral
symmetry ................................................................................................................. 30
Figure 13. Absorption spectrum of Ru(bpy)32+ ......................................................... 31
Figure 14. Structures of some of the ligands used for osmium (II) complexes ........ 32
Figure 15. Molecular structure formula of [Rh(phen)3]3+ .......................................... 33
Figure 16. Ligand field-splitting diagram for metal d orbitals in a square planar
complex ................................................................................................................... 34

8
Figure 17. Electronic transitions in a Ir (III) polyimine complexes ............................ 35
Figure 18. d orbitals in octahedral field .................................................................... 36
Figure 19. Heteroleptic diimine/diphosphine copper complexes 1-3 ....................... 37
Figure 20. Absorption spectra of copper complexes 1 (solid line), 2 (dashed line) and
3 (dotted line) at room temperature in a CH2Cl2 solution…………………………... 37
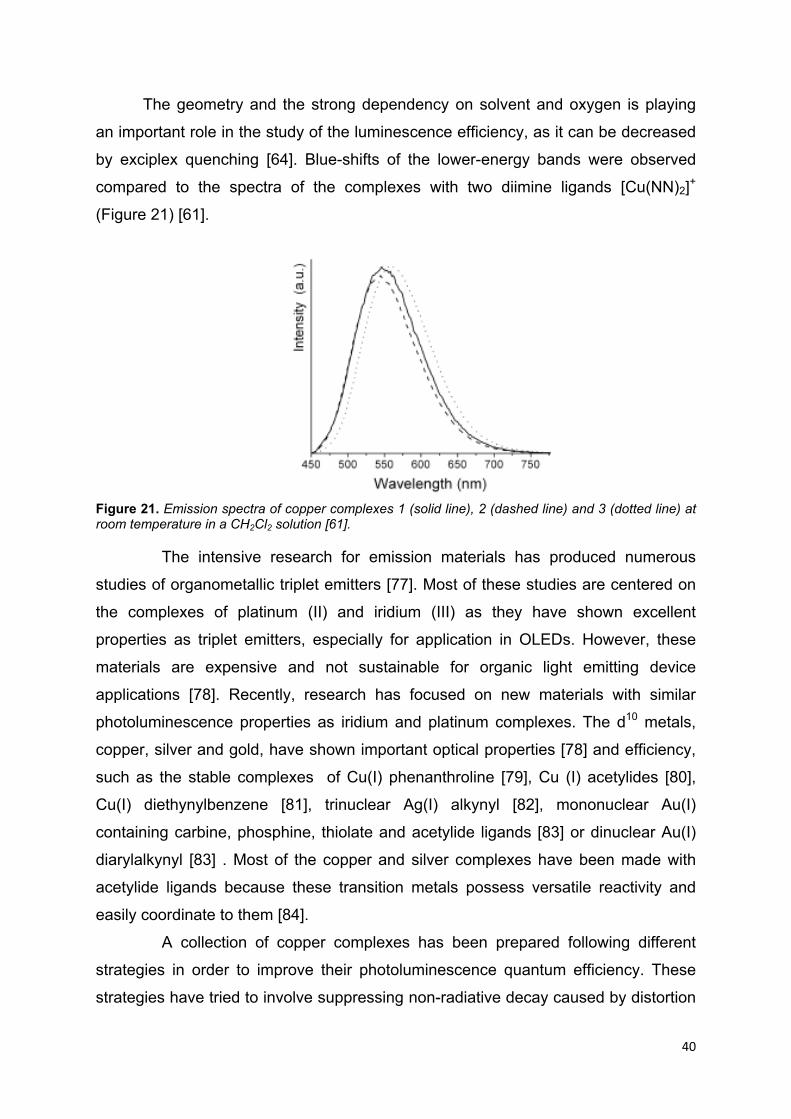
Figure 21. Emission spectra of copper complexes 1 (solid line), 2 (dashed line) and 3
(dotted line) at room temperature in a CH2Cl2 solution……………………………... 38
Figure 22. Schematic molecular orbital diagram of gold (I) phosphine complexes . 40
Figure 23. Method of synthesis for trinuclear alkynyl copper complexes 2 to 8, via
two steps, where: (a) tetrakis(acetronitrile) copper (I) tetrafluoroborate; (b)
bis(diphenylphosphine) methane; (1) binuclear copper complex and (R) is the
alkynyl ligand…………………………………………………………………………….... 55
Figure 24. The used alkynyl ligands in the reactions were: (c) 1-ethynyl-2,4-
difluorobenzene; (d)1-ethynyl-3,5-difluorobenzene; (e) 1-ethynyl-3,5-
bis(trifluoromethyl)benzene; (f) 1-ethynyl-α,α,α-4-(trifluoromethyl)benzene; (g) 9-
ethynylphenanthrene; (h) 2-ethynyl-6-methoxynaphthalene; i) 1-ethynylpyrene….. 55
Figure 25. Other alkynyl ligands and phosphine ligand: (a) ethylbenzene; (b) 1-
ethynyl 2-fluorobenzene; (c) 1-ethynylpyridine; (d) 4-ethynyl-N,N-dimethylaniline; (e)
1,4-diethynylbencene; (f) 1,3-diethynylbenzene; (g) (4-ethynyl)phenylacetronitrile
and (h) bis(2-diphenylphosphinophenyl)ether…………………………………………. 56
Figure 26. Method of synthesis for mononuclear copper complexes 9 to 16, where:
(a) tetrakis (acetronitrile) copper (I) tetrafluoroborate; (b) pyridine ligand, complexes
9,12 and 14 R1=R2= H, complexes 10, 13 and 15 R2=H and R1= CH3, complexes 11
and 16 R2= CH3 and R1= H; (c) bis(2-diphenylphosphinophenyl) ether; (d)
triphenylphosphine; (e) 9,9-dimethyl-4,5-bis(diphenylphosphino) xanthenes……... 60
Figure 27. Other pyridine and phosphine ligands: (a) 2-phenyl pyridine; (b) 2-phenyl
quinoline; (c) 2-methyl-6-phenyl pyridine; (d) 2,2-bipyridine-3,3-dicarboxylic acid; (e)
2,2’-bipyridyl; (f) 1,10-phenanthroline-5,6-dione; (g) 1,2-bis(diphenylphosphino)
benzene and (h) diphenyl phosphine methane………………………………………... 61
Figure 28. Complexes, 3, 4, 7 and 8, were exposure under an UV lamp at 365nm..73
Figure 29. Complexes, 10, 12, 13 and 14, were exposure under an UV lamp at
365nm ...................................................................................................................... 77
9
Figure 30. SEM image of a film of complex which have been processed as
amorphous films with 8% w/w PMMA by solution casting at 100 times
magnification………………………………………………………………………………. 80
Figure 31. SEM image of a film of complex which have been processed as
amorphous films with 8% w/w PMMA by solution casting at 1000 times
magnification………………………………………………………………………………. 80
Figure 32. SEM image of a film of complex which have been processed as
amorphous films with 8% w/w PMMA by solution casting at 10000 times
magnification………………………………………………………………………………..81
Figure 33. SEM image of a film of the doped complex 16 with PVCz (3:7,
dopper:complex), which have been processed as amorphous films by speed coating
at 36500 times magnification……………………………………………………………. 81
Figure 34. Extruded phosphorescent polypropylene doped with complexes 16
(green) and 10 (orange)………………………………………………………………….. 88
Figure 35. An energy level diagram of the complex 16, which LUMO level is at 3.6eV and HOMO level is at 6.4eV; the host materials, PVCz which LUMO level is at 2.2eV and HOMO level is at 5.7eV [34], CBP which LUMO level is at 3.0eV and HOMO level is at 6.3eV and TAZ which LUMO level is at 2.6eV and HOMO level is at 6.6eV……………………………………………………………………………………….. 92
10
List of Graphs
Graph 1. Absorption spectra of the complexes 2 to 8 in a solution of DCM ............ 66
Graph 2. Absorption spectra of the processed complexes 2 to 8 which have been as
amorphous films with 4% PMMA by speed coating ................................................. 67
Graph 3. Emission spectra of the complexes 2 to 8 in a solution of DCM ............... 69
Graph 4. Emission spectra of the processed complexes 2 to 8 with 4% w/w PMMA
by spin coating ......................................................................................................... 70
Graph 5. Lifetime curve of trinuclear copper complex 3 which possess 1-ethynyl-3,5-
difluorobenzene as alkynyl ligand………………………………………………………..72
Graph 6. Lifetime curve of trinuclear copper complex 6 which possess 9-
ethynylphenanthrene as alkynyl ligand………………………………………………….73
Graph 7. Emission spectra of the complexes 9 to 16 in a solution of DCM ............. 74
Graph 8. Emission spectra of the processed complexes 9-16 with 5% w/w PMMA by
speed coating .......................................................................................................... 76
Graph 9. Lifetime curve of mononuclear copper complex 10 which possess 4,4’-
dimethyl-2,2’-bipyridyl as pyridine ligand and bis-(diphenylphosphinophenyl)ether as
phosphine ligand…………………………………………………………………………...78
Graph 10. Lifetime curves of mononuclear copper complex 16 which possess 6,6’-
dimethyl-2,2’-bipyridyl as pyridine ligand and 9,9-dimethyl-4,5-
bis(diphenylphosphino) xanthene as phosphine ligand………………………………..78
Graph 11. TGA graphs of complexes 2 to 8 ............................................................ 83
Graph 12. TGA graphs of complexes 9 to 16 .......................................................... 84
Graph 13. Emission spectra of the complex 16 at different weight proportion of
PVCz ……………………………………………………………………………………… 93
Graph 14. Signal detectable by scanning differential calorimetry for complexes 9 to
16, where Texo is the temperature of a exothermic peak, Tendo is the temperature
of an endothermic peak, Tmelt is the temperature of the melting point and Tg is the
temperature of the glass transition……………………………………………………... 93
Graph 15. Emission spectra of the complex 16 at different weight proportion of
TAZ ………………………………………………………………………………………... 94
Graph 16. Emission of the complex 16 at 530nm, in different proportion, with the host
materials PVCz, CBP and TAZ ................................................................................ 95
11
Tables
Table 1. Yield of the labelled complexes 2 to 8 ....................................................... 53
Table 2. Yield of the labelled complexes 9 to 16 ..................................................... 57
Table 3. Absorption maximum of the complexes 2-8 in a solution of DCM and in 4%
PMMA films .............................................................................................................. 67
Table 4. Parameters of the emission spectroscopy of the complexes 2-9: λ maximum
emission, quantum yield (Φ) and lifetime (τ)…………………………………………….71
Table 5. Absorption maximum of the complexes 9-16 in a solution of DCM ........... 75
Table 6. Parameters of the emission spectroscopy of the processed complexes 9-16
in films with 5% w/w PMA by speed coating: λ maximum emission, quantum yield (Φ)
and lifetime (τ)…………………………………………………………………………….. 76
Table 7. Temperature of decomposition of the complexes 2 to 8 ............................ 83
Table 8. Temperature of decomposition of the complexes 9 to 16 .......................... 84
Table 9. Signal detectable by scanning differential calorimetry for the complexes 2
to 8, where Texo is the temperature of a exothermic peak, Tendo is the temperature
of a endothermic peak and Tg is the temperature of the glass transition…………... 86
Table 10. Signal detectable by scanning differential calorimetry for complexes 9 to
16…………………………………………………………………………………………… 87
Table 11. Redox potential of complex 2 to 8 in anhydrous, degassed acetonitrile vs
Cp2Fe/Cp2Fe+ used as internal reference……………………………………………. 90
Table 12. Redox potential of complex 9 to 16 in anhydrous, degassed acetonitrile vs Cp2Fe/Cp2Fe+ used as internal reference……………………………………………. 91

12
Chapter 1: Introduction to emitting materials for OLEDs
Esta tesis está dedicada a mis sobrinos, Miguel, Diego, Manuel y mi sobrina María. Esta tesis es un ejemplo que si quieres algo de verdad,
lo puedes conseguir.

13
1.1. Next generation of light emitting devices
Since the 1970s there has been scientific curiosity about organic
electroluminescencent devices [1]. During the last two decades, organic light
emitting diodes (OLEDs) have attracted considerable interest [2]. In 1987, Tang and
Van Slyke, from Kodak, first reported efficient high-performance OLEDs [3, 4]. This
new technology is based on the use of organic fluorescent dyes as emitters, which
can provide an array of different colour [5, 6]. In the 1990s OLEDs based on
phosphorescent transition metal complexes were proposed as a more efficient way
to harvest light from electrically generated excited states [7, 8]. Research in these
particular type of emitters has grown exponentially over the past decade.
The growth of OLED technology has been doomed by scepticism whether
OLEDs could progress into commercial products, as organic material are known to
be unstable to oxygen and unstable undo operational conditions [9]. In addition, the
manufacturability of these devices, which require the deposition of many different
layers of materials was in question. However, significant progresses in OLED
technology has been achieved since the 1990s in device fabrication and
encapsulation, which can eliminate water and oxygen from the device, extending the
operational lifetime by many orders of magnitude and making the technology
competitive with liquid crystal displays and inorganic LEDs [10, 11].
OLEDs received significant attention due to their promising applications in low
voltage flat-panel displays [12] to replace existing liquid crystal displays technology
(LCD) [2]. OLEDs are also promising candidates for interior lighting. The conversion
of the electricity into light is now competitive with fluorescent bulbs and tubes and
inorganic light emitting diodes (LEDs) ( efficacy 100 lmW-1) [13].For lighting
purposes, LED technology is limited by the geometry of the device which dictates the
use of diffusers to usefull redirect the light. OLEDs are flat devices, which offers a
significant advantage for lighting applications, with an active emissive layer of 100-
200nm [8] and a total thickness of only a few millimetres.
When compared with existing LCD technology, OLEDs offer a better viewing
angle, a more vivid colour contrast and improved power consumption, as there is no
need for a back light, as each individual pixel can be switched on and off.

14
Mechanically, OLEDs can be made significantly lighter than existing displays and if
printed on plastic, they also offer a limited degree of flexibility. [14, 15].
1.1.1. Structure of OLEDs
A basic structure of organic light emitting diodes (OLEDs) consists of multi
semiconducting organic layers which are either solution-processed or vacuum-
deposited (Figure 1). The first layer above the glass substrate is a transparent
conducting anode, typically indium tin oxide (ITO). The layer deposited on the anode
is a hole transporting layer (HTL). Similarly, the organic layer in contact with the
cathode is the optimized electron transporting layer (ETL).
Figure 1. Basic structure of an OLED [16].
During operation, a voltage is applied across the device such that the anode is
positive with respect to the cathode. Electrons migrate through the semiconducting
layer, towards the anode and holes migrate towards the cathode. As holes and
electrons meet in the emitting layer, the electron, travelling in the conduction band,
decays by emission of a photon of light.
The number and type of layers depend upon the chosen materials and
fabrication methodology. In general, an optimised multilayer structure increases the
performance of the device by lowering the barrier for the hole injection from the

15
anode and by allowing control over the electron-hole recombination region (Figure 2)
[17].
Figure 2. Multilayer structure of an OLED [17].
The multilayer structure is shown in Figure 2, with a new layer, which is the
doped emission layer (EML). This layer is the basic principle of an OLED as it
possess the doped organic material which with the necessary energy provided by
the recombination of the holes and electrons, emit light. This new layer, provide the
most important property to OLED since it can be processed in many more ways than
LED.
1.1.1.1. Anode
The anode material, in general, requires the following properties [18]:
i. Highly conductive so as to reduce contact resistance.
ii. High work function (WF > 4.1 eV) to promote efficient hole injection.
iii. Good film forming and wetting properties of applied organic materials
so as to guarantee good contact with the adjacent organic layers.
iv. Good stability, both thermal and chemical.
16
v. Transparent, or highly reflective material.
The structure of OLEDs, which is displayed in the figure 2, shows clearly that
the light must go through the layers and escape from the device, this is typically
achieved by using an anode made of indium-tin-oxide (ITO). ITO is a stable anode
for devices on rigid supports, possesses high optical transmission, low sheet
resistance, high work function, excellent adhesion to the substrates, chemical
stability and good surface morphology [15].
In addition, the anode must be capable of reducing the ambient light reflection
from the reflective cathode to intensify the contrast of the device [18]. The anode
may also be made using a stack of layers with graded refractive indexes to minimize
the total reflection of the ambient light from the conventional OLEDs. The thickness
and the refractive index of ITO can be varied with a desired gradient to form an
optically absorbing and electronically conducting anode for high contrast OLEDs by
developed lithographic techniques for device fabrication.
There are other transparent and conductive electrode materials, such as
fluorine doped tin oxide (FTO) [19], aluminium doped zinc oxide (AZO) [20], indium
doped zinc oxide, magnesium indium oxide, nickel tungsten oxide or other
transparent conductive oxide materials.
Polyaniline, or PANI, is one of the most studied conducting polymers of the
past 50 years [21]. It is due to its high electrical conductivity, light weight, mechanical
flexibility and low cost. All these properties make PANI an attractive alternative to the
use of ceramic oxides. Some of its applications are as a hole injection layer,
transparent conductor, an ITO replacement and as chemical vapours and solution
based sensor.
Platinum has a high work function (5.6 eV) and it contributes to increase hole
injection. However, as the anode must be very thin and transparent, it would be
deposited on the conventional ITO. Malliaras and co-workers have shown that a thin
layer (≤ 10 Å or ≤ 1nm) of platinum on ITO increases hole injection by up to a factor
of 100 with respect to uncoated ITO [22].
17
1.1.1.2. Cathode
The cathode material requirements are usually lower than anode materials, as
they do not need transparency, combined with electrical conductivity. In some case,
the cathode is transparent when a completely transparent OLED is needed. The
requisites for cathode materials are the following [18]:
1. High conductivity.
2. Low work function to promote electron injection.
3. Good film-forming and wetting properties to guarantee good contact with
adjacent organic layers.
4. Good stability.
5. Highly reflective or transparent if used in top-emitting OLEDs.
Usually, cathode materials are pure metals or metal alloys. Sometimes, ITO
could be used as the cathode with suitable modifications.
Magnesium (Mg), calcium (Ca), barium (Ba) or aluminium (Al) are used as
cathode because they possess a low work function. This character promotes the
electron injection into the lowest unoccupied molecular orbital (LUMO) level of the
ETL material. However, this characteristic implies high chemical reactivity. The
reactivity between the cathode metals and the external environment happens
frequently, requiring encapsulation of the device.
1.1.1.3. Hole transport layer (HTL)
The main function of the hole transport layer is to provide the positive charge
carrier holes a pathway to migrate from the anode into the electron transport layer. It
is common within small-molecule-based OLED devices, however it is less common
in polymer-based devices as conjugated polymers are good conductors themselves
[18].
The materials for HTL are easy to oxidise and moderately stable in the one-
electron oxidised (radical-cation) form. The materials possess low energy HOMO
and LUMO. These properties lead into the following chemical classes of materials for
HTL: triarylamine, triphenylmethanes and phenylazomethines.
Triarylamines are the most common material for HTL as they possess a good
electrochemical and thermal stability, adequate hole mobility and can be prepared in
18
high purity. Two of the most used are N,N’-(3-methylphenyl)-1,1’-biphenyl-4,4’-
diamine (TPD) and 4,4’-bis[N-(1-naphthyl-1)-N-phenyl-amino]-biphenyl (α-NPD).
These materials possess high hole drift mobilities. In theory, it is believed that a good
hole transition layer material should have a low energy barrier from the anode to HTL
and a relatively high glass transition temperature (Tg).
The triphenylmethanes were first developed for photoconductor applications
[23]. They show one of the highest hole mobility known for amorphous organic
material, in the range of 10-3 to 10-4 cm2/Vs [24].
A series of diphenylamine-substituted phenylazomethine dendrimers were
synthesised by Yamamoto and co-workers [25, 26]. These materials show high
thermal stability. When a metal ion-complex and this kind of material were used in a
device, the luminescence and electroluminescence efficiency were increased. They
are promising materials for highly efficienty OLEDs [27, 28].
1.1.1.4. Electron transport layer (ETL)
The electron transport materials help to move electrons from the cathode into
the organic layers of the device, via hopping mechanism, including transitory
production of anion radicals in the molecules involved [18].
The requirement for a good electron transport material are following:
1. High electron affinity (EA), < 3.2 eV. This value need to suit the work
function of the cathode and reduce the energy barrier difference
between the cathode and the emitter.
2. Good electron transport mobility (μe > 10-5 cm2/Vs). This property will
help to transport electrons to the emitter layer and efficiently enclose
the exciton in the emission layer.
3. High thermal stability (Tg>120 oC).
4. Stable electrochemistry and electric field stability. In other words, it
needs to have a reversible one-electron reduction.
5. Suit the optical band gap of the emitters. In order to increase the
efficiency, the materials should be transparent in the visible region.
6. The materials should be processable and compatible with neighbouring
materials to get uniform films.
19
1.1.2. Device fabrication
One of the most important aspect in the manufacture of OLEDs is the total
thickness of the layers. The organic layer is in general limited to 80 to 100 nm (800 Å
to 103 Å) to obtain efficient charge transport at suitable driving voltages [29]. As a
consequence, light is generated very close to the metallic cathode and the proximity
of the metal electrode causes severe optical absorption losses. In order to minimise
these quenching image force losses, a possible strategy is to increase the thickness
of the organic layers.
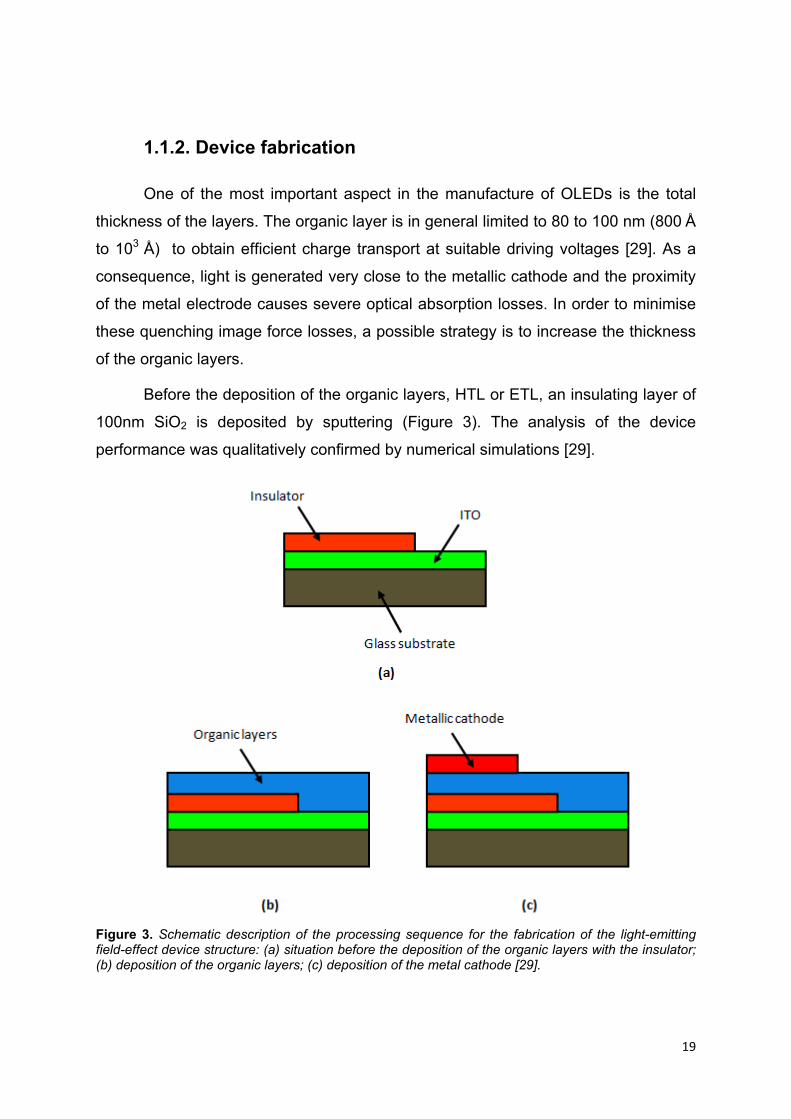
Before the deposition of the organic layers, HTL or ETL, an insulating layer of
100nm SiO2 is deposited by sputtering (Figure 3). The analysis of the device
performance was qualitatively confirmed by numerical simulations [29].
Figure 3. Schematic description of the processing sequence for the fabrication of the light-emitting field-effect device structure: (a) situation before the deposition of the organic layers with the insulator; (b) deposition of the organic layers; (c) deposition of the metal cathode [29].
20
Over the last 20 years there have been significant improvements in the
manufacturing of organic light emitting diodes. There are different methods, such as
vapour-deposition and solution processing of polymeric materials and inks. Some of
these improvements in device performance have made commercial display OLEDs
viable. These methods are competing with liquid crystal displays (LCDs) in an
expanding flat panel display marketplace [18]. Moreover, some researchers are
exploring the use of vapour-deposited organic materials in devices such as
photovoltaics [30], organic lasers [31] and organic thin-film transistors (TFTs) [32].
1.2. Organic light-emitting diode operating mechanism
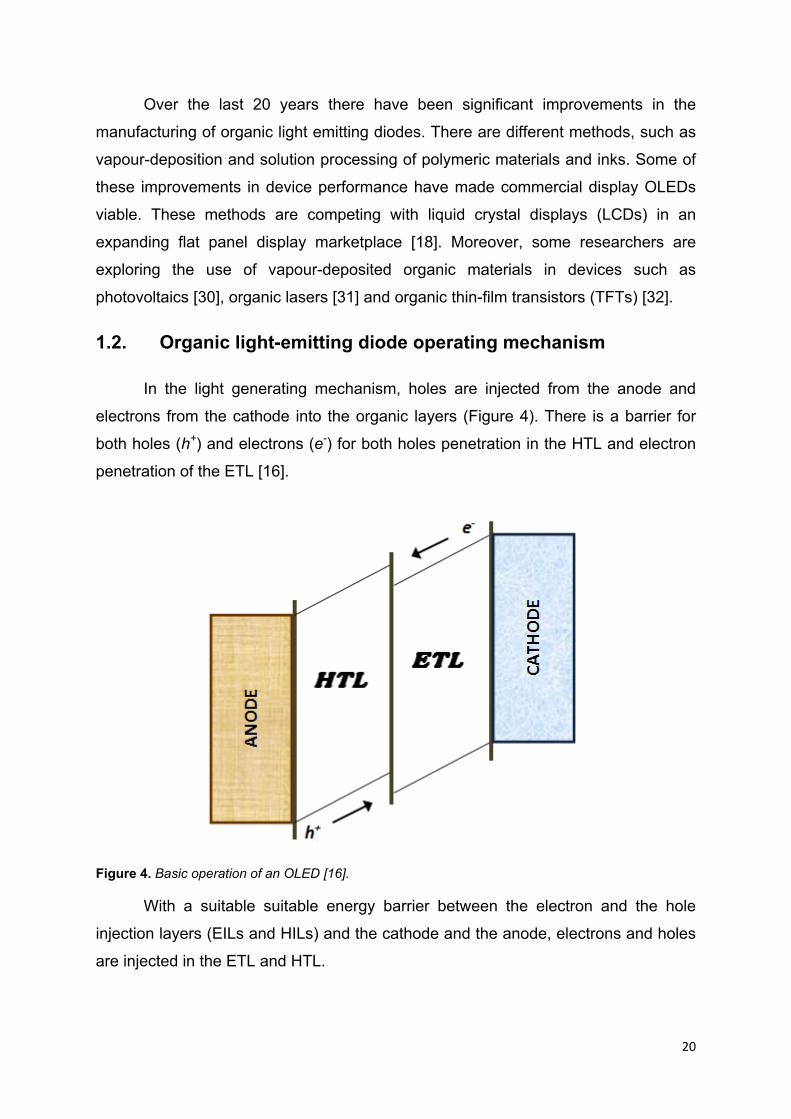
In the light generating mechanism, holes are injected from the anode and
electrons from the cathode into the organic layers (Figure 4). There is a barrier for
both holes (h+) and electrons (e-) for both holes penetration in the HTL and electron
penetration of the ETL [16].
Figure 4. Basic operation of an OLED [16].
With a suitable suitable energy barrier between the electron and the hole
injection layers (EILs and HILs) and the cathode and the anode, electrons and holes
are injected in the ETL and HTL.

21
Once the electrons and holes have been injected, they move through the ETL
and HTL and into the doped emission layer (EML), where the charges meet and
recombine. The electron migrate with an external potential, ∆V, through the host
material towards the anode. Normally, this process requires thermal activation
energy not to be quenched, due to inhomogeneities and to host reorganisation
effects related to the polaronic properties of the electrons.
1.2.1. Charge transport in organic materials
Charge transport in organic semiconductors is similar to inorganic
semiconductors, it exists via drift and diffusion. However, transport in organic
material is much more complicated due to their complex molecular nature. The
charge transport is impeded due to polarisation effects, the larger intermolecular
distances and smaller intermolecular orbital overlaps compared with inorganic
semiconductors. There are numerous theories which describe charge transport in
organic semiconductor materials, but none of them can explain all experimental
studies [33, 34].
1.2.2. Band transport model
Band transport occurs in delocalised states and is limited by scattering of
lattice vibrations. However, the lattice vibrations are reduced at low temperature,
which suggests that the charge carrier mobility increases with decreasing
temperature. Most organic semiconductors are characterised by a high degree of
disorder and low electronic coupling; these electronic couplings are Van der Waals
and dipole-dipole interactions. The weak electronic coupling between different
molecules can be broken, producing localised states. As a result, band transport is
generally not the preferred transport mechanism in organic semiconductors, being
limited to highly ordered molecular crystals such as naphthalene [35], anthracene
[36], rubrene [37] and pentacene [38].
1.2.3. Multiple trapping and release model
The multiple trapping and release model (MTR) describes charge transport in
hydrogenated amorphous silicon [39], but sometimes it has been used to explain the
transport in disordered organic materials [40]. This model of transport implies that

22
charge transport occurs through delocalised states. However, this transport is
hampered by impurities, defects and grain boundaries, which generate a distribution
of traps near the transport band. During the transport, charge carriers can be
trapped. These trapped carriers may be thermally liberated to reach the transport
band, where they can end up trapped again. The MTR has been used successfully
to describe transport in organic semiconductor films [41], where the energy levels
below the LUMO or HOMO is to a large extent due to disorder.
1.2.4. Hopping transport model
Charge carriers in disordered organic semiconductor materials move along
the lattice via a hopping mechanism, as they possess weak intermolecular coupling.
It means that the states for charge carriers in these materials are considered as
localised [42, 43]. The transport is thermally activated tunnelling of carriers between
localised states.
The mobility of the charge carriers depends on the energy within the density
of states distribution and increases if the density of the near neighbouring states is
large, or if there are states available at lower energy. As organic disordered
semiconductors are influenced by polarisation effects, the movements of the charges
can be limited. Charge transport in this kind of materials is described as a series of
carrier hopping from one site to the next, followed by polaronic relaxation.
The electron experiences a Coulomb attraction and the charges recombine,
an exciton is formed and, depending upon the nature of the emitting material (EMs)
and depending on the selection rules, light emission from a singlet (fluorescence) or
from a triplet excited (phosphorescence) state results. The process of hole trapping
as a first step can occur, if the oxidation potential of the emitter material compares
favourably with the HOMO energy of the HTL (Figure 5).

23
Figure 5. The light generating mechanism of OLEDs.
1.3. Light emitting materials
The materials which generate light, are in many cases a mixture of two or more
materials. At least, one of them is an electroluminescent emissive material, often
combined with a charge transporting host material. In general, the guest-host system
is common in the different kind of OLEDs, such as SMOLED, whereas in polymeric
LED (PLED) is usually composed of a single conjugated polymer.
Light-emitting materials need to possess many properties and they must be
effectively combined. These properties are: the layer must be able to transport
charges, both holes and electrons, in order that the charge carriers move through the
layer and find each other; the recombination charge must create an excited state in
the material and the mixture of materials. If they are used for long –lived devices,
must be uniformly dispersed (good film forming properties as a solid solution) and
not be affected by material migration under an applied electric field (no
electrophoresis).
The chemical and photo-physical properties of the emissive material itself lead
to a classification of OLEDs. They are two main types:
1. SMOLEDs: they contain small-molecule emissive materials which could
be processed by vacuum deposition techniques or solution coating (spin
coating or ink jet printing).
2. PLEDs: they contain polymeric emissive materials, which are almost
exclusively processed by solution coating.

24
1.3.1. Luminescence
Luminescence can be classified into two categories: luminescence from
electronically excited singlet (S1) or triplet (T1) states. Emission from singlet state is
called fluorescence and emission from triplet state is called phosphorescence [44].
This last process is intrinsically spin-forbidden and the timescale is much longer than
in fluorescent process, in the order of micro- to milliseconds.
A typical molecule shows different transitions between singlet states, singlet
and triplet state or triplet states, all those transitions are shown in the Jablonski
diagram (Figure 6).
Figure 6. The Jablonski diagram shows the photophysical processes in a typical molecule A-B. The processes, which are shown in the molecular system, are: (1) light absorption, (2) vibrational relaxation, (3) internal conversion (IC), (4) intersystem crossing (ISC), (5) radiative transition and (6) nonradiative transition [44].
In the diagram, S0 represents the ground state energy. The ground state is
the non-excited state [45]. S1 and S2 are the excited singlet states where the

25
electrons sit as pairs with opposite spins (+½ or -½) in a single orbital. On the right
end of the diagram the triplet states are represented by T1 and T2, where the
nonbonding electrons may occupy this level in two separate orbitals with the electron
spins parallel to each other.
In a molecule, there is a difference of energy, or energy gap, between the
highest occupied molecular orbital (HOMO) and the lowest unoccupied molecular
orbital (LUMO). If the absorbed energy is larger than the HOMO-LUMO energy gap
of a molecule, the transition from the ground state (S0) to the lowest energy level of
S1 is allowed. The molecule may also experience a change in vibration, rotation
and/or go into the higher electronic state (S2). These processes are labelled (1) in
the Figure 3. The time it takes a molecule to experience the transition from the
ground state to the excited state is extremely short, in the order of femtoseconds (10-
15 s).
The relaxation of an electron from the excited state to a lower energy level
can be radiative or non radiative (2). An electron in the highest single state S1, S2 or
S3, relaxes to the lowest vibrational state of them via non radiative, vibrational
relaxation (3). An electron can change spin from a singlet excited state (S1) to the
triplet excited state (T1) via an intersystem crossing process (ISC) (4), this happens
when the triplet state vibrational energy levels overlap with the lowest energy level
in S1. This process is followed by internal conversion to the lowest energy of T1.
Typically ISC is forbidden in most systems.
The other kinds of processes are called radiative processes, which result in
the emission of light (5). The emission of light can be produced by the processes of
fluorescence and phosphorescence. Fluorescence is the electronic transition from
the singlet excited state (S1) to the singlet ground state (S0). This process occurs
within nanoseconds after the absorption of light which is at shorter wavelength.
Organic molecules with conjugated double bonds, such as compounds with aromatic
rings, show fluorescent emission because the energy differences between excited
state and ground state orbitals are small enough to give photons in the visible part of
the electromagnetic spectrum.
In order to obtain an effective guest-host system, between the
electroluminescent emissive material and the transporting host material , there are

26
several factors which must be considered, such as the phase compatibility of the
host and guest, the aggregation of the molecules and the host-guest energy level
and orbital alignment. Efficient electroluminescent host-guest system have been
studied by Thom and co-workers, using computational methods, predicting suitable
host carbazole molecules for phosphorescent iridium guest complexes [46]. In this
study , the band gap of the guest falls within the band gap of the host to help
transport of electrons and holes from the host to the guest, where they recombine
(Figure 7). This applies to singlet and triplet excited states of the host and the guest.
Figure 7. Energy level relationship in a phosphorescent guest-host system, where: a) relationship between the band gap of the guest and the host; b) poor energy transfer between guest-host system; c) efficient energy transfer between guest-host system. The ground state was taken as zero.

27
As we can see in Figure 7, for an efficient energy transfer from the host to the
guest in the triplet state, which means there will be phosphorescence, the excited
triplet state of the host must be higher than that of the guest.
1.3.1.1. Factors influencing luminescence
One of the requirements for fluorescence and phosphorescence is a
molecular structure which absorbs ultraviolet or visible radiation [47]. We can say the
stronger the absorption of a molecule, the more intense its luminescence will be.
Molecules which contain conjugated double bonds, especially those with a high
degree of resonance stability, show efficient luminescence, as they show intense
electronic absorption in the ultraviolet to the visible region of the electromagnetic
spectrum.
Transition metal complexes can be optically active because of their
symmetrical configuration or because they are attached to optically active ligands
[48]. Their spectral band shape and transition energy is the consequence of their
specific electronic structure [44]. The presence of metal atoms enhances the
intersystem crossing, as they show a strong spin orbit coupling. Phosphorescence is
therefore allowed in metal complexes.
The nature of the solvent plays an important role in the absorption and
emission spectra, as the intermolecular solvent-solute interaction results in molecular
geometry variations [49]. However, the interpretation of solvent effects is difficult
because its magnitude is small on the spectra and is not easy to calculate precisely
[50]. Some of the significant factors, which are worth considering, are the dipole
moment, the size of the solute molecules and the difference between the dipole
moment in the ground and excited state. The quantum yield of luminescence is
higher in dense solutions, as opposed to a liquid because the viscosity of the
solution increases and, as a consequence, the probability of the loss of the excitation
energy by non radiative decay becomes lower.
The temperature influences the magnitude of luminescence. A rise in
temperature increases the frequency of collisions between the molecules and the
probability non-radiative decay increases as well. In general, we can say that a
temperature increase produces a decrease in luminescence [51].

28
1.3.2. Optical properties of transition metal complexes
Electronic transitions are frequently considered in metal complex as d-d
transitions as they involve the molecular orbitals which have mainly metal d
character [52]. However, it is necessary to mention that not all electronic transitions,
in the visible and ultraviolet spectral region are produced as d-d transitions; charge
transfer absorption, in which electrons are transferred from ligand to metal or vice
versa, can appear in this region too and they are much more intense than d-d
absorptions [53]. The complexes colours are determined by the magnitude of the
spacing between these levels and this spacing depends on factors such as the
geometry of the complexes, the nature of the bonding ligands and the oxidation state
of the metal ion.
Electron-electron repulsion has been so far ignored. However, this effect will
make a significant contribution to the electron energy in any complex which has
more than one electron or more than one d-level vacancy.
For metal complexes, the electronic configuration follows the same
configuration as for organic molecules [54]. By a molecular orbital (MO) diagram of
an octahedral transition metal complex, which can be applied to complex of Co (III),
Ru (II) and other d6 metal ions, we will define the different types of electronic
transitions. They are shown in Figure 8.
Figure 8. Molecular orbital (MO) diagram for an octahedral complex of a transition metal.

29
For organic molecules, excited configurations can take place from the ground
configuration, by promoting one electron from occupied to vacant MOs. There are
electronic transitions which can be expected at relatively low energies:
i. Metal-centered (MC): transition from nonbonding orbitals (πM), of t2g
symmetry, to antibonding orbitals (σM*), of eg symmetry.
ii. Ligand-centered (LC): transition from bonding orbitals (πL) to
antibonding orbitals (πL*).
iii. Ligand-to-metal charger-transfer (LMCT): transition from bonding
orbitals (πL) to antibonding orbitals (σM*).
iv. Metal-to-ligand charge-transfer (MLCT): transition from nonbonding
orbitals (πM) to antibonding orbitals (πL*).
The relative energy of these electronic transitions depends on the nature of
the metal and the ligands in predictable ways. In other words, low-energy metal-
centered (MC) transitions are expected for transition metals of the first row, low-
energy ligand-to-metal charge-transfer (LMCT) transitions are expected for
complexes which carry at least one ligand that is easy to oxidise and a metal which
is to reduce. Low-energy metal-to-ligand charge-transfer (MLCT) transitions are
expected when the complex carries a metal which is easy to oxidise and a ligand
easy to reduce and low-energy ligand-centered (LC) transitions are expected for
aromatic ligands with extended π and π* orbitals.
In the following schemes, we will compare the possible electronic transitions
in a tetrahedral complex to those of an octahedral complex (Figure 9 and 10).
In any tetrahedral complex, the lowest energy σ-bonding orbitals will be filled
and be primarily ligand in character. Next, there are two states of σ-nonbonding
molecular orbitals, one ligand-centred and one metal-centred.

30
Figure 9. Molecular orbital diagram for a tetrahedral ML4 complex [52].The possible ligand to metal charge transferences (LMCT) are showing by red arrows.

31
Figure 10. Molecular orbital diagram for octahedral ML8 complex [52]. The possible metal to ligand charge transferences (MLCT) are shown by red arrows.
In Figure 10, we can see the MLCT transitions for an octahedral complex,
which have occupied the t2g and eg* orbitals.
1.3.2.1. Ruthenium complexes
Ruthenium complexes and more specifically Ru (II) polypyridine complexes,
have been investigated in detail as they have important photochemical properties.
Some of their extraordinary properties are high chemical stability, reversible redox
activity, phosphorescent emission and long excited state lifetime [55, 56].
Ruthenium (II) is a d6 system and the polypyridine ligands have σ donor
orbital localised on the nitrogen atoms and π donor and π* acceptor orbital more or
less delocalised on aromatic rings (Figure 11).
32
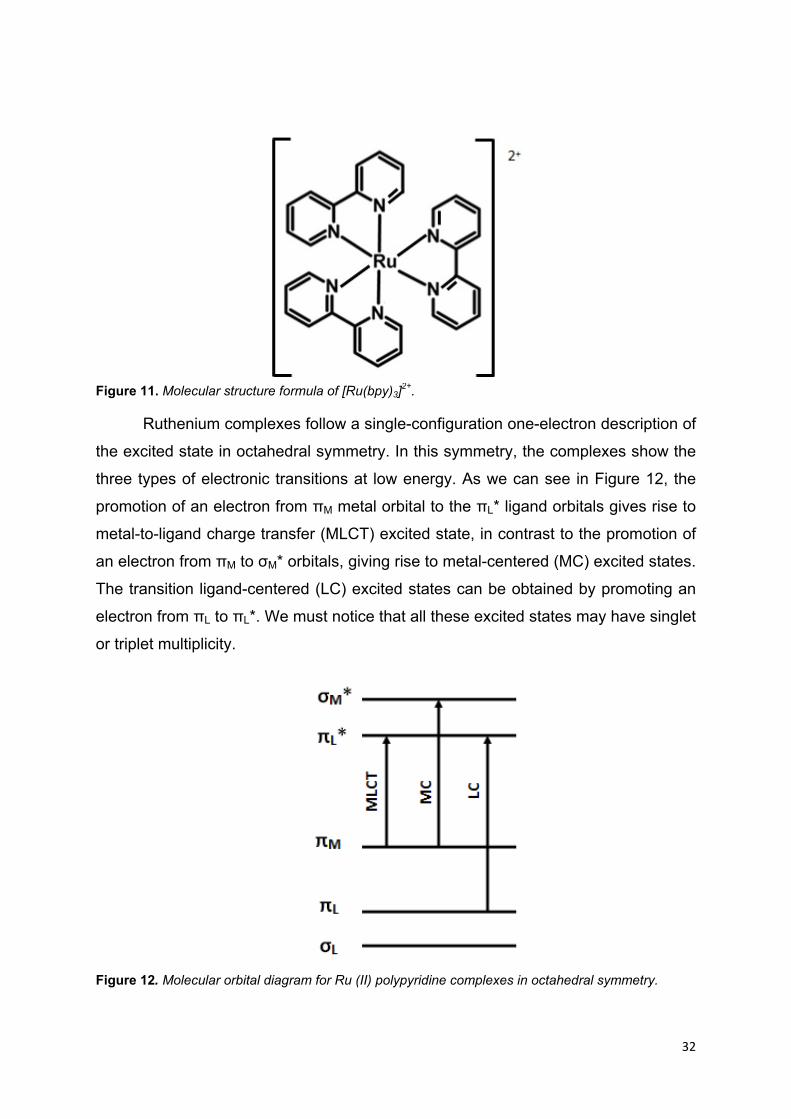
Figure 11. Molecular structure formula of [Ru(bpy)3]
2+.
Ruthenium complexes follow a single-configuration one-electron description of
the excited state in octahedral symmetry. In this symmetry, the complexes show the
three types of electronic transitions at low energy. As we can see in Figure 12, the
promotion of an electron from πM metal orbital to the πL* ligand orbitals gives rise to
metal-to-ligand charge transfer (MLCT) excited state, in contrast to the promotion of
an electron from πM to σM* orbitals, giving rise to metal-centered (MC) excited states.
The transition ligand-centered (LC) excited states can be obtained by promoting an
electron from πL to πL*. We must notice that all these excited states may have singlet
or triplet multiplicity.
Figure 12. Molecular orbital diagram for Ru (II) polypyridine complexes in octahedral symmetry.
33
For most of Ru (II) polypyridine complexes the lowest excited state is a 3MLCT level and thus exhibits relatively long lifetime and intense luminescent
emission.
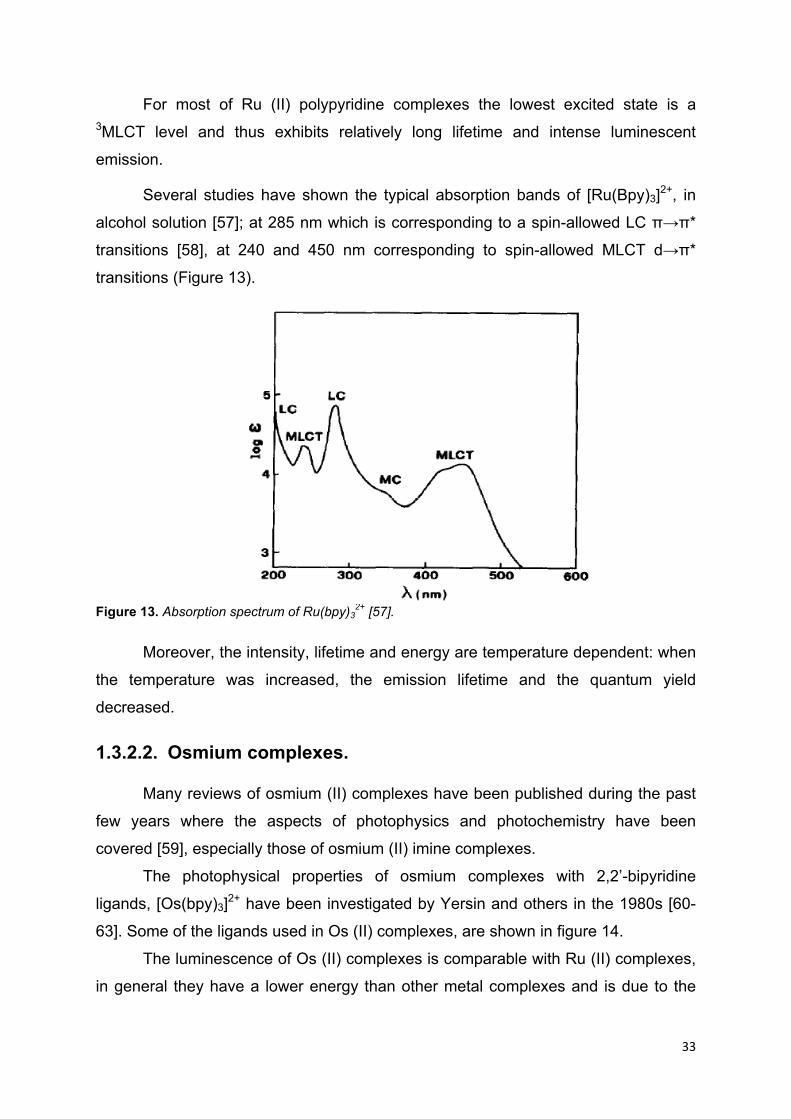
Several studies have shown the typical absorption bands of [Ru(Bpy)3]2+, in
alcohol solution [57]; at 285 nm which is corresponding to a spin-allowed LC π→π*
transitions [58], at 240 and 450 nm corresponding to spin-allowed MLCT d→π*
transitions (Figure 13).
Figure 13. Absorption spectrum of Ru(bpy)3
2+ [57].
Moreover, the intensity, lifetime and energy are temperature dependent: when
the temperature was increased, the emission lifetime and the quantum yield
decreased.
1.3.2.2. Osmium complexes.
Many reviews of osmium (II) complexes have been published during the past
few years where the aspects of photophysics and photochemistry have been
covered [59], especially those of osmium (II) imine complexes.
The photophysical properties of osmium complexes with 2,2’-bipyridine
ligands, [Os(bpy)3]2+ have been investigated by Yersin and others in the 1980s [60-
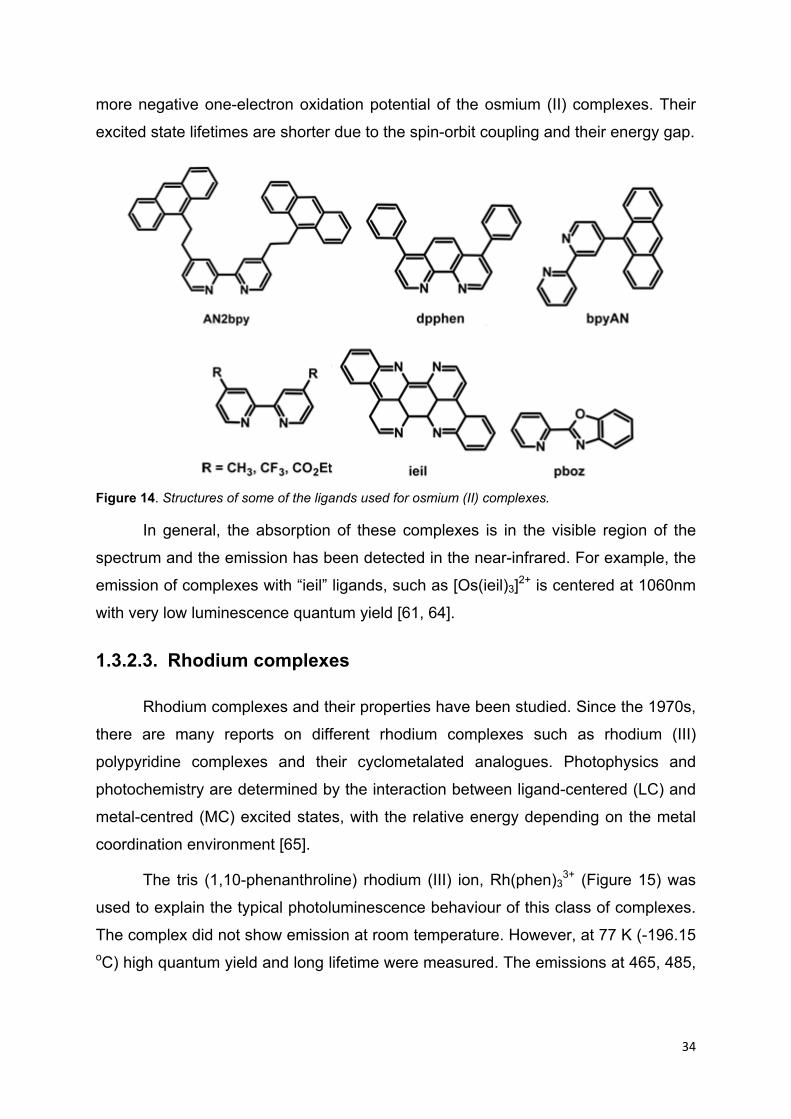
63]. Some of the ligands used in Os (II) complexes, are shown in figure 14.
The luminescence of Os (II) complexes is comparable with Ru (II) complexes,
in general they have a lower energy than other metal complexes and is due to the
34
more negative one-electron oxidation potential of the osmium (II) complexes. Their
excited state lifetimes are shorter due to the spin-orbit coupling and their energy gap.
Figure 14. Structures of some of the ligands used for osmium (II) complexes.
In general, the absorption of these complexes is in the visible region of the
spectrum and the emission has been detected in the near-infrared. For example, the
emission of complexes with “ieil” ligands, such as [Os(ieil)3]2+ is centered at 1060nm
with very low luminescence quantum yield [61, 64].
1.3.2.3. Rhodium complexes
Rhodium complexes and their properties have been studied. Since the 1970s,
there are many reports on different rhodium complexes such as rhodium (III)
polypyridine complexes and their cyclometalated analogues. Photophysics and
photochemistry are determined by the interaction between ligand-centered (LC) and
metal-centred (MC) excited states, with the relative energy depending on the metal
coordination environment [65].
The tris (1,10-phenanthroline) rhodium (III) ion, Rh(phen)33+ (Figure 15) was
used to explain the typical photoluminescence behaviour of this class of complexes.
The complex did not show emission at room temperature. However, at 77 K (-196.15 oC) high quantum yield and long lifetime were measured. The emissions at 465, 485,

35
524 and 571 nm were assigned to ligand-centred (LC) phosphorescence emission
from a π-π* triplet state localized on the phenanthroline ligands [66-68].
Figure 15. Molecular structure formula of [Rh(phen)3]
3+.
The temperature dependence can be explained on the basis of decay of the
ligand-centred (LC) triplet via a thermally activated process involving an upper metal-
centred (MC) state [59].
Binuclear rhodium complexes, which are both ligand-bridged species and
bridged metal-metal, show long lifetimes of luminescence as typical of a MLCT
excited state [56].
1.3.2.4. Platinum complexes
Platinum sits in group 10 of the periodic table, along with nickel and palladium.
The electronic configuration is d8, which by a simple ligand-field splitting diagram
(Figure 16), indicates that these metal ions have a thermodynamic preference to
form square planar complexes in the presence of strong-field ligands. This geometry
forces a single unoccupied orbital to high energies, while allowing the stabilisation of
three of the occupied orbitals [69]. Their square planar geometry influences directly
their photochemical and photophysical properties [56].

36
Figure 16. Ligand field-splitting diagram for metal d orbitals in a square planar complex.
Most of the metal ions, such as Ru (II), Os (II), Rh (II) and Ir (III), present an
octahedral symmetry. However, in the case of Pt (II), the complexes have a square-
planar geometry, which produces a very different photochemistry. The absorption or
luminescence are influenced by this square-planar nature in Pt (II) complexes.
As we can see in figure 16, the dx2
-y2 orbital is strongly antibonding; however,
if the orbital is populated with electrons by excitation, the molecule experiences a
significant distortion in the conformation of the excited state and Pt-Ligand bond
lengths increase. This is an unfavourable situation for luminescence from an excited
state, where non-radiative internal conversion or intersystem crossing to the ground
state can happen.
The 6-coordinate d6 complexes present a spherical profile, while ligands of Pt
(II) complexes are essentially flat and this allows close interactions, either with
identical complexes or with other molecules. The planar nature of the complexes
allow axial interactions, in other words interactions between the dz2 orbitals of two
platinum ions [70, 71]. From the point of view of optical spectroscopy and excited
states, this axial interaction implies that the highest occupied metal-based molecular
orbital has increased in energy, compared with the isolated molecules, so that the
lowest-energy optical transitions are shifted to even lower energies.

37
1.3.2.5. Iridium complexes
Iridium complexes were not very well known until twenty years ago. Today,
there are numerous papers where Ir (III) complexes and their luminescent properties
are discussed, as they present long lifetime and intense emission in the visible
region [56].
Most of the reported iridium complexes have cyclometalated ligands. One of
the main reason for iridium research is related to their use in organic light emitting
diode (OLED) fabrication [72].
The Ir (III) is 5d6 centred and the complexes are octahedral, as are Fe (II) [65],
Ru (II) [57], Os (II) [73] and Re (I) [74], whose metal centres are 3d6, 4d6, 5d6 and
5d6 respectively.
In Figure 17, we can see the orbital and state energy diagram for electronic
transitions in a polyimine complex of d6 metal centres.
Figure 17. Electronic transitions in a Ir (III) polyimine complexes [75].
The excitation is associated with electronic transitions from the ground state to
singlet levels of various natures and electronic localizations, such as ligand centered
(1LC), metal-centered (1MC) and metal to ligand charge transfer (1MLCT). On the
other hand, emission is from triplet levels, 3MLCT or 3LC [75]. This is a consequence

38
of the high spin-orbit coupling constant of the metal centres, which lead to a shift in
their energy levels.
As mentioned, the Ir (III) complexes are characterized by octahedral
geometry, where the ligand field splitting ∆ (Figure 18) is very large and the MC
levels are pushed so high in energy that normally they do not affect the emission
properties and just the MLCT and LC levels are emissive.
Figure 18. d orbitals in octahedral field.
1.3.2.6. Copper complexes
Copper metal has the advantage of wide availability. The abundance of the
copper metal makes it an interesting material from the photochemical and
photophysical point of view [54].
Copper is a d9 element, like silver (Ag) and gold (Au). This element has two
common oxidation states in solution: +1 and +2. The copper (I) complexes have
superior photochemical and photophysical properties than copper (II) complexes,
because the Cu (I) complexes have complete filling of d orbitals (d10). This electronic
configuration provides a symmetric localisation of the electronic charge and favours
the tetrahedral disposition of the ligands around the metal centre.
There are numerous reported copper complexes, some of the most important,
for their applications and properties, are the called heteroleptic diimine/diphosphine
copper complexes [Cu(NN)(PP)]+. These complexes contain N- and P- coordinating
ligands and they have been studied since the late 1970s [60]. Copper complexes
with two diimine ligands have been known as their luminescent properties [62],

39
however the substitution of one N-N ligand by one P-P ligand has improved the
emission and has received tremendous interest in recent years [61, 63].
A group of copper complexes were reported by Armaroli and co-workers,
[Cu(dbp)(POP)]+ (dbp = 2,9-butyl-1,10-phenanthroline and POP = bis[2-
(diphenylphosphino)phenyl]ether) (Figure 19), where the absorption spectra shows
a band above 350 nm, which is attributed to ligand-centred transitions (LC) and
another band between 350-450 nm, that is due to metal-ligand charge transfer
(MLCT) (Figure 20) [76].
Figure 19. Heteroleptic diimine/diphosphine copper complexes 1-3 [76].
Figure 20. Absorption spectra of copper complexes 1 (solid line), 2 (dashed line) and 3 (dotted line) at room temperature in a CH2Cl2 solution [76]
40
The geometry and the strong dependency on solvent and oxygen is playing
an important role in the study of the luminescence efficiency, as it can be decreased
by exciplex quenching [64]. Blue-shifts of the lower-energy bands were observed
compared to the spectra of the complexes with two diimine ligands [Cu(NN)2]+
(Figure 21) [61].
Figure 21. Emission spectra of copper complexes 1 (solid line), 2 (dashed line) and 3 (dotted line) at room temperature in a CH2Cl2 solution [61].
The intensive research for emission materials has produced numerous
studies of organometallic triplet emitters [77]. Most of these studies are centered on
the complexes of platinum (II) and iridium (III) as they have shown excellent
properties as triplet emitters, especially for application in OLEDs. However, these
materials are expensive and not sustainable for organic light emitting device
applications [78]. Recently, research has focused on new materials with similar
photoluminescence properties as iridium and platinum complexes. The d10 metals,
copper, silver and gold, have shown important optical properties [78] and efficiency,
such as the stable complexes of Cu(I) phenanthroline [79], Cu (I) acetylides [80],
Cu(I) diethynylbenzene [81], trinuclear Ag(I) alkynyl [82], mononuclear Au(I)
containing carbine, phosphine, thiolate and acetylide ligands [83] or dinuclear Au(I)
diarylalkynyl [83] . Most of the copper and silver complexes have been made with
acetylide ligands because these transition metals possess versatile reactivity and
easily coordinate to them [84].
A collection of copper complexes has been prepared following different
strategies in order to improve their photoluminescence quantum efficiency. These
strategies have tried to involve suppressing non-radiative decay caused by distortion
41
of the excited states of the copper complexes [85-87]. The synthesised complexes
have a variety of ligands in order to provide a range of colours of the emission [88].
Some of them are polynuclear complexes, that have been reported to have
interesting optical properties which are due to their metal-metal interaction and their
rigid structure, such as the pyridine and phosphine ligands [79, 89] which prevent
structural relaxation, giving a stable structure and promote radiative decay. The
fluoro substituents on the complexes have shown the ability to tune the colour of the
emission in previous studies [90].
There is an increasing interest in the synthesis of alkynyl metal complexes
because of their potential applications as nonlinear optical materials [91]. The
interest in transition metal alkynyl complexes is based on two chemical aspects of
the acetylide groups: their coordinated reactivity and their ability to coordinate to
transition metals [84]. They have a linear geometry, where the sp hybridised carbons
give increased linearity to the -C≡C- unit with an angle of 180o [72] and extended π-
electrons delocalization [88]. The C≡C bonds are part of a reactivity study, because
of the formation of cluster compounds, in which the alkynyl ligands bridges multiple
metal centres and the ligand is transformed into a vinylidene, allenylidene or
cummulenylidene [82]. Many alkynyl complexes have been reported over the past
few years, such as Au2(dppm)2(SO3CF3)2 (dppm: diphenylphosphino methane) [92],
[Pt2(μ-dppm)2(μ-C≡CR)(C≡CR)2]+ [88], alkynyl polynuclear complexes with copper,
rhenium, silver and platinum [81], [Cu3(μ3-η1-C≡CPh)(μ-dppm)3](BF4)2, [Cu3(μ3-η
1-
C≡CPh2)2(μ-dppm)3]BF4, [Cu3(μ3-η1-C≡CPh)(μ3-Cl)(μ-dppm)3]BF4 [84], [Cu3(μ-
PNP)3(μ3-η1-C≡CR’)2 (PNP: bid(diphenylphosphino)-alkyl/-aryl amine) [91] and
[Au(C≡CR)L] (L:PPh3, R:Me, Et, Ph, CF3; L: P(C6H4Me-p)3, R: Ph) [93].
In recent years, there has been an increasing need to extend this area of
research, in order to produce novel mononuclear coordinated complexes that are
able to exhibit long excited-state lifetimes, reversible redox behaviour and stability
toward photodecomposition [72].
1.3.2.7. Gold complexes
In 1970, the first gold complex was reported [94], when the
photoluminescence of the complex [Au(PPh3)Cl] was studied. Since that publication,

42
the attention to gold (I) complexes has been growing, particularly the interaction of
Au-Au and their photophysical properties.
The presence of the heavy metal in the complexes promotes the intersystem
crossing. The heavy-atom effect contributes to the photo excitation of the singlet
excited states and access to the spin-forbidden triplet states and as a result these
complexes show phosphorescence.
In gold (I) complexes, such as [Au2(dmpm)2](ClO4)2 (dmpm =
bis(dimethylphosphino)methane) and [Au3(dmmp)2](ClO4)3 (dmmp =
bis(dimethylphosphinomethyl)phenylphosphine), the role of structure of the
complexes is very important [95, 96]. Both complexes are phosphorescent, the bi-
nuclear and tri-nuclear gold complexes show two main wavelength maximums that
are in the emission spectrum, 455nm, τo = 1.2 μs and 467 nm, τo = 1.6 μs
respectively, which was suggested to originate from an excited state of intraligand
character, while at 555 nm, τo = 2.8 μs and 580 nm, τo = 7.0 μs respectively, which
are phosphorescent but indicate reduced dσ*-pσ and dδ*-pσ energy gaps, Figure 22.
The effect of aurophilic distance on the HOMO-LUMO energy gap reduces the
energy gap and as a consequence they shift their emission to red or longer
wavelength.
Figure 22. Schematic molecular orbital diagram of gold (I) phosphine complexes [72].
43
Another important group of gold complexes are those coordinated alkynyl
ligands. It is due to the linear two-coordinate geometry of gold (I) [81].
Gold (I) alkynyl complexes are known to show interesting luminescence.
They show an intramolecular Au-Au distance of 3.153 Å [97]. One of the first
reported gold (I) alkynyl complexes was [Au2(dppe)(C≡CPh) 2], with a
phosphorescent emission at 420nm in dichloromethane at 298K and a solid-state
emission at 550 nm at 298K (24.85 oC), which is characteristic to the [(dδ*)1(pσ)1]
phosphorescence. While the related complex [Au3(dppm)2(C≡CPh)2], which
possesses an intramolecular Au-Au distances of 3.167 Å, shows a phosphorescent
emission at 425 and 600 nm in MeCN at 298 K (24.85 oC) [98]. The aurophilic
distances in the solid state structure of gold (I) complexes play an important role in
perturbing the luminescence.

44
1.4. References
1. Organic light emitting devices, synthesis, properties and applications, ed.
K.M.a.U. Scherf. 2006: Wiley-VCH pubs.
2. Geffroy, B., P. le Roy, and C. Prat, Organic light-emitting diode (OLED)
technology: materials, devices and display technologies. Polymer
International, 2006. 55(6): p. 572-582.
3. Tang, C.W. and S.A. VanSlyke, Organic electroluminescent diodes. Applied
Physics Letters, 1987. 51(12): p. 913-915.
4. Lim, J.T., et al., White-light-emitting devices based on organic multilayer
structure. Current Applied Physics, 2002. 2(4): p. 295-298.
5. Yang, H., et al., White organic light-emitting devices with non-doped-type
structure. Displays, 2006. 27(4–5): p. 183-186.
6. Lee, Y.-J., et al., Study of thermal degradation of organic light emitting device
structures by X-ray scattering. Thin Solid Films, 2007. 515(14): p. 5674-5677.
7. Baldo, M.A., et al., Highly efficient phosphorescent emission from organic
electroluminescent devices. Nature, 1998. 395(6698): p. 151-154.
8. Pereira, L., Organic light emitting diodes. The use of rare earth and transition
metals. 2012, USA: Pan Stanford Publishing Pte. Ltd. 364.
9. So, F. and D. Kondakov, Degradation Mechanisms in Small-Molecule and
Polymer Organic Light-Emitting Diodes. Advanced Materials, 2010. 22(34): p.
3762-3777.
10. Lee, T.W., et al., Self-Organized Gradient Hole Injection to Improve the
Performance of Polymer Electroluminescent Devices. Advanced Functional
Materials, 2007. 17(3): p. 390-396.
11. Kuwabara, Y., et al., Thermally stable multilared organic electroluminescent
devices using novel starburst molecules, 4,4′,4″-Tri(N-
carbazolyl)triphenylamine (TCTA) and 4,4′,4″-Tris(3-
methylphenylphenylamino)triphenylamine (m-MTDATA), as hole-transport
materials. Advanced Materials, 1994. 6(9): p. 677-679.
12. Huang, C.J., et al., Improvement of color purity and electrical characteristics
by co-doping method for flexible red-light organic light emitting devices.
Displays, 2009. 30(4–5): p. 164-169.

45
13. P. Coppo, R.F., E. Galoppini, A. Maldotti, M.A. Miranda, K. Mizuno, J.S.
Seixas de Melo, N. Serpone, T. Tsuno, Photochemistry, ed. A. Albini. 2009.
14. F. So, J.K.a.P.B., Organic light-emitting devices for solid-state lighting. MRS.
Bulleting, 2008. 33: p. 663-669.
15. Chiang, C.-J., et al., Mechanical modeling of flexible OLED devices. Organic
Electronics, 2009. 10(7): p. 1268-1274.
16. Shinar, J., Organic light-emitting devices : a survey. 2002, New York ;
London: Springer.
17. Highly efficient OLEDs with phosphorescent materials., ed. H. Yersin. 2008:
Wiley-VCH pubs.
18. Li, Z.R. and H. Meng, Organic light-emitting materials and devices. 2007,
Boca Raton, FL.: CRC Press ; London : Taylor & Francis [distributor].
19. Kawashima, T., H. Matsui, and N. Tanabe, New transparent conductive films:
FTO coated ITO. Thin Solid Films, 2003. 445(2): p. 241-244.
20. Schmidt, N.W., et al., Effects of substrate temperature and near-substrate
plasma density on the properties of dc magnetron sputtered aluminum doped
zinc oxide. Journal of Applied Physics, 2003. 94(9): p. 5514-5521.
21. Okamoto, Y. and W. Brenner, Organic semiconductors. 1964, New York:
Reinhold ; London : Chapman & Hall.
22. Kafafi, Z.H.E., Organic light-emitting materials and devices IV. 2001: SPIE.
23. Borsenberger, P.M., Hole Transport in Bis (4-N,N-Diethylamino-2-
Methylphenyl)-4-Methylphenylmethane Doped Polymers. physica status solidi
(b), 1992. 173(2): p. 671-680.
24. P.M., B.W.T., Gruenbaum; E.H., Magin., Hole Transport in Vapor-Deposited
Triphenylmethane Glasses. Jpn. J. Appl. Phys., 1996. 35.
25. Higuchi, M., et al., First Synthesis of Phenylazomethine Dendrimer Ligands
and Structural Studies. Journal of the American Chemical Society, 2001.
123(19): p. 4414-4420.
26. Higuchi, M., et al., Control of Stepwise Radial Complexation in Dendritic
Polyphenylazomethines. Journal of the American Chemical Society, 2003.
125(33): p. 9988-9997.
27. Kimoto, A., et al., Synthesis of Asymmetrically Arranged Dendrimers with a
Carbazole Dendron and a Phenylazomethine Dendron. Macromolecules,
2004. 37(15): p. 5531-5537.

46
28. Cho, J.-S., et al., Synthesis of Diphenylamine-Substituted Phenylazomethine
Dendrimers and the Performance of Organic Light-Emitting Diodes.
Macromolecular Chemistry and Physics, 2005. 206(6): p. 635-641.
29. Schols, S. and SpringerLink (Online service), Device architecture and
materials for organic light-emitting devices targeting high current densities and
control of the triplet concentration. 2011, Springer Science+Business Media
B.V.: Dordrecht. p. xv, 154 p.
30. Tang, C.W., Two-layer organic photovoltaic cell. Applied Physics Letters,
1986. 48(2): p. 183-185.
31. Kozlov, V.G., et al., Laser action in organic semiconductor waveguide and
double-heterostructure devices. Nature, 1997. 389(6649): p. 362-364.
32. K. Kudi, M.Y., and T. Morisumi, Field effect measurement of organic dye films.
Jpn. J. Appl. Phys., 1984. 23: p. 130.
33. Pope, M. and C.E. Swenberg, Electronic processes in organic crystals and
polymers. 2nd ed. 1999, New York ; Oxford: Oxford University Press. xxix,
1328 p.
34. Lanzani, G., Photophysics of molecular materials : from single molecules to
single crystals. 2006, Weinheim: Wiley-VCH ; Chichester : John Wiley
[distributor].
35. Warta, W. and N. Karl, Hot holes in naphthalene: High, electric-field-
dependent mobilities. Physical Review B, 1985. 32(2): p. 1172-1182.
36. Karl, N. and J. Marktanner, Electron and Hole Mobilities in High Purity
Anthracene Single Crystals. Molecular Crystals and Liquid Crystals Science
and Technology. Section A. Molecular Crystals and Liquid Crystals, 2001.
355(1): p. 149-173.
37. Podzorov, V., et al., Hall Effect in the Accumulation Layers on the Surface of
Organic Semiconductors. Physical Review Letters, 2005. 95(22): p. 226601.
38. Ostroverkhova, O., et al., Ultrafast carrier dynamics in pentacene,
functionalized pentacene, tetracene, and rubrene single crystals. Applied
Physics Letters, 2006. 88(16): p. 162101-162101-3.
39. Le Comber, P.G. and W.E. Spear, Electronic Transport in Amorphous Silicon
Films. Physical Review Letters, 1970. 25(8): p. 509-511.

47
40. Horowitz, G., R. Hajlaoui, and P. Delannoy, Temperature Dependence of the
Field-Effect Mobility of Sexithiophene. Determination of the Density of Traps.
J. Phys. III France, 1995. 5(4): p. 355-371.
41. Mottaghi, M. and G. Horowitz, Field-induced mobility degradation in
pentacene thin-film transistors. Organic Electronics, 2006. 7(6): p. 528-536.
42. Bässler, H., Charge Transport in Disordered Organic Photoconductors a
Monte Carlo Simulation Study. physica status solidi (b), 1993. 175(1): p. 15-
56.
43. Vissenberg, M.C.J.M. and M. Matters, Theory of the field-effect mobility in
amorphous organic transistors. Physical Review B, 1998. 57(20): p. 12964-
12967.
44. Yen, W.M., S. Shionoya, and H.F. Yamamoto, Phosphor handbook. 2nd ed. /
edited by William M. Yen, Shigeo Shionoya, Hajime Yamamoto. ed. 2007,
Boca Raton, Fla.: CRC ; London : Taylor & Francis [distributor].
45. Lichtman, J.W. and J.-A. Conchello, Fluorescence microscopy. Nat Meth,
2005. 2(12): p. 910-919.
46. Thoms, T., et al., Improved host material design for phosphorescent guest–
host systems. Thin Solid Films, 2003. 436(2): p. 264-268.
47. Olsen, E.D., Modern optical methods of analysis. 1975, New York: McGraw-
Hill. ix, 629 p.
48. Coordination Chemistry : Vol. 1. 1971, New York ; London: Van Nostrand
Reinhold.
49. Krasovitskii, B.M. and B.M. Bolotin, Organic luminescent materials. 1988:
VCH.
50. Rao, C.N.R., Ultra-violet and visible spectroscopy : chemical applications. 3rd
ed. ed. 1975, London: Butterworth.
51. Hernandez-Hernandez, L., Gonzalez-Perez, C., Introduccion al analisis
instrumental. 1st ed. 2002, Barcelona: Editorial Ariel S.A.
52. Lee, J.D., Concise inorganic chemistry. 5th ed. ed. 1996, London: Chapman &
Hall.
53. Sharpe, A.G., Inorganic chemistry. 1981, London: Longman.
54. Balzani, V., S. Campagna, and G. Accorsi, Photochemistry and photophysics
of coordination compounds I. 2007, Berlin: Springer.

48
55. Balzani, V., et al., Luminescent and Redox-Active Polynuclear Transition
Metal Complexes†. Chemical Reviews, 1996. 96(2): p. 759-834.
56. P. Coppo, R.F., E. Galoppini, A. Maldotti, M.A. Miranda, K. Mizuno, J.S.
Seixas de Melo, N. Serpone, T. Tsuno, Photochemistry. 1st ed, ed. A. Albini.
Vol. 37. 2009, Cambridge, UK: RSC Publishins.
57. Juris, A., et al., Ru(II) polypyridine complexes: photophysics, photochemistry,
eletrochemistry, and chemiluminescence. Coordination Chemistry Reviews,
1988. 84(0): p. 85-277.
58. Lytle, F.E. and D.M. Hercules, Luminescence of tris(2,2'-
bipyridine)ruthenium(II) dichloride. Journal of the American Chemical Society,
1969. 91(2): p. 253-257.
59. Indelli, M.T., A. Carioli, and F. Scandola, Excited-state absorption of
tris(phenanthroline)rhodium(III). A handle on the excited-state behavior of a
powerful photochemical oxidant. The Journal of Physical Chemistry, 1984.
88(13): p. 2685-2686.
60. Buckner, M.T. and D.R. McMillin, Photoluminescence from copper(I)
complexes with low-lying metal-to-ligand charge transfer excited states.
Journal of the Chemical Society, Chemical Communications, 1978(17): p.
759-761.
61. Cuttell, D.G., et al., Simple Cu(I) Complexes with Unprecedented Excited-
State Lifetimes. Journal of the American Chemical Society, 2001. 124(1): p. 6-
7.
62. Lowry, M.S. and S. Bernhard, Synthetically Tailored Excited States:
Phosphorescent, Cyclometalated Iridium(III) Complexes and Their
Applications. Chemistry – A European Journal, 2006. 12(31): p. 7970-7977.
63. McCormick, T., W.-L. Jia, and S. Wang, Phosphorescent Cu(I) Complexes of
2-(2‘-pyridylbenzimidazolyl)benzene: Impact of Phosphine Ancillary Ligands
on Electronic and Photophysical Properties of the Cu(I) Complexes. Inorganic
Chemistry, 2005. 45(1): p. 147-155.
64. Palmer, C.E.A., et al., Flash photolysis and quenching studies of copper(I)
systems in the presence of Lewis bases: inorganic exciplexes? Inorganic
Chemistry, 1987. 26(19): p. 3167-3170.
65. Braterman, P.S., J.I. Song, and R.D. Peacock, Electronic absorption spectra
of the iron(II) complexes of 2,2'-bipyridine, 2,2'-bipyrimidine, 1,10-

49
phenanthroline, and 2,2':6',2''-terpyridine and their reduction products.
Inorganic Chemistry, 1992. 31(4): p. 555-559.
66. Carstens, D.H.W. and G.A. Crosby, Luminescence from complexes of
rhodium(III). Journal of Molecular Spectroscopy, 1970. 34(1): p. 113-135.
67. Crosby, G.A. and W.H. Elfring, Excited states of mixed ligand chelates of
ruthenium(II) and rhodium(III). The Journal of Physical Chemistry, 1976.
80(20): p. 2206-2211.
68. Hillis, J.E. and M.K. DeArmond, Nonradiative processes in transition metal
complexes: Luminescence data for Rh (III) and Ir (III) complexes. Journal of
Luminescence, 1971. 4(4): p. 273-290.
69. Houlding, V.H. and V.M. Miskowski, The effect of linear chain structure on the
electronic structure of pt(II) diimine complexes. Coordination Chemistry
Reviews, 1991. 111(0): p. 145-152.
70. Keller, H.J., Chemistry and physics of one-dimensional metals. 1977, New
York: Plenum Press.
71. Miller, J.S., Extended linear chain compounds. 1982, London ; New York:
Plenum.
72. Balzani, V., S. Campagna, and A. Barbieri, Photochemistry and photophysics
of coordination compounds II. 2007, Berlin: Springer.
73. Kober, E.M., et al., Application of the energy gap law to excited-state decay of
osmium(II)-polypyridine complexes: calculation of relative nonradiative decay
rates from emission spectral profiles. The Journal of Physical Chemistry,
1986. 90(16): p. 3722-3734.
74. Schanze, K.S., et al., Studies of intramolecular electron and energy transfer
using the fac-(diimine)ReI(CO)3 chromophore. Coordination Chemistry
Reviews, 1993. 122(1–2): p. 63-89.
75. Yersin, H. and K.L. Bray, Transition metal and rare earth compounds : excited
states, transitions, interactions: Berlin ; London : Springer, c2001-.
76. Armaroli, N., et al., Highly Luminescent CuI Complexes for Light-Emitting
Electrochemical Cells (Adv. Mater. 10/2006). Advanced Materials, 2006.
18(10): p. n/a-n/a.
77. Prokhorov, A.M., et al., 2,2[prime or minute]-Bipyridinyl carboranes as B,N,N-
ligands in cyclometallated complexes of platinum(ii). Chemical
Communications, 2011. 47(27): p. 7713-7715.
50
78. Barbieri, A., G. Accorsi, and N. Armaroli, Luminescent complexes beyond the
platinum group: the d10 avenue. Chemical Communications, 2008(19): p.
2185-2193.
79. Zhang, Q., et al., Highly Efficient Green Phosphorescent Organic Light-
Emitting Diodes Based on CuI Complexes. Advanced Materials, 2004. 16(5):
p. 432-436.
80. Yam, V.W.-W., K. Kam-Wing Lo, and K. Man-Chung Wong, Luminescent
polynuclear metal acetylides. Journal of Organometallic Chemistry, 1999.
578(1–2): p. 3-30.
81. Yam, V.W.-W., Luminescent metal alkynyls – from simple molecules to
molecular rods and materials. Journal of Organometallic Chemistry, 2004.
689(8): p. 1393-1401.
82. Long, N.J. and C.K. Williams, Metal Alkynyl σ Complexes: Synthesis and
Materials. Angewandte Chemie International Edition, 2003. 42(23): p. 2586-
2617.
83. Evans, R.C., P. Douglas, and C.J. Winscom, Coordination complexes
exhibiting room-temperature phosphorescence: Evaluation of their suitability
as triplet emitters in organic light emitting diodes. Coordination Chemistry
Reviews, 2006. 250(15–16): p. 2093-2126.
84. Diez, J., et al., Synthesis and characterization of triangulo copper(I)
complexes containing mono- and bicapping systems of asymmetric .mu.3-
.eta.1-acetylide ligands: molecular structures of [Cu3(.mu.3-.eta.1-
C.tplbond.CPh)(.mu.-dppm)3][BF4]2, [Cu3(.mu.3-.eta.1-
C.tplbond.CPh)2(.mu.-dppm)3][BF4], and [Cu3(.mu.3-.eta.1-
C.tplbond.CPh)(.mu.3-Cl)(.mu.-dppm)3][BF4] [dppm =
bis(diphenylphosphino)methane]. Organometallics, 1993. 12(6): p. 2213-
2220.
85. Hou, R., et al., Synthesis, structural characterization and luminescent
properties of a series of Cu(i) complexes based on polyphosphine ligands.
Dalton Transactions, 2011. 40(29): p. 7551-7558.
86. Min, J., et al., Neutral copper(i) phosphorescent complexes from their ionic
counterparts with 2-(2[prime or minute]-quinolyl)benzimidazole and phosphine
mixed ligands. Dalton Transactions, 2011. 40(3): p. 686-693.

51
87. Wada, A., et al., Efficient luminescence from a copper(i) complex doped in
organic light-emitting diodes by suppressing C-H vibrational quenching.
Chemical Communications, 2012. 48(43): p. 5340-5342.
88. Yam, V.W.-W., Molecular Design of Transition Metal Alkynyl Complexes as
Building Blocks for Luminescent Metal-Based Materials: Structural and
Photophysical Aspects. Accounts of Chemical Research, 2002. 35(7): p. 555-
563.
89. Armaroli, N., et al., Highly Luminescent CuI Complexes for Light-Emitting
Electrochemical Cells. Advanced Materials, 2006. 18(10): p. 1313-1316.
90. Coppo, P., E.A. Plummer, and L. De Cola, Tuning iridium(iii) phenylpyridine
complexes in the "almost blue" region. Chemical Communications, 2004(15):
p. 1774-1775.
91. Yam, V.W.-W., W.K.-M. Fung, and M.-T. Wong, Synthesis, Photophysics,
Electrochemistry, and Excited-State Redox Properties of Trinuclear Copper(I)
Acetylides with Bis(diphenylphosphino)alkylamines and -arylamines as
Bridging Ligands. Organometallics, 1997. 16(8): p. 1772-1778.
92. Ma, Y., et al., High Luminescence Gold(I) and Copper(I) Complexes with a
Triplet Excited State for Use in Light-Emitting Diodes. Advanced Materials,
1999. 11(10): p. 852-857.
93. Cheung, K.-L., S.-K. Yip, and V.W.-W. Yam, Synthesis, characterization,
electrochemistry and luminescence studies of heterometallic gold(I)–
rhenium(I) alkynyl complexes. Journal of Organometallic Chemistry, 2004.
689(24): p. 4451-4462.
94. Ziolo, R.F., S. Lipton, and Z. Dori, The photoluminescence of phosphine
complexes of d10 metals. Journal of the Chemical Society D: Chemical
Communications, 1970(17): p. 1124-1125.
95. Yam, V.W.-W., T.-F. Lai, and C.-M. Che, Novel luminescent polynuclear
gold(I) phosphine complexes. Synthesis, spectroscopy, and X-ray crystal
structure of [Au3(dmmp)2]3+[dmmp =
bis(dimethylphosphinomethyl)methylphosphine]. Journal of the Chemical
Society, Dalton Transactions, 1990(12): p. 3747-3752.
96. Yam, V.W.-W. and W.-K. Lee, Synthesis, spectroscopy and excited-state
redox properties of novel luminescent trinuclear three-co-ordinate gold(I)

52
phosphine complexes. Journal of the Chemical Society, Dalton Transactions,
1993(14): p. 2097-2100.
97. Li, D., et al., Luminescent gold(I) acetylide complexes. Photophysical and
photoredox properties and crystal structure of [{Au(C[triple bond, length half
m-dash]CPh)}2([small micro]-Ph2PCH2CH2PPh2)]. Journal of the Chemical
Society, Dalton Transactions, 1993(19): p. 2929-2932.
98. Che, C.-M., et al., Luminescent metal clusters. Spectroscopic properties and
X-ray structure of a trinuclear gold(I) complex containing
bis(diphenylphosphino)methane and phenylacetylide. Polyhedron, 1994.
13(6–7): p. 887-890.

53
Chapter 2: Procedures for synthesis of trinuclear
and mononuclear copper (I) complexes

54
2.1. Experimental procedures
All the chemical were purchased from Sigma Aldrich, Fisher Scientific and
Acros Organic, with the highest purity commercially available and used without
further purification.
NMR were recorded on a JEOL 400 MHz spectrometer using the resonance
peak of the solvent as an internal reference.
2.2. Synthesis of trinuclear copper (I) complexes
A range of trinuclear copper (I) complexes were prepared following the
procedure described in the literature [1], as shown in Figure 23. The synthesis of
these complexes involves two steps:
Step 1:
To a dichloromethane solution (20 ml) was added tetrakis (acetonitrile)
copper (I) hexafluoroborate (0.314 g; 1 mmol), [Cu(NCCH3)4(BF4) and
bis(diphenylphosphine) methane (µ-dppm) (1 mmol) . The reaction was stirred at
room temperature for 6 hours. The obtained precursor was labelled as 1.
Step 2: To a dichloromethane solution (20 ml) of the complex 1(0.87 mmol) , the
corresponding alkynyl ligand R (1.17 mmol) was added (Figure 24). The reaction
was stirred at room temperature for 24 hours under inert atmosphere. The crude
products were purified by precipitating twice in mixtures of hexane and diethyl ether.
The products were vacuum filtered and allowed to dry in air. They were labelled 2-8.
The yields of the reactions are shown in Table 1.

55
Table 1. Yield of the labelled complexes 2 to 8.
Complex Yield / %
1 89.0
2 98.8
3 72.1
4 30.2
5 34.1
6 92.9
7 63.1
8 40.0
The obtained products were characterized by:
1H NMR analysis in CDCl3.
Complex 2: 7.13 (dt, 2H, J1=8.7 Hz, J2 = 2.3 Hz); 6.99-7.09 (m, 36H); 6.92
(dt, 2H, J1=8.7 Hz, J2=2.3 Hz); 6.79 (t, 24H, J=7.5 Hz); 3.12 ppm (s, 6H).
Complex 3: 7.04-7.11 (m, 36H); 6.95 (tt, 2H, J1=8.9 Hz, J2=2.3 Hz); 6.86 (t,
24H, J=7.5 hz); 6.77 (td, 4H, J1=5.9 Hz, J2=2.3 Hz); 3.08 ppm (s, 6H).
Complex 4: 8.01 (s, 2H); 7.45 (s, 4H); 7.01-7.19 (m, 36H); 6.90 (t, 24H, J=7.5
Hz); 3.11 ppm (s, 6H).
Complex 5: 7.69 (d, 4H, J=8.0 Hz); 7.37 (d, 4H, J=8.0 Hz); 7.05-7.11 (m,
36H); 6.83 (t, 24H, J=7.5 Hz), 3.10 ppm (s, 6H).
Complex 6: 9.02 (d, 2H, J=8.3 Hz); 8.93 (d, 2H, J=8.5 Hz); 8.00 (t, 2H, J=7.5
Hz); 7.92 (s, 2H); 7.88 (t, 2H, J=7.5 Hz); 7.66 (d, 2H, J=8.0 Hz); 7.61 (t, 2H,
J=7.5 Hz); 6.98-7.08 (m, 36H); 6.69 (t, 24H, J=7.5 Hz); 3.17 ppm (s, 6H).
Complex 7: 8.05 (d, 2H, J=8.3 Hz); 7.97(d, 2H, J=8.3Hz); 7.86 (s, 2H); 7.68
(d, 2H, J=8.3 Hz); 7.58 (d, 2H, J=8.4 Hz); 7.36 (s, 2H); 3.90 (s, 6H); 3.09 ppm
(s, 6H).
19F NMR analysis in CDCl3.
Complex 2: -105.36; -107.04; -154.31ppm.

56
Complex 3: -108.78; -154.69 ppm.
Complex 4: -62.15; -151.25 ppm.
Complex 5: -62.23; -154.31 ppm.
13C in CDCl3.
Complex 2: 162.86 (C-F); 161.91 (C-F);134.62; 132.71; 132.34; 129.88;
128.30; 111.90;104.60; 27.34 ppm.
Complex 3: 163.20 (C-F); 132.62; 132.11; 130.19; 128.51; 113.90; 103.85;
27.54 ppm.
Complex 4: 133.27; 132.27; 131.01; 130.06; 128.93; 128.68; 126.95; 125.24;
124.24; 123.94; 122.72; 121.51; 118.79; 26.28 ppm.
Complex 5: 132.67; 132.21; 131.31; 130.39; 130.11; 129.98; 129.10 (C-F);
128.46; 125.77; 27.60 ppm.
Complex 6: 132.77; 132.12; 131.68; 131.33; 130.88; 130.31; 129.77; 128.96;
128.43; 128.10; 127.94; 127.84; 127.73; 127.53; 123.40;121.99; 26.44 ppm.
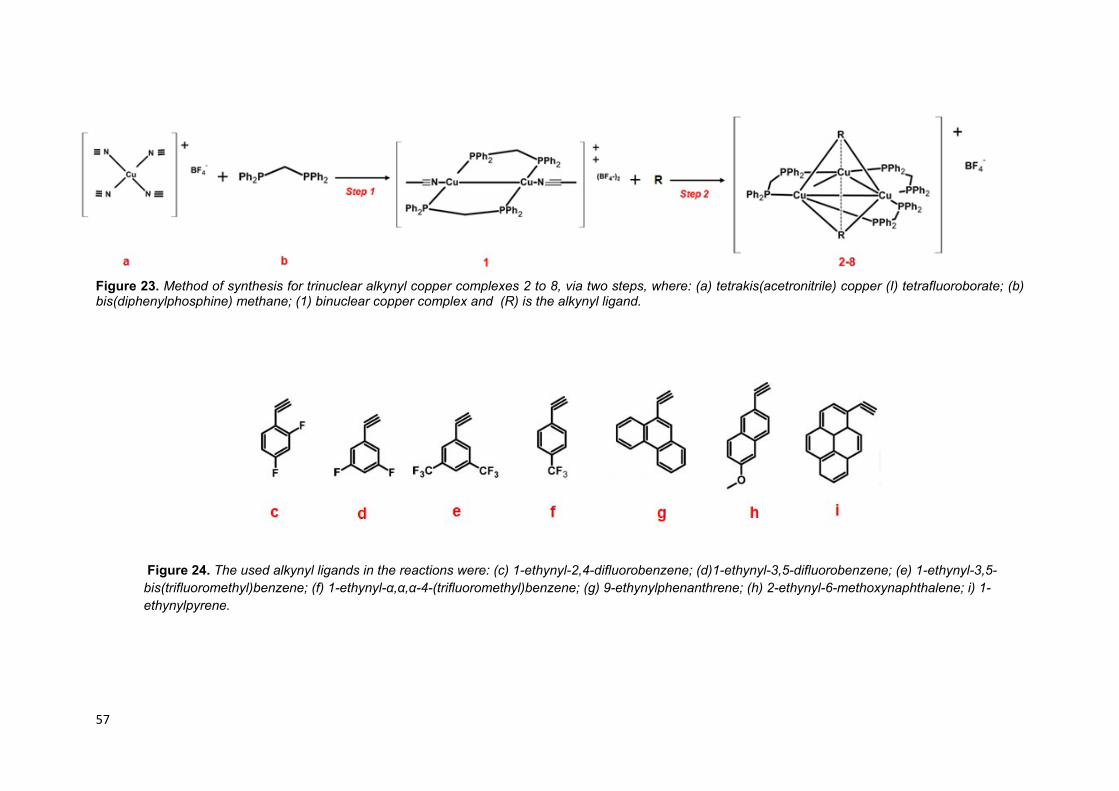
57
Figure 23. Method of synthesis for trinuclear alkynyl copper complexes 2 to 8, via two steps, where: (a) tetrakis(acetronitrile) copper (I) tetrafluoroborate; (b) bis(diphenylphosphine) methane; (1) binuclear copper complex and (R) is the alkynyl ligand.
Figure 24. The used alkynyl ligands in the reactions were: (c) 1-ethynyl-2,4-difluorobenzene; (d)1-ethynyl-3,5-difluorobenzene; (e) 1-ethynyl-3,5-bis(trifluoromethyl)benzene; (f) 1-ethynyl-α,α,α-4-(trifluoromethyl)benzene; (g) 9-ethynylphenanthrene; (h) 2-ethynyl-6-methoxynaphthalene; i) 1-ethynylpyrene.

56
2.2.1. Other ligands
Other alkynyl ligands and phosphine ligand, Figure 25, were employed for the
synthesis of trinuclear copper complexes [2-6], however the lack of emission
indicated poor reactivity.
Figure 25. Other alkynyl ligands and phosphine ligand: (a) ethylbenzene; (b) 1-ethynyl 2-fluorobenzene; (c) 1-ethynylpyridine; (d) 4-ethynyl-N,N-dimethylaniline; (e) 1,4-diethynylbencene; (f) 1,3-diethynylbenzene; (g) (4-ethynyl)phenylacetronitrile and (h) bis(2-diphenylphosphinophenyl)ether.
2.3. Synthesis of mononuclear copper (I) complexes
A range of mononuclear copper (I) complexes were synthesized via one step
following the method published by Min [7], Figure 26. To a dichloromethane solution
(10 ml) of the bipyridyl ligand (1 mmol) and the diphosphine ligand (1 mmol;
thriphenylphosphine 2 mmol) was added tetrakis (acetonitrile) copper(I)
tetrafluoroborate (0.314g; 1 mmol). The reaction was stirred at room temperature for
1 hour in air. The crude products were purified by precipitating twice in mixtures of
hexane and diethyl ether. The products were vaccum filtered and allowed to dry in
air. They were labelled 9-16. In the bipyridine ligand, for the complexes 9, 12 and
14, R1 and R2 is H; for complexes 10, 13 and 15, R1 is H and R2 is CH3; for
complexes 11 and 16 R1 is CH3 and R2 is H .The yields of the reactions are shown in
Table 2.

59
Table 2. Yield of the labelled complexes 9 to 16.
Complex Yield / %
9 95.0
10 84.5
11 74.0
12 33.6
13 61.2
14 66.3
15 88.3
16 53.0
The obtained products were characterised by:
1H NMR analysis in CDCl3.
Complex 9: 8.42 (d, 2H, J = 3.9 Hz, pyr.); 8.33 (d, 2H, J = 8.0 Hz, pyr.); 8.00
(t, 2H, J = 7.8 Hz pyr.); 7.20-7.31 (m, 8H, arom.); 7.16 (t, 8H, J = 7.3 Hz,
arom.); 7.02 (d, 2H, J = 7.7 Hz, pyr.); 6.90-6.99 (m, 10H, arom.); 6.69-6.75
ppm (m, 2H, arom.).
Complex 10: 8.26 (d, 2H, J = 7.9 Hz, pyr.); 8.15 (d, 2H, J = 8.0 Hz, pyr.); 7.20-
7.30(m, 8H, arom.); 7.16 (t, 8H, J = 7.3 Hz, arom.); 7.00 (d, 2H, J = 7.7 Hz,
pyr.); 6.90-6.99 (m, 10H, arom.); 6.69-6.75 ppm (m, 2H, arom.).
Complex 11: 8.06 (d, 2H J = 8.0 Hz. Pyr.); 7.90 (d, 2H, J = 7.9 Hz., pyr.); 7.20-
7.30 (m, 8H, arom.); 7.16 (t, 8H, J = 7.3 Hz, arom.); 6.92 (d, 2H, J = 7.7 Hz,
pyr.); 6.90-6.99 (m, 10H, arom.); 6.85-6.91 (m, 2H, arom.). 2.18 ppm (s, 6H,
CH3).
Complex 12: 8.50 (d, 2H, J = 3.9 Hz, pyr.); 8.28 (d, 2H, J = 8.0 Hz, pyr.); 8.08
(t, 2H, J = 7.8 Hz, pyr.); 7.34 (t, 6H, J = 7.7 Hz, arom.); 7.18 (t, 12H, arom);
6.94-7.10 ppm (m, 12H, arom.).
Complex 13: 8.37 (d, 2H, J = 8.0 Hz., pyr.); 8.09 (d, 2H, J = 7.9 Hz., pyr.);
7.34 (t, 6H, J = 7.7 Hz. Arom.); 7.18 (t, 12H, J = 7.5 Hz. Arom.); 7.11 (m, 2H,
pyr.); 7.03 (m, 12H, arom.); 2.54 ppm (s, 6H, CH3).
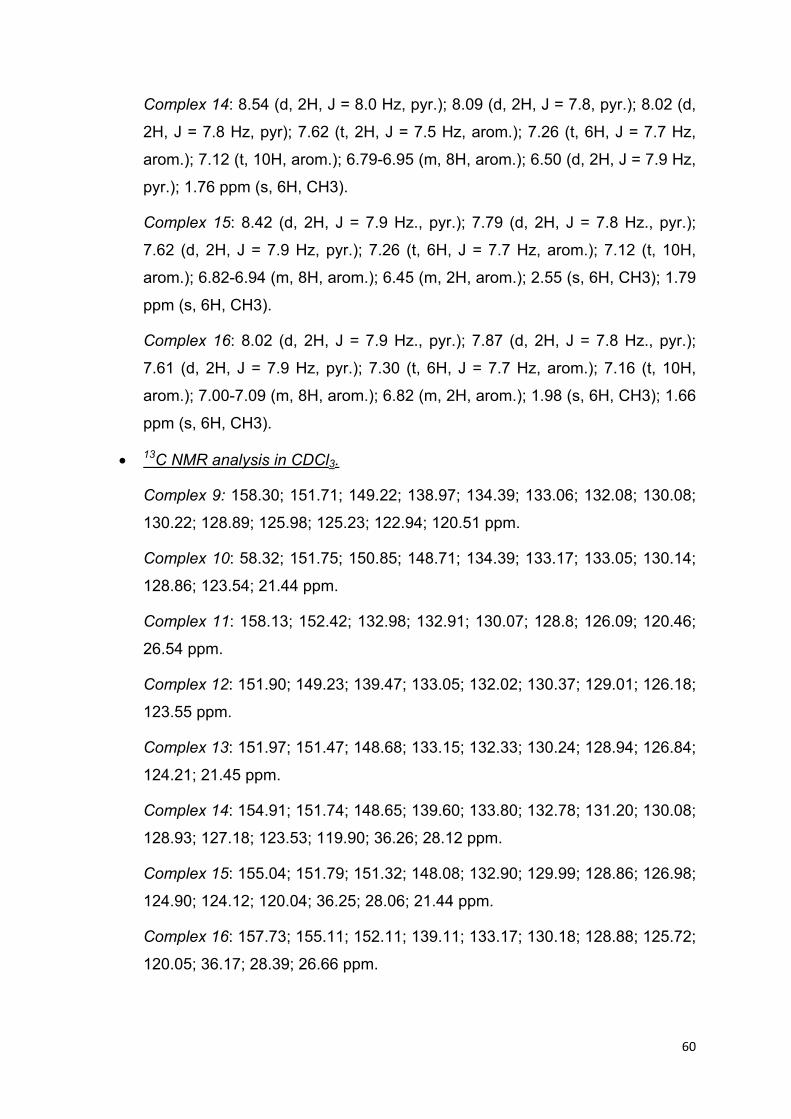
60
Complex 14: 8.54 (d, 2H, J = 8.0 Hz, pyr.); 8.09 (d, 2H, J = 7.8, pyr.); 8.02 (d,
2H, J = 7.8 Hz, pyr); 7.62 (t, 2H, J = 7.5 Hz, arom.); 7.26 (t, 6H, J = 7.7 Hz,
arom.); 7.12 (t, 10H, arom.); 6.79-6.95 (m, 8H, arom.); 6.50 (d, 2H, J = 7.9 Hz,
pyr.); 1.76 ppm (s, 6H, CH3).
Complex 15: 8.42 (d, 2H, J = 7.9 Hz., pyr.); 7.79 (d, 2H, J = 7.8 Hz., pyr.);
7.62 (d, 2H, J = 7.9 Hz, pyr.); 7.26 (t, 6H, J = 7.7 Hz, arom.); 7.12 (t, 10H,
arom.); 6.82-6.94 (m, 8H, arom.); 6.45 (m, 2H, arom.); 2.55 (s, 6H, CH3); 1.79
ppm (s, 6H, CH3).
Complex 16: 8.02 (d, 2H, J = 7.9 Hz., pyr.); 7.87 (d, 2H, J = 7.8 Hz., pyr.);
7.61 (d, 2H, J = 7.9 Hz, pyr.); 7.30 (t, 6H, J = 7.7 Hz, arom.); 7.16 (t, 10H,
arom.); 7.00-7.09 (m, 8H, arom.); 6.82 (m, 2H, arom.); 1.98 (s, 6H, CH3); 1.66
ppm (s, 6H, CH3).
13C NMR analysis in CDCl3.
Complex 9: 158.30; 151.71; 149.22; 138.97; 134.39; 133.06; 132.08; 130.08;
130.22; 128.89; 125.98; 125.23; 122.94; 120.51 ppm.
Complex 10: 58.32; 151.75; 150.85; 148.71; 134.39; 133.17; 133.05; 130.14;
128.86; 123.54; 21.44 ppm.
Complex 11: 158.13; 152.42; 132.98; 132.91; 130.07; 128.8; 126.09; 120.46;
26.54 ppm.
Complex 12: 151.90; 149.23; 139.47; 133.05; 132.02; 130.37; 129.01; 126.18;
123.55 ppm.
Complex 13: 151.97; 151.47; 148.68; 133.15; 132.33; 130.24; 128.94; 126.84;
124.21; 21.45 ppm.
Complex 14: 154.91; 151.74; 148.65; 139.60; 133.80; 132.78; 131.20; 130.08;
128.93; 127.18; 123.53; 119.90; 36.26; 28.12 ppm.
Complex 15: 155.04; 151.79; 151.32; 148.08; 132.90; 129.99; 128.86; 126.98;
124.90; 124.12; 120.04; 36.25; 28.06; 21.44 ppm.
Complex 16: 157.73; 155.11; 152.11; 139.11; 133.17; 130.18; 128.88; 125.72;
120.05; 36.17; 28.39; 26.66 ppm.
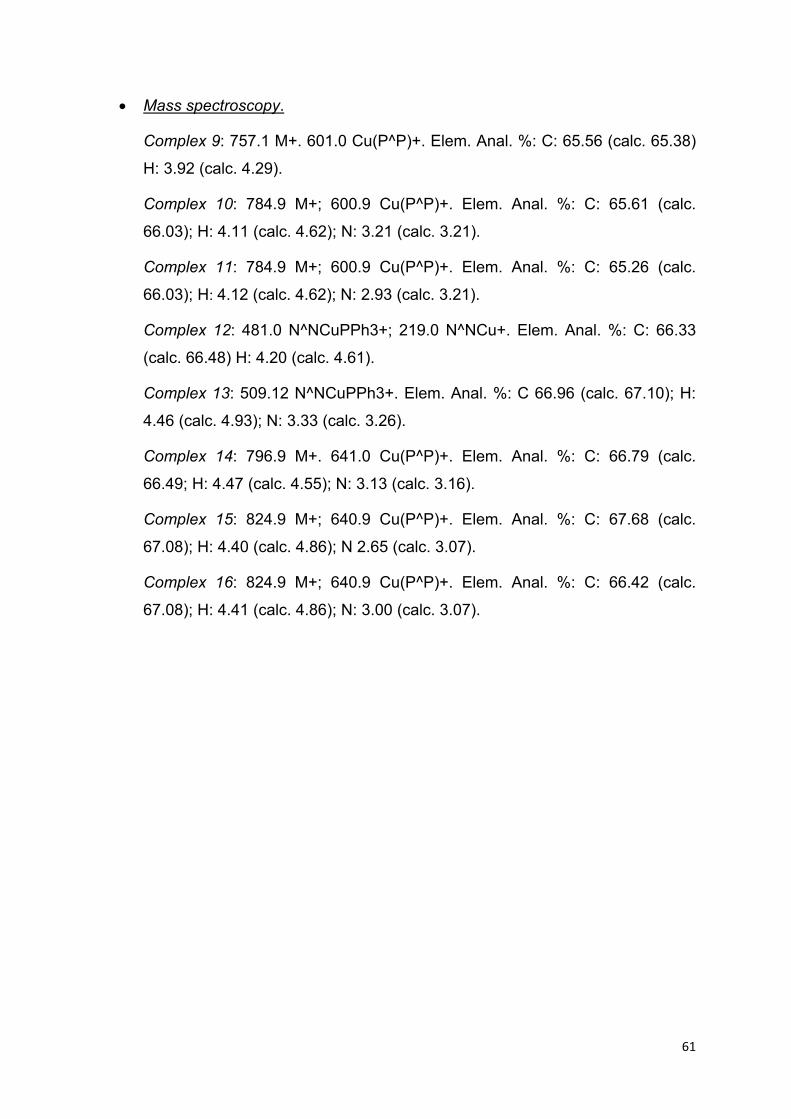
61
Mass spectroscopy.
Complex 9: 757.1 M+. 601.0 Cu(P^P)+. Elem. Anal. %: C: 65.56 (calc. 65.38)
H: 3.92 (calc. 4.29).
Complex 10: 784.9 M+; 600.9 Cu(P^P)+. Elem. Anal. %: C: 65.61 (calc.
66.03); H: 4.11 (calc. 4.62); N: 3.21 (calc. 3.21).
Complex 11: 784.9 M+; 600.9 Cu(P^P)+. Elem. Anal. %: C: 65.26 (calc.
66.03); H: 4.12 (calc. 4.62); N: 2.93 (calc. 3.21).
Complex 12: 481.0 N^NCuPPh3+; 219.0 N^NCu+. Elem. Anal. %: C: 66.33
(calc. 66.48) H: 4.20 (calc. 4.61).
Complex 13: 509.12 N^NCuPPh3+. Elem. Anal. %: C 66.96 (calc. 67.10); H:
4.46 (calc. 4.93); N: 3.33 (calc. 3.26).
Complex 14: 796.9 M+. 641.0 Cu(P^P)+. Elem. Anal. %: C: 66.79 (calc.
66.49; H: 4.47 (calc. 4.55); N: 3.13 (calc. 3.16).
Complex 15: 824.9 M+; 640.9 Cu(P^P)+. Elem. Anal. %: C: 67.68 (calc.
67.08); H: 4.40 (calc. 4.86); N 2.65 (calc. 3.07).
Complex 16: 824.9 M+; 640.9 Cu(P^P)+. Elem. Anal. %: C: 66.42 (calc.
67.08); H: 4.41 (calc. 4.86); N: 3.00 (calc. 3.07).

62
Figure 26. Method of synthesis for mononuclear copper complexes 9 to 16, where: (a) tetrakis (acetronitrile) copper (I) tetrafluoroborate; (b) pyridine ligand, complexes 9,12 and 14 R1=R2= H, complexes 10, 13 and 15 R1=H and R2= CH3, complexes 11 and 16 R1= CH3 and R2= H; (c) bis(2-diphenylphosphinophenyl) ether; (d) triphenylphosphine; (e) 9,9-dimethyl-4,5-bis(diphenylphosphino) xanthenes.
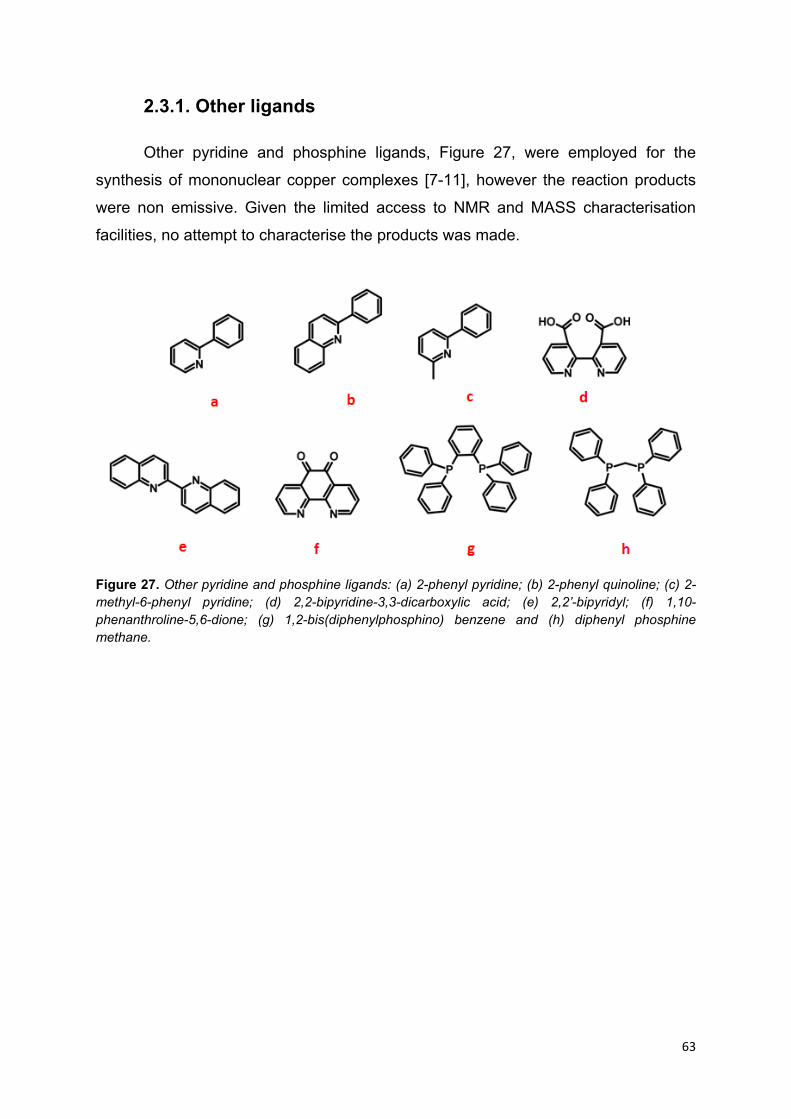
63
2.3.1. Other ligands
Other pyridine and phosphine ligands, Figure 27, were employed for the
synthesis of mononuclear copper complexes [7-11], however the reaction products
were non emissive. Given the limited access to NMR and MASS characterisation
facilities, no attempt to characterise the products was made.
Figure 27. Other pyridine and phosphine ligands: (a) 2-phenyl pyridine; (b) 2-phenyl quinoline; (c) 2-methyl-6-phenyl pyridine; (d) 2,2-bipyridine-3,3-dicarboxylic acid; (e) 2,2’-bipyridyl; (f) 1,10-phenanthroline-5,6-dione; (g) 1,2-bis(diphenylphosphino) benzene and (h) diphenyl phosphine methane.
64
2.4. References
1. Yam, V.W.-W., W.K.-M. Fung, and M.-T. Wong, Synthesis, Photophysics,
Electrochemistry, and Excited-State Redox Properties of Trinuclear Copper(I)
Acetylides with Bis(diphenylphosphino)alkylamines and -arylamines as
Bridging Ligands. Organometallics, 1997. 16(8): p. 1772-1778.
2. Diez, J., et al., Synthesis and characterization of triangulo copper(I)
complexes containing mono- and bicapping systems of asymmetric .mu.3-
.eta.1-acetylide ligands: molecular structures of [Cu3(.mu.3-.eta.1-
C.tplbond.CPh)(.mu.-dppm)3][BF4]2, [Cu3(.mu.3-.eta.1-
C.tplbond.CPh)2(.mu.-dppm)3][BF4], and [Cu3(.mu.3-.eta.1-
C.tplbond.CPh)(.mu.3-Cl)(.mu.-dppm)3][BF4] [dppm =
bis(diphenylphosphino)methane]. Organometallics, 1993. 12(6): p. 2213-
2220.
3. Babudri, F., et al., Photochemical tuning of light emission in a conjugated
polymer containing norbornadiene units in the main chain. Photochemical &
Photobiological Sciences, 2007. 6(4): p. 361-364.
4. Yam, V.W.-W., Luminescent metal alkynyls – from simple molecules to
molecular rods and materials. Journal of Organometallic Chemistry, 2004.
689(8): p. 1393-1401.
5. Long, N.J. and C.K. Williams, Metal Alkynyl σ Complexes: Synthesis and
Materials. Angewandte Chemie International Edition, 2003. 42(23): p. 2586-
2617.
6. Cade, I., et al., Synthesis and spectroscopy of anthracene-containing linear
and ‘T’-shaped π-conjugated ligands. Journal of Organometallic Chemistry,
2006. 691(7): p. 1389-1401.
7. Min, J., et al., Neutral copper(i) phosphorescent complexes from their ionic
counterparts with 2-(2[prime or minute]-quinolyl)benzimidazole and phosphine
mixed ligands. Dalton Transactions, 2011. 40(3): p. 686-693.
8. Zhang, Q., et al., Highly Efficient Green Phosphorescent Organic Light-
Emitting Diodes Based on CuI Complexes. Advanced Materials, 2004. 16(5):
p. 432-436.
65
9. Zhang, Q., et al., Highly Efficient Electroluminescence from Green-Light-
Emitting Electrochemical Cells Based on CuI Complexes. Advanced
Functional Materials, 2006. 16(9): p. 1203-1208.
10. Koga, Y., et al., Synthesis, Structures, and Unique Luminescent Properties of
Tridentate C∧C∧N Cyclometalated Complexes of Iridium. European Journal of
Inorganic Chemistry, 2011. 2011(18): p. 2869-2878.
11. Kuang, S.-M., et al., Synthesis and Structural Characterization of Cu(I) and
Ni(II) Complexes that Contain the Bis[2-(diphenylphosphino)phenyl]ether
Ligand. Novel Emission Properties for the Cu(I) Species. Inorganic Chemistry,
2002. 41(12): p. 3313-3322.

66
Chapter 3: Optical, thermal and electrochemical
Properties of novel trinuclear and mononuclear
copper (I) complexes

67
3.1. Introduction
This chapter discusses the optical, thermal and electrochemical properties of
the synthesised copper (I) complexes, the preparation was described in Chapter 2.
The properties were investigated to understand the emission of the novel complexes
and compare them with previously published complexes for organic light emitting
diodes (OLEDs). There are three main aspects to define the complexes as suitable
material for OLEDs: the optical, the thermal and the electrochemical
characterisation.
3.2. Photochemical studies
The photophysical properties of the novel complexes, which have been
synthesised by the method outlined in the previous chapter, were investigated by
UV-vis absorption and emission.
Absorption spectra were measured on a PerkinElmer Lambda 650S
spectrometer, , the emission spectra were measured on a spectrofluorimeter
Fluorolog-3, Horiba Jobin Yvon and the lifetime curves were recorded in
“phosphorimeter” mode, using a pulsed white lamp as excitation source.
3.2.1. Trinuclear copper (I) complexes
3.2.1.1. UV-vis absorption properties
The absorption spectra of complexes 2 to 8 were recorded at room
temperature in 10-5 M dichloromethane solutions, (Graph 1) and in processed films
with 4% poly(methylmethacrylate) (PMMA) by spin coating (Graph 2).
There are two main regions in the spectra (Table 3). The intense bands ( range of ε
= 2 - 3 x 10⁴ M-1 cm-1) at high energy (200 - 325 nm) are assigned to the transitions
between the molecular orbital π and π* [1], which appear to depend on the alkynyl
ligands present, as reported in previous spectroscopic works on other transition
metal alkynyl systems [2]. The highest energy absorptions are due to singlet-to-
singlet metal-to-ligand charge transfer (1MLCT) and spin-forbidden singlet-to-triplet
metal-to-ligand charge transfer (3MLCT) transitions, in a range of ε = 2 - 3 x 10⁴ M-1
cm-1. This low-energy absorption implies a relatively small singlet-triplet energy gap,

68
in other words a small HOMO-LUMO exchange integral, consistent with a MLCT
transition. The wavelength associated with the MLCT is determined by the degree of
conjugation of the alkynyl ligand for these complexes.
Graph 1. Absorption spectra of the complexes 2 to 8 in a solution of DCM.
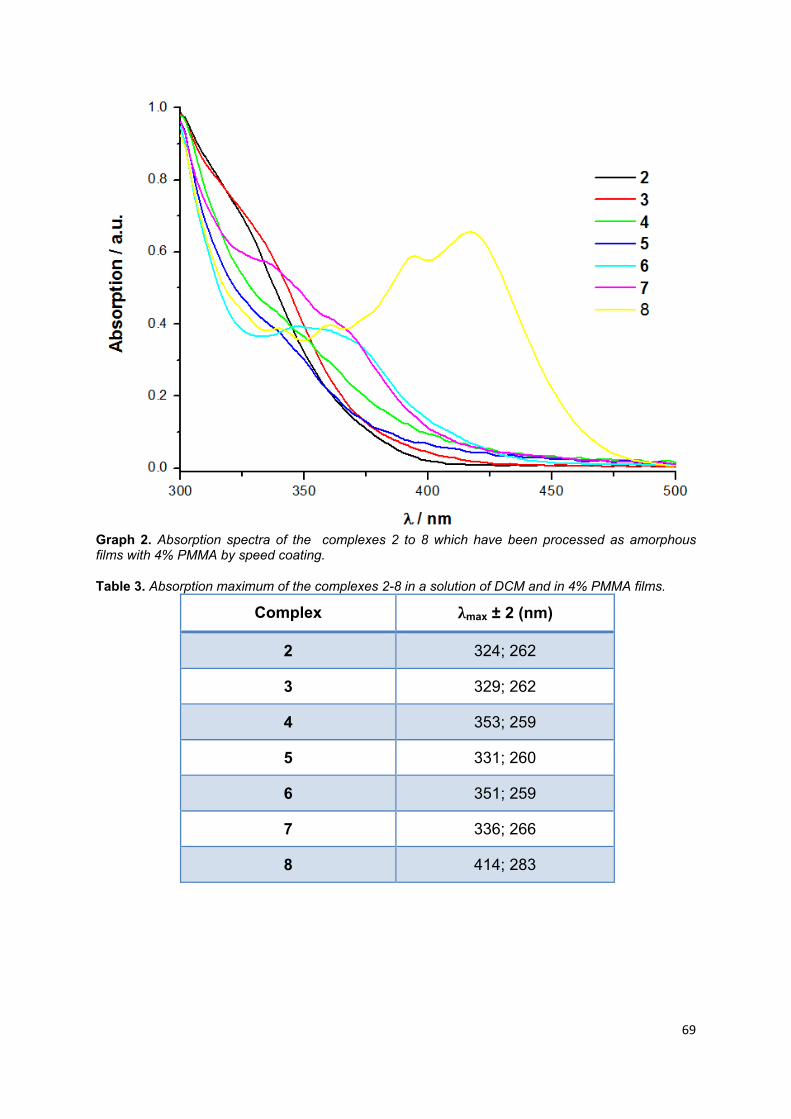
69
Graph 2. Absorption spectra of the complexes 2 to 8 which have been processed as amorphous films with 4% PMMA by speed coating.
Table 3. Absorption maximum of the complexes 2-8 in a solution of DCM and in 4% PMMA films.
Complex λmax ± 2 (nm)
2 324; 262
3 329; 262
4 353; 259
5 331; 260
6 351; 259
7 336; 266
8 414; 283

70
3.2.1.2. Emission properties
The emission properties were analysed by three parameters: λ maximum
emission, quantum yield (Φ) and lifetime (τ) [3] (Table 4). The trinuclear copper (I)
alkynyl complexes have shown luminescence in solid state and solution. As in the
case of other reported copper complexes, in order to obtain the emission spectra,
the solutions were degassed the emission as the presence of oxygen quenches [4].
Moreover, significant Stoke shifts for complexes 5-8 between the high
wavelength of the MLCT absorption band and the emission maximum. Complexes 2-
5 show emission λmaximum between 490 - 527 nm. The effect of the fluorine and
trifluoromethyl groups in different positions on the phenyl ligand lead to different
emission properties and tune of the emission. As well, these groups of electron
withdrawing substituent on the phenyl ring does not contribute to shift significantly
the emission to higher frequency, unlike in the case of iridium (III) cyclometallated
coordination complexes [1, 6].
The copper (I) complexes, 2-8, showed an emission from 490 to 678nm, with
the emission energy dependent on the electron-donating ability of the alkynyl ligand,
as displayed in Graphs 3 and 4. The origin of the emission has been proposed to
involve a mixture of the triplet ligand-to-metal charge transfer (LMCT) [alkynyl→Cu3]
alkynyl character, metal centered 3d94s1 character which could be modified by
copper-copper interaction and mixing of a ligand centrered π-π* (alkynyl) excited
state is also involved which is due to the π-conjugation effect [5].

71
Graph 3. Emission spectra of the complexes 2 to 8 in a solution of DCM.

72
Graph 4. Emission spectra of the complexes 2 to 8 which have been processed as amorphous films with 4% w/w PMMA by spin coating.
Complexes 6-8, show an emission λmaximum between 547 – 678 nm. The
presence of extended π-conjugated systems on the alkynyl ligand contributes to shift
the emission to higher wavelengths (bathochromic shift), in agreement with other
reported transition metal system [7].
Quantum yield calculations showed the fraction of molecules that emit a photon after
direct excitation by a light source. They were calculated for each complex using the
Equation 1, where quinine sulphate in 0.5M H2SO4 as standard reference and an
integrating sphere were used. All the quantum yields were measured at their
respective excitation wavelength for the sample and the reference, cancelling the
I(λr)/I(λx).
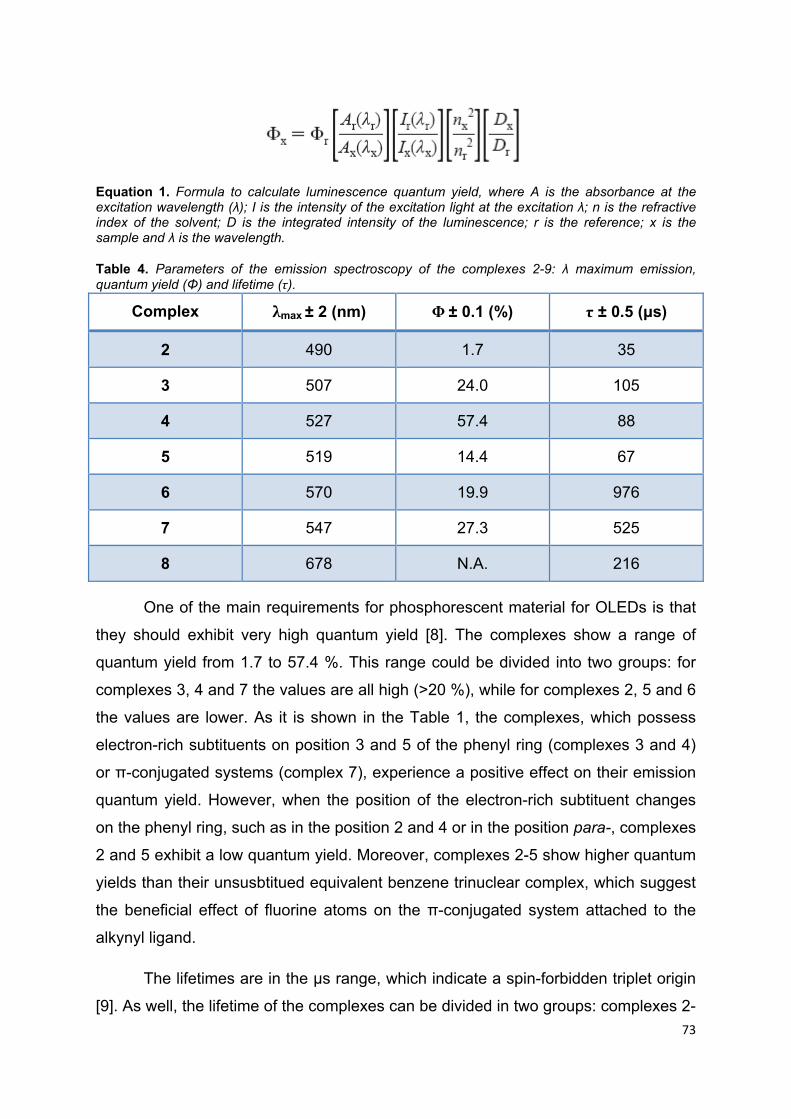
73
Equation 1. Formula to calculate luminescence quantum yield, where A is the absorbance at the excitation wavelength (λ); I is the intensity of the excitation light at the excitation λ; n is the refractive index of the solvent; D is the integrated intensity of the luminescence; r is the reference; x is the sample and λ is the wavelength.
Table 4. Parameters of the emission spectroscopy of the complexes 2-9: λ maximum emission, quantum yield (Φ) and lifetime (τ).
Complex λmax ± 2 (nm) Φ ± 0.1 (%) τ ± 0.5 (μs)
2 490 1.7 35
3 507 24.0 105
4 527 57.4 88
5 519 14.4 67
6 570 19.9 976
7 547 27.3 525
8 678 N.A. 216
One of the main requirements for phosphorescent material for OLEDs is that
they should exhibit very high quantum yield [8]. The complexes show a range of
quantum yield from 1.7 to 57.4 %. This range could be divided into two groups: for
complexes 3, 4 and 7 the values are all high (>20 %), while for complexes 2, 5 and 6
the values are lower. As it is shown in the Table 1, the complexes, which possess
electron-rich subtituents on position 3 and 5 of the phenyl ring (complexes 3 and 4)
or π-conjugated systems (complex 7), experience a positive effect on their emission
quantum yield. However, when the position of the electron-rich subtituent changes
on the phenyl ring, such as in the position 2 and 4 or in the position para-, complexes
2 and 5 exhibit a low quantum yield. Moreover, complexes 2-5 show higher quantum
yields than their unsusbtitued equivalent benzene trinuclear complex, which suggest
the beneficial effect of fluorine atoms on the π-conjugated system attached to the
alkynyl ligand.
The lifetimes are in the μs range, which indicate a spin-forbidden triplet origin
[9]. As well, the lifetime of the complexes can be divided in two groups: complexes 2-

74
5 show an excited-state lifetime which is similar to other metal complexes while
complexes 6-8 show a lifetime significantly longer than complexes 2-5. These long
lifetimes are a consequence of the d10 configuration of the copper (I) metal, which
provide stabilisation of the excited states via the ligand field and consequently
charge transfer and intraligand transitions [5]. Some of the lifetime curves are shown
on the graphs 5 and 6 .All the lifetime curves can be seen in the Appendix 1.
Graph 5. Lifetime curve of trinuclear copper complex 3 which possess 1-ethynyl-3,5-difluorobenzene as alkynyl ligand.

75
Graph 6. Lifetime curve of trinuclear copper complex 6 which possess 9-ethynylphenanthrene as alkynyl ligand.
Some of the complexes were exposed under a UV lamp; the figure shows the
emission of these complexes (Figure 1).
Figure 28. Complexes, 3, 4, 7 and 8, were exposure under an UV lamp at 365nm.

76
3.2.2. Mononuclear copper (I) complexes
3.2.2.1. UV-vis absorption properties
The electronic absorption spectra of the complexes 9-16 in dichloromethane
(DCM) are displayed in Graph 7. The complexes show intense absorption bands at
280nm (ε = 10000 – 50000 l mol-1 cm-1), which are assigned to the π-π* transition on
the aromatic ligands (Table 5). The less intense absorption band is centred around
370nm (1-5000 l mol-1 cm-1), is attributed to metal-to-ligand charge transfer (MLCT)
absorption, which possess a magnitude of the extinction coefficient expected for a
dπ-π* transition. Both bands were predicted by previously investigated analogous
[Cu(NN)(PP)]+ complexes, which contain bipyridine and phosphine ligands [10].
The absorption spectra of the complexes in PMMA film could not be
measured, as it was not reproducible.
Graph 7. Emission spectra of the complexes 9 to 16 in a solution of DCM.
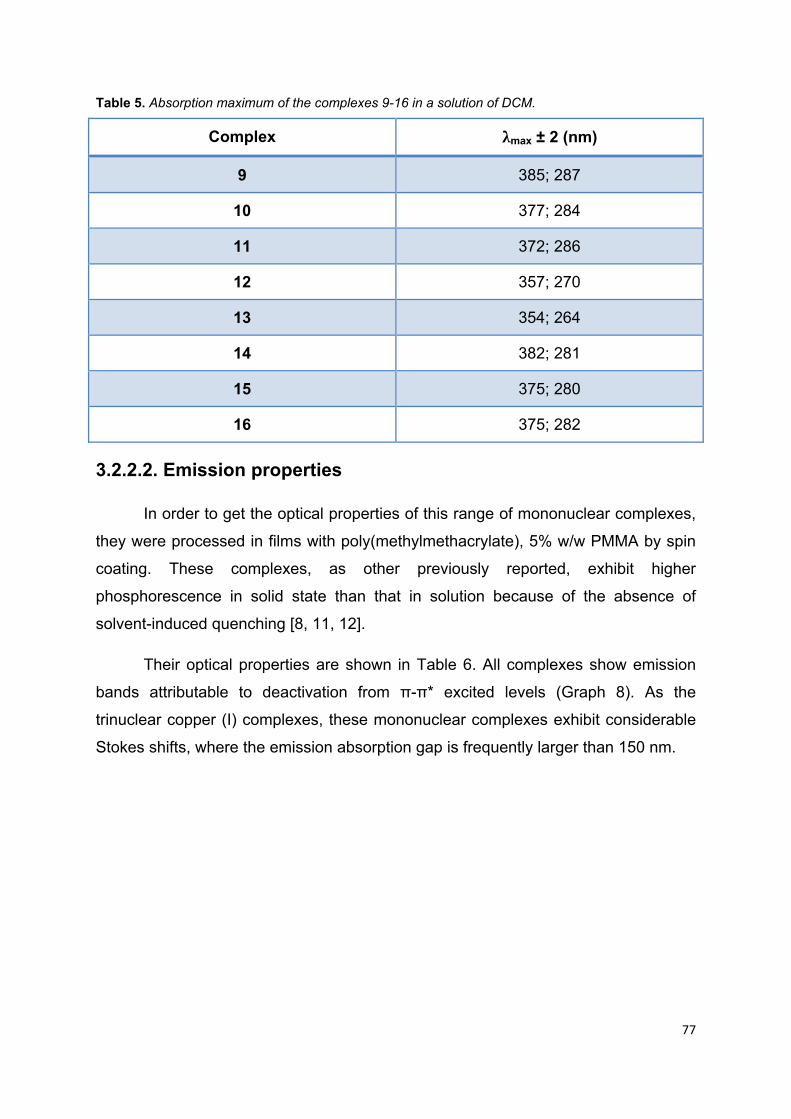
77
Table 5. Absorption maximum of the complexes 9-16 in a solution of DCM.
Complex λmax ± 2 (nm)
9 385; 287
10 377; 284
11 372; 286
12 357; 270
13 354; 264
14 382; 281
15 375; 280
16 375; 282
3.2.2.2. Emission properties
In order to get the optical properties of this range of mononuclear complexes,
they were processed in films with poly(methylmethacrylate), 5% w/w PMMA by spin
coating. These complexes, as other previously reported, exhibit higher
phosphorescence in solid state than that in solution because of the absence of
solvent-induced quenching [8, 11, 12].
Their optical properties are shown in Table 6. All complexes show emission
bands attributable to deactivation from π-π* excited levels (Graph 8). As the
trinuclear copper (I) complexes, these mononuclear complexes exhibit considerable
Stokes shifts, where the emission absorption gap is frequently larger than 150 nm.

78
Graph 8. Emission spectra of the complexes 9-16 which have been processed as amorphous films with 5% w/w PMMA by speed coating.
Table 6. Parameters of the emission spectroscopy of the processed complexes 9-16 in films with 5% w/w PMA by speed coating: λ maximum emission, quantum yield (Φ) and lifetime (τ).
Complex λmax ± 2(nm) Φ ± 0.1(%) τ ± 0.5 (μs)
9 559 3.3 9.7
10 544 0.3 11.2
11 528 14.5 15.7
12 550 0.4 10.0
13 537 0.2 10.7
14 560 0.1 11.5
15 558 1.1 10.7
16 530 33.3 15.1

79
All the complexes exhibit emission bands attributable to deactivation from
MLCT excited levels as other reported copper complexes [4].These complexes show
a relative short range of emission, from 528 to 560 nm. Complexes 9, 11 and 14,
which carry a pyridine ligand without subtituents, show a red shifted emission, while
complexes 11 and 16, which carry methyl groups in position 6 and 6’ of the pyridine
ligand, exhibit a blue shifted emission. These results indicate the effect of
substituents of the bipyridyl ligands on the emission; the steric impediment of methyl
groups in position 6 and 6’ produce different optical characteristics than the rest of
the complexes. In Figure 29, the emission of some of the complexes could be
observed by exposing them under a UV lamp at 365 nm.
Figure 29. Complexes, 10, 12, 13 and 14, were exposure under an UV lamp at 365nm.
The quantum yield of photoluminescence was measured using an integrating
sphere and following the method published by Porrès et al. [13]. Comparing the
complexes with different pyridine ligands, incorporating methyl susbtituents in the 6
and 6’ positions of the 2,2’-bipyridine ligands leads to an increased quantum yields

80
and excited-state lifetime. The importance of the steric impediment is shown in the
results of the quantum yields and lifetime.
Lifetime measures were performed three times for each complex for
consistency, some of them are shown on the graphs 9 and 10. Lifetime of all the
complexes is shown in Appendix 2.
Graph 9. Lifetime curve of mononuclear copper complex 10 which possess 4,4’-dimethyl-2,2’-bipyridyl as pyridine ligand and bis-(diphenylphosphinophenyl)ether as phosphine ligand.
Graph 10. Lifetime curves of mononuclear copper complex 16 which possess 6,6’-dimethyl-2,2’-bipyridyl as pyridine ligand and 9,9-dimethyl-4,5-bis(diphenylphosphino) xanthene as phosphine ligand.
81
3.3. Study of the thin films by scanning electron microscopy (SEM)
Recently, studies have found an interesting phenomenon: the
electroluminescence increased with an increasing thickness of the light-emiting layer
[14]. A study of electroluminescence from fac-tris-(2-phenylpyridine) iridium, with
4,4’-bis(9-carbazolyl)-1,1’-biphenyl (CBP) as host, indicated that carrier transport and
recombination guest-host processes change depending on EML thickness [15].
Some studies have shown the influence of the thickness and its control for WOLEDs
[16]. Ultrathin emitting layers were reported [17-19], where the produced devices
showed a strong dependency on the thickness of ultrathin EML. The thickness of
EML effects not only the operating voltage but also the emission characteristics and
efficiencies. Thinner EML layers reduce the voltage of the device, but decrease the
efficiency. In contrast, other studies have reported devices with thicker EML exhibits
high voltage, low luminescence and low efficiency as the charge carrier quenching.
As conclusion, it has been assumed that the amount of phosphorescent material is
the main factor which controls the electroluminescence of these devices [20, 21].
Films which contained the trinuclear or mononuclear copper complexes were
analysed by scanning electron microscopy (SEM) in order to measure the thickness
and concentration. The luminescence of the processed films of trinuclear copper (I)
complexes, with 2 % w/w PMMA and made by spin coating, could not be measured,
as it was not detected. As a consequence, mononuclear copper (I) complexes were
processed with 5 % w/w PMMA and the thickness increased. The SEM shows the
morphology of one of these films (Figure 30 to 32). The thicknesses were estimated
around 1 μm (Figure 33). These results show the effect of the thickness on their
luminescence and their quantum efficiency.

82
Figure 30. SEM image of a film of complex which have been processed as amorphous films with 8% w/w PMMA by solution casting at 100 times magnification.
Figure 31. SEM image of a film of complex which have been processed as amorphous films with 8% w/w PMMA by solution casting at 1000 times magnification.

83
Figure 32. SEM image of a film of complex which have been processed as amorphous films with 8% w/w PMMA by solution casting at 10000 times magnification.
Figure 33. SEM image of a film of the doped complex 16 with PVCz (3:7, dopper:complex), which have been processed as amorphous films by speed coating at 36500 times magnification.
84
3.4. Thermal studies
The complexes, mononuclear and trinuclear, were characterised by two
thermal techniques: thermogravimetric analysis and differential scanning calorimetry.
3.4.1. Thermogravimetric analysis (TGA)
Thermogravimetric analysis is an experimental technique, which is used in
order to obtain the decomposition temperature. In this technique, the mass of the
samples is a function of the temperature. A sample of each complex was heated at a
constant rate of 10 oC/min. Additionally, the atmosphere during the experiment was
saturated with nitrogen.
Graphs 11 and 12 show the thermogravimetric analisys of the trinuclear and
mononuclear copper (I) complexes, respectively. As well, the respective
temperatures of decomposition of each complex are shown in the following Tables 7
and 8.
The synthesised trinuclear copper (I) complexes show a very diverse range of
decomposition temperatures, from 184 oC to 269 oC. Complex 4 is more stable than
complex 5, which means that this electron withdrawing subtituent stabilises the
complex when they are carried in position 3 and 5 on the phenyl ring. However, the
same is not observed when the alkynyl ligand carries the fluorine, in Complexes 2
and 3.
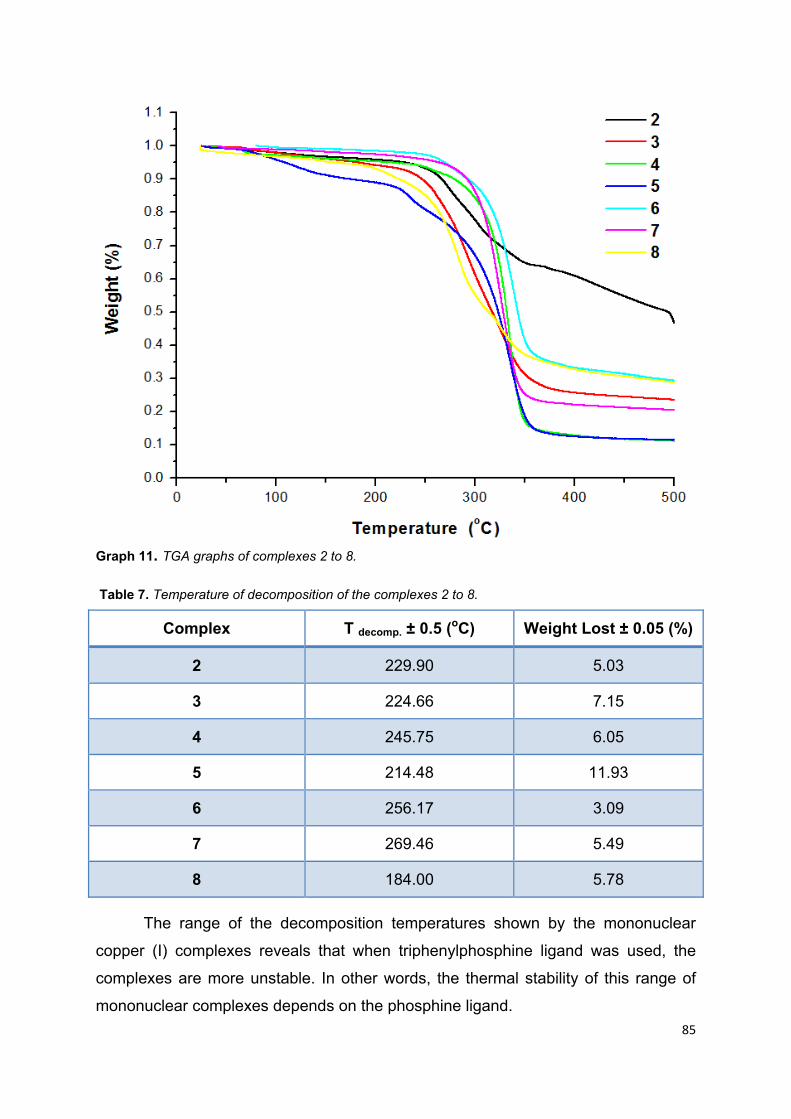
85
Graph 11. TGA graphs of complexes 2 to 8.
Table 7. Temperature of decomposition of the complexes 2 to 8.
Complex T decomp. ± 0.5 (oC) Weight Lost ± 0.05 (%)
2 229.90 5.03
3 224.66 7.15
4 245.75 6.05
5 214.48 11.93
6 256.17 3.09
7 269.46 5.49
8 184.00 5.78
The range of the decomposition temperatures shown by the mononuclear
copper (I) complexes reveals that when triphenylphosphine ligand was used, the
complexes are more unstable. In other words, the thermal stability of this range of
mononuclear complexes depends on the phosphine ligand.

86
Graph 12. TGA graphs of complexes 9 to 16.
Table 8. Temperature of decomposition of the complexes 9 to 16.
Complex T decomp. ± 0.5 (oC) Weight Lost ± 0.05 (%)
9 310.00 4.93
10 257.55 5.60
11 226.95 3.80
12 212.00 7.73
13 205.09 5.66
14 290.64 2.16
15 272.08 3.36
16 246.25 6.19
87
3.4.2. Differential scanning calorimetry (DSC)
Differential scanning calorimetry was the second thermal analysis used to
characterise the obtained complexes. In this analysis, we measure the energy
changes that occur when we heated, cooled or held the sample at constant
temperature. The starting temperature for each complex, was room temperature and
the highest temperature was bellow the decomposition temperature, which was
obtained by TGA. The scan heating rate was 10 oC/min and the cooling rate was 5 oC/min.
Melting point or recrystallisation peaks were not detected in any of the
trinuclear Complexes 2 to 8, which indicates an irreversible thermal behaviour.
However, some thermal peaks were detected such as an endothermic peak around
70 oC in all the complexes (Table 9), less the labelled Complex 2. Complexes 3, 5, 7
and 8 show a glass transition (Tg), during the cooling step, as it is the reversible
transition for these amorphous materials. All the graphs are shown in the Appendix
3.

88
Table 9. Signal detectable by scanning differential calorimetry for the complexes 2 to 8, where Texo is the temperature of an exothermic peak, Tendo is the temperature of a endothermic peak and Tg is the temperature of the glass transition.
Complex Heating Step Cooling Step
2 Tendo = 109.51 oC
Tendo = 189.54 oC
-
3 Tendo = 73.20 oC
Texo = 173.30 oC
Tg = 91.87 oC
4 Tendo = 53.49 oC
Tendo = 81.00 oC
Texo = 166.13 oC
Texo = 196.13 oC
5 - Tg = 52.82 oC
6 Tendo = 68.63 oC
Texo = 165.43 oC
Tendo = 224.12 oC
-
7 Tendo = 65.38 oC
Tendo = 139.93 oC
Tendo = 197.44 oC
Tg = 112.37 oC
8 Tendo = 63.61 oC
Tendo = 141.37 oC
Tg = 130.53 oC
The DSC analysis of Complexes 9 to 16 show different thermal peaks. Table
10 and the graphs in the Appendix 4 show a detectable melting point for Complexes
9 and 16, which is significanty higher for Complex 16, probably induced by a
distorted geometry. A recrystallisation could not be detected for any of the
complexes, which indicates their irreversible thermal behaviour.

89
Table 10. Signal detectable by scanning differential calorimetry for complexes 9 to 16, where Texo is the temperature of an exothermic peak, Tendo is the temperature of an endothermic peak, Tmelt is the temperature of the melting point and Tg is the temperature of the glass transition.
Complex Heating Step Cooling Step
9 Texo = 189.91 oC
Tendo = 217.98 oC
Tmelt = 246.50 oC
Tg = 108.86 oC
10 Tendo = 132.35 oC
Texo = 186.02 oC
-
11 - Tg = 109.51 oC
Tg = 144.95 oC
12 - -
13 Texo = 158.00 oC -
14 - -
15 - -
16 Tmelt = 106.42 oC -
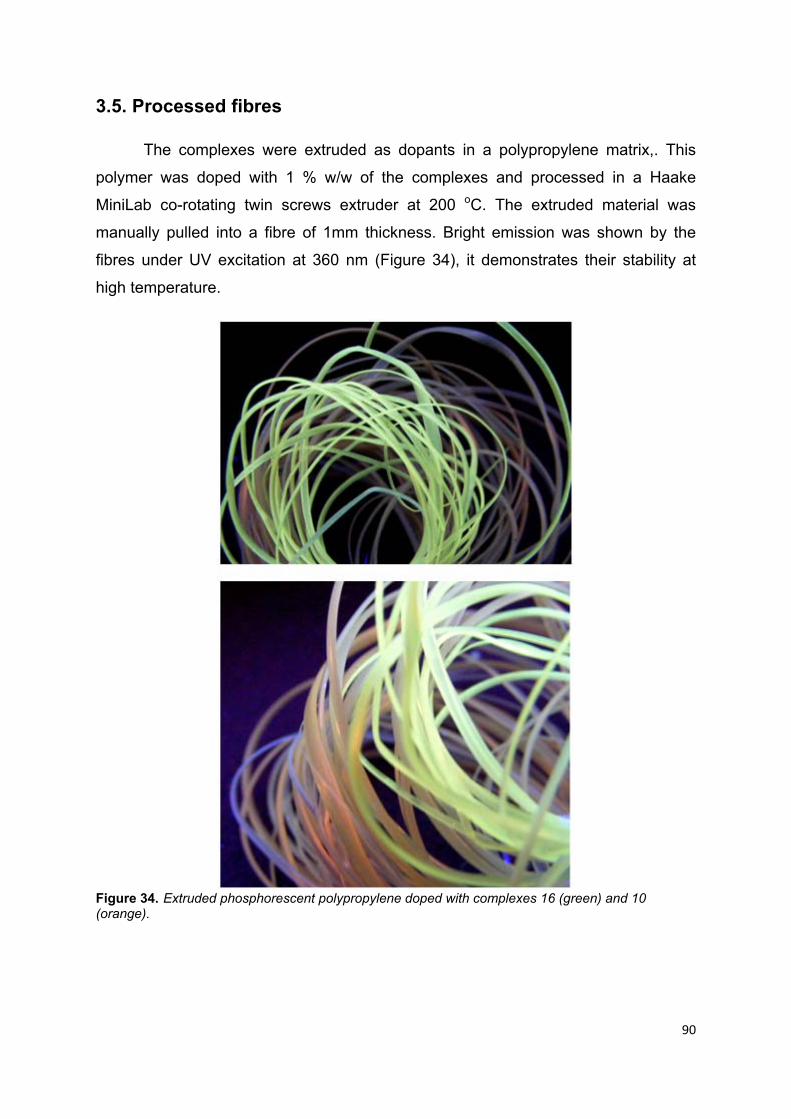
90
3.5. Processed fibres
The complexes were extruded as dopants in a polypropylene matrix,. This
polymer was doped with 1 % w/w of the complexes and processed in a Haake
MiniLab co-rotating twin screws extruder at 200 oC. The extruded material was
manually pulled into a fibre of 1mm thickness. Bright emission was shown by the
fibres under UV excitation at 360 nm (Figure 34), it demonstrates their stability at
high temperature.
Figure 34. Extruded phosphorescent polypropylene doped with complexes 16 (green) and 10 (orange).
91
3.6. Electrochemical studies
The electrochemical properties of synthesised copper complexes were
measured by cyclic voltammetry (CV). This method has provided valuable
information regarding the stability of the oxidation states and the rate of electron
transfer between the electrode and the electrolyte (tetrabutilamonium
hexafluorophosphate, TBAH). The voltage was linearly varied from an initial (2000
mV) to a final potential (-2000 mV) and immediately swept back at the same sweep
rate to the initial. The potential was applied to the working electrode (graphite
electrode) with respect to a reference electrode (AgCl/Ag), while an auxiliary
electrode (platinum electrode) was used to complete the electrical circuit.
Ferrocene (bis-cyclopentadienyl iron (III)) was used as standard reversible
process as the rate of electron transfer is very fast and reproducible [22].
All the experiments were performed in inert gas and using anhydrous
acetronile (ACN) as solvent.
3.6.1. Trinuclear copper (I) complexes
The cyclic voltammetry of some of the complexes show significant signals in
acetronitrile (0.1 M TBAH) as shown in Appendix 6. Complexes 2, 3, 6 and 7 show
the presence of an irreversible oxidation, assigned to one-electron oxidation at the
copper (I) center [3]. However, other reported trinuclear copper (I) acetylide
complexes with bis(diphenylphosphino) methane have showed a semireversible
redox couple [23, 24]. These irreversible oxidation is the consequence of inestable
complexes in solution.
A summary of the redox potentials, measured relative to the internal reference
is given in Table 11. All the measurements were done at 1000 mV/min.

92
Table 11. Redox potential of complex 2 to 8 in anhydrous, degassed acetonitrile vs Cp2Fe/Cp2Fe+ used as internal reference.
Complex E1/2 ox ± 0.1 (V) E1/2 red ± 0.1 (V)
2 0.94 -
3 0.95 -
4 - -
5 - -
6 1.01 -
7 0.95 -1.76
8 - -
3.6.2. Mononuclear copper (I) complexes
Complexes 9-16 show oxidations in the range of +0.66 V to +0.83 V versus
Fe(C5H5)2/ Fe(C5H5)2+, Appendix 7. These oxidation processes are irreversible, as
consequence of the rapid decomposition of Cu (II) species by comparison with other
copper complexes with triphenylphosphine ligands [25]. The reduction of the
complexes is not fully reversible, and assigned to a reduction of the phosphine
ligands, in the range of -1.56 V to -1.93 V versus Fe(C5H5)2/ Fe(C5H5)2+. Similar
values, in the same range, have been reported for transition metal complexes
containing bipyridine ligands [6, 26-29].
All the measurements for theses complexes were done at 3000 mV/min
(Table 12).
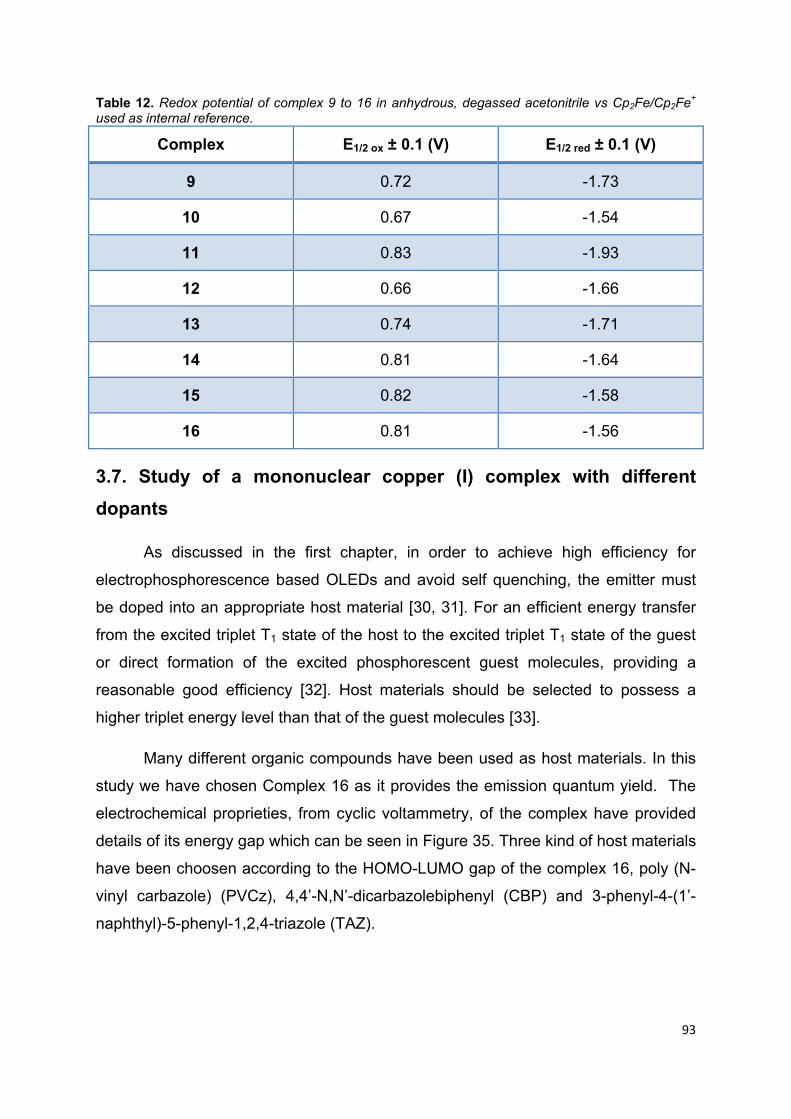
93
Table 12. Redox potential of complex 9 to 16 in anhydrous, degassed acetonitrile vs Cp2Fe/Cp2Fe+ used as internal reference.
Complex E1/2 ox ± 0.1 (V) E1/2 red ± 0.1 (V)
9 0.72 -1.73
10 0.67 -1.54
11 0.83 -1.93
12 0.66 -1.66
13 0.74 -1.71
14 0.81 -1.64
15 0.82 -1.58
16 0.81 -1.56
3.7. Study of a mononuclear copper (I) complex with different
dopants
As discussed in the first chapter, in order to achieve high efficiency for
electrophosphorescence based OLEDs and avoid self quenching, the emitter must
be doped into an appropriate host material [30, 31]. For an efficient energy transfer
from the excited triplet T1 state of the host to the excited triplet T1 state of the guest
or direct formation of the excited phosphorescent guest molecules, providing a
reasonable good efficiency [32]. Host materials should be selected to possess a
higher triplet energy level than that of the guest molecules [33].
Many different organic compounds have been used as host materials. In this
study we have chosen Complex 16 as it provides the emission quantum yield. The
electrochemical proprieties, from cyclic voltammetry, of the complex have provided
details of its energy gap which can be seen in Figure 35. Three kind of host materials
have been choosen according to the HOMO-LUMO gap of the complex 16, poly (N-
vinyl carbazole) (PVCz), 4,4’-N,N’-dicarbazolebiphenyl (CBP) and 3-phenyl-4-(1’-
naphthyl)-5-phenyl-1,2,4-triazole (TAZ).
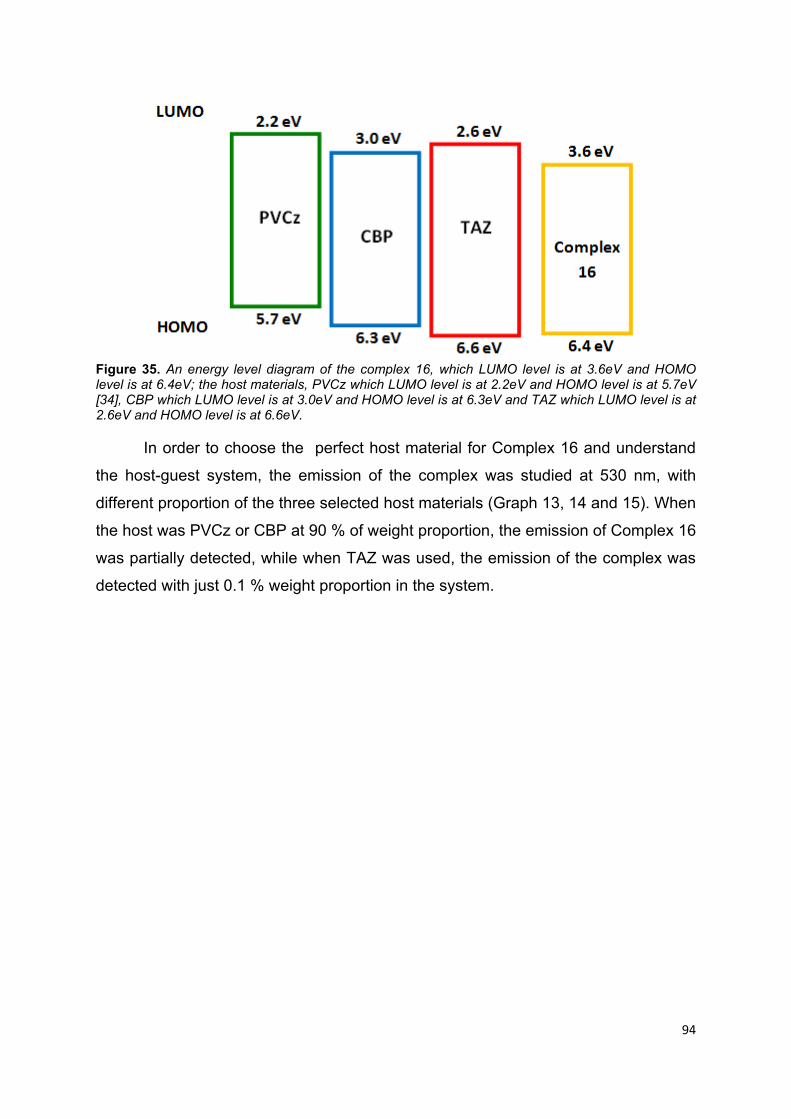
94
Figure 35. An energy level diagram of the complex 16, which LUMO level is at 3.6eV and HOMO level is at 6.4eV; the host materials, PVCz which LUMO level is at 2.2eV and HOMO level is at 5.7eV [34], CBP which LUMO level is at 3.0eV and HOMO level is at 6.3eV and TAZ which LUMO level is at 2.6eV and HOMO level is at 6.6eV.
In order to choose the perfect host material for Complex 16 and understand
the host-guest system, the emission of the complex was studied at 530 nm, with
different proportion of the three selected host materials (Graph 13, 14 and 15). When
the host was PVCz or CBP at 90 % of weight proportion, the emission of Complex 16
was partially detected, while when TAZ was used, the emission of the complex was
detected with just 0.1 % weight proportion in the system.
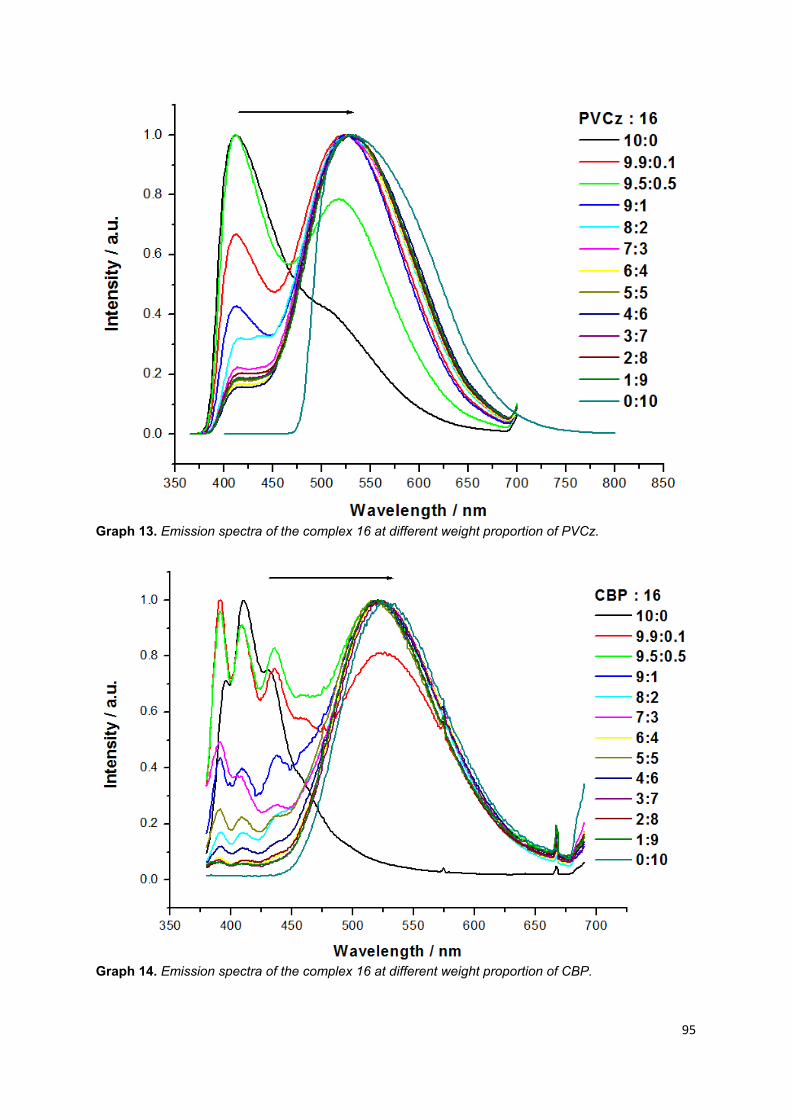
95
Graph 13. Emission spectra of the complex 16 at different weight proportion of PVCz.
Graph 14. Emission spectra of the complex 16 at different weight proportion of CBP.
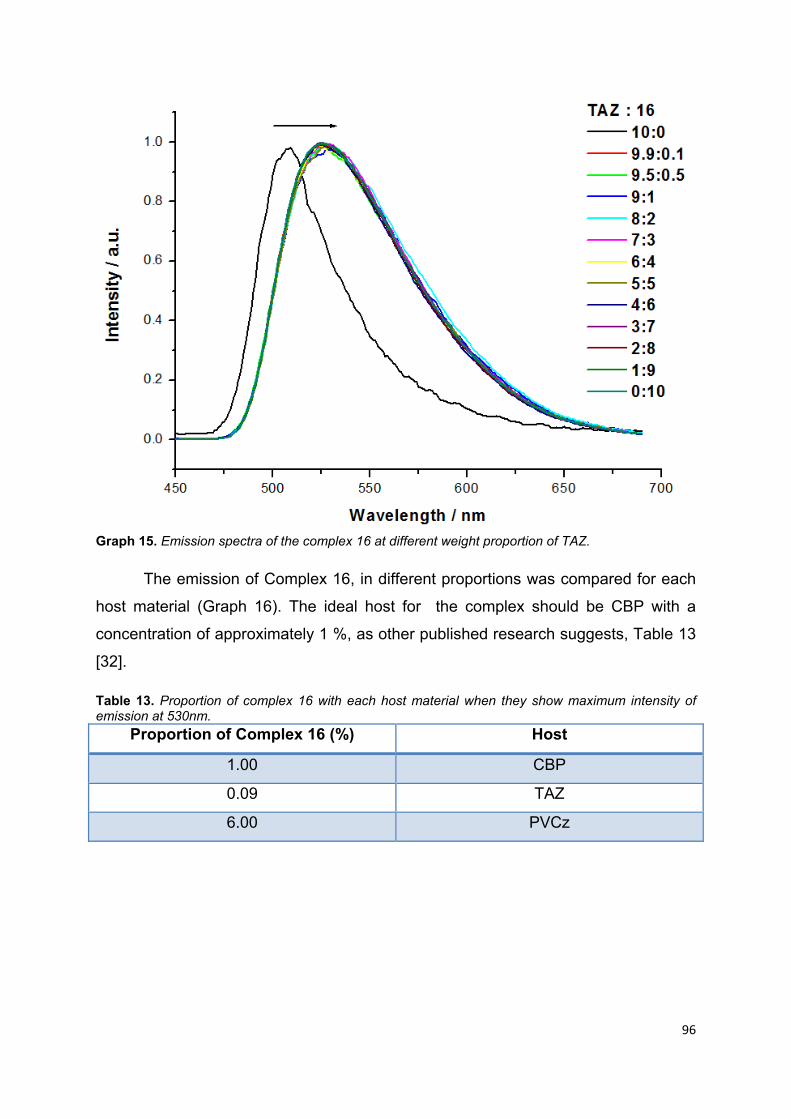
96
Graph 15. Emission spectra of the complex 16 at different weight proportion of TAZ.
The emission of Complex 16, in different proportions was compared for each
host material (Graph 16). The ideal host for the complex should be CBP with a
concentration of approximately 1 %, as other published research suggests, Table 13
[32].
Table 13. Proportion of complex 16 with each host material when they show maximum intensity of emission at 530nm.
Proportion of Complex 16 (%) Host
1.00 CBP
0.09 TAZ
6.00 PVCz
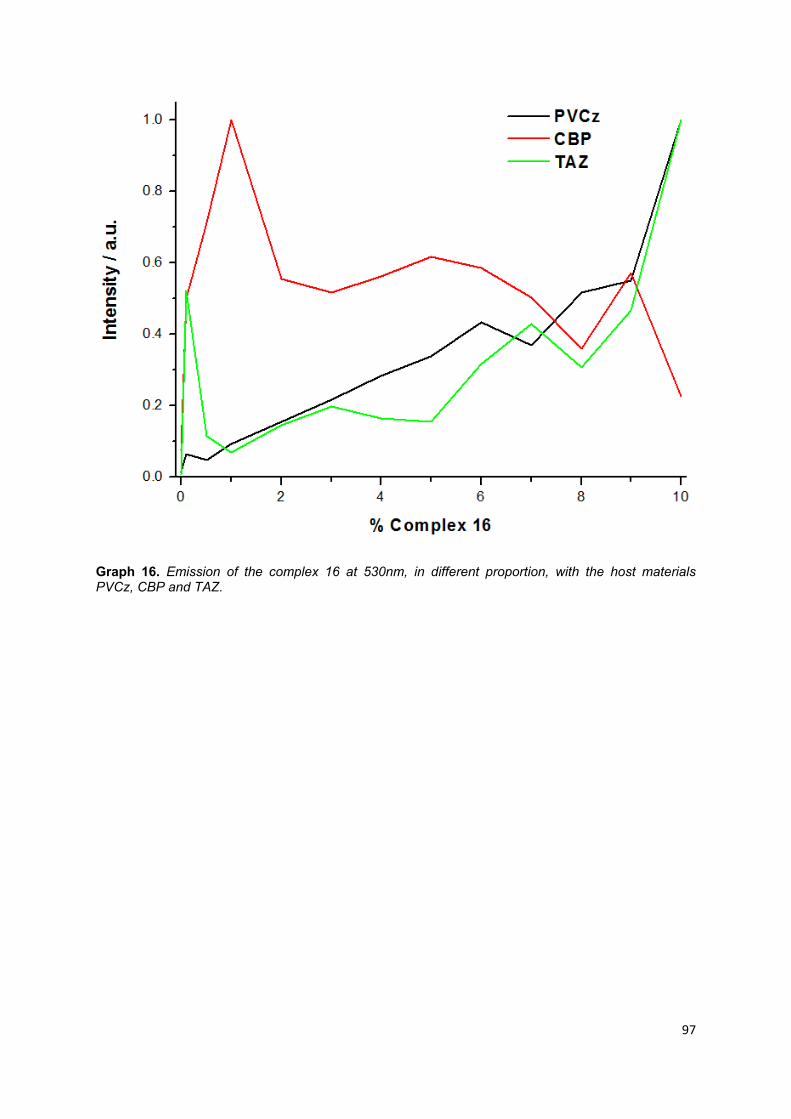
97
Graph 16. Emission of the complex 16 at 530nm, in different proportion, with the host materials PVCz, CBP and TAZ.

98
3.8. References
1. Orselli, E., et al., Blue-Emitting Iridium Complexes with Substituted 1,2,4-
Triazole Ligands: Synthesis, Photophysics, and Devices. Inorganic Chemistry, 2007.
46(26): p. 11082-11093.
2. Cheung, K.-L., S.-K. Yip, and V.W.-W. Yam, Synthesis, characterization,
electrochemistry and luminescence studies of heterometallic gold(I)–rhenium(I)
alkynyl complexes. Journal of Organometallic Chemistry, 2004. 689(24): p. 4451-
4462.
3. Yam, V.W.-W., W.K.-M. Fung, and M.-T. Wong, Synthesis, Photophysics,
Electrochemistry, and Excited-State Redox Properties of Trinuclear Copper(I)
Acetylides with Bis(diphenylphosphino)alkylamines and -arylamines as Bridging
Ligands. Organometallics, 1997. 16(8): p. 1772-1778.
4. Armaroli, N., et al., Highly Luminescent CuI Complexes for Light-Emitting
Electrochemical Cells (Adv. Mater. 10/2006). Advanced Materials, 2006. 18(10): p.
n/a-n/a.
5. Evans, R.C., P. Douglas, and C.J. Winscom, Coordination complexes
exhibiting room-temperature phosphorescence: Evaluation of their suitability as
triplet emitters in organic light emitting diodes. Coordination Chemistry Reviews,
2006. 250(15–16): p. 2093-2126.
6. Coppo, P., E.A. Plummer, and L. De Cola, Tuning iridium(iii) phenylpyridine
complexes in the "almost blue" region. Chemical Communications, 2004. 0(15): p.
1774-1775.
7. Tsuboyama, A., et al., Homoleptic Cyclometalated Iridium Complexes with
Highly Efficient Red Phosphorescence and Application to Organic Light-Emitting
Diode. Journal of the American Chemical Society, 2003. 125(42): p. 12971-12979.
8. Zhang, Q., et al., Highly Efficient Green Phosphorescent Organic Light-
Emitting Diodes Based on CuI Complexes. Advanced Materials, 2004. 16(5): p. 432-
436.
9. Yam, V.W.-W., Molecular Design of Transition Metal Alkynyl Complexes as
Building Blocks for Luminescent Metal-Based Materials: Structural and
Photophysical Aspects. Accounts of Chemical Research, 2002. 35(7): p. 555-563.

99
10. Hou, R., et al., Synthesis, structural characterization and luminescent
properties of a series of Cu(i) complexes based on polyphosphine ligands. Dalton
Transactions, 2011. 40(29): p. 7551-7558.
11. Scaltrito, D.V., et al., MLCT excited states of cuprous bis-phenanthroline
coordination compounds. Coordination Chemistry Reviews, 2000. 208(1): p. 243-
266.
12. McMillin, D.R. and K.M. McNett, Photoprocesses of Copper Complexes That
Bind to DNA. Chemical Reviews, 1998. 98(3): p. 1201-1220.
13. Porrès, L., et al., Absolute Measurements of Photoluminescence Quantum
Yields of Solutions Using an Integrating Sphere. Journal of Fluorescence, 2006.
16(2): p. 267-273.
14. Zhang, X., et al., Obtaining high-efficiency red electrophosphorescent OLEDs
by changing the thickness of light-emitting layer. Displays, 2007. 28(3): p. 150-153.
15. Song, D., et al., Dependence of carrier recombination mechanism on the
thickness of the emission layer in green phosphorescent organic light emitting
devices. Organic Electronics, 2011. 12(4): p. 582-588.
16. Seo, J.H., et al., White organic light-emitting diodes showing nearly 100%
internal quantum efficiency. Organic Electronics, 2010. 11(11): p. 1759-1766.
17. Tang, C.W. and S.A. VanSlyke, Organic electroluminescent diodes. Applied
Physics Letters, 1987. 51(12): p. 913-915.
18. Liu, S., et al., Highly efficient white organic light-emitting devices consisting of
undoped ultrathin yellow phosphorescent layer. Journal of Luminescence, 2013.
134(0): p. 665-669.
19. D'Andrade, B.W. and S.R. Forrest, Effects of exciton and charge confinement
on the performance of white organic p - i - n electrophosphorescent emissive
excimer devices. Journal of Applied Physics, 2003. 94(5): p. 3101-3109.
20. Tang, C.W., S.A. VanSlyke, and C.H. Chen, Electroluminescence of doped
organic thin films. Journal of Applied Physics, 1989. 65(9): p. 3610-3616.
21. Yu, J., et al., Film thickness influence of dual iridium complex ultrathin layers
on the performance of nondoped white organic light-emitting diodes. Displays, 2011.
32(2): p. 87-91.

100
22. Tsierkezos, N., Cyclic Voltammetric Studies of Ferrocene in Nonaqueous
Solvents in the Temperature Range from 248.15 to 298.15 K. Journal of Solution
Chemistry, 2007. 36(3): p. 289-302.
23. Yam, V.W.W., W.K. Lee, and T.F. Lai, Synthesis, spectroscopy, and
electrochemistry of trinuclear copper(I) acetylides. X-ray crystal structure of
[Cu3(.mu.-Ph2PCH2PPh2)3(.mu.3-.eta.1-C.tplbond.CBu-tert)(.mu.3-Cl)]PF6.
Organometallics, 1993. 12(6): p. 2383-2387.
24. Yam, V.W.-W., et al., Synthesis, structure, photophysics, time-resolved
emission spectroscopy and electrochemistry of luminescent copper(I) acetylide
complexes. Journal of the Chemical Society, Dalton Transactions, 1996. 0(15): p.
3283-3287.
25. Kuang, S.-M., et al., Synthesis and Structural Characterization of Cu(I) and
Ni(II) Complexes that Contain the Bis[2-(diphenylphosphino)phenyl]ether Ligand.
Novel Emission Properties for the Cu(I) Species. Inorganic Chemistry, 2002. 41(12):
p. 3313-3322.
26. Mydlak, M., et al., Positively Charged Iridium(III) Triazole Derivatives as Blue
Emitters for Light-Emitting Electrochemical Cells. Advanced Functional Materials,
2010. 20(11): p. 1812-1820.
27. Lowry, M.S. and S. Bernhard, Synthetically Tailored Excited States:
Phosphorescent, Cyclometalated Iridium(III) Complexes and Their Applications.
Chemistry – A European Journal, 2006. 12(31): p. 7970-7977.
28. Bolink, H.J., et al., Origin of the large spectral shift in electroluminescence in a
blue light emitting cationic iridium(iii) complex. Journal of Materials Chemistry, 2007.
17(48): p. 5032-5041.
29. De Angelis, F., et al., Controlling Phosphorescence Color and Quantum
Yields in Cationic Iridium Complexes: A Combined Experimental and Theoretical
Study. Inorganic Chemistry, 2007. 46(15): p. 5989-6001.
30. Schrögel, P., et al., Meta-linked CBP-derivatives as host materials for a blue
iridium carbene complex. Organic Electronics, 2011. 12(12): p. 2047-2055.
31. Adachi, C., et al., Nearly 100% internal phosphorescence efficiency in an
organic light-emitting device. Journal of Applied Physics, 2001. 90(10): p. 5048-
5051.
101
32. Jeon, W.S., et al., Ideal host and guest system in phosphorescent OLEDs.
Organic Electronics, 2009. 10(2): p. 240-246.
33. Guan, M., et al., The host materials containing carbazole and oxadiazole
fragment for red triplet emitter in organic light-emitting diodes. Organic Electronics,
2006. 7(5): p. 330-336.
34. Ohmori, Y., H. Kajii, and Y. Hino, Organic Light-Emitting Diodes Fabricated by
a Solution Process and Their Stress Tolerance. Display Technology, Journal of,
2007. 3(2): p. 238-244.

102
Chapter 4: Conclusions and future investigations
103
The contribution of this research has been found an alternative materials to
the expensive iridium and platinum complexes for organic light emitting diodes. In
this study, novel copper (I) complexes have been synthesized, trinuclear copper (I)
complexes carrying alkynyl ligands and mononuclear copper (I) complexes carrying
phosphine and bipyridine ligands.
A range of emission colours, from sky blue to deep red, was shown by using
alkynyl ligands with different electronic properties in the trinuclear copper (I)
complexes. These novel complexes possess a quantum yield of photoluminescence
comparable with other phosphorescent metal complexes used in OLEDs, such as
iridium (III) cyclometalated complexes. They show another interesting optical
property: their lifetime could be tuned from microseconds to milliseconds. For some
of these complexes, which have conjugated alkynyl ligands, their extended lifetime is
an indication of stabilised excited state. Their temperature decomposition range is
from 184 oC to 269 oC, which depend on their electro withdrawing subtituents on the
alkynyl ligand. However, the study of the complexes, by differential scanning
calorimetry and by cyclic voltammetry, provides evidence for irreversible thermal and
electrochemical behaviour, respectively. All these results suggest interesting optical
properties for very novel copper (I) complexes with alkynyl ligands, but their thermal
and electrochemical instability was demonstrated, which hamper their foreseeable
application in organic light emitting diodes.
In order to develop more stable copper (I) complexes for organic light emitting
diodes, a range of mononuclear copper (I) complexes was synthesised. These new
complexes, carry a variety of bipyridyl and diphosphine ligands, which tune the
optical and physical properties of the complexes. Unlike the trinuclear copper (I)
complexes, the mononuclear complexes provide a narrow range of emission colours.
Their high efficient emission active is only evident when bipyridyl ligand carring
methyl substituients face the copper ion. These methyl groups play a role to avoid
external quenching, as the geometrical arrangement provides a more rigid
configuration. Conversely, the complexes without or with methyl groups out-side of
the copper nucleus, show a non radiative decay path. In all cases, the thermal
properties depend on the phosphine ligands. They show a temperature of
decomposition from 200 oC to 300 oC, where the complexes with

104
thriphenylphosphine ligands show the lowest temperature. The other complexes
could be processed in a polymer matrix, which demonstrate their ability to be used
in plastic manufacturing. However, these complexes are not electrochemically
stable, as the cyclic voltammetry shows.
In summary, this second group of synthesised copper (I) complexes gives a
contribution to understand and consider copper complexes as a new generation of
alternative material for organic light emitting diodes.
Both groups of synthesised copper complexes, trinuclear and mononuclear,
shows that the structure of the ligands are the most important factor to define the
optical, chemical and physical properties.
For future investigations, it would be recommendable to synthesize and
realise a systematic study of equivalent complexes with silver and gold as it could be
possible the synthesis of other d10 transition metal, such as gold, with phenyl pyridine
ligands and another kind of ligands.
These novel complexes could be used in future applications, such as in
biological systems. They have demonstrated a high sensitivity to oxygen, which
could be very useful in biology.
105
Appendix 1: Lifetime curves of trinuclear copper (I)
complexes

106
Graph 1. Lifetime curve of trinuclear copper complex 2 which possess 1-ethynyl-2,4-difluorobenzene as alkynyl ligand.
Graph 2. Lifetime curve of trinuclear copper complex 3 which possess 1-ethynyl-3,5-difluorobenzene as alkynyl ligand.

107
Graph 3. Lifetime curve of trinuclear copper complex 4 which possess 1-ethynyl-3,5-bis(trifluoromethyl)benzene as alkynyl ligand.
Graph 4. Lifetime curve of trinuclear copper complex 5 which possess 1-ethynyl-α,α,α-4-(trifluoromethyl)benzene as alkynyl ligand.

108
Graph 5. Lifetime curve of trinuclear copper complex 6 which possess 9-ethynylphenanthrene as alkynyl ligand.
Graph 6. Lifetime curve of trinuclear copper complex 7 which possess 2-ethynyl-6-metoxynaphthalene as alkynyl ligand.

109
Graph 7. Lifetime curve of trinuclear copper complex 8 which possess 1-ethynylpyrene as alkynyl ligand.
110
Appendix 2: Lifetime curves of mononuclear copper
(I) complexes

111
Graph 1. Lifetime curve of mononuclear copper complex 9 which possess 2,2’-bipyridyl as pyridine ligand and bis-(diphenylphosphinophenyl)ether as phosphine ligand.
Graph 2. Lifetime curve of mononuclear copper complex 10 which possess 4,4’-dimethyl-2,2’-bipyridyl as pyridine ligand and bis-(diphenylphosphinophenyl)ether as phosphine ligand.
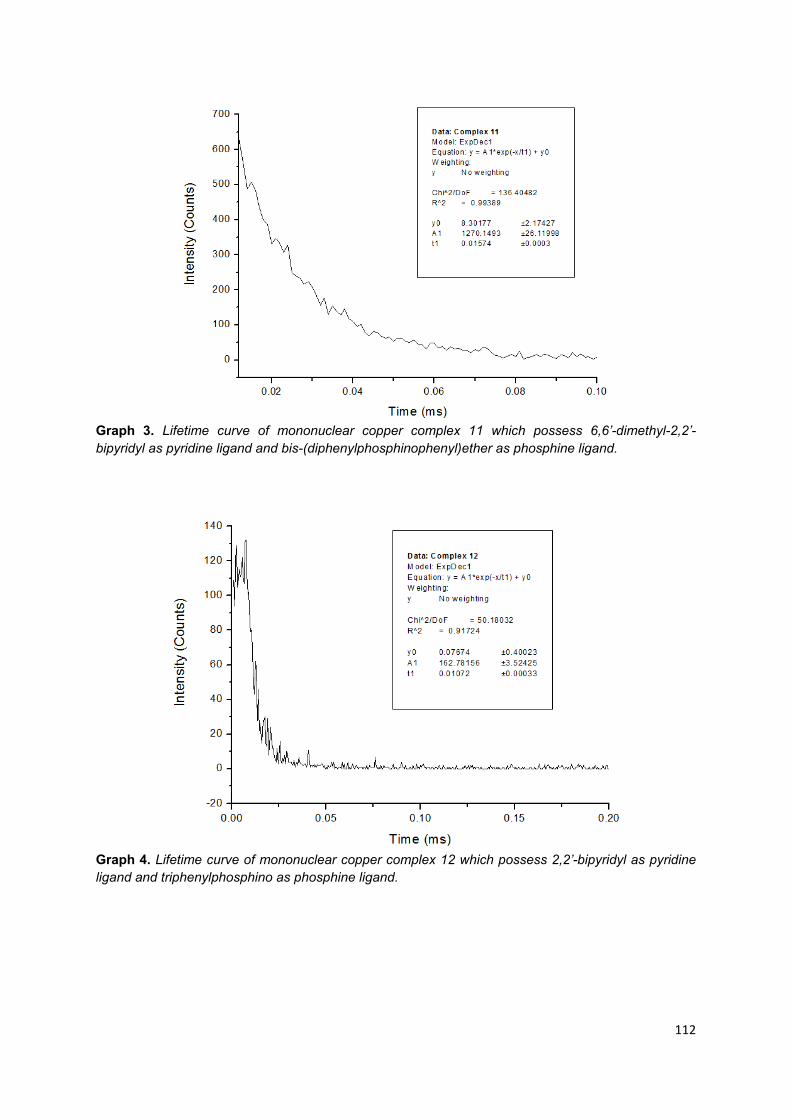
112
Graph 3. Lifetime curve of mononuclear copper complex 11 which possess 6,6’-dimethyl-2,2’-bipyridyl as pyridine ligand and bis-(diphenylphosphinophenyl)ether as phosphine ligand.
Graph 4. Lifetime curve of mononuclear copper complex 12 which possess 2,2’-bipyridyl as pyridine ligand and triphenylphosphino as phosphine ligand.
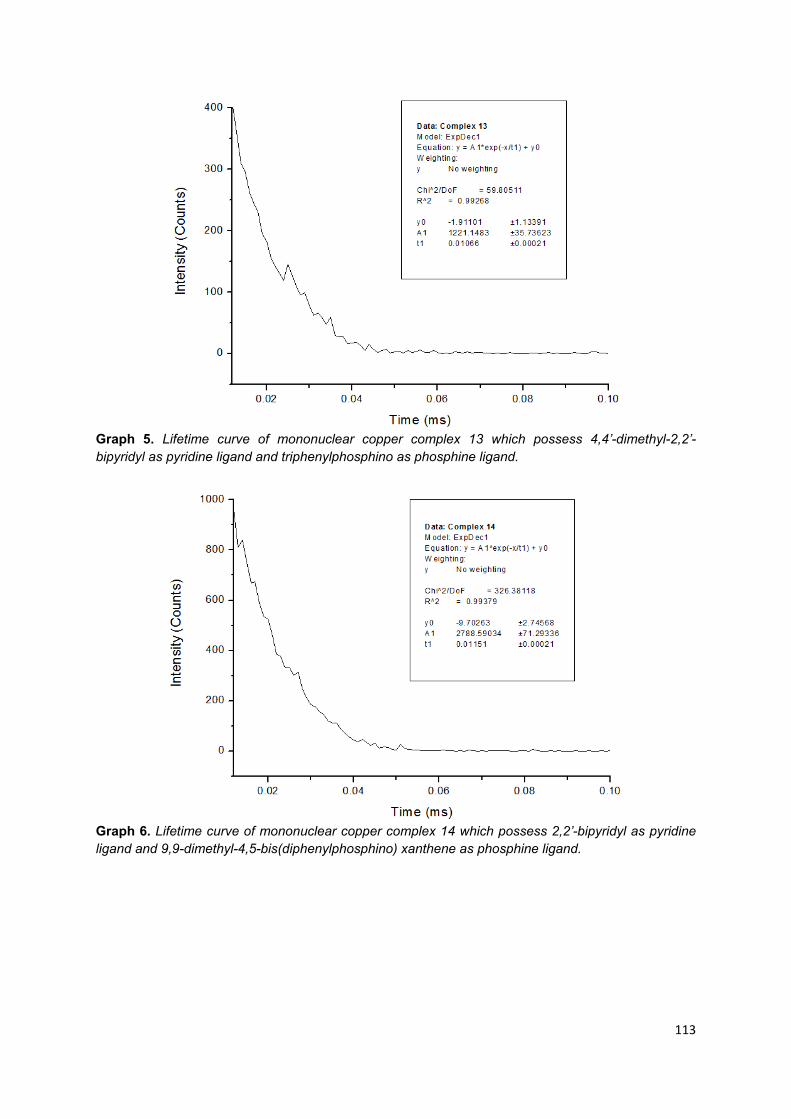
113
Graph 5. Lifetime curve of mononuclear copper complex 13 which possess 4,4’-dimethyl-2,2’-bipyridyl as pyridine ligand and triphenylphosphino as phosphine ligand.
Graph 6. Lifetime curve of mononuclear copper complex 14 which possess 2,2’-bipyridyl as pyridine ligand and 9,9-dimethyl-4,5-bis(diphenylphosphino) xanthene as phosphine ligand.
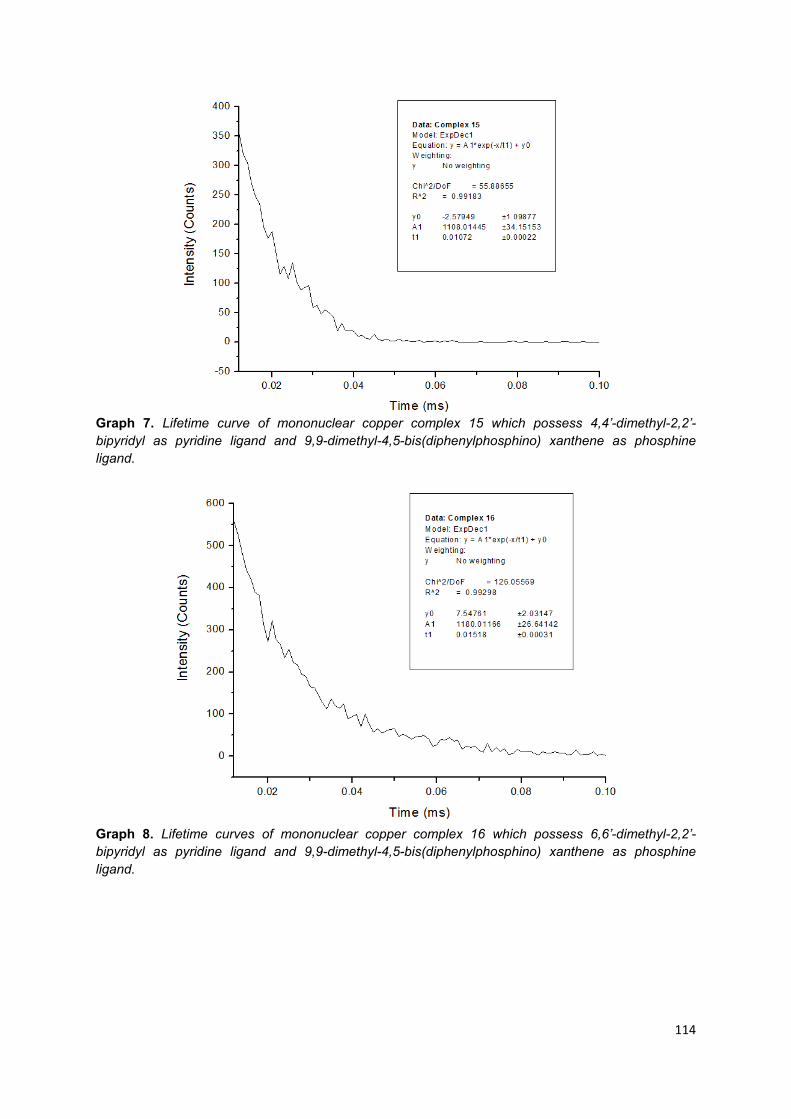
114
Graph 7. Lifetime curve of mononuclear copper complex 15 which possess 4,4’-dimethyl-2,2’-bipyridyl as pyridine ligand and 9,9-dimethyl-4,5-bis(diphenylphosphino) xanthene as phosphine ligand.
Graph 8. Lifetime curves of mononuclear copper complex 16 which possess 6,6’-dimethyl-2,2’-bipyridyl as pyridine ligand and 9,9-dimethyl-4,5-bis(diphenylphosphino) xanthene as phosphine ligand.

115
Appendix 3: Different scanning calorimetry graphs
of trinuclear copper (I) complexes

Graph1alkynyl l
Graph 2alkynyl l
. DSC curveligand.
2. DSC curveligand.
e of trinuclea
e of trinuclea
ar copper com
ar copper co
mplex 2 whi
omplex 3 whi
ich possess
ich possess
1-ethynyl-2,4
1-ethynyl-3,5
4-difluoroben
5-difluoroben
116
nzene as
nzene as
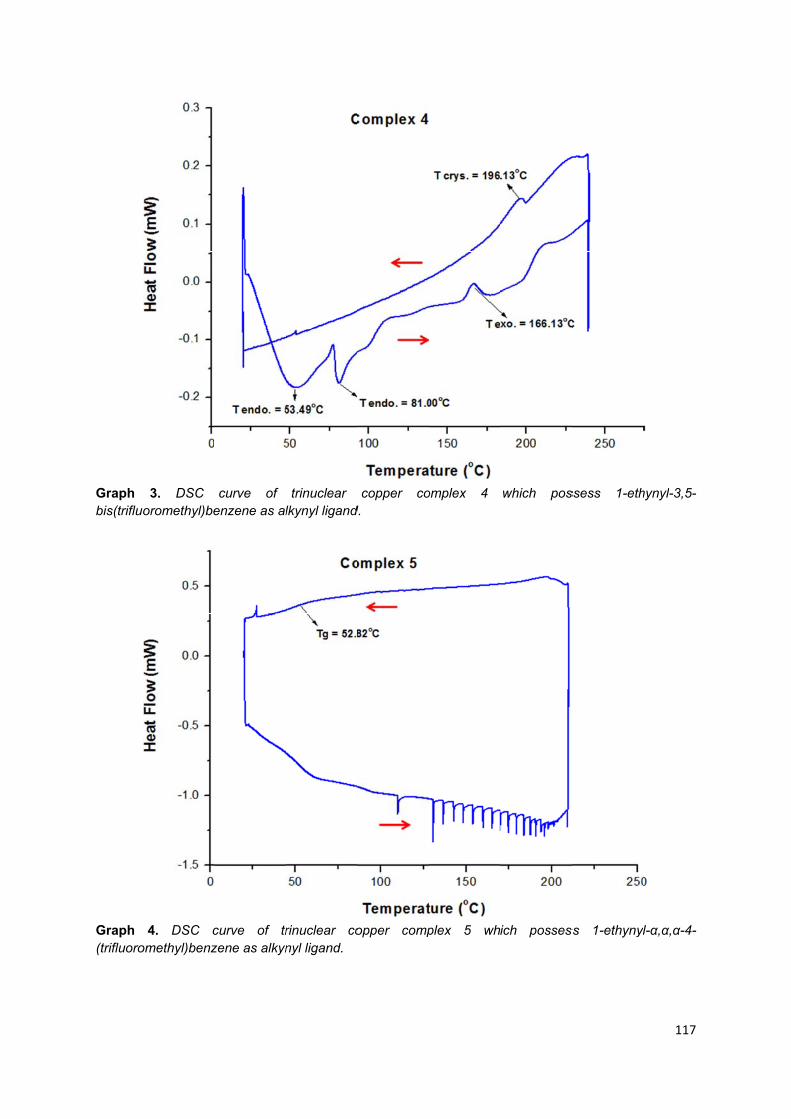
Graph bis(trifluo
Graph (trifluoro
3. DSC oromethyl)be
4. DSC comethyl)benz
curve of enzene as al
curve of trzene as alkyn
trinuclear lkynyl ligand
rinuclear conyl ligand.
copper cod.
opper comp
omplex 4
plex 5 wh
which pos
ich posses
ssess 1-eth
ss 1-ethynyl
117
hynyl-3,5-
l-α,α,α-4-

Graph 5.
Graph 6.
ligand.
DSC curve of
. DSC curve of
f trinuclear cop
of trinuclear c
pper complex
opper comple
6 which posse
ex 7 which po
ess 9‐ethynylp
ossess 2‐ethyn
phenanthrene
nyl‐6‐metoxyn
e as alkynyl lig
naphthalene a
118
gand.
as alkynyl

Graph 77. DSC curvee of trinuclear copper commplex 8 whic
ch possess 1-ethynylpyreene as alkyny
119
yl ligand.
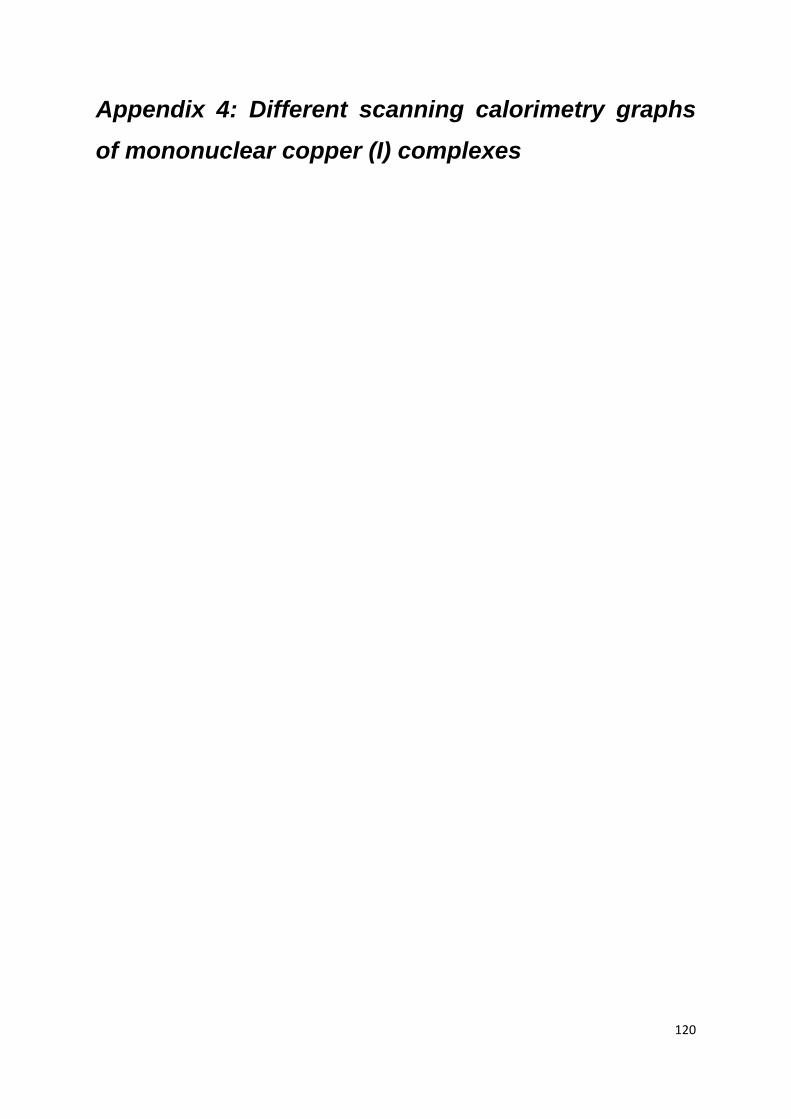
120
Appendix 4: Different scanning calorimetry graphs
of mononuclear copper (I) complexes

Graph 1ligand an
Graph 2pyridine
1. DSC curvnd bis-(diphe
2. DSC curveligand and b
ve of mononenylphosphin
e of mononucbis-(diphenyl
nuclear coppnophenyl)eth
clear copperlphosphinoph
per complexher as phosp
r complex 10henyl)ether a
x 9 which pophine ligand.
0 which posseas phosphine
ossess 2,2’-
ess 4,4’-dimee ligand.
-bipyridyl as
ethyl-2,2’-bip
121
pyridine
pyridyl as

Graph 3pyridine
Graph 4ligand an
3. DSC curveligand and b
4. DSC curvnd triphenylp
e of mononucbis-(diphenyl
ve of mononphosphino as
clear copperlphosphinoph
nuclear copps phosphine
r complex 11henyl)ether a
per complex ligand.
which posseas phosphine
12 which p
ess 6,6’-dimee ligand.
possess 2,2’-
ethyl-2,2’-bip
-bipyridyl as
122
pyridyl as
s pyridine
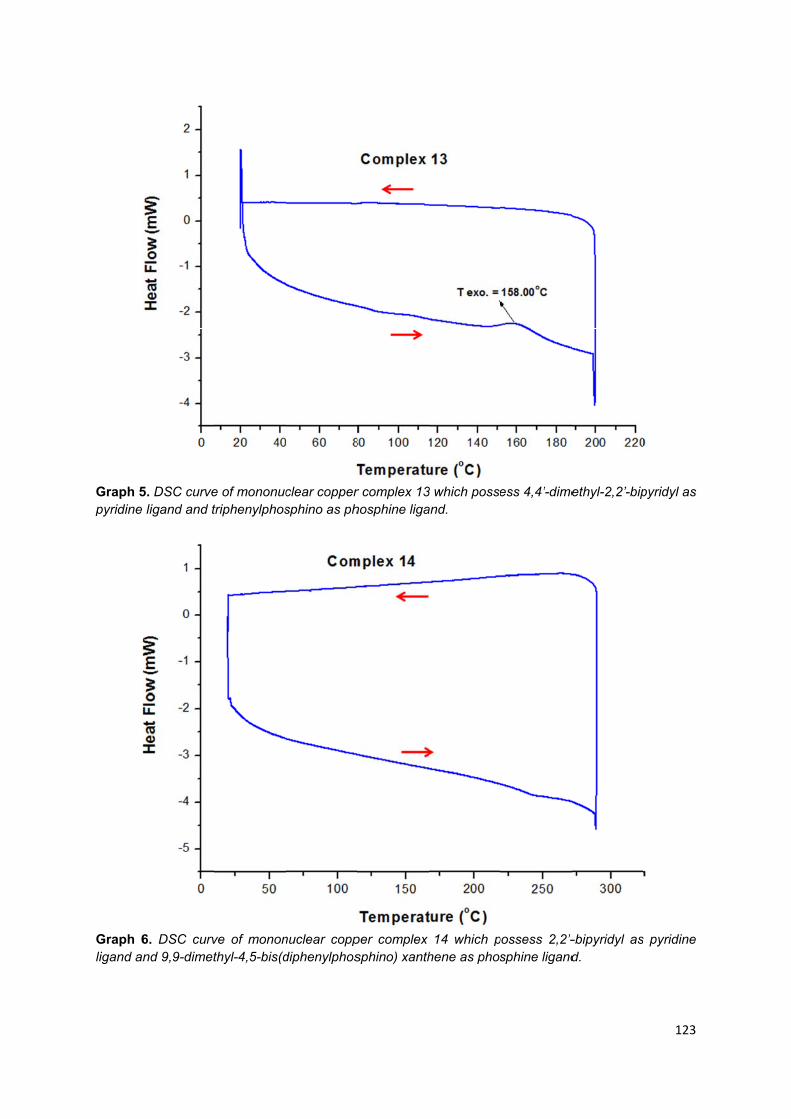
Graph 5pyridine
Graph 6ligand an
5. DSC curveligand and t
6. DSC curvnd 9,9-dimet
e of mononuctriphenylphos
ve of mononthyl-4,5-bis(d
clear coppersphino as ph
nuclear coppdiphenylphos
r complex 13hosphine liga
per complex sphino) xanth
3 which posseand.
14 which phene as phos
ess 4,4’-dime
possess 2,2’-sphine ligand
ethyl-2,2’-bip
-bipyridyl asd.
123
pyridyl as
s pyridine
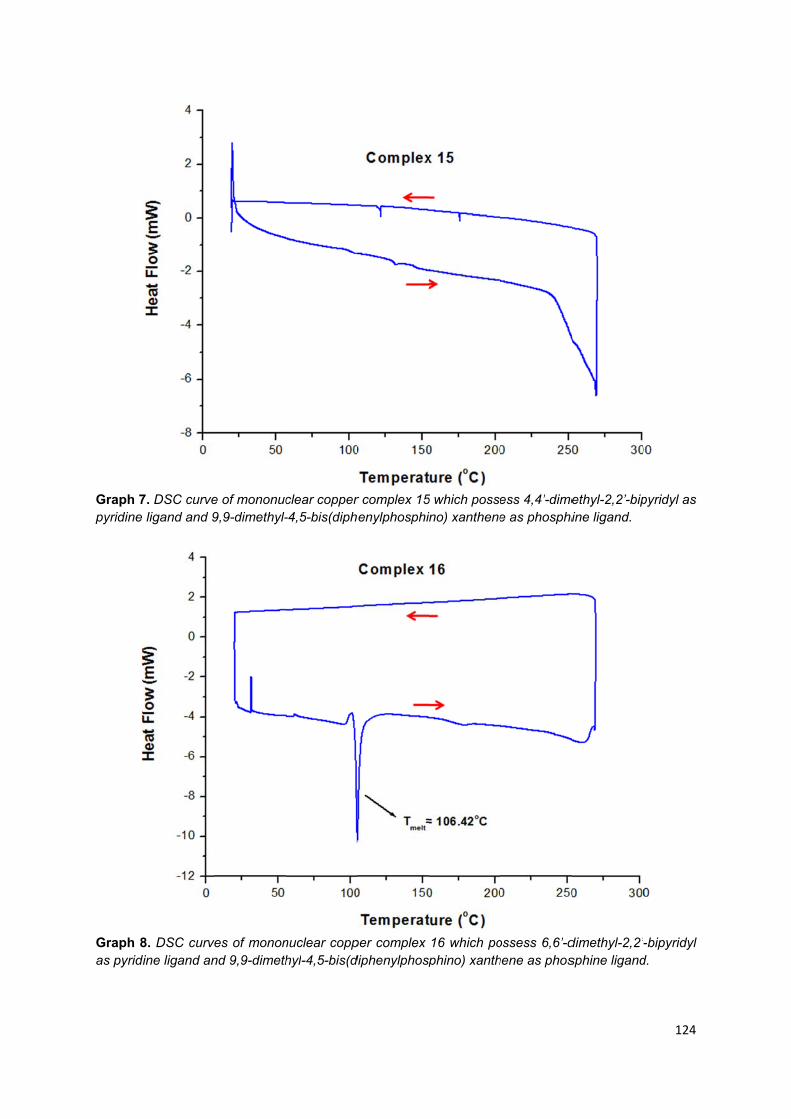
Graph 7pyridine
Graph 8as pyridi
7. DSC curveligand and 9
8. DSC curvedine ligand an
e of mononuc9,9-dimethyl-
es of mononnd 9,9-dimeth
clear copper-4,5-bis(diph
nuclear copphyl-4,5-bis(d
r complex 15enylphosphi
per complex diphenylphosp
5 which posseino) xanthene
16 which pophino) xanth
ess 4,4’-dimee as phosphi
ossess 6,6’-dhene as phos
ethyl-2,2’-bipine ligand.
dimethyl-2,2’sphine ligand
124
pyridyl as
’-bipyridyl d.

125
Appendix 5: Cyclic Voltammetry graphs of trinuclear
copper (I) complexes
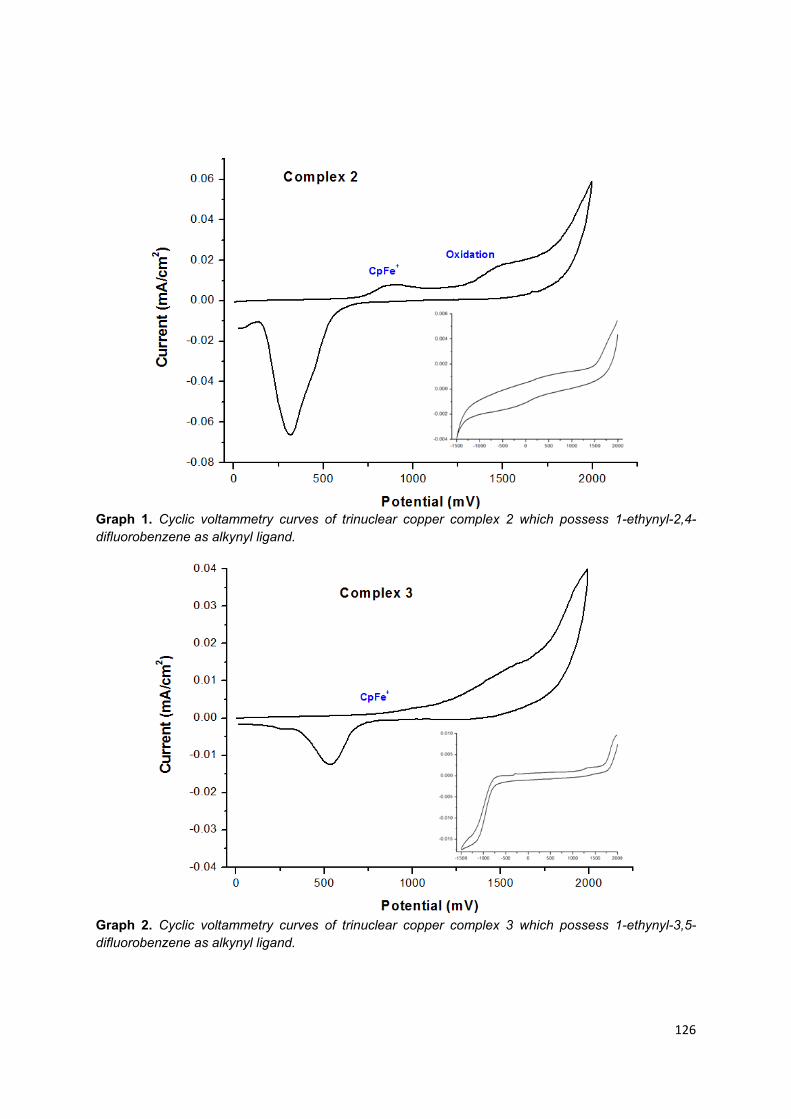
126
Graph 1. Cyclic voltammetry curves of trinuclear copper complex 2 which possess 1-ethynyl-2,4-difluorobenzene as alkynyl ligand.
Graph 2. Cyclic voltammetry curves of trinuclear copper complex 3 which possess 1-ethynyl-3,5-difluorobenzene as alkynyl ligand.

127
Graph 3. Cyclic voltammetry curves of trinuclear copper complex 4 which possess 1-ethynyl-3,5-bis(trifluoromethyl)benzene as alkynyl ligand.
Graph 4. Cyclic voltammetry curves of trinuclear copper complex 5 which possess 1-ethynyl-α,α,α-4-(trifluoromethyl)benzene as alkynyl ligand.

128
Graph 5. Cyclic voltammetry curves of trinuclear copper complex 6 which possess 9-ethynylphenanthrene as alkynyl ligand.
Graph 6. Cyclic Voltammetry curves of trinuclear copper complex 7 which possess 2-ethynyl-6-metoxynaphthalene as alkynyl ligand.

129
Graph 7. Cyclic voltammetry curves of trinuclear copper complex 8 which possess 1-ethynylpyrene as alkynyl ligand.

130
Appendix 6: Cyclic Voltammetry graphs of
mononuclear copper (I) complexes
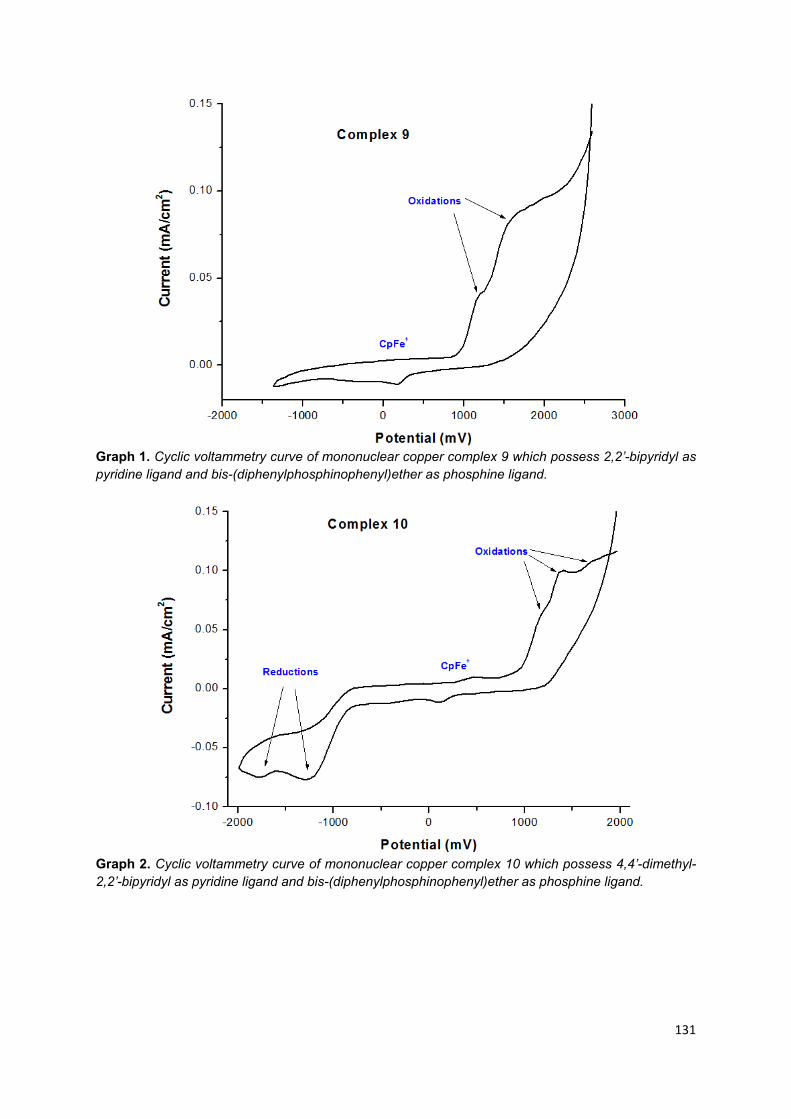
131
Graph 1. Cyclic voltammetry curve of mononuclear copper complex 9 which possess 2,2’-bipyridyl as pyridine ligand and bis-(diphenylphosphinophenyl)ether as phosphine ligand.
Graph 2. Cyclic voltammetry curve of mononuclear copper complex 10 which possess 4,4’-dimethyl-2,2’-bipyridyl as pyridine ligand and bis-(diphenylphosphinophenyl)ether as phosphine ligand.
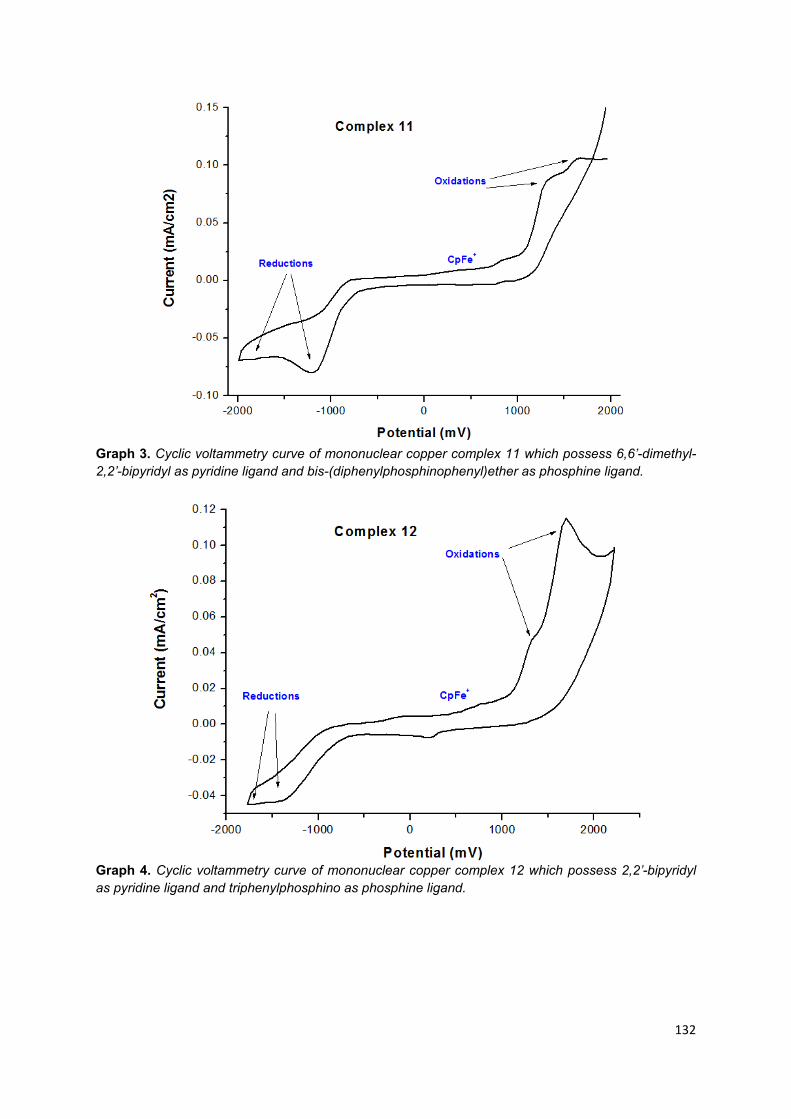
132
Graph 3. Cyclic voltammetry curve of mononuclear copper complex 11 which possess 6,6’-dimethyl-2,2’-bipyridyl as pyridine ligand and bis-(diphenylphosphinophenyl)ether as phosphine ligand.
Graph 4. Cyclic voltammetry curve of mononuclear copper complex 12 which possess 2,2’-bipyridyl as pyridine ligand and triphenylphosphino as phosphine ligand.

133
Graph 5. Cyclic voltammetry curve of mononuclear copper complex 13 which possess 4,4’-dimethyl-2,2’-bipyridyl as pyridine ligand and triphenylphosphino as phosphine ligand.
Graph 6. Cyclic voltammetry curve of mononuclear copper complex 14 which possess 2,2’-bipyridyl as pyridine ligand and 9,9-dimethyl-4,5-bis(diphenylphosphino) xanthene as phosphine ligand.

134
Graph 7. Cyclic voltammetry curve of mononuclear copper complex 15 which possess 4,4’-dimethyl-2,2’-bipyridyl as pyridine ligand and 9,9-dimethyl-4,5-bis(diphenylphosphino) xanthene as phosphine ligand.
Graph 8. Cyclic voltammetry curve of mononuclear copper complex 16 which possess 6,6’-dimethyl-2,2’-bipyridyl as pyridine ligand and 9,9-dimethyl-4,5-bis(diphenylphosphino) xanthene as phosphine ligand.

135
Appendix 7: Publications
Due to publisher copyright restrictions the publications from this thesis are excluded.
D