synoptic variability in the black sea. analysis of hydrographic survey and altimeter data
TRANSCRIPT

Ž .Journal of Marine Systems 31 2001 45–63www.elsevier.comrlocaterjmarsys
Synoptic variability in the Black Sea. Analysis of hydrographicsurvey and altimeter data
Elena Sokolova a, Emil V. Stanev a,) ,1, Valery Yakubenko b, Ivan Ovchinnikov b,†,Ruben Kos’yan b
a Department of Meteorology and Geophysics, Faculty of Physics, UniÕersity of Sofia, 5 James Bourchier Street, 1126 Sofia, Bulgariab Southern Branch of ShirshoÕ Institute of Oceanology, Russian Academy of Science, Gelendjik, Russia
Received 10 October 1999; accepted 25 April 2001
Abstract
Mesoscale features in the Black Sea circulation obtained from fine resolution hydrographic survey data andŽ .TOPEXrPoseidon TrP altimeter are compared. Important scales, associated with pronounced eddy variability and
diapycnal exchange at the depth of redox-zone, which are well resolved in the hydrographic survey data, are not sufficientlyresolved in the altimeter data. However, the satellite data give clear signals associated with the variability of generalcirculation, as well as with the dynamics of larger eddies. The seasonal transitions in the circulation between the intensewinter–spring state and the less intense summer–fall state is also well resolved. The propagation patterns of oscillationsalong the eastern coast detected from satellite altimetry support earlier concepts based on direct observations in this region.The correlation between two data types reveals the value of altimeter-derived signals as representative data source fordescribing the temporal changes of mesoscale ocean dynamics. Some estimates about the possible use of altimeter data forassimilation in numerical models are provided. q 2001 Elsevier Science B.V. All rights reserved.
Keywords: Satellite altimetry; Hydrographic surveys; Mesoscale features; Black Sea
1. Introduction
The Black Sea has been subject to deep oceano-graphic interest for a long time, starting from thefundamental study of Marsigly in the 17th century
Ž .on the exchange in the Bosphorus Straits Gill, 1982 ,until the recent time when several international pro-
) Corresponding author. Tel.: q359-2-6256289; fax: q359-2-9625276.
Ž .E-mail address: [email protected] E.V. Stanev .1 Present affiliation: ICBM, University of Oldenburg, Germany.† Deceased.
grams have been launched to study the differentaspects of Black Sea environment. Among them, theventilation project funded by the EU made it possi-ble to bring together the efforts of scientists withdifferent expertise aiming at deeper understandingand quantifying the ventilation of subsurface layers.The key role of mesoscale processes in the ventila-tion motivates us to address their appearance in theBlack Sea and to explore the consistency and com-
Žplimentarity of data of quite different origin hydro-.graphic survey and satellite observations when
quantifying the mesoscale circulation.The observational activities in recent years and
some new theoretical results contributed to displac-
0924-7963r01r$ - see front matter q 2001 Elsevier Science B.V. All rights reserved.Ž .PII: S0924-7963 01 00046-X
( )E. SokoloÕa et al.rJournal of Marine Systems 31 2001 45–6346
ing the main interest in the Black Sea oceanographyfrom the general circulation issues to the mesoscalevariability. Detailed description of the recent hydro-
¨graphic surveys is given by Ozsoy and UnluataŽ .1998 and the specific findings associated with themesoscale circulation are reported by Oguz et al.Ž .1993, 1994 . Here, we will only remind that theinternal Rossby radius in the Black Sea is ;20–30km and the mesoscale and sub-basin scale eddieshave diameters ranging from several tens to hun-dreds of kilometers. The baroclinic instability of thenarrow Rim Current encompassing the entire basingives the major source of mesoscale variability. Thiscurrent follows the continental slope with the coaston its right. Between the current and the coast, asystem of intense coastal anticyclones is observedŽ;10–20 eddies at the same time, according to
.Ovchinnikov, 1998 . Among them, the most impor-tant are the Batumi eddy in the easternmost corner of
Žthe sea and the Sevastopol eddy west of Crimea.Peninsula . The former has been found for the first
Ž .time by Kaz’min and Sklyarov 1982 from infraredimagery and its existence has been supported manytimes afterwards in the analyses of data from hydro-
Ž .graphic surveys e.g., Oguz et al., 1993, 1994 .The transport and mixing associated with
mesoscale eddies provide a fundamental mechanismfor the penetration of cold surface water into thepycnocline, which recently motivated a number ofanalyses on hydrographic survey data, as well asnumerical simulations. The contribution of eddies iswell illustrated on the example of intermediate waterformation. Two coastal areas are of utmost interest:the shelf edgercontinental slope area and the area ofanticyclonic eddies. In the first area, the cold watersare usually AtrappedB along the shelf edgercontinen-
Ž .tal slope isobath 65–75 m and the convection alongthe narrow continental slope favors the deepening ofcold waters. In the second area, the penetration of
Ž .cold intermediate water CIW into the halocline isdominated by downwelling in the anticyclones. Thespecific circulation in the Black Sea governs theefficiency of ventilation in this zone since the anticy-clonic eddies are located between the main gyre andthe coast, which approximately coincides with thezone of most intense cooling. The winter convectionmight be enhanced at the periphery of coastal anticy-
Ž .clones Stanev and Staneva, 2001 , which demon-
strates that the lateral intrusions of coastal watersŽ .into the pycnocline associated with eddy dynamics
govern the characteristics of cold intermediate water,as well as the amplitude of annual signal at thesedepths. An alternative idea about the CIW formationŽ .Ovchinnikov and Popov, 1987 suggests that part ofthe CIW is formed in the centers of cyclonic eddieswhere the newly generated surface waters spiralalong the dome-shaped isopycnal surfaces. This hy-pothesis focuses on the dynamic nature of CIWformation and it is strongly supported in the simula-
Ž .tions of Staneva and Stanev 1997 and Stanev andŽ .Staneva 2001 .
The theoretical studies, and in particular the nu-merical modeling, added new knowledge on themesoscale variability and its control on the ventila-tion of pycnocline. The high resolution modeling
Žefforts Oguz et al., 1995; Staneva and Stanev, 1997;Beckers et al., 2002, in press; Stanev and Staneva,
.2000 succeeded in producing realistic mean fieldsand eddy statistics. The study of Stanev and StanevaŽ .2001 gave more clarity on the contribution ofmesoscale processes in the ventilation of upper pycn-ocline. However, estimates on the diapycnal mixingthroughout the year at depths which slightly exceed
Ž .the depth of cold intermediate layer CIL are stillmissing, particularly as it concerns the contributionof this mixing to the ventilation of anoxic waters. Toour knowledge, the existing studies based on obser-
Ž .vations have not yet addressed: 1 the contributionŽ .of eddies in the ventilation, 2 the role of mesoscale
variability as a mechanism of switching the circula-Žtion between its different regimes Stanev and
. Ž .Staneva, 2000 , 3 the dominating propagation pat-terns associated with basin waves and baroclinicinstabilities. The limited number of hydrographicsurveys makes the answer to the above questionsdifficult and motivates us to formulate here the
Ž .following two questions: 1 Is there a useful infor-mation in the satellite altimeter data that can be used
Ž .as a complement to sea-borne observations, and 2if yes, could it be possible, by assimilating data innumerical models, to carry out real time integrationswith realistic representation of eddies that wouldmake it possible to correctly estimate their role forthe ventilation. In this paper, we will give an answerto the first question and will provide examples ofvery strong diapycnal mixing in the pycnocline. The

( )E. SokoloÕa et al.rJournal of Marine Systems 31 2001 45–63 47
consistency between data from altimeters and hydro-graphic surveys established here will define theframes and perspectives of further analyses of differ-ent aspects of Black Sea mesoscale and sub-basinscale processes. We will also discuss some problemsin data sampling, which may affect the efficiency ofdata assimilation.
The application of satellite altimetry to studyingBlack Sea dynamics was initiated by Korotaev et al.Ž .1998 , who compared the Black Sea surface anomaly
Ž .obtained from TOPEXrPoseidon TrP data andfrom hydrographic surveys collected during theCoMSBlack measurements. Some results of satellitedata assimilation in numerical circulation model arealso given in this study, demonstrating a good corre-lation between simulated sea level, when the modelis run in assimilation mode, and the sea level derived
Žfrom hydrographic survey data. Later Korotaev et.al., 2001 addressed the seasonal and mesoscale
variability using TrP and ERS-1 data, and in partic-ular the mesoscale variability associated with theRim Current. The regionalization of variability in
Ždifferent spectral bands intraannual, seasonal and.interannual , as well as the correlation between the
Ž .mechanical forcing and sea level anomaly SLA hasŽ .been studied by Stanev et al. 2000 .
In the present paper, we extend the analysescarried out in the preceding studies using longer timeseries of TrP data and more recent hydrographicsurvey data. The major area of our interest is theeastern Black Sea, where a number of observationshave been carried out during the period 1993–1998.The paper is structured as follows: after Introduction,we describe in Section 2 the data used in this study.The consistency between hydrographic survey andTrP data is addressed in Section 3, followed byConclusions at the end of paper.
2. Data used in the study
2.1. Hydrographic surÕey data
The traditional observational basis for studyingmesoscale and sub-basin scale variability is limited
Ž . Ž .by the lack of 1 long-term time series, and 2observations with sufficiently dense sampling overlarge regions. The situation seems to improve, partic-
ularly after the international initiatives in the frameof CoMSBlack program and NATO TU Black Seaproject. In the present paper, we analyse one of these
Ž .surveys 2–14 April 1993 , in which the resolutionof field measurements was 1r38 in the meridionaland zonal directions, and the station network, whereCTD data for temperature and salinity were mea-sured, comprised of 299 stations. The measurementscarried by the southern branch of Shirshov Instituteof Oceanology give the main amount of hydro-graphic survey data in the Black Sea after 1993.Here, we describe briefly this database, for moredetails we refer to the works by Krivosheya et al.Ž .1998a,b . The data originate from four cruises of
Ž .RV Vityaz and RV Akvanavt Table 1 . The mea-surements of the RV Vityaz are taken in the period5–29 November 1993 and the data sets comprise of117 stations, the maximum depth of the profiles is1800 dbar. During that period, the weather wasstormy with air temperature of ;y5 to 0 8C and
Žsea surface temperature of 7.8–8.5 8C Krivosheya et.al., 1997 . A well-developed anticyclonic eddy was
Ž .detected in the open sea ;130 km offshore , whichwas associated with the meandering of jet current,resulting in a very deep penetration of surface signal.The surveys of the RV Akvanavt were carried out inthe periods 24 August–1 September 1994, 11–19September 1994 and 29 August–5 September 1998.The first one included measurements in 57 locationsdown to 300 dbar. The second one consisted of 62stations with resolution decreasing from 10 miles inthe coastal zone to 20=22 miles in the open sea.The measurements were taken down to 1810 dbar.The circulation in that period was dominated byintense Rim Current, which followed the coast up
Žto the transect of Gelendgik Krivosheya et al.,.1998a,b . Beyond that area, a rapid westward change
of current direction was observed, the coastal circula-tion in front of Tuapse dominated by a pronouncedanticyclone. The third survey of the RV Akvanavtincluded measurements in 59 stations with maximaldepth of 2071 dbar. The distance between stationswas 3 and 10 miles, between sections, 15 and 18miles. At that period, the Rim Current was split intoseveral eddy structures. An anticyclonic eddy withcenter at ;45 miles southwest from Novorosiiskwas located in the open sea. Another anticycloniceddy dominated the circulation in the coastal zone

( )E. SokoloÕa et al.rJournal of Marine Systems 31 2001 45–6348
Table 1Characteristics of surveys
Time Number of Resolution Max depth ofŽ .stations observation dbar
2–14r04r1993 299 20 miles 21305–29r11r1993 117 from 25=20 to 10=5 miles 180024r08–1r09r1994 57 ;15 miles 30011–19r09r1994 62 from 10 to 20–22 miles 181029r08–5r09r1998 59 from 3–10 to 15–18 miles 2071
near Sochi. Between them a cyclonic eddy wasobserved.
The penetration of surface water into the deeplayers is controlled by the mixing of Mediterraneanand Black Sea water in the Bosphorus outflow areaand the diapycnal mixing in the areas of large slope
Žof pycnocline over the continental slope, Stanev et.al., in press . To our knowledge, detailed estimates
on the contribution of lateral exchange and diapycnalmixing are still missing in the Black Sea oceanogra-phy. Though the present study does not aim to enterinto the details of thermohaline processes, we willgive an illustration about the possible role of eddiesin diapycnal exchange, justifying in this way therelevance of the results in the remainder of the paperto the issues associated with the ventilation of BlackSea anoxic layers.
Dynamic heights calculated using RV Vityaz sur-Ž .vey data 5–29 November 1993 with a reference
level of 300 m reveal a number of mesoscale fea-Ž .tures dominating the circulation Fig. 1a . Among
Ž .them are the pronounced anticyclones dark shadingin the lower left corner, as well as the one at 36.58E.
Ž .The most pronounced cyclonic eddies light shadingare located at 32–338E and in the easternmost part ofthe survey region. The temperature patterns at differ-ent s surfaces, that is, at different geometric depths,t
show a good correlation with the dynamic heightsdemonstrating that the mesoscale circulation shapesthe distribution of heat. Since the source of oxygen,like the one of cooling, is at sea surface, we couldspeculate that the circulation would also dominate
the distribution of oxygen. However, more importantin the context of ventilation of anoxic waters is todemonstrate the mixing patterns, which indicate thepaths of penetration of surface signals into the deep
Ž .layers deeper than the CIL . It is well known thatthe onset of hydrogen sulphide is just below s s16.t
During the survey of RV Vityaz, the depth of thissurface ranged from 60 m in the area of cycloniccirculation up to 180 m in the areas of anticyclonesŽ .Fig. 1b . Thus, the water belonging to that isopycniclayer tended to cool or warm locally, which actuallyresulted in a vertical dyapycnal flux proportional tothe scalar product of temperature and density gradi-
Ž .ents Osborn, 1998 . The temperature patterns at thisŽ .level Fig. 1c correlate with some circulation fea-Žtures e.g., large temperatures in the anticyclone in
the southwest and lower temperatures in the cyclone.in the easternmost part of the survey region . Some
Žother features e.g., the anticyclone at 36.58E, Fig..1b have no counterparts in temperature at this depth,
but at s s14.2, for instance. The diapycnal ex-t
change is a function of temperature gradient, thus thepattern in Fig. 1c is indicative for dyapycnal mixingat the upper boundary of anoxic layer.
As seen in the vertical cross-section in Fig. 1d,the survey in November successfully captures thebeginning of cold water mass formation. This pro-cess is well illustrated by the outcropping of pycno-cline in the area of cyclonic eddy at 32–338E, wherethe core of CIL reaches the sea surface. To the eastand west of the outcropping zone, that is in the areas
Žwith anticyclonic circulation, the thick expressed in
ŽFig. 1. Indications of ventilation of anoxic waters caused by mesoscale circulation features as seen from RV Vityaz survey 5–29 Nov.. Ž . Ž . Ž . Ž .1993 data. a Dynamic heights mm , the reference level is at 300 m. b Depth of isopycnal surface s s16. c Temperature at s s16.t t
Ž . Ž . Ž . Ž . Ž .d Vertical cross-section of temperature shaded areas separated by dotted contours and salinity full lines at 43.28E. e As in d , butŽ .below s s15. f Product of zonal gradients of temperature and density.t

( )E. SokoloÕa et al.rJournal of Marine Systems 31 2001 45–63 49

( )E. SokoloÕa et al.rJournal of Marine Systems 31 2001 45–6350
.density coordinates surface layer, shields the CILfrom cooling at sea surface. On the same figure, weshow with solid lines the salinity field. In the upper
Ž .layer, above the CIL , salinity and temperature showpositive correlation, the slope of isohalines beingcomparable with the one of isothermals. The hori-zontal variations of the two fields become small
Ž .below s s15 Fig. 1d ; however, the temperaturetŽ .ones e.g., at s s16 in the area of the cyclone aret
indicative for cross-isopycnal exchange.The cross-section shown in Fig. 1e is stretched
below s s15 in comparison to previous plots, whicht
enables distinguishing more details in the thermoha-line stratification. We find two quite different situa-
Ž .tions. In the first one at 38.58E , the cooling fromabove in the area of the weaker cyclone does notreach the anoxic layers and we observe only that theCIL extends in thicker s layer. In the secondt
Ž .situation at 32–338E , on the contrary, there is aŽpenetration of deep water in the surface layer just
.below the area of maximum outcropping , and theisothermals show dramatic rise from s s16 up tot
the sea surface. Just several tens kilometers east ofthis location, at the fringe of cyclonic eddy, as wellas in the area occupied by the neighboring localanticyclonic eddy, there is a strong penetration ofwaters from the CIL into the pycnocline. The evi-
dence in Fig. 1f that the diapycnal mixing in theareas of mesoscale eddies has reached anoxic layersbecomes clear, particularly after comparing the scalarproduct of temperature and density zonal gradientsthat is proportional to the vertical diapycnal flux. Acaveat has to be given to the above discussionhaving in mind that the meteorological conditionschanged during the survey. The narrow white stripsin Fig. 1a,d separate the survey areas dominated bydifferent meteorological conditions. However, whilepart of the horizontal contrasts discussed above mightresult from the asynchronous measurements, most ofthe mesoscale features discussed above, and in par-ticular the ones associated with the ventilation ofanoxic layers, are probably not affected by samplingproblems.
2.2. Altimeter data
Six years of TrP data, from January 1993 toŽJanuary 1999, of TrP M-GDRs Archiving, Valida-
Ž .tion and Intercomparison of Satellite Data AVISO ,.1996 are used here. The sea level over the whole
sea is sampled by nine repeat tracks with timeŽ .intervals from 1 to 3 days Fig. 2 . Then the SLA is
obtained by subtracting the 4-year mean value forthe period 1993–1996. Standard altimetric correc-tions are applied except for ocean tides which are
Ž .Fig. 2. TrP tracks over the Black Sea and error map of TrP gridded data values are in percent from the variance of the signal .

( )E. SokoloÕa et al.rJournal of Marine Systems 31 2001 45–63 51
very small in the Black Sea. Inverse barometer cor-rection is also not applied because the response ofBlack Sea to atmospheric pressure is not significantŽ .Ducet et al., 1999 . The SLA was finally mappedonto a regular grid of 0.28 in latitude and 0.28 inlongitude once every 10 days using a sub-optimal
Žspacertime interpolation method Le Traon et al.,.1998 . The spatial and temporal correlation function
Ž .of SLA was analysed by Korotaev et al. 2001 alongwith the mesoscale circulation in the Black Seaderived from TrP data. Our calculations supporttheir estimates revealing a strong decrease of thespatial correlation beyond distances of ;30 km.The analysis of correlation functions and temporalspectra of the fine resolution data along tracks andthe comparison of satellite altimetry with dynamic
Ž .heights, which was done by Korotaev et al. 1998 ,demonstrates that there is much noise in TrP data.The latter motivated these authors to smooth the datawith a window of 50 km, which resulted in increaseof correlation between altimeter and hydrographicsurvey data. Our grid has a resolution of 0.28, that is,;20 km; thus, we could expect that gridded datapreserve the most important information from thedata on tracks. However, we have to keep in mindthat the error of interpolation increases with increas-ing the distance from the tracks. In order to give aquantitative measure of the reliability of data analy-
Žses carried out in the present study as a function of.interpolation error , we show in Fig. 2 the errors of
interpolation of TrP data.
3. Consistency between hydrographic survey andTrrrrrP data
3.1. Horizontal patterns
In the reminder of this paper, we will analyseseveral patterns of SLA obtained from satellite dataand their relationship with dynamic heights calcu-lated from hydrographic survey data. In order to
Žremove the barotropic effect mean Black Sea level.variations associated with the basin water balance ,
we subtract the basin mean value in both data sets.Since the TrP data are available only as anoma-
lies, we have two choices when making intercompar-
isons between sea surface elevation derived fromaltimeter data, and dynamic computations, based on
Ž .hydrographic survey data: 1 to add the mean seaŽ .level e.g., calculated from climatic data to altimeter
Ž .anomalies, or 2 to subtract the mean sea level fromdynamic heights corresponding to individual surveys.
Ž .We choose the second alternative: a in order not tocreate false impression of good consistency becauseof the dominating cyclonic pattern of mean sea level,
Ž .and b because the dynamic computations are notquite informative in shallow regions and adding meandynamic heights to SLA on the shelf could result infalse presentation of results. The mean sea level iscalculated from annual mean climatic data with ref-erence depth of 300 m. This particular depth is
Ž .chosen because: 1 the dynamic signal in the deeperŽ .levels is insignificant, 2 choosing a deeper layer
will result in further shrinking of horizontal area dueto eliminating stations where the bottom is shallower
Ž .than reference level, and 3 the data collected duringthe cruise in August 1994 reach only 300 m depth.
Using different reference sea level when calculat-ing anomaly in two data sets could create someproblems. The TrP SLA is obtained by subtracting
Ž .the 4-year mean value 1993–1996 in every locationfrom the current measurement, while the climaticmean value is subtracted when doing dynamic com-putations. If the 4-year mean field was close to theclimatic mean, then the error would be negligible.However, this is not a priori clear. To objectivelyanalyse the difference between the altimeter andhydrographic survey data, we analyse the differencesbetween the two consecutive surveys of RV Ak-
Ž .vanavt August and September 1994 and the corre-Ž .sponding snapshots of TrP Fig. 3 . All major pat-
terns in altimeter and hydrographic survey data areŽsimilar e.g., the positive anomalies at about 38.5–
.398E and the negative ones at 36–388E , demonstrat-ing that the effect of using different reference sea
Žlevel from climatic data much smoother than the.hydrological survey data could not severely bias the
intercomparison of SLA from TrP mission and sur-veys.
The circulation pattern of each survey was verybriefly described in the preceding sections, and wewill now describe the SLA obtained from TrP cy-
Ž .cles corresponding to survey periods Figs. 4–8 .The gradients of SLA calculated from the altimeter

( )E. SokoloÕa et al.rJournal of Marine Systems 31 2001 45–6352
Ž . Ž . Ž . Ž . Ž .Fig. 3. a SLA differences mm from TrP 15 Sept. 1994 to 28 Aug. 1994 . b Anomaly of dynamic heights differences mm from RVŽ .Akvanavt 11–19 Sept. 1994 to 24 Aug.–1 Sept. 1994 .
data compare well with the ones derived from hydro-graphic survey data. That gives some credibility thatthe processes associated with the sea level slope canwell be resolved from analyses of TrP data. Weremind the reader that the maximum contrast of SLAŽ .;20 cm is much higher than the errors in the TrP
Ž .data ;3 cm . To give a measure of possible errorsfrom mapping the track data, we plot with solid linesthe errors, which are larger than 50% of the signal.Obviously, the regularly distributed ApatchesB withhigh level of errors indicate the centres of rhombsbounded by satellite tracks.

( )E. SokoloÕa et al.rJournal of Marine Systems 31 2001 45–63 53
Some well-known features are identified in theanomaly patterns derived from the altimeter data.The SLA is negative in the basin interior during
Ž .winter–spring Fig. 4a . This pattern indicates thatduring that period the sea level itself is higher in thecoastal zone and lower in the open sea, thus reveal-
Ž .ing the intensification of circulation. In fall Fig. 5a ,the SLA is positive in the basin interior demonstrat-
ing that the intensity of circulation decreases. Thistendency is very well pronounced in the area of
Ž .Batumi eddy Figs. 6a–8a and the large values ofSLA there support the existing concept that, in thewarm part of the year, a reversal of the sign ofcirculation is possible. It is noteworthy that theappearance of anticyclonic tendency in the warmpart of the year is quite specific during the individual
Ž . Ž . Ž . Ž . ŽFig. 4. a SLA mm from TrP data for 8 Apr. 1993. b Anomaly of dynamic height mm during the HydroBlack survey 2–14 Apr.. Ž .1993 . c Dynamic heights from climatic data interpolated at the time of observations.

( )E. SokoloÕa et al.rJournal of Marine Systems 31 2001 45–6354
Ž . Ž . Ž . Ž . ŽFig. 5. a SLA mm from TrP data for 17 Nov. 1993. b Anomaly of dynamic height mm during the RV Vityaz survey 5–29 Nov.. Ž .1993 . c Dynamic heights from climatic data interpolated at the time of observations.
years and the position of Batumi eddy migrates inŽ .large area its center reaches 398E, Fig. 5a . For the
Ždynamics of this eddy, see also Staneva et al. 2001,.this issue .
There is a qualitative agreement between altimeterand hydrographic survey data. Most of the maincirculation features identified in the two types ofdata almost coincide. The altimeter data are smoother
since the distance between track does not fully re-solve mesoscale features. Some discrepancy can befound in the southeasternmost corner of Fig. 7bŽ .September 1994 that might result from errors inmeasurements, or processing of data, which have notbeen synchronously measured. If we calculate thecoefficient measuring the agreement between the twodata sets as the number of locations in the two data

( )E. SokoloÕa et al.rJournal of Marine Systems 31 2001 45–63 55
Ž . Ž . Ž . Ž . ŽFig. 6. a SLA mm from TrP data for 28 Aug. 1994. b Anomaly of dynamic height mm during the RV Akvanavt survey 24 Aug. to 1. Ž .Sept. 1994 . c Dynamic heights from climatic data interpolated at the time of observations.
sets where we have in the same time positive ornegative anomaly with respect to the mean for theoverlapping area against the total number of pointsin the same area, we obtain the following numbersfor the five surveys: 0.41, 0.40, 0.21, 0.30, and 0.40.If we exclude the areas where the interpolation errorsmight reach more than 50% of the signal, the abovenumbers increase to: 0.64, 0.82, 0.86, 0.60, and 0.93.
This result gives a warning for any further analysis,which does not account for increasing errors far fromsatellite tracks.
It is clearly seen from the horizontal patterns thatthe large-scale eddiesranomalies are well resolvedin TrP data. However, the sequence of cyclonic andanticyclonic eddies in Fig. 1 contributing to theventilation of pycnocline is not resolved in the TrP

( )E. SokoloÕa et al.rJournal of Marine Systems 31 2001 45–6356
Ž . Ž . Ž . Ž . ŽFig. 7. a SLA mm from TrP data for 15 Sept. 1994. b Anomaly of dynamic height mm during the RV Akvanavt survey 11–19 Sept.. Ž .1994 . c Dynamic heights from climatic data interpolated at the time of observations.
Ž .data Fig. 5 . The sharpness of eddy boundaries isalso underestimated in the mapped altimeter data.
3.2. Temporal Õariability
A number of studies have appeared recently onthe variability of Black Sea circulation and the prop-
Žagation patterns associated with it Stanev and.Rachev, 1999; Stanev and Staneva, 2000 . It has
Žbeen shown in these studies see also Korotaev et al.,.2001 that the large-scale propagation patterns can
be explained as basin oscillations with periods ofabout 1 year and very small phase velocities of;2–3 cm sy1. Since most of our survey data are inthe eastern Black Sea, we will analyse the propaga-tion of signals along the eastern coast. The two lineson which we will demonstrate the propagation pat-terns are chosen in a way to be representative for the

( )E. SokoloÕa et al.rJournal of Marine Systems 31 2001 45–63 57
Ž . Ž . Ž . Ž . ŽFig. 8. a SLA mm from TrP data for 1 Sept. 1998. b Anomaly of dynamic height mm during the RV Akvanavt survey 29 Aug. to 5. Ž .Sept. 1998 . c Dynamic heights from climatic data interpolated at the time of observations.
Ž .near-coastal zone line 2 in Figs. 4–8 and the deepzone reaching to the south the area of Batumi eddyŽ .line 1 in Figs. 4–8 . The noisy signal at highfrequencies motivated us to analyse separately thelow frequency signal for the whole data series andthe high frequency signal for the periods when wehave survey data.
The eastern basin can be regarded as a wave-guiderotated against the parallels with an axis approxi-
Žmately following the Adeep channelB Stanev and.Rachev, 1999 . In the easternmost part of this axis,
oscillations are excited by the rigorous dynamics ofsub-basin scale Batumi eddy. This eddy is well
Žmanifested by the positive sea level anomalies dark

( )E. SokoloÕa et al.rJournal of Marine Systems 31 2001 45–6358
.shading , which appear on the Hovemoler diagramplotted in Fig. 9a. It appears quasi-periodically in theearly summer and the anticyclonic vorticity domi-nates the circulation for about 6 months. However,sometimes it persists until the beginning of the next
Ž .year 1995–1996 . The slope of the contours givesthe direction of propagation of the signals. Duringmost of the time, it is from SE to NW, along the
Ž .coast. In some cases 1994 , the variability associ-ated with Batumi eddy does not show a unidirec-
tional response along the line 1. The propagationpatterns in 1993 and 1995 are split between points
Ž9–12 at ;200 km from the zone of its maximum.amplitude in two branches with opposite slope. This
demonstrates that the oscillations might propagatewith the coast on their right, but sometimes they
Ž .move backwards. The latter demonstrates that: 1Ž .the centre of Batumi eddy migrates, and 2 that
westerly propagating waves are not the only possiblesignals in this region. The propagation pattern to the
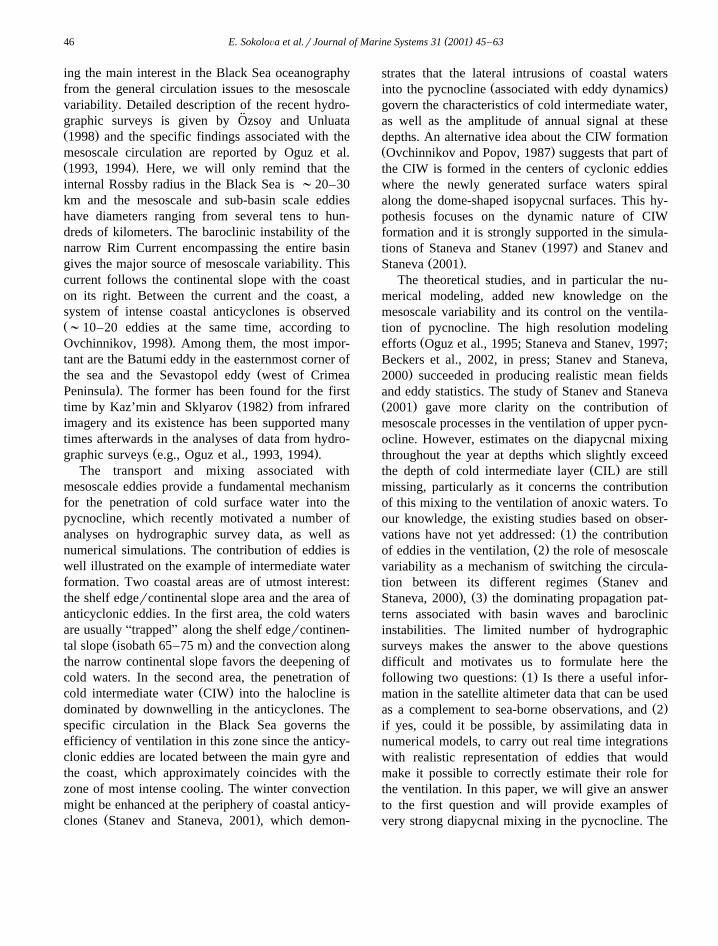
Ž .Fig. 9. Hovemoler diagram of TrP data along the lines plotted in Fig. 5. The ordinate gives the time 1993 means the beginning of 1993 ,Ž .the abscissa gives the location on the line point 1 is on the west–north, point 14 is at southeastern end of the lines . The original data are
filtered with a time window of 180 days.
( )E. SokoloÕa et al.rJournal of Marine Systems 31 2001 45–63 59
west in the second half of line 1, i.e., far from thezone dominated by Batumi eddy dynamics, demon-
Žstrates regular annual variability six maxima in 6. Ž .years . As explained by Stanev et al. 2002 , this
type of propagation patterns cannot be found in theforcing data, which demonstrates that the seasonalvariability in the atmosphere could only provide theperturbations, which are transformed in the oceaninto westerly propagating waves. The slope of con-tours corresponds to mean speed of westerly propa-gating signal of ;2 cm sy1.
The propagation pattern is quite different at shorterŽ .distance from the coast Fig. 9b . Along line 2, we
see more irregular oscillations originating in theŽsoutheastern corner i.e., oscillations which might be
.excited by Batumi eddy dynamics . There is a pro-nounced transition of the characteristics of oscilla-tions at about points 9–11, where the slope of con-tours changes substantially. Further to the NW, the
Žpattern is relatively regular propagation with the.coast on the right until point 4, where reflection and
refraction from the coast might explain the sporadicreversal of phase speed.
The high frequency oscillations in the TrP dataare very noisy for time scales shorter than 1 month.These oscillations are not well resolved by the sam-
Fig. 10. As in Fig. 9, but for the high frequency signal in 1993.

( )E. SokoloÕa et al.rJournal of Marine Systems 31 2001 45–6360
Žpling frequency we have approximately three snap-.shots per month , therefore, we filter the data series
with cosine filter with a time window of one month.The residual signal obtained after subtracting the low
Ž .frequency signal the one shown in Fig. 9 from thefiltered one is shown in Figs. 10–12, for threeconsecutive years. There is a large variety of propa-
Ž .gation patterns: a along coast propagation with thecoast on the right in 1994 in the northern part of line
Ž . Ž . Ž2 Fig. 11b ; b reversal of the phase speed the.bifurcations in the northern part of line 2 in 1993
Ž . Ž .Fig. 10b ; c Astanding oscillationsB that are notassociated with propagation along line 2, but are
Ž . Ž .located in its southern part in 1993 Fig. 10b ; dalong-coastal propagation with the coast on the left
Ž .in 1993 in the north part of line 1 Fig. 10a . TheŽanalysis of the total signal low plus high frequen-
.cies demonstrates that the propagation is almostŽalways with the coast on the right with some short
.lasting exceptions in 1993 . This result does not fullyŽ .support the statement of Krivosheya et al. 1998a
claiming that eddies always propagate in the direc-tion of the current. The propagation speed rangesbetween 3 and 15 cm sy1. In the study of Krivosheya
Ž .et al. 1998b , this speed has been estimated to be2–6 kmrday, that is of the same order of magnitude.
Fig. 11. As in Fig. 9, but for the high frequency signal in 1994.

( )E. SokoloÕa et al.rJournal of Marine Systems 31 2001 45–63 61
Fig. 12. As in Fig. 9, but for the high frequency signal in 1998.
What is very important to mention here is that in lessŽ .than 80 km the distance between lines 1 and 2 , the
propagation patterns in high frequency range mightdiffer considerably. We remind the reader that errorsof mapping are different in the different parts oflines 1 and 2 which might cause nonphysical results.
4. Conclusions
The major aim of this present study is to demon-strate the similarities and differences between altime-
ter and survey data in the region of the Black Sea.We do not enter into deep details and quantitativeanalyses, but prefer to address this issue from thepoint of view of qualitativerphenomenological ag-reement between results obtained from the two datasets. Since this study was stimulated by the interestto explore the possibilities of using TrP data for
Ž .assimilation purposes see also Korotaev et al., 2001 ,this approach seems adequate. The major advantageof altimeter data against hydrographic observationsis that they provide continuous record with relativelygood discretisation. They give very promising results

( )E. SokoloÕa et al.rJournal of Marine Systems 31 2001 45–6362
Žabout propagation of signals we demonstrated this.along the eastern coast , which is crucially important
when integrating models in assimilation mode. Themagnitudes of oscillations resolved in TrP data in
Ž .space see also Stanev et al., 2000 , as well as thehorizontal gradients of SLA, compare well with in-
Ždependent estimates from data demonstrated in this. Ž .paper and modeling Staneva et al., 2001, this issue .
We present evidence about the possible role ofeddies in diapycnal exchange associated with theventilation of Black Sea anoxic layers. The majorfinding here is that the interior Black Sea not onlyprovides conditions for ventilation of intermediatelayer in winter, as suggested by Ovchinnikov and
Ž .Popov 1987 , but also might contribute to mixingbetween oxic and anoxic waters at mesoscales. How-ever, the lack of resolution in TrP data makes itpossible to only resolve large eddies and does notallow to sufficiently represent the narrow Rim Cur-
Žrent Oguz et al., 1993, 1994; Staneva et al., 2001,. Ž .this issue and small-scale features eddies in Fig. 1 ,
the latter contributing to deep penetrationrmixing ofthermohaline and chemical signals. To illustrate thisstatement, we show in Fig. 13 the SLA obtainedfrom hydrographic survey and altimeter data alongthe section line in Fig. 1. Obviously, no clear possi-bility exists that would make possible by associating
Fig. 13. Zonal section along 43.28N of SLA. Solid line fromdynamic computations, dashed line from TrP data.
the sea level gradients derived from the TrP dataŽwith the slope of the pycnocline as suggested by
some simple assimilation schemes, e.g., Cooper and.Haines, 1996 to ensure basinwide information about
small-scale eddies. Such information could be pro-vided from the track-data if the noise is not too high.Further understanding on the value of altimeter datacan be obtained by assimilation efforts, as shown by
Ž .Korotaev et al. 1998, 2001 ; thus, it is quite impor-tant to focus on physical process and their valida-tions.
We admit that 10-day interval between consecu-tive maps of SLA is not enough to resolve themesoscale oscillations. That is also proved by thefine-resolution numerical experiments of Staneva et
Ž .al. 2001 , as well as by the noise in TrP data athigh frequencies, demonstrating that some care hasto be taken in the efforts of assimilation of TrP datato avoid errors resulting from insufficient samplingat high frequencies. The long distance between trackis the next serious drawback, which inevitably re-sulted in some errors when mapping the data. Thisgives another caveat when using TrP data for assim-ilation purposes. The recent publications of Ayoub et
Ž . Ž .al. 1999 and Ducet et al. 2000 , where the merg-ing between ERS and TrP data is discussed, givessome ideas about the future extension of the presentwork. Although the ERS data have less time resolu-
Ž .tion 30 days than the TrP data, their higher resolu-tion in space is a substantial complement to TrPdata, resulting in better mapping. We believe thatusing the merged data is of utmost importance whentrying to resolve the mesoscale dynamics in theBlack Sea, and will address this issue in a futurestudy.
Acknowledgements
The authors thank P.-Y. Le Traon and V. Beloko-pitov who made the TrP data and the climatictemperature and salinity data available. The authorsalso thank M.H. Calvez for altimeter data process-ing. Data from the CoMSBlack survey in 1993 havebeen prepared in the frame of NATO Black Seaproject and made available through Black Sea Envi-
Ž .ronment Internet Node BSEIN . This work wassupported by the CEC Contract IC15CT960113.

( )E. SokoloÕa et al.rJournal of Marine Systems 31 2001 45–63 63
References
Archiving, Validation and Intercomparison of Satellite DataŽ .AVISO , 1996. User Handbook: Merged TOPEXrPoseidonproducts. AVI-NT-02-101-CN, Edition 3.0.
Ayoub, N., Le Traon, P.-Y., De Mey, P., 1999. A description ofthe mediterranean surface variable circulation from combinedERS-1 and TOPEXrPoseidon altimetric data. J. Mar. Syst. 18Ž .1–3 , 3–40.
Beckers, J.M., Gregoire, M.L., Nihoul, J.C.J., Stanev, E.V.,Staneva, J.V., Lancelot, C., 2002. Hydrodynamical processesgoverning exchanges between the Danube, the North-Westerncontinental shelf and the Black Sea basin simulated by 3d and
Ž .box models. Estuarine Coastal Shelf Sci. in press .Cooper, M., Haines, K., 1996. Altimetric assimilation with water
Ž .property conservation. J. Geophys. Res. C1 101 , 1059–1077.Ducet, N., Le Traon, P.-Y., Gauzelin, P., 1999. Response of the
Black Sea mean level to atmospheric pressure and windforcing. J. Mar. Syst. 22, 311–327.
Ducet, N., Le Traon, P.-Y., Reverdin, G., 2000. Global high-reso-lution mapping of ocean circulation from TOPEXrPoseidon
Ž .and ERS-1 and -2. J. Geophys. Res. C8 105 , 19477.Gill, A.E., 1982. Atmosphere–Ocean Dynamics. Academic Press,
Orlando, FL, 662 pp.Kaz’min, A.S., Sklyarov, V.E., 1982. Some peculiarities of the
Black Sea waters circulation on the base of ‘METEOR’Ž .satellite data. Earth Res. Space 6, 43–49 in Russian .
Korotaev, G.K., Saenko, O.A., Koblinsky, C.J., Demishev, S.G.,Knysh, V.V., 1998. An accuracy, methodology, and someresults of the assimilation of the TOPEXrPoseidon altimetrydata into the model of the Black Sea general circulation. Earth
Ž .Res. Space 3, 3–17 in Russian .Korotaev, G.K., Saenko, O.A., Koblinsky, C.J., 2001. Satellite
altimetry observations of the Black Sea level. J. Geophys. Res.Ž .106 C1 , 917–933.
Krivosheya, V.G., Moskalenko, L.V., Ovchinnikov, I.M.,Yakublenko, V.G., 1997. Features of water dynamics andhydrological structure of the North-Eastern Black Sea in au-
Ž . Ž .tumn 1993. Oceanology 37 3 , 352–358 in Russian .Krivosheya, V.G., Nyffeler, F., Yakubenko, V.G., Ovchinnikov,
I.M., Kos’yan, R.D., Kontar, E.A., 1998a. Experimental stud-ies of eddy structures within the Rim cyclonic current zone inthe north-eastern part of the Black Sea. In: Ivanov, L., Oguz,
Ž .T. Eds. , Ecosystem Modelling as a Management Tool for theBlack Sea, vol. 2. Kluwer Academic Publishing, Dordrecht,pp. 131–144.
Krivosheya, V.G., Ovchinnikov, I.M., Titov, V.B., Yakubenko,V.G., Skirta, A.Yu., 1998b. Meandering of the main BlackSea current and eddies formation in the North-Eastern part of
Ž .the Black Sea in summer 1994. Oceanology 38 4 , 554–556Ž .in Russian .
Le Traon, P.-Y., Nadal, F., Ducet, N., 1998. An improved map-ping method of multi-satellite altimeter data. J. Atmos. Ocean.Technol. 25, 522–534.
Oguz, T., Latun, V.S., Latif, M.A., Vladimirov, V.V., Sur, H.I.,¨Markov, A.A., Ozsoy, E., Kotovshchikov, B.B., Eremeev,
¨ ¨V.V., Unluata, U., 1993. Circulation in the surface and inter-¨mediate layers of the Black Sea. Deep-Sea Res. 40, 1597–1612.
Oguz, T., Aubrey, D., Latun, V., Demirov, E., Kolesnikov, L.,Sur, H., Diaconu, V., Besiktepe, S., Duman, M., Limeburner,R., Eremeev, V., 1994. Mesoscale circulation and thermoha-line structure of the Black Sea during HydroBlack’91. Deep-Sea Res. 41, 603–628.
Oguz, T., Malanotte-Rizzoli, P., Aubrey, D., 1995. Wind andthermohaline circulation of the Black Sea driven by yearly
Ž .mean climatological forcing. J. Geophys. Res. C4 100 ,6846–6865.
Osborn, T.J., 1998. The vertical component of epineutral diffusionand the dianeutral component of horizontal diffusion. J. Phys.Oceanogr. 28, 485–494.
Ovchinnikov, I.M., 1998. Interaction between surface and deepwaters in the process of transverse circulation of the Black
Ž .Sea. In: Gregoire, M. Ed. , Ventilation of the Black Sea’sAnoxic Waters. Workshop reports series Nor05r98, GHER,Liege, Belgium, pp. 133–161.
Ovchinnikov, I.M., Popov, Y.I., 1987. Evolution of the coldintermediate layer in the Black Sea. Oceanology 27, 555–560Ž .in Russian .
Ozsoy, E., Unluata, U., 1998. The Black Sea. In: Robinson, A.,Ž .Brink, K. Eds. , 1998. The Sea: the Global Coastal Ocean:
Regional Studies and Syntheses, vol. 11. Wiley, New York,pp. 889–914.
Stanev, E.V., Rachev, N.H., 1999. Numerical study on the plane-tary Rossby modes in the Black Sea. J. Mar. Syst. 21, 283–306.
Stanev, E.V., Staneva, J.V., 2000. The impact of the barocliniceddies and basin oscillations on the transitions between differ-ent quasi-stable states of the Black Sea circulation. J. Mar.
Ž .Syst. 24 1–2 , 3–26.Stanev, E.V., Staneva, J.V., 2001. The sensitivity of the heat
exchange at sea surface to meso and sub-basin scale eddies.Model study for the Black Sea. Dyn. Atmos. Oceans 33,163–189.
Stanev, E.V, Le Traon, P.-Y., Peneva, E.L., 2000. Sea levelvariations and their dependency on meteorological and hydro-logical forcing. Analysis of altimeter and surface data for the
Ž .Black Sea. J. Geophys. Res. C7 105 , 17203–17221.Stanev, E.V., Beckers, J.M., Lancelot, C., Le Traon, P.-Y.,
Staneva, J.V., Peneva, E.L., Gregoire, M., 2002. Coastal–openocean exchange in the Black Sea: observations and modelling.
Ž .Estuarine Coastal Shelf Sci. in press .Staneva, J.V., Stanev, E.V., 1997. Cold intermediate water forma-
tion in the Black Sea. Analysis on numerical model simula-¨ Ž .tions. In: Ozsoy, E., Mikaelyan, A. Eds. , Sensitivity to
Change: Black Sea, Baltic Sea and North Sea. NATO Ser.,Kluwer Academic Publishing, Dordrecht, pp. 375–393.
Staneva, J.V., Dietrich, D.E., Stanev, E.V., Bowman, M.J., 2001.Rim current and coastal eddy mechanisms in an eddy-resolv-ing Black Sea general circulation model. J. Mar. Syst. 31,
Ž .137–157 this issue .