synoptic categorization and climate variability analysis of historical flood- inducing storms in the...
Post on 21-Dec-2015
216 views
TRANSCRIPT

Synoptic Categorization and climate variability analysis of historical flood-
inducing storms in the Northeast
Johnathan KirkNortheast Regional Climate Center
Cornell University

Introduction• Main focus:
– Synoptic climatology analysis of climate variation across New England and Canadian Maritimes
– Given annual maximum stream flow dates at river gauges, identified primary synoptic scale weather cause
– Categorized storms by type based on storm track
Introduction
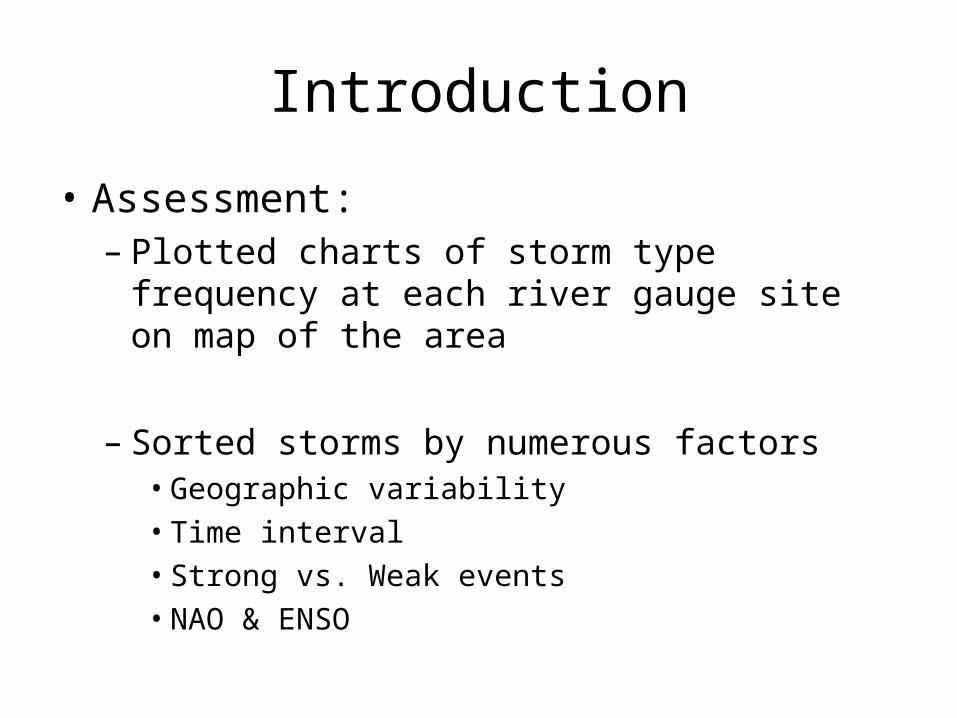
• Assessment:– Plotted charts of storm type frequency at each
river gauge site on map of the area
– Sorted storms by numerous factors• Geographic variability• Time interval• Strong vs. Weak events• NAO & ENSO
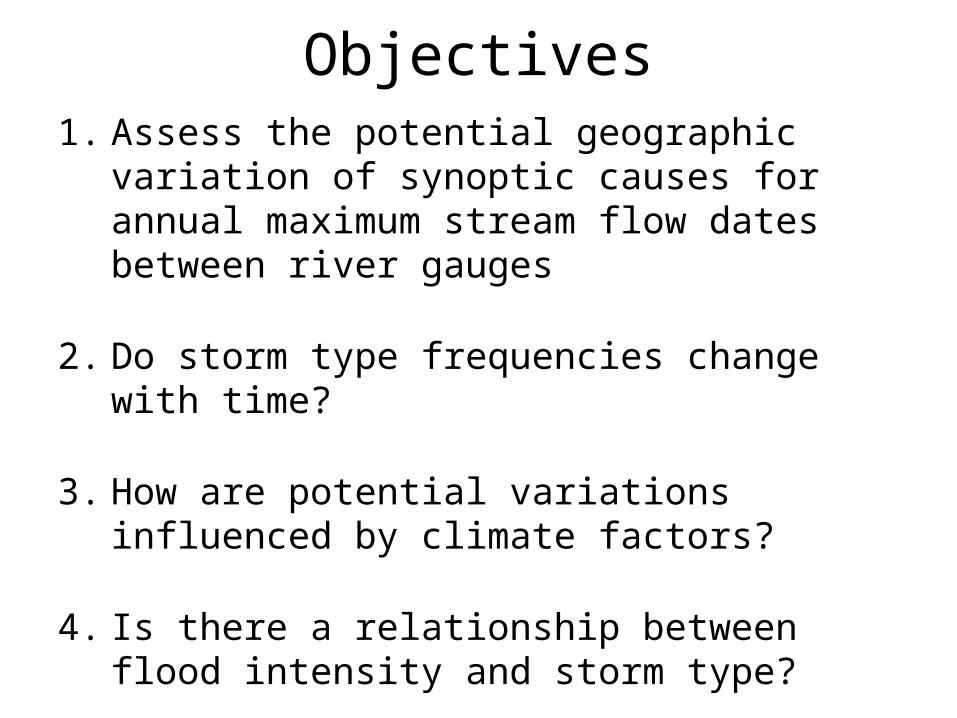
Objectives1. Assess the potential geographic variation of
synoptic causes for annual maximum stream flow dates between river gauges
2. Do storm type frequencies change with time?
3. How are potential variations influenced by climate factors?
4. Is there a relationship between flood intensity and storm type?

Gauge Site Selection
• US selected gauges reasonably represent the geographic diversity and average record length (Collins, 2009)– Basin size, topographic, lithologic, & hydroclimatic diversity
• Main hydroclimatic differentiators:– Latitude, elevation, & distance from the coast
• Canada gauge selection followed same criteria– No major differences in recording techniques in relationship to
synoptic climatology


Storm Type Categorization
• Categorized storms by two factors:– Storm track– General dynamics
• Assessed storm track by majority entrance zone
• Distinction was made between Closed Lows and Strong Surface Lows

Storm Type Categorization Scheme
Storm Type Definition
Coastal Low Storm tracks parallel to East Coast, typically over sea
Strong Sfc Low* Low pressure center encircled by at least one isobar, but associated with upper level trough
Closed Low* Low pressure center encircled with at least one isobar both at the surface and aloft
Multiple Lows Two simultaneous storms independently contributed to flood event
Tropical Cyclone Influence from remnants of a tropical system
Other All other causes (snowmelt, etc.)
* Category associated with geographic tag
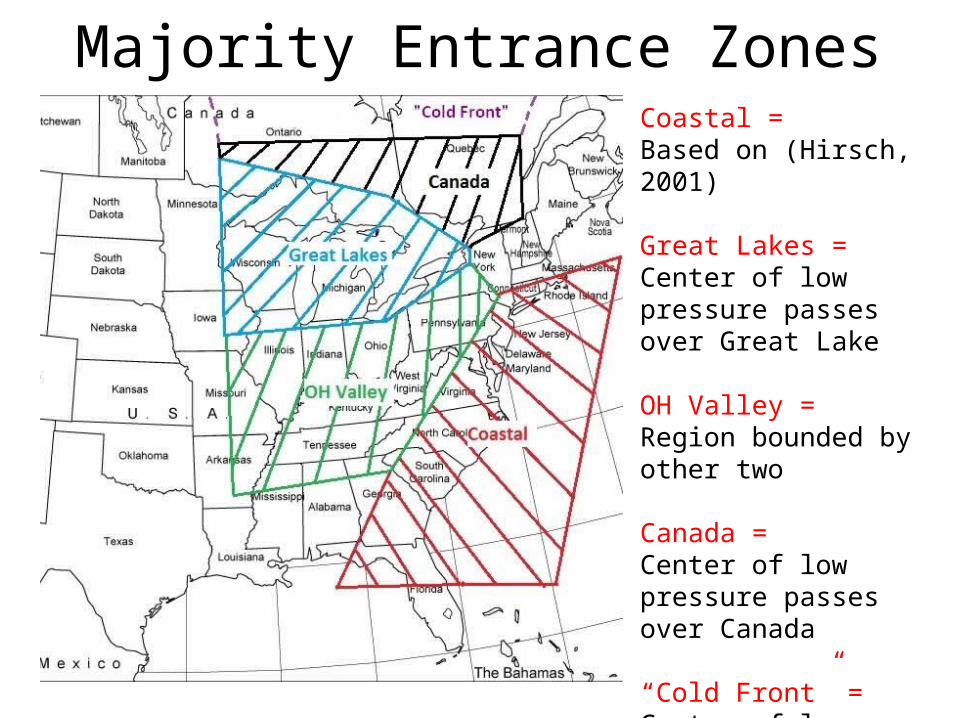
Majority Entrance ZonesCoastal = Based on (Hirsch, 2001)
Great Lakes =Center of low pressure passes over Great Lake
OH Valley =Region bounded by other two
Canada = Center of low pressure passes over Canada
“Cold Front” = Center of low pressure passes over N. Canada
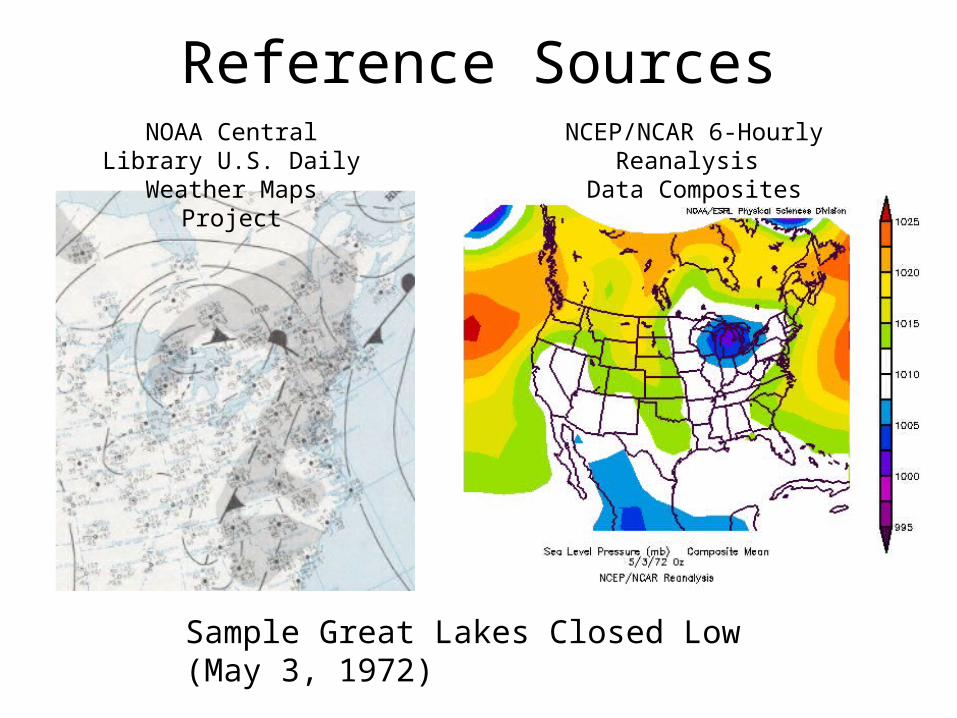
Reference SourcesNCEP/NCAR 6-Hourly Reanalysis
Data CompositesNOAA Central Library U.S.
Daily Weather Maps Project
Sample Great Lakes Closed Low (May 3, 1972)
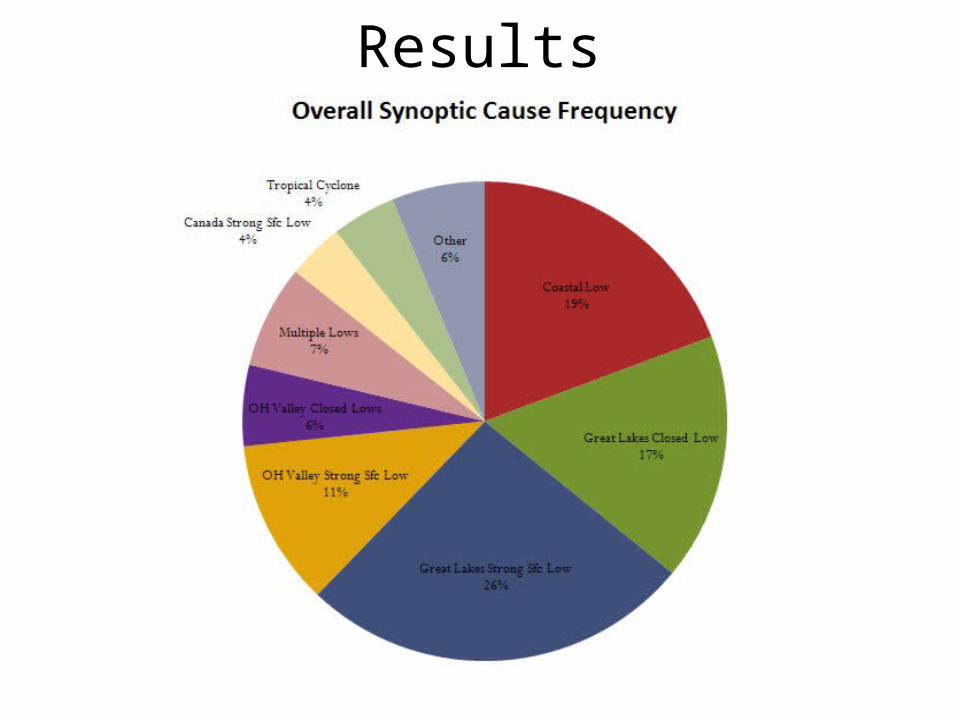
Results
Results

Results
Results
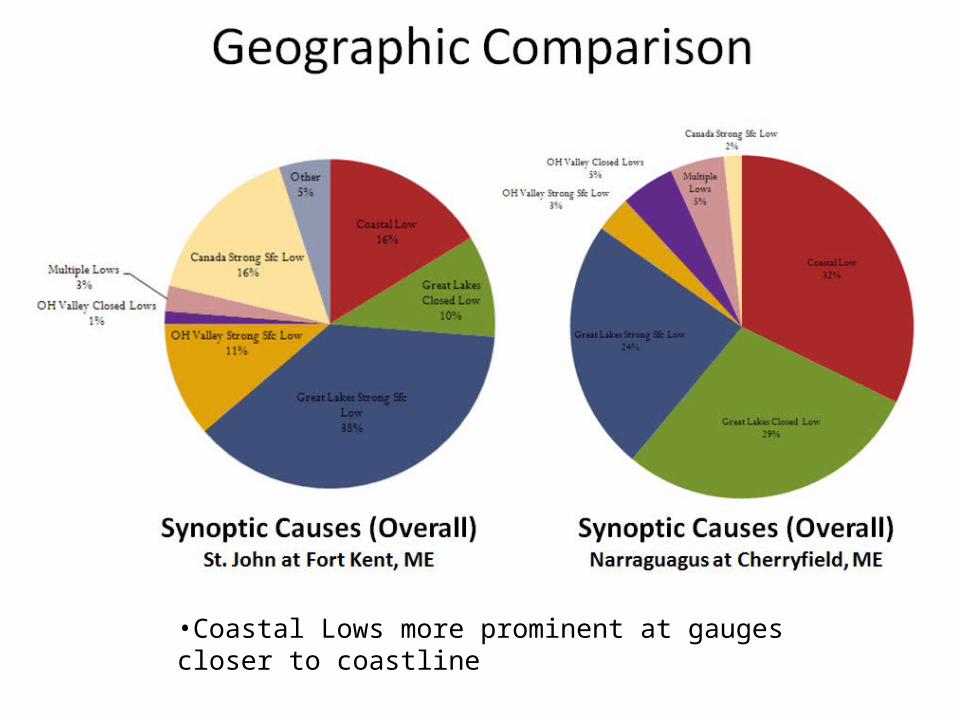
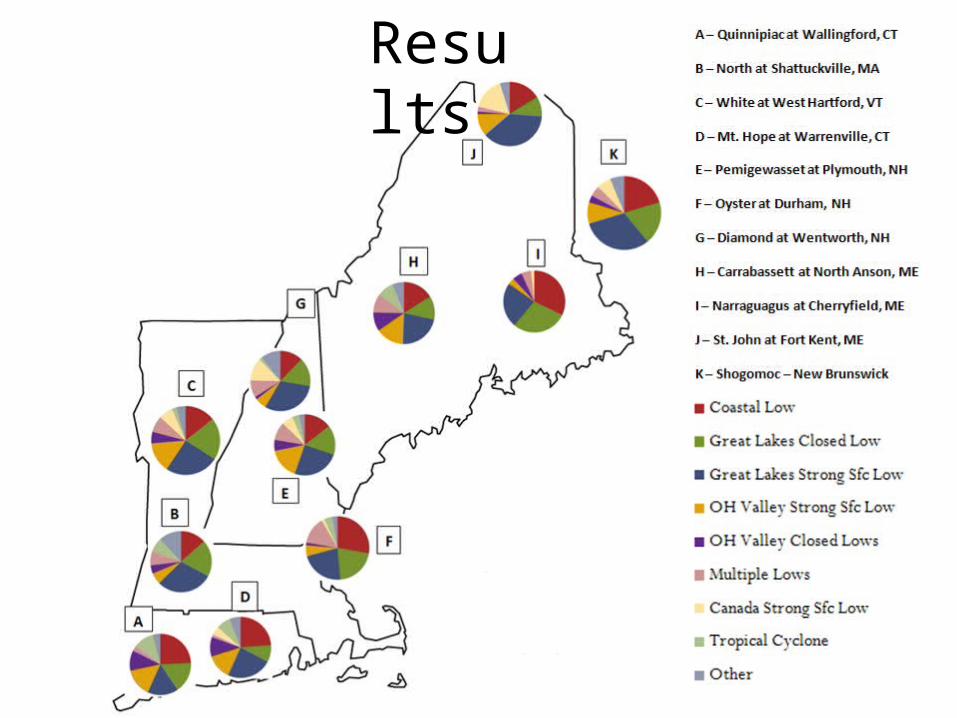
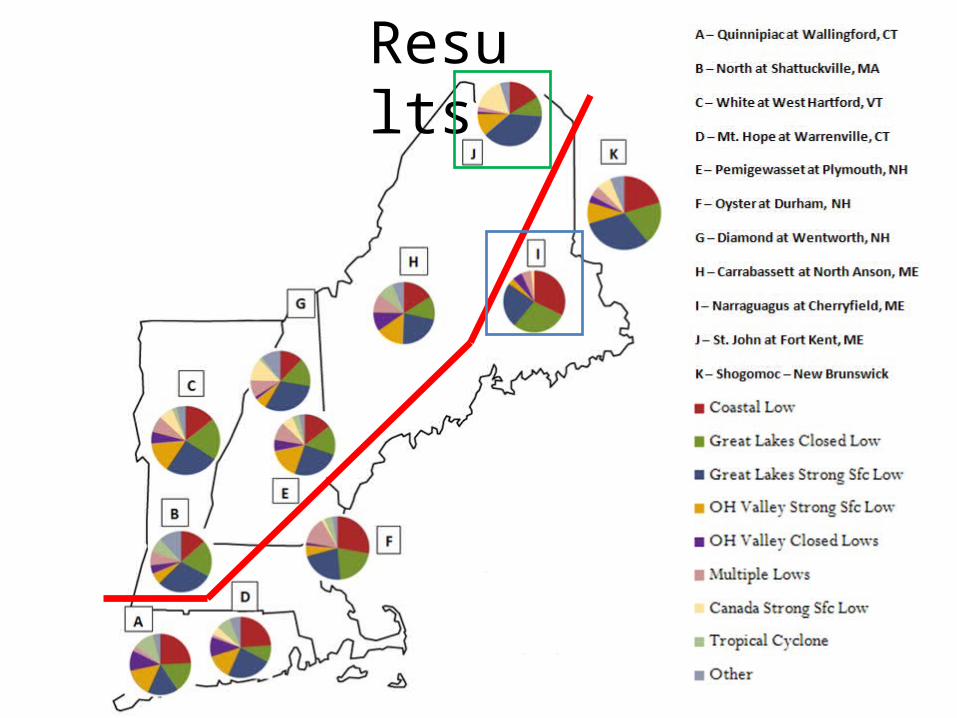
•Coastal Lows more prominent at gauges closer to coastline
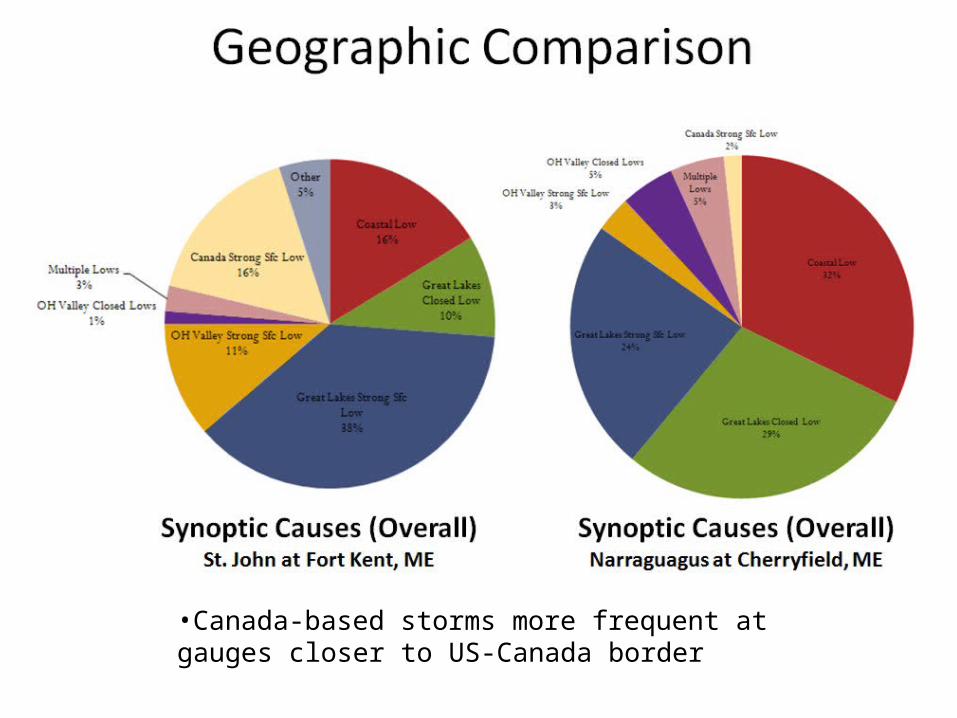
•Canada-based storms more frequent at gauges closer to US-Canada border

•Great Lakes-based storms outnumber OH Valley-based storms
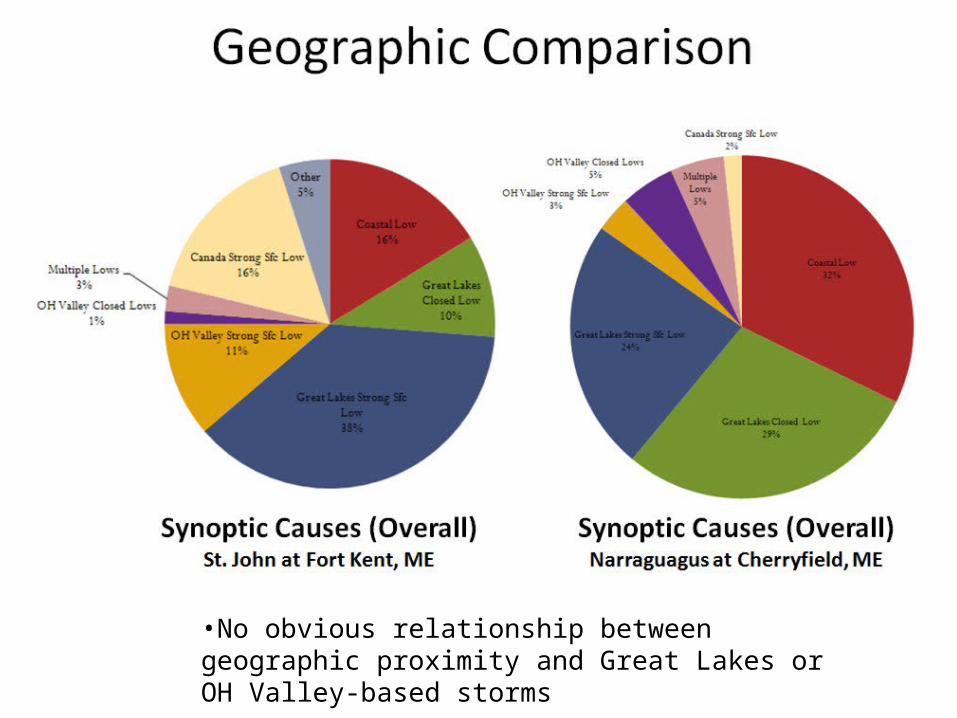
•No obvious relationship between geographic proximity and Great Lakes or OH Valley-based storms
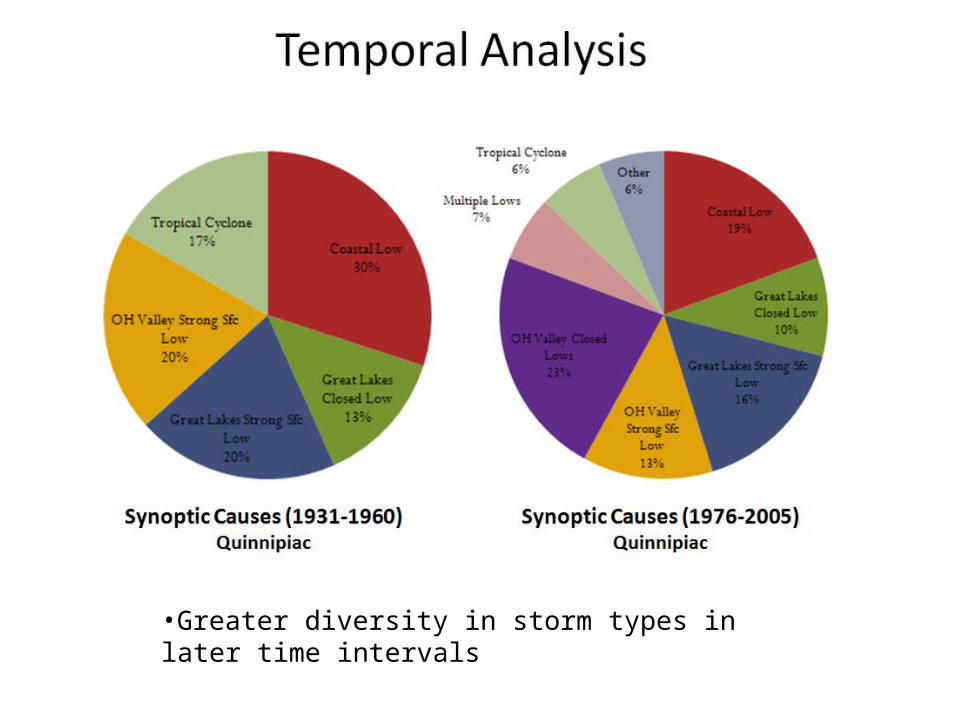
•Greater diversity in storm types in later time intervals

•Great Lakes-based storm frequency does not significantly change with time

•OH Valley-based storms do change with time•Same with Coastal lows, Tropical Cyclones, etc.
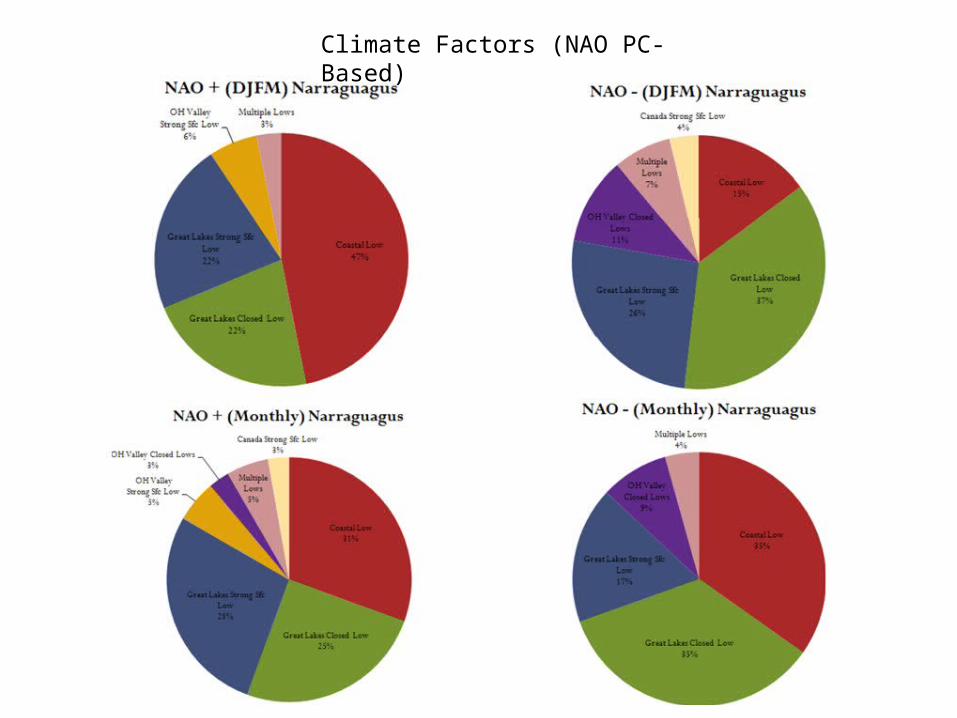
Climate Factors (NAO PC-Based)

Climate Factors - NAO
• NAO:– Coastal lows seem to shift east/west in NAO +/-
– In absence of coastal lows, Great Lakes and/or OH Valley Lows increase in frequency
– Inland stations were more homogeneous
• Difference in NAO DJFM & Monthly may not be significant

•Tropical Cyclone suppression occurs in SOI - years

•Coastal Lows suppressed in SOI + years

•Overall Great Lakes/OH Valley Lows do not seem to be affected

Strong Events vs. Weak Events


Strong Events vs. Weak Events
• Some stations look to have meaningful trends
• Others do not have significant differences
• Exemplifies need for more thorough statistical analysis for numerical significance– Both to defend trends and lack of significant difference– Could exaggerate variations
• Z-scores: more “weak” events, less “strong” events
Moving Forward• What are the relationships between storm type frequencies?
– Do some storm frequencies in/decrease as a result of the lack of another?
• Are these findings statistically significant?– Increasing sample size by adding 11 more stations from Canadian
Maritimes
• Are the findings skewed by variability?– Some stations may be outliers – Could explain contradictory findings

Acknowledgments• I would like to thank the following individuals for their assistance
on this project:
• Dr. Art DeGaetano, NRCC/Cornell University
• Matt Collins, NOAA Restoration Center/NMFS
• Contributors and advisors from the NCDC– Dr. Thomas Peterson– Sam McCown– Tiffany Means