synchrotron facilities and the study of the earth’s deep
TRANSCRIPT

INSTITUTE OF PHYSICS PUBLISHING REPORTS ON PROGRESS IN PHYSICS
Rep. Prog. Phys. 68 (2005) 1811–1859 doi:10.1088/0034-4885/68/8/R03
Synchrotron facilities and the study of the Earth’sdeep interior
Thomas S Duffy
Department of Geosciences, Princeton University, Princeton, NJ 08544, USA
Received 19 April 2005Published 5 July 2005Online at stacks.iop.org/RoPP/68/1811
Abstract
The combination of synchrotron x-ray facilities with high-pressure methods provides newexperimental tools for addressing geophysical problems relevant to understanding the interiorof the Earth and other planets. Among the important geophysical questions related to the Earth’ssilicate mantle are the origin of seismic discontinuities in the upper mantle, the rheologicalproperties of mantle minerals and their influence on dynamic flow in the Earth, and the nature ofthe core–mantle boundary region. In the case of the Earth’s core, key questions are centred onthe identity of the light elements of the core and their effect on energetics and thermodynamicproperties, the melting curve of iron and its alloys and the origin of seismic anisotropy in theinner core.
Both new and established high-pressure synchrotron methods applied to the diamond anvilcell and large-volume apparatus are surveyed. Advances in synchrotron capabilities have beenaccompanied by new innovations in high-pressure technology. X-ray diffraction techniques aremature but continued improvements are leading to expanded pressure–temperature coverageand better ability to recover crystallographic details. Diffraction and absorption studies ofthe properties of liquids of silicate and iron alloy composition have expanded in response tonew capabilities. Recently, methods for inelastic scattering and nuclear resonance probes havebeen developed at high pressures and these provide constraints on vibrational, electronic andmagnetic properties, which were previously unattainable.
(Some figures in this article are in colour only in the electronic version)
0034-4885/05/081811+49$90.00 © 2005 IOP Publishing Ltd Printed in the UK 1811

1812 T S Duffy
Contents
Page1. Introduction 18142. An overview of the Earth’s deep interior 1814
2.1. Seismic structure of the Earth 18142.2. Geochemical evidence on the makeup of the Earth’s mantle 18172.3. Mantle circulation 18192.4. Subduction zones 18192.5. Role of synchrotron-based high-pressure research 1820
3. Experimental techniques for planetary interior research 18223.1. Apparatus for generating high pressure and temperature 1822
3.1.1. Diamond anvil cell 18223.1.2. Laser heating 18233.1.3. Large-volume apparatus 1825
3.2. Synchrotron techniques for deep Earth studies 18263.2.1. Powder x-ray diffraction 18263.2.2. Single crystal x-ray diffraction 18283.2.3. Synchrotron techniques for studying amorphous materials at high
pressures 18293.2.4. X-ray scattering 18303.2.5. Spectroscopy 1831
3.2.5.1. X-ray emission spectroscopy 18313.2.5.2. IR spectroscopy 1832
4. Selected applications of synchrotron research to the mantle 18324.1. Equation of state 18324.2. Phase changes and seismic discontinuities in the upper mantle 1833
4.2.1. 660 km discontinuity 18334.2.2. 410 km discontinuity 1834
4.3. Slab penetration into the lower mantle 18364.4. Mantle rheology 18374.5. Lower mantle minerals 1839
4.5.1. Magnesium silicate perovskite 18394.5.2. Calcium silicate perovskite 18414.5.3. (Mg,Fe)O 18414.5.4. SiO2 1842
4.6. Post-perovskite phase and the core–mantle boundary 18425. Selected applications of synchrotron research to the core 1844
5.1. Crystal structure of iron 18445.2. Elasticity of iron 18455.3. Fe–FeS system 18475.4. Melting of iron 18475.5. Properties of iron and iron-alloy liquids 1849
6. Experimental challenges 1850

Synchrotron facilities and study of the Earth’s interior 1813
7. Summary 1851Acknowledgments 1851References 1851
1814 T S Duffy
1. Introduction
The geological activity that manifests itself so dramatically at the Earth’s surface ultimatelyoriginates from the processes in the deep interior. Plate tectonics provides a coherent frameworkfor describing the behaviour of the tectonic plates that cover the Earth’s surface. However, thedriving forces of plate tectonics remain poorly understood. Progress requires understandingthe physical and chemical state of the planet’s interior as well as its formation and evolution.
The solar system provides us with a range of planetary systems that are even moreimperfectly understood than the Earth. As one example of the diversity of planetary styles, theEarth is the only planet on which plate tectonics is known to operate, but the reasons for itsapparent absence on other planets are unclear. In addition planetary interiors provide naturallaboratories for investigating the physical and chemical behaviour of materials under extremeconditions of pressure and temperature.
Understanding planetary structure and evolution requires a detailed knowledge of theproperties of geological materials under conditions of deep planetary interiors. Experimentsunder such extreme conditions are challenging, however, and many fundamental propertiesremain poorly constrained or are inferred only through uncertain extrapolations from lowerpressure–temperature (P –T ) states.
In recent years, synchrotron-based techniques have played an ever-increasing role in theexperimental effort to understand geological materials at high pressures and temperatures.Over the last decade, the development of new third-generation synchrotrons augmented byimprovements in x-ray optics and detectors has led to dramatic advances in material propertymeasurements at high pressures. The availability of synchrotron-based tools has also driventhe development of new high-pressure designs. Differential stress in the sample, for example,rather than being a hindrance, is now being exploited for new experimental measurements.Established techniques, such as x-ray diffraction, are being used at higher pressures andtemperatures with increased precision and accuracy of measurement. New techniques in high-pressure x-ray spectroscopy and scattering have greatly advanced capabilities for studyingthermodynamic, elastic and electronic properties.
Section 2 of this review discusses the geophysical and geological constraints on the Earth’sinterior, emphasizing problems of recent interest. In section 3 developments in high-pressureand synchrotron tools for the Earth’s interior research are surveyed. In sections 4 and 5,applications of recent synchrotron-based studies to the selected problems of the mantle andcore are presented. In section 6, some speculations regarding future developments are noted.
2. An overview of the Earth’s deep interior
Knowledge of deep planetary interiors is derived from a multi-disciplinary effort involvinggeophysical observations (e.g. seismology), geochemical analysis of rocks and the mineralsderived directly or indirectly from the deep Earth, numerical simulations of convective flowof material under Earth conditions and the study (using both experiment and theory) of thephysical and chemical properties of the Earth materials at high pressures and temperatures.Here an overview of recent progress from geophysical, geochemical and geodynamics researchis given and some key issues of relevance for high-pressure synchrotron studies are highlighted.
2.1. Seismic structure of the Earth
The most direct information about the interior structure of the Earth comes from analysis ofseismic waves generated by large earthquakes around the world. From globally averaged or

Synchrotron facilities and study of the Earth’s interior 1815
Continental crust
Figure 1. (Left) Globally averaged variation of compressional velocity (VP), shear velocity (VS)and density (ρ) with depth from Earth model AK135 [1]. (Right) Schematic illustration of majorfeatures of the Earth’s interior. From [20].
regional profiles of compressional velocity, shear velocity and density with depth [1], the basicstructure of the Earth’s interior is revealed (figure 1). The Earth’s crust varies in thicknessfrom 0 to 70 km and is on an average 35 km thick under the continents and 7 km thick underthe oceans. Below the crust lies the mantle. The mantle is divided into the upper mantleand lower mantle by an abrupt increase in seismic velocity at 660 km depth. Another majorseismic discontinuity occurs near 410 km depth. In between the two discontinuities is a regionof anomalously steep seismic gradient known as the transition zone. The uppermost mantle,above 410 km depth, is characterized by strong regional variations in velocity and, in certainregions, by a seismic low-velocity zone.
The lithosphere is the rigid, thermal boundary layer that overlies the hotter, ductile mantleundergoing convective motion. Under the oceanic regions, the lithosphere can reach a thicknessup to ∼100–130 km, while the lithosphere under the continents can be up to 250 km thick. Theoceanic lithosphere consists of SiO2-rich basaltic oceanic crust underlaid by SiO2-poor andMgO-rich peridotite layers. The oceanic lithosphere returns to the mantle at subduction zones,which are regions of abundant volcanic and seismic activity (figure 1).
In general, the lower mantle, extending from 660 km depth to the core mantle boundarynear 2900 km depth, exhibits a smoother variation of seismic velocity with depth. The layerthat lies 200–300 km above the core–mantle boundary, known for historical reasons as D′′, isone of the most obscure yet important parts of the mantle, having extreme lateral heterogeneityand anomalous properties [2]. A global seismic discontinuity has been reported to exist at thetop of the layer [3, 4]. Local regions of very low seismic velocities (ultra-low velocity zones)are interpreted in terms of partial melting at the base of the mantle and/or chemical reactionsbetween the mantle and the core [5]. D′′ may be the source region for volcanic hot spots suchas Hawaii [6]. It may also be important as the final resting place for the subducting slabs.As discussed later, recent synchrotron experiments at pressures in excess of 100 GPa haveidentified a new structural phase transition that may finally provide a coherent explanation forsome of the features of this region.

1816 T S Duffy
Figure 2. Vertical average of finite frequency tomographic results over the bottom 1000 km of theEarth’s mantle. Red regions exhibit relative compressional velocity perturbations (δVP/VP) thatare slower than average and blue regions are faster than average. From [9].
Over the last 20 years, seismologists have made major strides in constraining thethree-dimensional seismic structure in the mantle, using seismic tomography [7] (figure 2).Tomographic studies are able to resolve the velocity variations associated with subductinglithospheric plates and thereby image their interaction with the 660 km seismic discontinuity.While a range of behaviour is observed at different subduction zones, evidence of slabpenetration through the 660 km discontinuity at many subduction zones provides strong supportfor a mantle-wide circulation system [8]. More recently, tomographic studies have examinedthe nature of rising plumes of hot material (hot spots) [9], and the scale and degree ofheterogeneity in the deep mantle [10]. The velocity variations imaged by tomography canmostly be ascribed to the effects of temperature [11, 12] but chemistry and phase may also beimportant, especially in certain regions such as the subcontinental lithosphere and the deepestmantle. Synchrotron studies play a major role in constraining the thermoelastic properties ofminerals needed to interpret the tomographic images.
The Earth’s core accounts for about one-third of the planet’s mass. Based on a numberof lines of evidence including shock compression data and cosmochemical considerations,the core is inferred to be predominantly iron, but experimental studies show that the coremust also contain ∼10% lighter element by mass (see [13] for a review of core properties).Candidate light elements for the core include S, O, Si, C and H. The core itself is dividedinto a liquid outer core and a small, solid inner core with a 1228 km radius. The Earth’s coreplays an important role in the energetics and dynamics of the planet and provides the sourcefor the Earth’s magnetic field. The Earth’s inner core is believed to be growing over time asthe Earth cools. Information on the history of the geomagnetic field and hence the evolutionof the core is contained in surface rocks which record the paleomagnetic field direction andintensity of the time of their formation. A comparison of seismologically determined densitiesof the inner core with those expected for iron under the relevant P –T conditions suggests thatthe inner core is also likely to contain some light element but perhaps only half as much asthe outer core [14]. The selective rejection of light elements upon crystallization at the innercore boundary provides a source of compositional buoyancy that is likely to be an importantcontributor to the driving forces for convection in the fluid outer core [15]. Also, there is

Synchrotron facilities and study of the Earth’s interior 1817
seismological evidence that the inner core has some degree of layering. The inner core iselastically anisotropic with seismic waves travelling about 3% faster in the direction of therotation axis compared with the waves travelling in the equatorial plane.
While seismology provides the strongest constraints on the nature of the Earth’sinterior with depth, other geophysical measurements also place observational constraintson the interior. Experimental studies at high pressures and temperatures are necessaryfor the interpretation of many of these measurements. Bulk planetary properties suchas the mass, mean density and moment of inertia provide the zeroth order constraints.Other information comes from variations in the gravity field, topography, tidal response,rotation rate, intrinsic magnetic field and surface heat flow [16]. With the exceptionof the Moon, seismic data are unavailable for other planets and satellites in the solarsystem. Nevertheless, considerable insight into the behaviour of the interior andproperties of bodies across the solar system can still be deduced by remote observationstogether with reasonable inferences derived through appropriate analogies with the Earth’sbehaviour.
2.2. Geochemical evidence on the makeup of the Earth’s mantle
The chemistry of the Earth’s mantle is inferred from direct petrological data supplemented byconstraints on the bulk chemical composition of the Earth. Direct samples of the uppermostmantle (including mantle peridotites and xenoliths trapped in kimberlites or basalts) provideconstraints on the chemistry of the upper 200 km or so of the Earth’s mantle, although howrepresentative these samples are of the region as a whole remains an open question. Lessdirect (but perhaps more representative) constraints on the mantle come from the study ofthe detailed composition of basalts that are derived from the upper mantle by the processof partial melting at mid-ocean ridges. Mineral inclusions in diamond [17] provide raresamples of the deep mantle and these have been inferred to originate from the depths to thetransition zone or even the lower mantle. Interpretation of all these samples is augmentedby constraints on the Earth’s bulk chemistry [18] largely derived from the estimation ofthe solar system chemical abundances (from measurements of the solar photosphere andprimitive meteorites) together with models for the accretion, differentiation and evolution ofthe Earth.
The dominant picture that has emerged from such analyses specifies that the uppermostmantle is composed of an Fe- and Mg-rich rock type known as peridotite that has been depletedin low-melting point components by the process of basalt formation at mid-ocean ridges.Determining whether the composition of deeper regions matches that of the uppermost mantleis one of the major ongoing directions of high-pressure synchrotron-based research. Theaverage upper mantle is dominated by five oxide components: SiO2, MgO, FeO, Al2O3 andCaO. A peridotite (or pyrolite) composition can then be specified in terms of four primaryend-member minerals: olivine ((Mg,Fe)2SiO4), orthopyroxene ((Mg,Fe)SiO3), clinopyroxene(CaMgSi2O6) and pyrope-rich garnet ((Mg,Fe,Ca)3Al2Si3O12). Olivine is the dominant uppermantle mineral component in this model (about 60% by volume). Experimental studieshave revealed that each of the four end-members undergoes a series of phase transformationsunder compression (figure 3). For realistic mantle compositions, the picture is complicatedby interactions and mutual solubility among the phases. For example, at upper mantleconditions, pyroxenes dissolve into the garnet structure producing an Al-deficient majoritegarnet [19, 20].
The connection between this geochemical model and the geophysical observationsdiscussed above comes from the fact that at expected temperatures of the mantle, phase

1818 T S Duffy
Figure 3. A simplified chart showing phase transformations in end-member upper minerals.The approximate mantle depth corresponding to olivine transitions is indicated. For pyroxenes,representative high temperature (normal mantle) and low temperature (subducting slab) paths areshown. All end-members transform to perovskite or perovskite-bearing assemblages at pressuresof ∼25 GPa (650–700 km depth).
transformations in olivine occur at pressures corresponding roughly to those at depths of 410and 660 km, the major seismic discontinuities of the upper mantle. On this basis, it is expectedthat the bulk chemical composition inferred from near-surface rocks may extend across theentire upper mantle, and perhaps through the Earth’s mantle as a whole. However, morestringent tests of the model require consideration of the exact depth of the discontinuities aswell as the amplitude and width of the discontinuities and how these quantities vary regionally.Mineralogical models with somewhat lower olivine contents (∼40%) provide a better fit to theseismic data at 410 km [21, 22]. The presence of phase transitions also does not rule out theexistence of chemical changes.
A notable finding from the studies of the four end-member mineral compositions at highpressures is that, ultimately, all, transform to assemblages that are dominated by perovskite-structured phases. The perovskite-forming reactions produce atomic configurations withsilicon in octahedral rather than tetrahedral coordination by oxygen. Such transformationsoccur at depths corresponding to the transition zone and in the vicinity of the 660 kmdiscontinuity. Thus, from a mineralogical viewpoint, the 660 km discontinuity also playsa central role in the Earth’s mantle because of this fundamental change in the structural unitthat serves as the backbone of the various mineral phases.
While the bulk of the mantle may be represented by the phases found in peridotitesor pyrolite compositions, on consideration of a wider range of compositions includingplausible compositions in subducted oceanic crusts (some of which are geochemically altered),subducted sediments and other environments, the number of potential mineral phases becomeslarge (e.g. [23]). Over the last two decades, a major effort of synchrotron-based mineral physicsresearch has been to characterize the stability, phase transitions and equations of state of theminerals (and appropriate analogue compositions) that may form from the variety of plausiblemantle chemical compositions.
Synchrotron facilities and study of the Earth’s interior 1819
2.3. Mantle circulation
Mantle convection is the process by which the Earth slowly cools through the transport ofinterior heat to the surface. At subduction zones, the slowly moving (approximately a fewcentimetres per year) lithospheric plates plunge back into the mantle as part of this globalmantle circulation system. The major focus of current research is to understand the nature ofsubduction and mantle convection. In particular, a key question is the extent to which the mantleis compositionally uniform or whether large-scale heterogeneities exist which have survivedlong-term convective mixing processes. A related issue is the role that the major seismicdiscontinuities play in the overall mantle circulation scheme [24]. Some geochemical evidenceobtained from analysis of the distribution of trace elements and radiogenic isotopes in differentrock types favours the existence of long-lived chemically isolated reservoirs, associated perhapswith major seismic discontinuities [10]. However, evidence from seismic tomography suggeststhat many subducting lithospheric slabs penetrate through the 660 km discontinuity, althoughother slabs are impeded or deflected by the boundary [8]. Computer models simulating mantleflow also generally favour the whole mantle rather than layered convection [10, 25]. Mantleconvection occurs through solid-state flow driven by density contrasts. Therefore, in order tocharacterize the driving forces for mantle flow, it is necessary to understand all the contributionsto density variations including chemical, thermal and structural effects as a function of P andT for candidate phases. Similarly, the interpretation of velocity anomalies imaged by seismictomography in terms of variations in temperature, composition and phase also requires adetailed understanding of structural and thermodynamic properties of mantle minerals andtheir variation with pressure and temperature. It is also necessary to understand the flowlaws which govern solid-state deformation of minerals in different regimes of the Earth’smantle [26–28].
There is intriguing seismic evidence of chemical heterogeneity in the deep mantle [29,30].For example, observed anti-correlations between relative variations in shear wave velocity anddensity or shear and bulk wave velocities in the deep lower mantle are inconsistent with theexplanation solely in terms of thermal effects and imply that there must also be significantlateral compositional variations [31, 32]. Based on this and other lines of reasoning, it hasbeen suggested that the bottom third of the mantle may be geochemically distinct, and moreheterogeneous, although no global sharp discontinuity in seismic velocity has been detectedthere [29].
2.4. Subduction zones
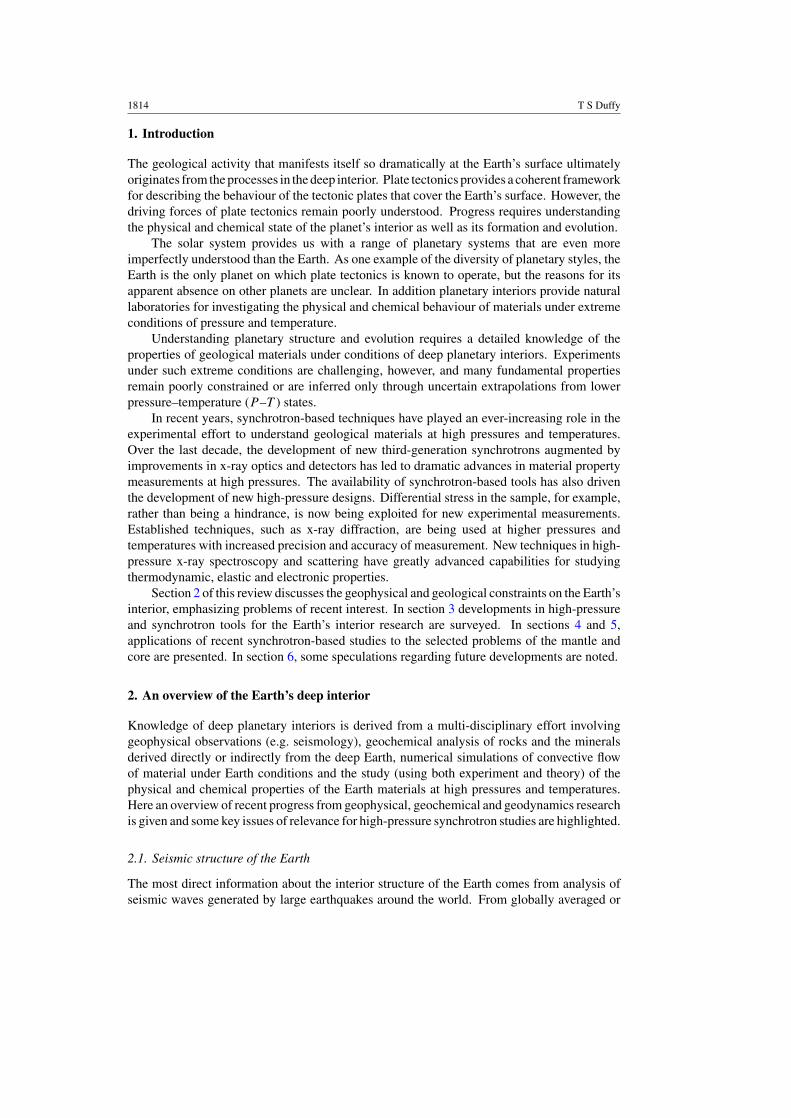
Subduction, the process by which the lithospheric plates are recycled into the mantle, providesa mechanism to inject chemical heterogeneity into the deep Earth (figure 4). The subductingslabs consist of a layer of basalt-composition crust overlying chemically depleted mantle.There are several fundamental questions associated with subduction zones and their role inEarth processes.
Subduction zones are associated with intermediate (100–300 km depth) and deep(300–680 km depth) earthquakes. The existence of such earthquakes is puzzling as thetemperatures in the subducting slabs should be so high that ductile flow rather than brittlefailure should be the dominant deformation mechanism under these conditions. A number ofhypotheses have been proposed to explain the existence of deep seismicity. One possibilityis that olivine, in the cold interior portion of the slab, continues to exist metastably far belowthe depth of the 410 km discontinuity. A sudden transformation to one of its high-pressurepolymorphs might trigger an earthquake-generating instability. Other possibilities include
1820 T S Duffy
Figure 4. Schematic illustration of possible behaviour of the subducting lithosphere showingponding near the 660 km discontinuity. Yellow and red regions at the top of the slab are subductingoceanic crust. Remainder (tan region) is lithospheric mantle. From [352].
metamorphic dehydration reactions in hydrous minerals or plastic instabilities. A detailedunderstanding of deformation behaviour under differential stress conditions, and the kineticsand mechanisms of phase transformations in mantle minerals including hydrous minerals, isneeded to understand the deep earthquake process.
Another key issue related to subduction zones is their role in recycling volatiles (H2O,CO2, etc) into the mantle. Hydrogen remains one of the most poorly constrained compositionalvariables in the mantle. During subduction, slabs undergo a series of metamorphic reactionsthat release water into the overlying mantle and promote melting. How much water can yet beretained to be transported into the deep mantle is a subject of ongoing investigation. Owingto its large size, the mantle has the potential to store vast quantities of volatiles even if theyare present in small amounts in individual mineral phases. Hydrated mineral systems includenominally anhydrous minerals that incorporate variable amounts of OH as defects, hydroussilicates of metamorphic environments and a class of dense hydrous magnesium silicates—eachof these groups has members that could potentially harbour water deep into the upper and alsothe lower mantle [33]. The presence of hydrogen can affect properties such as elasticity [34],strength [35,36] and melting temperature. Small amounts of hydroxyl can cause large changesin the effective viscosity of rock, and hence can influence the rate and pattern of mantle flow.There is increasing geophysical evidence for hydrated regions in the Earth’s interior [37–39].
2.5. Role of synchrotron-based high-pressure research
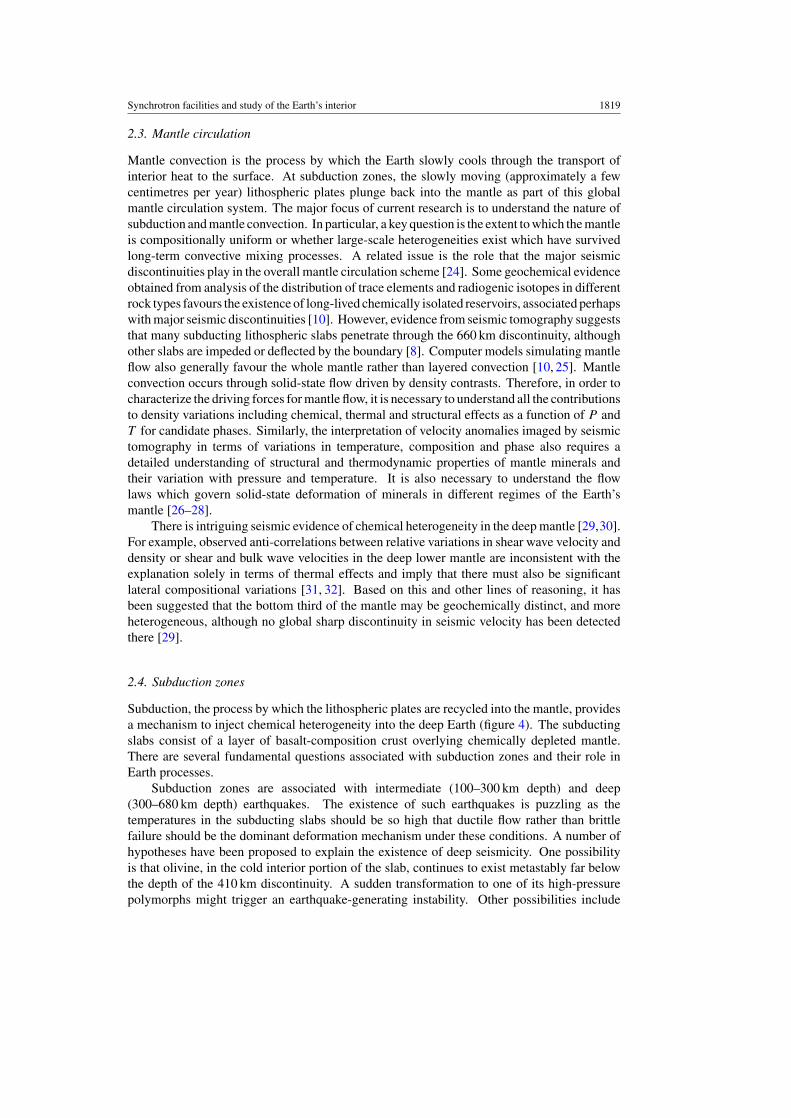
Pressures in the deep Earth are determined from the density distribution with depth (figure 1).The pressure at the base of the upper mantle (660 km) corresponds to about 24 GPa, whereasthat at the core–mantle boundary is 135 GPa. The inner-core boundary is at a pressure ofnearly 330 GPa and the pressure at the centre of the Earth is 363 GPa. Temperatures areconsiderably more uncertain, and the plausible temperature range of interest for the mantleis shown in figure 5. Near-surface constraints on temperatures come from a variety of lines
Synchrotron facilities and study of the Earth’s interior 1821
Figure 5. Summary of the plausible range of temperatures as a function of depth in the mantle [353].LVZ = low-velocity zone.
of evidence: temperatures of magmas, the near-surface geotherm, geothermometers derivedfrom mineral coexistences or solid solution compositions. At greater depths, temperaturescan be constrained by the location of phase boundaries, such as the melting point of iron at330 GPa and perovskite-forming transitions near 660 km depth. Thus, to examine the full rangeof phenomena (including melting) of relevance to the Earth’s mantle requires experimentalstudies at conditions up to 135 GPa (1.35 Mbar) and temperatures up to ∼4500 K. The Earth’score covers an even more extreme range: 135–363 GPa and temperatures of perhaps up to6000 K. These requirements place stringent demands on experimental apparatus to generatesuch conditions. The development of dedicated beamlines for high-pressure research at bothsecond- and third-generation synchrotron sources has been a synergistic development whichhas not only led to advances in analytical capabilities but has also stimulated new developmentsin pressure- and temperature-generating apparatus. Both high-pressure tools and synchrotronexperimental techniques are surveyed in the next section. Recent reviews of the applications ofsynchrotron research to materials research at high pressures can be found elsewhere [40, 41].
1822 T S Duffy
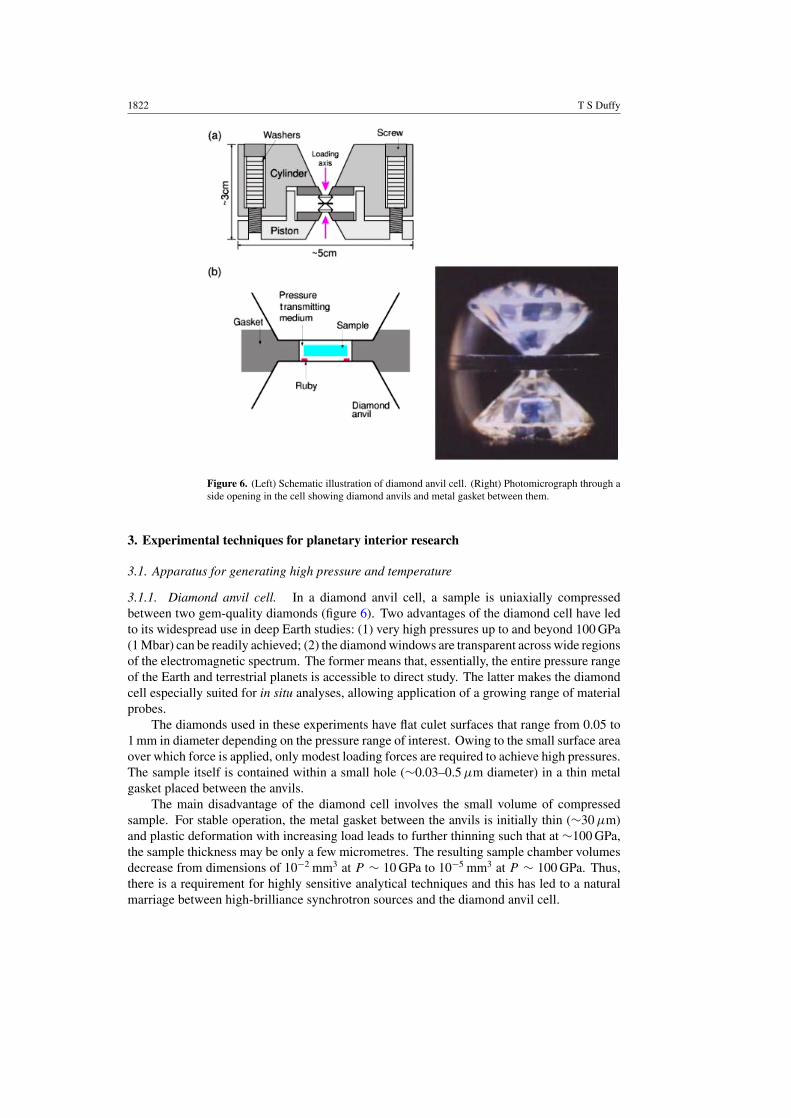
Figure 6. (Left) Schematic illustration of diamond anvil cell. (Right) Photomicrograph through aside opening in the cell showing diamond anvils and metal gasket between them.
3. Experimental techniques for planetary interior research
3.1. Apparatus for generating high pressure and temperature
3.1.1. Diamond anvil cell. In a diamond anvil cell, a sample is uniaxially compressedbetween two gem-quality diamonds (figure 6). Two advantages of the diamond cell have ledto its widespread use in deep Earth studies: (1) very high pressures up to and beyond 100 GPa(1 Mbar) can be readily achieved; (2) the diamond windows are transparent across wide regionsof the electromagnetic spectrum. The former means that, essentially, the entire pressure rangeof the Earth and terrestrial planets is accessible to direct study. The latter makes the diamondcell especially suited for in situ analyses, allowing application of a growing range of materialprobes.
The diamonds used in these experiments have flat culet surfaces that range from 0.05 to1 mm in diameter depending on the pressure range of interest. Owing to the small surface areaover which force is applied, only modest loading forces are required to achieve high pressures.The sample itself is contained within a small hole (∼0.03–0.5 µm diameter) in a thin metalgasket placed between the anvils.
The main disadvantage of the diamond cell involves the small volume of compressedsample. For stable operation, the metal gasket between the anvils is initially thin (∼30 µm)and plastic deformation with increasing load leads to further thinning such that at ∼100 GPa,the sample thickness may be only a few micrometres. The resulting sample chamber volumesdecrease from dimensions of 10−2 mm3 at P ∼ 10 GPa to 10−5 mm3 at P ∼ 100 GPa. Thus,there is a requirement for highly sensitive analytical techniques and this has led to a naturalmarriage between high-brilliance synchrotron sources and the diamond anvil cell.

Synchrotron facilities and study of the Earth’s interior 1823
Measurement of equilibrium thermodynamic properties at high pressures and temperaturesrequires that the experiments be conducted under hydrostatic stress conditions. The uniaxialload in a diamond anvil cell is transformed to a hydrostatic pressure by surrounding the samplewith a fluid pressure medium. However, above ∼16 GPa at room temperature, all knownpressure media freeze, resulting in the development of some degree of non-hydrostatic stresses.In practice, samples are often surrounded by a soft solid pressure-transmitting medium, therebygenerating a quasi-hydrostatic stress state. Rare gas solids (He, Ar, Ne) are often used forthis purpose, but other soft materials (e.g. NaCl) are also employed. In addition, deviatoricstresses can be relieved by annealing the sample at high temperature using the laser-heatingtechnique discussed later. Deviatoric stresses can often be readily monitored and characterizedby measuring either the relative variations of lattice parameters or the ellipticity of diffractionrings together with lattice strain theory [42, 43].
Pressure measurement in the diamond anvil cell relies on the use of calibrated standards.One common method involves measurements of the R1 fluorescence wavelength of small rubycrystals placed in the sample chamber excited using visible laser irradiation [44]. This rubyfluorescence scale [44–46] has been calibrated against room-temperature isotherms derivedfrom shock Hugoniot data. The accuracy of the ruby scale has been verified to be within±1% up to 55 GPa, from the analysis of simultaneous volume and elasticity data [47, 48], butits accuracy declines at higher pressures [49] and may also be affected by polymorphism ofAl2O3 [50,51]. Some refinements to the ruby scale have been developed in recent years [52,53].For synchrotron studies in both the DAC and multi-anvil apparatus (discussed later), the useof internal x-ray standards is common. The development of improved high P –T pressurestandards is an important area of research [54].
Diamond anvil cell technology has undergone continual refinement since its inception.The needs of synchrotron experiments have driven the development of symmetric andpanoramic cell designs [55], as well as improvements to x-ray transparent gaskets and backingplates [56, 122]. Earlier, nearly all diamond cell studies used an axial geometry in which thex-rays enter and exit the sample through the diamonds. However, a number of diffractionand scattering experiments require a wider range of angular access to the cell or suffer fromexcessive absorption by the diamonds (below ∼10 keV). The development of x-ray transparentberyllium [58, 59] and boron gaskets [60] have aided many experiments including diffractionexperiments measuring lattice strain anisotropy in response to a non-hydrostatic stress fieldand inelastic scattering experiments using the panoramic geometry [55].
3.1.2. Laser heating. One of the most important developments resulting from themarriage of synchrotron beamlines and high-pressure techniques has been to foster in situexperiments at or approaching the P –T conditions of planetary interiors as opposed to themore indirect temperature-quench or ambient-pressure recovery experiments that dominatedpreviously.
In the diamond cell, high temperatures can be achieved by electrical resistive heating orby laser heating. Resistive heating methods offer the advantage that they can produce highlyuniform temperatures in the pressure cell, yet are often restricted to temperatures of ∼1300 Kor less, thus, limiting the direct replication of geophysical conditions to those found in coldsubducting slabs. Nevertheless, resistive heating methods have found important applicationsfor pressure–volume–temperature (P –V –T ) equation of state and phase transformation studiesof planetary materials [61]. More recently, new designs for internal and external resistiveheating have been developed that can reach either very high temperatures (∼3000 K) at modestpressures [62] or modest temperatures (1200 K) at megabar pressures with a high degree ofthermal stability [63].

1824 T S Duffy
(b)(a)
(d)(c)
Figure 7. The laser-heated diamond anvil cell. (a) Sample viewed through the diamondanvils. The diamond culet is 500 µm in diameter. The sample consists of a mixture of asilicate (pyrope garnet) and platinum powder. The sample is insulated from the diamonds andsurrounded by argon. Small ruby crystals and a cerium-doped YAG (Y3Al5O12) crystal arealso loaded into the sample chamber. The pressure is about 20 GPa. (b) The YAG : Ce crystalsfluorescence in the visible (spectral emission range: 487–587 nm) in response to x-ray excitation.X-ray fluorescent crystals enable improved alignment of x-ray beam and heating laser [275].(c) Visible radiation emitted by the heated sample at ∼2000 K. (d) Sample after several heatingcycles. Pt diffusion away from hot spot produces an inhomogeneous distribution after repeatedheating.
In the laser heating method, the sample is heated by an infrared (IR) laser beam andtemperatures are measured by spectroradiometry [64, 65] (figure 7). This method hasmany advantages, among the most important of which is the ability to heat samples athigh pressures to temperatures up to ∼5000 K. While different laser heating configurationshave been installed at various synchrotrons, the double-sided heating design using anear-IR laser developed by Shen et al [66] is prominent at third-generation synchrotronsources such as the APS and SPring-8 [67, 68]. Systems using CO2 laser sourceshave also been employed at synchrotrons [69, 70]. CO2 laser heating systems have theadvantage that the laser is directly absorbed by silicates and oxides, and no additionallaser absorber is required. Concomitant with the development of dedicated laser heatingsystems at third-generation sources, there has been continual improvement in laser heatingtechniques, temperature measurement and sample assemblies [71]. In particular, effortshave been focused on the examination of thermal gradients [72–76], thermal pressureeffects [77, 78] and chemical reactivity [79]. Characterization and improvements to theheating environment [57] and the optical system [70, 80] have also been the focus ofrecent work.

Synchrotron facilities and study of the Earth’s interior 1825
While laser heating can readily achieve planetary temperatures, it suffers from a seriousdisadvantage that strong radial and axial temperature gradients can develop. In modernlaser heating systems, radial gradients are minimized in various ways including the use ofTEM01 laser modes, combinations of low order (TEM00, TEM01) laser modes, multi-modelasers or defocused beams. Micro-focusing of the x-ray beam to ∼5–10 µm diameter [81]can ensure that the diffracted intensity is restricted to the flat-topped portion of the samplehot spot.
A question with regard to laser heating has been the issue of systematic temperatureuncertainties. These can arise from chromatic aberrations in the optical system [70],wavelength-dependent emissivity of the sample [64] and poorly characterized axial temperaturegradients [76]. In the case of resistive heating, (and the large-volume apparatus discussedbelow), temperature measurements using thermocouples may also suffer systematic uncertaintyowing to the poorly characterized effect of pressure on thermocouple voltage [82, 83]. Thus,an important advance is the recent development of an independent and absolute temperaturecalibration using the intensity ratio of phonon creation to phonon annihilation pairs as measuredby nuclear resonant inelastic scattering on laser-heated samples [84,85]. At 1400 K and 24 GPa,the temperature from the phonon creation/annhilation sidebands could be determined to within5–10% [85], and was in agreement with results from spectroradiometry [67, 85]. Furtherdevelopment of this method promises to provide improved temperature metrology underextreme conditions.
3.1.3. Large-volume apparatus. Large-volume multi-anvil presses cover a more limitedP –T range than the diamond anvil cell. However, this disadvantage is compensated by alarger sample volume (∼1–10 mm3) that allows for highly uniform (±10–20 K) and prolongedstable heating. More complex sample assemblages can be accommodated in this device aswell. A variety of different anvil assemblies, including both single-stage and double-stagedesigns, are available. In a single-stage multi-anvil apparatus, pressures up to ∼15 GPa can bereached, whereas in double-stage systems conditions at the top of the lower mantle (∼30 GPa,2000 K) can be achieved.
A major activity of the multi-anvil apparatus has been the quantitative determination ofphase relations in multi-component systems that are relevant for the major lithologies expectedin the mantle [19]. Before the development of synchrotron techniques, such studies werecarried out on quenched samples. This approach has a limitation in that pressure is notwell constrained at high temperatures. Other areas where the multi-anvil apparatus hasplayed a prominent role include the determination of thermoelastic properties from ultrasonicinterferometry [86], P –V –T equation of state [87], deformation studies [28] and properties ofmelts at high pressures [88].
A variety of press designs and characteristics can be found at various synchrotrons, anddetailed descriptions of the multi-anvil systems at SPring-8 [89] and the Advanced PhotonSource [90] have been reported. Another type of large-volume apparatus in use at synchrotronfacilities is the Paris–Edinburg press [91]. The capabilities of large-volume apparatus systemscontinue to evolve rapidly. One recent technical development is the capacity of oscillating thepress in the x-ray beam to improve diffraction crystal statistics in energy dispersive diffractionexperiments [92]. The replacement of some or all of the tungsten carbide anvils with sintereddiamonds or cubic boron nitride has been the focus of ongoing developmental efforts that haveresulted in achievements of pressures in excess of 40 GPa at 2000 K [93] and in an improvedx-ray access to the pressure chamber. Overviews of recent developments using synchrotronradiation and large-volume apparatus have been reported [83, 94].

1826 T S Duffy
Second stage anvil
X–ray
Slits Fluorescencescreen
Collimator SSD
CCD
SPEED–1500
Figure 8. Experimental set-up for energy dispersive x-ray diffraction experiments in the multi-anvilapparatus. SPEED-1500 is an instrument in operation at SPring-8. From [83].
3.2. Synchrotron techniques for deep Earth studies
The development and growth of dedicated beamlines for high-pressure research at second- andthird-generation synchrotron sources has enabled high-pressure studies to exploit a number ofdesirable characteristics of synchrotron radiation. High x-ray energies are valuable becauseof their ability to penetrate the pressure-confining medium. High intensities provide forrapid data accumulation on small weakly scattering samples. The small divergence of thebeam enables achievement of small x-ray spots with slits or focusing optics that allow forhigher intensities, isolate the pressure-confining medium and restrict the data collection toregions of minimal pressure and temperature gradients. The synchrotron developments havebeen coupled with developments in x-ray optics and detectors that allow detection of thesubtle features often required to properly determine the unit cell and determine or refine thecrystal structure. The tuneability of synchrotron sources and advances in high-resolutionoptics has allowed for development and application of resonant scattering and spectroscopictechniques.
3.2.1. Powder x-ray diffraction. Powder x-ray diffraction has been the workhorse techniquefor synchrotron-based high-pressure studies. Initially, the energy dispersive method was widelyadopted [95]. In this technique, a white x-ray beam is directed through the diamond anvilsor between gaps in the anvils of a multi-anvil apparatus and the diffraction is recorded asa function of x-ray energy at a fixed scattering angle using a solid-state detector (figure 8).The fixed scattering angle is well suited to high-pressure apparatus. In the diamond cell,supporting plates behind the diamonds have only limited opening angles, particularly forexperiments aimed at achieving higher pressures. The energy dispersive technique allows forrapid, real-time data accumulation. Slits used for spatial filtering in the scattered beam pathcan reduce unwanted background scattering. However, the relatively poor energy resolutionof solid-state detectors is a serious disadvantage, especially when examining lower symmetryphases or mixtures of multiple phases, as peak overlaps greatly hinder the data analysis.Also, as only a small portion of the diffracted cone is recorded, the measured intensities can begreatly affected by texture development under stress and grain growth during high-temperatureexperiments. Over the past two decades, energy dispersive diffraction has been a widely usedtechnique for synchrotron-based studies of equations of state [43, 87, 96–101], high P –T phase

Synchrotron facilities and study of the Earth’s interior 1827
Figure 9. Experimental set-up for angle-dispersive x-ray diffraction experiments in the laser-heateddiamond anvil cell. From [354].
transitions [102,103], texture development [58], strength and rheology determination [104,105]and melting studies [106].
The use of angle dispersive polycrystalline diffraction techniques at high pressures hasincreased in recent years. In this technique, a monochromatic x-ray beam is directed through thepressure apparatus and the rings of diffracted intensity are recorded using an imaging plate (IP)or CCD detector (figure 9). CCD detectors have the advantage that readout time is minimalwhich can be especially important for laser-heating experiments in the DAC. However, IPshave larger active areas, and superior resolution can be obtained. The main advantage of theangle dispersive method is markedly better angular resolution of diffraction peaks. Subtlephase transformations have been identified in several systems that could not be detected bythe energy dispersive method (e.g. [107]). Also, with a CCD or IP detector, integration of thewhole powder ring means that reasonable intensities can be obtained. The powder patternscan then be subject to whole profile structure refinements using the Rietveld method to obtaininformation on the evolution of structure parameters with pressure. An example of a Rietveldrefinement result for the post-perovskite (CaIrO3-type) phase in MgGeO3 at 89 GPa is shown infigure 10. Area detectors also allow for the study of preferred orientation from which insightsinto deformation mechanisms can be obtained [108]. Time-resolved studies involving an IPtranslating continuously behind a slit, as the temperature is raised, can be used to obtain asingle record across a high-temperature phase transition from which the kinetic parametersgoverning the transition can be recovered [109].

1828 T S Duffy
Figure 10. Representative Rietveld refinement results from monochromatic diffraction data for theCaIrO3-type phase of MgGeO3. The solid line shows calculated diffraction intensity and crossesare observed diffraction intensity. The pressure determined from the Pt (111) reflection is 89.0 GPa.The ticks at the bottom show diffraction peak positions for NaCl B2 phase (top), Pt (middle) andCaIrO3-type MgGeO3 (bottom). The curve below the ticks indicates the difference between theobserved and the calculated diffraction intensity. Regions near 7˚, 8˚ and 10.5˚ were excluded fromthe fit to avoid misfit due to deviatoric stress in Pt and NaCl and due to presence of ultratransformedstarting material.
One disadvantage of the angle dispersive method is that the accessible d-spacing rangemay be limited by the constraints of the pressure vessel. The tuneability of synchrotronradiation can partially overcome this through the selection of relatively short-wavelengthx-rays. Also, the loss of diffracted beam collimation means that diffraction from the pressuremedium surrounding the sample and Compton scattering from the (diamond) anvils can leadto high backgrounds and low signal-to-noise ratio. A new technique that aims to combinethe advantages of energy- and angle-dispersive diffraction by collecting angle-dispersive data,using a solid-state detector and white synchrotron radiation, has recently been developed forthe multi-anvil press [110].
3.2.2. Single crystal x-ray diffraction. Single crystal experiments at high pressures areespecially challenging owing to the limited access to reciprocal space afforded by the high-pressure apparatus. An energy dispersive single-crystal method for the diamond cell has beendeveloped to overcome this limitation and give high accuracy in lattice constant determinationunder quasi-hydrostatic conditions at pressures that extend into the lower mantle range [111].The spatial filtering of unwanted background owing to pressure cell components affordedby the energy dispersive technique is again effective for the case of very small crystals orvery weak scatterers. Examples of applications of this method to mantle and core relevantmaterials include studies of FeO [112], Mg(OH)2 [113] and SiO2 [114]. Ferroelastic phasetransformations in minerals that result in the softening of shear elastic moduli may have directrelevance for the interpretation of seismic shear velocities in the mantle [115]. In the caseof SiO2, determination of the precise cell constants from single-crystal diffractionprovidesinsights into the nature of the phase transition from stishovite to the CaCl2-type phase [114]
Synchrotron facilities and study of the Earth’s interior 1829
while effects on strength and elasticity were obtained from other experiments using an energydispersive diffraction in a radial geometry [116]. Another important geological application ofthis technique is to identify and characterize single-crystal inclusions in natural diamonds [117].The technique has also been applied to the identification of high-pressure phases in meteorites.In the Shergotty meteorite, which is known to originate from Mars, the α-PbO2 phase of SiO2
was discovered and characterized [118]. This provides an interesting but not fully understoodexample of formation of metastable high-pressure phases in the SiO2 system, a topic that hasbeen addressed in detail in high P –T experiments, as discussed in a later section.
3.2.3. Synchrotron techniques for studying amorphous materials at high pressures. Meltingis a major agent of chemical differentiation in planets. Silicate liquids exhibit complexbehaviour under compression as the tetrahedral framework of the liquid adopts more compactconfigurations. The liquid structure, ultimately, determines the basic thermodynamic andtransport properties of the melt, such as its viscosity and density. The geophysical consequencesof such evolution can be profound. For example, melts generally have high compressibilitiesas compared with solids and this may lead to formation of regions on the Earth, where certainmelts become neutrally or negatively buoyant (one possibility for this is the ultra-low velocityzone in the D′′ region [5]). More generally, knowledge of melt and liquid properties bear onsuch processes ranging from those important to the Earth’s formation and early evolution, suchas magma ocean and core formation processes, to present phenomena such as surficial volcanicactivity, and also the possible distribution of melts in the present mantle [119]. In the case ofthe Earth’s core, melt properties allow constraints to be applied on chemistry of the core andconvection and magnetic field generation in the outer core.
However, knowledge of the properties of melts and glasses is much more limited than forcrystalline solids. Studies of glasses and quenched melts using a variety of techniques, suchas NMR and IR spectroscopy, provide many insights which are ultimately indirect. Again, thedevelopment and improvement of synchrotron facilities has provided new opportunities fordirect measurements at high pressures and temperatures.
X-ray diffraction measurements of local structure in liquids, using high-pressure devices, isespecially challenging as the weak, broad scattering from the small compressed sample volumecan be swamped by the background from the high-pressure apparatus. Synchrotron radiationhas been crucial in making such measurements possible. Energy dispersive techniques, inwhich spectra are collected at a series of 2θ values, are effective because they allow for spatialfiltering to reduce the background scattering [88]. Angle dispersive techniques provide morereliable intensities and have been developed using a multichannel collimator and a multi-anvilpress [120]. Angle dispersive methods in the diamond anvil cell have been used to study thestructural evolution of amorphous and liquid iron up to 67 GPa [121, 122].
Studies of liquid silicates are especially challenging because of their chemical complexity,low mean atomic number and high melting temperatures. Through a series of improvementsto the energy dispersive method in a multi-anvil apparatus, x-ray diffraction studies [123]of MgSiO3 and CaSiO3 melts have now been reported at 6 GPa. Such studies enable thedetermination of the structural evolution of liquids and the degree of sharpness of structuralchanges and provide insights into compression mechanisms. While structural changes inliquids may be generally smooth, first-order liquid-to-liquid structural change have beenobserved in, for example, liquid phosphorus [124].
X-ray radiography methods [125] for density measurements of liquids, using x-rayabsorption, have been used for liquid density determinations of potential planetary core materi-als at high pressures using a large-volume press. In this method, a reference sphere or cylinderis embedded in the liquid sample which is then illuminated with monochromatic x-rays. The
1830 T S Duffy
absorption contrast between sample and reference material can be used to determine the sam-ple density to within ∼1% if several criteria are met. These criteria are that the materials ofthe pressure apparatus surrounding the sample remain homogeneous along the x-ray direction,the shape of the reference material (i.e. Al2O3) does not change with compression and theabsorption coefficients are independent of pressure and temperature. The method has alsobeen used to determine melt density in indium using the externally heated diamond cell [126].
Viscosities of liquid silicates have been extensively studied becuase of their importance forunderstanding magmatic processes in the crust and mantle [127]. Silicate melt viscosities arehighly sensitive to changes in pressure reflecting changes in melt polymerization. An importantadvance in understanding viscosity in high-pressure silicate liquids was the development ofthe falling sphere method in which the measured terminal velocity of a rigid sphere fallingthrough the liquid is related to viscosity through Stokes’ law. Kushiro [128] carried out the firstquench experiments in a piston-cylinder device and showed that, in contrast to normal liquids,the viscosity of silica-rich melts decreased with pressure up to 2.5 GPa. Using synchrotronradiation, an in situ Stokes’ viscometry method has been developed in which radiography isused to record the motion of an x-ray opaque marker sphere [129]. This method has a numberof advantages, especially the ability to determine more precise sinking velocities comparedwith fall-and-quench experiments. The pressure range of the technique applicable to silicatesamples has now been expanded past 10 GPa and 2000 K as a result of advances in synchrotroncapabilities and high-pressure techniques [130, 131]. While applications of such methods arestill in the initial stages, examples of significant findings to date include confirmation of aviscosity minimum in liquid albite (NaAlSi3O8) near 5 GPa [131], and a direct test showingsubstantial disagreement between viscosities from the falling sphere method and those inferredfrom oxygen self-diffusion data for a silica-rich composition at high pressures [132].
3.2.4. X-ray scattering. While x-ray diffraction provides information on the static positionof atoms, high-resolution inelastic x-ray scattering (IXS) techniques offer a means of probinglattice dynamics. IXS provides constraints on the dynamic structure factor and phonondispersion over the entire Brillouin zone [133]. The experimental technique involvesthe use of a high-resolution monochromator-analyser system with energy resolution of∼3 meV [134, 135]. Earlier, IXS techniques were of very restricted applicability at highpressures mainly because of constraints imposed by the pressure containment medium. Thedevelopment of third-generation synchrotron x-ray facilities together with improvements in celldesign has changed this situation. The high brilliance of the third-generation source coupledwith improvements in efficient focusing optics now allows such techniques to be applied tosamples as small as 10−4–10−5 mm3, resulting in the capability to perform such experimentsin diamond cell samples up to the megabar range. Detailed discussions of the application ofIXS to high-pressure research can be found elsewhere [134, 136].
For geophysical applications, synchrotron inelastic scattering experiments presentsignificant new opportunities. Other techniques to measure phonon dispersion curves, such asinelastic neutron scattering, are generally feasible only at very low pressures or under othersimilarly restrictive conditions. In IXS, the sound velocities can be determined from the linearpart of the acoustic phonon branches. The elastic wave velocities (and the correspondingelastic constant tensor) are crucial for deep Earth studies because of their direct connectionto seismic profiles. More generally, the elastic constants give insight into mechanical andstructural properties, material strength, mechanical stability, interatomic interactions and phasetransition mechanisms. Methods such as Brillouin scattering and ultrasonic interferometryhave been traditionally used for such measurements at static high pressure [137, 138]. IXStechniques provide a complementary approach that is free of some limitations, such as the

Synchrotron facilities and study of the Earth’s interior 1831
need for optically transparent samples in Brillouin spectroscopy. Polycrystalline IXS studiesto date have focused on the determination of orientationally-averaged compressional soundvelocities [134, 139]. The effects of preferred orientation on the average sound velocity mustbe taken into account [140]. Use of single crystals and measurements of both longitudinaland transverse phonons in various crystal directions can constrain some or all of the elastictensor at high pressures [135,141]. The application to crystals is limited only by the ability topreserve single crystals in a hydrostatic environment at very high-pressure conditions.
Nuclear resonant inelastic x-ray scattering (NRIXS) also provides information on elasticand vibrational properties including sound velocities and the (partial) phonon density of states(DOS) of samples containing Mossbauer isotopes such as 57Fe [142, 143]. In this method thesample is compressed in a panoramic diamond anvil cell and the incident x-rays are focusedto 5 µm by a Kirkpatrick–Baez mirror system. X-ray energies are scanned using a ∼1 meVtuneable monochromator, and multiple avalanche photodiodes are used as detectors [85]. High-pressure studies using this technique were reported on Fe up to 153 GPa at room temperature[144, 145]. From the phonon DOS, information on the vibrational heat capacity and entropycan be obtained, allowing for constraints to be placed on a variety of properties includingthe Gruneisen parameter and thermal expansivity, both of which are relevant for constrainingthe geothermal temperature gradient in planetary cores. NRIXS measurements have nowbeen extended to simultaneous high pressure and high temperatures [67, 85, 146]. These areespecially demanding experiments as the long (4–6 h) counting times and stringent thermalstability requirements of the experimental hutch (∼5 mK h−1) during NRIXS experimentsrequire very stable heating systems and temperature control.
There are a number of complexities in the interpretation of NRIXS data. As withIXS, the determination of sound velocities requires some approximations in fitting ofmeasurements. The NRIXS method constrains an average or Debye sound velocity. Extractionof compressional and shear velocities is complicated by elastic anisotropy which can becompounded by preferred orientation effects [147]. It is, therefore, somewhat difficult toput firm limits at present on the precision of the recovered velocities for both the NRIXS andIXS techniques. For samples containing other components in addition to iron, a partial DOSsassociated with the iron sub-structure is measured, but this can be related to the Debye soundvelocity of the whole sample [148]. A number of iron alloys that are candidate light elementsfor planetary cores have now been explored by NRIXS methods [149–151].
Synchrotron Mossbauer spectroscopy (SMS) is time-domain nuclear resonant scatteringin the forward direction and is analogous to conventional Mossbauer spectroscopy in that itenables extraction of the hyperfine parameters (e.g. quadrupole splitting and isomer shifts) ofMossbauer-active nuclei. This method can be used to place constraints on properties such asvalence states, local environment, site occupancies, magnetic properties of iron in minerals andhigh-pressure phases [152]. At elevated pressures, conventional energy-resolved Mossbauerspectroscopy is restricted to highly iron-rich samples, whereas the SMS technique is applicableto more diluted samples owing to the substantial increase in flux from synchrotron sourcesas compared with conventional gamma ray sources. Applications of SMS techniques at veryhigh pressures include the study of hedenbergite at 68 GPa [153] and magnesium silicateperovskite at 120 GPa [152]. In Fe2O3, synchrotron Mossbauer spectra have been recorded onlaser heated samples demonstrating a transitition from a low-temperature magnetic state to ahigh-temperature non-magnetic state at 24 GPa and 1000 K [154].
3.2.5. Spectroscopy3.2.5.1. X-ray emission spectroscopy. In x-ray emission spectroscopy (XES), excitation ofdeep-core electrons produces fluorescent photons which are examined with sub-electronvolt
1832 T S Duffy
energy resolution [55]. An example of a geophysical application of XES is the study of thespin state of iron atoms through examination of the Fe Kβ emission line. High spin–low spintransitions in Fe-bearing minerals can affect a number of physical properties including densityand compressibility, geochemical behaviour (i.e. Fe partitioning among phases) and transportproperties (thermal conductivity and electrical conductivity). Changes in the optical absorptionspectrum could affect the dominant heat transport mechanism under deep Earth conditions bypotentially enhancing radiative transfer [155]. In 1999, the first application of this method athigh pressures was reported in which the high spin–low spin transition in FeS at 7 GPa wasidentified [156]. Numerous other materials have now been studied, even at conditions wellabove 100 GPa (e.g. [155, 157–162), and the geophysical implications of some of these studiesare discussed later.
3.2.5.2. IR spectroscopy. Synchrotron radiation also provides a bright source in the IRregion, and IR microspectroscopy systems at synchrotron beamlines can realize sensitivityseveral orders of magnitude of higher than conventional laboratory systems. Vibrational IRspectra recorded at high pressures complement diffraction data and yield information aboutbonding, crystal symmetry, phase transitions and vibrational properties. IR spectroscopyplays an important role in elucidating the behaviour of hydrogen in Earth minerals. Therehas been considerable interest in the various hydrated mineral systems and their geophysicallyrelevant properties as discussed earlier. Examples of application of IR spectroscopy to thesephases include the study of brucite [163] and chondrodite [164] at elevated pressures. Moredetailed reviews of the applications of high-pressure IR micro-spectroscopy are reportedelsewhere [165, 166].
4. Selected applications of synchrotron research to the mantle
4.1. Equation of state
Interpretation of seismic structure of the Earth began more than 50 years ago when Birch [167]recognized that phase transitions or chemical changes were necessary to explain the seismicstructure of the upper mantle. The crystal structure and the equation of state of eachcandidate mineral at high pressures and temperatures are the most basic information neededto model the mineralogy of the mantle. High P –T structural studies using synchrotron x-raydiffraction have long played a key role in identifying stability ranges of minerals phases [61].Among experimental methods that constrain elastic properties, static P –V compressionexperiments [168] have been a major contributor as they can be applied across the widest rangeofP –T conditions and have no special sample requirements, making them feasible even on non-quenchable high P phases. Nevertheless, equation of state determination needs to be performedwith care. At room temperature, the effects of non-hydrostatic stress can bias equation ofstate parameters. Also, the well-known trade-off between fit values of the bulk modulusand its pressure derivative needs to be considered. P –V –T equation of state measurementsprovide constraints on thermal parameters required to model mineral assemblages at high-temperature interior conditions [87]. At high temperatures, the parameters that govern thethermal equation of state can be recovered with varying degrees of precision from differentexperimental tools which can sample different P –T ranges with variable levels of experimentalprecision [169, 170].

Synchrotron facilities and study of the Earth’s interior 1833
4.2. Phase changes and seismic discontinuities in the upper mantle
The development of in situ synchrotron x-ray techniques at mantle pressures and temperatureshas provided an opportunity for a more direct investigation of phase changes in mantle mineralsand their connection to seismic discontinuities. In situ phase boundaries by synchrotron x-raydiffraction are complementing and increasingly supplanting understanding of basic phaserelations of the deep Earth which earlier had been based almost entirely on quench studies(e.g. [19]). The pioneering synchrotron studies of silicate phase transformations are yielding aconsiderably revised picture of phase boundaries in the (Mg,Fe)2SiO4 binary system and othermantle relevant systems. Further, synchrotron studies promise to greatly improve constraintson transition pressures and temperatures, widths of phase loops, behaviour of chemicallycomplex system and, finally, understanding of transformation mechanisms and kinetics.
4.2.1. 660 km discontinuity. The 660 km discontinuity has long been associated withthe transformation in (Mg,Fe)2SiO4 from the spinel phase (ringwoodite) to a post-spinelassemblage of (Mg,Fe)SiO3 perovskite and (Mg,Fe)O ferropericlase, as found in quenchexperiments [171]. A surprising result was that the first in situ determination of the post-spinelphase boundary in Mg2SiO4, using synchrotron diffraction in a multi-anvil apparatus, yielded apressure for the transformation that corresponded to a depth of only ∼600 km at 1600˚C [172].Other studies, using similar techniques, also reported unexpectedly low transition pressures inMg2SiO4 [22] and Mg3Al2Si3O12 [173]. The effect of ∼10 mol% Fe is expected to only lowerthe transition pressures further.
These findings suggest that either the 660 km discontinuity is not associated with thepost-spinel transition or that there are unresolved experimental issues associated with thein situ synchrotron experiments. Most follow-up studies have focused on exploring highP –T synchrotron techniques, and alternative models for the discontinuity have not beenseriously considered (see [173] for an exception). The most likely explanations for thediscrepancy involve the uncertainty in pressure calibration at high temperatures or errorin temperature measurements owing to the uncertain effect of pressure on thermocoupleemf [82, 174, 175].
The first synchrotron diffraction study [176] of the post-spinel phase boundary, usingthe diamond anvil cell, instead found good agreement with the expected pressure of thediscontinuity based on seismology, consistent with another diamond cell study using Ramanspectroscopy as a diagnostic [177]. One of the main differences between the two diffractionstudies involved the P –V –T equation of state for the in situ pressure standard. The initialresult of Irifune et al [172] was based on a particular equation of state (owing to Andersonet al [178]) for the gold internal standard. However, a number of thermal equations of statefor gold have been proposed and there are discrepancies among them [178–180]. The resultsof Shim et al [176] were based instead on the equation of state of MgO [181] and Pt [182].
The post-spinel phase boundary in Mg2SiO4 was also re-investigated recently, using bothin situ diffraction and quench techniques in the multi-anvil press by Fei et al [183]. This studyemployed multiple internal pressure standards. When the Au scale of Anderson et al [178] isused as an internal calibrant, the phase transition occurs at pressures below those correspondingto the 660 km discontinuity, in agreement with Irifune et al [172]. However, the use of MgOas an internal standard [181], results in close agreement between the pressure of the transitionand that of the 660 km boundary in Earth’s mantle, which is generally consistent with thefindings from the diamond anvil cell experiments [176]. Recently, new Au pressure scaleshave been proposed [54,184] and these appear to be in better agreement with results based onthe MgO scale.

1834 T S Duffy
Table 1. Clapeyron slopes of Olivine phase transformations.
In situPhase measurement Quench
Composition transition (MPa K−1) (MPa K−1) Reference
Mg2SiO4 α −→ β 4.0 — [191](Mg,Fe)2SiO4 α −→ β 3.6 — [22](Mg,Fe)2SiO4 α −→ β — 2.5 [196]
Mg2SiO4 β −→ γ 6.9 — [197]Mg2SiO4 β −→ γ — 5.0 [196]
Mg2SiO4 γ −→ pv + fp −1.3 — [183]Mg2SiO4 γ −→ pv + fp −0.4 to −2.0 — [175]Mg2SiO4 γ −→ pv + fp — −3.0 [171]
pv = (Mg, Fe)SiO3 perovskite, fp = (Mg, Fe)O.
In situ x-ray diffraction studies also place constraints on the Clapeyron slope of the post-spinel transition in Mg2SiO4. The slope reported by Fei et al [183] was −1.3 MPa K−1,while Katsura et al [175] reported values ranging from −0.4 to −2.0 MPa K−1. Both of theseresults are lower than the previous determinations (∼−3.0 MPa K−1) based on quenchingexperiments [171] and calorimetric studies [185] (table 1). The difference between quenchand in situ experiments may be related to temperature effects on the calibration curve used todetermine pressure in the quench experiments, or because of the sluggish reactions kinetics atlow temperatures [175]. A less negative Clapeyron slope for the post-spinel transition will makethis transition less effective in impeding material transport across the phase boundary [24],and thus favours large-scale mixing of material between the upper and lower mantle. TheClapeyron slope is also used to estimate lateral thermal variations in the mantle associated withlateral variations in the depth to the discontinuity. Using the new synchrotron Clapeyron slopemeasurements, the observed ±20 km variations of the depth to the discontinuity [186, 187]correspond to lateral temperature variations of ±400 K or more [175], which is considerablygreater than the earlier estimates (∼250 K) based on the Clapeyron slope from quenchingexperiments.
Synchrotron diffraction studies using the multi-anvil apparatus have also beenused to investigate phase boundaries near 660 km depth in MgSiO3 [188, 189] andMg3Al2Si3O12 [173]. In addition, the phase relations in a pyrolite composition were examinedat conditions near the 660 km discontinuity, using a combination of synchrotron x-raydiffraction and quench studies [190]. The latter study found that the post-spinel transitionin a pyrolite composition at 1600˚C is still about 1.5 GPa (or ∼40 km) below the expectedpressure of the 660 km discontinuity even when a more recent gold pressure scale [184] isadopted. Further studies to develop more accurate pressure scales and to investigate othersystematic error sources in high P –T experiments are clearly needed to better understand thedepths, slopes and widths of mantle-relevant phase transformations.
4.2.2. 410 km discontinuity. The first synchrotron-based in situ study of the olivine(α)–wadsleyite(β) transformation was carried out on end-member Mg2SiO4 [191]. More recently,Katsura et al [22] carried out a comprehensive analysis of the olivine-to-wadsleyite phasetransformation in the binary (Mg,Fe)2SiO4 system. In this case, pressure was determined byin situ x-ray diffraction, using recent MgO pressure scales [181, 192, 193], while the phaserelations were determined by the analysis of quench products from a large-volume press. Asthis study considered compositions spanning likely Fe abundance in the upper mantle, moredirect geophysical constraints on the phase boundary could be obtained. By comparison of

Synchrotron facilities and study of the Earth’s interior 1835
Figure 11. Phase boundaries for selected transitions involving end-member mantle mineralsfrom in situ synchrotron diffraction studies. Abbreviations are: Gt—garnet, Pv—perovskite,Cor—corundum, Rw—ringwoodite, Per—periclase (MgO), Ak—akimotoite, Wa—wadsleyite,Mj—majorite. From [183].
the measured Clapeyron slope of the transitions with the pressure expected at 410 km depth, thetemperature at this depth was estimated to be 1760±45 K for a pyrolitic mantle, and this, in turn,corresponds to a mantle potential temperature of 1550–1650 K. This compares favourably withthe potential temperature of ∼1600 K estimated independently from mid-ocean ridge basalt(MORB) chemistry [194].
The slope of the α–β transition was found to be 3.6–4.0 MPa K−1 in synchrotron-basedexperiments [22, 191], whereas earlier results from quench experiments and calorimetry hadyielded lower slopes [195, 196]. Interestingly, the Clapeyron slope for the β–γ transition inMg2SiO4 from in situ diffraction (6.9 MPa K−1) [197] is also greater than that observed inquench studies. Together with results for the 660 km discontinuity discussed earlier, the in situsynchrotron-based measurements consistently yield more positive and less negative slopes forthese phase boundaries as compared with results from quench experiments and calorimetry(figure 11 and table 1). A possible explanation is that the amount of pressure decrease withheating was systematically overestimated in quench experiments [22].
Gu et al [186] mapped the global variations of the depth to the 410 km discontinuity atlong seismic periods and found variations of the order of 5 km. Based on the recent synchrotronClapeyron slope determination, this would correspond to thermal variations of ∼50 K [22].Flanagan and Shearer [187] found larger variations of ∼22–27 km with little correlation withsurface tectonics. This would correspond to the thermal variations of ∼250 K at this depth.
1836 T S Duffy
However, there is also little correlation between the tomographic maps of seismic velocityvariations and the discontinuity topography. The topography of the discontinuity could alsoreflect variations in Mg# of olivine. Higher Mg# results in faster seismic velocities. Thus,topgraphic variations at 410 km depth could reflect a combination of thermal and compositionaleffects.
The new synchrotron diffraction data also allow for a comparison of the thickness ofthe olivine–wadsleyite transition with that found for the 410 km discontinuity by short-periodseismic data. In order to make this comparison, the change in Fe across the transition owing todifferent partitioning behaviour of olivine and wadsleyite must be included [198,199]. Whilethe effect of nonlinearity on the yield of wadsleyite, as the transition proceeds, was foundto be small, latent heat increases the width of the transition to some extent [22]. The endresult is that the thickness of the olivine–wadsleyite transition is expected to be between 7and 13 km, which is considerably greater than that found by short-period seismic observations(thickness <5 km [200, 201]). To provide an explanation for this discrepancy, Katsura et al[22] proposed that the mantle near 410 km depth is depleted in olivine (∼40%) as comparedwith pyrolite (∼60% olivine) and has an Mg# of ∼0.89. This would reduce the width of thediscontinuity to ∼5 km, while also providing a better match for the magnitude of the seismicvelocitiy discontinuity [21]. Possible changes in chemical composition across the 410 kmdiscontinuity, especially enhanced incorporation of hydrogen in the wadsleyite phase, mayalso affect the width of the discontinuity and the velocity contrast [199].
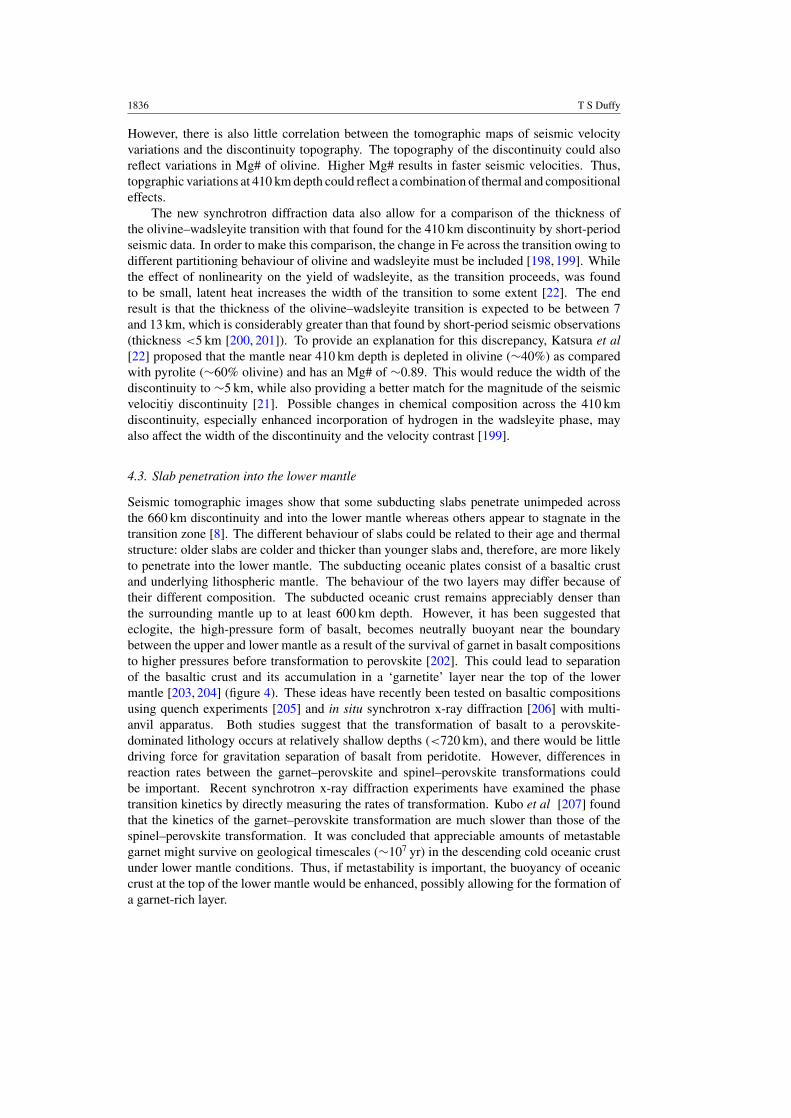
4.3. Slab penetration into the lower mantle
Seismic tomographic images show that some subducting slabs penetrate unimpeded acrossthe 660 km discontinuity and into the lower mantle whereas others appear to stagnate in thetransition zone [8]. The different behaviour of slabs could be related to their age and thermalstructure: older slabs are colder and thicker than younger slabs and, therefore, are more likelyto penetrate into the lower mantle. The subducting oceanic plates consist of a basaltic crustand underlying lithospheric mantle. The behaviour of the two layers may differ because oftheir different composition. The subducted oceanic crust remains appreciably denser thanthe surrounding mantle up to at least 600 km depth. However, it has been suggested thateclogite, the high-pressure form of basalt, becomes neutrally buoyant near the boundarybetween the upper and lower mantle as a result of the survival of garnet in basalt compositionsto higher pressures before transformation to perovskite [202]. This could lead to separationof the basaltic crust and its accumulation in a ‘garnetite’ layer near the top of the lowermantle [203, 204] (figure 4). These ideas have recently been tested on basaltic compositionsusing quench experiments [205] and in situ synchrotron x-ray diffraction [206] with multi-anvil apparatus. Both studies suggest that the transformation of basalt to a perovskite-dominated lithology occurs at relatively shallow depths (<720 km), and there would be littledriving force for gravitation separation of basalt from peridotite. However, differences inreaction rates between the garnet–perovskite and spinel–perovskite transformations couldbe important. Recent synchrotron x-ray diffraction experiments have examined the phasetransition kinetics by directly measuring the rates of transformation. Kubo et al [207] foundthat the kinetics of the garnet–perovskite transformation are much slower than those of thespinel–perovskite transformation. It was concluded that appreciable amounts of metastablegarnet might survive on geological timescales (∼107 yr) in the descending cold oceanic crustunder lower mantle conditions. Thus, if metastability is important, the buoyancy of oceaniccrust at the top of the lower mantle would be enhanced, possibly allowing for the formation ofa garnet-rich layer.

Synchrotron facilities and study of the Earth’s interior 1837
4.4. Mantle rheology
Rheological properties of mantle mineral are necessary for understanding the mechanism ofsolid-state convection in the Earth, and for exploring such phenomena as the origin of deepfocus earthquakes. However, quantitative studies of rheological properties of materials athigh pressure have generally been limited to 4 GPa or less, corresponding to depths of lessthan 120 km. Thus, only the conditions at the top of the upper mantle have been the subjectof direct examination. Consequently, there is little direct understanding of how deformationbehaviour may change with pressure and temperature. In the last few years, however, newsynchrotron-based techniques have allowed for quantitative studies of high-pressure strengthand mantle rheology at in situ conditions for the first time.
The diamond anvil cell can be used as a deformation apparatus. In early studies, the yieldstrength of materials was inferred from measurements of pressure gradients across the sample(e.g. [208, 209]). The development of methods for measuring and interpreting lattice strainanisotropy, using x-ray diffraction in a radial geometry with x-ray transparent gaskets [42,210],has led to significant advances in the characterization of low-temperature strength, elasticanisotropy and texture development in materials of geological interest. P –V measurementsperformed at a ‘magic angle’, with respect to the loading axis, allow for determination ofthe quasi-hydrostatic equation of state from data under non-hydrostatic conditions [104,211].Yield strengths have been determined to ∼70 GPa for a number of silicates, oxides and metals(figure 12) [104, 105, 211]. As a result of work hardening at these large strains, the ratio ofdifferential stress or yield strength, Y , to shear modulus, G, increases with pressure, contraryto predictions of constitutive strength models that assume linear scaling [212]. For silicatesand oxides, systematic trends in strength are apparent. At lower pressures, the yield strengthof four-coordinated upper mantle minerals, such as olivine and ringwoodite, is in the rangeof 4–6% of the shear modulus. The strength of six-coordinated silicates (CaSiO3, stishovite,MgSiO3) is lower and amounts to ∼3–4% of the shear modulus at lower mantle pressures.Measurements up to 300 GPa show that differential stresses up to 10% of the pressure can bedeveloped in strong metals under these ultra-high P conditions [59]. Elastic constants canalso be recovered from radial x-ray diffraction experiments [105,116] (figure 13), although insome cases these may be affected by plastic anisotropy [213].
In the multi-anvil press, although the loading is hydrostatic, a deviatoric stress field inthe sample is created by the anisotropy and strength of the sample assembly. One classof deformation experiments that has been developed and refined in recent years involvescompressing a sample to generate local stress heterogeneity that manifests itself as a broadeningof diffraction peaks [27]. By heating the sample and monitoring the resultant stress relaxationwith time-resolved x-ray diffraction, empirical flow laws can be developed [214]. Weidner et al[26] have used this method to examine the strength of different mantle minerals undersubduction zone conditions and have shown that the temperature dependence of strengthis quite variable among the major subduction zone phases. In particular, while perovskiteis weaker than ringwoodite at room temperatures (in agreement with diamond cell data), it isstronger at high temperatures [215], and this may have a bearing on earthquake processes insubduction zones.
A new device for rheology studies is a modified Drickamer-type apparatus, in which oneanvil has the capability to rotate [216]. The sample is then deformed in simple shear between thetwo pistons yielding the possibility of achieving very large strains. Another new type of multi-anvil deformation device is called the D-DIA [217]. In the D-DIA, two of the six anvils are ableto move independently, allowing for the application of a differential stress, while maintaining afixed confining pressure. Differential (elastic) lattice strain is measured by distortion of Debye
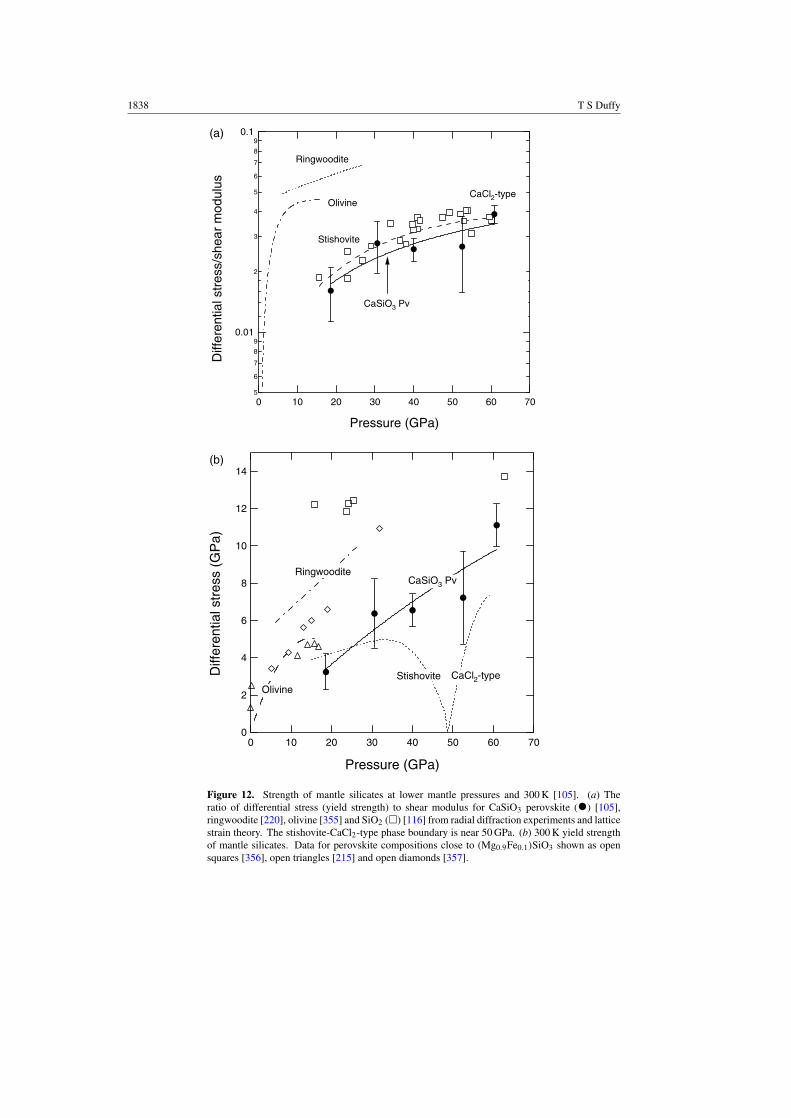
1838 T S Duffy
5
6
7
8
90.01
2
3
4
5
6
7
8
90.1
(b)
(a)
Diff
eren
tial s
tres
s/sh
ear
mod
ulus
706050403020100
Pressure (GPa)
Ringwoodite
Olivine
Stishovite
CaSiO3 Pv
CaCl2-type
14
12
10
8
6
4
2
0
Diff
eren
tial s
tres
s (G
Pa)
706050403020100
Pressure (GPa)
Ringwoodite
OlivineStishovite
CaSiO3 Pv
CaCl2-type
Figure 12. Strength of mantle silicates at lower mantle pressures and 300 K [105]. (a) Theratio of differential stress (yield strength) to shear modulus for CaSiO3 perovskite (•) [105],ringwoodite [220], olivine [355] and SiO2 (�) [116] from radial diffraction experiments and latticestrain theory. The stishovite-CaCl2-type phase boundary is near 50 GPa. (b) 300 K yield strengthof mantle silicates. Data for perovskite compositions close to (Mg0.9Fe0.1)SiO3 shown as opensquares [356], open triangles [215] and open diamonds [357].

Synchrotron facilities and study of the Earth’s interior 1839
800
600
400
200
0
Ela
stic
mod
uli (
GP
a)
706050403020100
Pressure (GPa)
C11
C12
C44
Calcium oxide
Radial X-ray diffraction Brillouin scattering
KS
G
Figure 13. Elastic constants of CaO at high pressures from Brillouin scattering and radial x-raydiffraction. X-ray diffraction and Brillouin scattering results are in excellent agreement over thecommon pressure range (at 24 GPa) and the x-ray results even capture the softening of C44 withpressure. The radial diffraction results agree with extrapolation of Brillouin results at 40 GPa butdiverge at higher pressures for C11 and C12.
rings, and total axial strain (which may include a significant plastic component) is monitored byradiography. This device promises to provide a more complete characterization of rheologicalbehaviour as lattice strain can be examined as a function of pressure, temperature, strain rateand total plastic strain. As examples, ringwoodite and MgO have been examined at highpressures with this device documenting pressure, temperature and strain dependence of thestrength [218, 219]. The D-DIA results show that earlier studies [35, 220] of low-temperaturestrength of ringwoodite can be rationalized by accounting for differences in work hardeningthat result from different strain levels in the D-DIA, diamond cell deformation and multi-anvilstress relaxation experiments.
4.5. Lower mantle minerals
Experimental studies have shown that the mineral assemblage adopted by a peridotite lithologyunder lower mantle conditions consists of three main minerals: (Mg,Fe)SiO3–Al2O3 perovskite(Mg-pv), CaSiO3 perovskite (Ca-pv) and (Mg,Fe)O ferropericlase (fp) [221–224]. In thelower mantle, basaltic compositions consist of two perovskites, a stishovite and an additionalaluminous phase [205, 225]. In this section, synchrotron-based experimental studies of majorlower mantle minerals of basalt and peridotite compositions are reviewed.
4.5.1. Magnesium silicate perovskite. As the expected dominant phase of the lower mantle,the properties of magnesium silicate perovskite, (Mg,Fe)SiO3, have attracted much attention.

1840 T S Duffy
Initial synchrotron diffraction experiments using energy dispersive techniques in both thediamond anvil cell and large-volume press focused on the thermal equation of state [226–228].Subsequently, higher resolution diffraction studies extended equation of state and structuraldeterminations to 94 GPa [229,230]. The stability of perovskite was demonstrated at 106 GPa(2300 km depth conditions) by in situ measurements [231,232], which also reported evidencefor a possible modification of the perovskite structure [231]. Earlier reports [102,233,234] ofbreakdown to oxides or transformation to a cubic perovskite at ∼60–80 GPa were not confirmedby later studies.
Mineralogical models for the Earth’s mantle typically contain ∼4–6 mol% Al2O3.The effects of aluminium incorporation on the structure and physical properties of perovskitehave been a subject of much interest. P –V EOS measurements suggested that the presence of5 mol% Al2O3 lowers the bulk modulus of MgSiO3 perovskite by ∼10% [235], a surprisingresult that is contradictory to expectations from elasticity systematics. Many additional P –V
EOS studies of Al-bearing perovskites have subsequently been reported, but the results arehighly variable with both increase and decrease as well as no changes in compressibilityreported [236–241]. The results seem to depend in a complicated manner on synthesisconditions as well as the substitution mechanism and its evolution. The difficulty of accuratelyconstraining the bulk modulus from volume compression data owing to parameter tradeoff,limited compression range, deviatoric stress, etc may also play a role here. Interestingly, recenthigh-pressure polycrystalline Brillouin scattering measurements, which place more directconstraints on the bulk modulus, found no difference in compressibility between Al-containingand Al-free perovskite samples, but rather found a 6% reduction in the shear modulus of theAl-containing sample [242]. Variations in aluminium content are thus a possible explanationfor lateral heterogeneities in the lower mantle that exhibit large relative variation in shearvelocity compared with compressional velocities.
X-ray emission spectra measurements indicate that magnesium silicate perovskiteundergoes an electronic transformation from a high-spin to a low-spin state, at lower mantlepressures [155, 160]. Data for Mg0.9Fe0.1SiO3 showed the presence of electronic transitionscorresponding to partial and full spin pairing at 70 GPa and 120 GPa, respectively [155].The former corresponds to a depth range (∼1700 km), where a similar transformation isobserved in (Mg,Fe)O (see later) and where seismic studies begin to suggest the existenceof possible chemical heterogeneities [29]. The second transition is close to the boundaryof post-perovskite phase transition (also discussed later). Another study using the samemethod on Al- and Fe-containing samples found evidence of a continuous transition fromhigh spin to low spin over a broad pressure range, with a mixed spin state being observedat ∼100 GPa [160]. Such spin pairing transitions are potentially significant for interpretinggeophysical data in the deep lower mantle as resulting changes in physical properties (e.g.thermal expansivity, thermal conductivity) could act to decrease mixing rates and thereby helpto maintain chemical heterogeneities, but this depends in detail on the P –T evolution of thetransition.
The geophysical and geochemical properties of the Earth’s deep interior depend onthe partitioning of iron between the major Fe-bearing lower mantle phases: (Mg,Fe)SiO3
perovskite and (Mg,Fe)O ferropericlase. Partition coefficients can be determined fromsynchrotron x-ray diffraction studies of volumes of coexisting phases [243, 244] orby transmission electron microscopy (TEM) analysis of samples recovered at ambientconditions [245, 246]. At pressures at the top of the lower mantle, iron is preferentiallypartitioned into ferropericlase, but there are conflicting reports on the trend with pressure asdiffraction-based measurements conclude that Fe2+ is increasingly allocated into perovskitewith depth [243,244] whereas TEM-based studies find no significant change in the partitioning

Synchrotron facilities and study of the Earth’s interior 1841
behaviour [245,246]. A number of factors including pressure, temperature, aluminium content,ferrous/ferric ratios and spin states may affect the partitioning behaviour. Constraining partitioncoefficients in complex assemblages under such extreme conditions remains a foremostchallenge in high-pressure mineral physics.
4.5.2. Calcium silicate perovskite. A CaSiO3-rich perovskite phase is expected to exist underlower mantle conditions and it was long thought that this phase possesses cubic symmetry[247–249]. A number of energy dispersive diffraction experiments have been carried outon the material since 1989. These studies are mainly focused on the room temperatureand thermal equations of state and are a good example of the continual improvementsin data quality that have been realized through advances in experimental techniques andsynchrotron capabilities over the last fifteen years [101, 105, 247–251]. Recently, an angledispersive x-ray diffraction study [107] showed for the first time that the symmetry of CaSiO3
perovskite at room temperature is not cubic, but tetragonal or orthorhombic, in agreementwith theoretical predictions [252–254]. This was confirmed in subsequent diffraction studiesbut these also showed that the cubic form is stable under high temperature–high-pressureconditions [224, 246, 255, 256]. The transition temperature was found to increase with thealuminium content of the samples, and it is plausible that a transition from cubic to a lowersymmetry form may occur under some lower mantle conditions. Such a transition is likely tobe accompanied by significant anomalies in elastic properties [254] and may, therefore, haverelevance for the interpretation of seismic profiles.
4.5.3. (Mg,Fe)O. The behaviour of the (Mg,Fe)O system illustrates how even simple mineralsystems can show complex behaviour under extreme conditions. The endmember, MgO,remains stable as the rocksalt (B1) structure at at least 227 GPa [43] and its equation of state hasbeen sufficiently well characterized using a variety of experimental [181,257] and theoreticalmethods [192, 193] to make it perhaps the best documented in situ pressure standard [54].However, at room temperature, Fe1−xO undergoes a rhombohedral distortion above ∼17 GPadepending on the level of deviatoric stress [258] and transforms to the NiAs (B8) structure at∼75 GPa and high temperatures [259,260]. While the (Mg,Fe)O series exhibits complete solidsolution at ambient pressure, the different behaviours of the end-members suggest complexitiescould appear in the phase diagram at high pressures and temperatures. The rhombohedraldistortion has also been observed in Fe-rich solid solutions (Mg# = Mg/(Mg + Fe) < 0.2)[261, 262], but the transformation to the B8 structure has not been observed at megabarpressures in any composition except for the Fe end-member [261]. Evidence from x-raydiffraction experiments suggests that intermediate compositions (Mg#50–80), at least partially,dissociate at conditions near 83–86 GPa and 1000 K to an Mg-enriched composition and analmost pure wustite (FeO) composition [263, 264]. A dissociation transition in the Earth’smantle would produce phases of considerably different density and may well affect thedynamics and chemistry of the lower mantle [2, 29]. However, other diffraction experimentson more Fe-rich compositions (Mg#39 and Mg#25) at 86–102 GPa and 2500 K did not find anyevidence of dissociation or transformation to the B8 structure [265]. Experiments on peridotitecompositions up to 124 GPa have also not reported evidence of dissociation [246].
A high-spin to low-spin transition in Fe has been reported using XES in an Mg#83composition at 50–60 GPa, but this was not accompanied by any abrupt change in the structureor volume [159]. Such a transition could change Fe partitioning and partial melting behaviourin the lower mantle. In contrast, XES measurements on Fe0.92O showed no transition to alow-spin state for pressures as high as 143 GPa [157]. Further studies are needed to explore
1842 T S Duffy
possible dissociation and spin transitions in the (Mg,Fe)O system and the relationship, if any,between them.
4.5.4. SiO2. The high-pressure behaviour of silica has been extensively studied because ofits technological importance and also because it serves as a model system for understandingthe octahedrally coordinated silicates of deep planetary interiors. Stishovite, the rutile-structured polymorph of SiO2, undergoes a displacive transformation to an orthorhombicCaCl2-type structure near 50 GPa [266, 267]. The transformation mechanism as well as theelasticity and strength of SiO2 across this transition have been examined using synchrotrontechniques [114, 116]. Theoretical studies indicate that a large number of structurally relatedphases of SiO2 are possible at high pressures and that many of these phases possess similartotal energies [268]. Detailed studies of polymorphism in a range of AX2-type compounds,including oxides such as GeO2 and SnO2, provide further insight into the probable sequenceof structural changes in silica at high pressures and temperatures [269–272].
There are conflicting reports, at pressures above 75 GPa, about the stability of SiO2
phases from x-ray diffraction experiments using heated diamond anvil cells. Most studiesreport the stability of the CaCl2-type form at 120 GPa [267, 273–276], although others havereported the formation of a polymorph related to the α-PbO2-type structure at pressures of∼80 GPa [277, 278]. More recently, the transformation from the CaCl2-type structure to theα-PbO2-type structure was reported at 121 GPa and 2400 K, and this new phase was foundto be stable at 151 GPa and 2500 K [276]. To further complicate the picture, there have beenseveral reports of formation of, presumably, metastable high-pressure polymorphs at relativelylow temperatures using externally heated diamond cells or from different starting materials,such as tridymite [272,279,280]. This is not surprising in view of the concept that there are anumber of energetically similar phases that can be generated from hexagonally close packedarrays of oxygen with Si cations occupying one-half of the octahedral sites. In such a case,the observed phase in an experiment could depend on starting material, deformation history,temperature, deviatoric stress and heating duration. Identification of the thermodynamicallystable phase becomes experimentally challenging and requires a thorough understanding ofthe response of SiO2 samples to the above factors. Indeed, a recent study showed that theCaCl2-type phase is observed up to 131 GPa when stishovite starting material is used [275],while α-PbO2 form can be synthesized at room temperatures from cristobalite starting materialat pressures as low as 45 GPa [278]. However, laser heating of α-PbO2-type SiO2 formed fromcristobalite leads to the formation of the CaCl2-type phase at 79–101 GPa, indicating that theCaCl2-type phase is the thermodynamically stable phase under these conditions [275].
4.6. Post-perovskite phase and the core–mantle boundary
The recent discovery by Murakami et al [281] of a transformation from MgSiO3 perovskiteto a post-perovskite (CaIrO3-type) phase at ∼125 GPa is a major finding that could forcedrastic reordering of our picture of the structure and dynamics of the core–mantle boundaryregion. The post-perovskite transformation in MgSiO3 was rapidly confirmed or independentlydiscovered by other experiments and theoretical calculations which also provided additionalinsight into some physical and thermodynamic properties of the new phase [282–285]. Theorthorhombic CaIrO3-type phase consists of edge-sharing chains of SiO6 octahedra linked byapical oxygens to form sheets along the (010) plane (figure 14). The octahedral sheets areseparated into eight-fold coordinated magnesium layers. The structure is anisotropic beingmore compressible in the b direction. The density increase associated with the transition is0.9–1.2% [281,286]. Synchrotron diffraction experiments have shown that the presence of iron
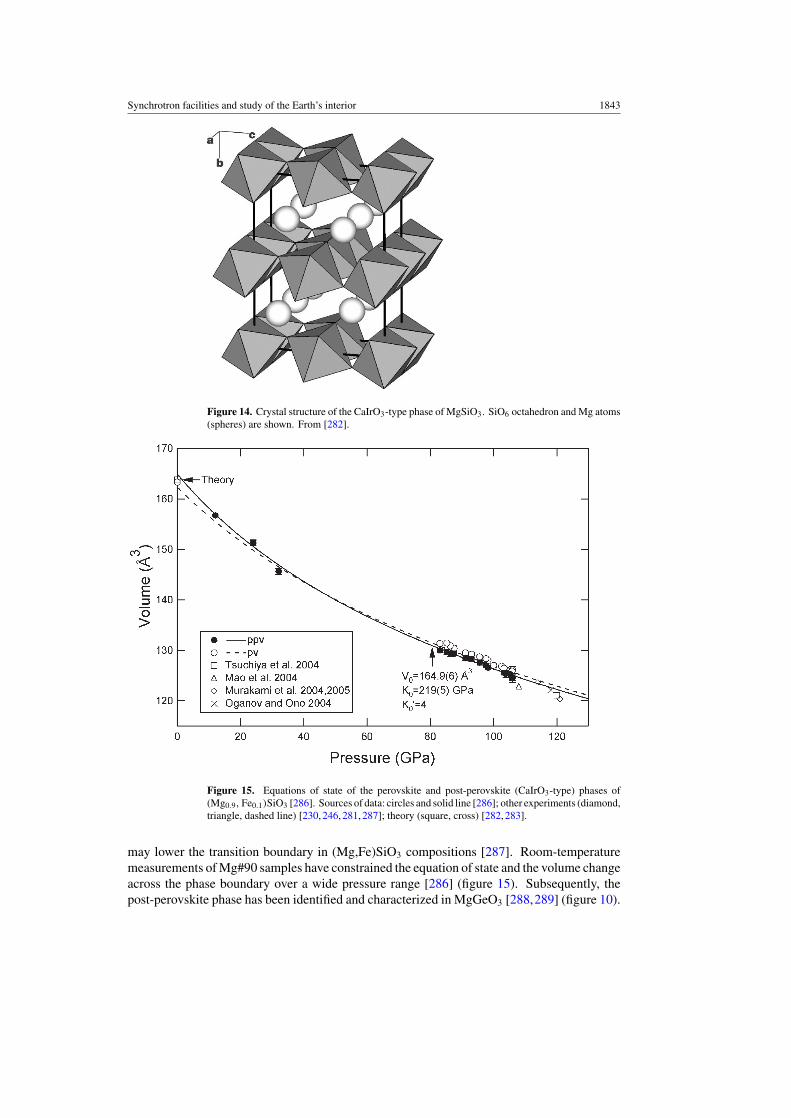
Synchrotron facilities and study of the Earth’s interior 1843
Figure 14. Crystal structure of the CaIrO3-type phase of MgSiO3. SiO6 octahedron and Mg atoms(spheres) are shown. From [282].
Figure 15. Equations of state of the perovskite and post-perovskite (CaIrO3-type) phases of(Mg0.9, Fe0.1)SiO3 [286]. Sources of data: circles and solid line [286]; other experiments (diamond,triangle, dashed line) [230, 246, 281, 287]; theory (square, cross) [282, 283].
may lower the transition boundary in (Mg,Fe)SiO3 compositions [287]. Room-temperaturemeasurements of Mg#90 samples have constrained the equation of state and the volume changeacross the phase boundary over a wide pressure range [286] (figure 15). Subsequently, thepost-perovskite phase has been identified and characterized in MgGeO3 [288,289] (figure 10).

1844 T S Duffy
The post-perovskite phase transformation also occurs in perovskites formed in naturalperidotites and basaltic compositions [224, 246]. In peridotite, the transformation fromperovskite to post-perovskite was observed at 113 GPa and 2500 K [246], consistent withthe transition pressure observed in an (Mg0.9, Fe0.1)SiO3 composition [286]. These conditionscorrespond to about 400 km above the core–mantle boundary, and thus lie ∼100–200 kmabove the expected depth of the D′′ seismic discontinuity. Chemical analysis of recoveredsamples shows that Fe–Mg partition coefficient between coexisting ferropericlase and thepost-perovskite phase is large, indicating that iron is strongly depleted in the post-perovskitephase compared with the perovskite phase at lower pressures [246]. On the other hand,Mao et al [287] suggested that the post-perovskite phase is enriched in iron, on the basis ofan analysis of x-ray diffraction data. A strong change in Fe–Mg partitioning in the deep lowermantle may have important geophysical implications as this may affect electrical conductivity,viscosity, melting and heat transport [246]. In basaltic compositions, the phase assemblageidentified at 143 GPa and ∼3000 K consisted of an (Mg,Fe)SiO3 post-perovskite phase, CaSiO3
perovskite, α-PbO2-type SiO2 and a CaTi2O4-type aluminous phase [224].
5. Selected applications of synchrotron research to the core
Iron-rich cores exist in all the terrestrial planets and in many large satellites. The pressuresat which cores occur in our solar system span about two orders of magnitude ranging from∼3 GPa at the top of the core for bodies such as Jupiter’s satellite Europa to 363 GPa atthe centre of Earth’s core. The relative range of temperature encountered in cores spans alikely range of less than a factor of 10. The temperatures of relevance for core physics andchemistry can be, roughly, bounded at one end by the low-pressure Fe–FeS eutectic (∼1250 Kat 1 bar), and at the high end by the melting temperature of pure iron near the centre of theEarth (∼6000 K).
The nature of the Earth’s core bears on a host of geophysical questions including planetformation and evolution, bulk chemistry of the Earth, magnetic field generation and dynamics,core–mantle interactions and planetary temperature structure. Heat from the core contributesto the driving force for mantle convection. Interest in planetary cores has been stimulatedby remote observations and spacecraft exploration of planets that have provided new insightsinto the state of cores throughout the solar system [290]. For example, Ganymede, the largestsatellite in the solar system, was discovered to have an internally generated magnetic fieldby the Galileo spacecraft [291]. While the P –T conditions of the Earth’s solid inner core(330–363 GPa ∼4000–6000 K) still exceed those achievable by direct static experimentalinvestigation, synchrotron studies of the crystal structure, melt properties, equation of state,thermodynamic properties and electronic and magnetic properties of iron and iron alloys overa range of P –T conditions play an integral role in understanding and interpreting geophysicaldata for planetary cores across the solar system.
5.1. Crystal structure of iron
At low pressures and temperatures, iron has four solid phases: α- and δ-Fe, body centredcubic (bcc) phases that are stable at low P and T and at high T just below the meltingpoint, respectively; γ -Fe, a face centred cubic phase (fcc) stable at high temperatures andε-Fe, a hexagonal close packed (hcp) phase stable at high pressures and low temperatures.At higher pressures, there have been some reports from diamond anvil cell experiments ofthe existence of additional phases, including a double hexagonal close packed phase (dhcp)[292–294], and an orthorhombic phase [295, 296]. However, other high-pressure studies

Synchrotron facilities and study of the Earth’s interior 1845
have not observed these phases [93, 106, 297–299]. It is plausible that these polymorphs aremetastable and related to temperature or stress gradients in the diamond cell [106, 296, 298].This conclusion is supported by multi-anvil experiments, under more uniform temperatureconditions, that reported no evidence for these phases at conditions now reaching up to 44 GPaand 2100 K [93,297,299]. Such conflicting experimental results highlight the complexity anddifficulty of high-pressure experiments on even simple systems at extreme conditions.
The possible existence of a high-pressure bcc phase of iron has been considered for manyyears (e.g. [300]) but no definitive proof has been obtained as yet. Synchrotron x-ray diffractionexperiments on Fe have now reached conditions as high as 161 GPa and 3000 K [298]. Only theε-phase was observed at pressures higher than 60 GPa. Recent ab initio molecular dynamicsfree energy calculations have suggested that a bcc phase could be stabilized at core conditionsby the presence of silicon or sulfur impurities [301]. Synchrotron diffraction experiments [302]on Fe–Si alloys have indeed shown that the presence of Si in Fe greatly extends the stabilityof the bcc phase and it was proposed that the inner core could contain a Si-rich bcc phase anda Si-poor hcp phase.
5.2. Elasticity of iron
Understanding the elastic properties of iron and iron alloys is necessary to resolve structuraland compositional issues related to the Earth’s core. Some of the central questions are: (1) howdo the inner and outer core differ in bulk composition, and what is the corresponding role ofchemical versus thermal convection in driving fluid flow in the outer core? (2) Does the lowanomalous shear velocity (and corresponding high Poisson’s ratio) of the inner core representthe effects of partial melt, anelastic behaviour or the anharmonic elastic response of the coreforming material?
In the past, experimental constraints on sound velocities of Fe and Fe alloys have largelybeen obtained from shock compression [11, 300, 303] as static methods were confined tovery low pressures. The advent of new synchrotron-based techniques has now expanded thecapabilities of static measurements and broadened our understanding of elastic properties atvery high pressures. Using NRIXS techniques, the elastic, thermodynamic and vibrationalproperties of hcp iron were measured at 153 GPa at room temperature [144, 145]. Thesemeasurements have now been extended to simultaneous high pressures and temperatures [121].Compressional velocities, VP, determined by IXS have also been reported to more than 100 GPa[134, 140]. Figure 16 shows a compilation of the recent results. Aggregate compressionalvelocities from NRIXS, IXS and radial x-ray diffraction are in general agreement, and definea linear VP − ρ trend that lies slightly above shock compression data. 300 K aggregatecompressional velocities in pure Fe are consistent with inner core values when extrapolatedlinearly in density (Birch’s law). The experimental data and their extrapolation show somesignificant differences with theoretical calculations. Shear velocities are derived from IXS orNRIXS experiments by combining compressional or Debye velocity and equation of state dataand, therefore, are more uncertain. Also, extrapolations using Birch’s law are of uncertainreliability for shear properties. The shear velocity data exhibit more scatter and there is morevariance between the trends from different datasets. Nevertheless, extrapolated 300 K shearvelocities generally lie well above the inner core values, suggesting the potential importance ofphenomena such as chemical impurities, intrinsic (volume independent) anharmonic thermaleffects, anelasticity or even partial melting in determining the very low shear velocities in theinner core. It is worth noting that shear velocities inferred from shock data [300,304] are moreconsistent with inner core values, suggesting a possible prominent role for anharmonic thermaleffects.
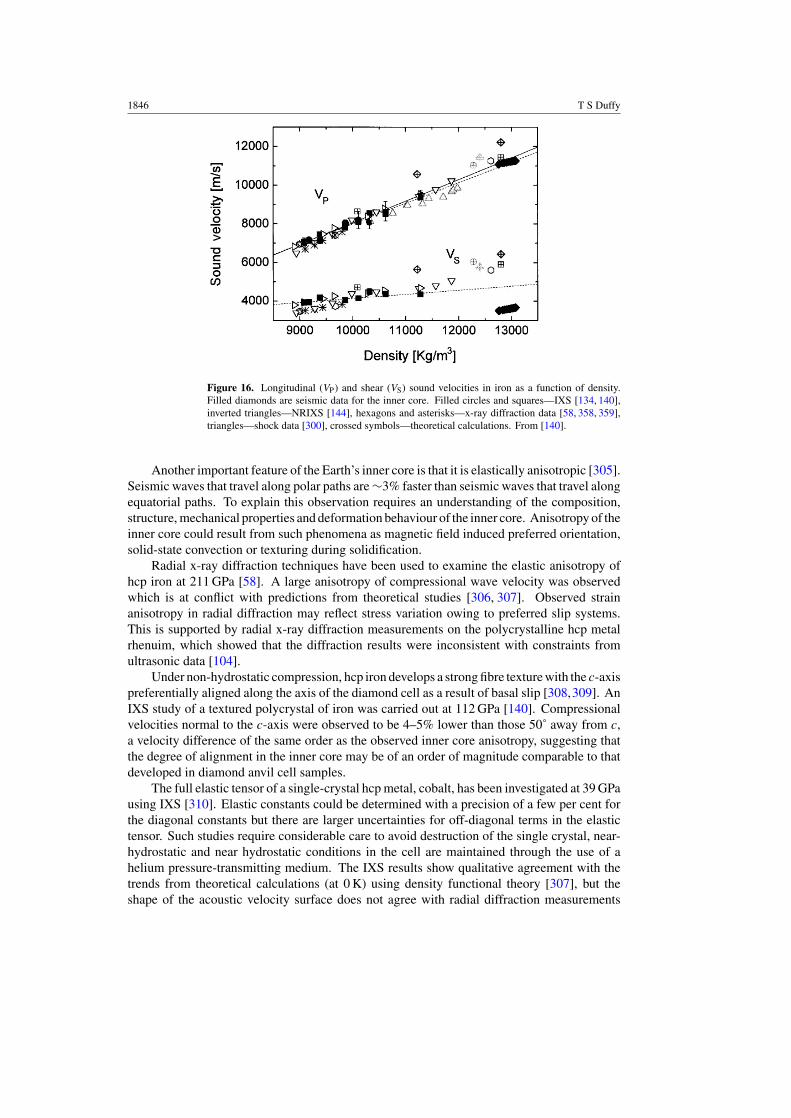
1846 T S Duffy
v
Figure 16. Longitudinal (VP) and shear (VS) sound velocities in iron as a function of density.Filled diamonds are seismic data for the inner core. Filled circles and squares—IXS [134, 140],inverted triangles—NRIXS [144], hexagons and asterisks—x-ray diffraction data [58, 358, 359],triangles—shock data [300], crossed symbols—theoretical calculations. From [140].
Another important feature of the Earth’s inner core is that it is elastically anisotropic [305].Seismic waves that travel along polar paths are ∼3% faster than seismic waves that travel alongequatorial paths. To explain this observation requires an understanding of the composition,structure, mechanical properties and deformation behaviour of the inner core. Anisotropy of theinner core could result from such phenomena as magnetic field induced preferred orientation,solid-state convection or texturing during solidification.
Radial x-ray diffraction techniques have been used to examine the elastic anisotropy ofhcp iron at 211 GPa [58]. A large anisotropy of compressional wave velocity was observedwhich is at conflict with predictions from theoretical studies [306, 307]. Observed strainanisotropy in radial diffraction may reflect stress variation owing to preferred slip systems.This is supported by radial x-ray diffraction measurements on the polycrystalline hcp metalrhenuim, which showed that the diffraction results were inconsistent with constraints fromultrasonic data [104].
Under non-hydrostatic compression, hcp iron develops a strong fibre texture with the c-axispreferentially aligned along the axis of the diamond cell as a result of basal slip [308,309]. AnIXS study of a textured polycrystal of iron was carried out at 112 GPa [140]. Compressionalvelocities normal to the c-axis were observed to be 4–5% lower than those 50˚ away from c,a velocity difference of the same order as the observed inner core anisotropy, suggesting thatthe degree of alignment in the inner core may be of an order of magnitude comparable to thatdeveloped in diamond anvil cell samples.
The full elastic tensor of a single-crystal hcp metal, cobalt, has been investigated at 39 GPausing IXS [310]. Elastic constants could be determined with a precision of a few per cent forthe diagonal constants but there are larger uncertainties for off-diagonal terms in the elastictensor. Such studies require considerable care to avoid destruction of the single crystal, near-hydrostatic and near hydrostatic conditions in the cell are maintained through the use of ahelium pressure-transmitting medium. The IXS results show qualitative agreement with thetrends from theoretical calculations (at 0 K) using density functional theory [307], but theshape of the acoustic velocity surface does not agree with radial diffraction measurements

Synchrotron facilities and study of the Earth’s interior 1847
on hcp polycrystals [58]. The study of elastic constants by IXS techniques offers greaterpromise as these measurements can be applied to opaque samples over a wide pressure range.Further, single-crystal studies can help to understand the effect of texturing and anisotropy ongeophysical materials.
5.3. Fe–FeS system
Sulfur is a strong candidate light element in planetary cores owing to its solubility in iron,the low eutectic temperatures of the Fe–FeS system and the abundance of iron sulfides inmeteorites [311]. The amount of sulfur that could be accreted into a growing Earth may,ultimately, be limited by its high volatility, though this may be a less significant issue forsmaller planets and satellites that did not suffer as much accretional heating. Iron sulfide, FeS,exhibits a number of solid phases at high pressures, including a hexagonal NiAs-type phase(phase V) at high temperatures and a phase with a NiAs-type superstructure (phase IV) atintermediate temperatures [312]. Extension of measurements to higher P –T conditions usingthe laser-heated diamond cell showed that phase V is the stable phase at high temperature andMartian core pressures [103]. Along with extensive polymorphism, FeS possesses a number ofinteresting complexities associated with its electronic properties. FeS IV exhibits anomalouscompression with an abrupt c-axis shortening around 5–9 GPa, which was attributed to anelectronic transition of Fe from the high-spin state to a low-spin state [312–314]. Phase V alsoundergoes an isostructural phase transition at similar pressures and higher temperatures [315].At room temperature, FeS transforms from the troilite structure to an MnP-related structure at3.5 GPa and then to a new structure (Phase III) above 6.7 GPa [314,316]. This structure, whichis a monoclinic and distorted NiAs-type phase characterized by short Fe–Fe distances, wasunknown for a long time but was finally solved using angle-dispersive synchrotron powderdiffraction [317]. Synchrotron XES measurements showed that this transformation is alsoaccompanied by a high-spin to low-spin transition in Fe [156]. 57Fe nuclear resonant inelasticscattering was also used to measure the DOSs and derive thermodynamic properties forFeS [318]. Recently, a variety of other probes, including conventional Mossbauer spectroscopyand electrical resistivity [319–321], have also been applied to iron sulfide at pressure. FeSthus provides a striking example of how new or improved synchrotron-based techniques inconjunction with conventional measurements enables us to construct a dramatically improvedand integrated picture of crystal structures, electronic properties and physical properties atconditions directly relevant to planetary cores.
While the Fe–S system forms a simple eutectic up to 14 GPa, a number of intermediatecompounds (Fe3S2, Fe2S and Fe3S) have been found at higher pressures and some of theirequations of state, structures and elastic properties have been investigated by synchrotrontechniques [322,323]. Fe3S was studied using NRIXS and SMS at 57 GPa at room temperature.A magnetic transition was observed at 21 GPa, which affects the sound velocities [151]. Fe3C,another candidate core material, also undergoes a magnetic transition near 25 GPa, as foundin an XES study [161].
5.4. Melting of iron
The melting curve of iron remains controversial. Early studies were based on either visualobservations of melt in the laser-heated diamond cell or on measurements of temperaturesresulting from shock compression. However, these methods produced conflicting meltingcurves that differed by as much as 1200 K at 100 GPa [324, 325] (figure 17). Since then,there have been numerous additional studies using a variety of experimental and theoretical
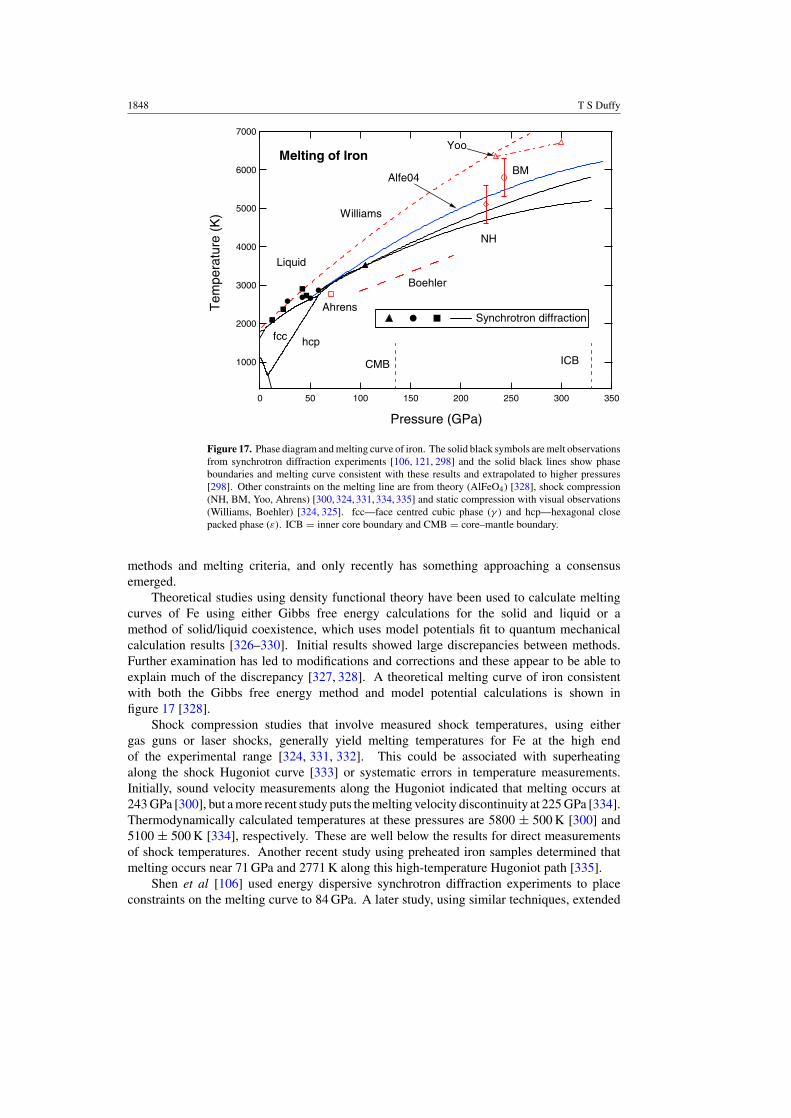
1848 T S Duffy
7000
6000
5000
4000
3000
2000
1000
Tem
pera
ture
(K
)
350300250200150100500
Pressure (GPa)
Williams
Boehler
NH
BM
Yoo
Alfe04
Ahrens Synchrotron diffraction
CMB ICB
Melting of Iron
Liquid
fcc hcp
Figure 17. Phase diagram and melting curve of iron. The solid black symbols are melt observationsfrom synchrotron diffraction experiments [106, 121, 298] and the solid black lines show phaseboundaries and melting curve consistent with these results and extrapolated to higher pressures[298]. Other constraints on the melting line are from theory (AlFeO4) [328], shock compression(NH, BM, Yoo, Ahrens) [300, 324, 331, 334, 335] and static compression with visual observations(Williams, Boehler) [324, 325]. fcc—face centred cubic phase (γ ) and hcp—hexagonal closepacked phase (ε). ICB = inner core boundary and CMB = core–mantle boundary.
methods and melting criteria, and only recently has something approaching a consensusemerged.
Theoretical studies using density functional theory have been used to calculate meltingcurves of Fe using either Gibbs free energy calculations for the solid and liquid or amethod of solid/liquid coexistence, which uses model potentials fit to quantum mechanicalcalculation results [326–330]. Initial results showed large discrepancies between methods.Further examination has led to modifications and corrections and these appear to be able toexplain much of the discrepancy [327, 328]. A theoretical melting curve of iron consistentwith both the Gibbs free energy method and model potential calculations is shown infigure 17 [328].
Shock compression studies that involve measured shock temperatures, using eithergas guns or laser shocks, generally yield melting temperatures for Fe at the high endof the experimental range [324, 331, 332]. This could be associated with superheatingalong the shock Hugoniot curve [333] or systematic errors in temperature measurements.Initially, sound velocity measurements along the Hugoniot indicated that melting occurs at243 GPa [300], but a more recent study puts the melting velocity discontinuity at 225 GPa [334].Thermodynamically calculated temperatures at these pressures are 5800 ± 500 K [300] and5100 ± 500 K [334], respectively. These are well below the results for direct measurementsof shock temperatures. Another recent study using preheated iron samples determined thatmelting occurs near 71 GPa and 2771 K along this high-temperature Hugoniot path [335].
Shen et al [106] used energy dispersive synchrotron diffraction experiments to placeconstraints on the melting curve to 84 GPa. A later study, using similar techniques, extended
Synchrotron facilities and study of the Earth’s interior 1849
melting determination at 105 GPa and 3510 K [298]. However, measurements of melting usinga point detector can be biased owing to the limited azimuthal coverage of the diffracted cone.Recently, angle dispersive measurements using diffuse scattering from the melt as a positivemelting criterion have been reported [121] and these are in agreement with the previous energy-dispersive data.
Figure 17 summarizes constraints on the melting curve of iron. Phase boundariesto 100 GPa are based on synchrotron x-ray diffraction results [106, 121, 298]. Theseare consistent with the latest improved theoretical calculations [328] and calculated shocktemperatures at the melting pressured at 225 GPa, obtained from recent Hugoniot soundvelocity measurements [334]. This convergence of recent results from static experiment,shock compression and theory suggests that a consensus on the melting curve of Fe may bedeveloping. However, the melting curve of Boehler, based on visual observations, lies atsignificantly lower temperatures and the discrepancy amounts to about 600 K (or ∼20%) at105 GPa [325].
Extrapolation of the synchrotron-based melting curve yields melting temperatures for Feat the inner core boundary of 5200–5900 K, whereas theoretical calculations yield a value near6300 K [328]. Extrapolating the range from synchrotron experiments along a plausible coregeotherm [13] yields estimated temperatures of 3600–4400 K at the core–mantle boundary.The temperature at the inner core boundary, however, may differ from that of pure Fe becauseof freezing point depression owing to the presence of a light element. Thus, the meltingbehaviour must also be constrained in more complex systems [70]. While the exact change inthe melting point will depend on the identity of the light element(s), existing estimates suggestthat the effect will be ∼500–1000 K at core pressures [70].
5.5. Properties of iron and iron-alloy liquids
Planetary cores, even those of some satellites and small planets (e.g. Io, Mars) withoutdetectable internal magnetic fields, are likely to have, at least partially, liquid interiors evenup to the present day [290]. The study of the properties of liquids in the Fe–FeS systemhas also benefited from synchrotron developments including measurements of liquid densitiesand viscosities using x-ray absorption profiles or x-ray radiography combined with fallingsphere viscometry, as outlined earlier. Densities of liquids in the Fe–S and Fe–Si systemwere measured up to 5–6 GPa at temperatures above 1700 K [336, 337]. The results bythis method are broadly consistent with density bounds inferred from sink/float experimentsup to 20 GPa [338]. The addition of sulfur strongly reduces the density (and increases thecompressibility) of the melt.
The viscosity of iron and iron-alloys are one of the fundamental parameters neededto characterize convective flow and operation of the geodynamo in the Earth’s outer core.Measurements of the viscosity of Fe–FeS compositions to 7 GPa using Stokes’ viscometryyield viscosities of ∼10−2 Pa s [339–342] and an estimated viscosity of 2 × 10⁻² Pa s for theEarth’s outer core was reported [340]. The viscosity of pure Fe liquid has also been measuredup to ∼6 GPa and 2100 K in two studies [340, 343], though they show some disagreement inthe pressure dependence of viscosity and its relation to melt structure [344].
Macroscopic properties, such as viscosity, depend on the nature of the local structure ofthe liquid. Synchrotron x-ray diffraction on liquid iron has been used to determine the radialdistribution function at 5 GPa and 2300 K [344]. As pressure increases, a bcc-like structurein liquid iron evolves towards a more close-packed structure. More recently, the structure ofliquid iron was examined in the diamond anvil cell at 58 GPa using angle dispersive diffractiontechniques [121] demonstrating that liquid iron behaves as a close-packed hard-sphere liquid.
1850 T S Duffy
Theoretical calculations [345] suggest that iron remains a relatively simple close-packed liquideven at core conditions, and the viscosity is similar to values at ambient pressure. X-raydiffraction studies to constrain the radial distribution functions of Fe–S and Fe–Si liquids werecarried out up to 5 GPa and 1400–2300 K in a large-volume apparatus [346]. Si produceslittle change in melt structure compared with pure Fe, but the presence of S strongly modifiesthe local structure. This result is consistent with the observed large effect of sulfur on meltcompressibility obtained by the x-ray absorption method discussed earlier.
6. Experimental challenges
Synchrotron experiments directed at understanding planetary interiors have experiencedconsiderable evolution in recent years. There are a number of areas of experimental challengewhere future advancements may develop.
Although improvements in pressure and temperature metrology can enhance all typesof high-pressure synchrotron experiments, they are especially needed for understandingmantle phase transitions. Progress has been made in developing better high P –T equationof state standards [52, 181, 184], and increasingly extensive cross-calibrations have beencarried out [54]. Further efforts are needed to improve calibration of standards at veryhigh pressures exceeding 1 Mbar [49]. P –V –T equations of state used at present involve anumber of simplifying assumptions, and more sophisticated formuations need to be developed.Theoretical studies using density functional theory should play a greater role in constrainingthe form of the equation of state and the higher order thermodynamic parameters that areoften required. Absolute pressure scales can be constructed from acoustic and volumecompression data [47, 48] while careful, detailed studies are needed at high P –T to establishwell-characterized absolute standards.
There have also been significant strides in temperature generation and measurementcapabilities in different high-pressure apparatus. The use of intensity ratios of phononcreation and annihilation (Stokes/anti-Stokes) pairs, from Raman [347] or nuclear resonancespectroscopy [84] for absolute temperature determination, is a significant development with thepotential to resolve long-standing uncertainties associated with spectroradiometry. In large-volume apparatus, thermal noise metrology offers a possible route to an absolute calibrationif measurements of sufficient accuracy can be extracted from the weak Johnson noise signal.
High-pressure technology promises to continue to evolve, expanding the P –T range andexperimental accuracy of existing techniques while also making entirely new measurementspossible. For the diamond anvil cell, synthetic single-crystal diamond grown by chemicalvapour deposition (CVD) techniques have been developed for ultra-high pressures [348].Growth of CVD layers on natural diamonds allows for various probes to be encapsulatedwithin diamond, thereby creating new opportunities for electrical and magnetic measurements,heating systems and isotopic control of diamond composition [349]. Supported Moissanite(SiC) cells have been developed that allow for significant increases in sample volume [350].In the multi-anvil apparatus, the use of sintered diamond anvils not only allows for pressuregeneration up to 60 GPa or above [351] but also provides an optical window that can enablenew types of high-pressure experiments [92].
Nuclear resonant and inelastic scattering techniques have just begun to be exploited athigh pressures as they have considerable potential application to geophysical problems. Theseare count-rate limited experiments, and further improvements in photon flux and stability oflaser heating are expected in the future.
Development of monochromatic single-crystal diffraction techniques at the megabarpressure range promises to be a frontier research direction for diamond anvil cell studies

Synchrotron facilities and study of the Earth’s interior 1851
over the next decade. There are a number of requirements for such experiments that are beingactively addressed, including hydrostaticity of the pressure environment, size and integrity ofthe single crystal at very high pressures, access to a sufficient portion of reciprocal space anda diffraction system for accurate intensity and d-spacing measurement. Development of newdiamond cell designs, x-ray transparent gaskets and new types of x-ray transparent backingplates are also integral parts of this effort.
7. Summary
Synchrotron-based high-pressure experiments have contributed greatly to our understandingof material properties at high pressures and to our ability to interpret geophysical observationsof the deep Earth and planetary interiors. The last few years have witnessed rapid, synergisticdevelopment of advanced pressure-generating capabilities and new synchrotron techniques.At the same time, more established techniques, such as x-ray diffraction, witness continualimprovements in quality and capability. Examples of the most significant findings over thelast five years include the following:
(1) The discovery and characterization of the post-perovskite (CaIrO3-type) phase of MgSiO3
at pressures near 125 GPa. The existence of a first-order phase change in the most abundantmantle constituent promises to have a major impact on our understanding of core–mantleboundary dynamics.
(2) Development of high-pressure inelastic scattering and spectroscopic techniques whichhave enabled many electronic, magnetic and vibrational properties to be characterizeddirectly at high pressure for the first time. Examples include the discovery of spin pairingtransitions in Fe alloys and Fe-bearing silicates under deep Earth conditions.
(3) Synchrotron x-ray diffraction techniques in both the diamond anvil cell and multi-anvilapparatus have allowed for detailed examination of the depth, slope, thickness and velocitycontrast of the major upper mantle seismic discontinuities under in situ conditions for thefirst time.
(4) The study of melting, melt structure and physical properties of melts as well as liquids usinga variety of diffraction and spectroscopic techniques. Understanding of the behaviour ofmelts at very high-pressure conditions is critical to understanding Earth formation andevolution as well as core structure and its dynamics.
(5) The study of the strength and rheology of silicates across the upper mantle P –T rangeand at deep mantle pressures at room temperatures. Ultimately, rheological propertiesultimately control mantle flow, but until recently it had been among the more poorlyconstrained physical properties of minerals.
Acknowledgments
The manuscript benefited by comments from A Kubo. S-H Shim, A Kubo, S Speziale andS Shieh provided assistance in the preparation of the figures. The NSF, DOE and David andLucile Packard Foundation provided financial support.
References
[1] Kennett B L N, Engdahl E R and Buland R 1995 Geophys. J. Int. 122 108–24[2] Garnero E J 2000 Ann. Rev. Earth Planet. Sci. 28 509–37[3] Sidorin I, Gurnis M and Helmberger D V 1999 Science 286 1326–31[4] Lay T and Helmberger D V 1983 Geophys. J. R. Astron. Soc. 75 799–837

1852 T S Duffy
[5] Williams Q and Garnero E J 1996 Science 273 1528–30[6] Christensen U R and Hofmann A W 1994 J. Geophys. Res. 99 19867–84[7] Romanowicz B 1991 Ann. Rev. Earth Planet. Sci. 19 77–99[8] van der Hilst R D, Widiyantoro S and Engdahl E R 1997 Nature 386 578–84[9] Montelli R, Nolet G, Dahlen F A, Masters G, Engdahl E R and Hung S H 2004 Science 303 338–43
[10] van Keken P E, Hauri E H and Ballentine C J 2002 Ann. Rev. Earth Planet. Sci. 30 493–525[11] Duffy T S and Ahrens T J 1992 J. Geophys. Res. 97 4503–20[12] Karato S-I and Karki B B 2001 J. Geophys. Res. 106 21771–83[13] Stixrude L and Brown J M 1998 Ultrahigh-Pressure Mineralogy ed R J Hemley (Washington, DC: Mineralogical
Society of America) pp 261–82[14] Jephcoat A and Olson P 1987 Nature 325 332–5[15] Buffett B A, Huppert H E, Lister J R and Woods A W 1996 J. Geophys. Res. 101 7989–8006[16] Stevenson D J 2001 High-Pressure Phenomena ed G L Chiarotti et al (Amsterdam: IOS) pp 587–606[17] McCammon C 2001 Science 293 813–14[18] McDonough W F and Sun S S 1995 Chem. Geol. 120 223–53[19] Fei Y and Bertka C M 1999 Mantle Petrology: Field Observations and High Pressure Experiments ed Y Fei et al
(Houston: The Geochemical Society) pp 189–207[20] Helffrich G R and Wood B J 2001 Nature 412 501–7[21] Duffy T S, Zha C S, Downs R T, Mao H-k and Hemley R J 1995 Nature 378 170–3[22] Katsura T et al 2004 J. Geophys. Res. 109 B02209[23] Hacker B R, Abers G A and Peacock S M 2003 J. Geophys. Res. 108 2029[24] Tackley P J, Stevenson D J, Glatzmaier G A and Schubert G 1994 J. Geophys. Res. 99 15877–901[25] Christensen U 1995 Ann. Rev. Earth Planet. Sci. 23 65–87[26] Weidner D J, Chen J H, Xu Y Q, Wu Y J, Vaughan M T and Li L 2001 Phys. Earth Planet. Int. 127
67–81[27] Weidner D J 1998 Rev. Mineral. 37 493–524[28] Durham W B, Weidner D J, Karato S I and Wang Y B 2002 Plastic Deformation of Minerals and Rocks
ed S Karato and H R Wenk (Washington, DC: Mineralogical Society of America) pp 21–49[29] Kellogg L H, Hager B H and van der Hilst R D 1999 Science 283 1881–4[30] van der Hilst R D and Karason H 1999 Science 283 1885–8[31] Ishii M and Tromp J 1999 Science 285 1231–6[32] Kennett B L N, Widiyantoro S and van der Hilst R D 1998 J. Geophys. Res. 103 12469–93[33] Williams Q and Hemley R J 2001 Ann. Rev. Earth Planet. Sci. 29 365–418[34] Yusa H, Inoue T and Ohishi Y 2000 Geophys. Res. Lett. 27 413–16[35] Chen J, Inoue T, Weidner D J, Wu Y and Vaughan M T 1998 Geophys. Res. Lett. 25 575–8[36] Kavner A 2003 Earth Planet. Sci. Lett. 214 645–54[37] Song T R A, Helmberger D V and Grand S P 2004 Nature 427 530–3[38] van der Meijde M, Marone F, Giardini D and van der Lee S 2003 Science 300 1556–8[39] Nolet G and Zielhuis A 1994 J. Geophys. Res. 99 15813–20[40] Hemley R J, Mao H-k and Struzhkin V V 2005 J. Synch. Rad. 12 135–54[41] Paszkowicz W 2002 Nucl. Instrum. Methods B 198 142–82[42] Singh A K 1993 J. Appl. Phys. 73 4278–86[43] Duffy T S, Hemley R J and Mao H-k 1995 Phys. Rev. Lett. 74 1371–4[44] Piermarini G J, Block S, Barnett J D and Forman R A 1975 J. Appl. Phys. 46 2774–80[45] Mao H K, Bell P M, Shaner J W and Steinberg D J 1978 J. Appl. Phys. 49 3276–83[46] Mao H K, Xu J and Bell P M 1986 J. Geophys. Res. 91 4673–6[47] Zha C S, Mao H-k and Hemley R J 2000 Proc. Natl Acad. Sci. 97 13494–9[48] Zha C S, Duffy T S, Downs R T, Mao H-k and Hemley R J 1998 Earth Planet. Sci. Lett. 159 25–34[49] Dewaele A, Loubeyre P and Mezouar M 2004 Phys. Rev. B 70 094112[50] Funamori N and Jeanloz R 1997 Science 278 1109–11[51] Lin J F, Degtyareva O, Prewitt C T, Dera P, Sata N, Gregoryanz E, Mao H K and Hemley R J 2004 Nat. Mat.
3 389–93[52] Holzapfel W B 2003 J. Appl. Phys. 93 1813–18[53] Dorogokupets P I and Oganov A R 2003 Dokl. Earth Sci. A 391 854–7[54] Fei Y W, Li H, Hirose K, Minarik W, Van Orman J, Sanloup C, van Westrenen W, Komabayashi T and
Funakoshi K 2004 Phys. Earth Planet. Int. 143–144 515–26[55] Mao H K, Kao C C and Hemley R J 2001 J. Phys.: Condens. Matter 13 7847–58[56] Yamanaka T, Fukuda T, Hattori T and Sumiya H 2001 Rev. Sci. Instrum. 72 1458–62
Synchrotron facilities and study of the Earth’s interior 1853
[57] Mao H K, Shen G, Hemley R J and Duffy T S 1998 High-Pressure Temperature Research: Properties of Earthand Planetary Materials ed M H Manghnani and T Yagi (Washington, DC: American Geophysical Union)pp 27–34
[58] Mao H K, Shu J F, Shen G, Hemley R J, Li B and Singh A K 1998 Nature 396 741–3[59] Hemley R J, Mao H-k, Shen G, Badro J, Gillet P, Hanfland M and Hausermann D 1997 Science 276 1242–5[60] Lin J F, Shu J, Mao H K, Hemley R J and Shen G 2003 Rev. Sci. Instrum. 74 4732–6[61] Fei Y and Wang Y 2000 Rev. Mineral. Geochem. 41 551–7[62] Zha C S and Bassett W A 2003 Rev. Sci. Instrum. 74 1255–62[63] Dubrovinskaia N and Dubrovinsky L 2003 Rev. Sci. Instrum. 74 3433–7[64] Jephcoat A P and Besedin S P 1996 Phil. Trans. R. Soc. Lond. A 354 1333–60[65] Ming L and Bassett W A 1974 Rev. Sci. Instrum. 45 1115–18[66] Shen G, Rivers M L, Wang Y and Sutton S R 2001 Rev. Sci. Instrum. 72 1273–82[67] Lin J F, Sturhahn W, Zhao J, Shen G, Mao H-k and Hemley R J 2005 Advances in High-Pressure Technology
for Geophysical Applications ed J Chen et al (Amerstdam: Elsevier) at press[68] Watanuki T, Shimomura O, Yagi T, Kondo T and Isshiki M 2001 Rev. Sci. Instrum. 72 1289–92[69] Yagi T, Kondo T, Watanuki T, Shimomura O and Kikegawa T 2001 Rev. Sci. Instrum. 72 1293–7[70] Boehler R 2000 Rev. Geophys. 38 221–45[71] Andrault D and Fiquet G 2001 Rev. Sci. Instrum. 72 1283–8[72] Dewaele A, Fiquet G and Gillet P 1998 Rev. Sci. Instrum. 69 2421–6[73] Kavner A and Panero W R 2004 Phys. Earth Planet. Int. 143–144 527–39[74] Panero W R and Jeanloz R 2001 J. Geophys. Res. 106 6493–8[75] Panero W R and Jeanloz R 2001 Rev. Sci. Instrum. 72 1306–8[76] Kiefer B and Duffy T S 2005 J. Appl. Phys. at press[77] Andrault D, Fiquet G, Itie J P, Richet P, Gillet P, Hausermann D and Hanfland M 1998 Eur. J. Mineral. 10
931–40[78] Kavner A and Duffy T S 2001 J. Appl. Phys. 89 1907–14[79] Prakapenka V B, Shen G Y and Dubrovinsky L S 2003 High Temp.—High Pressures 35–36 237–49[80] Walter M J and Koga K T 2004 Phys. Earth Planet. Int. 143–144 541–58[81] Eng P J, Newville M, Rivers M L and Sutton S R 1998 SPIE Proc. 3449 145–56[82] Getting I C and Kennedy G C 1970 J. Appl. Phys. 41 4552[83] Irifune T 2002 Mineral. Mag. 66 769–90[84] Lin J F, Sturhahn W, Zhao J Y, Shen G Y, Mao H K and Hemley R J 2004 Geophys. Res. Lett. 31 L14611[85] Zhao J, Sturhahn W, Lin J F, Shen G, Alp E E and Mao H-k 2004 High Pressure Res. 24 447–57[86] Li B S, Kung J and Liebermann R C 2004 Phys. Earth Planet. Int. 143–144 559–74[87] Duffy T S and Wang Y 1998 Ultrahigh Pressure Mineralogy ed R J Hemley (Washington, DC: Mineralogical
Society of America) pp 425–58[88] Katayama Y and Inamura Y 2003 J. Phys.: Condens. Matter 15 S343–S350[89] Utsumi W, Funakoshi K, Katayama Y, Yamakata M, Okada T and Shimomura O 2002 J. Phys.: Condens.
Matter 14 10497–504[90] Uchida T et al 2002 J. Phys.: Condens. Matter 14 11517–23[91] Besson J M, Nelmes R J, Hamel G, Loveday J S, Weill G and Hull S 1992 Physica B 180 907–10[92] Katsura T, Funakoshi K, Kubo A, Nishiyama N, Tange Y, Sueda Y, Kubo T and Utsumi W 2004 Phys. Earth
Planet. Int. 143–144 497–506[93] Kubo A, Ito E, Katsura T, Shinmei T, Yamada H, Nishikawa O, Song M S and Funakoshi K 2003 Geophys.
Res. Lett. 30 1126[94] Parise J B, Weidner D J, Chen J, Liebermann R C and Chen G 1998 Ann. Rev. Mater. Sci. 28 349–74[95] Buras B and Gerward L 1989 Prog. Cryst. Growth Charact. Mater. 18 93–138[96] Fei Y, Mao H K, Shu J, Parthasarathy G and Bassett W A 1992 J. Geophys. Res. 97 4489–95[97] Fei Y, Mao H K, Shu J F and Hu J 1992 Phys. Chem. Minerals 18 416–22[98] Fei Y and Mao H-k 1993 J. Geophys. Res. 98 11875–84[99] Fiquet G, Andrault D, Itie J P, Gillet P and Richet P 1996 Phys. Earth Planet. Int. 95 1–17
[100] Kruger M B, Nguyen J H, Caldwell W and Jeanloz R 1997 Phys. Rev. B 56 1–4[101] Shim S-H, Duffy T S and Shen G 2000 J. Geophys. Res. 105 25955–68[102] Meade C, Mao H K and Hu J 1995 Science 268 1743–5[103] Kavner A, Duffy T S and Shen G 2001 Earth Planet. Sci. Lett. 185 25–33[104] Duffy T S, Shen G, Heinz D L, Shu J F, Ma Y, Mao H-k, Hemley R J and Singh A K 1999 Phys. Rev. B 60
15063–73[105] Shieh S R, Duffy T S and Shen G 2004 Phys. Earth Planet. Int. 143–144 93–106

1854 T S Duffy
[106] Shen G, Mao H-k, Hemley R J, Duffy T S and Rivers M L 1998 Geophys. Res. Lett. 25 373–6[107] Shim S-H, Jeanloz R and Duffy T S 2002 Geophys. Res. Lett. 29 2466[108] Wenk H R, Lonardelli I, Pehl J, Devine J, Prakapenka V, Shen G and Mao H K 2004 Earth Planet. Sci. Lett.
226 507–19[109] Chen J H, Weidner D J, Parise J B, Vaughan M T and Raterron P 2001 Phys. Rev. Lett. 86 4072–5[110] Wang Y B, Uchida T, Von Dreele R, Rivers M L, Nishiyama N, Funakoshi K, Nozawa A and Kaneko H 2004
J. Appl. Cryst. 37 947–56[111] Mao H K, Jephcoat A P, Hemley R J, Finger L W, Zha C S, Hazen R M and Cox D E 1988 Science 239
1131–4[112] Shu J F, Mao H K, Hu J Z, Fei Y W and Hemley R J 1998 N. Jahr. Mineral. 172 309–23[113] Duffy T S, Shu J, Mao H-k and Hemley R J 1995 Phys. Chem. Minerals 22 277–81[114] Hemley R J, Shu J, Carpenter M A, Hu J, Mao H-k and Kingma K J 2000 Solid State Commun. 114 527–32[115] Karki B B, Stixrude L and Crain J 1997 Geophys. Res. Lett. 24 3269–72[116] Shieh S R, Duffy T S and Li B S 2002 Phys. Rev. Lett. 89 25507[117] Sobolev N V, Fursenko B A, Goryainov S V, Shu J F, Hemley R J, Mao H K and Boyd F R 2000 Proc. Natl
Acad. Sci. 97 11875–9[118] Dera P, Prewitt C T, Boctor N Z and Hemley R J 2002 Am. Mineral. 87 1018–23[119] Duffy T S and Ahrens T J 1992 High-Pressure Research in Mineral Physics: Applications to Earth and
Planetary Sciences ed Y Syono and M H Manghnani (Tokyo: Terra Scientific) pp 197–206[120] Yaoita K, Katayama Y, Tsuji K, Kikegawa T and Shimomura O 1997 Rev. Sci. Instrum. 68 2106–10[121] Shen G Y, Prakapenka V B, Rivers M L and Sutton S R 2004 Phys. Rev. Lett. 92 185701[122] Shen G Y, Rivers M L, Sutton S R, Sata N, Prakapenka V B, Oxley J and Suslick K S 2004 Phys. Earth Planet.
Int. 143–144 481–95[123] Funamori N, Yamamoto S, Yagi T and Kikegawa T 2004 J. Geophys. Res. 109 B03203[124] Katayama Y and Tsuji K 2003 J. Phys.: Condens. Matter 15 6085–103[125] Katayama Y, Tsuji K, Chen J, Koyama N, Kikegawa T, Yaoita K and Shimomura O 1993 J. Non-Cryst. Solids
156 687–90[126] Shen G Y, Sata N, Newville M, Rivers M L and Sutton S R 2002 Appl. Phys. Lett. 81 1411–13[127] Scarfe C M, Mysen B O and Virgo D 1987 Magmatic Processes: Physiochemical Principles ed B O Mysen
(University Park, PA: Geochemical Society) pp 59–68[128] Kushiro I 1976 J. Geophys. Res. 81 6347–50[129] Kanzaki M, Kurita K, Fujii T, Kato T, Shimomura O and Akimoto S 1987 High-Pressure Research in Mineral
Physics ed M H Manghnani and Y Syono (Washington, DC: American Geophysical Union) pp 195–200[130] Reid J E, Suzuki A, Funakoshi K I, Terasaki H, Poe B T, Rubie D C and Ohtani E 2003 Phys. Earth Planet.
Int. 139 45–54[131] Suzuki A, Ohtani E, Funakoshi K, Terasaki H and Kubo T 2002 Phys. Chem. Mineral. 29 159–65[132] Tinker D, Lesher C E, Baxter G M, Uchida T and Wang Y B 2004 Am. Mineral. 89 1701–8[133] Burkel E 2000 Rep. Prog. Phys. 63 171–232[134] Fiquet G et al 2004 Phys. Earth Planet. Int. 143–144 5–18[135] Occelli F, Krisch M, Loubeyre P, Sette F, Le Toullec R, Masciovecchio C and Rueff J P 2001 Phys. Rev. B 63
224306[136] Krisch M 2003 J. Raman Spectrosc. 34 628–32[137] Isaak D G 2001 Handbook of Elastic Properties of Solids, Liquids, and Gases ed M Levy et al (San Diego:
Academic) pp 325–77[138] Li B S, Liebermann R C and Weidner D J 2001 J. Geophys. Res. 106 30579–91[139] Krisch M H, Mermet A, SanMiguel A, Sette F, Masciovecchio C, Ruocco G and Verbeni R 1997 Phys. Rev. B
56 8691–4[140] Antonangeli D, Occelli F, Requardt H, Badro J, Fiquet G and Krisch M 2004 Earth Planet. Sci. Lett. 225
243–51[141] Antonangeli D, Krisch M, Fiquet G, Farber D, Aracne C, Badro J, Occelli F and Requardt H 2005 Phys. Rev.
Lett. 93 215505[142] Sturhahn W, Toellner T S, Alp E E, Zhang X, Ando M, Yoda Y, Kikuta S, Seto M, Kimball C W and Dabrowski B
1995 Phys. Rev. Lett. 74 3832–5[143] Sturhahn W 2004 J. Phys.: Condens. Matter 16 S497–530[144] Mao H K et al 2001 Science 292 914–16[145] Lubbers R, Grunsteudel H F, Chumakov A I and Wortmann G 2000 Science 287 1250–3[146] Shen G, Sturhahn W, Alp E E, Zhao J, Toellner T S, Prakapenka V B, Meng Y and Mao H R 2004 Phys. Chem.
Mineral. 31 353–9

Synchrotron facilities and study of the Earth’s interior 1855
[147] Struzhkin V V, Mao H K, Mao W L, Hemley R J, Sturhahn W, Alp E E, L’Abbe C, Hu M Y and Errandonea D2004 Hyperfine Int. 153 3–15
[148] Hu M Y, Sturhahn W, Toellner T S, Mannheim P D, Brown D E, Zhao J Y and Alp E E 2003 Phys. Rev. B 67094304
[149] Lin J F, Struzhkin V V, Sturhahn W, Huang E, Zhao J Y, Hu M Y, Alp E E, Mao H K, Boctor N and Hemley R J2003 Geophys. Res. Lett. 30 2112
[150] Mao W L, Sturhahn W, Heinz D L, Mao H K, Shu J F and Hemley R J 2004 Geophys. Res. Lett. 31 L15618[151] Lin J F, Fei Y W, Sturhahn W, Zhao J Y, Mao H K and Hemley R J 2004 Earth Planet. Sci. Lett. 226 33–40[152] Jackson J M, Sturhahn W, Shen G Y, Zhao J Y, Hu M Y, Errandonea D, Bass J D and Fei Y W 2005 Am. Mineral.
90 199–205[153] Zhang L, Stanek J, Hafner S S, Ahsbahs H, Grunsteudel H F, Metge J and Ruffer R 1999 Am. Mineral. 84
447–53[154] Lin J F, Sturhahn W, Zhao J, Shen G, Mao H-k and Hemley R J 2005 Advances in High-Pressure Technology
for Geophysical Applications ed J Chen et al (Amerstdam: Elsevier) at press[155] Badro J, Rueff J P, Vanko G, Monaco G, Fiquet G and Guyot F 2004 Science 305 383–6[156] Rueff J P, Kao C C, Struzhkin V V, Badro J, Shu J, Hemley R J and Hao H K 1999 Phys. Rev. Lett. 82
3284–7[157] Badro J, Struzhkin V V, Shu J F, Hemley R J, Mao H K, Kao C C, Rueff J P and Shen G Y 1999 Phys. Rev.
Lett. 83 4101–4[158] Badro J, Fiquet G, Struzhkin V V, Somayazulu M, Mao H K, Shen G and Le Bihan T 2002 Phys. Rev. Lett. 89
205504[159] Badro J, Fiquet G, Guyot F, Rueff J P, Struzhkin V V, Vanko G and Monaco G 2003 Science 300 789–91[160] Li J, Struzhkin V V, Mao H K, Shu J F, Hemley R J, Fei Y W, Mysen B, Dera P, Prakapenka V and Shen G Y
2004 Proc. Natl Acad. Sci. 101 14027–30[161] Lin J F, Struzhkin V V, Mao H K, Hemley R J, Chow P, Hu M Y and Li J 2004 Phys. Rev. B 70 212405[162] Rueff J P, Krisch M, Cai Y Q, Kaprolat A, Hanfland M, Lorenzen M, Masciovecchio C, Verbeni R and Sette F
1999 Phys. Rev. B 60 14510–12[163] Shinoda K, Yamakata M, Nanba T, Kimura H, Moriwaki T, Kondo Y, Kawamoto T, Niimi N, Miyoshi N and
Aikawa N 2002 Phys. Chem. Mineral. 29 396–402[164] Liu Z X, Lager G A, Hemley R J and Ross N L 2003 Am. Mineral. 88 1412–15[165] Hemley R J, Goncharov A F, Lu R, Struzhkin V V, Li M and Mao H K 1998 Nuovo Cim. D 20 539–51[166] Liu Z, Hu J, Yang H, Mao H K and Hemley R J 2002 J. Phys.: Condens. Matter 14 10641–6[167] Birch F 1952 J. Geophys. Res. 57 227–86[168] Knittle E 1995 A Handbook of Physical Constants ed T J Ahrens (Washington, DC: American Geophysical
Union) pp 98–143[169] Jackson I and Rigden S M 1996 Phys. Earth Planet. Int. 96 85–112[170] Shim S-H and Duffy T S 2000 Am. Mineral. 85 354–63[171] Ito E and Takahashi E 1989 J. Geophys. Res. 94 10637–46[172] Irifune T et al 1998 Science 279 1698–700[173] Hirose K, Fei Y W, Ono S, Yagi T and Funakoshi K 2001 Earth Planet. Sci. Lett. 184 567–73[174] Walter M J, Thibault Y, Wei K and Luth R W 1995 Can. J. Phys. 73 273–86[175] Katsura T et al 2003 Phys. Earth Planet. Int. 136 11–24[176] Shim S-H, Duffy T S and Shen G 2001 Nature 411 571–4[177] Chudinovskikh L and Boehler R 2001 Nature 411 574–7[178] Anderson O L, Isaak D G and Yamamoto S 1989 J. Appl. Phys. 65 1534–43[179] Jamieson J C, Fritz J N and Manghnani M H 1982 High Pressure Research in Geophysics ed S Akimoto and
M H Manghnani (Tokyo: Center for Academic Publications) pp 27–47[180] Heinz D L and Jeanloz R 1984 J. Appl. Phys. 55 885–93[181] Speziale S, Zha C S, Duffy T S, Hemley R J and Mao H-k 2001 J. Geophys. Res. 106 515–28[182] Holmes N C, Moriarity J A, Gathers G R and Nellis W J 1989 J. Appl. Phys. 66 2962–7[183] Fei Y, Van Orman J, Li J, van Westrenen W, Sanloup C, Minarik W, Hirose K, Komabayashi T, Walter M and
Funakoshi K 2004 J. Geophys. Res. 109 B02305[184] Shim S-H, Duffy T S and Kenichi T 2002 Earth Planet. Sci. Lett. 203 729–39[185] Akaogi M and Ito E 1993 Geophys. Res. Lett. 20 1839–42[186] Gu Y J, Dziewonski A M and Ekstrom G 2003 Geophys. J. Int. 154 559–83[187] Flanagan M P and Shearer P M 1998 J. Geophys. Res. 103 2673–92[188] Ono S, Katsura T, Ito E, Kanzaki M, Yoneda A, Walter M J, Urakawa S, Utsumi W and Funakoshi K 2001
Geophys. Res. Lett. 28 835–8

1856 T S Duffy
[189] Kuroda K, Irifune T, Inoue T, Nishiyama N, Miyashita M, Funakoshi K and Utsumi W 2000 Phys. Chem.Mineral. 27 523–32
[190] Nishiyama N, Irifune T, Inoue T, Ando J and Funakoshi K 2004 Phys. Earth Planet. Int. 143–144 185–99[191] Morishima H, Kato T, Suto M, Ohtani E, Urakawa S, Utsumi W, Shimomura O and Kikegawa T 1994 Science
265 1202–3[192] Matsui M, Parker S C and Leslie M 2000 Am. Mineral. 85 312–6[193] Matsui M and Nishiyama N 2002 Geophys. Res. Lett. 29 1368[194] Jackson I and Rigden S M 1998 The Earth’s Mantle: Composition, Structure and Evolution ed I Jackson
(Cambridge: Cambridge University Press) pp 405–60[195] Akaogi M, Ito E and Navrotsky A 1989 J. Geophys. Res. 94 15671–85[196] Katsura T and Ito E 1989 J. Geophys. Res. 94 15663–70[197] Suzuki A, Ohtani E, Morishima H, Kubo T, Kanbe Y, Kondo T, Okada T, Terasaki H, Kato T and Kikegawa T
2000 Geophys. Res. Lett. 27 803–6[198] Irifune T and Isshiki M 1998 Nature 392 702–5[199] Frost D J 2003 Earth Planet. Sci. Lett. 216 313–28[200] Benz H M and Vidale J E 1993 Nature 365 147–50[201] Shearer P M and Masters T G 1992 Nature 355 791–6[202] Irifune T and Ringwood A E 1993 Earth Planet. Sci. Lett. 117 101–10[203] Karato S 1997 Phys. Earth Planet. Int. 99 103–11[204] Ringwood A E 1991 Geochim. Cosmochim. Acta 55 2083–110[205] Hirose K, Fei Y W, Ma Y Z and Mao H K 1999 Nature 397 53–6[206] Litasov K, Ohtani E, Suzuki A, Kawazoe T and Funakoshi K 2004 Geophys. Res. Lett. 31 L24607[207] Kubo T, Ohtani E, Kondo T, Kato T, Toma M, Hosoya T, Sano A, Kikegawa T and Nagase T 2002 Nature 420
803–6[208] Meade C and Jeanloz R 1990 Nature 348 533–5[209] Kinsland G L 1977 J. Appl. Phys. 48 978[210] Singh A K, Mao H-k, Shu J and Hemley R J 1998 Phys. Rev. Lett. 80 2157–60[211] Duffy T S, Shen G, Shu J F, Mao H-k, Hemley R J and Singh A K 1999 J. Appl. Phys. 86 6729–36[212] Christensen N E, Ruoff A L and Rodriguez C O 1995 Phys. Rev. B 52 9121–4[213] Weidner D J, Li L, Davis M and Chen J H 2004 Geophys. Res. Lett. 31 L06621[214] Weidner D J, Wang Y B and Vaughan M T 1994 Geophys. Res. Lett. 21 753–6[215] Chen J H, Weidner D J and Vaughan M T 2002 Nature 419 824–6[216] Yamazaki D and Karato S 2001 Rev. Sci. Instrum. 72 4207–11[217] Wang Y B, Durham W B, Getting I C and Weidner D J 2003 Rev. Sci. Instrum. 74 3002–11[218] Uchida T, Wang Y B, Rivers M L and Sutton S R 2004 Earth Planet. Sci. Lett. 226 117–26[219] Nishiyama N, Wang Y, Uchida T, Irifune T, Rivers M L and Sutton S R 2005 Geophys. Res. Lett. 32 L022141[220] Kavner A and Duffy T S 2001 Geophys. Res. Lett. 28 2691–4[221] O’Neill B and Jeanloz R 1990 Geophys. Res. Lett. 17 1477–80[222] Kesson S E, Fitz Gerald J D and Shelley J M 1998 Nature 393 252–5[223] Lee K K M, O’Neill B, Panero W R, Shim S H, Benedetti L R and Jeanloz R 2004 Earth Planet. Sci. Lett. 223
381–93[224] Ono S, Ohishi Y, Isshiki M and Watanuki T 2005 J. Geophys. Res. 110 B02208[225] Funamori N, Jeanloz R, Miyajima N and Fujino K 2000 J. Geophys. Res. 105 26037–43[226] Morishima H, Ohtani E, Kato T, Shimomura O and Kikegawa T 1994 Geophys. Res. Lett. 21 899–902[227] Mao H K, Hemley R J, Fei Y, Shu J F, Chen L C, Jephcoat A P, Wu Y and Bassett W A 1991 J. Geophys. Res.
96 8069–79[228] Funamori N, Yagi T, Utsumi W, Kondo T, Uchida T and Funamori M 1996 J. Geophys. Res. 101 8257–69[229] Fiquet G, Andrault D, Dewaele A, Charpin T, Kunz M and Hausermann D 1998 Phys. Earth Planet. Int. 105
21–31[230] Fiquet G, Dewaele A, Andrault D, Kunz M and Bihan T L 2000 Geophys. Res. Lett. 27 21–4[231] Shim S-H, Duffy T S and Shen G 2001 Science 293 2437–40[232] Serghiou G, Zerr A and Boehler R 1998 Science 280 2093–5[233] Saxena S K, Dubrovinsky L S, Lazor P and Hu J Z 1998 Eur. J. Mineral. 10 1275–81[234] Saxena S K, Dubrovinsky L S, Lazor P, Cerenius Y, Haggkvist P, Hanfland M and Hu J Z 1996 Science 274
1357–9[235] Zhang J Z and Weidner D J 1999 Science 284 782–4[236] Andrault D, Bolfan-Casanova N and Guignot N 2001 Earth Planet. Sci. Lett. 193 501–8[237] Daniel I, Cardon H, Fiquet G, Guyot F and Mezouar M 2001 Geophys. Res. Lett. 28 3789–92
Synchrotron facilities and study of the Earth’s interior 1857
[238] Daniel I, Bass J D, Fiquet G, Cardon H, Zhang J Z and Hanfland M 2004 Geophys. Res. Lett. 31 L15608[239] Walter M J, Kubo A, Yoshino T, Brodholt J, Koga K T and Ohishi Y 2004 Earth Planet. Sci. Lett. 222
501–16[240] Yagi T, Okabe K, Nishiyama N, Kubo A and Kikegawa T 2004 Phys. Earth Planet. Int. 143–144 81–91[241] Kubo A, Yagi T, Ono S and Akaogi M 2000 Proc. Japan Acad. Ser. B 76 103–7[242] Jackson J M, Zhang J Z and Bass J D 2004 Geophys. Res. Lett. 31 L10614[243] Mao H K, Shen G and Hemley R J 1997 Science 278 2098–100[244] Andrault D 2001 J. Geophys. Res. 106 2079–87[245] Kesson S E, O’Neill H S and Shelley J M G 2002 Phys. Earth Planet. Int. 131 295–310[246] Murakami M, Hirose K, Sata N and Ohishi Y 2005 Geophys. Res. Lett. L03304[247] Mao H K, Chen L C, Hemley R J, Jephcoat A P, Wu Y and Bassett W A 1989 J. Geophys. Res. 94 17889–94[248] Tarrida M and Richet P 1989 Geophys. Res. Lett. 16 1351–4[249] Wang Y B and Weidner D J 1994 Geophys. Res. Lett. 21 895–8[250] Wang Y B, Weidner D J and Guyot F 1996 J. Geophys. Res. 101 661–72[251] Shim S-H, Duffy T S and Shen G 2000 Phys. Earth Planet. Int. 120 327–38[252] Akber-Knutson S, Bukowinski M S T and Matas J 2002 Geophys. Res. Lett. 29 1034[253] Magyari-Kope B, Vitos L, Grimvall G, Johansson B and Kollar J 2002 Phys. Rev. B 65 193107[254] Stixrude L, Cohen R E, Yu R C and Krakauer H 1996 Am. Mineral. 81 1293–6[255] Kurashina T, Hirose K, Ono S, Sata N and Ohishi Y 2004 Phys. Earth Planet. Int. 145 67–74[256] Ono S, Ohishi Y and Mibe K 2004 Am. Mineral. 89 1480–5[257] Dewaele A, Fiquet G, Andrault D and Hausermann D 2000 J. Geophys. Res. 105 2869–77[258] Mao H K, Shu J, Fei Y, Hu J and Hemley R J 1996 Phys. Earth Planet. Int. 96 135–45[259] Fei Y and Mao H K 1994 Science 266 1678–80[260] Murakami M, Hirose K, Ono S, Tsuchiya T, Isshiki M and Watanuki T 2004 Phys. Earth Planet. Int. 146
273–82[261] Kondo T, Ohtani E, Hirao N, Yagi T and Kikegawa T 2004 Phys. Earth Planet. Int. 143–144 201–13[262] Mao W, Shu J F, Hu J Z, Hemley R and Mao H 2002 J. Phys.: Condens. Matter 14 11349–54[263] Dubrovinsky L S, Dubrovinskaia N A, Saxena S K, Annersten H, Halenius E, Harryson H, Tutti F, Rekhi S
and Le Bihan T 2000 Science 289 430–2[264] Dubrovinsky L, Dubrovinskaia N, Annersten H, Halenius E and Harryson H 2001 Eur. J. Mineral. 13 857–61[265] Lin J F, Heinz D L, Mao H K, Hemley R J, Devine J M, Li J and Shen G Y 2003 Proc. Natl Acad. Sci. 100
4405–8[266] Kingma K J, Cohen R E, Hemley R J and Mao H K 1995 Nature 374 243–5[267] Andrault D, Fiquet G, Guyot F and Hanfland M 1998 Science 282 720–4[268] Teter D M, Hemley R J, Kresse G and Hafner J 1998 Phys. Rev. Lett. 80 2145–8[269] Leger J M and Haines J 1997 Eur. J. Solid State Inorg. Chem. 34 785–96[270] Ono S, Hirose K, Nishiyama N and Isshiki M 2002 Am. Mineral. 87 99–102[271] Ono S, Tsuchiya T, Hirose K and Ohishi Y 2003 Phys. Rev. B 68 014103[272] Prakapenka V B, Shen G Y, Dubrovinsky L S, Rivers M L and Sutton S R 2004 J. Phys. Chem. Solids 65
1537–45[273] Tsuchida Y and Yagi T 1989 Nature 340 217–20[274] Andrault D, Angel R J, Mosenfelder J L and Le Bihan T 2003 Am. Mineral. 88 301–7[275] Shieh S R, Duffy T S and Shen G 2005 Earth Planet. Sci. Lett. 235 273–82[276] Murakami M, Hirose K, Ono S and Ohishi Y 2003 Geophys. Res. Lett. 30 1207[277] Dubrovinsky L S, Saxena S K, Lazor P, Ahuja R, Eriksson O, Wills J M and Johansson B 1997 Nature 388
362–5[278] Dubrovinsky L S, Dubrovinskaia N A, Saxena S K, Tutti F, Rekhi S, Bihan T L, Shen G and Hu J 2001 Chem.
Phys. Lett. 333 264–70[279] Luo S N, Tschauner O, Asimow P D and Ahrens T J 2004 Am. Mineral. 89 454–61[280] Dubrovinsky L S, Dubrovinskaia N A, Prakapenka V, Seifert F, Langenhorst F, Dmitriev V, Weber H P and
Le Bihan T 2004 Phys. Earth Planet. Int. 143–144 231–40[281] Murakami M, Hirose K, Kawamura K, Sata N and Ohishi Y 2004 Science 304 855–8[282] Oganov A R and Ono S 2004 Nature 430 445–8[283] Tsuchiya T, Tsuchiya J, Umemoto K and Wentzcovitch R A 2004 Earth Planet. Sci. Lett. 224 241–8[284] Shim S-H, Duffy T S, Jeanloz R and Shen G 2004 Geophys. Res. Lett. 31 L10603[285] Iitaka T, Hirose K, Kawamura K and Murakami M 2004 Nature 430 442–5[286] Shieh S R, Duffy T S, Kubo A, Shen G, Prakapenka V B, Sata N, Hirose K and Ohishi Y 2005 EOS Trans.
AGU MR23A–0181
1858 T S Duffy
[287] Mao W L, Shen G Y, Prakapenka V B, Meng Y, Campbell A J, Heinz D L, Shu J F, Hemley R J and Mao H K2004 Proc. Natl Acad. Sci. 101 15867–9
[288] Hirose K, Kawamura K, Ohishi Y, Tateno S and Sata N 2005 Am. Mineral. 90 262–5[289] Kubo A, Duffy T S, Shieh S R, Kiefer B, Prakapenka V B and Shen G 2004 EOS Trans AGU (Fall Meeting
Suppl.) MR23A–0181[290] Stevenson D J 2003 Earth Planet. Sci. Lett. 208 1–11[291] Kivelson M G, Khurana K K, Russell C T, Walker R J, Warnecke J, Coroniti F V, Polanskey C, Southwood D J
and Schubert G 1996 Nature 384 537–41[292] Saxena S K, Dubrovinsky L S, Haggkvist P, Cerenius Y, Shen G and Mao H K 1995 Science 269
1703–4[293] Dubrovinsky L S, Saxena S K and Lazor P 1998 Eur. J. Mineral. 10 43–7[294] Yoo C S, Soderlind P, Moriarty J A and Cambell A J 1996 Phys. Lett. A 214 65–70[295] Andrault D, Fiquet G, Kunz M, Visocekas F and Hausermann D 1997 Science 278 831–4[296] Andrault D, Fiquet G, Charpin T and le Bihan T 2000 Am. Mineral. 85 364–71[297] Funamori N, Yagi T and Uchida T 1996 Geophys. Res. Lett. 23 953–6[298] Ma Y Z, Somayazulu M, Shen G Y, Mao H K, Shu J F and Hemley R J 2004 Phys. Earth Planet. Int. 143–144
455–67[299] Uchida T, Wang Y B, Rivers M L and Sutton S R 2001 J. Geophys. Res. 106 21799–810[300] Brown J M and McQueen R G 1996 J. Geophys. Res. 91 7485–94[301] Vocadlo L, Alfe D, Gillan M J, Wood I G, Brodholt J P and Price G D 2003 Nature 424 536–9[302] Lin J F, Heinz D L, Campbell A J, Devine J M and Shen G Y 2002 Science 295 313–15[303] Duffy T S and Ahrens T J 1997 J. Appl. Phys. 82 4259–69[304] Duffy T S and Ahrens T J 1992 High-Pressure Research in Mineral Physics: Applications to Earth and
Planetary Sciences ed Y Syono and M H Manghnani (Tokyo: Terra Scientific) pp 353–62[305] Tromp J 2001 Ann. Rev. Earth Planet. Sci. 29 47–69[306] Steinle-Neumann G, Stixrude L, Cohen R E and Gulseren O 2001 Nature 413 57–60[307] Steinle-Neumann G, Stixrude L and Cohen R E 1999 Phys. Rev. B 60 791–9[308] Wenk H R, Matthies S, Hemley R J, Mao H K and Shu J 2000 Nature 405 1044–7[309] Merkel S, Wenk H R, Gillet P, Mao H K and Hemley R J 2004 Phys. Earth Planet. Int. 145 239–51[310] Antonangeli D, Krisch M, Fiquet G, Farber D L, Aracne C M, Badro J, Occelli F and Requardt H 2005 Phys. Rev.
Lett. 93 215505[311] Poirier J P 1994 Phys. Earth Planet. Int. 85 319–37[312] Fei Y, Prewitt C T, Mao H K and Bertka C M 1995 Science 268 1892–4[313] Kusaba K, Syono Y, Kikegawa T and Shimomura O 1998 J. Phys. Chem. Solids 59 945–50[314] Kusaba K, Syono Y, Kikegawa T and Shimomura O 1997 J. Phys. Chem. Solids 58 241–6[315] Urakawa S, Someya K, Terasaki H, Katsura T, Yokoshi S, Funakoshi K I, Utsumi W, Katayama Y, Sueda Y I
and Irifune T 2004 Phys. Earth Planet. Int. 143–144 469–79[316] King H E and Prewitt C T 1982 Acta Crystallogr. B—Struct. Sci. 38 1877–87[317] Nelmes R J, McMahon M I, Belmonte S A and Parise J B 1999 Phys. Rev. B 59 9048–52[318] Kobayashi H, Kamimura T, Alfe D, Sturhahn W, Zhao J Y and Alp E E 2004 Phys. Rev. Lett. 93 195503[319] Kobayashi H, Takeshita N, Mori N, Takahashi H and Kamimura T 2001 Phys. Rev. B 63 115203[320] Takele S and Hearne G R 1999 Phys. Rev. B 60 4401–3[321] Kobayashi H, Sato M, Kamimura T, Sakai M, Onodera H, Kuroda N and Yamaguchi Y 1997 J. Phys.: Condens.
Matter 9 515–27[322] Fei Y W, Li J, Bertka C M and Prewitt C T 2000 Am. Mineral. 85 1830–33[323] Fei Y W, Bertka C M and Finger L W 1997 Science 275 1621–3[324] Williams Q, Jeanloz R, Bass J, Svendsen B and Ahrens T J 1987 Science 236 181–2[325] Boehler R 1993 Nature 363 534–6[326] Alfe D, Gillan M J and Price G D 1999 Nature 401 462–4[327] Alfe D, Price G D and Gillan M J 2002 Phys. Rev. B 65 165118[328] Alfe D, Vocadlo L, Price G D and Gillan M J 2004 J. Phys.: Condens. Matter 16 S973–S982[329] Belonoshko A B, Ahuja R and Johansson B 2000 Phys. Rev. Lett. 84 3638–41[330] Laio A, Bernard S, Chiarotti G L, Scandolo S and Tosatti E 2000 Science 287 1027–30[331] Yoo C S, Holmes N C, Ross M, Webb D J and Pike C 1993 Phys. Rev. Lett. 70 3931–4[332] Koenig M et al 2004 Nucl. Fusion 44 S208–14[333] Luo S N and Ahrens T J 2003 Appl. Phys. Lett. 82 1836–8[334] Nguyen J H and Holmes N C 2004 Nature 427 339–42[335] Ahrens T J, Holland K G and Chen G Q 2002 Geophys. Res. Lett. 29 1150

Synchrotron facilities and study of the Earth’s interior 1859
[336] Sanloup C, Fiquet G, Gregoryanz E, Morard G and Mezouar M 2004 Geophys. Res. Lett. 31 L07604[337] Sanloup C, Guyot F, Gillet P, Fiquet G, Mezouar M and Martinez I 2000 Geophys. Res. Lett. 27 811–4[338] Balog P S, Secco R A, Rubie D C and Frost D J 2003 J. Geophys. Res. 108 2124[339] Dobson D P, Crichton W A, Vocadlo L, Jones A P, Wang Y B, Uchida T, Rivers M, Sutton S and Brodholt J P
2000 Am. Mineral. 85 1838–42[340] Rutter M D, Secco R A, Uchida T, Liu H J, Wang Y B, Rivers M L and Sutton S R 2002 Geophys. Res. Lett.
29 1217[341] Terasaki H, Kato T, Urakawa S, Funakoshi K, Suzuki A, Okada T, Maeda M, Sato J, Kubo T and Kasai S 2001
Earth Planet. Sci. Lett. 190 93–101[342] Urakawa S, Terasaki H, Funakoshi K, Kato T and Suzuki A 2001 Am. Mineral. 86 578–82[343] Terasaki H, Kato T, Urakawa S, Funakoshi K, Sato K, Suzuki A and Okada T 2002 Geophys. Res. Lett. 29 1227[344] Sanloup C, Guyot F, Gillet P, Fiquet G, Hemley R J, Mezouar M and Martinez I 2000 Europhys. Lett. 52 151–7[345] Alfe D, Kresse G and Gillan M J 2000 Phys. Rev. B 61 132–42[346] Sanloup C, Guyot F, Gillet P and Fei Y 2002 J. Geophys. Res. 107 2272[347] Lin J F, Santoro M, Struzhkin V V, Mao H K and Hemley R J 2004 Rev. Sci. Instrum. 75 3302–6[348] Mao W L, Mao H K, Yan C S, Shu J F, Hu J Z and Hemley R J 2003 Appl. Phys. Lett. 83 5190–2[349] Weir S T, Akella J, Aracne-Ruddle C, Vohra Y K and Catledge S A 2000 Appl. Phys. Lett. 77 3400–2[350] Xu J A, Mao H K, Hemley R J and Hines E 2004 Rev. Sci. Instrum. 75 1034–8[351] Ito E, Katsura T, Aizawa Y, Kawabe K, Yokoshi S, Kubo A, Nozawa A and Funakoshi K 2005 Advances in
High Pressure Technology for Geophysical Applications ed J Chen et al (Amsterdam: Elseveir)[352] Akaogi M 2000 Science 287 1602–3[353] Schubert G, Turcotte D L and Olson P 2001 Mantle Convection in the Earth and Planets (Cambridge: Cambridge
University Press) p 940[354] Shim S-H 2005 Structure, Composition and Evolution of the Earth’s Mantle ed R van der Hilst et al (Washington:
American Geophysical Union) at press[355] Uchida T, Funamori N, Ohtani T and Yagi T 1996 High Pressure Sci. Technol. ed W Trzeciakowski (Singapore:
World Scientific) pp 183–5[356] Meade C and Jeanloz R 1990 Nature 348 533–5[357] Merkel S, Wenk H R, Badro J, Montagnac G, Gillet P, Mao H-k and Hemley R J 2003 Earth Planet. Sci. Lett.
209 351–60[358] Dubrovinsky L S, Dubrovinskaia N A, Saxena S K, Rekhi S and LeBihan T 2000 J. Alloys Compounds 297
156–61[359] Mao H K, Shu J F, Shen G Y, Hemley R J, Li B S and Singh A K 1999 Nature 399 280