swr 3_10 1 amer
DESCRIPTION
JURNALTRANSCRIPT
75
Soil & Water Res., 5, 2010 (3): 75–87
Surface irrigation that has a lower efficiency than other methods is the oldest most widely used irrigation method in Egypt and the world over. Irrigation water generally infiltrates into the root zone during conveyance and recession of water at the soil surface. The inlet stream size should be adjusted to meet the intake characteristics of the soil, the slope, and the entire area to provide a nearly uniform time for water to infiltrate at all points along the length of the furrow, border, or basin. Three phenomena should be considered in the surface irrigation design: (1) the intake characteristics of the soil; (2) the rate of advance of the water front moving
along the furrow or strip;
(3) the rate of recession of water along the furrow or strip after the water delivery has been cut off.
The shape of water infiltrated to a depth depends on numerous factors, such as the variability of the soil, flow channel shape, type of irrigation (fur-row versus border strip), inflow rate, irrigation hydraulics, duration of the irrigation, and the field slope (Holzapfel et al. 1984; Blair & Smerdon 1988; Valiantzas et al. 2000).
The general surface irrigation process includes four phases: advance, storage, depletion, and recession (Holzapfel et al. 1984; Walker & Skogerboe 1987; Alazba 1999). When the inflow stream is introduced at the upstream end of the
Surface Irrigation Management in Relation to Water Infiltration and Distribution in Soils
Abdelmonem M. AMER1 and Kamal H. AMER2
1Department of Soil and Water Science; 2Department of Agricultural Engineering, Faculty of Agriculture, Menoufia University, Shebin El-Kom, Egypt
Abstract: Water infiltration and storage under surface irrigation are evaluated, based on the initial soil water content and inflow rate as well as on the irrigation parameters and efficiencies. For that purpose, a field experiment was con-ducted using fruitful grape grown in alluvial clay soil at Shebin El-Kom in 2008 grape season. To evaluate the water storage and distribution under partially wetted furrow irrigation in comparison to the traditional border irrigation as a control method, two irrigation treatments were applied. They are known as wet (WT) and dry (DT) treatments, at which water was applied when the available soil water (ASW) reached 65% and 50%, respectively. The coefficient of variation (CV) was 6.2 and 10.2% for WT and DT respectively under the furrow irrigation system as compared to 8.5% in border. Water was deeply percolated as 11.9 and 18.9% for wet and dry furrow treatments respectively, as compared with 11.1% for control with no deficit. The application efficiency achieved was 86.2% for wet furrow irrigation achieving a high grape yield (30.7 t/ha). The relation between the infiltration (cumulative depth, Z and rate, I) and opportunity time (t0) in minutes for WT and DT treatments was: ZWT = 0.528 t0
0.6, ZDT = 1.2 t00.501, IWT = 19 t0
–0.4, IDT = 36 t0–0.498.
Also, empirical power form equations were obtained for the measured advance and recession times along the furrow length during the irrigation stages of advance, storage, depletion, and recession.
Keywords: grape yield; infiltration parameters; irrigation evaluation; linear distribution; soil water storage; surface irrigation (furrow/border); water use efficiency

76
Soil & Water Res., 5, 2010 (3): 75–87
plane, water advances with a sharply defined wet-ting front down the slope toward the downstream end in what is referred to as the advance phase. This phase is characterised by down-field move-ment of the advancing water front and continues until the water reaches the downstream end of the field. After the water has advanced to the downstream end, it continues to accumulate in the field in the storage phase. In this phase, water covers the entire field and the inflow continues at the upstream end of the field. The storage phase ends, and the depletion phase begins when the inflow ceases. The depletion phase continues until the depth of the surface water at the upstream end is reduced to zero. This phase differs from the storage phase only by the absence of inflow into the field. The horizontal recession phase begins when the depth of the surface water at the upstream decreases to zero, marking the initia-tion of the water drying or recession front. This phase continues until no surface water remains on the field and the irrigation is complete. The time interval during which the infiltration of water into the soil can occur is bounded by the advance and recession functions and is defined as the infiltration opportunity time (Holzap-fel et al. 1984; Foroud et al. 1996; Rodriguiz 2003). The water flow, soil surface roughness, and infiltration rate affect the non-uniform and unsteady pattern of flow into the root zone along the furrow or border of surface irrigation. The water inflow is expressed by a continuity equation and an equation of motion (Cahoon et al. 1995). Wu (1971) studied individual inflows as water advance effects on water outflow. His derivations of the water infiltrated into soil along a furrow were based on the advance and storage stages of the surface irrigation interrelation with the soil infiltration rate.
Warrick (1983) examined six statistical dis-tributions of the depth of water infiltrated on surface irrigation. He found that the uniformity coefficient, UC as well as the lower quarter dis-tribution uniformity, DU are related analytically to the coefficient of variation CV by the general approximations:
UC = 1 – 0.8 CV and DU = 1 – 1.3 CV. The aim of this work was to determine if the fur-
row irrigation system could have irrigation water efficiency on the water storage and infiltration higher than the border method in alluvial clay soil with cultivated grape.
THEORY
Infiltrated water depth
The initial soil moisture content was measured before measuring the infiltration rate. The infiltra-tion rate of the soil was measured using the double ring method (Ankeny 1992) before the irrigation in more than one location along the furrow.
The soil infiltration rate (I) is an empirical power function (Rodriguiz 2003) describing the rate in cm/h as a function of the opportunity time in minutes and is expressed as:
I = k × to n – 1 (1)
where:I – infiltration rate (cm/h)to – opportunity time (min)k, n – empirical coefficients
The infiltration rate becomes constant when to nearly equals to 10 (1 – n), and then it is called the basic infiltration rate (Ic) which represents a steady state of the water flow in to the soil or saturated hydraulic conductivity (Ks) (Philip 1969; Amer 2001a, b).
The cumulative infiltrated depth as a function of the opportunity time can be derived by integrat-ing the right side of Eq. (1) with respect to the opportunity time and is expressed as:
kZ = –––– tn
o + b (2)
n
where:Z – cumulative infiltration depth (cm) n – empirical power coefficient which ranges from
0.8 to 0.2 for most soil types
The integrating constant b is the correction factor of the data at the first stage of infiltration:
Z1Z2 – Z23b = –––––––––––––
Z1 + Z2 – 2Z3
where:Z3 – estimated at t3 t3 = √ t1 √ t2Z1, Z2 – being measured at t1 and t2, respectively
The water advance and recession functions combine to define the infiltration opportunity time along the furrow or strip length as shown in Figure 1. The two functions can be defined as the

77
Soil & Water Res., 5, 2010 (3): 75–87
advance or recession times versus the distance ℓ along the furrow or strip and are formulated as empirical power equations (Elliot & Walker 1982; Walker & Skogerboe 1987; Scaloppi et al. 1995; Rodriguiz 2003) as follows:
tℓ = a ℓm (3)
tr = c ℓx (4)
where:tℓ – advance time (min)tr – recession time (min)ℓ – furrow or strip length (m)a, c, m, and x – empirical coefficients in the respective
equations
The water infiltration opportunity time along the furrow or strip length which is the difference between the last time when water disappeared and the first time when water started at the same point along the furrow or strip can be determined as follows:
to = T + tr – tℓ (5)
where to is the opportunity time in minutes when water totally infiltrated along the furrow or strip into the depth of the root zone and T is the total time of the advance, storage, and deple-tion (duration time that starts with water being turned on and ends when water at the upstream
end disappears) given in minutes as shown in Figure 1. When storage and depletion do not oc-cur, the total time T is taken from the water turn on to cut off.
The advance depth, Z, which is infiltrated during the advance time, can be formulated as follows:
kZℓ = –––– (T – tℓ)
n (6)
n
The storage depth, Zs, along the furrow which is infiltrated when water is cut off can be formu-lated as follows:
kZs = –––– (Toff – tℓ)
n (6)
n
The depletion, Zd, along the furrow which is infiltrated at the end of the depletion stage can be formulated as follows:
kZd = –––– (T – tℓ)
n (7)
n
Infiltrated water depth along irrigated field
The infiltrated water depth Z along the furrow can be formulated by incorporating Eq. (3) and (4) into Eq. (5), subsequently applying Eq. (2) as follows:
kZ = –––– (T + cℓx– aℓm)n (8)
n
Elap
sed
time
(min
)
Irrigated field length, (m)
Total time, TDepletion stage
t o =(
T +
t r -t
)
Opp
ortu
nity
tim
e
tR
tL
Storage stage
Figure 1. Infiltrated water depth by surface irrigation using water advance and recession

78
Soil & Water Res., 5, 2010 (3): 75–87
The infiltrated water depth along the furrow can be profiled using Eq. (8) as shown in Figu-re 2. The desired water depth d which the soil can keep in the root zone divides the area under the irrigation conditions into three divisions, i.e.: A1 represents the water stored in the root zone, A2 represents the water of deep seepage beyond the root zone, and A3 represents the water deficit in the root zone.
The deep seepage area, A2, can be formulated as follows:
Ld TA2 = kTn–1∫(––– + tr – tℓ) × dℓ – d × Ld (9)
0 n
Water usable by the plant area, A1, can be for-mulated as follows:
A1 = Z– × L – A2 (10)
The deficit area, A3, can be formulated as fol-lows:
A3 = L × d – A1 (11)
The infiltrated water depth Z can be formulated from Eq. (8) in a simple form by using binomial expansion and keeping only the first two terms without significant deference occurring as fol-lows:
k
1 TZ = –– ∑ Cn
p Tn–p(tr –tℓ)
p = kTn–1(–– + tr – tℓ) n p=0
n
(12)
where:C – combinationp – integral number of terms
The average infiltrated depth of the low quarter, can be derived as follows:
4kTn–1 L TZ- LQ = –––––––– ∫ (–– + tr – tℓ) × dℓ L 0.75L
n
T 4tR 4tLZ-
LQ = 4kTn–1 (–– +––––– [1 – 0.75x+1] – ––––– × n x + 1 m + 1
× [1 – 0.75m+1]) (13)
Irrigation efficiency
The percentage of the water deep seepage PDS defined as the ratio of the irrigation water drained beyond the root zone to the total water applied can be formulated as follows:
A2PDS = –––––––– (14) A1 + A2
The percentage of water deficit PD defined as the ratio of the water deficit to the water needed in the root zone can be formulated as follows:
A3PD = –––––––– (15) A1 + A3
Water uniformity for the surface irrigation profile can be determined by measuring the infiltrated water along the furrow or strip in systematic sta-tions. The uniformity coefficient as well as the distribution uniformity evaluates the design of the irrigation systems. Uniformity coefficient, UC as a parameter that shows how uniformly is water distributed along the furrow can be defined as follows:
Figure 2. Water distribution depth profile

79
Soil & Water Res., 5, 2010 (3): 75–87
∑|Z – Z|UC = 1 – ––––––––– (16) NZ
where,Z – water depth measured at each station (mm)Z– – mean of water depths measured at all locations
(mm)N – total number of locations
The distribution uniformity DU defined as the ratio of the average low quarter depth of water infiltrated Z
- LQ to the mean of water depths Z
-
along the strip can be expressed as: ZLQDU = ––––– (17) Z
The application and storage efficiencies evaluate the design of the system synchronising with the irrigation scheduling. The application efficiency Ea with no tail water runoff, defined as the ratio of infiltrated water stored in the root zone to the total water applied, can be expressed as:
A1Ea = –––––––– (18) A1 + A2
Storage efficiency ES defined as the ratio of the infiltrated water stored to the water needed in the root zone can be expressed as:
A1Es = –––––––– (19) A1 + A3
Irrigation evaluation using linear distribution
In practice, irrigation systems apply water with a degree of non-uniformity. If the irrigation
amount applied (d) is considered in between mini-mum and maximum depths of water distribution (Zmin ≤ d ≤ Zmax), then the area wetted by the ir-rigation system is divided into the surplus and deficit areas. Then, the situation is called to be under irrigation condition. When d ≥ Zmax, the whole area is deficiently irrigated. If d ≤ Zmin, the whole area is superfluously irrigated.
The schedule parameter α specifies the deviation of the schedule irrigation depth d to the average of the water distribution depth X– in terms of CV and is formulated as follows:
1 dα = –––– ( ––– – 1) (20)
CV Z
where:d – water depth expressing the plant water require-
mentZ– – mean water distribution depth applied
In the under irrigation condition, the relative schedule depth (1 + αCV) in Figure 3 intersected with the water distribution curve Z/Z
– shows both
the deep seepage area (AS) and the deficit area (AD) which define both the deep seepage (PDS) and deficit (PD) percentages, respectively.
The percentage of the area under the deep seep-age is defined as:
1.725 – αAs = –––––––––– (21) 3.45
The percentage of the area under deficit is de-fined as:
1.725 + αAD = –––––––––– (22) 3.45
Figure 3. Linear cumulative frequency curve with relative required depth (1+αCV) for CV = 0.3
(1+ CV) for CV=0.3
0
0.5
1
1.5
2
0 0.25 0.5 0.75 1Percent of area, P
1+
CV
)21(725.11/ PCVZZ
Deficit
Deep seepage
1+CV
As AD
Percent of area (P)
Deep seepageDeficit
0 0.25 0.5 0.75 1
Z/Z = 1 + 1.725CV(1 – 2P)
0.0
0.5
0.0
0.5
0.2
1 +
α C
V
1 +
α C
V
As Ap

80
Soil & Water Res., 5, 2010 (3): 75–87
In the under-irrigation condition, the deficit percentage is defined as the ratio of the water deficit to the water required in the root zone and is formulated using linear distribution of the water applied by the irrigation system and is determined as follows:
(1.725 + α)2 CVPD = ––––––––––––––– (23) 6.9 (1+ α CV)
Where CV is system’s coefficient of variation and α is schedule parameter.
The percent of deep seepage (PDS) in under-ir-rigation condition is described as follows:
(1.725 – α)2 CVPDS = ––––––––––––––– (24) 6.9
In complete over-irrigation, when PD equals zero and α ≤ –1.725, the over irrigated percentage is as follows:
dPDS = –α CV = 1 – –– (25) Z
In complete deficit, when PD equals zero α ≥ 1.725, the deficit fraction is as follows:
α CV ZPD = ––––––––– = 1 – ––– (26)
(1 + α CV) d
The application and storage efficiencies were used to evaluate the design of the system syn-chronising with the irrigation scheduling. The application efficiency (Ea) defined as the ratio of water stored in the root zone to the total water applied was calculated as follows:
Ea = 1 – PDS (27)
The storage efficiency (ES) defined as the ratio of the amount of water stored to the water needed in the root zone was calculated as follows:
Es = 1 – PD (28)
The distribution uniformity, DU, can be ex-pressed in linear distribution as follows:
DU = 1 – 1.27CV (29)
The uniformity coefficient, UC, can be expressed in linear distribution as follows:
UC = 1 – 0.798CV (30)
MATERIALS AND METHODS
The field experiment was conducted in alluvial soil cultivated with grape and continued during the growing season 2008 from 25 February to 11 July. The soil is located at Shebin El-Kom area in the Nile Delta (17.9 m a.s.l., 30°32’N, 31°03’E). The soil of the studied area was non-saline and non-alkali (ECe = 2 dS/m, SAR =7.5, and pH = 7.6), and the clay fraction in the surface depth was increased by 41%, in the subsurface depths. The soil particle size distribution in the soil pro-file was 46.5% clay, 33.8% silt, and 19.7% sand on average. The studied area was irrigated with the Nile water having EC = 0.65, SAR = 2.4, and pH = 8.2. The chemical and physical properties of the soil as well as of the irrigation water used in the study were determined according to Page (1982) and Klute (1986). As shown in Table 1, the volumetric soil water content at the field capac-ity was increased from 39.4% in the first twenty centimetres of the surface soil to 43.3% in the second twenty centimetres of the soil, decreas-ing to 38.9% in the soil depth from 80 to 100cm. The average volumetric soil content was almost 41.02% for one meter depth. The bulk density was 1.32 g/cm3 in the soil surface (0–30cm) and in the deep subsurface (80–100cm), but it decreased in the lower depths with an average of 1.29 g/cm3 for 1 m soil depth.
Table 1. Variation of volumetric soil water parameters and soil bulk density with soil depth
Soil depth (cm) Field capacity (%) Permanent wilting point (%) Bulk density (g/cm3)
0–20 39.40 20.10 1.32
20–40 43.30 20.30 1.26
40–60 42.50 18.64 1.29
60–80 41.00 18.60 1.30
80–100 38.90 18.60 1.32
Average 41.02 19.25 1.29

81
Soil & Water Res., 5, 2010 (3): 75–87
Experimental treatments
A randomised complete-blocks design with the irrigation types as the main block and two different techniques of irrigation scheduling as random treat-ments with the furrow irrigation compared with the border irrigation treatment was established as shown in Figure 4. There were three replicates in each treatment. The plot size was 54 × 15 m with 2.5 m row width and a 2 m spacing between the plants within rows. The plants were adequately watered using first the border irrigation. The irriga-tion water treatments were the wet and dry furrow treatments compared to the dry border treatment. In the wet treatment (WT) the irrigation water was applied when the available soil water (ASW) was reduced by 35% (i.e. ASW is almost 65%) in the soil profile, in which the measured gravimetric water content was 26.33% at the soil retention ψ = 1bar. In the dry furrow treatment (DT), water was applied when the soil water content reached almost 50% of the available soil water (23.9% gravimetric water content at soil potential ψ = 3.5bar). Only the dry treatment with two replicates was applied under the border irrigation as the control when ASW was below 50%, almost 22.6% soil water content by weight. The water distribution along the furrow was obtained mathematically and compared to the control treatment by border. Linear distribution was used to determine the deep seepage, water deficiency, storage efficiency, and application ef-ficiency.
Furrow irrigation design
The evaluation of the surface irrigation based on the measurements of the advance and reces-sion phases and an independent measurement of the soil infiltration is affected by the inlet flow, soil type, furrow slope, length, shape, time of ir-rigation cut off, and cultivated crop, all of which being the design parameters.
The furrow was 54 m in length and 0.7 m in width with blocked-ends. Figure 4 shows the shape of the furrow and the border experiment layout. The field slope was measured using a water level tube and recorded as 0.12%. The water advance and recession times were recorded at each 4.5 m along the furrow length for two different soil water contents. The soil water content along the furrow was measured for 1m soil depth in nine stations using soil samples taken by an augur. The water advance time was recorded for each 4.5 m length during the irrigation time. The total flow time T including the times of the water advance, storage, and depletion was recorded from the time of the water being turned on to the moment of its disap-pearing at the upstream end. The water recession time as the function of the furrow length was re-corded in an empirical equation. The inflow rate of 2.1m3/h was measured using the flow meter for the furrow treatments, and, of 7.5m2 /h per unit width for the border treatment. The collected data were used to find out the power equations as shown in Eqs. (3) and (4).
Figure 4. Experimental layout

82
Soil & Water Res., 5, 2010 (3): 75–87
The irrigation schedule depth (d) was determined using water balance as follows:
d = (θf – θi)D (31)
where: θf, θi – average volumetric water contents after and
before irrigation (m3/m3)D – wetted soil root depth (m)
The average width of the flow in the border was taken as 2.5 m, equal to the strip width. But the average width of the flow in the partially wetted furrow (w) was determined as follows:
QToffw = –––––– (32) ZL
where:w – average width of flow in the furrow (m)Q – furrow inflow rate (m3/h)Toff – water cutoff time (h)Z – average of the cumulative infiltrated depth (m)L – furrow length (m)
Crop yield
Grape yield was determined by evaluating the average yield per plant in kg and multiplying that by the number of plants in feddan (840 trees/feddan), where 1 feddan is equal to 4200 m2. The water use efficiency, WUE, was determined by dividing the grape yield in kg/feddan by the amount of water applied in m3/feddan.
RESULTS AND DISCUSSIONS
Infiltration functions
The field infiltration rates were obtained using the double ring infiltrometer as presented in the curves in Figure 5. The soils at the three locations were moderately dry on the surface, prior to the infiltration it was about 23.9% of the initial water moisture content by weight for the dry treatment. The initial soil moisture was 26.33% in the wet treatment when the soil infiltration was measured. The measured intake rates for the individual in-filtration runs were obtained at 2- to 10-minute intervals for the duplicate measurement locations at each of the three sites. The average points in the figure were taken from the duplicate meas-ured curves (different locations) at regular time intervals; the vertical bar at each point shows the difference between the duplicate curves at a given time. The precision of these measurements was excellent considering the reference soil variation between the measurement locations at a given site and the likelihood of errors in the infiltration measurements. The infiltration rate (I in cm/h) as fitted to Kostiakov equation was found in the experimental field. It was related to the opportunity time to in minutes for the studied alluvial clay soil as I = 36 to
–0.498 with r2 = 0.9881, and I = 19 to–0.4
with r2 = 0.966 for the dry and wet treatments respectively. The minimum value of 1.8 cm/h in-filtration rate (Ic) was found for both treatments
Figure 5. Field infiltration rate I and accumulated infiltrated depth for dry and wet treatments
i i ld i fil i d l d i fil d d h f d
I50%ASW = 36 to-0.498
I35%ASW = 19 to-0.4
Wet treatmentZ35%ASW = 0.528 to
0.6
Dry treatmentZ50%ASW = 1.2 to
0.502
0
4
8
12
16
20
24
28
32
0 40 80 120 160 200 240 280 320Time in min
I in
cm
/h a
nd Z
in c
m
r2 = 0.9881
r2 = 0.966
Time (min) 0 40 80 120 160 200 240 280 320
Dry treatment
I50%ASW = 36to– 0.498
Wet treatment
Z50%ASW = 1.2to0 .502
Z35%ASW = 0.528 to0 .6
r2 = 0.9881
I35%ASW = 19to– 0.4 r2 = 0.966
I in
cm/h
and
Z in
cm

83
Soil & Water Res., 5, 2010 (3): 75–87
and according to Kutilek and Nielsen (1994), the saturated hydraulic conductivity could be con-sidered as 0.667 × 1.8 = 1.2 cm/h. The cumulative infiltrated depth Z in cm was integrated from the infiltration rate function and reported as Z = 1.2 to
0.502 and Z = 0.528 to0.6, respectively, where Z is
given in cm and to in min
Water application under border irrigation
The border system that supplied water at the beginning of the grape growth was used to apply water in the dry treatment as the control treat-ment. The water infiltrated depth was determined from the water advance, recession, and infiltra-tion functions (r2 = 0.965). Empirical power form equations were obtained by regression for the measured advance data in the border strip with blocked-end yielding t = 0.1242 1.42 by apply-ing 7.5 m2/h inlet discharge per unit width and 44 min water cut off as shown in Table 2. While the horizontal water recession time was described as tr = 0.214 1.127. The total time T that included the advance, storage, and depletion phases was 54 min. The total advance time tL was recorded as 38 min. The total recession time tR was found
to be 75 min. The data of advance and recession times as well as infiltrated water depths in four stages are illustrated in Table 2.
The soil water intake was slightly infiltrated in the storage and depletion stages due to minimal of the storage and depletion times. On the contrary, soil water intake was largely infiltrated due to maximal advance and recession times. The aver-age infiltrated water depth along the border was 102 mm (428 m3/feddan) by applying 7.5 m2/h inlet discharge per unit width. Maximum infil-trated depth was 115.5mm which occurred at the down stream end. Minimum infiltrated depth was recorded as 88.9mm occurring at the upstream end. Seasonal irrigation water was averaged to 1711 m3/feddan (4074 m3/ha) as determined based on 5 irrigations by border including the water ap-plied in the first irrigation.
Water application by furrow irrigation
The furrow irrigation system was developed to supply water into grape farm using pipelines, thus reducing the wetted surface area in order to save water. The system applied water into the furrow width of 0.7 m nearby the plant roots. The partially
Table 2. Border infiltrated depths in four stages using water advance and recession
Length (m)
Advance time (min)
Recession time (min)
Infiltrated water depth (Z, mm) at the end stage of
advance storage depletion recession
0.0 0.0 54 74.5 80.2 88.9 88.9
4.5 1.2 57 73.3 79.1 87.9 90.4
9.0 3.0 61 71.5 77.4 86.4 92.1
13.5 4.7 66 69.7 75.8 84.9 94.7
18.0 6.5 73 67.8 74.0 83.3 98.7
22.5 9.0 77 65.1 71.5 81.1 99.8
27.0 12.0 83 61.6 68.4 78.4 102.0
31.5 16.0 90 56.6 63.9 74.5 104.1
36.0 19.6 99 51.8 59.7 70.9 107.9
40.5 25.5 106 42.6 51.9 64.5 108.6
45.0 30.0 112 34.1 45.1 59.2 109.6
49.5 33.8 120 24.7 38.5 54.3 112.4
54.0 38.0 129 0.0 29.5 48.3 115.5
Cutoff at 44 min average 53.3 62.7 74.1 102.0
84
Soil & Water Res., 5, 2010 (3): 75–87
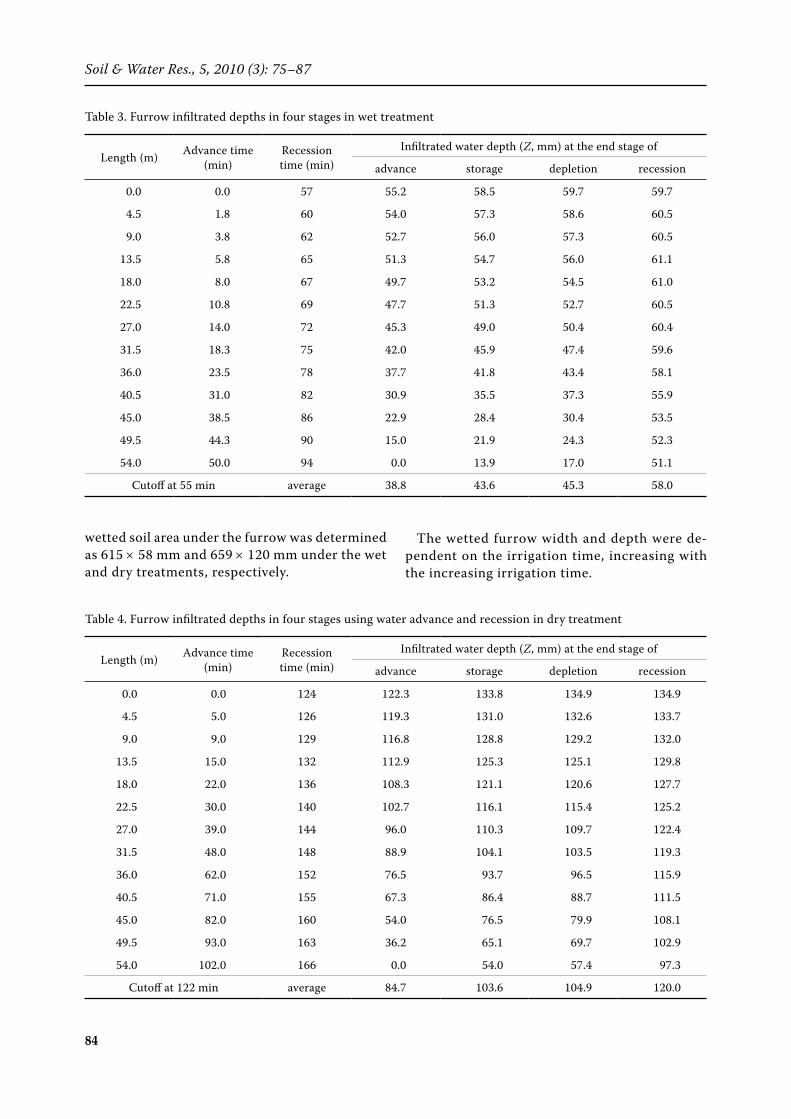
wetted soil area under the furrow was determined as 615 × 58 mm and 659 × 120 mm under the wet and dry treatments, respectively.
The wetted furrow width and depth were de-pendent on the irrigation time, increasing with the increasing irrigation time.
Table 3. Furrow infiltrated depths in four stages in wet treatment
Length (m) Advance time (min)
Recession time (min)
Infiltrated water depth (Z, mm) at the end stage of
advance storage depletion recession
0.0 0.0 57 55.2 58.5 59.7 59.7
4.5 1.8 60 54.0 57.3 58.6 60.5
9.0 3.8 62 52.7 56.0 57.3 60.5
13.5 5.8 65 51.3 54.7 56.0 61.1
18.0 8.0 67 49.7 53.2 54.5 61.0
22.5 10.8 69 47.7 51.3 52.7 60.5
27.0 14.0 72 45.3 49.0 50.4 60.4
31.5 18.3 75 42.0 45.9 47.4 59.6
36.0 23.5 78 37.7 41.8 43.4 58.1
40.5 31.0 82 30.9 35.5 37.3 55.9
45.0 38.5 86 22.9 28.4 30.4 53.5
49.5 44.3 90 15.0 21.9 24.3 52.3
54.0 50.0 94 0.0 13.9 17.0 51.1
Cutoff at 55 min average 38.8 43.6 45.3 58.0
Table 4. Furrow infiltrated depths in four stages using water advance and recession in dry treatment
Length (m) Advance time (min)
Recession time (min)
Infiltrated water depth (Z, mm) at the end stage of
advance storage depletion recession
0.0 0.0 124 122.3 133.8 134.9 134.9
4.5 5.0 126 119.3 131.0 132.6 133.7
9.0 9.0 129 116.8 128.8 129.2 132.0
13.5 15.0 132 112.9 125.3 125.1 129.8
18.0 22.0 136 108.3 121.1 120.6 127.7
22.5 30.0 140 102.7 116.1 115.4 125.2
27.0 39.0 144 96.0 110.3 109.7 122.4
31.5 48.0 148 88.9 104.1 103.5 119.3
36.0 62.0 152 76.5 93.7 96.5 115.9
40.5 71.0 155 67.3 86.4 88.7 111.5
45.0 82.0 160 54.0 76.5 79.9 108.1
49.5 93.0 163 36.2 65.1 69.7 102.9
54.0 102.0 166 0.0 54.0 57.4 97.3
Cutoff at 122 min average 84.7 103.6 104.9 120.0

85
Soil & Water Res., 5, 2010 (3): 75–87
Wet treatmentTable 3 shows the water advance and recession
times in the wet furrow treatments. The empirical power form equations were obtained by regression of the measured advance data for the furrow with blocked-end yielding t = 0.181 1.4 by applying 2.1 m3/h inlet discharge. While the horizontal water recession time was described as tr = 0.47 1.2 by applying 2.1 m3/h and 55 min water cut off. The total time T that included the advance, stor-age, and depletion phases was 57 min. The total advance time tL was recorded as 50 min. The total recession time tR was found to be 37 min. It was evident that the soil water intake slightly infiltrated with the ascendency in the recession, storage, and depletion stages due to its minimal time. Revers-ibly, the soil water intake was largely infiltrated due to maximal advance time. The infiltrated water depth along the furrow was 58 mm on av-erage by applying 2.1 m3/h inlet discharge. The amount of the water applied was 59.8 m3/feddan per irrigation. Maximum infiltrated depth was 59.7 mm, occurring at the upstream end. Minimum infiltrated depth was recorded as 51.1 mm, occur-ring at the downstream end. The total amount of the water irrigation was seasonally averaged as
1086 m3/feddan (2585 m3/ha) based on 11 irriga-tions for the Wet treatment plus the first irrigation (428 m3/feddan) using the border irrigation.
Dry treatment
Table 4 shows the water advance and recession infiltrated depths in the Dry furrow treatment. Empirical power was found for the water advance for Dry furrow with blocked-end yielding t = 0.62 1.28 by applying 2.1 m3/h inlet discharge. While the horizontal water recession time was described as tr = 0.343 1.22. The total time T that included the advance, storage, and depletion phases was 124 min. The total advance time tL was recorded as 102 min. The total recession time tR was found to be 42 min.
It was noticed that the soil water intake slightly infiltrated ascendant in the storage and depletion stages due to its minimal times. On the contrary, soil water intake largely infiltrated due to maximal advance and recession times. The average infil-trated water depth along the furrow was 120 mm by applying 2.1 m3/h inflow rate for the dry furrow. The amount of the water applied was 132.8 m3/fed-dan per irrigation. Maximum infiltrated depth was 134.9 mm occurring at the upstream end. Mini-
Table 5. Irrigation system evaluation
ParametersFurrow irrigation Border irrigation
WT DT DT
Average infiltrated depth (Z) (mm) 58 120 100
Irrigation schedule depth (d) (mm) 51.1 97.3 88.9
Average width of flow (w) (m) 0.615 0.659 2.5
CV (%) 6.2 10.2 8.5
Uniformity coefficient (UC) (%) 95.1 91.9 93.2
Distribution uniformity (DU) (%) 92.1 87.0 89.2
Schedule parameter (α) –1.9 –1.9 –1.3
Deep seepage percentage (PDS) (%) 11.9 18.9 11.1
Water deficit percentage (PD) (%) 0.0 0.0 0.0
Application efficiency (Ea) (%) 88.1 81.1 88.9
Storage efficiency (Es) (%) 100 100 94.5
Water applied (m3/feddan) 1 086 1 092 1 711
Yield (t/feddan) 12.9 10.8 9.3
Water use efficiency (WUE) (kg/m3) 11.9 9.9 5.4
CV – coefficient of variation

86
Soil & Water Res., 5, 2010 (3): 75–87
mum infiltrated depth was recorded as 99.2 mm occurring at the downstream end. The amount of the irrigation water was seasonally averaged at 1 092 m3/feddan (2 585 m3/ha) as determined based on 5 irrigations by dry furrow plus the water amount in the first irrigation.
Irrigation evaluation and grape yield
The coefficient of variation was determined for the furrow and border treatments and illustrated in Table 5. The coefficient of variation was 6.2 and 10.2% for the wet and dry treatments of the furrow systems, respectively. It was 8.5% by ap-plying water under border system.
The schedule parameter α was determined us-ing statistical model based on Eq. (20) as shown in Table 5. The schedule parameter (α) was –1.9 with the furrow treatments and –1.3 with the border irrigation. The irrigated area received only the surplus of water along the furrow length. For that reason, the irrigated area did not have any water deficit and water was deeply percolated as 11.9 and 18.9 % for the Wet and Dry treatments in the furrow irrigation, respectively. It was 11.1% in the border irrigation due to irrigating when ASW was below 50% (initial soil moisture was 22.6% by weight). The wet furrow irrigation treatment achieved 86.2% application efficiency and100% storage efficiency. The grape yield achieved was as high as 12.9 ton/feddan by applying the wet furrow treatment, due to a higher water use ef-ficiency (WUE), 12.1 kg/m3, than that under the border irrigation.
CONCLUSION
The main goal of the work was to study the effect of using the furrow irrigation system as compared with the border method on the infiltration, distri-bution, and storage of water in agricultural fields. For that purpose, a field study was conducted at Shibin El-Kom in grape farm from 25 February to 11 July 2008 season. The field is a clay alluvial soil, irrigated using partially wetted furrow irrigation with blocked-end 54 m long and 0.8 m wide with 0.1% slope compared with the border of 2 m width. Two different irrigation scheduling techniques with 2.1 m3/h inflow rate (dry and wet treatments) were applied based on supplying water in the field
when the soil water content was in between 23 to 24% by weight (DT) and 26.4 to 27.2% by weight (WT). In the border irrigation system only the dry treatment was used consisting of two replicates with 7.5 m2/h inflow rates per unit width. The results showed that the average infiltrated water depth along the furrow was 58 and 120 mm by applying the wet and dry treatments, respectively. The seasonal amount of water used in the furrow irrigation was 1062 and 1092 m3/feddan with the wet and dry treatments, respectively, compared with 1283 m3/feddan under the border irrigation. The coefficient of variation (CV) was recorded as 6.2% and 10.2% respectively for the wet and dry furrows with the schedule parameter α = –1.9 in comparison with CV = 8.5% and α = –1.3 for the border irrigation. The irrigated area did not have any water deficit under any treatment but water was deeply percolated as 11.9 and 18.9% in the wet and dry furrow treatments, and 11.1% in border irrigation.
The results demonstrated that the short ir-rigation interval using furrow irrigation with a small amount of water (wet treatment) was better than a long interval with a large amount of water per irrigation (dry treatment). The wet treat-ment achieved 11.9 kg/m3 water use efficiency (WUE) and 88.1% application efficiency (Ea) compared with 9.9 kg/m3 WUE and 81.1% Ea in the dry treatment. Grape yield has been achieved a high value of 12.9 t/feddan with the wet fur-row, and decreased to 10.8 t/feddan in the dry furrow due to the increasing irrigation interval, being insignificantly affected by the increasing amount of water per irrigation. Regarding the border irrigation, the grape yield was decreased to 9.3 t/feddan, WUE to 5.4 kg/m3, and storage efficiency to 94.5%.
R e f e r e n c e s
Alazba A.A. (1999): Dimensionless advance curves for infiltration families. Agricultural Water Management, 41: 115–131.
Amer A.M. (2001a): Drainable and water-filled pores as related to water storage and conductivity in agricul-tural soils of the Nile Delta. In: Proc. 28th SIL Congress, February 4–10, Monash University, Melbourne.
Amer A.M. (2001b): Soil Water Movement and Irriga-tion Requirements. 1st Ed. El-Dar Al-Arabia for Publ. & Dist., Cairo. (in Arabic)

87
Soil & Water Res., 5, 2010 (3): 75–87
Ankeny M.D. (1992): Methods and theory for uncon-fined infiltration measurements. In: Topp G.C. et al. (ed.): Advances in Measurement of Soil Physical Prop-erties: Bringing Theory into Practice. SSSA Special Publication No. 30. SSSA, Madison, 123–141.
Blair A.W., Smerdon E.T. (1988): Unimodal surface irrigation efficiency. Journal of Irrigation and Drainage Engineering-ASCE, 114: 156–167.
Cahoon J.E., Mandel P.A., Eisenhauer D.E. (1995): Management recommendations for sloping blocked-end furrow irrigation. Applied Engineering in Agri-culture, ASAE, 11: 527–533.
Elliot R.L., Walker W.R. (1982): Field evaluation of furrow infiltration and advance functions. Transac-tions of the ASAE, 15: 369–400.
Foroud N., George E.S., Entz T. (1996): Determination of infiltration rate from border irrigation advance and recession trajectories. Agricultural Water Manage-ment, 30: 133–142.
Holzapfel E.A., Marino M.A., Morales J.C. (1984): Comparison and selection of furrow irrigation models. Agricultural Water Management, 9: 105–125.
Klute A. (1986): Method of Soil Analysis. Part I: Physi-cal and Minerological Methods. 2nd Ed. Soc. Agron. Inc. Pub., Madison.
Kutílek M., Nielsen D.R. (1994): Soil Hydrology. Cat-ena Verlag, Cremlingen-Destedt.
Page A.J. (1982): Method of Soil Analysis. Part II: Chemi-cal and Microbiological Properties. 2nd Ed. Soc. Agron. Inc. Pub., Madison.
Philip J.R. (1969): Theory of infiltration. Advances in Hydroscience, 5: 215–305.
Rodriguez J.A. (2003): Estimation of advance and in-filtration equations in furrow irrigation for untested discharges. Agricultural Water Management, 60: 227–239.
Scaloppi E.J., Merkley G.P., Willardson L.S. (1995): Intake parameters from advance and wetting phases of surface irrigation. Journal of Irrigation and Drainage Engineering-ASCE, 121: 57–70.
Valiantzas J.D., Aggelides S., Sassalou A. (2000): Furrow infiltration estimation from time to a single advance point. Agricultural Water Management, 52: 17–32.
Walker W.R., Skogerboe G.V. (1987): Surface Irriga-tion: Theory and Practice. Prentice-Hall, Englewood Cliffs.
Warrick A.W. (1983): Interrelationship of irrigation uniformity terms. Journal of Irrigation and Drainage Engineering-ASCE, 109: 317–331.
Wu I.P. (1971): Overland flow hydrograph analysis to determine infiltration function. Transactions of the ASAE, 14: 294–300.
Received for publication December 8, 2009Accepted after corrections March 24, 2010
Corresponding author:
Prof. Abdelmonem M. Amer, Ph.D., Menoufia University, Faculty of Agriculture, Department of Soil and Water Science, Shebin El-Kom, Egypte-mail: [email protected]