switzerland-born - home - victorian multicultural … geographic distribution of switzerland-born in...
TRANSCRIPT

Victorian Community Profiles: 2006 Census
Switzerland-Born

Switzerland-Born
CONTENTS
Message from the Chairperson iii
Notes on the data iv
Table Page
1 Distribution within Australia of Switzerland-born: 2006 and 2001 Census …………………………………………………………………1
2 Number of Switzerland-born by Top Ten Local Government Areas and their Major Suburbs, Victoria: 2006 ……………. 2
3 Number of Switzerland-born by Top Twenty Local Government Areas, Victoria: 2006 and 2001 Census ……………….. 4
4 Year of Arrival of Switzerland-born and Total Victorian Overseas-born: 2006 ………………………………………………. 5
5 Year of Arrival by Top Ten Local Government Areas, Switzerland-born, Victoria: 2006 …………………………………………….6
6 Total Persons Identified with Swiss Ancestry in Victoria by Top Ten Local Government Areas: 2006 ………….. 7
7 Birthplaces (Top Ten plus Australia) of Persons of Swiss Ancestry in Victoria: 2006 ……………………………………………8
8 Age and Gender of Switzerland-born and the Total Victorian Population: 2006 ………………………………………………………………9
9 Languages Spoken at Home (Top 10) by Gender, Switzerland-born and the Total Victorian Population: 2006 ………………………………………………….12
10 Languages Spoken at Home (Top 3) by Top Ten Local Government Areas, Switzerland-born, Victoria: 2006 ……. 13
11 Proficiency in Spoken English by Gender, Switzerland-born, Victoria: 2006 ……………………………………………………………14
12 Proficiency in Spoken English by Top 10 Ranked Local Government Areas, Switzerland-born, Victoria: 2006 ………………..15
13 Religious Affiliation (Top Ten) by Gender, Switzerland-born and the Total Victorian Population: 2006 …………………………………….16
14 Religious Affiliation (Top Three) by Top Ten Local Government Areas, Switzerland-born, Victoria: 2006 …………………………………….17
15 Type of Internet Connection by Gender, Switzerland-born and the Total Victorian Population: 2006 ………………………18
16 Highest Level of Educational Attainment by Gender, Switzerland-born & Total Victorian Population: 2006 ………. 19
17 Highest Level of Educational Attainment by Top 10 Local Government Area, Switzerland-born, Victoria: 2006 ……………….20
18 Labour Force Participation by Gender, Switzerland-born and the Total Victorian Population: 2006 ………………………...21
19 Labour Force Participation by Top Ten Local Government Area, Switzerland-born, Victoria: 2006 ………………………..22
20 Occupation by Gender, Switzerland-born and the Total Victorian Population: 2006 ………………………………………………..23
21 Occupation by Top Ten Local Government Areas, Switzerland-born, Victoria: 2006 ………………………………………. 24
22 Industry of Employment by Gender, Switzerland-born and the Total Victorian Population: 2006 …………………………. 25
23 Industry of Employment by Top Ten Local Government Area, Switzerland-born, Victoria: 2006 ……………………………………………….26
24 Weekly Individual Income by Gender, Switzerland-born and the Total Victorian Population: 2006 …………………………………………………..27
25 Weekly Individual Income by Top Ten Local Government Area, Switzerland-born, Victoria: 2006 …………………………………………………28
26 Housing Tenure Type by Gender, Switzerland-born and the Total Victorian Population: 2006 ……………………………………………….29
27 Housing Tenure Type by Top Ten Local Government Areas, Switzerland-born, Victoria: 2006 …………………………………………30
28 Family Composition by Gender, Switzerland-born and the Total Victorian Population: 2006 ………………………………………………31
29 Citizenship by Gender, Switzerland-born and the Total Victorian Population: 2006 ………………………………………………………….32
30 Citizenship by Top Ten Local Government Area, Switzerland-born, Victoria: 2006 …………………………………………………33
(continued)
i
Victorian Community Profiles: 2006 Census

Switzerland-Born
(continued)
Figure Page
1 Geographic Distribution of Switzerland-born in Metropolitan Local Government Areas, Victoria: 2006 ………………………………………….3
2 Age and Gender Distribution of Switzerland-born and of the Total Victorian Population: 2001, 2006 …………………………………………..10
(including tables on age, single year, and sex distribution, persons and percentage)
3 Map of Metropolitan Melbourne Local Government Areas ………………………………………………………………………..34
4 Map of Regional Victoria Local Government Areas …………………………………………………………………….. 35
Published by
Victorian Multicultural Commission
GPO Box 2392
Melbourne VIC 3001
Copies of the Community Profiles may be downloaded from the Victorian Multicultural Commission website,
www.multicultural.vic.gov.au
© Copyright State of Victoria 2007
This work is copyright. No part of it may be reproduced by any process except in accordance with
the provisions of the Copyright Act 1968.
Disclaimer
This document has been prepared from data supplied by the Australian Bureau of Statistics only for
the purpose of disseminating information for the benefit of the public. The State of Victoria accepts no
liability for the accuracy, reliability, currency or completeness of the information nor its use or the
reliance placed upon it.
ii
Victorian Community Profiles: 2006 Census
Switzerland-Born
iii
Message from Chairperson, Victorian Multicultural Commission
The valuable knowledge and skills of Victoria's immigrants have helped to broaden our understanding of the world and have made Victoria the cosmopolitan and vibrant state it is today.
At the 2006 Census, Victorians were born in over 200 countries, spoke over 200 languages and dialects, followed more than 130 religions and were identified with over 200 ancestries; 43.8 per cent of Victorians were either born overseas or have at least one parent born overseas.
I am pleased to introduce the Victorian Community Profiles Series: 2006 Census, for the top 74 overseas birthplace groups or communities in Victoria. Each profile consists of a series of 30 tables providing a range of socio-economic and demographic data compared across Local Government Areas. The Community Profiles complement our recent publication on Population Diversity in Local Councils in Victoria: 2006 Census. These publications assist in the development of policies and in the planning and delivery of culturally appropriate and accessible services based on information about the size, geographic location, demographic and socio-economic characteristics of our diverse communities. We are committed to improving access and equity and ensuring that government policies and strategies are responsive to all Victorians. This includes strengthening rural, regional and urban communities and planning for the needs of our changing population at all stages of life. The production of the Community Profiles series, the enactment of the Racial and Religious Tolerance Act 2001, the Multicultural Victoria Act 2004 and the Whole-of-Government approach to Multicultural Affairs are reflective of the Government's vision for Victoria, one that is a vibrant society that embraces diversity and welcomes the full participation of all of its members.
George Lekakis Chairperson
Victorian Community Profiles: 2006 Census

Switzerland-Born
iv
NOTES ON THE DATA The following notes relate to the Birthplace community profiles, and detail some important considerations regarding the classifications used and comparability issues between censuses. For more general information about what is collected in the Census, and the meaning of various categories, please see Australian Bureau of Statistics (ABS) Census Dictionary, 2006 (Cat no. 2901.0) on the ABS Website www.abs.gov.au. Terminology Note that in the descriptions below, “nfd” stands for “Not Further Defined”, and “nec” stands for “Not Elsewhere Classified”. Birthplace Groups All birthplace groups are defined as per the “Country of Birth of Individual” classification in the Census Dictionary, with the exception that: The 2006 birthplace classification was changed to include Serbia and Montenegro as separate states to recognize the official split which occurred in June 2006. This means that while data are available for these countries separately in 2006, it is necessary to combine the two to provide any meaningful information for time series comparisons. In addition, a number of respondents to the Census continue to state their birthplace as “Yugoslavia”. Since this nation did not exist in 2006, a large number of people had their birthplace coded to the category “South Eastern Europe, not further defined”. It is expected that most of the persons in this group were born in the former Republic of Yugoslavia, but some other responses were also coded to the group. As a best match, this category has been combined along with Serbia and Montenegro to form the birthplace “Former Yugoslavia”, enabling time series statistics to be produced. In summary:
- ‘Former Yugoslavia’ in 2006 includes “Serbia”, “Montenegro” and “South Eastern Europe not further defined”;
- ‘Former Yugoslavia’ in 2001 includes “Yugoslavia, Federal Republic of”, and “South Eastern Europe nfd”; and
- ‘Former Yugoslavia’ in 1996 includes “Former Yugoslav Republic of Serbia & Montenegro” and “Former Yugoslavia nfd”.
These categories are not completely comparable but they are the closest to comparability due to the changes to country names and classification in the former Yugoslavia. Confidentiality and Introduced Random Error The ABS takes steps to ensure that no data on individuals can be identified using a cross-classified table. ABS is required by the Census and Statistics Act, 1905 to protect confidentiality. For this reason, tables are “Perturbed” by the introduction of small random errors. These errors are statistically insignificant, but users may notice that populations for particular groups vary slightly between tables due to this practice. For more information on confidentiality and introduced random error, refer to the Census Dictionary.
Victorian Community Profiles: 2006 Census
Switzerland-Born
v
Local Government Areas Local Government Areas are assumed to be identical in geographic extent between 2001 and 2006. There have been some minor boundary changes, but the population impact of these is negligible. The only exception is Delatite (S) which existed in 2001. For 2006 it was split into Mansfield (S) and Benalla (RC). These two councils have been recombined for tables containing time series (eg. Tables 2 and 3 in the Community Profiles) to afford a comparison between the two years. For tables not containing time series, they are treated as separate entries. Delatite does not feature in the top 20 LGAs for any birthplace group, so the impact on data is negligible. Local Government Area Rankings For tables sorted by the top 10 Local Government Areas (LGAs) for a particular birthplace, the rankings are based on the true table population for that birthplace, derived from the non cross-classified table in Table 3 on the number of birthplace-born by top twenty LGAs. The ranking of LGAs is preserved throughout the profile for each birthplace to provide consistency for the reader. As LGA rankings are based on the size of the total population of a particular birthplace group, for tables based on smaller sub-populations, eg. persons aged 15+ (Tables 17, 25 and 27) or employed persons (Tables 21 and 23), the table population for the ranked LGAs may not appear in strictly descending order. For instance, an LGA with 5,000 China-born will rank above an LGA with 4,000 China-born, but it is quite possible (probably due to age structure of the population) for the LGA containing 5,000 to only have, say 2,000 employed while the LGA of 4,000 China-born has 2,500 employed. Rankings are preserved throughout the profile based on the order in Table 3. In addition, even for tables based on the same population, LGA ranks may appear slightly out of order due to data perturbation to protect confidentiality in cross-classified tables (see above). LGA totals in other tables may differ slightly from those in Table 3. In these cases, the total table population for a particular LGA may appear slightly lower than for a lower-ranked LGA in the same table. This will only occur where population numbers in the two LGAs are very close to begin with, and the effect is not statistically significant. Ancestry All ancestry groups are defined as per the Census dictionary, with the exception that some ancestry groups have been combined to form a single ancestry category. This has generally occurred where there are multiple ancestries associated with a particular country (eg. New Zealand ancestry includes New Zealand and Maori). There are 8 birthplace groups where multiple ancestries have been combined. They are New Zealand, India, Canada, USA, Laos, Sri Lanka, Indonesia and Pakistan. Note that for the Community Profiles, ancestry counts Total Responses of a particular ancestry. This means that for those ancestry groups consisting of more than one component ancestry (see above), some people may be double-counted. For example, responses of “Indian”, “Anglo-Indian”, and “Gujerati” are all included under the ancestry group “Indian”. If a person responded with “Indian” as their first response, and “Gujerati” as their second, they would be counted twice in this table. This effect is expected to be minimal, and will not affect the statistical validity of the table.
Victorian Community Profiles: 2006 Census

Switzerland-Born
vi
Language Languages defined are based on the ABS Australian Standard Classification of Languages (ASCL), 1997 (Cat no. 1267.0). For the community profiles, the language tables do not have a time series component, so all languages are based on the complete set used in the ASCL in 2006. As the languages identified for the community profiles are derived from raw data tables featuring the top 100 languages spoken at home in Victoria, for some birthplace groups, languages in their top 10 will include languages outside the top 100 in Victoria. Because these were not included separately in the raw data tables, they cannot be shown in the language table in question, but will be included in “Other Languages”. Hence the “top 10” is not necessarily a complete top 10 for every birthplace group. For Table 9 on Languages Spoken at Home, where there are less than 10 languages with speakers for a particular birthplace, some lines in the table may be blank. Note that due to the “Other languages” issue above, in this case there may still be some residual population in the “Other languages” row. Religion Religions are based on the ABS Australian Standard Classification of Religious Groups (ASCRG), 2005. (Cat no. 1266.0) For the community profiles, the religion tables do not have a time series component, so all religions are based on the complete set used in the ASCRG in 2006. For Table 13 on Religious Affiliation, where there are less than 10 religions represented in the population numbers for a particular birthplace group, some lines in the table may be left blank. Proficiency in English Note that this is a self-assessment by the respondent. Labour Force Status Tables 18 and 19 relate to Labour Force Status. Labour force status applies only to persons aged 15 years and over. The ‘Not Applicable’ category counts all persons aged less than 15 years. Note that the unemployment rate derived from the Census is not identical to that derived from ABS’s Monthly Population Survey. There are various differences in scope and collection methodology as explained on the ABS website. Industry Tables 22 and 23 relate to industry of employed persons only. Industry is coded using the new ABS Australian and New Zealand Industrial Classification (ANZSIC), 2006 edition (Cat no. 1292.0). There are 19 industry divisions in this classification. Some of these divisions have been combined to provide a more succinct table structure:
• Agriculture, Forestry and Fishing have been combined with Mining;
• Wholesale Trade and Retail Trade have been combined;
• Finance & Insurance has been combined with Rental, Hiring and Real Estate in Table 23 only;
• Professional, Scientific and Technical Services have been combined with Administrative and Support Services;
• Education and Training has been combined with Health Care & Social Assistance for Table 23 only; and
• Arts & Recreation Services has been combined with Other Services.
Victorian Community Profiles: 2006 Census

Switzerland-Born
vii
For more information on industry coding, refer to the ANZSIC. Occupation Tables 20 and 21 relate to the occupation of employed persons only. Occupation data are coded using the Australian and New Zealand Standard Classification of Occupations (ANZSCO) (Cat no 1221.0), and relate to the occupation of employed persons only. There are 8 ANZSCO major groups.
Victorian Community Profiles: 2006 Census

Switzerland-Born
Table 1
Distribution within Australia of Switzerland-born: 2006 and 2001 Census
2001-2006 2006 2001 2001-2006
Persons
%
of total Persons
%
of total % change
%
of total
%
of total
%
change
New South Wales 3,571 31.7 3,572 33.2 -0.0 35.2 36.0 5.6
Sydney 2,591 23.0 2,673 24.9 -3.1 29.6 30.1 6.0
Rest of State 980 8.7 899 8.4 9.0 5.6 5.9 3.2
Queensland 2,604 23.1 2,275 21.2 14.5 15.8 14.7 16.0
Brisbane 986 8.8 813 7.6 21.3 8.7 8.2 13.4
Rest of State 1,618 14.4 1,462 13.6 10.7 7.2 6.5 19.4
Victoria 2,204 19.6 2,159 20.1 2.1 26.6 26.5 8.0
Melbourne 1,792 15.9 1,799 16.7 -0.4 23.5 23.4 8.4
Rest of State 412 3.7 360 3.3 14.4 3.1 3.1 4.9
Western Australia 1,695 15.1 1,532 14.2 10.6 12.0 12.1 7.4
Perth 1,380 12.3 1,235 11.5 11.7 10.3 10.3 7.3
Rest of State 315 2.8 297 2.8 6.1 1.8 1.8 7.8
South Australia 516 4.6 535 5.0 -3.6 7.0 7.3 2.9
Adelaide 410 3.6 434 4.0 -5.5 5.9 6.2 3.2
Rest of State 106 0.9 101 0.9 5.0 1.0 1.1 1.5
Australian Capital Territory 265 2.4 245 2.3 8.2 1.6 1.6 5.0
Canberra 265 2.4 242 2.3 9.5 1.6 1.6 5.0
Rest of Territory 0 0.0 3 0.0 -100.0 0.0 0.0 10.1
Tasmania 257 2.3 240 2.2 7.1 1.1 1.1 9.7
Hobart 142 1.3 133 1.2 6.8 0.5 0.5 7.3
Rest of State 115 1.0 107 1.0 7.5 0.6 0.6 11.9
Northern Territory 149 1.3 197 1.8 -24.4 0.6 0.7 -1.6
Darwin 90 0.8 124 1.2 -27.4 0.4 0.5 1.5
Rest of Territory 59 0.5 73 0.7 -19.2 0.2 0.2 -9.0
Australia 11,261 100.0 10,755 100.0 4.7 100.0 100.0 7.8
All capital cities 7,656 68.0 7,453 69.3 2.7 80.5 80.8 7.4
Rest of country 3,605 32.0 3,302 30.7 9.2 19.5 19.2 9.4
(a) Australia includes Jervis Bay Territory, Christmas Island and Cocos (Keeling) Islands.
Rest of State or Territory categories include 'no usual address', 'migratory and off-shore' and 'undefined [State/Territory]'.
1
State or Territory/Capital city/
Rest of State or Territory(a)
Switzerland-born Overseas-born
2006 2001
Victorian Community Profiles: 2006 Census

Switzerland-Born
Table 2
Number of Switzerland-born by Top Ten Local Government Areas and their Major Suburbs, Victoria: 2006
Rank
in 2006
Rank
in 2001 Local Government Area Major Suburbs
1 2 Yarra Ranges (S)
2 1 Boroondara (C)
3 3 Monash (C)
4 4 Knox (C)
5 6 Bayside (C)
6 13 Port Phillip (C)
7 8 Kingston (C)
8 7 Whitehorse (C)
9 5 Glen Eira (C)
10 11 Stonnington (C)
2
Caulfield, Caulfield South, Carnegie, Murrumbeena, Ormond, Bentleigh,
Elsternwick
South Yarra, Toorak, Prahran, Malvern, Glen Iris, Malvern East, Armadale,
Windsor
Moorabbin, Mordialloc, Cheltenham, Mentone, Dingley, Clayton South,
Aspendale, Edithvale, Chelsea
Box Hill, Blackburn, Nunawading, Forest Hill, Burwood, Burwood East,
Mitcham, Vermont, Vermont South
Brighton, Sandringham, Beaumaris, Black Rock, Hampton, Highett
St Kilda, Elwood, Balaclava, Albert Park, Middle Park, Port Melbourne, South
Melbourne, St Kilda Road
Glen Waverley, Mt Waverley, Ashwood, Wheelers Hill, Mulgrave, Clayton,
Oakleigh
Boronia, Bayswater, Ferntree Gully, Wantirna, Wantirna South, Knoxfield,
Scoresby, Rowville
Lilydale, Mooroolbark, Montrose, Olinda, Sassafras, Upwey, Tecoma,
Belgrave, Selby, Monbulk, Wandin, Seville, Woori Yallock, Warburton
Camberwell, Hawthorn, Kew, Canterbury, Ashburton, Balwyn
Victorian Community Profiles: 2006 Census

Switzerland-Born
Figure 1
Geographic Distribution of Switzerland-born in
Metropolitan Local Government Areas, Victoria: 2006
3
Victorian Community Profiles: 2006 Census
Switzerland-Born
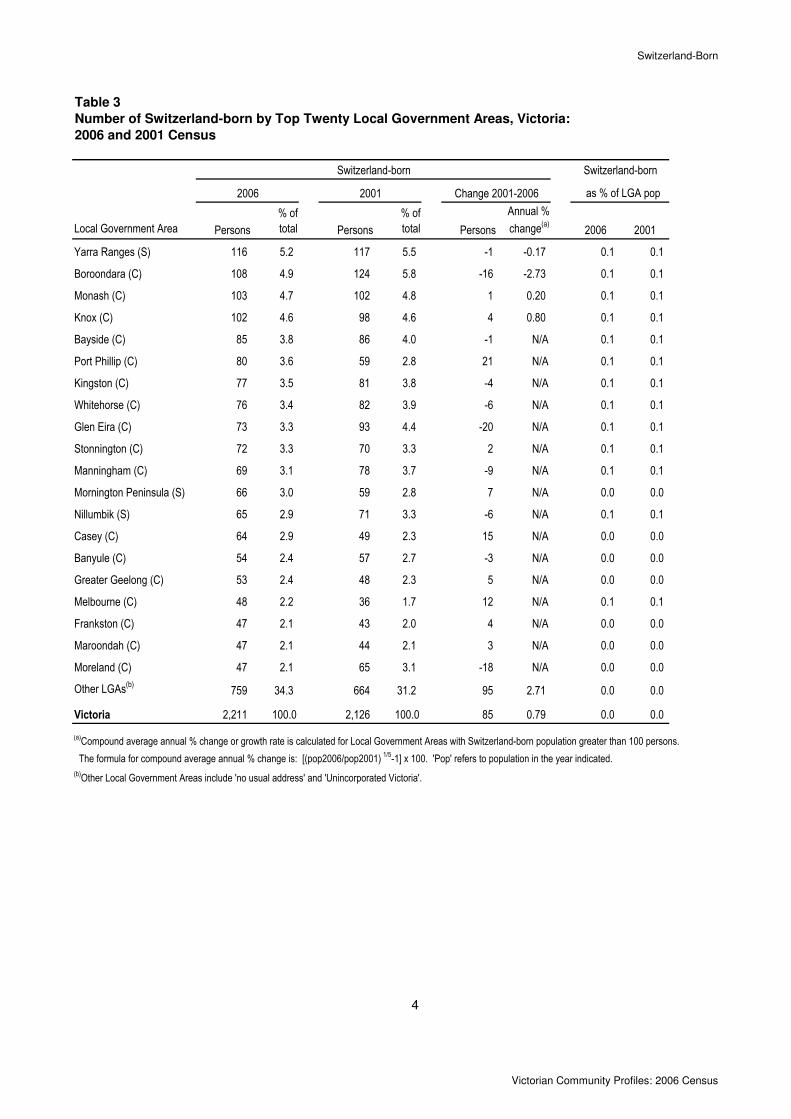
Table 3
Number of Switzerland-born by Top Twenty Local Government Areas, Victoria:
2006 and 2001 Census
Local Government Area Persons
% of
total Persons
% of
total Persons
Annual %
change(a)2006 2001
Yarra Ranges (S) 116 5.2 117 5.5 -1 -0.17 0.1 0.1
Boroondara (C) 108 4.9 124 5.8 -16 -2.73 0.1 0.1
Monash (C) 103 4.7 102 4.8 1 0.20 0.1 0.1
Knox (C) 102 4.6 98 4.6 4 0.80 0.1 0.1
Bayside (C) 85 3.8 86 4.0 -1 N/A 0.1 0.1
Port Phillip (C) 80 3.6 59 2.8 21 N/A 0.1 0.1
Kingston (C) 77 3.5 81 3.8 -4 N/A 0.1 0.1
Whitehorse (C) 76 3.4 82 3.9 -6 N/A 0.1 0.1
Glen Eira (C) 73 3.3 93 4.4 -20 N/A 0.1 0.1
Stonnington (C) 72 3.3 70 3.3 2 N/A 0.1 0.1
Manningham (C) 69 3.1 78 3.7 -9 N/A 0.1 0.1
Mornington Peninsula (S) 66 3.0 59 2.8 7 N/A 0.0 0.0
Nillumbik (S) 65 2.9 71 3.3 -6 N/A 0.1 0.1
Casey (C) 64 2.9 49 2.3 15 N/A 0.0 0.0
Banyule (C) 54 2.4 57 2.7 -3 N/A 0.0 0.0
Greater Geelong (C) 53 2.4 48 2.3 5 N/A 0.0 0.0
Melbourne (C) 48 2.2 36 1.7 12 N/A 0.1 0.1
Frankston (C) 47 2.1 43 2.0 4 N/A 0.0 0.0
Maroondah (C) 47 2.1 44 2.1 3 N/A 0.0 0.0
Moreland (C) 47 2.1 65 3.1 -18 N/A 0.0 0.0
Other LGAs(b) 759 34.3 664 31.2 95 2.71 0.0 0.0
Victoria 2,211 100.0 2,126 100.0 85 0.79 0.0 0.0
(a)Compound average annual % change or growth rate is calculated for Local Government Areas with Switzerland-born population greater than 100 persons.
The formula for compound average annual % change is: [(pop2006/pop2001) 1/5-1] x 100. 'Pop' refers to population in the year indicated.
(b)Other Local Government Areas include 'no usual address' and 'Unincorporated Victoria'. 1820889 578127
4
Switzerland-born Switzerland-born
as % of LGA pop2006 2001 Change 2001-2006
Victorian Community Profiles: 2006 Census
Switzerland-Born
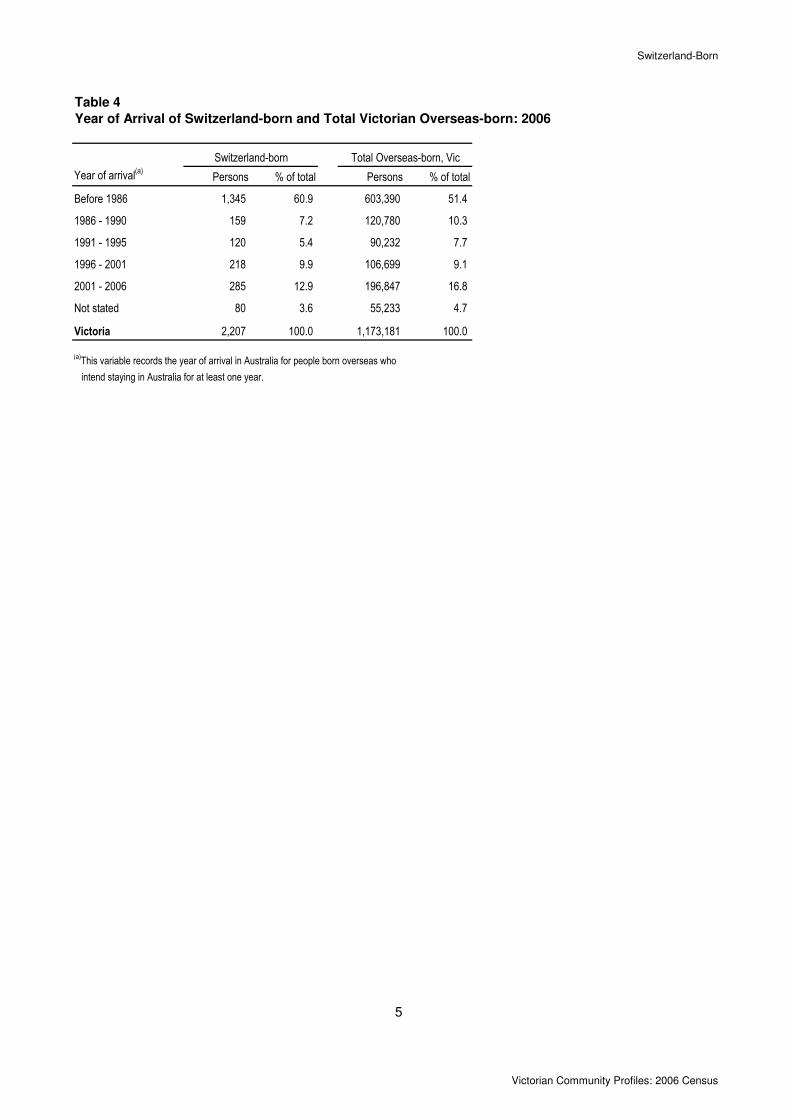
Table 4
Year of Arrival of Switzerland-born and Total Victorian Overseas-born: 2006
Year of arrival(a) Persons % of total Persons % of total
Before 1986 1,345 60.9 603,390 51.4
1986 - 1990 159 7.2 120,780 10.3
1991 - 1995 120 5.4 90,232 7.7
1996 - 2001 218 9.9 106,699 9.1
2001 - 2006 285 12.9 196,847 16.8
Not stated 80 3.6 55,233 4.7
Victoria 2,207 100.0 1,173,181 100.0
(a)This variable records the year of arrival in Australia for people born overseas who
intend staying in Australia for at least one year.
5
Switzerland-born Total Overseas-born, Vic
Victorian Community Profiles: 2006 Census
Switzerland-Born
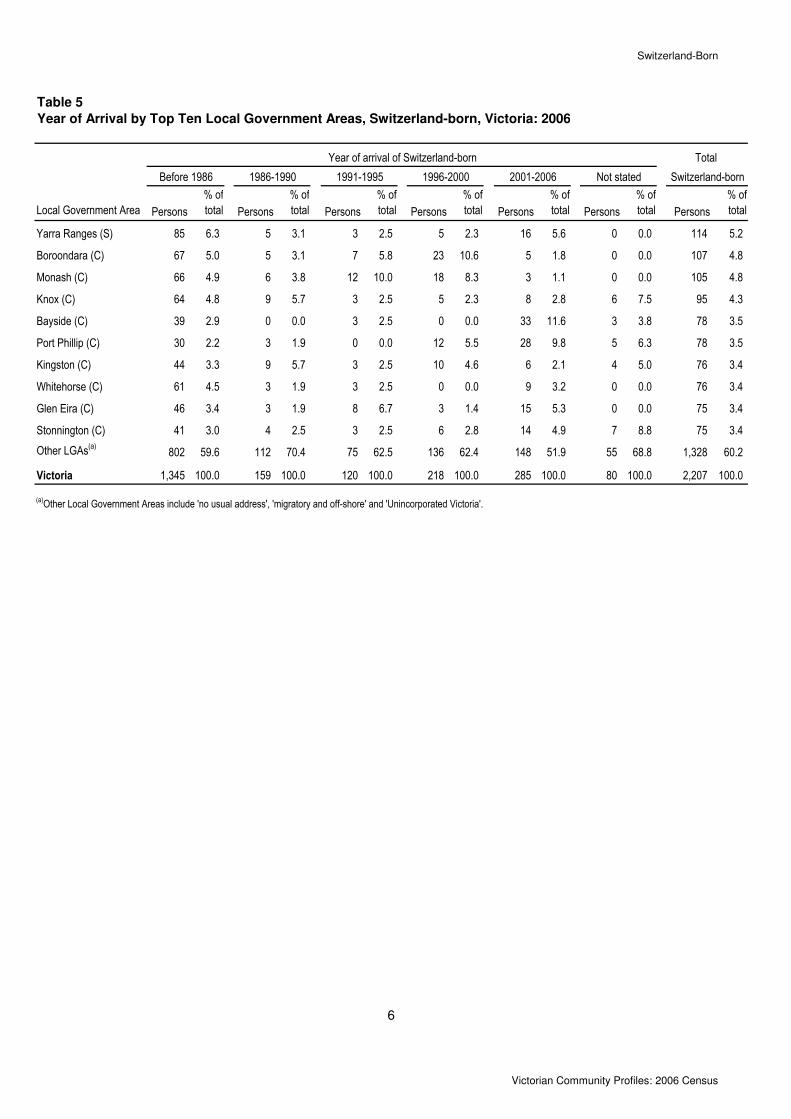
Table 5
Year of Arrival by Top Ten Local Government Areas, Switzerland-born, Victoria: 2006
Local Government Area Persons
% of
total Persons
% of
total Persons
% of
total Persons
% of
total Persons
% of
total Persons
% of
total Persons
% of
total
Yarra Ranges (S) 85 6.3 5 3.1 3 2.5 5 2.3 16 5.6 0 0.0 114 5.2
Boroondara (C) 67 5.0 5 3.1 7 5.8 23 10.6 5 1.8 0 0.0 107 4.8
Monash (C) 66 4.9 6 3.8 12 10.0 18 8.3 3 1.1 0 0.0 105 4.8
Knox (C) 64 4.8 9 5.7 3 2.5 5 2.3 8 2.8 6 7.5 95 4.3
Bayside (C) 39 2.9 0 0.0 3 2.5 0 0.0 33 11.6 3 3.8 78 3.5
Port Phillip (C) 30 2.2 3 1.9 0 0.0 12 5.5 28 9.8 5 6.3 78 3.5
Kingston (C) 44 3.3 9 5.7 3 2.5 10 4.6 6 2.1 4 5.0 76 3.4
Whitehorse (C) 61 4.5 3 1.9 3 2.5 0 0.0 9 3.2 0 0.0 76 3.4
Glen Eira (C) 46 3.4 3 1.9 8 6.7 3 1.4 15 5.3 0 0.0 75 3.4
Stonnington (C) 41 3.0 4 2.5 3 2.5 6 2.8 14 4.9 7 8.8 75 3.4
Other LGAs(a) 802 59.6 112 70.4 75 62.5 136 62.4 148 51.9 55 68.8 1,328 60.2
Victoria 1,345 100.0 159 100.0 120 100.0 218 100.0 285 100.0 80 100.0 2,207 100.0
(a)Other Local Government Areas include 'no usual address', 'migratory and off-shore' and 'Unincorporated Victoria'.
6
2001-2006 Switzerland-born
Year of arrival of Switzerland-born
Before 1986 1986-1990 1991-1995 1996-2000 Not stated
Total
Victorian Community Profiles: 2006 Census

Switzerland-Born
Table 6
Local Government Area Total
% of
total Persons
% of
total
Boroondara (C) 356 5.5 154,453 3.1
Yarra Ranges (S) 322 5.0 140,216 2.8
Whitehorse (C) 258 4.0 144,767 2.9
Monash (C) 256 4.0 161,241 3.3
Greater Geelong (C) 254 4.0 197,477 4.0
Knox (C) 247 3.8 146,739 3.0
Bayside (C) 220 3.4 87,937 1.8
Stonnington (C) 207 3.2 89,885 1.8
Mornington Peninsula (S) 195 3.0 136,483 2.8
Port Phillip (C) 191 3.0 85,096 1.7
Other LGAs(a) 3,916 61.0 3,588,128 72.7
Victoria 6,422 100.0 4,932,422 100.0
Note: This table selects all those in Victoria (not limited to the Switzerland-born subgroup) identifying with Swiss ancestry.
Respondents had the option of nominating several ancestries but only the first two answers or responses were
processed in the Census. Therefore, the number of responses can be greater than the number of persons.(a)Other Local Government Areas include 'no usual address' and 'Unincorporated Victoria'.
7
Total LGA
population
Total First and Second
Responses
Total Persons Identified with Swiss Ancestry in Victoria by Top Ten
Local Government Areas: 2006
Victorian Community Profiles: 2006 Census

Switzerland-Born
Table 7
Birthplaces (Top Ten plus Australia) of Persons of Swiss ancestry in Victoria: 2006
Birthplace Persons % of total Persons % of total Persons % of total
Australia 2,042 64.3 2,170 66.9 4,212 65.6
Switzerland 844 26.6 754 23.3 1,598 24.9
New Zealand 46 1.4 66 2.0 112 1.7
England 35 1.1 46 1.4 81 1.3
USA 33 1.0 21 0.6 54 0.8
South Africa 19 0.6 17 0.5 36 0.6
France 9 0.3 11 0.3 20 0.3
Germany 7 0.2 9 0.3 16 0.2
Sri Lanka 8 0.3 4 0.1 12 0.2
Canada 6 0.2 5 0.2 11 0.2
Papua New Guinea 3 0.1 5 0.2 8 0.1
Other countries 71 2.2 75 2.3 146 2.3
Not stated etc(b) 52 1.6 59 1.8 111 1.7
Total Swiss ancestry 3,175 100.0 3,242 100.0 6,417 100.0
(b)Includes 'inadequately described', 'at sea' and 'not elsewhere classified'.
18
8
(a)Respondents had the option of nominating several ancestries but only the first two responses were processed in the Census.
This table totals both first response and second responses.
Swiss ancestry(a)
Males Females Total
Victorian Community Profiles: 2006 Census
Switzerland-Born
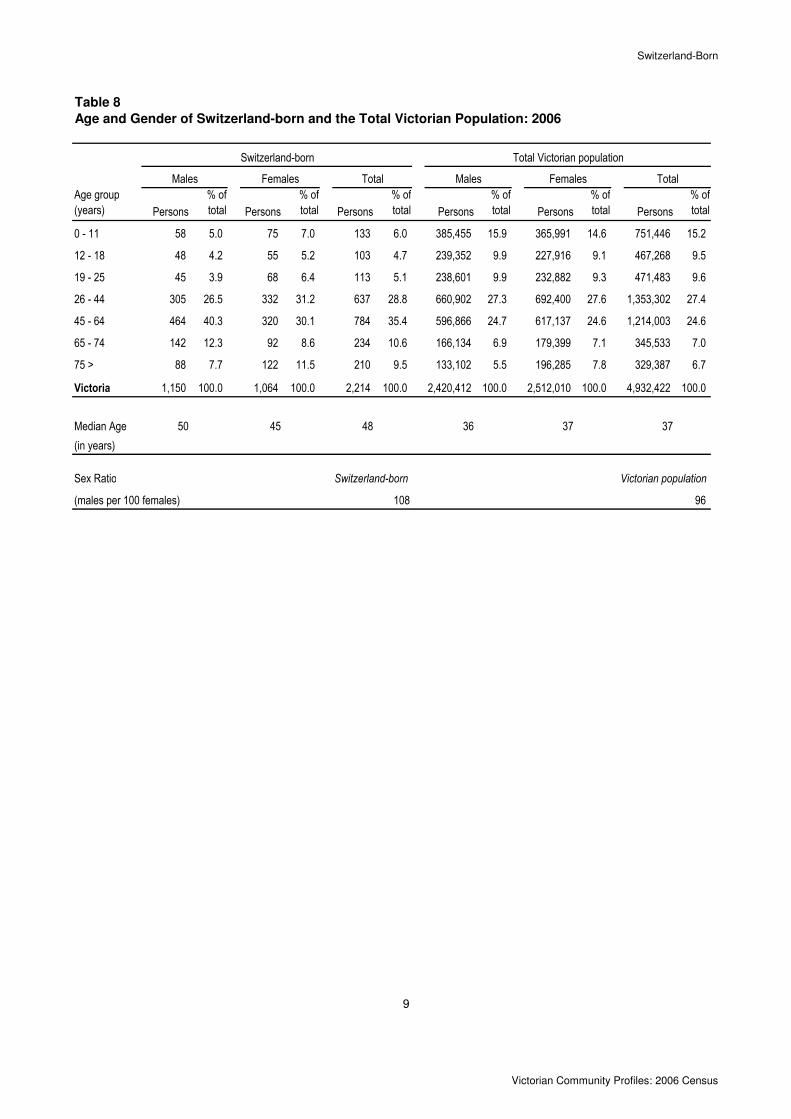
Table 8
Age and Gender of Switzerland-born and the Total Victorian Population: 2006
Age group
(years) Persons
% of
total Persons
% of
total Persons
% of
total Persons
% of
total Persons
% of
total Persons
% of
total
0 - 11 58 5.0 75 7.0 133 6.0 385,455 15.9 365,991 14.6 751,446 15.2
12 - 18 48 4.2 55 5.2 103 4.7 239,352 9.9 227,916 9.1 467,268 9.5
19 - 25 45 3.9 68 6.4 113 5.1 238,601 9.9 232,882 9.3 471,483 9.6
26 - 44 305 26.5 332 31.2 637 28.8 660,902 27.3 692,400 27.6 1,353,302 27.4
45 - 64 464 40.3 320 30.1 784 35.4 596,866 24.7 617,137 24.6 1,214,003 24.6
65 - 74 142 12.3 92 8.6 234 10.6 166,134 6.9 179,399 7.1 345,533 7.0
75 > 88 7.7 122 11.5 210 9.5 133,102 5.5 196,285 7.8 329,387 6.7
Victoria 1,150 100.0 1,064 100.0 2,214 100.0 2,420,412 100.0 2,512,010 100.0 4,932,422 100.0
Median Age 50 45 48 36 37 37
(in years)
Sex Ratio
(males per 100 females) 108 96
9
Switzerland-born
Males Females Total
Total Victorian population
Victorian population Switzerland-born
Males Females Total
Victorian Community Profiles: 2006 Census

Switzerland-Born
Figure 2
Age and Gender Distribution of Switzerland-born and Total Victorian Population: 2001, 2006
(a) Switzerland-born
same as for (a)
Total Males: Total Females:
2001 - 1,133 2001 - 1,019
2006 - 1,150 2006 - 1,064
(b) Total Victorian Population
Total Males: Total Females:
2001 - 2,287,974 2001 - 2,373,044
2006 - 2,420,412 2006 - 2,512,010 10
Age (years)
Age (years)
02468101214161820
0-4
5-9
10-14
15-19
20-24
25-29
30-34
35-39
40-44
45-49
50-54
55-59
60-64
65-69
70-74
75-79
80-84
85+
Males (%)0 2 4 6 8 10 12 14 16 18 20
0-4
5-9
10-14
15-19
20-24
25-29
30-34
35-39
40-44
45-49
50-54
55-59
60-64
65-69
70-74
75-79
80-84
85+
Females (%)
2001
2006
02468101214161820
0-4
5-9
10-14
15-19
20-24
25-29
30-34
35-39
40-44
45-49
50-54
55-59
60-64
65-69
70-74
75-79
80-84
85+
Males (%)0 2 4 6 8 10 12 14 16 18 20
0-4
5-9
10-14
15-19
20-24
25-29
30-34
35-39
40-44
45-49
50-54
55-59
60-64
65-69
70-74
75-79
80-84
85+
Females (%)
2001
2006
Victorian Community Profiles: 2006 Census

Switzerland-Born
Age and Sex distribution (Persons) Age and Sex distribution (Persons)
Male Female Male Female Male Female Male Female
0-4 16 36 23 25 156,660 149,269 154,286 146,277
5-9 28 25 35 32 161,716 153,111 165,847 156,871
10-14 35 43 39 28 169,147 160,474 165,507 157,586
15-19 31 31 29 31 171,571 163,608 163,829 158,065
20-24 32 50 25 40 171,124 167,588 157,738 153,985
25-29 45 58 46 53 161,216 162,615 163,597 167,827
30-34 59 66 103 96 172,577 181,477 175,018 185,373
35-39 94 99 115 129 181,608 193,437 175,056 182,845
40-44 116 122 110 81 178,691 187,610 174,002 181,333
45-49 115 88 104 68 174,620 181,882 160,131 165,335
50-54 100 63 135 85 158,661 164,361 150,995 155,011
55-59 129 87 129 84 147,703 153,185 119,139 119,018
60-64 120 82 77 53 115,882 117,709 97,576 99,135
65-69 79 48 64 47 91,957 96,390 81,217 86,916
70-74 63 44 46 52 74,177 83,009 74,661 84,667
75-79 54 42 26 51 63,536 76,918 56,197 74,153
80-84 21 40 17 38 42,493 62,567 31,627 50,867
85+ 13 40 10 26 27,073 56,800 21,551 47,780
Total 1,150 1,064 1,133 1,019 2,420,412 2,512,010 2,287,974 2,373,044
Age and Sex distribution (Percentage) Age and Sex distribution (Percentage)
Male Female Male Female Male Female Male Female
0-4 1.4 3.4 2.0 2.5 6.5 5.9 6.7 6.2
5-9 2.4 2.3 3.1 3.1 6.7 6.1 7.2 6.6
10-14 3.0 4.0 3.4 2.7 7.0 6.4 7.2 6.6
15-19 2.7 2.9 2.6 3.0 7.1 6.5 7.2 6.7
20-24 2.8 4.7 2.2 3.9 7.1 6.7 6.9 6.5
25-29 3.9 5.5 4.1 5.2 6.7 6.5 7.2 7.1
30-34 5.1 6.2 9.1 9.4 7.1 7.2 7.6 7.8
35-39 8.2 9.3 10.2 12.7 7.5 7.7 7.7 7.7
40-44 10.1 11.5 9.7 7.9 7.4 7.5 7.6 7.6
45-49 10.0 8.3 9.2 6.7 7.2 7.2 7.0 7.0
50-54 8.7 5.9 11.9 8.3 6.6 6.5 6.6 6.5
55-59 11.2 8.2 11.4 8.2 6.1 6.1 5.2 5.0
60-64 10.4 7.7 6.8 5.2 4.8 4.7 4.3 4.2
65-69 6.9 4.5 5.6 4.6 3.8 3.8 3.5 3.7
70-74 5.5 4.1 4.1 5.1 3.1 3.3 3.3 3.6
75-79 4.7 3.9 2.3 5.0 2.6 3.1 2.5 3.1
80-84 1.8 3.8 1.5 3.7 1.8 2.5 1.4 2.1
85+ 1.1 3.8 0.9 2.6 1.1 2.3 0.9 2.0
Total 100.0 100.0 100.0 100.0 100.0 100.0 100.0 100.0
11
(a) Switzerland born (b) Total Victoria
2006 2001 2006 2001
(c) Switzerland born (d) Total Victoria
2006 2001 2006 2001
Victorian Community Profiles: 2006 Census

Switzerland-Born
Table 9
Languages Spoken at Home (Top Ten) by Gender, Switzerland-born and the Total Victorian Population: 2006
Top 10 languages
spoken at home Persons
% of
total Persons
% of
total Persons
% of
total Persons
% of
total Persons
% of
total Persons
% of
total
German 330 28.7 321 30.1 651 29.4 8,934 0.4 10,667 0.4 19,601 0.4
French 90 7.8 80 7.5 170 7.7 5,581 0.2 6,279 0.2 11,860 0.2
Italian 57 5.0 55 5.1 112 5.1 64,178 2.7 69,158 2.8 133,336 2.7
Swiss, so described 45 3.9 29 2.7 74 3.3 67 0.0 59 0.0 126 0.0
Dutch 6 0.5 4 0.4 10 0.5 4,262 0.2 5,295 0.2 9,557 0.2
Bosnian 3 0.3 7 0.7 10 0.5 2,938 0.1 2,998 0.1 5,936 0.1
Tamil 3 0.3 3 0.3 6 0.3 5,725 0.2 5,372 0.2 11,097 0.2
Greek 3 0.3 3 0.3 6 0.3 57,965 2.4 59,915 2.4 117,880 2.4
Spanish 6 0.5 - - 6 0.3 11,787 0.5 12,720 0.5 24,507 0.5
Vietnamese 3 0.3 3 0.3 6 0.3 34,776 1.4 37,394 1.5 72,170 1.5
Speaks English only 576 50.2 536 50.2 1,112 50.2 1,795,945 74.2 1,872,343 74.5 3,668,288 74.4
Other languages(a) 22 1.9 19 1.8 41 1.9 293,709 12.1 307,643 12.2 601,352 12.2
Not stated 4 0.3 8 0.7 12 0.5 134,544 5.6 122,168 4.9 256,712 5.2
Victoria 1,148 100.0 1,068 100.0 2,216 100.0 2,420,411 100.0 2,512,011 100.0 4,932,422 100.0
(a)Include 'inadequately described' and 'non-verbal so described'.
12
Total Victorian population
Males Females TotalMales Females Total
Switzerland-born
Victorian Community Profiles: 2006 Census
Switzerland-Born
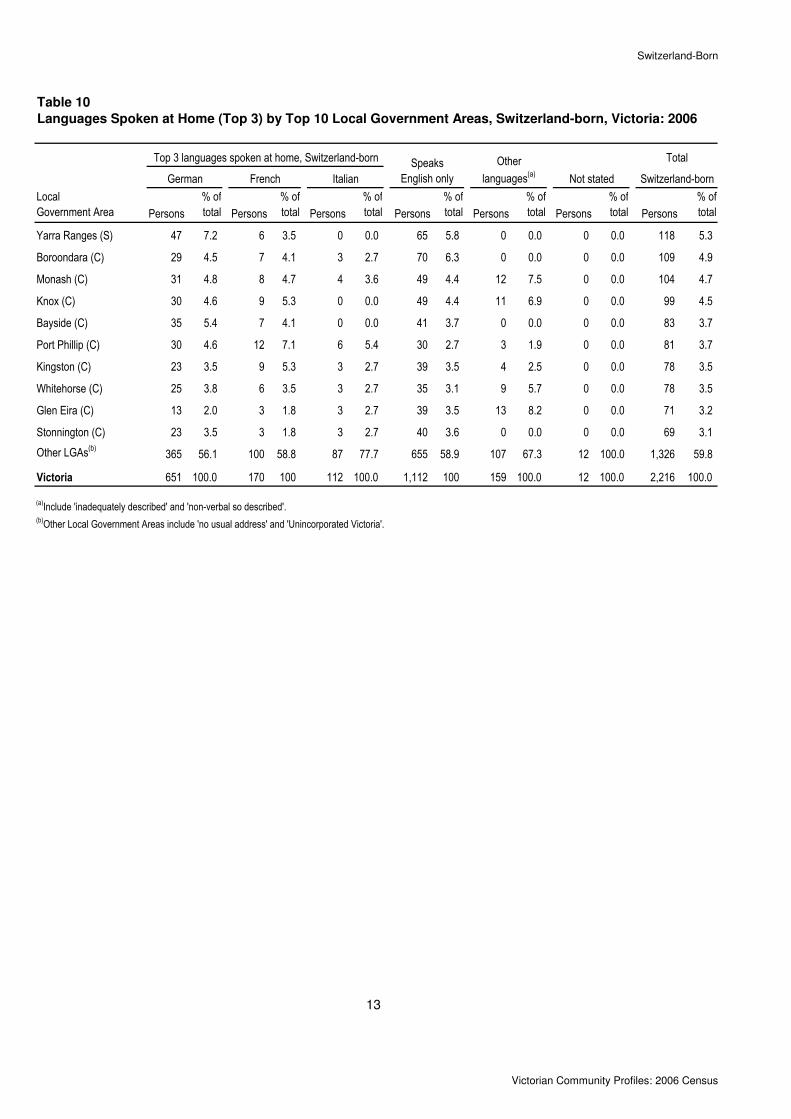
Table 10
Languages Spoken at Home (Top 3) by Top 10 Local Government Areas, Switzerland-born, Victoria: 2006
Local
Government Area Persons
% of
total Persons
% of
total Persons
% of
total Persons
% of
total Persons
% of
total Persons
% of
total Persons
% of
total
Yarra Ranges (S) 47 7.2 6 3.5 0 0.0 65 5.8 0 0.0 0 0.0 118 5.3
Boroondara (C) 29 4.5 7 4.1 3 2.7 70 6.3 0 0.0 0 0.0 109 4.9
Monash (C) 31 4.8 8 4.7 4 3.6 49 4.4 12 7.5 0 0.0 104 4.7
Knox (C) 30 4.6 9 5.3 0 0.0 49 4.4 11 6.9 0 0.0 99 4.5
Bayside (C) 35 5.4 7 4.1 0 0.0 41 3.7 0 0.0 0 0.0 83 3.7
Port Phillip (C) 30 4.6 12 7.1 6 5.4 30 2.7 3 1.9 0 0.0 81 3.7
Kingston (C) 23 3.5 9 5.3 3 2.7 39 3.5 4 2.5 0 0.0 78 3.5
Whitehorse (C) 25 3.8 6 3.5 3 2.7 35 3.1 9 5.7 0 0.0 78 3.5
Glen Eira (C) 13 2.0 3 1.8 3 2.7 39 3.5 13 8.2 0 0.0 71 3.2
Stonnington (C) 23 3.5 3 1.8 3 2.7 40 3.6 0 0.0 0 0.0 69 3.1
Other LGAs(b) 365 56.1 100 58.8 87 77.7 655 58.9 107 67.3 12 100.0 1,326 59.8
Victoria 651 100.0 170 100 112 100.0 1,112 100 159 100.0 12 100.0 2,216 100.0
(a)Include 'inadequately described' and 'non-verbal so described'.(b)Other Local Government Areas include 'no usual address' and 'Unincorporated Victoria'.
13
Speaks
English only
Other
languages(a)
Total
German French Italian
Top 3 languages spoken at home, Switzerland-born
Switzerland-bornNot stated
Victorian Community Profiles: 2006 Census

Switzerland-Born
Table 11
Proficiency in Spoken English by Gender, Switzerland-born, Victoria: 2006
Proficiency in
spoken English(a)Persons
% of
total Persons
% of
total Persons
% of
total Persons
% of
total Persons
% of
total Persons
% of
total
Speaks English only 573 50.1 540 50.6 1,113 50.3 1,795,964 74.2 1,872,338 74.5 3,668,302 74.4
Speaks other lang &
speaks English:
Very well 444 38.8 395 37.0 839 37.9 276,111 11.4 275,908 11.0 552,019 11.2
Well 105 9.2 96 9.0 201 9.1 133,954 5.5 134,123 5.3 268,077 5.4
Not well 15 1.3 18 1.7 33 1.5 64,689 2.7 85,024 3.4 149,713 3.0
Not at all 3 0.3 4 0.4 7 0.3 14,676 0.6 22,373 0.9 37,049 0.8
Not stated(b)
3 0.3 15 1.4 18 0.8 135,024 5.6 122,238 4.9 257,262 5.2
Victoria 1,143 100.0 1,068 100.0 2,211 100.0 2,420,418 100.0 2,512,004 100.0 4,932,422 100.0
(a)This is a self-assessment. (b)Not stated includes 'language or English proficiency not stated' and 'both language and English proficiency not stated'.
14
Males Females Total
Total Victorian population
Males Females Total
Switzerland-born
Victorian Community Profiles: 2006 Census

Switzerland-Born
Table 12
Proficiency in Spoken English by Top Ten Ranked Local Government Areas, Switzerland-born, Victoria: 2006
Local
Government Area Persons
% of
total Persons
% of
total Persons
% of
total Persons
% of
total Persons
% of
total Persons
% of
total Persons
% of
total
Yarra Ranges (S) 61 5.5 46 5.5 13 6.5 0 0.0 0 0.0 0 0.0 120 5.4
Boroondara (C) 70 6.3 31 3.7 6 3.0 0 0.0 0 0.0 0 0.0 107 4.8
Monash (C) 48 4.3 43 5.1 5 2.5 0 0.0 0 0.0 0 0.0 96 4.3
Knox (C) 47 4.2 35 4.2 7 3.5 3 9.1 0 0.0 0 0.0 92 4.2
Bayside (C) 40 3.6 36 4.3 0 0.0 3 9.1 0 0.0 0 0.0 79 3.6
Port Phillip (C) 35 3.1 36 4.3 12 6.0 0 0.0 0 0.0 0 0.0 83 3.8
Kingston (C) 43 3.9 28 3.3 6 3.0 0 0.0 0 0.0 0 0.0 77 3.5
Whitehorse (C) 27 2.4 34 4.1 17 8.5 3 9.1 0 0.0 0 0.0 81 3.7
Glen Eira (C) 33 3.0 22 2.6 10 5.0 3 9.1 3 42.9 3 16.7 74 3.3
Stonnington (C) 34 3.1 27 3.2 6 3.0 0 0.0 0 0.0 0 0.0 67 3.0
Other LGAs(c) 675 60.6 501 59.7 119 59.2 21 63.6 4 57.1 15 83.3 1,335 60.4
Victoria 1,113 100.0 839 100.0 201 100.0 33 100.0 7 100.0 18 100.0 2,211 100.0
(a)This is a self-assessment. (b)Not stated includes 'language or English proficiency not stated' and 'both language and English proficiency not stated'.(c)Other Local Government Areas include 'no usual address' and 'Unincorporated Victoria'.
15
Speaks
English only Not stated(b) Switzerland-born
Speaks other languages and speaks English(a), Switzerland-born
Very well Well Not well Not at all
Total
Victorian Community Profiles: 2006 Census
Switzerland-Born
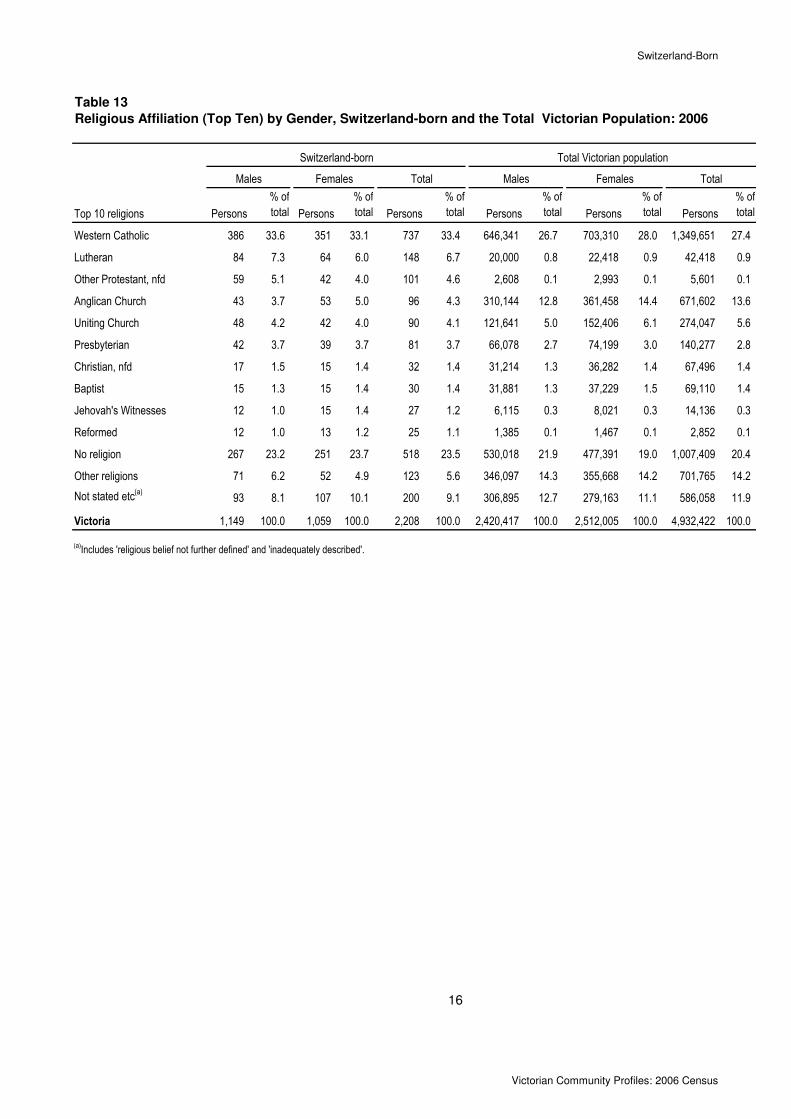
Table 13
Religious Affiliation (Top Ten) by Gender, Switzerland-born and the Total Victorian Population: 2006
Top 10 religions Persons
% of
total Persons
% of
total Persons
% of
total Persons
% of
total Persons
% of
total Persons
% of
total
Western Catholic 386 33.6 351 33.1 737 33.4 646,341 26.7 703,310 28.0 1,349,651 27.4
Lutheran 84 7.3 64 6.0 148 6.7 20,000 0.8 22,418 0.9 42,418 0.9
Other Protestant, nfd 59 5.1 42 4.0 101 4.6 2,608 0.1 2,993 0.1 5,601 0.1
Anglican Church 43 3.7 53 5.0 96 4.3 310,144 12.8 361,458 14.4 671,602 13.6
Uniting Church 48 4.2 42 4.0 90 4.1 121,641 5.0 152,406 6.1 274,047 5.6
Presbyterian 42 3.7 39 3.7 81 3.7 66,078 2.7 74,199 3.0 140,277 2.8
Christian, nfd 17 1.5 15 1.4 32 1.4 31,214 1.3 36,282 1.4 67,496 1.4
Baptist 15 1.3 15 1.4 30 1.4 31,881 1.3 37,229 1.5 69,110 1.4
Jehovah's Witnesses 12 1.0 15 1.4 27 1.2 6,115 0.3 8,021 0.3 14,136 0.3
Reformed 12 1.0 13 1.2 25 1.1 1,385 0.1 1,467 0.1 2,852 0.1
No religion 267 23.2 251 23.7 518 23.5 530,018 21.9 477,391 19.0 1,007,409 20.4
Other religions 71 6.2 52 4.9 123 5.6 346,097 14.3 355,668 14.2 701,765 14.2
Not stated etc(a) 93 8.1 107 10.1 200 9.1 306,895 12.7 279,163 11.1 586,058 11.9
Victoria 1,149 100.0 1,059 100.0 2,208 100.0 2,420,417 100.0 2,512,005 100.0 4,932,422 100.0
(a)Includes 'religious belief not further defined' and 'inadequately described'.
16
Females Total
Switzerland-born Total Victorian population
Males Females Total Males
Victorian Community Profiles: 2006 Census

Switzerland-Born
Table 14
Religious Affiliation (Top Three) by Top Ten Local Government Areas, Switzerland-born, Victoria: 2006
Local
Government Area Persons
% of
total Persons
% of
total Persons
% of
total Persons
% of
total Persons
% of
total Persons
% of
total Persons
% of
total
Yarra Ranges (S) 36 4.9 12 8.1 9 8.9 34 6.6 17 3.4 10 5.0 118 5.3
Boroondara (C) 38 5.2 3 2.0 8 7.9 24 4.6 28 5.6 9 4.5 110 5.0
Monash (C) 31 4.2 8 5.4 7 6.9 19 3.7 23 4.6 14 7.0 102 4.6
Knox (C) 34 4.6 12 8.1 0 0.0 25 4.8 22 4.4 6 3.0 99 4.5
Bayside (C) 27 3.7 9 6.1 3 3.0 13 2.5 29 5.8 4 2.0 85 3.8
Port Phillip (C) 17 2.3 8 5.4 3 3.0 31 6.0 15 3.0 6 3.0 80 3.6
Kingston (C) 23 3.1 5 3.4 6 5.9 17 3.3 24 4.8 4 2.0 79 3.6
Whitehorse (C) 22 3.0 7 4.7 6 5.9 19 3.7 17 3.4 6 3.0 77 3.5
Glen Eira (C) 20 2.7 3 2.0 0 0.0 17 3.3 26 5.2 5 2.5 71 3.2
Stonnington (C) 29 3.9 7 4.7 7 6.9 16 3.1 9 1.8 3 1.5 71 3.2
Other LGAs(b) 460 62.4 74 50.0 52 51.5 303 58.5 294 58.3 133 66.5 1,316 59.6
Victoria 737 100.0 148 100.0 101 100.0 518 100.0 504 100.0 200 100.0 2,208 100.0
(a)Includes 'religious belief not further defined' and 'inadequately described'.(b)Other Local Government Areas include 'no usual address' and 'Unincorporated Victoria'.
17
Top 3 religions, Switzerland-born
No religion Not stated etc(a)
Total
Western Catholic Lutheran Other Protestant Switzerland-bornOther religions
Victorian Community Profiles: 2006 Census
Switzerland-Born
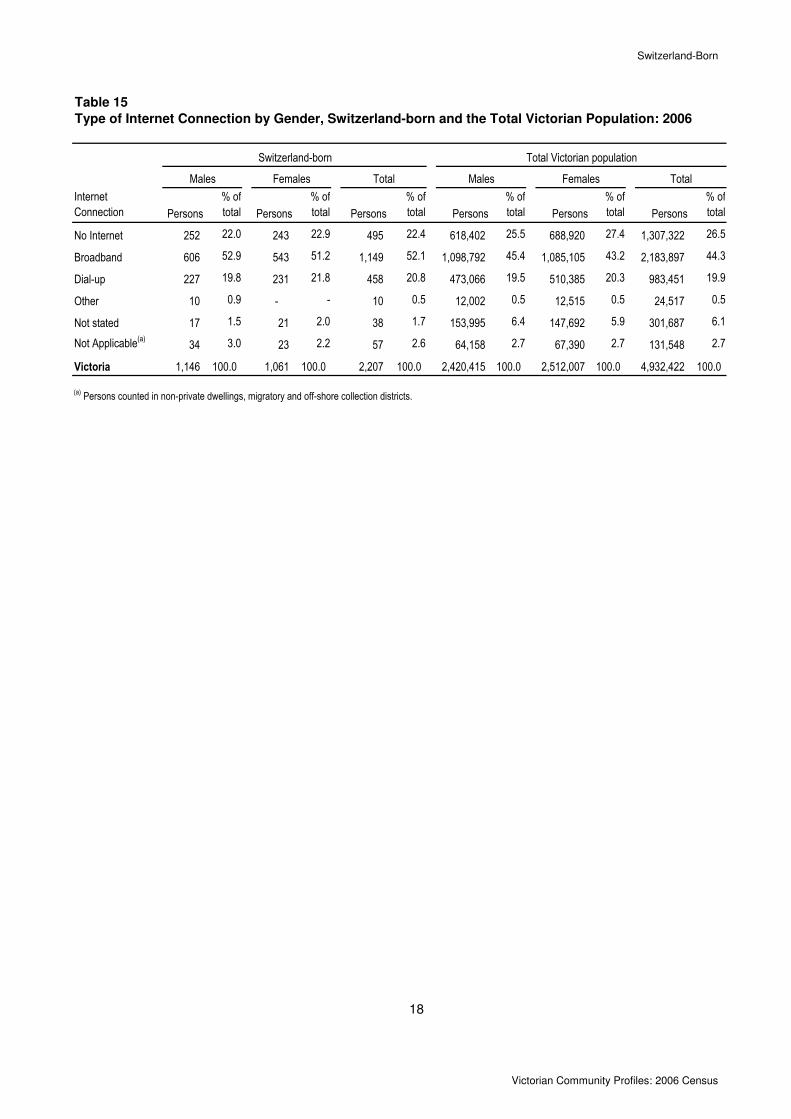
Table 15
Type of Internet Connection by Gender, Switzerland-born and the Total Victorian Population: 2006
Internet
Connection Persons
% of
total Persons
% of
total Persons
% of
total Persons
% of
total Persons
% of
total Persons
% of
total
No Internet 252 22.0 243 22.9 495 22.4 618,402 25.5 688,920 27.4 1,307,322 26.5
Broadband 606 52.9 543 51.2 1,149 52.1 1,098,792 45.4 1,085,105 43.2 2,183,897 44.3
Dial-up 227 19.8 231 21.8 458 20.8 473,066 19.5 510,385 20.3 983,451 19.9
Other 10 0.9 - - 10 0.5 12,002 0.5 12,515 0.5 24,517 0.5
Not stated 17 1.5 21 2.0 38 1.7 153,995 6.4 147,692 5.9 301,687 6.1
Not Applicable(a)34 3.0 23 2.2 57 2.6 64,158 2.7 67,390 2.7 131,548 2.7
Victoria 1,146 100.0 1,061 100.0 2,207 100.0 2,420,415 100.0 2,512,007 100.0 4,932,422 100.0
(a) Persons counted in non-private dwellings, migratory and off-shore collection districts.
18
Males Females Total
Switzerland-born
Males Females Total
Total Victorian population
Victorian Community Profiles: 2006 Census

Switzerland-Born
Table 16
Highest Level of Educational Attainment by Gender, Switzerland-born and the Total Victorian Pop.: 2006
Highest level of
educational attainment(a) Persons
% of
total Persons
% of
total Persons
% of
total Persons
% of
total Persons
% of
total Persons
% of
total
Postgraduate degree 55 5.2 43 4.4 98 4.8 61,909 3.2 46,217 2.3 108,126 2.7
Grad Dip & Grad Cert 18 1.7 21 2.2 39 1.9 26,904 1.4 47,137 2.3 74,041 1.9
Bachelor Degree 159 15.0 145 15.0 304 15.0 225,592 11.7 276,925 13.5 502,517 12.6
Diplomas etc(b) 570 53.7 289 29.9 859 42.3 512,723 26.5 306,504 15.0 819,227 20.6
School Education only(c) 175 16.5 288 29.8 463 22.8 836,436 43.3 1,055,649 51.5 1,892,085 47.5
No Educational Attainment(d) - - 4 0.4 4 0.2 16,269 0.8 23,578 1.2 39,847 1.0
Not stated etc(e) 85 8.0 177 18.3 262 12.9 253,049 13.1 293,140 14.3 546,189 13.7
Victoria 1,062 100.0 967 100.0 2,029 100.0 1,932,882 100.0 2,049,150 100.0 3,982,032 100.0
(a)This variable is applicable to persons aged 15 years and over.(b)Include Advanced Diploma, Diploma, and Certificate.(c) Includes persons who completed school to between Year 8 and Year 12 level.(d) Includes persons whose qualification is out of scope of this variable.(e)Includes 'inadequately described'.
19
Switzerland-born Total Victorian population
Males Females Total Males Females Total
Victorian Community Profiles: 2006 Census

Switzerland-Born
Table 17
Highest Level of Educational Attainment by Top 10 Local Government Area, Switzerland-born, Victoria: 2006
Local
Government Area Persons
% of
total Persons
% of
total Persons
% of
total Persons
% of
total Persons
% of
total Persons
% of
total Persons
% of
total
Yarra Ranges (S) 4 4.1 3 7.7 19 6.3 56 6.5 15 3.2 13 5.0 110 5.4
Boroondara (C) 7 7.1 5 12.8 17 5.6 35 4.1 15 3.2 12 4.6 91 4.5
Monash (C) - - - - 15 4.9 45 5.2 22 4.7 12 4.6 94 4.6
Knox (C) - - - - 10 3.3 52 6.1 24 5.1 14 5.3 100 4.9
Bayside (C) 8 8.2 - - 13 4.3 24 2.8 14 3.0 10 3.8 69 3.4
Port Phillip (C) 18 18.4 - - 19 6.3 29 3.4 8 1.7 4 1.5 78 3.8
Kingston (C) 4 4.1 - - 6 2.0 28 3.3 22 4.7 14 5.3 74 3.6
Whitehorse (C) 3 3.1 3 7.7 6 2.0 33 3.8 20 4.3 9 3.4 74 3.6
Glen Eira (C) - - - - 10 3.3 30 3.5 13 2.8 12 4.6 65 3.2
Stonnington (C) 3 3.1 - - 18 5.9 29 3.4 10 2.1 7 2.7 67 3.3
Other LGAs(e) 51 52.0 28 71.8 171 56.3 498 58.0 304 65.1 155 59.2 1,207 59.5
Victoria 98 100.0 39 100.0 304 100.0 859 100.0 467 100.0 262 100.0 2,029 100.0
(a)This variable is applicable to persons aged 15 years and over.(b)Include Advanced Diploma, Diploma, and Certificate.(c)Includes persons who completed school to between Year 8 and Year 12 level, and persons with qualification that is out of scope of the variable.(d)Includes 'inadequately described'.(e)Other Local Government Areas includes, 'no usual address' and 'Unincorporated Victoria'.
20
Highest level of educational attainment(a), Switzerland-born
Diplomas
etc(b)School only or
No Quals(c) Total
Postgraduate
degree
Grad Dip &
Grad Cert Bachelor Degree Not Stated etc.(d)
Victorian Community Profiles: 2006 Census

Switzerland-Born
Table 18
Labour Force Participation by Gender, Switzerland-born and the Total Victorian Population: 2006
Labour force
participation(a)Persons
% of
total Persons
% of
total Persons
% of
total Persons
% of
total Persons
% of
total Persons
% of
total
In the labour force 740 64.5 543 50.8 1,283 57.9 1,295,204 53.5 1,109,398 44.2 2,404,602 48.8
Employed 712 (62.0) 516 (48.3) 1,228 (55.4) 1,225,532 (50.6) 1,048,909 (41.8) 2,274,441 (46.1)
Unemployed 28 (2.4) 27 (2.5) 55 (2.5) 69,672 (2.9) 60,489 (2.4) 130,161 (2.6)
Not in the labour force 308 26.8 410 38.4 718 32.4 513,857 21.2 816,511 32.5 1,330,368 27.0
Not stated 15 1.3 18 1.7 33 1.5 123,827 5.1 123,239 4.9 247,066 5.0
Not applicable(b)
85 7.4 98 9.2 183 8.3 487,528 20.1 462,858 18.4 950,386 19.3
Victoria 1,148 100.0 1,069 100.0 2,217 100.0 2,420,416 100.0 2,512,006 100.0 4,932,422 100.0
Unemployment rate(c)
(a)This variable is applicable to persons 15 years and over. (b)Persons aged under 15 years. (c)The unemployment rate is the number of unemployed persons calculated as a percentage of the total persons in the labour force.
21
5.5% 5.4%3.8% 5.0% 4.3% 5.4%
Switzerland-born Total Victorian population
Males Females Total Males Females Total
Victorian Community Profiles: 2006 Census
Switzerland-Born
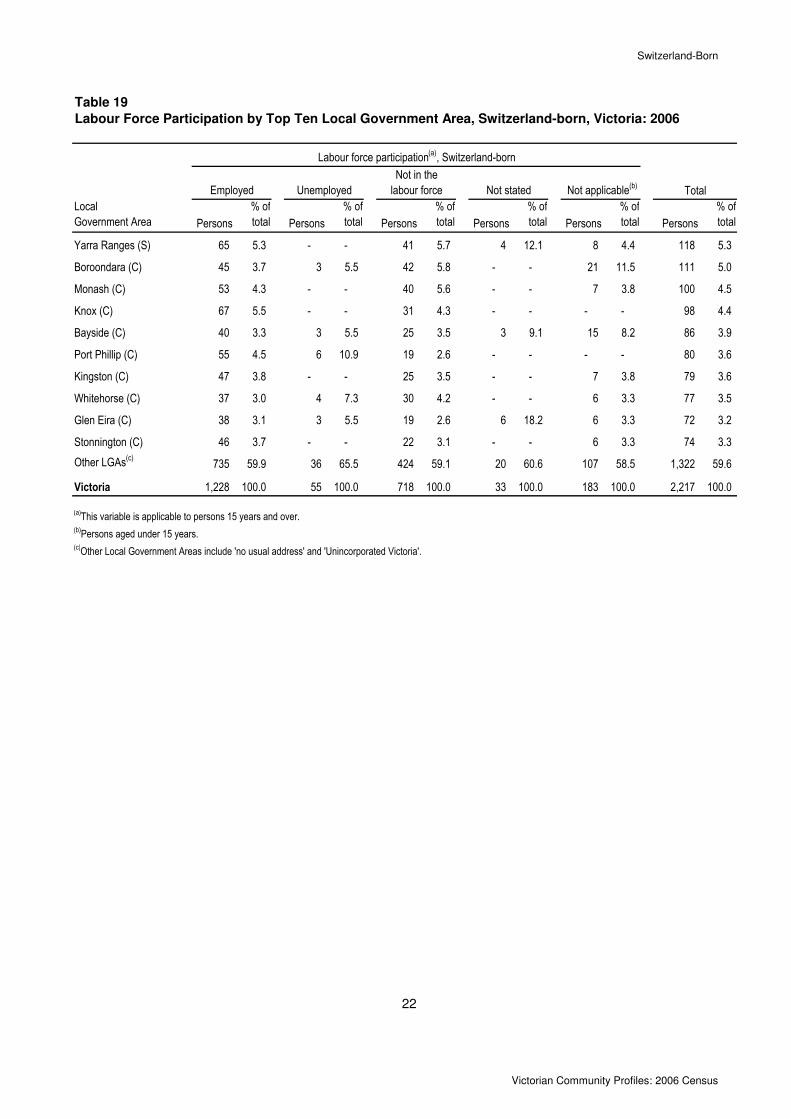
Table 19
Labour Force Participation by Top Ten Local Government Area, Switzerland-born, Victoria: 2006
Local
Government Area Persons
% of
total Persons
% of
total Persons
% of
total Persons
% of
total Persons
% of
total Persons
% of
total
Yarra Ranges (S) 65 5.3 - - 41 5.7 4 12.1 8 4.4 118 5.3
Boroondara (C) 45 3.7 3 5.5 42 5.8 - - 21 11.5 111 5.0
Monash (C) 53 4.3 - - 40 5.6 - - 7 3.8 100 4.5
Knox (C) 67 5.5 - - 31 4.3 - - - - 98 4.4
Bayside (C) 40 3.3 3 5.5 25 3.5 3 9.1 15 8.2 86 3.9
Port Phillip (C) 55 4.5 6 10.9 19 2.6 - - - - 80 3.6
Kingston (C) 47 3.8 - - 25 3.5 - - 7 3.8 79 3.6
Whitehorse (C) 37 3.0 4 7.3 30 4.2 - - 6 3.3 77 3.5
Glen Eira (C) 38 3.1 3 5.5 19 2.6 6 18.2 6 3.3 72 3.2
Stonnington (C) 46 3.7 - - 22 3.1 - - 6 3.3 74 3.3
Other LGAs(c) 735 59.9 36 65.5 424 59.1 20 60.6 107 58.5 1,322 59.6
Victoria 1,228 100.0 55 100.0 718 100.0 33 100.0 183 100.0 2,217 100.0
(a)This variable is applicable to persons 15 years and over. (b)Persons aged under 15 years.(c)Other Local Government Areas include 'no usual address' and 'Unincorporated Victoria'.
22
Labour force participation(a), Switzerland-born
Not stated Not applicable(b)TotalEmployed Unemployed
Not in the
labour force
Victorian Community Profiles: 2006 Census

Switzerland-Born
Table 20
Occupation by Gender, Switzerland-born and the Total Victorian Population: 2006
Occupation(a)Persons
% of
total Persons
% of
total Persons
% of
total Persons
% of
total Persons
% of
total Persons
% of
total
Managers 170 24.1 59 11.3 229 18.7 204,392 16.7 101,920 9.7 306,312 13.5
Professionals 183 26.0 139 26.7 322 26.3 222,296 18.1 250,000 23.8 472,296 20.8
Technical and trades workers 187 26.5 24 4.6 211 17.2 271,405 22.1 47,780 4.6 319,185 14.0
Community & personal serv. wkrs 27 3.8 68 13.1 95 7.8 58,398 4.8 132,095 12.6 190,493 8.4
Clerical & administrative workers 43 6.1 133 25.6 176 14.4 82,478 6.7 254,946 24.3 337,424 14.8
Sales workers 23 3.3 53 10.2 76 6.2 89,182 7.3 141,192 13.5 230,374 10.1
Machinery operators & drivers 23 3.3 10 1.9 33 2.7 130,369 10.6 18,858 1.8 149,227 6.6
Labourers 41 5.8 25 4.8 66 5.4 140,828 11.5 83,725 8.0 224,553 9.9
Not stated(b) 8 1.1 9 1.7 17 1.4 26,184 2.1 18,399 1.8 44,583 2.0
Victoria 705 100.0 520 100.0 1,225 100.0 1,225,532 100.0 1,048,915 100.0 2,274,447 100.0
(a)This variable is applicable to employed persons.(b)Includes 'inadequately described'.
23
Switzerland-born Total Victorian population
Males Females Total Males Females Total
Victorian Community Profiles: 2006 Census

Switzerland-Born
Table 21
Occupation by Top Ten Local Government Areas, Switzerland-born, Victoria: 2006
Local
Government Area Managers
Profes-
sionals
Technical&
trades
workers
Community
& personal
serv wkrs
Clerical &
admin
workers
Sales
workers
Machine
operators
& drivers
Labour-
ers
Not
stated(b) Persons
% of
total
Yarra Ranges (S) 13 16 12 3 10 6 - 3 - 63 5.1
Boroondara (C) 8 16 4 6 7 5 - - - 46 3.8
Monash (C) 14 10 10 6 4 6 - 3 - 53 4.3
Knox (C) 7 12 19 6 15 4 3 - - 66 5.4
Bayside (C) 12 12 5 - 9 3 - - - 41 3.3
Port Phillip (C) 9 24 8 3 6 5 - - - 55 4.5
Kingston (C) 11 8 10 4 7 5 - - - 45 3.7
Whitehorse (C) 7 10 14 - 3 - - 3 - 37 3.0
Glen Eira (C) 5 8 5 - 9 6 - 3 - 36 2.9
Stonnington (C) 13 19 6 3 - 4 - 3 - 48 3.9
Other LGAs(c) 130 187 118 64 106 32 30 51 17 735 60.0
Victoria 229 322 211 95 176 76 33 66 17 1,225 100.0
(a)This variable is applicable to employed persons.
(a)Includes 'inadequately described'.
(c)Other Local Government Areas include 'no usual address' and 'Unincorporated Victoria'.
24
TotalOccupation(a), Switzerland-born (Persons)
Victorian Community Profiles: 2006 Census
Switzerland-Born
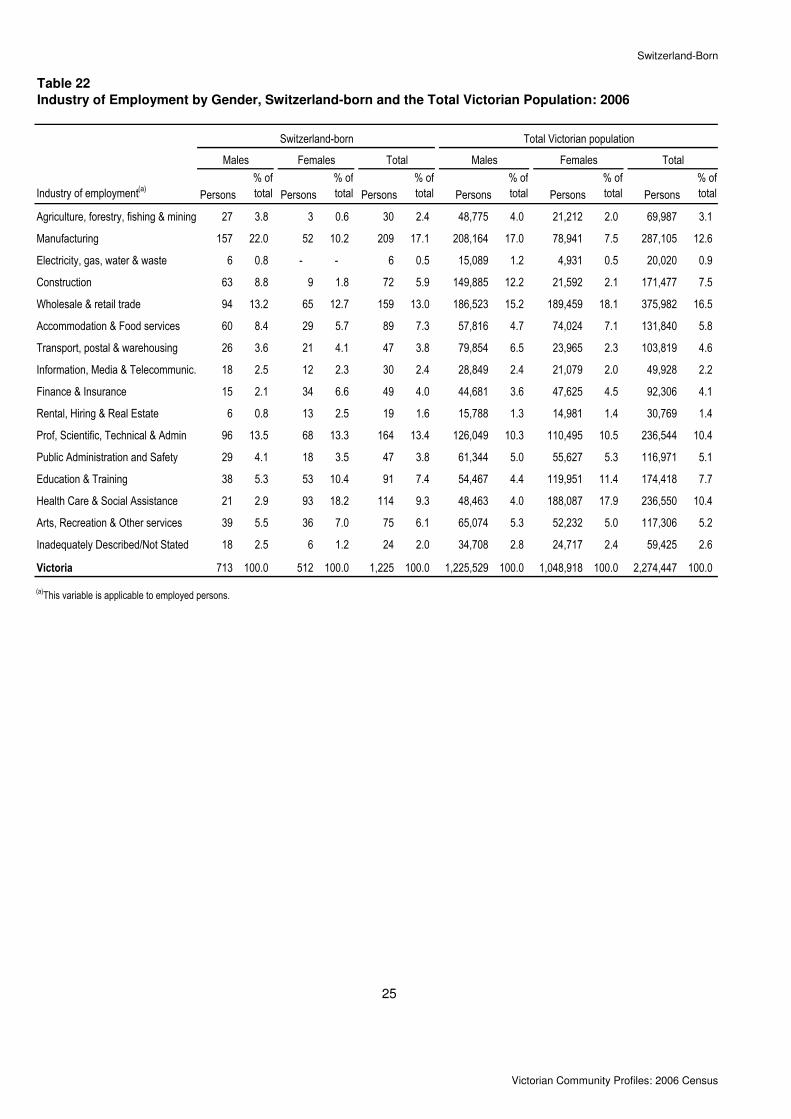
Table 22
Industry of Employment by Gender, Switzerland-born and the Total Victorian Population: 2006
Industry of employment(a) Persons
% of
total Persons
% of
total Persons
% of
total Persons
% of
total Persons
% of
total Persons
% of
total
Agriculture, forestry, fishing & mining 27 3.8 3 0.6 30 2.4 48,775 4.0 21,212 2.0 69,987 3.1
Manufacturing 157 22.0 52 10.2 209 17.1 208,164 17.0 78,941 7.5 287,105 12.6
Electricity, gas, water & waste 6 0.8 - - 6 0.5 15,089 1.2 4,931 0.5 20,020 0.9
Construction 63 8.8 9 1.8 72 5.9 149,885 12.2 21,592 2.1 171,477 7.5
Wholesale & retail trade 94 13.2 65 12.7 159 13.0 186,523 15.2 189,459 18.1 375,982 16.5
Accommodation & Food services 60 8.4 29 5.7 89 7.3 57,816 4.7 74,024 7.1 131,840 5.8
Transport, postal & warehousing 26 3.6 21 4.1 47 3.8 79,854 6.5 23,965 2.3 103,819 4.6
Information, Media & Telecommunic. 18 2.5 12 2.3 30 2.4 28,849 2.4 21,079 2.0 49,928 2.2
Finance & Insurance 15 2.1 34 6.6 49 4.0 44,681 3.6 47,625 4.5 92,306 4.1
Rental, Hiring & Real Estate 6 0.8 13 2.5 19 1.6 15,788 1.3 14,981 1.4 30,769 1.4
Prof, Scientific, Technical & Admin 96 13.5 68 13.3 164 13.4 126,049 10.3 110,495 10.5 236,544 10.4
Public Administration and Safety 29 4.1 18 3.5 47 3.8 61,344 5.0 55,627 5.3 116,971 5.1
Education & Training 38 5.3 53 10.4 91 7.4 54,467 4.4 119,951 11.4 174,418 7.7
Health Care & Social Assistance 21 2.9 93 18.2 114 9.3 48,463 4.0 188,087 17.9 236,550 10.4
Arts, Recreation & Other services 39 5.5 36 7.0 75 6.1 65,074 5.3 52,232 5.0 117,306 5.2
Inadequately Described/Not Stated 18 2.5 6 1.2 24 2.0 34,708 2.8 24,717 2.4 59,425 2.6
Victoria 713 100.0 512 100.0 1,225 100.0 1,225,529 100.0 1,048,918 100.0 2,274,447 100.0
(a)This variable is applicable to employed persons.
25
Switzerland-born Total Victorian population
Males Females Total Males Females Total
Victorian Community Profiles: 2006 Census

Switzerland-Born
Table 23
Industry of Employment by Top Ten Local Government Area, Switzerland-born, Victoria: 2006
Local
Government Area
Agri,
forestry,
fishing
&mining
Manu-
facturing
Elect,
gas,
water &
waste
Cons-
truction
Whole-
sale
& retail
Accom
& Food
Serv.
Trans-
port,
postal,
w'house
Info,
Media,
Teleco
mms
Finance,
Insure,
Rental,
Real est.
Prof,
Sci,
Tech &
Admin
Support
Public
Admin
&
Safety
Educ,
Training
Health
Care
Arts,
Recrea-
tion,
Other
service
Not
stated(b) Persons
% of
total
Yarra Ranges (S) 3 12 - 3 10 - 9 3 3 3 4 12 3 - 65 5.3
Boroondara (C) - - - - 7 6 6 - 3 6 - 13 6 - 47 3.8
Monash (C) - 11 - 4 8 6 5 3 - 3 - 7 - 3 50 4.1
Knox (C) - 17 - 8 6 - - - 3 10 - 16 3 - 63 5.1
Bayside (C) - 6 3 - 9 - - - 3 7 - 10 - - 38 3.1
Port Phillip (C) - 6 3 6 6 3 - 3 9 8 6 9 - - 59 4.8
Kingston (C) - 6 - - 11 8 - - 6 6 - 5 3 3 48 3.9
Whitehorse (C) - 4 - - 11 6 - - 7 10 - 4 - - 42 3.4
Glen Eira (C) - 8 - 3 8 - - - - 3 - - 12 - 34 2.8
Stonnington (C) - 3 - - 11 6 - - 3 9 3 6 3 3 47 3.8
Other LGAs(c) 27 136 - 48 72 54 27 21 31 99 34 123 45 15 732 59.8
Victoria 30 209 6 72 159 89 47 30 68 164 47 205 75 24 1,225 100
(a)This variable is applicable to employed persons.(b) Includes 'Inadequately Described'.(c)Other Local Government Areas include 'No usual address' and 'Unincorporated Victoria'.
26
TotalIndustry of employment(a), Switzerland-born (Persons)
Victorian Community Profiles: 2006 Census
Switzerland-Born
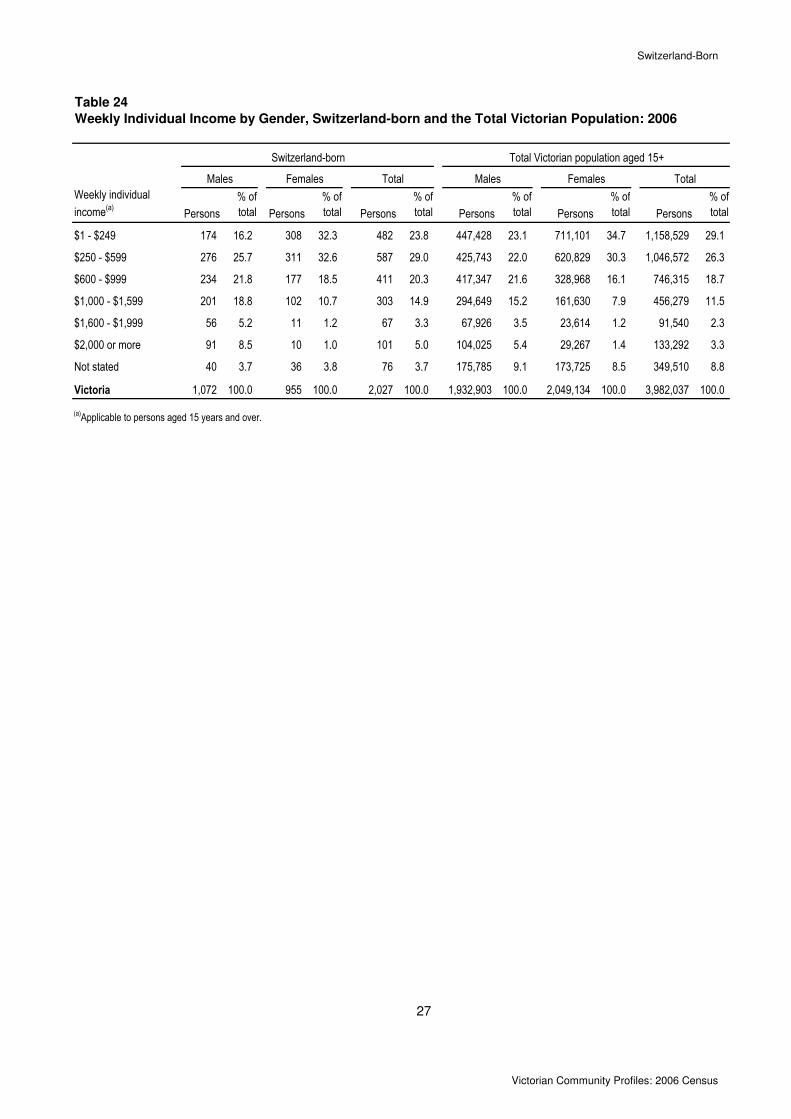
Table 24
Weekly Individual Income by Gender, Switzerland-born and the Total Victorian Population: 2006
Weekly individual
income(a)Persons
% of
total Persons
% of
total Persons
% of
total Persons
% of
total Persons
% of
total Persons
% of
total
$1 - $249 174 16.2 308 32.3 482 23.8 447,428 23.1 711,101 34.7 1,158,529 29.1
$250 - $599 276 25.7 311 32.6 587 29.0 425,743 22.0 620,829 30.3 1,046,572 26.3
$600 - $999 234 21.8 177 18.5 411 20.3 417,347 21.6 328,968 16.1 746,315 18.7
$1,000 - $1,599 201 18.8 102 10.7 303 14.9 294,649 15.2 161,630 7.9 456,279 11.5
$1,600 - $1,999 56 5.2 11 1.2 67 3.3 67,926 3.5 23,614 1.2 91,540 2.3
$2,000 or more 91 8.5 10 1.0 101 5.0 104,025 5.4 29,267 1.4 133,292 3.3
Not stated 40 3.7 36 3.8 76 3.7 175,785 9.1 173,725 8.5 349,510 8.8
Victoria 1,072 100.0 955 100.0 2,027 100.0 1,932,903 100.0 2,049,134 100.0 3,982,037 100.0
(a)Applicable to persons aged 15 years and over.
27
Switzerland-born Total Victorian population aged 15+
Males Females Total Males Females Total
Victorian Community Profiles: 2006 Census

Switzerland-Born
Table 25
Weekly Individual Income by Top Ten Local Government Area, Switzerland-born, Victoria: 2006
Local Government Area
$1 -
$249
$250 -
$599
$600 -
$999
$1,000 -
$1,599
$1,600 -
$1,999
$2,000
or more
Not
stated Persons
% of
total
Yarra Ranges (S) 32 34 14 20 3 - - 103 5.1
Boroondara (C) 19 21 12 17 7 7 3 86 4.2
Monash (C) 31 38 17 9 3 - - 98 4.8
Knox (C) 16 26 23 18 7 - 3 93 4.6
Bayside (C) 18 12 13 7 8 - 3 61 3.0
Port Phillip (C) 14 21 10 13 7 13 3 81 4.0
Kingston (C) 22 24 12 6 - 6 8 78 3.8
Whitehorse (C) 26 24 12 9 - - 4 75 3.7
Glen Eira (C) 7 26 16 12 4 3 - 68 3.4
Stonnington (C) 18 9 6 9 6 11 6 65 3.2
Other LGAs(b) 279 352 276 183 22 61 46 1,219 60.1
Victoria 482 587 411 303 67 101 76 2,027 100.0
(a)Applicable to persons aged 15 years and over.
(b)Other Local Government Areas include 'no usual address' and 'Unincorporated Victoria'.
28
TotalWeekly individual income(a), Switzerland-born (Persons)
Victorian Community Profiles: 2006 Census

Switzerland-Born
Table 26
Housing Tenure Type by Gender, Switzerland-born and the Total Victorian Population: 2006
Tenure type(a) Persons
% of
total Persons
% of
total Persons
% of
total Persons
% of
total Persons
% of
total Persons
% of
total
Fully owned 486 42.5 439 41.3 925 42.0 711,859 29.4 773,302 30.8 1,485,161 30.1
Being purchased(b) 359 31.4 338 31.8 697 31.6 977,295 40.4 985,182 39.2 1,962,477 39.8
Rented & rent free 242 21.2 226 21.3 468 21.2 509,725 21.1 531,356 21.2 1,041,081 21.1
Other(c) 12 1.0 3 0.3 15 0.7 12,131 0.5 14,307 0.6 26,438 0.5
Not stated 21 1.8 22 2.1 43 2.0 145,241 6.0 140,481 5.6 285,722 5.8
Not applicable(d)23 2.0 34 3.2 57 2.6 64,158 2.7 67,385 2.7 131,543 2.7
Victoria 1,143 100.0 1,062 100.0 2,205 100.0 2,420,409 100.0 2,512,013 100.0 4,932,422 100.0
(a)This table counts persons in dwellings of a particular tenure type. Tenure type is applicable to occupied private dwellings.(b)Includes being purchased under a rent/buy scheme.(c)Includes being occupied under a life tenure scheme, and other tenure type.(d)Includes persons counted in 'non-private dwellings' and 'migratory and off-shore Census districts'.
29
Switzerland-born Total Victorian population
Males Females Total Males Females Total
Victorian Community Profiles: 2006 Census

Switzerland-Born
Table 27
Housing Tenure Type by Top Ten Local Government Areas, Switzerland-born, Victoria: 2006
Local Government Area
Fully
owned
Being
purchased(b)Rented
& rent free Other(c)Not
stated
Not
applicable(d) Persons
% of
total
Yarra Ranges (S) 64 29 14 - - 7 114 5.2
Boroondara (C) 48 31 26 - 3 3 111 5.0
Monash (C) 61 31 6 - - 5 103 4.7
Knox (C) 60 33 3 - - 3 99 4.5
Bayside (C) 26 26 25 - - 10 87 3.9
Port Phillip (C) 12 13 54 - - - 79 3.6
Kingston (C) 21 30 26 - 6 - 83 3.8
Whitehorse (C) 44 22 11 - - - 77 3.5
Glen Eira (C) 35 16 17 3 - - 71 3.2
Stonnington (C) 25 21 26 - - - 72 3.3
Other LGAs(e) 529 445 260 12 34 29 1,309 59.4
Victoria 925 697 468 15 43 57 2,205 100.0
(a)This table counts persons in dwellings of a particular tenure type. Tenure type is applicable to occupied private dwellings.(b)Includes being purchased under a rent and buy scheme.
(c)Includes being occupied under a life tenure scheme, and other tenure type.
(d)Includes persons counted in 'non-private dwellings' and 'migratory and off-shore Census districts'.
(e)Other Local Government Areas include 'no usual address' and 'Unincorporated Victoria'.
30
TotalHousing tenure type(a), Switzerland-born (Persons)
Victorian Community Profiles: 2006 Census

Switzerland-Born
Table 28
Family Composition by Gender, Switzerland-born and the Total Victorian Population: 2006
Family composition(a)Persons
% of
total Persons
% of
total Persons
% of
total Persons
% of
total Persons
% of
total Persons
% of
total
Couple family no children 384 33.6 281 26.5 665 30.2 460,290 19.0 462,970 18.4 923,260 18.7
Couple family with children 486 42.5 405 38.1 891 40.4 1,203,681 49.7 1,157,863 46.1 2,361,544 47.9
One-parent family 36 3.1 105 9.9 141 6.4 202,689 8.4 314,270 12.5 516,959 10.5
Other family 13 1.1 6 0.6 19 0.9 25,783 1.1 24,762 1.0 50,545 1.0
Not applicable(b)224 19.6 265 25.0 489 22.2 527,966 21.8 552,148 22.0 1,080,114 21.9
Victoria 1,143 100.0 1,062 100.0 2,205 100.0 2,420,409 100.0 2,512,013 100.0 4,932,422 100.0
(a)This table counts persons in families classified into different types, applicable to families in family households.(b)Persons living in lone person, group or non-classifiable households, and persons counted in non-private dwellings and migratory and off-shore collection districts.
31
Switzerland-born Total Victorian population
Males Females Total Males Females Total
Victorian Community Profiles: 2006 Census

Switzerland-Born
Table 29
Citizenship by Gender, Switzerland-born and the Total Victorian Population: 2006
Citizenship Persons
% of
total Persons
% of
total Persons
% of
total Persons
% of
total Persons
% of
total Persons
% of
total
Australian 868 75.9 813 76.4 1,681 76.2 2,078,403 85.9 2,179,338 86.8 4,257,741 86.3
Not Australian 262 22.9 241 22.7 503 22.8 183,647 7.6 187,173 7.5 370,820 7.5
Not stated 13 1.1 10 0.9 23 1.0 158,357 6.5 145,504 5.8 303,861 6.2
Victoria 1,143 100.0 1,064 100.0 2,207 100.0 2,420,407 100.0 2,512,015 100.0 4,932,422 100.0
32
Switzerland-born Total Victorian population
Males Females Total Males Females Total
Victorian Community Profiles: 2006 Census

Switzerland-Born
Table 30
Citizenship by Top Ten Local Government Areas, Switzerland-born, Victoria: 2006
Local Government Area Australian
Not
Australian
Not
stated Persons
% of
total
Yarra Ranges (S) 89 25 0 114 5.2
Boroondara (C) 88 15 4 107 4.8
Monash (C) 93 12 0 105 4.8
Knox (C) 95 0 0 95 4.3
Bayside (C) 42 33 3 78 3.5
Port Phillip (C) 34 44 0 78 3.5
Kingston (C) 61 12 3 76 3.4
Whitehorse (C) 55 18 3 76 3.4
Glen Eira (C) 57 18 0 75 3.4
Stonnington (C) 57 18 0 75 3.4
Other LGAs(a) 1,010 308 10 1,328 60.2
Victoria 1,681 503 23 2,207 100.0
(a)Other Local Government Areas include 'no usual address' and 'Unincorporated Victoria'.
33
TotalCitizenship, Switzerland-born (Persons)
Victorian Community Profiles: 2006 Census

Figure 3 - Melbourne Metropolitan Local Government Areas - 2006
34

Figure 4 - Regional Victoria Local Government Areas - 2006
35

Level 11, 1 Spring StreetMelbourne, Victoria 3000
Telephone (03) 9208 3184Facsimile (03) 9208 3179Email [email protected]
www.multicultural.vic.gov.au