swimming starts: a comparison of relay...
TRANSCRIPT

1 2.671 Go Forth and Measure
2.671 Measurement and Instrumentation Tuesday PM
Prof. Swithenbank 5/4/2015
SWIMMING STARTS: A COMPARISON OF RELAY AND INDIVIDUAL RACING DIVE REACTION TIME, SPEED, AND DISTANCE
Michael Everett
MIT Cambridge, MA, USA
ABSTRACT In competitive swimming, relay starts are known to
be faster than starts from a standstill but exactly how much faster and why are unknown. Measurements were made using iPhone video recordings and Logger Pro software for analysis. The average reaction time for a relay start is 0.26 ± 0.03 seconds and 0.71 ± 0.03 seconds for a flat start. With 95% confidence, the average relay start reaction time is 0.39 seconds shorter than the flat start time. The maximum speeds reached during relay and flat starts are statistically indistinguishable with 95% confidence, as are horizontal distance traveled and angle of entry. This indicates the difference in times for relay splits and individual races is mainly due to the advantage of anticipating the start and not due to the extra steps or arm swings allowed when aggregated over all swimmers.
INTRODUCTION
Competitive swimming is all about racing and becoming faster. In one season of collegiate swimming, each athlete spends about 500 hours in practice and is satisfied with an improvement of only a few tenths of a second. Most of the time at practice is spent swimming laps back and forth to improve aerobic ability and race strategy. Often only a few hours are dedicated to more technical aspects of the race, like the start and turns at the wall. This paper focuses on the start of the race, which is a dive off of starting blocks for three of the four strokes.
The dive in an individual race is very different from that of a relay race (Figure 1) and the exact rules are covered in Section 2.1. Essentially, in an individual race, the swimmer must be completely still and listen to the voice of the announcer. In a relay, the swimmer can anticipate the start by gauging how fast the previous swimmer is moving toward the wall, and can step into the dive. Due to this advantage, swimmers often have
significantly faster times on relays as compared to “flat” starts, but the difference varies from athlete to athlete. There are many common ideas of why this difference occurs including the mental aspect of being in a team race such as a relay, or a higher speed upon entering the water due to arm swings or steps forward.
Reaction times and speed upon entering the water of these different types of dives were measured using video analysis. These factors are then related to real race times to determine how important the dive is compared to other factors. Section 1 explains the background and theory of the racing dive; the experimental setup is covered in Section 3; Section 4 contains results and trends; and Section 5 has conclusions.
Figure 1: 2 Types of Starts. On the left is the flat start. Before the race starts, swimmers must be completely still. On the right is a relay exchange. Notice how the incoming swimmer (red box) touches the wall before the diver’s feet (yellow box) leave the starting block
BACKGROUND
NCAA RULES The specifics of the individual event start (flat start)
are described in NCAA Rulebook [1] Rule 2, Section 1, Article 1:

2 2.671 Go Forth and Measure
In all swimming races with the exception of backstroke and medley relay races, upon a signal by whistle from the referee, the swimmers shall step onto his or her starting platform and shall stand, without excessive noise or movement, with both feet on the top of the platform. The referee then shall turn control of the competitors over to the starter. The starter may give brief instructions deemed necessary. Then, upon the starter’s verbal command “Take your mark,” each swimmer, with no unnecessary noise or movement, immediately shall assume any desired starting position with at least one foot on the front edge of the starting platform. (With prior approval of the referee, a swimmer may start in the water but must have at least one hand on the wall or starting platform.) Sufficient time shall be allowed to enable each swimmer to assume a stationary starting position; however, all swimmers are expected to take their starting positions at approximately the same time, and unnecessary noise, movement or delays shall not be permitted. When the starter sees that the swimmers are stationary, the starter shall start the race with an electronic-sound device.
NCAA Rulebook Rule 2, Section 1, Article 7c explains the relay start:
1. The swimmer is allowed (but not required) to use a step-forward start (i.e., to move forward on the top of the starting platform immediately before takeoff); however, all velocity in the start must be generated after the swimmer is on the platform. 2. The swimmer may be in motion when the preceding teammate finishes his or her leg of the race; however, the swimmer must have at least one foot in contact with the starting platform when (or after) the teammate finishes. 3. If the swimmer leaves the starting mark before the preceding teammate finishes his or her leg of the race, that relay team shall be disqualified.
IMPORTANT PARAMETERS OF A START There are many parameters involved in a swimming
start, including speed, reaction time, horizontal distance traveled, angle of entry, and time in the air. A good start depends on all of these characteristics and the relative importance of each varies depending on the athlete. Lyttle et al. [2] proposed that there is a compromise between getting off of the blocks as quickly as possible (fast reaction time) and pushing hard off of the blocks (high maximum speed, horizontal distance). Ruschel et al. [3] found that horizontal distance traveled is most correlated with performance of a swimming start, but time in the air is not as relevant. Accordingly, many parameters were measured to determine how they vary between the two types of start: relay and flat.
One way to measure reaction time and speed upon entering water starts with video recording. Video analysis software calculates ! and !, which are horizontal and vertical positions as explained in the Experimental Design section. With ! and !, it is possible to calculate more race-relevant statistics. Speed is more important than velocity in ! or ! because maximizing a velocity could be done with a “belly-flop” or vertical dive. In reality, during a fast dive the swimmer’s body bends upon entering the water to translate speed into ! velocity underwater.
Once the swimmer’s feet leave the starting block, he is a complex body whose center of mass translates much like an inanimate point mass. Every swimmer does something different with their arms, head, and feet in the air to maximize the distance they travel and to enter the water in an efficient shape. Thus, the video analysis software was used to track the approximate center of mass (near the hips) during flight. A fit of ! and ! allows extrapolation of body angle, !, upon entering the water (Figure 4).
HISTORICAL RESULTS The difference in relay times and flat start times
from the 2015 NCAA Championships [2] can be calculated using meet results (Figure 2). With 95% confidence, the average reaction time for a flat start is at least 0.43 seconds greater than for a relay start. The average relay start reaction time is 0.21 seconds whereas average flat start reaction time is 0.67 seconds. These times are measured using specialized force plates on the starting blocks, capacitive touchpads on the walls, and a centralized timing system. The Experimental Design section explains a less hardware-intensive setup to measure the same quantity.

3 2.671 Go Forth and Measure
Figure 2: Competition Reaction Times. Relay start reaction times are faster on average and have a larger variance than flat starts. This data comes from 2015 NCAA Division I Swimming Championships for 50 Free and 200 Free Relay Finals.
EXPERIMENTAL DESIGN
EQUIPMENT AND SETUP The data was collected with video analysis. An
iPhone camera on a tripod shot at 30 frames/second and captured the starting block and about 5 yards of the 25-yard lane. This was enough to see the entire dive from starting block to entry in water (Figure 4). To account for variability between trials and swimmers, 5 male swimmers each performed 5 flat starts and then 5 relay starts in the span of about 30 minutes.
LOGGER PRO ANALYSIS The .mov files from the camera were inserted into a
Logger Pro file for frame-by-frame viewing. One frame at a time, the location of the center of the upper ring of the swimsuit was recorded (Figure 3). There was some blurring which led to inaccuracy of position but with about 40 positions per dive, this was minimal.
For flat starts, the announcer waved a hand in front of the camera at the same time as he said, “go,” in order to begin the time count for reaction time. By advancing frame-by-frame, the number of frames between the hand wave and the swimmer’s feet leaving the starting block were divided by the frame rate to calculate reaction time. For relay starts, the time count started when the incoming swimmer’s hand touched the wall. As expected, the swimmer on the block was already moving before the hand touch.
Figure 3: Flat start trajectory. The yellow lines are the origin and axes and the blue dots show where the swimmer’s center of mass is as time passes. The blurring on the right side image occurred in all trials. Both images are zoomed in to show detail.
The frame rate was used to convert frame number to
elapsed time. This was assumed to be 30 frames/second but is not critical since the important results are relative times rather than absolute. Finally, the positions were calibrated using the square tiles on the pool deck, which are a standard 1” across. The origin for each measurement was set at the front of the block for x-position, and the surface of the water for y-position. This scale is shown in Figure 4 by the light green line in the bottom center.
Figure 4: Single dive trajectory. The viewable area from the camera setup was wide enough to see the starting block all the way to the entry into water. The trail of blue dots shows the entire trajectory of a single, flat start. The green line near the bottom shows the scale: its actual length was 27”. The angle Θ was calculated using the last two (x,y) pairs as described in Section 2.2 After extracting the blue dots from the Logger Pro
analysis, nice trajectory curves are generated to display height and length of dives by different swimmers (Figure 5).
0"0.1"0.2"0.3"0.4"0.5"
)0.05"
0.05"
0.15"
0.25"
0.35"
0.45"
0.55"
0.65"
0.75"
0.85"
Frequency)
)Competition)Reaction)Time)(s))
Relay"Start"Flat"Start"
4 2.671 Go Forth and Measure
Figure 5: Flat Start Trajectories. 5 swimmers’ XY positions are plotted at once to show the different trajectories to reach a similar end result. Swimmer A traveled the farthest away from the starting block on his dive and also jumped the highest off of the block. This figure does not show time, just trajectory.
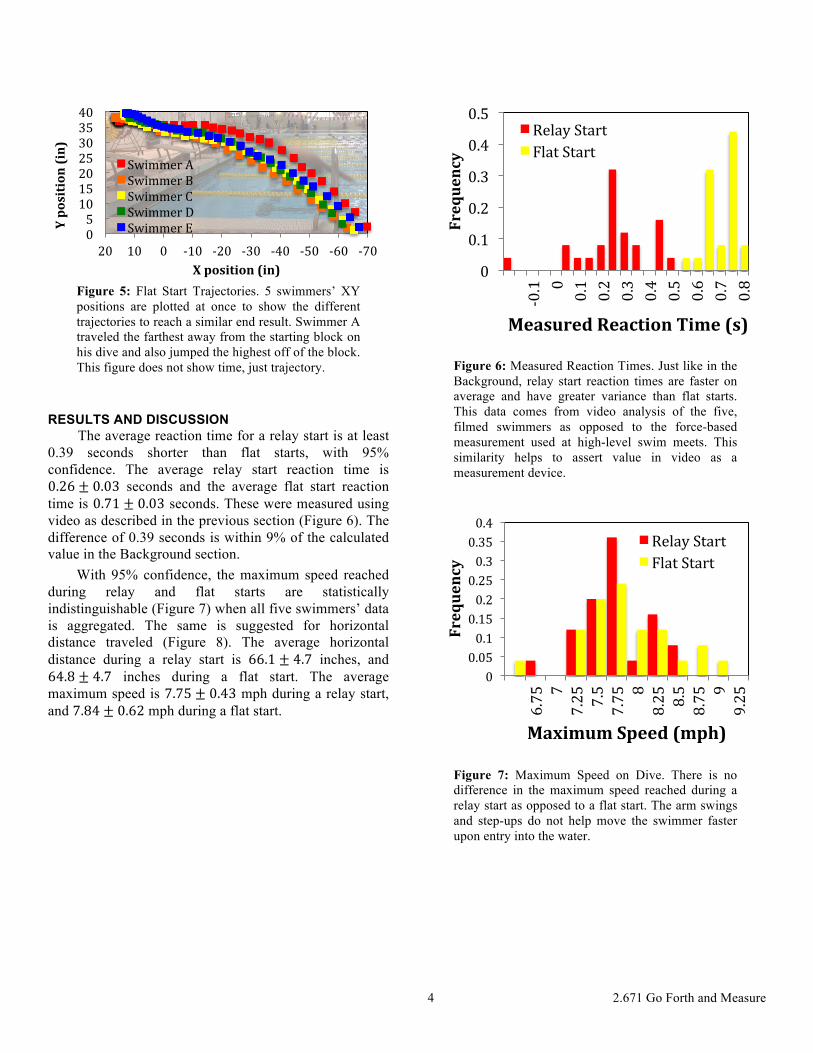
RESULTS AND DISCUSSION The average reaction time for a relay start is at least
0.39 seconds shorter than flat starts, with 95% confidence. The average relay start reaction time is 0.26 ± 0.03 seconds and the average flat start reaction time is 0.71 ± 0.03 seconds. These were measured using video as described in the previous section (Figure 6). The difference of 0.39 seconds is within 9% of the calculated value in the Background section.
With 95% confidence, the maximum speed reached during relay and flat starts are statistically indistinguishable (Figure 7) when all five swimmers’ data is aggregated. The same is suggested for horizontal distance traveled (Figure 8). The average horizontal distance during a relay start is 66.1 ± 4.7 inches, and 64.8 ± 4.7 inches during a flat start. The average maximum speed is 7.75 ± 0.43 mph during a relay start, and 7.84 ± 0.62 mph during a flat start.
Figure 6: Measured Reaction Times. Just like in the Background, relay start reaction times are faster on average and have greater variance than flat starts. This data comes from video analysis of the five, filmed swimmers as opposed to the force-based measurement used at high-level swim meets. This similarity helps to assert value in video as a measurement device.
Figure 7: Maximum Speed on Dive. There is no difference in the maximum speed reached during a relay start as opposed to a flat start. The arm swings and step-ups do not help move the swimmer faster upon entry into the water.
0"5"10"15"20"25"30"35"40"
)70")60")50")40")30")20")10"0"10"20"
Y)position)(in))
X)position)(in))
Swimmer"A"Swimmer"B"Swimmer"C"Swimmer"D"Swimmer"E"
0"0.1"0.2"0.3"0.4"0.5"
)0.1" 0" 0.1"
0.2"
0.3"
0.4"
0.5"
0.6"
0.7"
0.8"
Frequency)
Measured)Reaction)Time)(s))
Relay"Start"Flat"Start"
0"0.05"0.1"0.15"0.2"0.25"0.3"0.35"0.4"
6.75" 7"
7.25" 7.5"
7.75" 8"
8.25" 8.5"
8.75" 9"
9.25"
Frequency)
Maximum)Speed)(mph))
Relay"Start"Flat"Start"
5 2.671 Go Forth and Measure
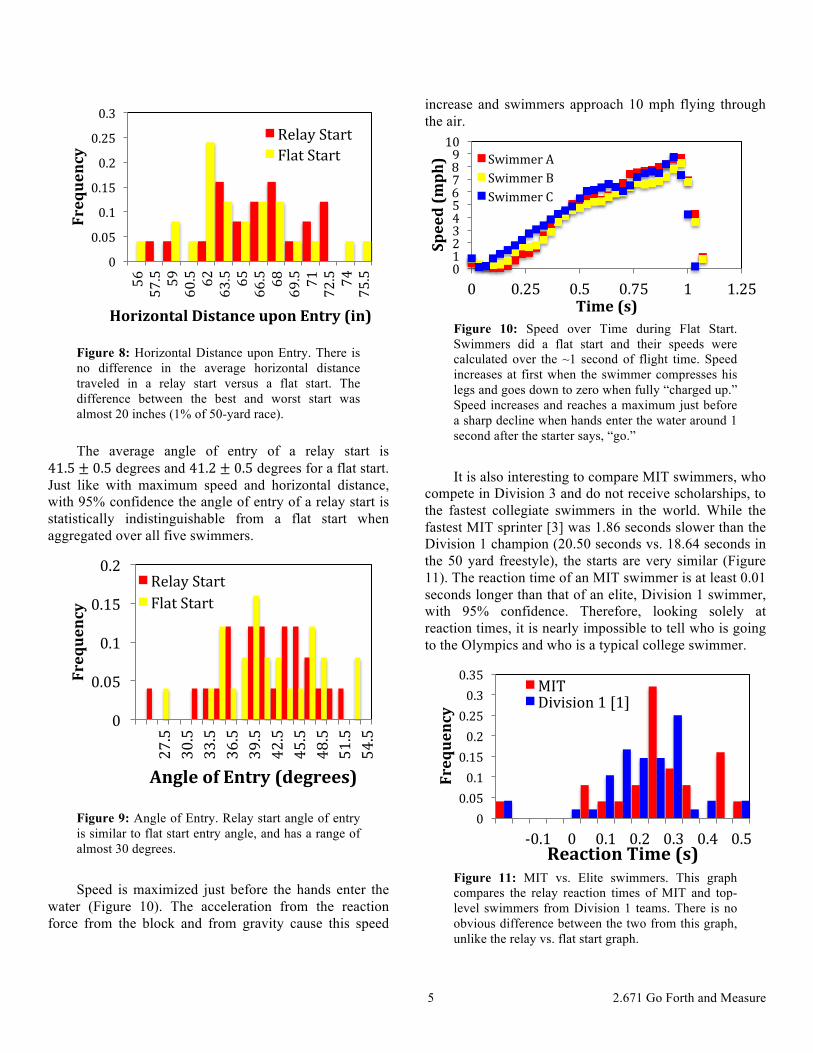
Figure 8: Horizontal Distance upon Entry. There is no difference in the average horizontal distance traveled in a relay start versus a flat start. The difference between the best and worst start was almost 20 inches (1% of 50-yard race). The average angle of entry of a relay start is
41.5 ± 0.5 degrees and 41.2 ± 0.5 degrees for a flat start. Just like with maximum speed and horizontal distance, with 95% confidence the angle of entry of a relay start is statistically indistinguishable from a flat start when aggregated over all five swimmers.
Figure 9: Angle of Entry. Relay start angle of entry is similar to flat start entry angle, and has a range of almost 30 degrees. Speed is maximized just before the hands enter the
water (Figure 10). The acceleration from the reaction force from the block and from gravity cause this speed
increase and swimmers approach 10 mph flying through the air.
Figure 10: Speed over Time during Flat Start. Swimmers did a flat start and their speeds were calculated over the ~1 second of flight time. Speed increases at first when the swimmer compresses his legs and goes down to zero when fully “charged up.” Speed increases and reaches a maximum just before a sharp decline when hands enter the water around 1 second after the starter says, “go.”
It is also interesting to compare MIT swimmers, who
compete in Division 3 and do not receive scholarships, to the fastest collegiate swimmers in the world. While the fastest MIT sprinter [3] was 1.86 seconds slower than the Division 1 champion (20.50 seconds vs. 18.64 seconds in the 50 yard freestyle), the starts are very similar (Figure 11). The reaction time of an MIT swimmer is at least 0.01 seconds longer than that of an elite, Division 1 swimmer, with 95% confidence. Therefore, looking solely at reaction times, it is nearly impossible to tell who is going to the Olympics and who is a typical college swimmer.
Figure 11: MIT vs. Elite swimmers. This graph compares the relay reaction times of MIT and top-level swimmers from Division 1 teams. There is no obvious difference between the two from this graph, unlike the relay vs. flat start graph.
0"0.05"0.1"0.15"0.2"0.25"0.3"
56"
57.5" 59"
60.5" 62"
63.5" 65"
66.5" 68"
69.5" 71"
72.5" 74"
75.5"
Frequency)
Horizontal)Distance)upon)Entry)(in))
Relay"Start"Flat"Start"
0"
0.05"
0.1"
0.15"
0.2"
27.5"
30.5"
33.5"
36.5"
39.5"
42.5"
45.5"
48.5"
51.5"
54.5"
Frequency)
Angle)of)Entry)(degrees))
Relay"Start"Flat"Start"
0"1"2"3"4"5"6"7"8"9"10"
0" 0.25" 0.5" 0.75" 1" 1.25"
Speed)(mph))
Time)(s))
Swimmer"A"Swimmer"B"Swimmer"C"
0"0.05"0.1"0.15"0.2"0.25"0.3"0.35"
)0.1" 0" 0.1" 0.2" 0.3" 0.4" 0.5"
Frequency)
Reaction)Time)(s))
MIT"Division"1"[1]"

6 2.671 Go Forth and Measure
In Figures 6 and 11 there are data points with negative reaction times. This means the swimmer “false started” and this would be a disqualification in competition. The swimmer dove into the pool before the previous swimmer touched the wall. It happens a few times per meet regardless of level.
Since speed and horizontal distance do not differ significantly when all swimmers are combined (Figures 7, 8), the statistics were also compared swimmer-by-swimmer (Figures 12, 13). For example, swimmer C reaches a greater average maximum speed during a relay start than flat start, but does not travel as far. Conversely, swimmer E shows opposite behavior. There is no trend that covers all five of the swimmers in this experiment; instead there is now information available for each swimmer to learn more about his technique and where to improve.
Figure 12: Horizontal Distance Traveled by Swimmer. Swimmer C travels further on a flat start than a relay start but swimmer C does the opposite.
Figure 13: Maximum Speed by Swimmer. Again, there is no clear trend across all five swimmers, since some reach a higher average maximum speed on one type of dive than the other.
The swimmers in the experiment complained of fatigue because 10 dives in quick succession is much more than a typical practice or competition. More trials are required to draw insights about each swimmer’s technique since error bars are large compared to differences in magnitude (Figures 12, 13). Measuring more than 5 different swimmers would better account for the different start techniques (e.g. one foot forward versus two, or a full forward step on a relay start versus a half step). A higher frame rate on the video would improve precision and less blurring in the video footage would improve accuracy of measured positions.
CONCLUSIONS With 95% confidence, the reaction time of a relay
start is 0.39 seconds shorter than that of a flat start. The average relay start reaction time is 0.26 ± 0.03 seconds and the average flat start reaction time is 0.71 ± 0.03 seconds. For each of the three statistics: horizontal distance, maximum speed, and angle of entry, there is no statistically significant difference between a flat and relay start when aggregated over all five swimmers. A swimmer enters the water at an average horizontal distance of 66.1 ± 4.7 inches during a relay start, and 64.8 ± 4.7 inches during a flat start. The average maximum speed is 7.75 ± 0.43 mph during a relay start, and 7.84 ± 0.62 mph during a flat start. A swimmer enters the water at an average angle of 41.5 ± 0.5 degrees during a relay start, and 41.2 ± 0.5 degrees during a flat start. There is only a small difference of 0.01 seconds between elite swimmers’ reaction times and MIT swimmers’ on relays. Therefore the time in practice is best spent working on components of the race other than relay start reaction time since there is little room to improve.
On an individual basis, for some swimmers there is little difference between their relay and flat starts other than a faster reaction time. For other swimmers, there are strengths and weaknesses exposed by video analysis, which can be accounted for in upcoming practices and competitions.
Because swimmers train for so many hours and race for only a few minutes each season, every race is an important data point for a coach and athlete to learn from. A relation of reaction times of flat and relay starts is helpful in comparing the time of a relay race and an individual race. Currently, the two types of races are disjoint and hard to compare. Now, a relay swim can
50"55"60"65"70"75"80"
Horizontal)Distance)
Traveled)(in))
Relay))Flat)))Relay))Flat))Relay))Flat)Relay))Flat))Relay))Flat))))))))))A)))))))))))))))))))B)))))))))))))))))))))C)))))))))))))))))))))D)))))))))))))))))))E)
6"6.5"7"
7.5"8"
8.5"9"
Maximum
)Speed)(m
ph))
Relay))Flat)))Relay))Flat)))Relay)Flat))Relay))Flat))))Relay))Flat))))))))))A)))))))))))))))))))))B))))))))))))))))))))C))))))))))))))))))))))))D))))))))))))))))))))E)

7 2.671 Go Forth and Measure
accurately be equated to an individual swim time minus 0.39 seconds.
Future work will compare different styles of relay starts, which was briefly mentioned in the Background, to determine which is fastest. Some swimmers step forward with two feet, some do a big arm swing, and some just stand still but all involve anticipation of the start. It will also be useful to automate the video analysis process of this experiment so that swim coaches can utilize this information on their own swimmers using only an iPhone and tripod.
ACKNOWLEDGMENTS The author would like to thank Dr. Barbara Hughey
and the 2.671 course staff for equipment and guidance, as well as Brendon Chiu, Daryl Neubieser, Justin Chiu, Scott Mayberry, and John Matthews for help in data acquisition.
REFERENCES [1] 2014-15 NCAA Swimming and Diving Rulebook
http://www.ncaapublications.com/productdownloads/SW15.pdf (accessed 5/3/15)
[2] Ruschel C., Araùjo L., Pereira S., Roesler H. (2007) Kinematical analysis of the swimming start: block, flight and underwater phases. ISBS-Conference Proceedings 1, 385-388 [3] Lyttle A., Blanksby B., Elliot B., Lloyd D. (1999) Optimal depth for streamlined gliding.: Biomechanics and Medicine in Swimming VIII, Jyväskylä, Finland: University of Jyväskylä.: Keskinen K.L., Komi P.V., Hollander A.P., editors. 165-170 [4] 2015 NCAA Division 1 Championships Results, 3/26/15,
http://www.hawkeyesports.com/livestats/c-swim/ (accessed 4/7/15)
[5] 2014-15 MIT Swimming Schedule/Results, http://mitathletics.com/sports/m-swim/2014-15/schedule (accessed 4/7/15)