swespine the swedish spine register the 2009 … _report2009.pdf · swespine the swedish spine...
TRANSCRIPT

SWESPINE
THE SWEDISH SPINE REGISTER
THE 2009 REPORT www.4s.nu
SEPTEMBER 2009
SWEDISH SOCIETY OF SPINAL SURGEONS
Björn Strömqvist Peter Fritzell Olle Hägg Bo Jönsson ISBN 978-91-978553-1-0

2
Table of contents Introduction 3 I. Preoperative, surgical and follow-up protocols 4 II. Preoperative and surgical data on lumbar spine procedures 2008 Lumbar disc herniation 11 Central spinal stenosis 14 Lateral spinal stenosis 16 Spondylolisthesis 18 DDD/Segmental pain 20 III. 1-year follow-up of lumbar spine procedures in 2008 23 Lumbar disc herniation 23 Central spinal stenosis 25 Lateral spinal stenosis 27 Spondylolisthesis 29 DDD/Segmental pain 31 Oswestry Disability Index (ODI) 34 IV. 2-year follow-up of lumbar spine procedures 2008 35 V. 5-year follow-up of lumbar spine procedures 2008 40 VI. A deeper look at patients operated on for DDD 44 VII. Number of registered operations and follow-up rate on a yearly basis since 1998 58 VIII. Conclusions 59 IX. Examples on publications using SweSpine data 60
3
Introduction The Swedish spine register was proposed in 1993 for documentation of the outcome of degenerative lumbar spine surgery. From 1998 it has been the property of the Swedish Society of Spinal Surgeons consisting of a register group of four spinal surgeons and two part-time secretaries. The protocol which regarding preoperative demographics and postoperative outcome is entirely patient based, whereas surgical data are completed by the surgeon, has gradually developed regarding contents since 1998 and since that time 80-85% of the departments performing spine surgery in Sweden have participated. Since 2007, protocols for other spinal disorders such as metastatic tumors, fractures, deformities and infections are in use and nowadays also cervical and thoracic disorders are being registered. This presentation is the 10th yearly report from SweSpine, focusing on demographics and outcomes of degenerative lumbar spine disorders. Among preoperative demographics are included age, sex, smoking habits, working condition, sick leave, consumption of analgesics, walking distance and pain on the VAS scale as well as the SF-36, EQ-5D and ODI. The total number of patients registered for a lumbar spine operation has gradually increased over the last 10 years (see Figure 51) and this presentation which contains the lumbar spine operations performed during 2008 is based on 5 632 operated patients from 37 departments. The one-year follow-ups presented refer to patients operated on in 2007 and followed-up during 2008 while two-year follow-ups are based on patients operated on in 2006 and followed-up in 2008. The main part of this report concerns basic/demographic data and follow-up data. Each yearly report also contains an analytic part on different subjects and this year we have focused on DDD/Segmental pain (Chapter V). Previous years have focused on topics such as predictors for bad outcome of surgery and gender differences among others. It is our strong conviction that the type of national register as presented in this booklet is very important not only for documenting the changing spectrum of surgery but also for the study of outcome when new methods and results of research projects are implemented in general practice. You will find an English demo-version of the register at our web site www.4s.nu (press British flag). It gives you an idea of how our software works in an on-line setting. The soft ware is available for purchase through any of the contacts below. Swedish Society of Spinal Surgeons/Register Group 2009-10-16 Carina Blom Peter Fritzell Olle Hägg [email protected] [email protected] [email protected] Bo Jönsson Lena Oreby Björn Strömqvist [email protected] [email protected] [email protected] The study has been supported by the National Board of Health and Welfare/Swedish Association of Local Authorities and Regions.

4I. Pre- intra- and postoperative protocols The following pages display pre-, intra- and postoperative protocols. In addition to these, ODI, SF-36 and EQ-5D are also completed preoperatively and at all follow-up time points.

5 Swedish Spine Register
BASIC INFORMATION – LUMBAR SPINE Personal id number: Date filled in: Serial number: It is important that you answer the questions as far as you can. Height: ..................... cm Weight: ...................... kg 1. Gender: 1.. Male 2. Female 2. Do you smoke? 1. Yes 0. No 3. Have you ever had back surgery before? 1. Yes 0. No
If yes, how many times?....... 4. Do you currently receive retirement pension? 1. Yes, full-time
2. Yes, part-time 0. No 5. How heavy is your current work? 0. I don’t work outside home 1. Mild 2. Average 3. Heavy 6. Are you currently unemployed? 1. Yes 0. No 7. Do you currently receive paid sick-leave? 1. Yes, full-time for my back problems If yes, since when?…………….. 2. Yes, part-time for my back problems .......................................................... 3. Yes, due to another illness .......................................................... 0. No
8. Do you currently receive disability benefits 1. Yes, full-time or activity benefits? 2. Yes, part-time 0. No 9. How long have you had your current back pain? 0. I don´t have back pain 1. Less than 3 months 2. 3 to 12 months 3. 1 to 2 years 4. More than 2 years 10. How long have you had pain radiating 0. I don´t have pain radiating to my leg (s) out to your leg(s)? 1. Less than 3 months 2. 3 to 12 months 3. 1 to 2 years 4. More than 2 years 11. Do you take analgesic medications or 1. Yes, regularly tablets for your back problems? 2. Yes, sometimes 0. No
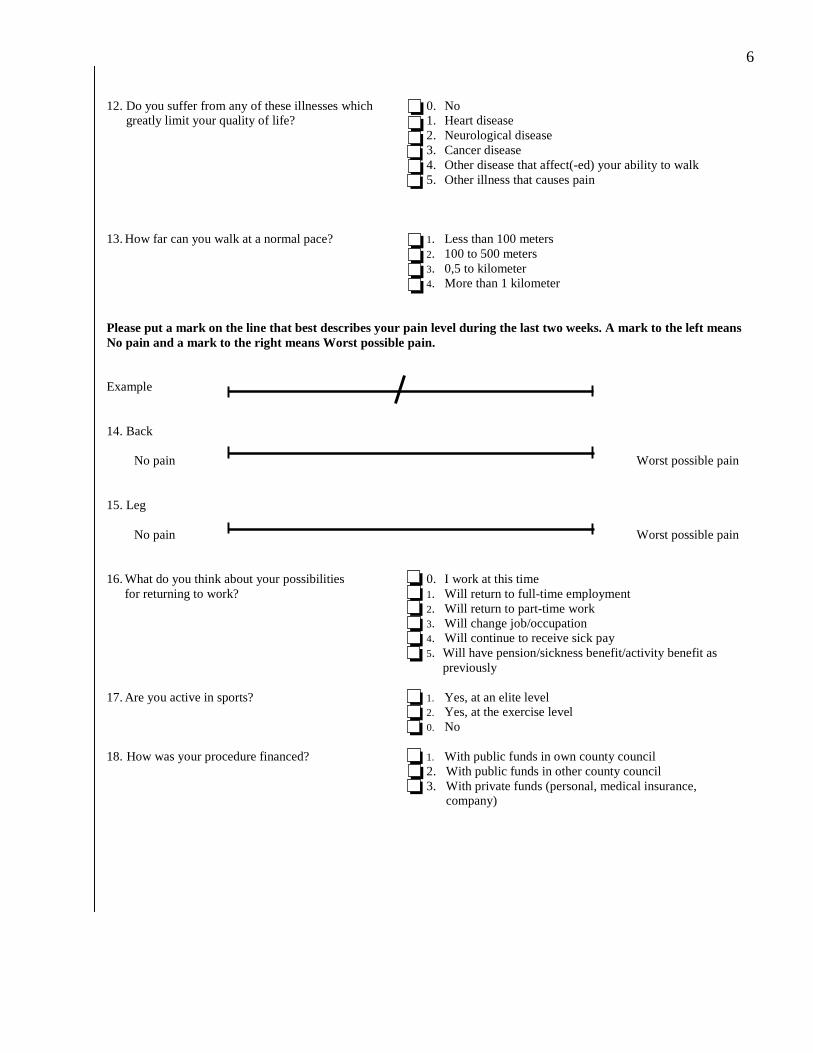
6 12. Do you suffer from any of these illnesses which 0. No greatly limit your quality of life? 1. Heart disease 2. Neurological disease 3. Cancer disease 4. Other disease that affect(-ed) your ability to walk 5. Other illness that causes pain 13. How far can you walk at a normal pace? 1. Less than 100 meters 2. 100 to 500 meters 3. 0,5 to kilometer 4. More than 1 kilometer Please put a mark on the line that best describes your pain level during the last two weeks. A mark to the left means No pain and a mark to the right means Worst possible pain. Example 14. Back No pain Worst possible pain 15. Leg
No pain Worst possible pain
16. What do you think about your possibilities 0. I work at this time for returning to work? 1. Will return to full-time employment
2. Will return to part-time work 3. Will change job/occupation 4. Will continue to receive sick pay 5. Will have pension/sickness benefit/activity benefit as
previously 17. Are you active in sports? 1. Yes, at an elite level 2. Yes, at the exercise level
0. No 18. How was your procedure financed? 1. With public funds in own county council 2. With public funds in other county council
3. With private funds (personal, medical insurance, company)

7
Hospitalization time
Date (YY-MM-DD)
Date of admission Date of surgery Date of discharge
SWEDISH SPINE REGISTER SURGERY LUMBAR SPINE
Patient’s name
Bone transplantation
0 None
1 Autologous – iliac crest
2 Autologous – spinous process/lamina
5 Autologous + allograft bone
6 Autologous + mineral
3 Allograft bone
7 BMP + autologous
8 BMP + allograft bone
9 BMP + mineral
4 Mineral (ceramic, hydroxiapatite etc)
99 Other .............................................................
......................................................................
Implant
Anterior implant Level
Yes No Prox
If yes, fill in implant list Dist
Posterior implant Level
Yes No Prox
If yes, fill in implant list Dist
Type of procedure 1 Elective admission 2 Emergency admission
Surgical procedure
1 Herniated disc surgery (conventional)
2 Herniated disc surgery (mikroscopic)
4 Decompression surgery (conventional)
17 Dekompression surgery (mikroscopic)
5 Decompr + posterior fusion without instr
6 Dekompr + posterior fusion with instr
13 Decompression + PLIF
19 Decompression+ TLIF
7 Posterior fusion without instr
8 Posterior fusion with instr
9 ALIF without instr
10 ALIF with inst
12 PLIF
18 TLIF
20 360 instrumented/global fusion
16 Disc prosthesis
15 Nucleus prosthesis
3 Percutaneous nucleotomy
99 Other procedure.............................................
Diagnosis
1 Paramedian disc herniation
14 Central disc herniation
2 Central spinal stenosis without degen olisthesis
13 Central spinal stenosis with degen olisthesis
3 Lateral spinal stenosis
4 Spondylolysis/Spondylolisthesis, isthmic
5 Segmental pain with/without degen olisthesis
8 Postoperative instability
6 Degen scoliosis
99 Other..................................................................
..........................................................................
Operated level
Proximal Distal

8
Complication during hospital care
Side / Antibiotic prophylaxis
Side 1 Right 2 Left 3 Bilat
Antibiotic prophylaxis 1 Yes 0 No
This is only filled in if the patient is re-operated after discharge
Re-operation date
Type of measure
9 Extirpation of recurrent disc herniation
5 Extraction of implant
10 Refusion
3 Drainage av infection
4 Repositioning of implant
8 Repare of dural defect
11 Redecompression (same level)
99 Other
1 Yes 0 No
Death
Thrombosis
Pulmonary embolus
UVT
Urinary retention
Hemorrhage/Hematoma
Wound infection
Nerve root injury
Cauda equina syndrome
Dural tear
Malpositioned implant
Vascular injury
Other.................................................................. ..........................................................................
Re-operation during hospital care
Type of intervention
2 Hemostasis/evacuation of hematoma
8 Repair of dural defect
3 Drainage of infection
5 Extraction of implant
4 Repositioning of implant
10 Redecompression
99 Other
This is only filled in if the patient is re-operated after discharge
Reason for re-operation
10 Recurrent disc herniation
11 Pain from implant
12 Patient wants implant removed
13 Pseudarthrosis
2 Discitis/Spondylitis
1 Deep infection with implant
3 Infection donor site
4 Pain donor site
6 Breakage implant
5 Loosening implant
7 CSF leakage
14 Persistent stenosis
15 Malalignment
99 Other reason
Doctor
..................................................................................

9 Swedish Spine Register
FOLLOW -UP FORM – LUMBAR SPINE ___________ FU Year Personal id number: Serial nr: Date filled in: Height:................................ cm Weight: ...................... kg 1. How is your back pain today compared with 0. Did not have back pain before the operation before the operation? 1. Completely gone 2. Greatly improved 3. Somewhat improved 4. Unchanged 5. Worsened 2. How is your leg/sciatic pain today compared with 0. Did not have leg/ pain before the operation before the operation? 1. Completely gone 2. Greatly improved 3. Somewhat improved 4. Unchanged 5. Worsened 3. Do you currently receive retirement pension? 1. Yes, full-time 2. Yes, part-time 0. No 4. Do you currently receive disability benefits or 1. Yes, full-time 2. Yes, part-time 0. No activity benefits? 5. Do you receive paid sick-leave today? 1. Yes, full-time for my back problems 2. Yes, part-time for my back problems 3. Yes, for another illness 0. No 6. Have you returned to work? 1. I did not work outside the home before 2. Yes, full-time 3. Yes, part-time 0. No 7. Are you working at an easier job now? 1. Yes 0. No 8. How long did you receive fully paid sick-leave 1. Less than 3 months after surgery? 2. 3 to 6 months 3. 6 to 9 months 4. 9 to 12 months 5. 1 to 2 years 6. More than 2 years 9. Do you take analgesic medications or tablets 1. Yes, regularly 2. Yes, sometimes 0. No for your back problems? 10. How far are you able to walk? 1. Less than 100 meters 2. 100 to 500 meters 3. 0,5 to 1 kilometer 4. More than 1 kilometer
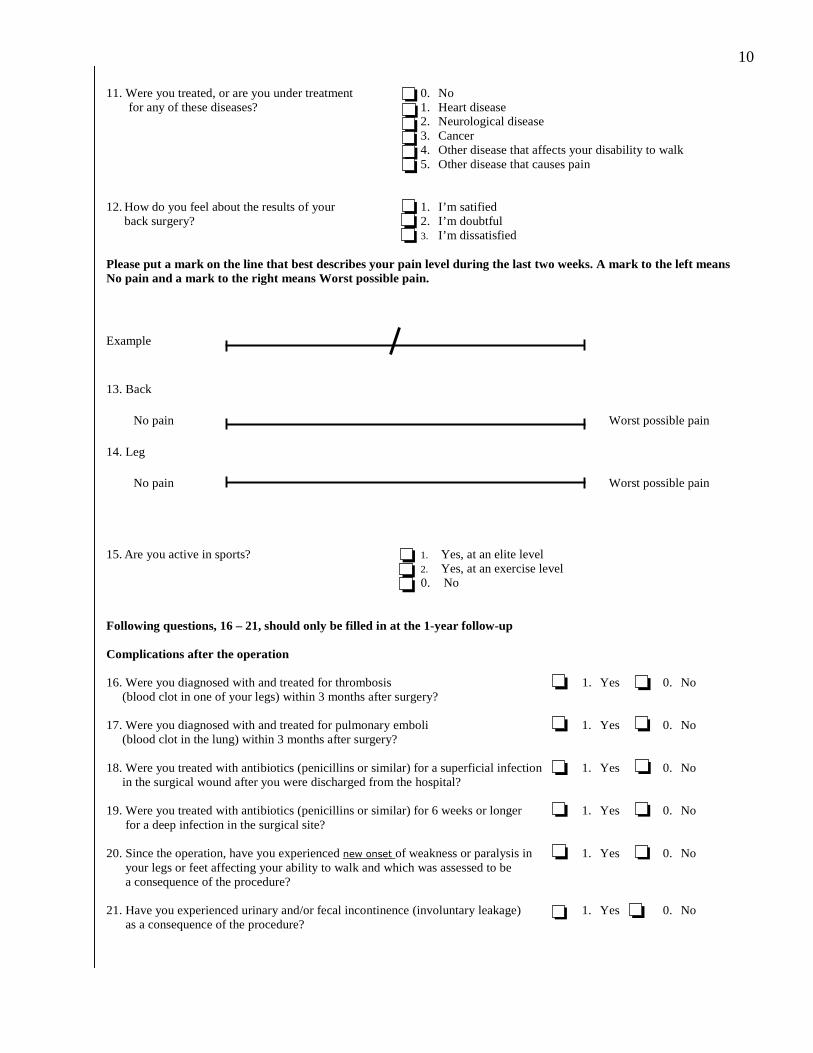
10 11. Were you treated, or are you under treatment 0. No for any of these diseases? 1. Heart disease 2. Neurological disease 3. Cancer 4. Other disease that affects your disability to walk 5. Other disease that causes pain 12. How do you feel about the results of your 1. I’m satified back surgery? 2. I’m doubtful
3. I’m dissatisfied Please put a mark on the line that best describes your pain level during the last two weeks. A mark to the left means No pain and a mark to the right means Worst possible pain. Example 13. Back
No pain Worst possible pain 14. Leg
No pain Worst possible pain
15. Are you active in sports? 1. Yes, at an elite level 2. Yes, at an exercise level
0. No
Following questions, 16 – 21, should only be filled in at the 1-year follow-up Complications after the operation 16. Were you diagnosed with and treated for thrombosis 1. Yes 0. No (blood clot in one of your legs) within 3 months after surgery? 17. Were you diagnosed with and treated for pulmonary emboli 1. Yes 0. No (blood clot in the lung) within 3 months after surgery? 18. Were you treated with antibiotics (penicillins or similar) for a superficial infection 1. Yes 0. No in the surgical wound after you were discharged from the hospital? 19. Were you treated with antibiotics (penicillins or similar) for 6 weeks or longer 1. Yes 0. No for a deep infection in the surgical site? 20. Since the operation, have you experienced new onset of weakness or paralysis in 1. Yes 0. No your legs or feet affecting your ability to walk and which was assessed to be a consequence of the procedure? 21. Have you experienced urinary and/or fecal incontinence (involuntary leakage) 1. Yes 0. No as a consequence of the procedure?

11II. Pre- and intraoperative data on lumbar spine surgical procedures performed in 2008 The register contains in total 5 632 patients operated on for degenerative lumbar spine disorders from totally 37 departments in Sweden 2008. Last year’s report on operations from 2007 contained 4 932 patients from 39 departments, further follow-up protocols submitted during last year makes the total figure for 2007 5 027 patients operated on, i.e. a 12% increase in number of procedures performed was registered. Indication for surgery in patients operated on in 2008 was: Disc herniation 30%, central spinal stenosis 43%, lateral spinal stenosis 7%, spondylolisthesis 5%, DDD/Segmental pain (disc degenerative disorder) 12% and others 3%, see Figure 1.
30%
43%
7%
5%
12%
3%
LDH
CSS
LSS
Spond
DDD
Other
Fig 1. Indication for surgery according to diagnosis in 5 632 patients operated on in 2008. Below are presented demographic preoperative patient reported data and surgical data for patients operated on in 2008. Lumbar disc herniation
Demographic data
For 2008, 1 712 operations for lumbar disc herniation were registered. 56% of the patients were male and 44% female. Mean patient age was 45 (12–88) years, the age distribution is seen in Figure 2. The proportion of smokers was 22%.

12
0
10
20
30
40
50
0-10 11-20 21-30 31-40 41-50 51-60 61-70 71-80 81-90 >91
Age distribution
Per
cen
t
Fig 2. Age distribution for patients operated on for lumbar disc herniation, n = 1 712 patients. For 87% of the patients the disc herniation operation was their first lumbar spine operation while 13% had had spine surgery previously. Preoperative duration of leg pain/sciatica was as follow: 1% had no leg pain, 18% had had leg pain for less than 3 months, 54% for 3-12 months, 15% for 1-2 years and 13% had had leg pain for more than 2 years at the time of surgery. The corresponding figures for back pain was as follows: 7% had no back pain, 12% had less than 3 months duration of back pain, 45% 3-12 months, 16% 1-2 years and 21% more than 2 years duration of back pain. Mean leg pain/sciatica on the VAS scale was 66 (0-100), Figure 3. Mean back pain on the VAS scale was 47 (0-100), Figure 4.

13
0
20
40
60
80
100
0-10 11-20 21-30 31-40 41-50 51-60 61-70 71-80 81-90 91-100
Leg pain (VAS)
Per
cen
t
Fig 3. Leg pain on the visual analog scale preoperatively in patients operated on for lumbar disc herniation (%).
0
20
40
60
80
100
0-10 11-20 21-30 31-40 41-50 51-60 61-70 71-80 81-90 91-100
Back pain (VAS)
Per
cen
t
Fig 4.Back pain on the visual analog scale preoperatively in patients operated on for lumbar disc herniation (%). 60% of the patients reported regular consumption of analgesics before surgery, intermittent consumption was reported by 27% while 13% of the patients did not consume analgesics. Preoperative walking distance estimated by the patients was less than 100 m for 33%, 100–500 m for 20%, 500 m–1000 m for 16% and more than 1000 m for 31% of the patients. Surgical data
Conventional open disc surgery was performed in 42% of the cases and microscopic disc surgery in 49%. The reminaing operations consisted of different combinations of especially decompressive
14procedures for patients with disc herniation in a stenotic spine. Mean time for hospitalization (time from admittance to discharge) was 3.0 days for patients for both conventional and microscopic disc surgery. Central spinal stenosis
Demographic data
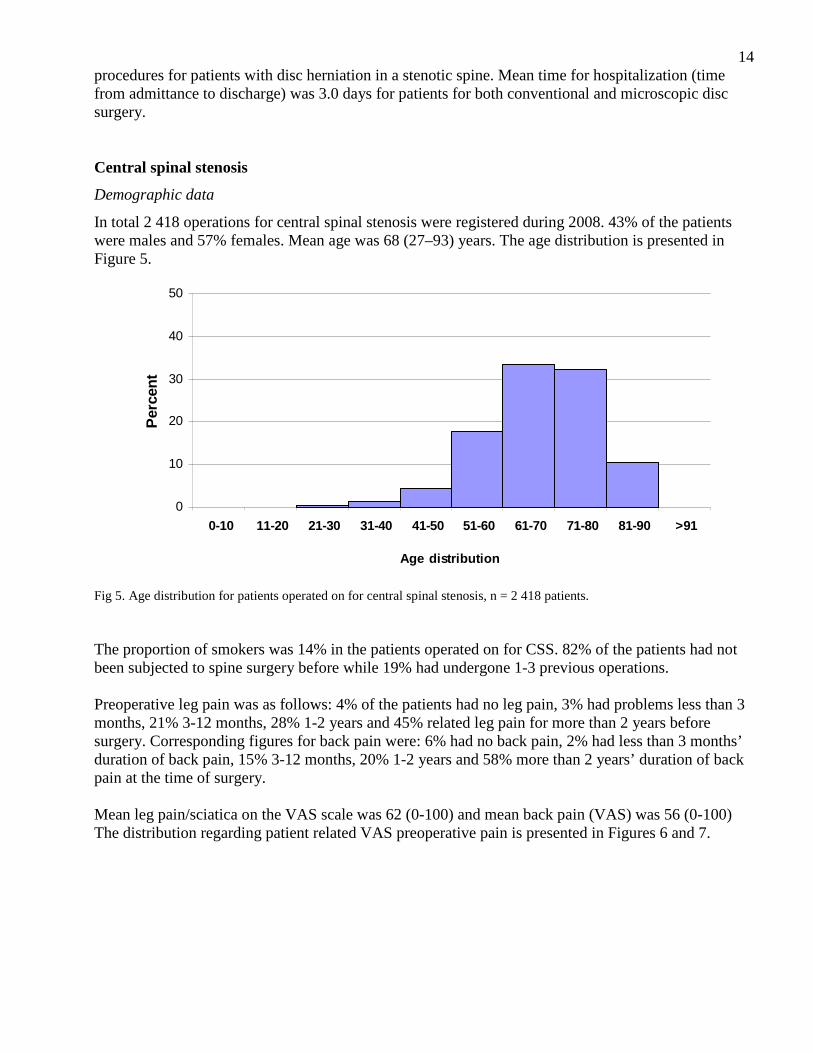
In total 2 418 operations for central spinal stenosis were registered during 2008. 43% of the patients were males and 57% females. Mean age was 68 (27–93) years. The age distribution is presented in Figure 5.
0
10
20
30
40
50
0-10 11-20 21-30 31-40 41-50 51-60 61-70 71-80 81-90 >91
Age distribution
Per
cen
t
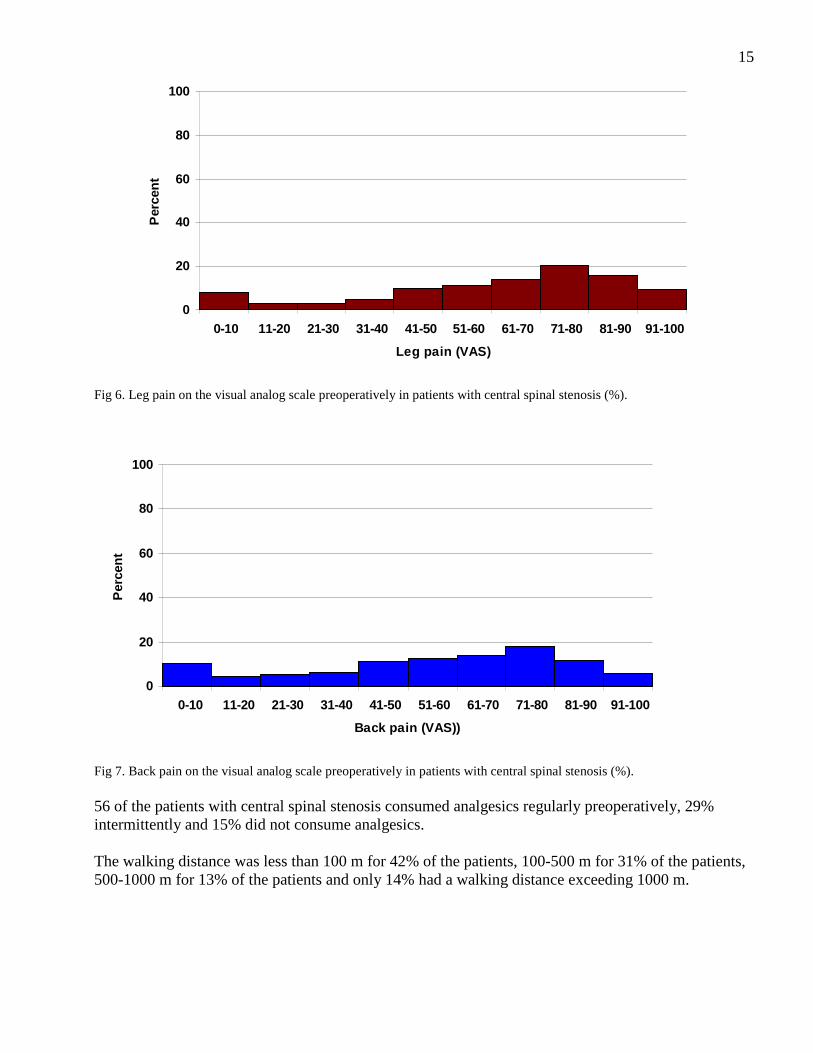
Fig 5. Age distribution for patients operated on for central spinal stenosis, n = 2 418 patients. The proportion of smokers was 14% in the patients operated on for CSS. 82% of the patients had not been subjected to spine surgery before while 19% had undergone 1-3 previous operations. Preoperative leg pain was as follows: 4% of the patients had no leg pain, 3% had problems less than 3 months, 21% 3-12 months, 28% 1-2 years and 45% related leg pain for more than 2 years before surgery. Corresponding figures for back pain were: 6% had no back pain, 2% had less than 3 months’ duration of back pain, 15% 3-12 months, 20% 1-2 years and 58% more than 2 years’ duration of back pain at the time of surgery. Mean leg pain/sciatica on the VAS scale was 62 (0-100) and mean back pain (VAS) was 56 (0-100) The distribution regarding patient related VAS preoperative pain is presented in Figures 6 and 7.
15
0
20
40
60
80
100
0-10 11-20 21-30 31-40 41-50 51-60 61-70 71-80 81-90 91-100
Leg pain (VAS)
Per
cen
t
Fig 6. Leg pain on the visual analog scale preoperatively in patients with central spinal stenosis (%).
0
20
40
60
80
100
0-10 11-20 21-30 31-40 41-50 51-60 61-70 71-80 81-90 91-100
Back pain (VAS))
Per
cen
t
Fig 7. Back pain on the visual analog scale preoperatively in patients with central spinal stenosis (%). 56 of the patients with central spinal stenosis consumed analgesics regularly preoperatively, 29% intermittently and 15% did not consume analgesics. The walking distance was less than 100 m for 42% of the patients, 100-500 m for 31% of the patients, 500-1000 m for 13% of the patients and only 14% had a walking distance exceeding 1000 m.

16Surgical data
For 71% of the patients decompressive surgery was the sole procedure, 43% of which were operated on with conventional open surgery and 28% microscopically. Decompression combined with posterior instrumented fusion constituted 20% of the operations and decompression + PLIF 1% of the operations. For 3% of the patients decoompression and posterior non-instrumented fusion was the surgical procedure performed. Mean time of hospitalization for patients with conventional decompression was 4.0 days, for patients with microscopic decompression 5,0 days and for patients with decompression + posterior instrumented fusion 7.0 days. Lateral spinal stenosis
Demographic data
In total 399 patients operated on for lateral spinal stenosis were registered for 2008. 51% of the patients were males and 49% females. 22% of the patients were smokers. The mean age was 60 (16–88) years. Age distribution is presented in Figure 8.
0
10
20
30
40
50
0-10 11-20 21-30 31-40 41-50 51-60 61-70 71-80 81-90 >91
Age distribution
Per
cen
t
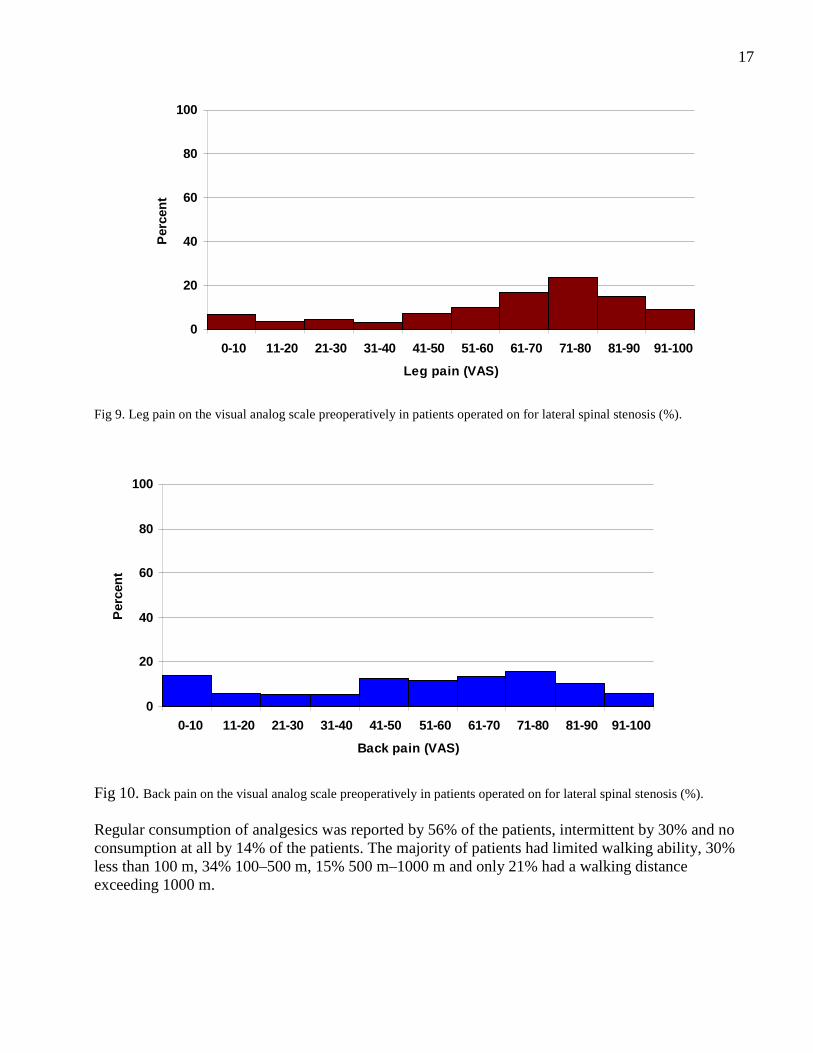
Fig 8. Age distribution for patients operated on for lateral spinal stenosis, n = 399 patients. The majority of patients with lateral spinal stenosis, 78%, had had no previous spine surgery while 22% had been operated on one or more times before the current procedure. Preoperative duration of leg pain/sciatica was as follows: 2% denied leg pain, 2% had had leg pain for less than 3 months, 25% for 3-12 months, 28% for 1-2 years and 42% had had leg pain exceeding 2 years before surgery. Corresponding figures for back pain were: 8% had no back pain, 2% had less than 3 months duration of back pain, 14% 3-12 months, 21% 1-2 years and 55% more than 2 years duration of back pain at the time of surgery. Mean leg pain on the VAS scale was 63 (0-100) and mean back pain on the VAS scale 53 (0-100), Figures 9 and 10.
17
0
20
40
60
80
100
0-10 11-20 21-30 31-40 41-50 51-60 61-70 71-80 81-90 91-100
Leg pain (VAS)
Per
cen
t
Fig 9. Leg pain on the visual analog scale preoperatively in patients operated on for lateral spinal stenosis (%).
0
20
40
60
80
100
0-10 11-20 21-30 31-40 41-50 51-60 61-70 71-80 81-90 91-100
Back pain (VAS)
Per
cen
t
Fig 10. Back pain on the visual analog scale preoperatively in patients operated on for lateral spinal stenosis (%). Regular consumption of analgesics was reported by 56% of the patients, intermittent by 30% and no consumption at all by 14% of the patients. The majority of patients had limited walking ability, 30% less than 100 m, 34% 100–500 m, 15% 500 m–1000 m and only 21% had a walking distance exceeding 1000 m.

18Surgical data
The vast majority of procedures performed in this patient group was decompressive surgery, 94%. Open as well as microscopic decompression required a mean hospitalization time of 3.0 days while decompression + posterior instrumented fusion required hospitalization for 6.0 days and was performed in 11% of the patients. Spondylolisthesis
Demographic data
In total 272 patients 48% of which were men and 52% women, were reported for 2008. 17% of these patients were smokers. Mean age was 50 (10–79) years and the age distribution is presented in Figure 11.
0
10
20
30
40
50
0-10 11-20 21-30 31-40 41-50 51-60 61-70 71-80 81-90 >91
Age distribution
Per
cen
t
Fig 11. Age distribution for patients operated on for spondylolisthesis, n = 272 patients. For 92% of the patients the current procedure was their first operation on the lumbar spine while the remainder had one or two previous procedures. Preoperative duration of leg pain/sciatica was as follows: 11% had no leg pain, 3% with spondylolisthesis had leg pain for less than 3 months, 12% for 3-12 months, 23% for 1-2 years and 52% for more than 2 years before surgery. Corresponding figures for back pain were as follows: 3% had no back pain, 0% had less than 3 months duration of back pain, 6% 3-12 months, 15% 1-2 years and 76% more than 2 years duration of back pain at the time of surgery. Preoperative leg pain on the VAS scale was 50 (0-100) and back pain 59 (0-100). The distribution of pain on the VAS scale is presented in Figures 12 and 13.

19
0
20
40
60
80
100
0-10 11-20 21-30 31-40 41-50 51-60 61-70 71-80 81-90 91-100
Leg pain (VAS)
Per
cen
t
Fig 12. Leg pain preoperatively on the visual analog scale scale in patients with spondylolisthesis (%).
0
20
40
60
80
100
0-10 11-20 21-30 31-40 41-50 51-60 61-70 71-80 81-90 91-100
Back pain (VAS)
Per
cen
t
Fig 13. Back pain preoperatively on the visual analog scale in patients with spondylolisthesis (%). Regular consumption of analgesics was reported by 50% of the patients, intermittent by 32% and no consumption by 18% of the patients operated on for spondylolisthesis. Walking distance was estimated to less than 100 m for 19% of the patients, 100-500 m for 29% of the patients, 500-1000 m for 18% of the patients and exceeding 1000 m for 35% of the patients.

20Surgical data
In patients with spondylolisthesis, varying surgical procedures were undertaken, the most common as follows: decompression + posterior instrumented fusion 44%, posterior instrumented fusion only 20%, PLIF 14%, decompression + uninstrumenterad fusion 4%, decompression + PLIF 3%, posterior uninstrumented fusion 3%, ALIF 1%, and various decompressive procedures for the remainder. Mean hospitalization time varied between 6.0 and 7.0 days for the operations undertaken. DDD/Segmental pain
Demographic data
During 2008, 653 patients were registered for surgical intenvention for DDD. 49% of the patients were males and 51% females. The proportion of smokers was 18%. Mean age was 46 (19–78) years and the age distribution is presented in Figure 14.
0
10
20
30
40
50
0-10 11-20 21-30 31-40 41-50 51-60 61-70 71-80 81-90 >91
Age distribution
Per
cen
t
Fig 14. Age distribution for patients operated on for DDD, n =653 patients. In this group of patients significantly more patients had had previous operations than in the other diagnostic categories, the current procedure was the first operation for 62%while 38% had been operated on one or more times previously. The main indication for operation in this group of patients is back pain but both leg and back pain is presented. Preoperative duration of leg pain in the patients with DDD was as follows: 14% had no leg pain, 2% had had leg pain for less than 3 months, 11% for 3-12 months, 20% for 1-2 years and 53% for more than 2 years. Corresponding figures for back pain were: 1% had no back pain, 1% had less than 3 months duration of back pain, 5% 3-12 months, 14% 1-2 years and 80% more than 2 years duration of back pain at the time of current procedure.
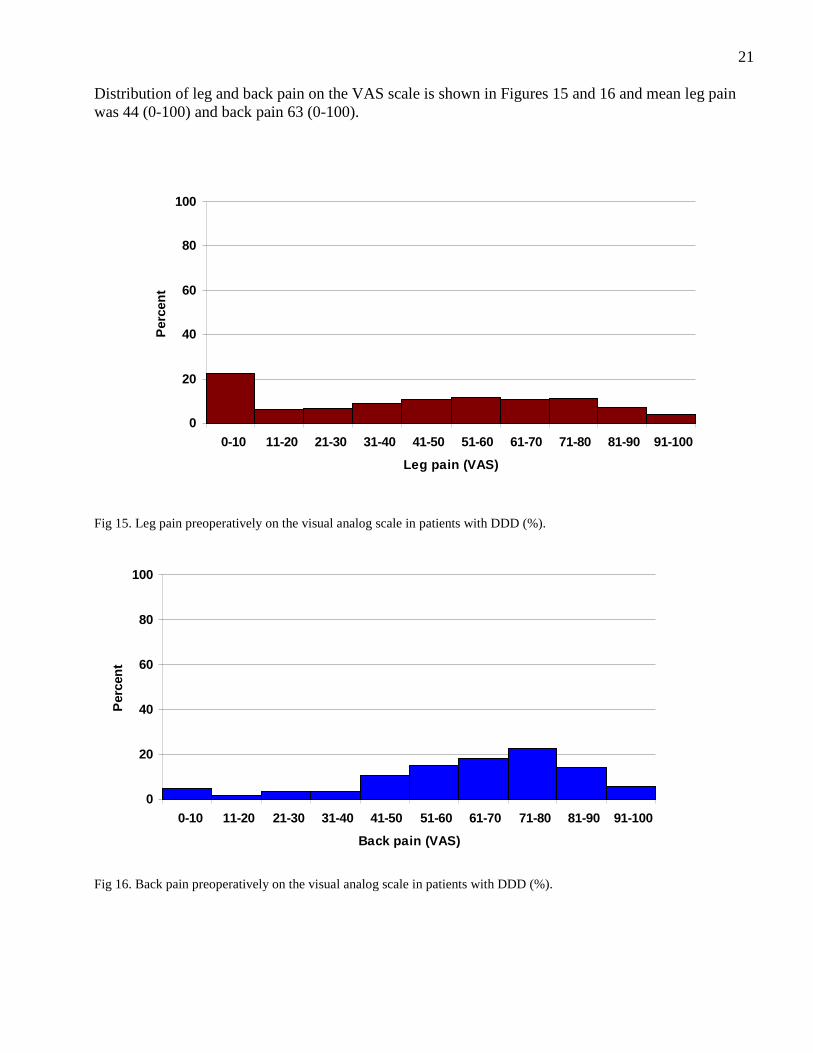
21 Distribution of leg and back pain on the VAS scale is shown in Figures 15 and 16 and mean leg pain was 44 (0-100) and back pain 63 (0-100).
0
20
40
60
80
100
0-10 11-20 21-30 31-40 41-50 51-60 61-70 71-80 81-90 91-100
Leg pain (VAS)
Per
cen
t
Fig 15. Leg pain preoperatively on the visual analog scale in patients with DDD (%).
0
20
40
60
80
100
0-10 11-20 21-30 31-40 41-50 51-60 61-70 71-80 81-90 91-100
Back pain (VAS)
Per
cen
t
Fig 16. Back pain preoperatively on the visual analog scale in patients with DDD (%).

2257% of the patients operated on for DDD reported regular consumption of analgesics, 42% intermittent and 11% did not use analgesics at all. The walking distance was estimated to less than 100 m for 14% of the patients, 100-500 m for 22% of the patients, 500-1000 m for 22% of the patients and 43% of the patients reported a walking distance exceeding 1000 m. Surgical data
A heterogenous surgical treatment spectrum was seen also for this diagnosis. The following procedures were undertaken: Posterior instrumented fusion 24%, PLIF 20%, disc prosthesis 17%, decompression + posterior instrumented fusion 13%, decompression + PLIF 6%, TLIF 6%, decompression + TLIF 7%, posterior uninstrumenterad fusion 3%, decompression + posterior uninstrumented fusion 1%, ALIF 1% and various procedures for the remainder. Mean hospitalization time varied between 2,0 and 7,0 days for the operations undertaken.

23II. One-year follow-up of lumbar spine surgery in Sweden 2008 Totally included are 5 027 patients operated on in 2007, 3 902 of which (77.6%), have completed one-year follow-up. They are distributed as follows: lumbar disc herniation 1 155, central spinal stenosis 1 706 lateral spinal stenosis 282, spondylolisthesis 234 and DDD 417 while 108 patients had procedures categorized as “other operations”. Lumbar disc herniation
Of 1 155 patients who were operated on for lumbar disc herniation and completed one-year follow-up, 54% were males and 46% females, mean age 45 (15-88) years Mean preoperative leg pain on the VAS scale was 65, mean postoperative 22. Corresponding figures for back pain were 45 and 24 respectively. Figures 17 and 18 demonstrate pre- and postoperative estimation of leg and back pain on the VAS scale. The surgical procedures were conventional disc surgery 43%, microscopic disc surgery 48%, decompressive surgery 6% and other operations 2%.
0
10
20
30
40
50
60
10 20 30 40 50 60 70 80 90 100
Leg pain (VAS)
Per
cen
t
Preop
Postop 1 yr
Fig 17. Leg pain on the visual analog scale pre- and postoperatively in patients operated on for lumbar disc herniation 2007 (%). Global assessment concerning leg pain was as follows: Completely painfree 35%, significantly improved 38%, somewhat improved 15%, unchanged 6% and deteriorated 3%. 2% of the patients had no preoperative leg pain.
24
0
10
20
30
40
50
10 20 30 40 50 60 70 80 90 100
Back pain (VAS)
Per
cen
t
Preop
Postop 1 yr
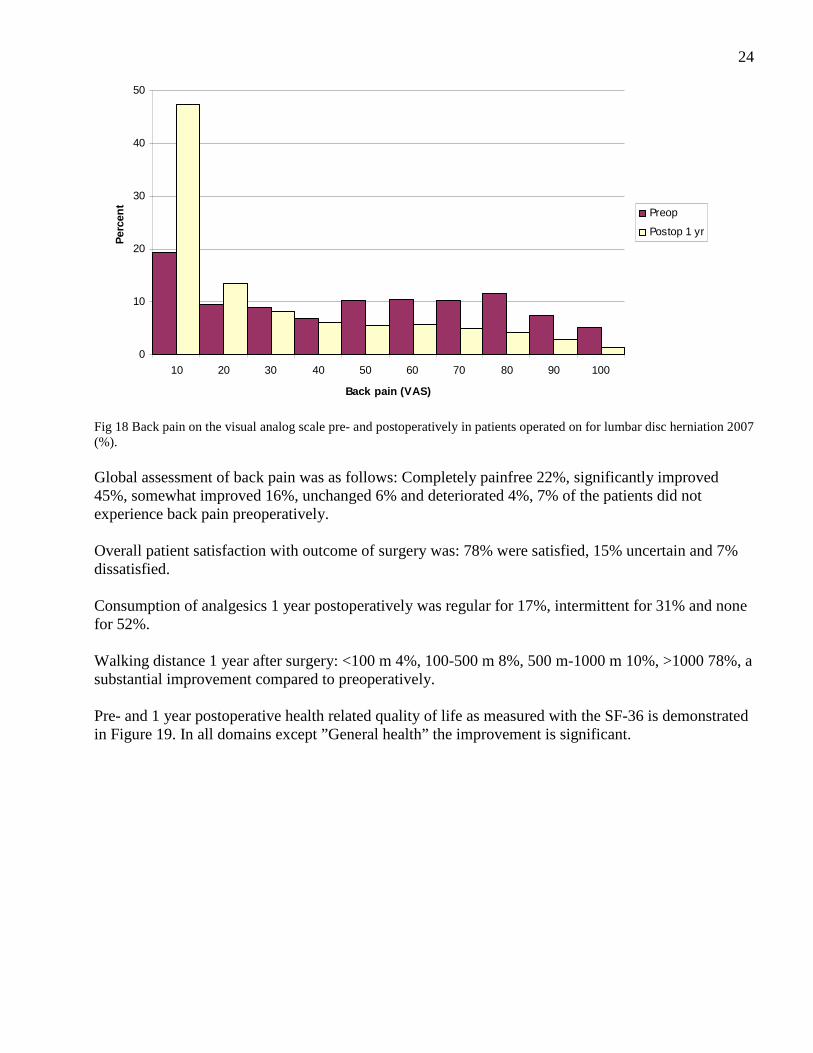
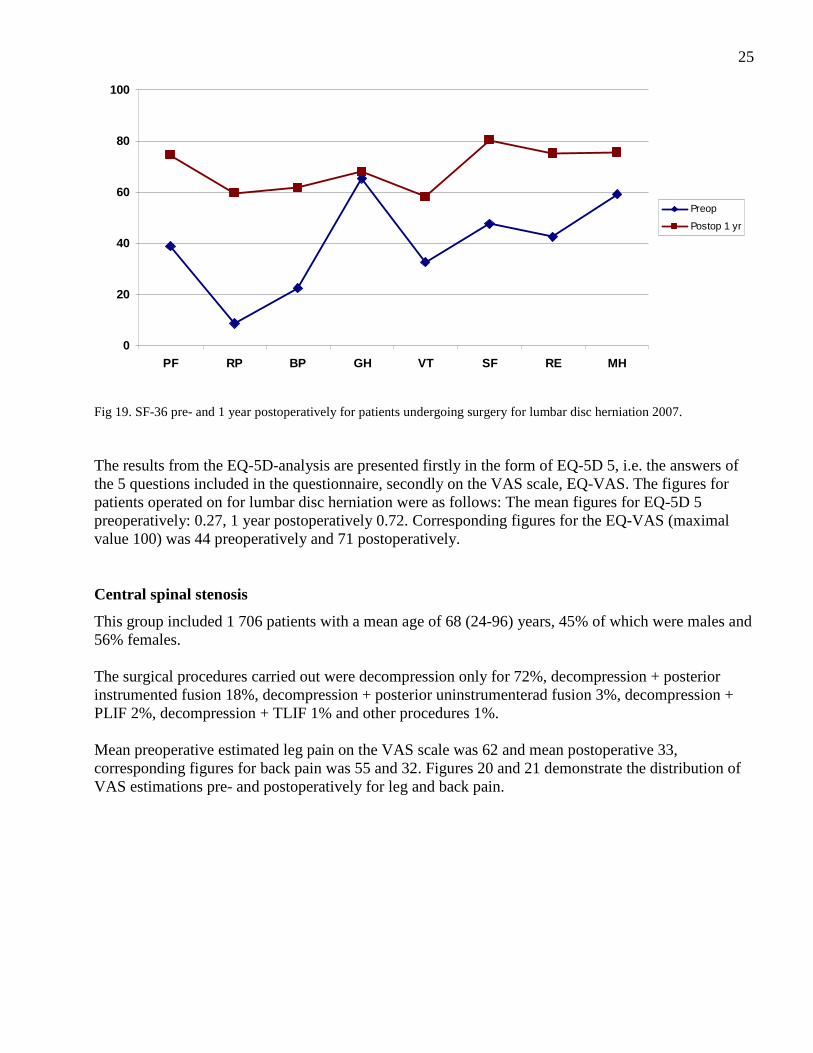
Fig 18 Back pain on the visual analog scale pre- and postoperatively in patients operated on for lumbar disc herniation 2007 (%). Global assessment of back pain was as follows: Completely painfree 22%, significantly improved 45%, somewhat improved 16%, unchanged 6% and deteriorated 4%, 7% of the patients did not experience back pain preoperatively. Overall patient satisfaction with outcome of surgery was: 78% were satisfied, 15% uncertain and 7% dissatisfied. Consumption of analgesics 1 year postoperatively was regular for 17%, intermittent for 31% and none for 52%. Walking distance 1 year after surgery: <100 m 4%, 100-500 m 8%, 500 m-1000 m 10%, >1000 78%, a substantial improvement compared to preoperatively. Pre- and 1 year postoperative health related quality of life as measured with the SF-36 is demonstrated in Figure 19. In all domains except ”General health” the improvement is significant.
25
0
20
40
60
80
100
PF RP BP GH VT SF RE MH
Preop
Postop 1 yr
Fig 19. SF-36 pre- and 1 year postoperatively for patients undergoing surgery for lumbar disc herniation 2007. The results from the EQ-5D-analysis are presented firstly in the form of EQ-5D 5, i.e. the answers of the 5 questions included in the questionnaire, secondly on the VAS scale, EQ-VAS. The figures for patients operated on for lumbar disc herniation were as follows: The mean figures for EQ-5D 5 preoperatively: 0.27, 1 year postoperatively 0.72. Corresponding figures for the EQ-VAS (maximal value 100) was 44 preoperatively and 71 postoperatively. Central spinal stenosis
This group included 1 706 patients with a mean age of 68 (24-96) years, 45% of which were males and 56% females. The surgical procedures carried out were decompression only for 72%, decompression + posterior instrumented fusion 18%, decompression + posterior uninstrumenterad fusion 3%, decompression + PLIF 2%, decompression + TLIF 1% and other procedures 1%. Mean preoperative estimated leg pain on the VAS scale was 62 and mean postoperative 33, corresponding figures for back pain was 55 and 32. Figures 20 and 21 demonstrate the distribution of VAS estimations pre- and postoperatively for leg and back pain.

26
0
10
20
30
40
50
60
10 20 30 40 50 60 70 80 90 100
Leg pain (VAS)
Per
cen
t
Preop
Postop 1 yr
Fig 20.Leg pain estimated on the VAS scale pre- and 1 year postoperatively by patients operated on for central lumbar spinal stenosis 2007 (%).
0
10
20
30
40
50
10 20 30 40 50 60 70 80 90 100
Back pain (VAS)
Per
cen
t
Preop
Postop 1 yr
Fig 21. Back pain estimated on the VAS scale pre- and 1 year postoperatively by patients operated on for central lumbar spinal stenosis 2007 (%). Global assessment of leg pain: 22% were completely painfree, 31% significantly improved, 17% somewhat improved, 13% unchanged and 11% deteriorated. 6% of the patients denied preoperative leg pain. Global assessment of back pain: 22% completely painfree, 31% significantly improved, 20% somewhat improved, 12% unchanged and 8% deteriorated. 8% had no preoperative back pain.

27Overall satisfaction with outcome of surgery was as follows: 63% were satisfied, 24% uncertain and 13% dissatisfied with the outcome of surgery. Consumption of analgesics 1 year postoperatively was regular in 32%, intermittent in 32%, and none in 37% of the patients. Walking distance one year postoperatively was as follows: < 100 m 20%, 100-500 m 22%, 500 m-1000 m 16%, >1000 m 42%, a pronounced improvement when compared to preoperative figures. Regarding health related quality of life on the SF-36 questionnaire, a significant improvement was noted one year postoperatively when compared to before surgery in all aspects except general health. The improvement was less marked than for disc herniation patients but, when adjusted for age, similar, Figure 22.
0
20
40
60
80
100
PF RP BP GH VT SF RE MH
Preop
Postop 1 yr
Fig 22. SF-36 pre-and 1 year postoperatively in patients operated on for central lumbar spinal stenosis 2007. Mean EQ-5D 5 value preoperatively was 0.35, 1 year postoperatively 0.63. Mean EQ-VAS value preoperatively was 48 and one year postoperatively 64. Lateral spinal stenosis
This patient group consisted of 282 patients, aged 61 (32-88) years, 47% of which were males and 53% females. Surgical procedure: Decompression only was utilized in 78% of the patients, decompression + posterior fusion in 15% (13% instrumented and 2% uninstrumented), other procedures accounted for 6% of the patients. Mean preoperative leg pain on the VAS scale was 65, mean one year postoperative value 34. Corresponding figures for back pain were 55 and 33 respectively. Figures 23 and 24 demonstrate the distribution of pre- and postoperative estimation of leg and back pain on the VAS scale.

28
0
10
20
30
40
50
60
10 20 30 40 50 60 70 80 90 100
Leg pain (VAS)
Per
cen
t
Preop
Postop 1 yr
Fig 23. Leg pain estimated on the VAS scale pre- and 1 year postoperatively by patients operated on for lateral lumbar spinal stenosis 2007 (%).
0
10
20
30
40
50
10 20 30 40 50 60 70 80 90 100
Back pain (VAS)
Per
cen
t
Preop
Postop 1 yr
Fig 24. Back pain estimated on the VAS scale pre- and 1 year postoperatively by patients operated on for lateral lumbar spinal stenosis 2007 (%). One year postoperatively the global assessment concerning leg pain was as follows: 23% were completely painfree, 32% significantly improved, 24% somewhat improved, 10% unchanged and 9% deteriorated, 1% had no preoperative leg pain. For back pain the figures were: 18% completely painfree, 31% significantly improved, 23% somewhat improved, 15% unchanged and 6% deteriorated. 8% had no preoperative back pain.
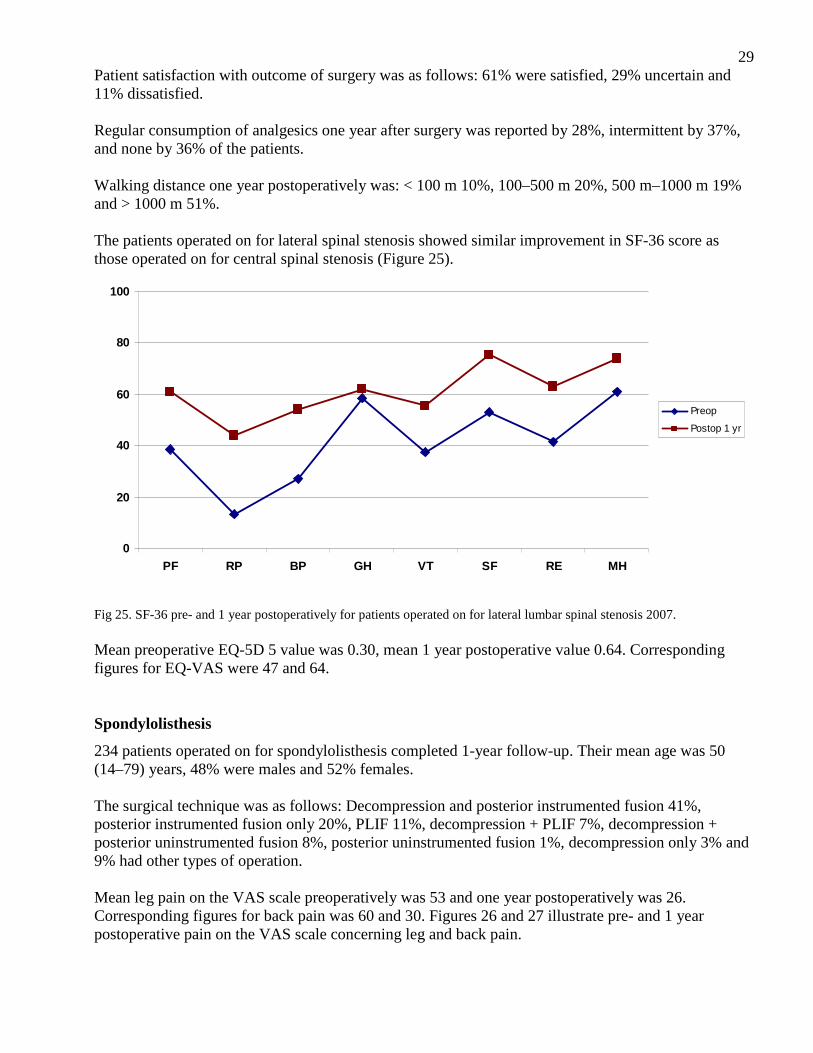
29Patient satisfaction with outcome of surgery was as follows: 61% were satisfied, 29% uncertain and 11% dissatisfied. Regular consumption of analgesics one year after surgery was reported by 28%, intermittent by 37%, and none by 36% of the patients. Walking distance one year postoperatively was: < 100 m 10%, 100–500 m 20%, 500 m–1000 m 19% and > 1000 m 51%. The patients operated on for lateral spinal stenosis showed similar improvement in SF-36 score as those operated on for central spinal stenosis (Figure 25).
0
20
40
60
80
100
PF RP BP GH VT SF RE MH
Preop
Postop 1 yr
Fig 25. SF-36 pre- and 1 year postoperatively for patients operated on for lateral lumbar spinal stenosis 2007. Mean preoperative EQ-5D 5 value was 0.30, mean 1 year postoperative value 0.64. Corresponding figures for EQ-VAS were 47 and 64. Spondylolisthesis
234 patients operated on for spondylolisthesis completed 1-year follow-up. Their mean age was 50 (14–79) years, 48% were males and 52% females. The surgical technique was as follows: Decompression and posterior instrumented fusion 41%, posterior instrumented fusion only 20%, PLIF 11%, decompression + PLIF 7%, decompression + posterior uninstrumented fusion 8%, posterior uninstrumented fusion 1%, decompression only 3% and 9% had other types of operation. Mean leg pain on the VAS scale preoperatively was 53 and one year postoperatively was 26. Corresponding figures for back pain was 60 and 30. Figures 26 and 27 illustrate pre- and 1 year postoperative pain on the VAS scale concerning leg and back pain.

30
0
10
20
30
40
50
60
10 20 30 40 50 60 70 80 90 100
Leg pain (VAS)
Per
cen
t
Preop
Postop 1 yr
Fig 26.Leg pain estimated on the VAS scale 1 year postoperatively by patients operated on for spondylolisthesis in 2007 (%).
0
10
20
30
40
50
10 20 30 40 50 60 70 80 90 100
Back pain (VAS)
Per
cen
t
Preop
Postop 1 yr
Fig 27. Back pain estimated on the VAS scale 1 year postoperatively by patients operated on for spondylolisthesis in 2007 (%). The global assessment 1 year postoperatively regarding leg pain revealed 26% to be completely painfree, 31% significantly improved, 16% somewhat improved, 9% unchanged and 10% deteriorated. 8% of the patients reported no preoperative leg pain. For back pain the corresponding figures were: completely painfree 14%, significantly improved 47%, somewhat improved 22%, unchanged 9% and deteriorated 8%. 1% of the patients denied preoperative back pain.

31Overall patient satisfaction with the outcome of surgery was as follows: 69% were satisfied, 19% uncertain and 12% dissatisfied. 22% of the patients reported regular consumption of analgesics 1 year postoperatively, 35% reported intermittent and 43% no consumption of analgesics. Walking distance 1 year postoperatively: < 100 m 7%, 100-500 m 15%, 500 m-1000 m 11% and >1000 m 68%, thus, pronounced improvement compared to preoperatively. In all aspects except general health the patients operated on for spondylolisthesis improved significantly on the SF-36 score, Figure 28.
0
20
40
60
80
100
PF RP BP GH VT SF RE MH
Preop
Postop 1 yr
Fig 28. SF-36 score pre- and 1 year postoperatively for patients operated on for spondylolisthesis 2007. Mean preoperative EQ-5D 5 value was 0.36, mean 1 year postoperatively 0.63. Mean preoperative EQ-VAS value was 47 and 1 year postoperatively 65. DDD (disc degenerative disorder)/segmental pain
In total 417 patients operated on during 2007 had completed 1-year follow-up. Mean patient age was 46 (21–76) years, 46% were males and 54% females. The operations performed for DDD were as follows: posterior instrumented fusion 20%, disc prosthesis 18%, PLIF 18%, decompression + posterior instrumented fusion 11%, decompression + PLIF 9%, TLIF 8%, decompression + TLIF 7%, posterior uninstrumented fusion 4% and other procedures 5%. Preoperative mean leg pain on the VAS scale was 45, 1 year postoperative value was 24. Corresponding figures for back pain were 64 and 33. Figures 29-30 illustrate distribution of pre- and postoperative VAS estimation for leg and back pain.

32
0
10
20
30
40
50
60
10 20 30 40 50 60 70 80 90 100
Leg pain (VAS)
Per
cen
t
Preop
Postop 1 yr
Fig 29. Leg pain on the visual analog scale pre- and 1 year postoperatively in patients operated on for DDD 2007 (%).
0
10
20
30
40
50
10 20 30 40 50 60 70 80 90 100
Back pain (VAS)
Per
cen
t
Preop
Postop 1 yr
Fig 30. Back pain on the visual analog scale pre- and 1 year postoperatively in patients operated on for DDD 2007 (%). Global assessment of leg pain 1 year postoperatively in the DDD group was as follows: Completely painfree 25%, significantly improved 28%, somewhat improved 17%, unchanged 13% and deteriorated 6%. 11% had no preoperative leg pain. Corresponding figures for back pain were: Completely painfree 14%, significantly improved 43%, somewhat improved 24%, unchanged 12% and deteriorated 7%. 1% of the patients denied back pain preoperatively.

33 Regarding overall patient satisfaction with outcome of surgery, 69% reported as satisfied, 22% as uncertain and 9% as dissatisfied. Regular consumption of analgesics 1 year postoperatively was reported by 29%, intermittent by 36% and none by 34% of the patients. Walking distance 1 year after surgery: < 100 m 7%, 100-500 m 12%, 500 m-1000 m 16%, >1000 m 65%, a pronounced improvement compared to before surgery. The SF-36 profiles, presented in Figure 31, show similar profiles as for the other diagnoses with improvement in physical as well as mental components.
0
20
40
60
80
100
PF RP BP GH VT SF RE MH
Preop
Postop 1 yr
Fig 31. SF-36 pre- and 1 year postoperatively for patients operated on for DDD 2007. Mean EQ-5D 5 value preoperatively was 0.31, mean 1 year postoperative value 0.62. Mean EQ-VAS value preoperatively was 46, 1 year postoperatively 66.

34Oswestry Disability Index, ODI, before and 1 year after surgery for all diagnoses Figure 32 demonstrates a comparison between pre- and postoperative disability as measured by the Oswestry Disability Index. The reduction of disability at 1 year after surgery is significant for all diagnoses, to the highest extent for patients operated on for disc herniation. 0-20 is regarded as “no or insignificant disability”.
0
20
40
60
80
100
LDH CSS LSS Spond DDD
mea
n Preop
Postop 1 yr
Fig 32. ODI score before and 1 year after lumbar spine surgery, related to diagnosis, for patients operated on in 2007.

35III. 2-year follow-up of lumbar spine surgery in Sweden 2008 In total 2 506 patients operated on in 2006 have completed pre- as well as 1- and 2-year follow-up postoperative protocols. Most common diagnoses for surgery are disc herniation, 803 and central spinal stenosis 1 014 patients. 178 patients were operated on for lateral spinal stenosis, 158 for spondylolisthesis and 285 for DDD while the remaining 68 were categorized as “other operations”. Below is presented a comparison between 1- and 2-year follow-up regarding the parameters registered. Only patients completing the protocol preoperatively and 1- and 2-year postoperatively are included. Leg and back pain on the VAS scale did not change between 1- and 2-year follow-up (Table 1). Table 1. Pain in the back and leg (mean value) diagnosis related, before surgery and at 1- and 2-year follow-up. Back Leg Preop Postop 1 yr Postop 2 yrs Preop Postop 1 yr Postop 2 yrs Disc herniation 44 23 24 65 20 22 Central stenosis 54 29 31 61 31 32 Lateral stenosis 54 31 31 62 32 31 Spondylolisthesis 56 26 27 51 22 24 DDD 62 34 32 45 25 26 Tables 2-6 present walking ability, diagnosis related, at 1 and 2 year postoperatively and the outcome is more or less identical. Table 2. Walking distance, disc herniation (%) Preoperatively Postop 1 yr Postop 2 yrs <100 m 32 4 6 100 m– 500 m 24 7 8 500 m– 1000 m 16 10 9 >1000 m 28 78 77 Table 3. Walking distance, central spinal stenosis (%) Preoperatively Postop 1 yr Postop 2 yrs <100 m 42 18 20 100 m– 500 m 32 19 19 500 m– 1000 m 12 17 15 >1000 m 14 46 46

36Table 4. Walking distance, lateral spinal stenosis (%) Preoperatively Postop 1 yr Postop 2 yrs <100 m 23 10 11 100 m– 500 m 34 13 15 500 m– 1000 m 17 21 15 >1000 m 26 56 58 Table 5. Walking distance, spondylolisthesis (%) Preoperatively Postop 1 yr Postop 2 yrs <100 m 15 4 5 100 m– 500 m 24 9 11 500 m– 1000 m 19 10 13 >1000 m 42 77 71 Table 6. Walking distance, DDD (%) Preoperatively Postop 1 yr Postop 2 yrs <100 m 9 6 8 100 m– 500 m 24 10 10 500 m– 1000 m 25 15 12 >1000 m 42 68 71 Also consumption of analgesics shows a stable pattern at follow-up as demonstrated in Tables 7-11. Table 7. Consumption of analgesics, disc herniation preoperatively, 1 and 2 years postoperatively (%). Preoperatively Postop 1 yr Postop 2 yrs Regularly 60 17 19 Intermittently 30 31 31 No consumption 11 53 51 Table 8. Consumption of analgesics, central spinal stenosis preoperatively, 1 and 2 years postoperatively (%). Preoperatively Postop 1 yr Postop 2 yrs Regularly 51 26 31 Intermittently 31 33 32 No consumption 18 41 38
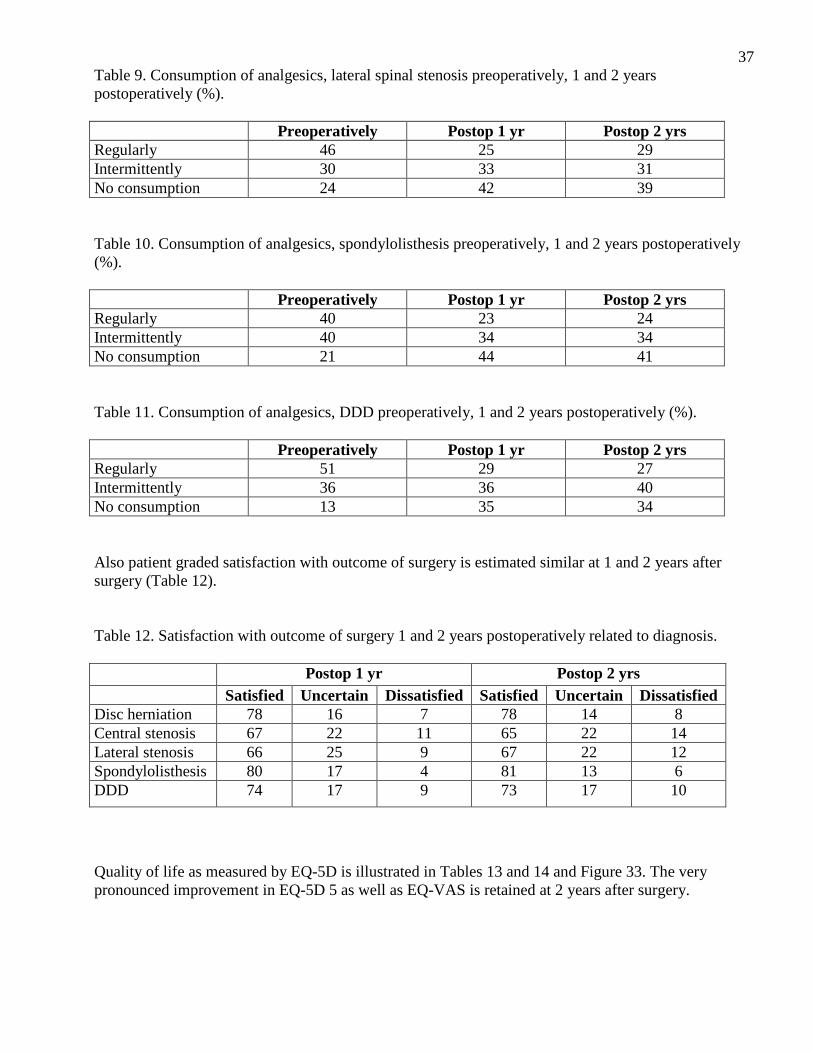
37Table 9. Consumption of analgesics, lateral spinal stenosis preoperatively, 1 and 2 years postoperatively (%). Preoperatively Postop 1 yr Postop 2 yrs Regularly 46 25 29 Intermittently 30 33 31 No consumption 24 42 39 Table 10. Consumption of analgesics, spondylolisthesis preoperatively, 1 and 2 years postoperatively (%). Preoperatively Postop 1 yr Postop 2 yrs Regularly 40 23 24 Intermittently 40 34 34 No consumption 21 44 41 Table 11. Consumption of analgesics, DDD preoperatively, 1 and 2 years postoperatively (%). Preoperatively Postop 1 yr Postop 2 yrs Regularly 51 29 27 Intermittently 36 36 40 No consumption 13 35 34 Also patient graded satisfaction with outcome of surgery is estimated similar at 1 and 2 years after surgery (Table 12). Table 12. Satisfaction with outcome of surgery 1 and 2 years postoperatively related to diagnosis. Postop 1 yr Postop 2 yrs Satisfied Uncertain Dissatisfied Satisfied Uncertain Dissatisfied Disc herniation 78 16 7 78 14 8 Central stenosis 67 22 11 65 22 14 Lateral stenosis 66 25 9 67 22 12 Spondylolisthesis 80 17 4 81 13 6 DDD 74 17 9 73 17 10
Quality of life as measured by EQ-5D is illustrated in Tables 13 and 14 and Figure 33. The very pronounced improvement in EQ-5D 5 as well as EQ-VAS is retained at 2 years after surgery.

38Table 13. EQ-5D means preoperatively, 1 and 2 years postoperatively, related to diagnosis. Preoperatively Postop 1 yr Postop 2 yrs Disc herniation 0.29 0.73 0.73 Central stenosis 0.38 0.63 0.62 Lateral stenosis 0.40 0.67 0.66 Spondylolisthesis 0.43 0.67 0.69 DDD 0.34 0.61 0.62
0
1
LDH CSS LSS Spond DDD
Preop
Postop 1 yr
Postop 2 yrs
Fig 33. Quality of life preoperatively, 1 and 2 years postoperatively measured by EQ-5D. Table 14. EQ-5D health estimation according to the VAS scale, means. Preoperatively Postop 1 yr Postop 2 yrs Disc herniation 46 73 71 Central stenosis 51 65 63 Lateral stenosis 53 58 68 Spondylolisthesis 51 70 69 DDD 48 63 65
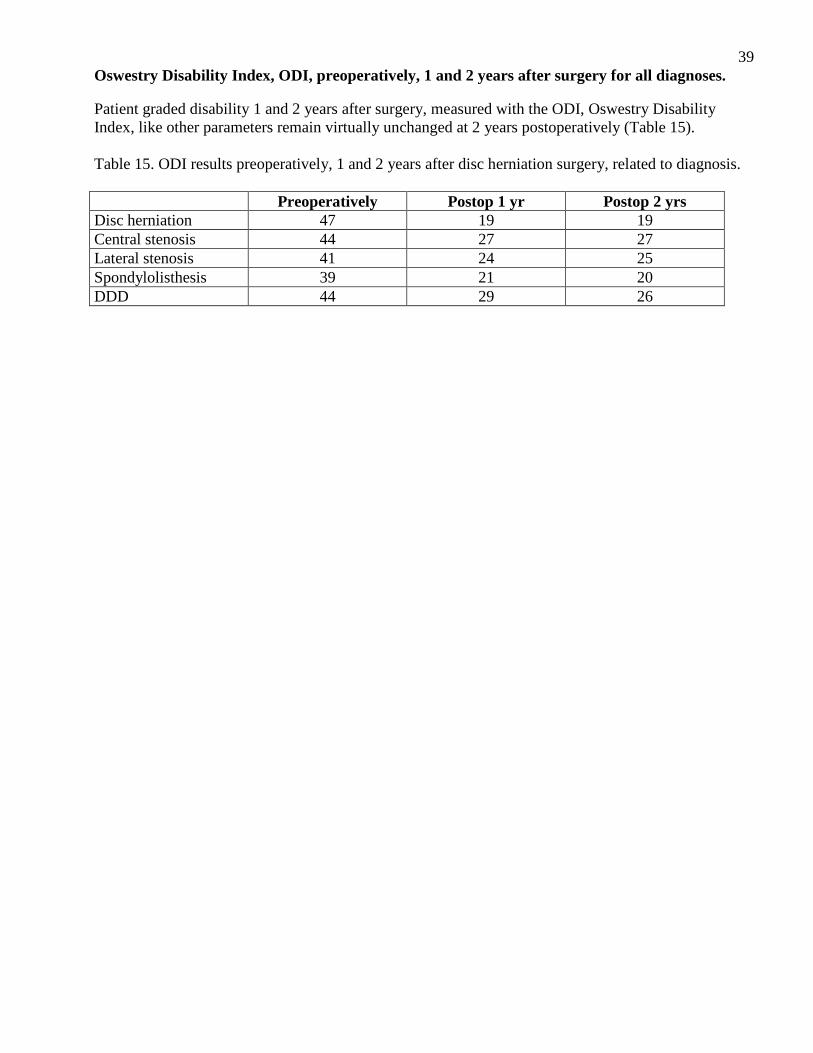
39Oswestry Disability Index, ODI, preoperatively, 1 and 2 years after surgery for all diagnoses. Patient graded disability 1 and 2 years after surgery, measured with the ODI, Oswestry Disability Index, like other parameters remain virtually unchanged at 2 years postoperatively (Table 15). Table 15. ODI results preoperatively, 1 and 2 years after disc herniation surgery, related to diagnosis. Preoperatively Postop 1 yr Postop 2 yrs Disc herniation 47 19 19 Central stenosis 44 27 27 Lateral stenosis 41 24 25 Spondylolisthesis 39 21 20 DDD 44 29 26

40IV. 5-year follow-up of lumbar spine surgery in Sweden 2008 In total 999 patients completed 1-, 2- and 5-year follow-up after having undergone lumbar spine surgery 2003. The follow-up rate in this group is much lower than regarding 1- and 2-year follow-ups so the figures have to be studied with caution. We are still collecting 5-year follow-up data and more complete data will be possible to present later on. Most common diagnoses for surgery were disc herniation 381 and central spinal stenosis 348 patients. 71 patients had been operated on for lateral spinal stenosis, 72 for spondylolisthesis and 127 for DDD. 6 patients had operations labelled as “other operations”. The following pages compare 1-, 2- and 5-year follow-ups of patients completing the data preoperatively and at all 3 postoperative time points. Pain on the VAS scale in the back as well as in the leg did not change much over the years, Table 16. Table 16. Pain on the VAS scale (means), related to diagnosis. Back Leg Preop 1 yr 2 yrs 5 yrs Preop 1 yr 2 yrs 5 yrs Disc herniation 44 21 22 21 68 20 21 18 Central stenosis 58 31 34 36 65 33 34 34 Lateral stenosis 56 31 33 28 61 35 32 29 Spondylolisthesis 60 31 26 28 51 23 27 24 DDD 58 28 33 31 39 21 26 22 Walking distance, diagnosis related, is presented in the following 5 tables (17-21), and minimal changes are observed over time. Table 17. Walking distance, disc herniation (%). Preoperatively Postop 1 yr Postop 2 yrs Postop 5 yrs < 100 m 37 4 4 4 100 m – 500 m 19 9 7 7 500 m – 1000 m 17 11 10 17 > 1000 m 27 76 78 83 Table 18. Walking distance, central spinal stenosis (%). Preoperatively Postop 1 yr Postop 2 yrs Postop 5 yrs < 100 m 43 17 20 29 100 m – 500 m 35 23 21 19 500 m – 1000m 12 15 17 15 > 1000 m 11 44 42 37
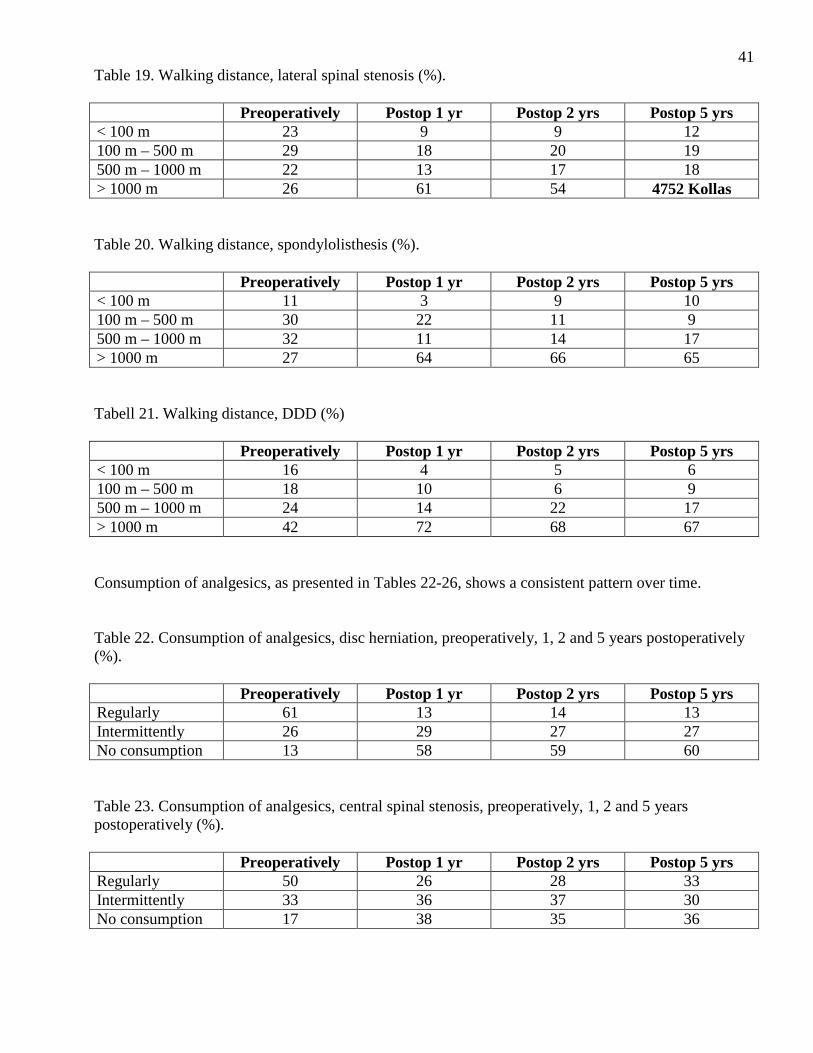
41Table 19. Walking distance, lateral spinal stenosis (%). Preoperatively Postop 1 yr Postop 2 yrs Postop 5 yrs < 100 m 23 9 9 12 100 m – 500 m 29 18 20 19 500 m – 1000 m 22 13 17 18 > 1000 m 26 61 54 4752 Kollas Table 20. Walking distance, spondylolisthesis (%). Preoperatively Postop 1 yr Postop 2 yrs Postop 5 yrs < 100 m 11 3 9 10 100 m – 500 m 30 22 11 9 500 m – 1000 m 32 11 14 17 > 1000 m 27 64 66 65 Tabell 21. Walking distance, DDD (%) Preoperatively Postop 1 yr Postop 2 yrs Postop 5 yrs < 100 m 16 4 5 6 100 m – 500 m 18 10 6 9 500 m – 1000 m 24 14 22 17 > 1000 m 42 72 68 67 Consumption of analgesics, as presented in Tables 22-26, shows a consistent pattern over time. Table 22. Consumption of analgesics, disc herniation, preoperatively, 1, 2 and 5 years postoperatively (%). Preoperatively Postop 1 yr Postop 2 yrs Postop 5 yrs Regularly 61 13 14 13 Intermittently 26 29 27 27 No consumption 13 58 59 60 Table 23. Consumption of analgesics, central spinal stenosis, preoperatively, 1, 2 and 5 years postoperatively (%). Preoperatively Postop 1 yr Postop 2 yrs Postop 5 yrs Regularly 50 26 28 33 Intermittently 33 36 37 30 No consumption 17 38 35 36
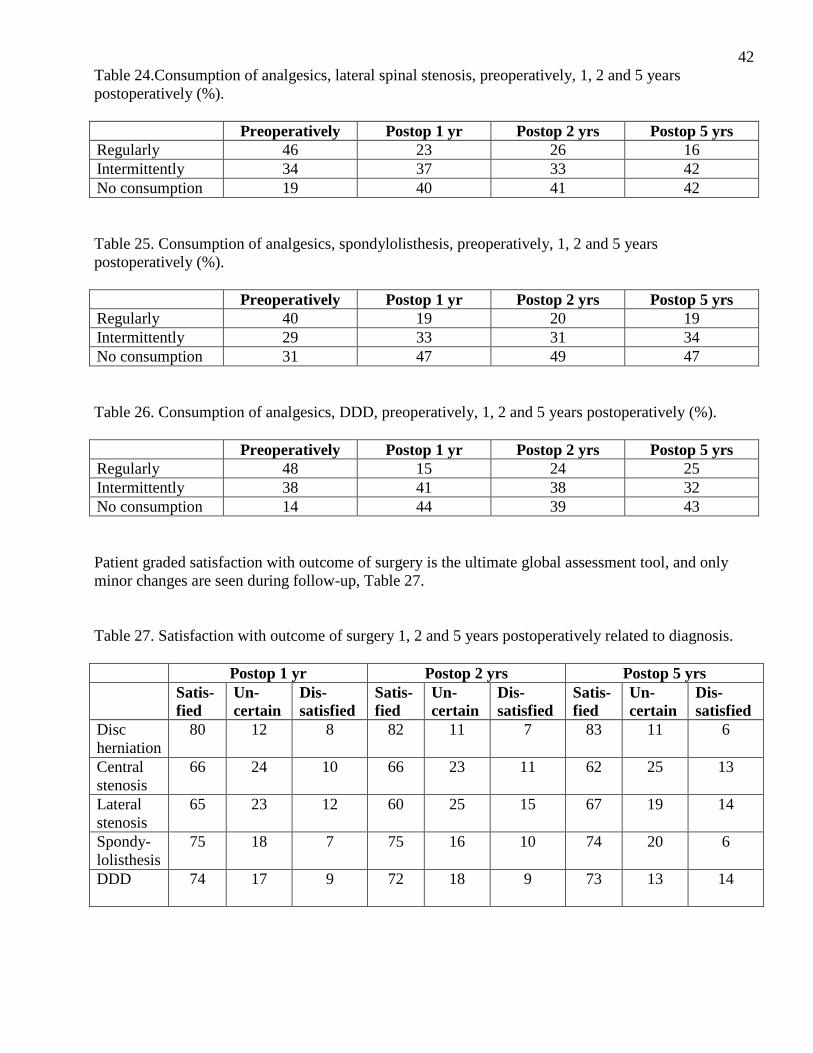
42Table 24.Consumption of analgesics, lateral spinal stenosis, preoperatively, 1, 2 and 5 years postoperatively (%). Preoperatively Postop 1 yr Postop 2 yrs Postop 5 yrs Regularly 46 23 26 16 Intermittently 34 37 33 42 No consumption 19 40 41 42 Table 25. Consumption of analgesics, spondylolisthesis, preoperatively, 1, 2 and 5 years postoperatively (%). Preoperatively Postop 1 yr Postop 2 yrs Postop 5 yrs Regularly 40 19 20 19 Intermittently 29 33 31 34 No consumption 31 47 49 47 Table 26. Consumption of analgesics, DDD, preoperatively, 1, 2 and 5 years postoperatively (%). Preoperatively Postop 1 yr Postop 2 yrs Postop 5 yrs Regularly 48 15 24 25 Intermittently 38 41 38 32 No consumption 14 44 39 43 Patient graded satisfaction with outcome of surgery is the ultimate global assessment tool, and only minor changes are seen during follow-up, Table 27. Table 27. Satisfaction with outcome of surgery 1, 2 and 5 years postoperatively related to diagnosis. Postop 1 yr Postop 2 yrs Postop 5 yrs Satis-
fied Un-certain
Dis-satisfied
Satis-fied
Un- certain
Dis-satisfied
Satis-fied
Un-certain
Dis-satisfied
Disc herniation
80 12 8 82 11 7 83 11 6
Central stenosis
66 24 10 66 23 11 62 25 13
Lateral stenosis
65 23 12 60 25 15 67 19 14
Spondy-lolisthesis
75 18 7 75 16 10 74 20 6
DDD
74 17 9 72 18 9 73 13 14

43Quality of life on the EQ-5D 5 and EQ-VAS scales are presented in Tables 28 and 29 and in Figure 34, and the very pronounced improvement in quality of life reported by the patients after surgery seems to be retained in a 5-year perspective. Table 28. EQ-5D means preoperatively, 1, 2 and 5 years postoperatively, related to diagnosis.
Preoperatively Postop 1 yr Postop 2 yrs Postop 5 yrs Disc herniation 0.22 0.71 0.71 0.76 Central stenosis 0.33 0.62 0.61 0.58 Lateral stenosis 0.40 0.62 0.66 0.66 Spondylolisthesis 0.41 0.63 0.62 0.65 DDD 0.40 0.65 0.68 0.65
0
1
LDH CSS LSS Spond DDD
Preop
Postop 1 yr
Postop 2 yrs
Postop 5 yrs
Fig 34. Quality of life, preoperatively, 1, 2 and 5 years postoperatively measured with EQ-5D. Table 29. EQ-5D health estimation according to the VAS scale (EQ-VAS), means.
Preoperatively Postop 1 yr Postop 2 yrs Postop 5 yrs Disc herniation 46 73 73 76 Central stenosis 50 62 62 59 Lateral stenosis 52 65 70 66 Spondylolisthesis 50 67 65 68 DDD 45 67 66 66
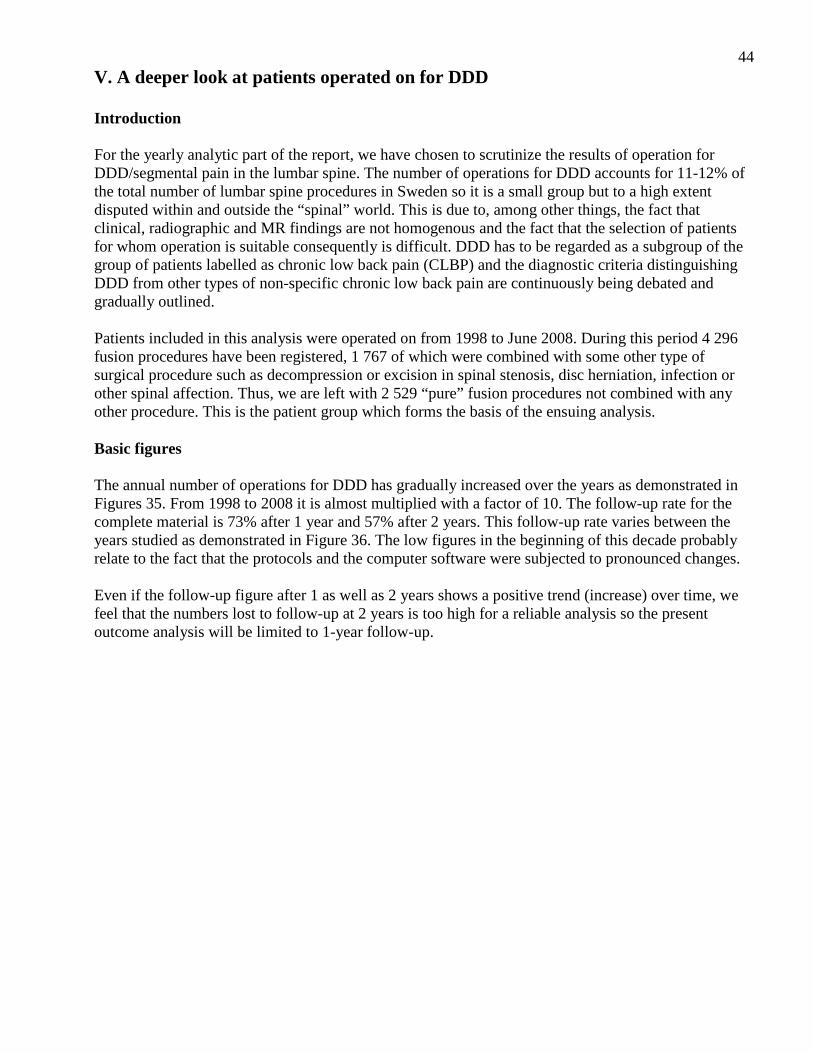
44V. A deeper look at patients operated on for DDD Introduction For the yearly analytic part of the report, we have chosen to scrutinize the results of operation for DDD/segmental pain in the lumbar spine. The number of operations for DDD accounts for 11-12% of the total number of lumbar spine procedures in Sweden so it is a small group but to a high extent disputed within and outside the “spinal” world. This is due to, among other things, the fact that clinical, radiographic and MR findings are not homogenous and the fact that the selection of patients for whom operation is suitable consequently is difficult. DDD has to be regarded as a subgroup of the group of patients labelled as chronic low back pain (CLBP) and the diagnostic criteria distinguishing DDD from other types of non-specific chronic low back pain are continuously being debated and gradually outlined. Patients included in this analysis were operated on from 1998 to June 2008. During this period 4 296 fusion procedures have been registered, 1 767 of which were combined with some other type of surgical procedure such as decompression or excision in spinal stenosis, disc herniation, infection or other spinal affection. Thus, we are left with 2 529 “pure” fusion procedures not combined with any other procedure. This is the patient group which forms the basis of the ensuing analysis. Basic figures The annual number of operations for DDD has gradually increased over the years as demonstrated in Figures 35. From 1998 to 2008 it is almost multiplied with a factor of 10. The follow-up rate for the complete material is 73% after 1 year and 57% after 2 years. This follow-up rate varies between the years studied as demonstrated in Figure 36. The low figures in the beginning of this decade probably relate to the fact that the protocols and the computer software were subjected to pronounced changes. Even if the follow-up figure after 1 as well as 2 years shows a positive trend (increase) over time, we feel that the numbers lost to follow-up at 2 years is too high for a reliable analysis so the present outcome analysis will be limited to 1-year follow-up.

45 Annual number of registered operations for DDD
0
100
200
300
400
500
600
700
-98 -99 -00 -01 -02 -03 -04 -05 -06 -07 -08
Fig 35. Number of registered operations for DDD annually 1998-2008.
1- AND 2-YEAR FOLLOW-UP RATE
0
10
20
30
40
50
60
70
80
90
100
-98 -99 -00 -01 -02 -03 -04 -05 -06 -07 -08
FU1FU2
Fig 36. Follow-up rate (percent) for DDD after 1 and 2 years. The low follow-up rate in the first years of the decade probably relates to the fact that the protocol and computer application underwent profound changes. Primary outcome measure
For outcome measurement in the spine register, the Oswestry Disability Index (ODI), the quality of life questionnaires SF-36 and EQ-5D, and pain measurement on the VAS scale for leg as well as back pain are utilized. To present all these data would give us a table that would be hard to digest and we have, after validation, chosen to use the patient based “global assessment” as the primary outcome measure. This global assessment is the patient estimation of change regarding back pain after surgery as compared to before, graded into a five level Linkert scale regarding back pain: Completely relieved, significantly improved, somewhat improved, unchanged or deteriorated. This very simple question

46appears to correlate very well with changes in our measures of function and quality of life in the register. The Figures 37-39 demonstrate how very well global assessment of back pain relates to all of the three scores for disability, quality of life and back pain on the VAS scale. Simply spoken, a patient estimating her/his back pain as significantly improved 1 year after surgery, has experienced reduction of back pain with 40 of 100 units on the VAS scale, has improved her/his quality of life (EQ-5D 5) with 0.36 and has improved her/his function or reduced disability with 23/100 ODI units. The correlation is very obvious and the 95% confidence intervals differ profoundly between the five categories when related to all three scores.
Completely Significantly Somewhat Unchanged Deteriorated painfree improved improved
Back pain Fig 37. Change of ODI in relation to global assessment, DDD.
Completely Significantly Somewhat Unchanged Deteriorated painfree improved improved
Back pain Fig 38. Change of EQ-5D in relation to global assessment, DDD.

47
Completely Significantly Somewhat Unchanged Deteriorated painfree improved improved
Back pain Fig 39. Change of VAS back pain in relation to global assessment, DDD. From these figures, one can also deduce what can be regarded as minimally clinically significant difference, MCSD, i.e. the back pain estimated as “somewhat improved”. A patient choosing this alternative has perceived a back pain reduction with 14 units on the VAS scale, a quality of life improvement with 0.2 units on the EQ-5D 5 and a reduced disability/improved back function, with 8 ODI units. It is also striking that the patients who do not experience any change of the preoperative back pain postoperatively also report 0 change with a very small confidence interval for VAS EQ-5D 5 and ODI. With these facts considered, it is our strongly felt opinion that global assessment is a reliable measure of the impact spine surgery for DDD has had on pain function and quality of life. Overall results Of 1 834 patients completing the 1-year follow-up, 80% reported improvement, 14% of which were totally painfree, 43% significantly improved and 23% somewhat improved. 12% were unchanged and 8% deteriorated when compared to preoperatively. Of primarily registered and operated patients, 54% were females and 46% males, and at the 1-year follow-up the corresponding figures were 55 and 45%. There seems to be no difference between genders regarding self reported degree of improvement after surgery for DDD (Chi² = 0.4), Figure 40.
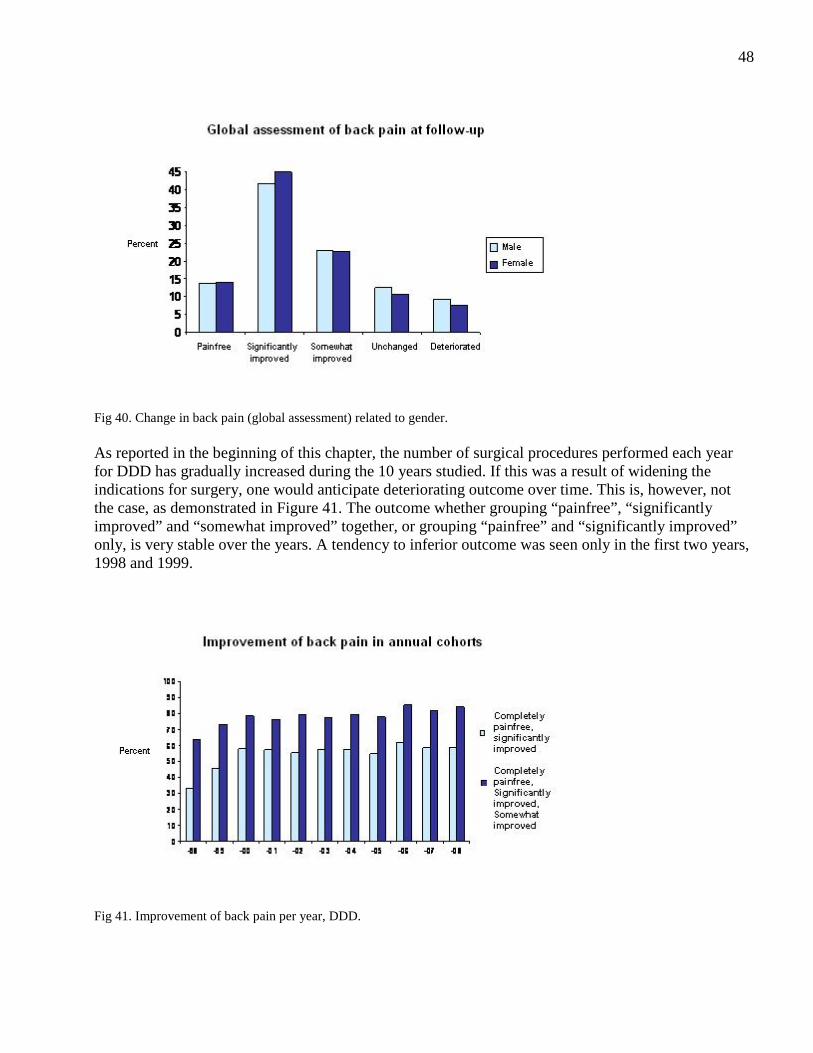
48
Fig 40. Change in back pain (global assessment) related to gender. As reported in the beginning of this chapter, the number of surgical procedures performed each year for DDD has gradually increased during the 10 years studied. If this was a result of widening the indications for surgery, one would anticipate deteriorating outcome over time. This is, however, not the case, as demonstrated in Figure 41. The outcome whether grouping “painfree”, “significantly improved” and “somewhat improved” together, or grouping “painfree” and “significantly improved” only, is very stable over the years. A tendency to inferior outcome was seen only in the first two years, 1998 and 1999.
Fig 41. Improvement of back pain per year, DDD.

49Quality of life During 2001, the register protocol was expanded to include EQ-5D as a quality of life questionnaire. Preoperative data have been completed by 1 953 patients and 1-year follow-up data by 1 588. A significant increase in quality of life one year after surgery is seen after operation for DDD. Figure 42 shows the results related to gender. A small difference between males and females is seen, females having a somewhat lower quality of life before surgery and the relative improvement for females is 0.29 and for males 0.25, a small difference but because of the high number of patients, statistically significant (Mann-Whitney U-test = 0.03). The clinical significance of this minor difference, however, is considered unimportant.
Fig 42. Change in quality of life preoperatively, 1 and 2 years postoperatively related to gender, DDD. When pre- and postoperative quality of life is studied over the 10-year period, there is a tendency towards higher quality of life before surgery and at 1-year follow-up but the relative improvement is unchanged over the years (Kruskal-Wallis = 0.21). This might be interpreted as indicating that patients with a better quality of life are operated on today than 10 years ago but are still improved to the same extent as those operated on 10 years ago. Complications The Swedish register contains two modalities to report complications and both have been studied in relation to surgery for DDD:
1. Surgeon reported complications, noted in the surgical protocol in conjunction with discharge from hospital. The menu contains the following complications: Death, thrombosis, pulmonary embolism, haematoma, nerve root injury, cauda equina syndrome, dural lesion and implant-related complications.
2. Patient based question at follow-up, expressed as follows: ”Has any complication to your spine
operation occurred?” This question was used up to and including 2004, but since it was regarded insufficient for statistics, we expanded the complication question to 6 questions,
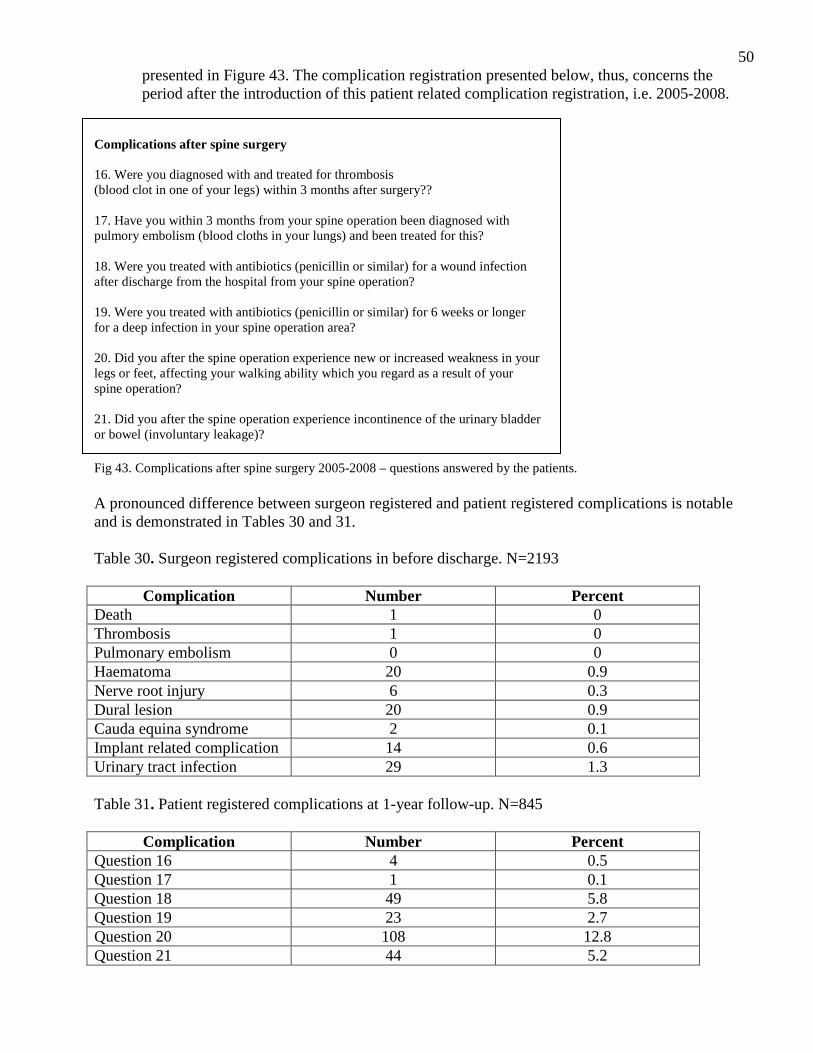
50presented in Figure 43. The complication registration presented below, thus, concerns the period after the introduction of this patient related complication registration, i.e. 2005-2008.
Complications after spine surgery 16. Were you diagnosed with and treated for thrombosis (blood clot in one of your legs) within 3 months after surgery?? 17. Have you within 3 months from your spine operation been diagnosed with pulmory embolism (blood cloths in your lungs) and been treated for this? 18. Were you treated with antibiotics (penicillin or similar) for a wound infection after discharge from the hospital from your spine operation? 19. Were you treated with antibiotics (penicillin or similar) for 6 weeks or longer for a deep infection in your spine operation area? 20. Did you after the spine operation experience new or increased weakness in your legs or feet, affecting your walking ability which you regard as a result of your spine operation? 21. Did you after the spine operation experience incontinence of the urinary bladder or bowel (involuntary leakage)? Fig 43. Complications after spine surgery 2005-2008 – questions answered by the patients. A pronounced difference between surgeon registered and patient registered complications is notable and is demonstrated in Tables 30 and 31. Table 30. Surgeon registered complications in before discharge. N=2193
Complication Number Percent Death 1 0 Thrombosis 1 0 Pulmonary embolism 0 0 Haematoma 20 0.9 Nerve root injury 6 0.3 Dural lesion 20 0.9 Cauda equina syndrome 2 0.1 Implant related complication 14 0.6 Urinary tract infection 29 1.3 Table 31. Patient registered complications at 1-year follow-up. N=845
Complication Number Percent Question 16 4 0.5 Question 17 1 0.1 Question 18 49 5.8 Question 19 23 2.7 Question 20 108 12.8 Question 21 44 5.2

51 There is a surprisingly high incidence of patient reported complications regarding leg weakness and incontinence. This high incidence can have several different explanations. The surgeon reported complications concern the primary hospitalization time while the patient reported complications reflect the whole postoperative period. There might be an underreporting from the surgeon, but, on the other hand, the patient related question might be misinterpreted to some extent. The patient reported complication may also reflect a deterioration occurring during the first postoperative year. At this stage, it is not possible to judge the validity of the answers, but our aim is to perform a deeper analysis of the problem. Regarding infection, this complication rate is in line with reported complication rates in other orthopaedic surgical procedures although the deep infections seem to be more common than expected. This, also, will be the object of closer analysis. Surgical techniques Over the 11 years, the surgical techniques of treating DDD have changed. While uninstrumented posterolateral fusion (PLF) accounts for a fairly constant small part, during later years interbody fusions (bone graft and implants placed in the evacuated disc space) performed from posterior and combined with pedicular screw implants presented as PLIF and TLIF, below, have increased. The yearly changes are presented in Figure 44.
Fig 44. Surgical techniques from 1998-2008 for DDD. The surgical techniques used do not differ between males and females (Figure 45).

52
Fig 45. Surgical techniques used related to gender (DDD). We have made a preliminary comparison between the outcomes reported for the three most common surgical techniques for DDD today (instrumented PLF, PLIF and disc prosthesis) to the oldest method (uninstrumented PLF). The results for the different surgical techniques differ and some of the differences are statistically significant, when tested with relevant statistical methods. Such differences can also be established when the outcome of the different surgical techniques is measured by EQ-5D, back pain on the VAS scale and ODI. As seen in Figures 46 and 47A-C, however, the differences are small and cannot be regarded as being clinically significant. Present data do not permit us to determine whether differences in outcome are effects of the surgical procedures as such or if they are effects of a selection bias; the individual surgeon selects the technique of surgery for the individual patient. It should also be borne in mind that long-term outcome might be different when fusion and motion preservation technology are compared, and long-term follow-up is essential.
Fig 46. Outcome measured by global assessment for different surgical techniques.

53
Fig 47A. Outcome measured by EQ-5D for different surgical techniques.
Fig 47B. Outcome measured by VAS for different surgical techniques.

54
Fig 47C. Outcome measured by ODI for different surgical techniques. The number of patients having returned to work, full- or part-time, at 1-year follow-up is presented din Figure 48. RETURN TO WORK RATE RELATED TO SURGICAL TECHNIQUE
Fig 48. Return to work full- or part-time at 1-year follow-up. Results in relation to number of segments operated on Surgical treatment for DDD may be performed on one or several segments. The most common segment operated on is L5/S1 (Figure 49).

55
Fig 49. Segments operated on (%). The results concerning improvement of back pain postoperatively do not differ significantly between the different levels or the different combination of levels where fusion has been performed. Irrespective of whether the results are given as Global assessment, EQ-5D or VAS back pain, the statistical calculations do not reveal any significant difference between the levels operated on (Figure 50).
Fig 50. Improvement of back pain (VAS) related to segments operated on (%). Thus, it seems that the result, at least, short-term, does not differ if one, two or three segments are operated. In the long-term differences might be expected and will be evaluated by the Swedish Spine Register later on. This is a controversial subject, to which the answer has not yet been given. Predictors In a univariate analysis we have found gender, smoking, previous spine operation, working ability, duration of symptom and intensity of pain to be significantly or almost significantly correlated with outcome of surgery. A multivariate logistic regression analysis (Table 32) demonstrates that high
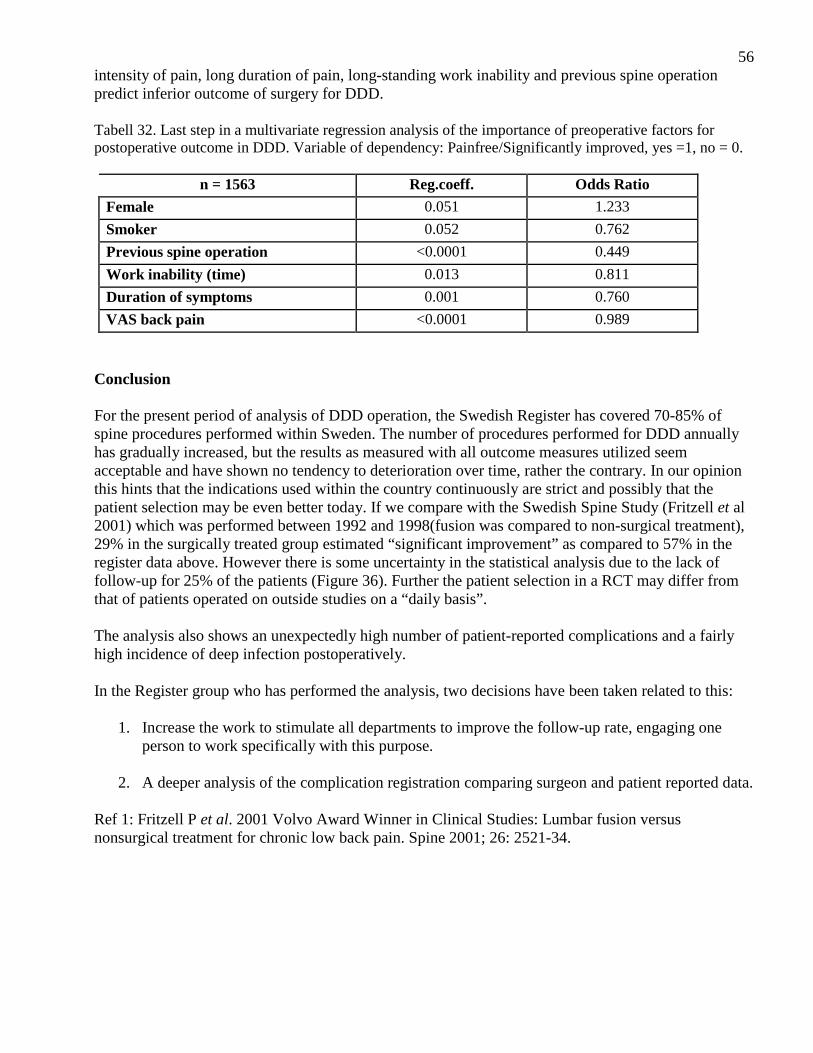
56intensity of pain, long duration of pain, long-standing work inability and previous spine operation predict inferior outcome of surgery for DDD. Tabell 32. Last step in a multivariate regression analysis of the importance of preoperative factors for postoperative outcome in DDD. Variable of dependency: Painfree/Significantly improved, yes =1, no = 0.
n = 1563 Reg.coeff. Odds Ratio
Female 0.051 1.233
Smoker 0.052 0.762
Previous spine operation <0.0001 0.449
Work inability (time) 0.013 0.811
Duration of symptoms 0.001 0.760
VAS back pain <0.0001 0.989
Conclusion For the present period of analysis of DDD operation, the Swedish Register has covered 70-85% of spine procedures performed within Sweden. The number of procedures performed for DDD annually has gradually increased, but the results as measured with all outcome measures utilized seem acceptable and have shown no tendency to deterioration over time, rather the contrary. In our opinion this hints that the indications used within the country continuously are strict and possibly that the patient selection may be even better today. If we compare with the Swedish Spine Study (Fritzell et al 2001) which was performed between 1992 and 1998(fusion was compared to non-surgical treatment), 29% in the surgically treated group estimated “significant improvement” as compared to 57% in the register data above. However there is some uncertainty in the statistical analysis due to the lack of follow-up for 25% of the patients (Figure 36). Further the patient selection in a RCT may differ from that of patients operated on outside studies on a “daily basis”. The analysis also shows an unexpectedly high number of patient-reported complications and a fairly high incidence of deep infection postoperatively. In the Register group who has performed the analysis, two decisions have been taken related to this:
1. Increase the work to stimulate all departments to improve the follow-up rate, engaging one person to work specifically with this purpose.
2. A deeper analysis of the complication registration comparing surgeon and patient reported data.
Ref 1: Fritzell P et al. 2001 Volvo Award Winner in Clinical Studies: Lumbar fusion versus nonsurgical treatment for chronic low back pain. Spine 2001; 26: 2521-34.

57VI. Number of registered operations and follow-up rate The number of patients registered for surgery for degenerative disorders of the lumbar spine has continuously increased over the last 10 years, Figure 51.
0
1000
2000
3000
4000
5000
6000
1999 2000 2001 2002 2003 2004 2005 2006 2007 2008
Fig 51. Number of patients registered for surgery for degenerative disorders of the lumbar spine 1999-2008. Below is shown follow-up rate at 1 and 2 years for patients operated on 2006, Figure 52.
Fig 52. Current follow-up rate.

58 VII. Conclusion The Swedish Spine Register, SweSpine, contains more than 40 000 patients registered after spine surgery. This year’s figure is the highest so far, 5 632 patients have been registered for a surgical procedure. We feel the development to be very stimulating, positive, enabling many analyses in the future, and also hypothesis generating. The absolutely most important task for us is to increase the follow-up rate which will give us a clinical data base that is difficult to beat concerning monitoring or outcome and documentation of surgical activity. The amount of data gathered calls for more analyses than the register group has been able to perform and we hope that other people within the Swedish Society of Spinal Surgeons will be prepared to work with the material. As demonstrated on the next page, analyses performed have for example studied gender differences in lumbar disc herniation surgery, negative predictors for outcome of spine surgery and complication registration studies of DDD. In the long-term we also hope that 5- and 10-year follow-up will be possible to perform to such an extent that we can determine how patients are doing at a time so far after spine surgery that very many other things have happened to them in life. The Register group finally wants to thank all colleagues and secretaries engaged in gathering data to the register and all other interested spine surgeons who have contributed in gradually developing the register. We also appreciate the economical funding from SKL/National Board of Health and Welfare.

59VIII. Examples on publications using SweSpine data
1. Fritzell P, Strömqvist B, Hägg O. A practical approach to spine registers in Europe. The Swedish experience. Eur Spine J 2006; 15: S57-S63.
2. Jansson KA, Németh G, Granath F, Jönsson B, Blomqvist P. Health-related quality of life (EQ-5D) before and one year after surgery for lumbar spinal stenosis. J Bone Joint Surg 2009; 91-B(2): 210-6.
3. Jansson KA, Németh G, Granath F, Jönsson B, Blomqvist P. Health-related quality of life in patients before and after surgery for a herniated lumbar disc. J bone Joint Surg 2005; 87-B(7): 959-64.
4. Strömqvist B, Jönsson B, Fritzell P, Hägg O, Larsson B-E, Lind B. The Swedish national register for lumbar spine surgery. Acta Orthop Scand 2001; 72: 99-106.
5. Strömqvist B, Fritzell P, Hägg O, Jönsson B. One-year report from the Swedish National Spine Register. Swedish Society of Spinal Surgeons. Acta Orthop 2005; 76(Suppl 319): 1-24.
6. Strömqvist F, Ahmad M, Hildingsson C, Jönsson B, Strömqvist B. Gender differences in lumbar disc herniation surgery. Acta Orthop 2008; 79(5): 643-9.
7. Strömqvist B, Fritzell P, Hägg O, Jönsson B. Swedish Society of Spinal Surgeons. The Swedish Spine Register: development, design and utility. Eur Spine J 2009; 18(Suppl 3): S294-S304.
8. Zanoli G. Outcome assessment in lumbar spine surgery. Thesis. Acta Orthop 2005; 76(Suppl 318): 1-47.
9. Zanoli G, Nilsson LT, Strömqvist B. Reliability of the prospective data collection protocol of the Swedish Spine Register. Test-retest analysis of 119 patients. Acta Orthop 2006; 77: 662-9.
10. Zanoli G, Strömqvist B, Jönsson B. SF-36 scores in degenerative lumbar spine disorders: analysis of prospective data from 451 patients. Acta Orthop 2006; 77: 298-306.
11. Zanoli G, Strömqvist B, Jönsson B. Visual analog scales for interpretation of back and leg pain intensity in patients operated for degenerative lumbar spine disorders. Spine 2001; 26: 2375-80.