swan valley osb - clean environment commission · build with us. ™ swan valley osb presentation...
TRANSCRIPT

BU
ILD
WIT
H U
S.™ Swan Valley OSB
Presentation to Clean Environment
Commission, July 2009
BUILD WITH US.™
22
Presentation Summary
• Company information
• RTO background and history
• Review of the application
• Ambient air quality
• Environmental benefits
• Socio-economic review

BUILD WITH US.™
Who We Are

BUILD WITH US.™
4
LP Company Profile
• Founded in 1973
• 26 mills (14 OSB mills)
– 6 mills in Canada (4 OSB)
• 4 Joint Ventures (2 OSB and 2 EWP)
• 4600 employees (1400 in Canada)

BUILD WITH US.™
5
2008 OSB Market Share
LP
24.4%
Grant
11.6%
Ainsworth
11.0%
Weyco
9.0%
GP
8.8%
Huber
7.3%
Other
7.0%
Tolko
6.0%
Norbord
15.0%
BUILD WITH US.™
6
LP Vision and Values
• To be a respected, profitable and growing manufacturer of building products. To be a supplier of choice because of our quality products and reliable services. And to be an employer ofchoice – offering a safe, fun, ethical, challenging and rewarding place to work.
• We will
– Obey all legal requirements
– Communicate honestly and truthfully
– Act with integrity
– Be fair and respectful in our workplace
– Safety, Environment and Quality are core values

BUILD WITH US.™
7
Stewardship
• A sincere respect and care for our shared environment is at the core of everything we do.
• Natural resources are critical to our organization: they not only allow us to manufacture the premium building products we’re known for, they help us sustain livable communities and a high quality of life.

BUILD WITH US.™
8
Stewardship
• Good environmental stewardship is vital to strength, profitability and sustainability of our company and the communities where we operate.

BUILD WITH US.™
We are Local
BUILD WITH US.™
10
LP Swan Valley OSB
• Operating in the Valley for over 13 years
– First board produced January 21, 1996
• 175 employees
– Employment for Valley residents
– Most of these people lived in the Valley or returned for the opportunity to work near home
• We contribute over $35 million to the local economy annually
• Active supporter of local community initiatives

BU
ILD
WIT
H U
S.™
Defining the Issue

BUILD WITH US.™
1212
Important Terms
Volatile organic compounds (VOCs) - VOC is the collective name given to compounds that are gases at room temperature and which contain carbon as the primary element. VOCs are found naturally in all organic materials such as raw wood, agricultural products and petroleum products. VOCs are commonly found in and released from many consumer products.
Greenhouse Gas (GHGs) – Gases that absorb heat radiated from earth. The primary man-made GHGs are carbon dioxide (CO2), nitrous oxide (N2O), and methane). In Canada, 80% of total national GHG emissions are predominantly associated with the production or consumption of fossil fuels.
Nitrogen oxides (NOx) – Gases that contribute to ozone, smog, acid rain and fine particulate. Nitrogen oxides occur naturally in the environment but are also generated by the combustion of fuels.
BUILD WITH US.™
1313
Important Terms cont’d
Ambient air - Open air that is not enclosed within a building, chimney or other structure.
Ambient air quality criteria (AAQC) - Many provinces, including Manitoba, have established ambient air quality criteria (AAQC). They are set at the level where no adverse effect is observed on people or the environment.
Air quality dispersion modeling – Computer generated mathematical models that are used to predict the ground level concentrations at a point downwind of one or more emission sources.
Resins – phenol-formaldehyde and MDI

BU
ILD
WIT
H U
S.™
What is an RTO?
BUILD WITH US.™
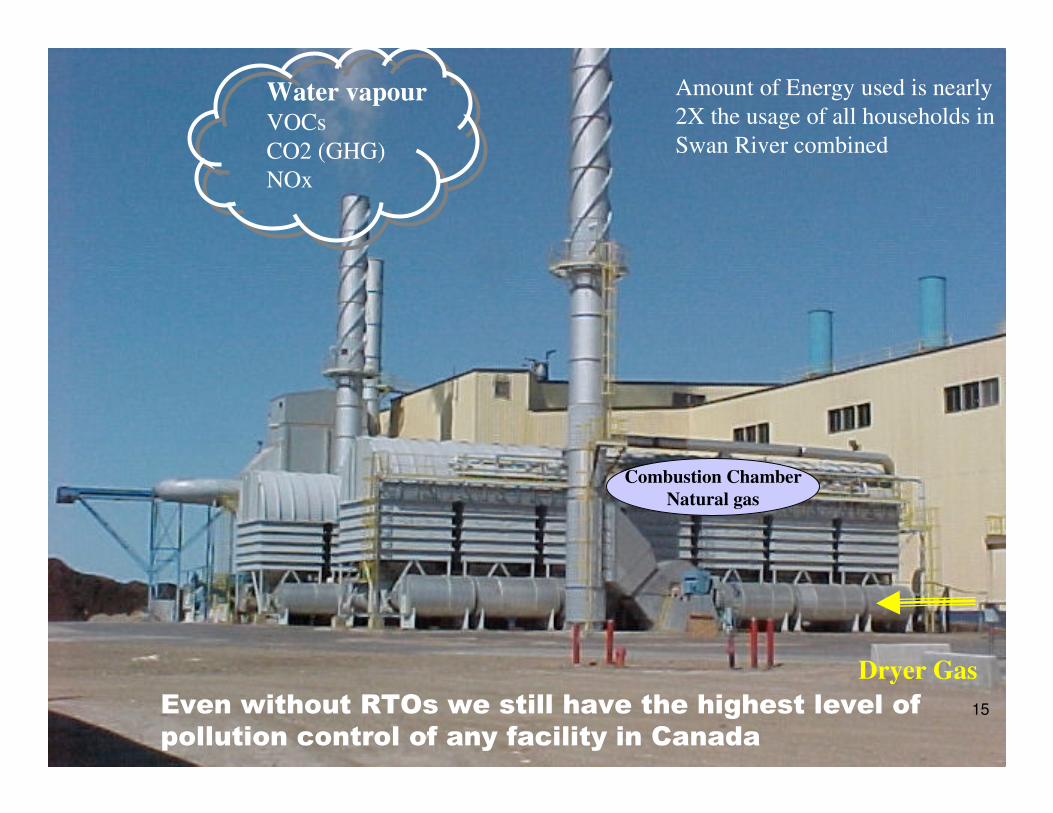
1515
Water vapourVOCs
CO2 (GHG)
NOx
Dryer Gas
Combustion Chamber
Natural gas
Amount of Energy used is nearly
2X the usage of all households in
Swan River combined
Even without RTOs we still have the highest level of
pollution control of any facility in Canada

BUILD WITH US.™
Process Flow

BUILD WITH US.™
1717
• 1994 Environmental Impact Assessment (EIA) determined that all applicable air quality criteria were met…without RTOs
• LP proposed to install RTOs due to concerns regarding the uncertainty of a new industry to the Valley.
• At the time it was believed that any Canadian mills built after Swan were going to be constructed with RTOs and existing mills retrofitted with RTOs
Why We Have RTOs
BUILD WITH US.™
1818
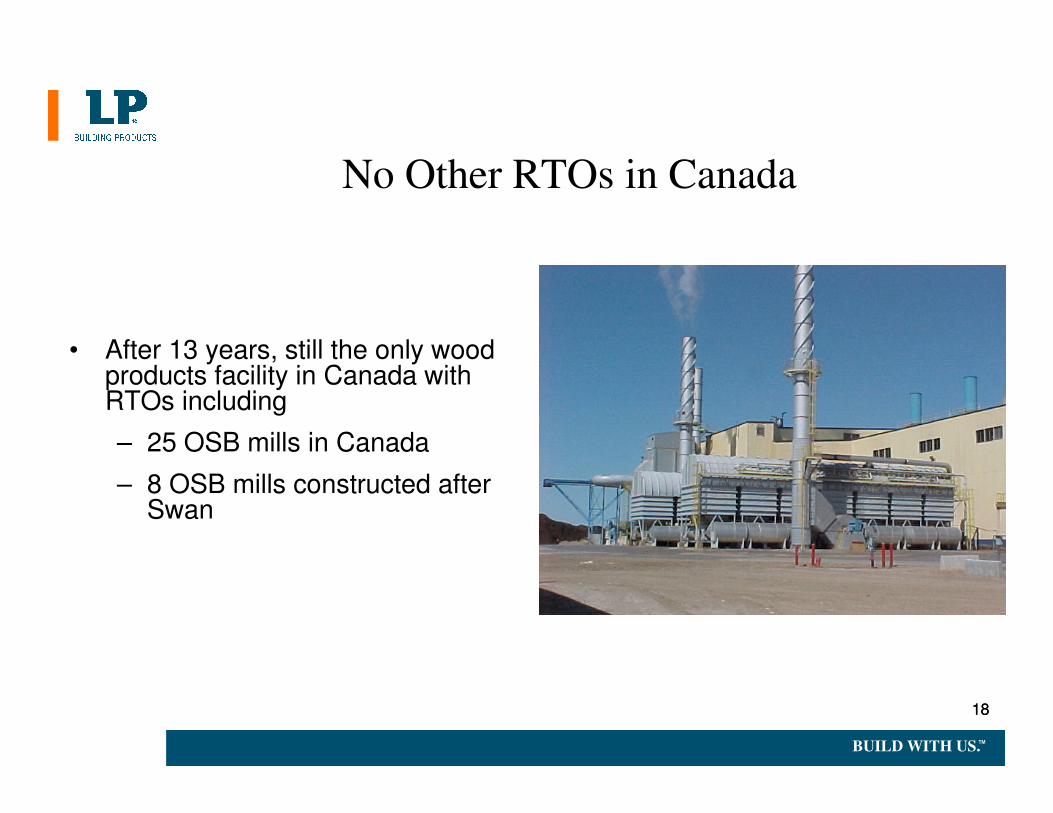
No Other RTOs in Canada
• After 13 years, still the only wood products facility in Canada with RTOs including
– 25 OSB mills in Canada
– 8 OSB mills constructed after Swan

BUILD WITH US.™
1919
SWAN VALLEY OSB
OSB Plants in Canada
Swan Valley OSB is
the only mill in
Canada with RTOs

BUILD WITH US.™
2020
Unlikely There Will Ever be RTOs in
Canada
• No Canadian (federal or provincial) jurisdiction is advocating RTO technology because of negative environmental impacts (GHG and NOx)

BUILD WITH US.™
2121
Highest Level of Emission Control in Canada
• WESPs and high efficiency cyclones on Dryers/Energy System
• DESP & Multiclone on bark fired Thermal Oil Heater
• Five Baghouses on various stages of the flake handling process

BUILD WITH US.™
2222
Section Summary
• LP Swan Valley is the only wood products facility in Canada with RTOs.
• Even without the RTOs, LP Swan Valley will still have the highest level of emission control equipment of any mill in Canada.

BU
ILD
WIT
H U
S.™
Advances in Process
Technology

BUILD WITH US.™
2424
• In 2004 we installed a state-of-the-art drying and heat energy system
• This technology results in reduced emissions through:
– Recycle dryer exhaust gas
– Lower dryer inlet temperatures
– Gentler drying process
$26 Million Technology Upgrade
BUILD WITH US.™
2525
We started down this path 8 years ago…
• There was a need to address wood residue imbalance
• We recognized an opportunity to:
– optimize resource usage
– balance energy demands
– eliminate RTOs through technology upgrade
– reduce emissions of greenhouse gases and nitrogen oxides
• Initiated discussions with Manitoba Conservation and Community Liaison Committee regarding the project and future opportunities
– CLC included Concerned Citizens of the Valley until they withdrew from the committee

BUILD WITH US.™
2626
Section Summary
• Latest process technology is in place to reduce emissions

BU
ILD
WIT
H U
S.™
What is LP Swan Valley
Requesting?

BUILD WITH US.™
2828
• Increase emission limits from the Press:
– Formaldehyde
– Benzene
– MDI
– VOC
• Increase emission limits from the WESPs:
– Formaldehyde
– Benzene
Amendments to the Mill Environmental License

BUILD WITH US.™
2929
Proposed Modifications
• The proposal includes the construction of a single 49.5 metre dryer/WESP stack
– Provides for optimum dispersion in order to ensure protection of community health and the environment
• All other emission sources unchanged
BUILD WITH US.™
3030
Representative Emission Limits
• 1994 emission limits proposed by LP were developed based on:
– engineering estimates and emission factors
– zero site specific data
– limited industry data
– many assumptions
• 2009 proposed emission limits based on:
– actual site specific data
– latest technology
– extensive industry data
– industry specific stack test methods
• Our application is robust based on 13 years of site specific data

BUILD WITH US.™
3131
• Even with proposed changes LP Swan Valley will still be subjected to more compliance conditions and limits than any other OSB plant in Canada (confirmed in Appendix C, SENES report, 2009)
• Proposed limits conform with any applicable industry standards in Canada
LP Swan Valley Continues to Meet High Standards

BUILD WITH US.™
3232
We Followed the Process
Applied for an Alteration to the Development:
• Filed a Proposal
– Determined to be a Major Alteration to the Development
• Screening – proposal reviewed by Manitoba Conservation, the public and a Technical Advisory Committee (TAC)
– Public review conducted through media advertisement and placement of proposal in the public registries
– 45 day public consultation period
• Minister called for Clean Environment Commission review and recommendations
• Ultimate Licensing Decision by Manitoba Conservation

BUILD WITH US.™
3333
Section Summary
• Proposed limits based on site specific data
• Proposed limits conform with industry standards in Canada

BU
ILD
WIT
H U
S.™
Demonstrating Protection of
Community Health and the
Environment Through:
Dispersion Modeling

BUILD WITH US.™
3535
What is Dispersion Modeling?
• Dispersion Modeling predicts maximum ground level concentrations for comparison to ambient air quality criteria (AAQC)
• Dispersion modeling demonstrates that the proposed emission limits will meet all Manitoba AAQC and ensure protection of community health and the environment.

BUILD WITH US.™
3636
Approved Modeling Approach
• Followed “Guidelines for Air Dispersion Modeling in Manitoba” (November 2006)
– LP used Model version ISC Prime
– Detailed modeling protocol approved in advance by MB Conservation
• Performed by Olsson Associates, an outside consultant
• Manitoba Conservation determined that the results were acceptable

BUILD WITH US.™
3737
Modeling Results; No RTOs
• Maximum ground level concentrations (GLC) meet all applicable AAQC under all conditions without RTOs
• Key model results:
– Formaldehyde is below AAQC 100% of the time
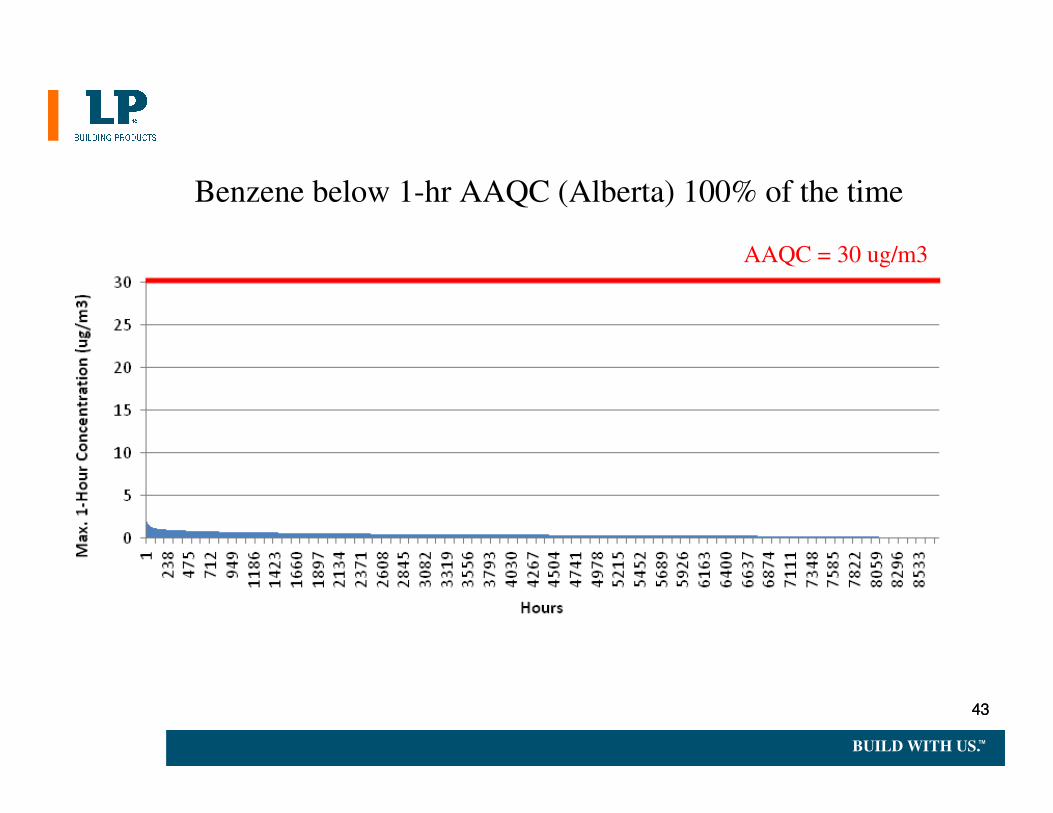
– Benzene is below AAQC 100% of the time
– MDI is below AAQC 100% of the time
BUILD WITH US.™
3838
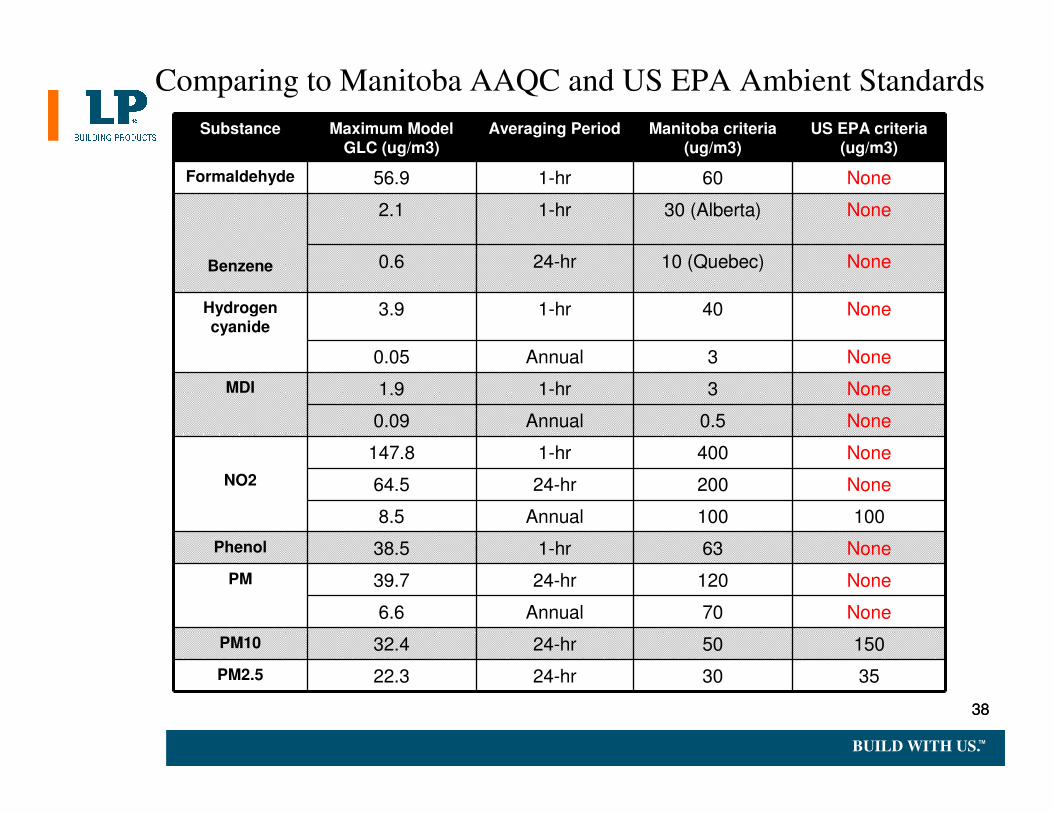
Comparing to Manitoba AAQC and US EPA Ambient Standards
Substance Maximum Model GLC (ug/m3)
Averaging Period Manitoba criteria (ug/m3)
US EPA criteria (ug/m3)
Formaldehyde 56.9 1-hr 60 None
Benzene
2.1 1-hr 30 (Alberta) None
0.6 24-hr 10 (Quebec) None
Hydrogen cyanide
3.9 1-hr 40 None
0.05 Annual 3 None
MDI 1.9 1-hr 3 None
0.09 Annual 0.5 None
NO2
147.8 1-hr 400 None
64.5 24-hr 200 None
8.5 Annual 100 100
Phenol 38.5 1-hr 63 None
PM 39.7 24-hr 120 None
6.6 Annual 70 None
PM10 32.4 24-hr 50 150
PM2.5 22.3 24-hr 30 35

BUILD WITH US.™
3939
Formaldehyde below Manitoba 1-hr AAQC 100% of the time
AAQC = 60 ug/m3

BUILD WITH US.™
4040
MB AAQC = 60 ug/m3

BUILD WITH US.™
4141

BUILD WITH US.™
4242
MDI below Manitoba 1-hr AAQC 100% of the time
AAQC = 3 ug/m3
BUILD WITH US.™
4343
Benzene below 1-hr AAQC (Alberta) 100% of the time
AAQC = 30 ug/m3

BUILD WITH US.™
4444
Benzene below 24-hr AAQC (Quebec) 100% of the time
AAQC = 10 ug/m3

BUILD WITH US.™
4545
Hydrogen Cyanide below Manitoba 1-hr AAQC 100% of the time
AAQC = 40 ug/m3

BUILD WITH US.™
4646
Phenol below Manitoba 1-hr AAQC 100% of the time
AAQC = 63 ug/m3

BUILD WITH US.™
4747
NO2 below Manitoba 1-hr AAQC 100% of the time
AAQC = 400 ug/m3

BUILD WITH US.™
4848
NO2 below Manitoba 24-hr AAQC 100% of the time
AAQC = 200 ug/m3

BUILD WITH US.™
4949
Total Suspended Particulate
below Manitoba 24-hr AAQC 100% of the time
AAQC = 120 ug/m3
BUILD WITH US.™
5050
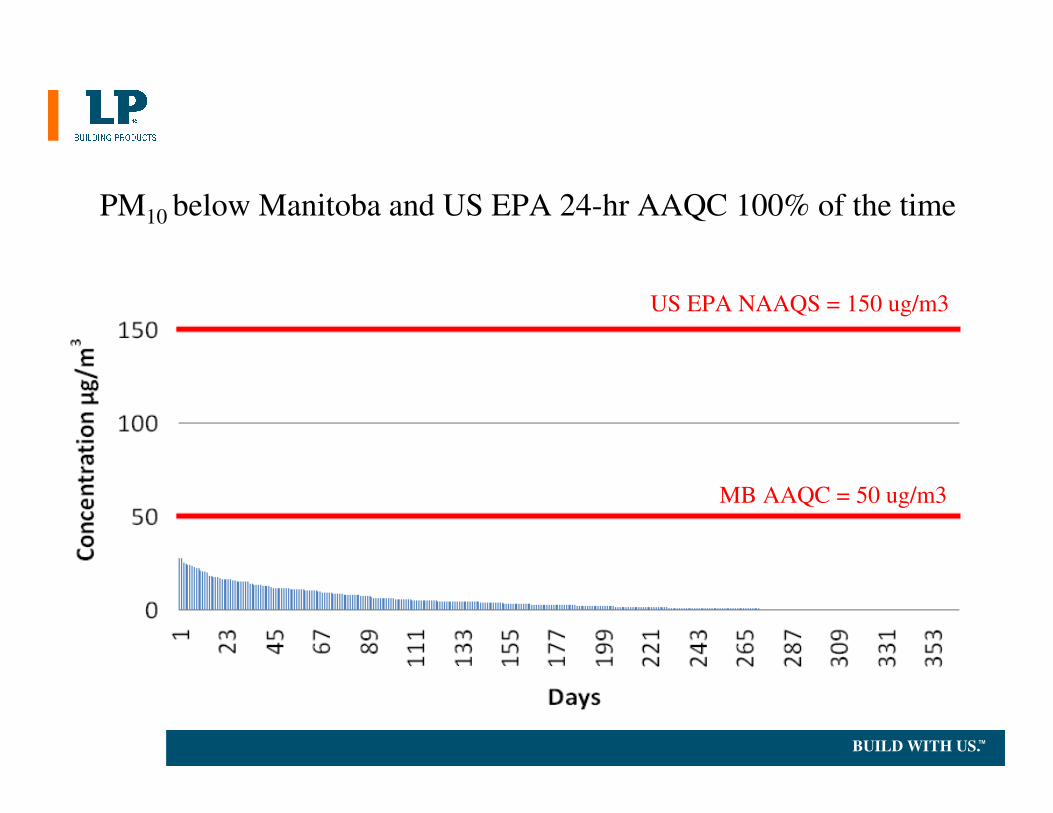
PM10 below Manitoba and US EPA 24-hr AAQC 100% of the time
MB AAQC = 50 ug/m3
US EPA NAAQS = 150 ug/m3

BUILD WITH US.™
5151
PM2.5 below Manitoba and US EPA 24-hr AAQC 100% of the time
US EPA NAAQS = 35 ug/m3
MB AAQC = 30 ug/m3

BUILD WITH US.™
5252
Section Summary
• Modeling demonstrates that the proposed emission limits will meet all Manitoba AAQC 100% of the time
• Meeting the AAQC ensures protection of community health and the environment

BU
ILD
WIT
H U
S.™
Demonstrating Protection of
Community Health and the
Environment Through:
Health Risk Assessment

BUILD WITH US.™
5454
What is a Health Risk Assessment?
• Calculates health risk levels based on
– the maximum ground level concentrations (GLC) predicted by the dispersion model
– a comparison to AAQC and human exposure databases
• The Health Risk Assessment demonstrates that the risk associated with the proposed emission limits will ensure protection of community health and the environment

BUILD WITH US.™
5555
Rigorous External Reviews Were Conducted
• MB Conservation’s Technical Advisory Committee (TAC) reviewed the risk assessment in March 2009 and had no issues or concerns
– In the TAC summary, Manitoba Health wrote:
“In general, it seems to make sense that the LP Canada Ltd. Swan Valley OSB Plant be held to the same emission limit standards as that of other similar industries throughout the province/country.”
• OHG Consulting reviewed the Health Risk Assessment in June 2009 and agreed with the conclusions

BUILD WITH US.™
5656
Health Risk Assessment Conclusions
• Health risks associated with cancer determined to be less than 1-in-a-million.
– 1-in-a-million risk level is the accepted standard world-wide (US, Canada, the UK, the World Health Organization)
• Non-cancer risks were characterized as “no adverse effect”

BUILD WITH US.™
5757
What does 1-in-a-million mean?
Risk was characterized by Commissioner of the U.S. Food and Drug Administration (1987) as follows:
“The risk of one in a million is often misunderstood by the public and the media. It is not an actual risk, i.e. it is not expected that one out of every million people will get cancer if they drink decaffeinated coffee. Rather, it is a mathematical risk, based on scientific assumptions used in risk assessment. When the FDA uses the risk level of one
in a million, it is confident that the risk to humans is virtually
nonexistent."
Source – de Vries (Ed.), “Food Safety and Toxicology," CRC Press1996.
BUILD WITH US.™
5858
What Does “No Adverse Effect” Mean?
• Recall that AAQC are set at levels at which there is no adverse effect on people or environment
• Dispersion modeling results demonstrated that all AAQC met 100% of the time

BUILD WITH US.™
5959
Health Risk Levels Associated with the Proposed
Emission Limits
Parameter Carcinogen Health Risk Level
Formaldehyde Yes 7 out of 1 Billion
Benzene Yes 2.3 out of 10 million
HCN No No adverse effect
MDI No No adverse effect
NO2 No No adverse effect
Phenol No No adverse effect
PM10 No No adverse effect
PM 2.5 No No adverse effect

BUILD WITH US.™
6060
Comparison to Everyday Risks
• Lifetime Risk All cancers 2-in-100
• Motor vehicle accident 1.7-in-100
• Home accidents 8-in-1000
• Proposed Formaldehyde limit 7-in-1,000,000,000
• Proposed Benzene limit 2.3-in-10,000,000
Health risks associated with proposed emission
limits are “virtually non-existent”

BUILD WITH US.™
61
$500,000 Spent in Community Health Status Studies
• LP was required to conduct a baseline Community Health Status Study in 1995
– Health was broadly defined to include physical, psychological, social, economic, and environmental well-being.
– Unprecedented at the time.
• Follow-up Community Health Status Study was conducted in 2001
– Undertaken to determine whether or not the OSB plant has had an effect on health, for better or worse, as measured against the baseline data.
– Concluded that there has been an increasing and general
consensus that the plant is “a good thing.”
• In 2006, MB Conservation determined that no further health studies were warranted.

BUILD WITH US.™
6262
Section Summary; No RTOs
• Health Risk Assessment demonstrates that:
– cancer risks are virtually non-existent
– non-cancer risks characterized as no adverse effect
• Health Risk Assessment demonstrates that the proposed emission limits will ensure protection of community health and the environment

BU
ILD
WIT
H U
S.™
Proof On the Ground:
Monitoring Ambient Air Quality

BUILD WITH US.™
6464
Ambient Air Quality Monitoring
• LP operates a comprehensive ambient air monitoring program to collect meteorological and air quality data in the vicinity of the plant.
• The ambient air quality monitoring network includes two sites
– Site 1 is located approximately 1.5 km north-northeast of the OSB plant.
– Site 2 is located approximately 2.0 km west of the OSB plant.

BUILD WITH US.™
6565

BUILD WITH US.™
6666
Measuring Air Quality since 1995
• Particulate Matter (PM10) sampled continuously
• 6-day sample frequency for VOC, Formaldehyde, and Benzene
– according to National Air Pollution Surveillance (NAPS) schedule
– network of monitoring stations across the country that all sample on the same schedule
• Phenol, MDI and hydrogen cyanide monitoring quarterly
• Results compiled and submitted to MB Conservation

BUILD WITH US.™
6767
Measured Average Monthly 24-hr Ambient PM10 Concentrations

BUILD WITH US.™
6868
Measured 1-hr Ambient Formaldehyde Concentrations

BUILD WITH US.™
6969
Measured 24-hr Ambient Benzene Concentrations

BUILD WITH US.™
7070
Measured 24-hr Ambient MDI Concentrations

BUILD WITH US.™
7171
Measured 24-hr Ambient Phenol Concentrations

BUILD WITH US.™
7272
Measured 24-hr Ambient Hydrogen Cyanide Concentrations

BUILD WITH US.™
7373
Section Summary
• Actual measured ambient air quality information demonstrates all ambient air quality criteria are met
• In our application, LP commits to continue the ambient monitoring program, ensuring ongoingprotection of community health and the environment

BU
ILD
WIT
H U
S.™
What We’ve Demonstrated So Far
• Dispersion modeling demonstrates all AAQC are met 100% of the time,
• Health risk assessment concludes health risks are “virtually non-existent” or “no adverse effect”
• Continued comprehensive ambient air quality monitoring demonstrates all AAQC are met
• Demonstrates that the proposed emission limits (without RTOs) do not pose a risk to community health and environment.

BU
ILD
WIT
H U
S.™
Environmental Benefits of Shutting
Down the RTOs

BU
ILD
WIT
H U
S.™
Greenhouse Gas
Emissions Reduced
by 75%

BUILD WITH US.™
7777
RTOs Create Greenhouses Gases
• The RTOs generate 12,000 tonnes of GHG per year
– 0.9% of all combustion sources in the manufacturing sector in Manitoba
(Ref. Climate Change Connection)
– Equivalent of taking 2200 vehicles off the road
• Extremely important to the people of Manitoba in meeting our international GHG reduction commitments

BUILD WITH US.™
7878
RTO Elimination Aligns with International
Trends
• Consistent with major environmental groups’ goals to reduce GHG emissions and the reliance on fossil fuels
– Sierra Club, World Wildlife Fund, Green Party of Canada, EcoNetwork
• Manitoba Environment Act will require consideration of greenhouse gas emissions for any major development
• US EPA regulations are evolving to consider Life Cycle impacts including greenhouse gas emissions (SENES 2009)

BUILD WITH US.™
7979
RTOs Emit Nitrogen Oxides
• Contributor to smog and ground level ozone
– Near ground level, ozone is formed when chemicals, including Nitrogen Oxides, react chemically in the presence of sunlight.
– Ground-level ozone can have detrimental effects on plants and ecosystems by making them more susceptible to disease, insects and harsh weather.
• NOx will be reduced by shutting off RTOs
BUILD WITH US.™
80
Assessment of Risk to Flora and Fauna
• Assess the risk of possible harmful affects to plants and animals from exposures to OSB plant emissions
• 1995 (baseline), 1997, 2000, 2005
• Concluded:
– Emission of ozone precursors from the LPC mill at the OSB plant do not currently appear to promote the formation of ozone in the ambient environment at a level considered harmful to local plants
– No evidence of ozone-related damage on samples of two common local plant species known to be sensitive to ozone (i.e. trembling aspen and alfalfa)
• Committed to Flora and Fauna study in 2010

BUILD WITH US.™
8181
Section Summary
• 75% reduction in GHG emissions
• Reduction in nitrogen oxide emissions
• Consistent with Manitoban and Canadian commitments

BU
ILD
WIT
H U
S.™
Ensuring LP Swan Valley is
Sustainable
BUILD WITH US.™
83
Continuously Improving the Process
• Continuously improving resource usage (yield)
– Invested $26 million dollars in 2004 on the latest energy system and drying technology
– 10% improvement in yield
– Lower temperature, single pass drying generates fewer emissions
– Project received Honorable Mention in the 2005 in CCME Pollution Prevention Awards

BUILD WITH US.™
8484
Optimizing Resource Usage

BUILD WITH US.™
8585
Reduction in Total Facility Emissions
0
1000
2000
3000
4000
5000
6000
7000
8000
2002 2003 2004 2005 2006 2007 2008
To
nn
es
Total Facility
Incinerator

BUILD WITH US.™
86
Reducing Emissions at the Source
• Resins
– We use the lowest formaldehyde resins available (PF and MDI), minimizing resin-related formaldehyde emissions from the press
– Use of MDI also allows higher moistures and lower drying temperature to further minimize wood-related emissions from the dryers

BUILD WITH US.™
8787
Section Summary
• LP Swan Valley continues to optimize the process to reduce emissions at the source

BU
ILD
WIT
H U
S.™
Socio-Economic Review

BUILD WITH US.™
89
LP Swan Valley’s Economic Contribution
• 550 direct jobs
• Over $35 million contributed annually to the local economy
– $12 million LP employee payroll
– $21 million in logging contracts in 2007
– $11.5 million maintenance costs
• $26 million dollars invested on latest drying and energy technology in 2004

BUILD WITH US.™
90
– Significant competitive disadvantage to LP Swan Valley
• $3.2 million annual operating and maintenance expenses
• $10 million capital replacement within the next few years
• Only forest products mill in Canada with RTOs
– We will be monetarily penalized for running RTOs as carbon tax systems (such as in BC), carbon markets and/or GHG regulations are developed.
The Impact of Operating RTOs
BUILD WITH US.™
91
State of the Industry
• Canadian Forest Service data show that as of March 31, 2009 there were:
– 386 forest product mills indefinitely closed, permanently closed, or curtailed
– 44,050 layoffs
• Since 2006:
– North American OSB demand has dropped by 50%
– 12 of 25 Canadian OSB facilities are permanently or indefinitelyclosed (two of these are LP facilities)
– many others are on reduced capacity

BUILD WITH US.™
92
0
5,000
10,000
15,000
20,000
25,000
30,000
Vo
lum
e (
00
0's
)
OSB 25,374 26,153 26,420 23,933 18,505 13,700
2004 2005 2006 2007 2008 2009
North American OSB Demand
Source: APA April, 2009 Forecast

BUILD WITH US.™
93
12 OSB Plants in Canada Have Closed Since 2006

BUILD WITH US.™
94
The Market Situation is Significantly Impacting
our Workforce and the Local Economy
• 17 employees were laid off in 2008
• During curtailment months an additional 50 employees (approx)
are laid off
• Turnover rate has increased from 4% to 20%
• Maintaining trades-people has been a challenge
• Many production operators have left to seek other opportunities
• 15 logging contractors (25%) have ceased operations
• We are 1 of only 3 operating LP OSB mills left in Canada (down
from 5)

BUILD WITH US.™
95
The Mill has been Adjusting to the Downturn in an
Effort to Minimize Losses
• Production in 2008 reduced by 40% of normal volume
• Production in 2009 YTD reduced by 70% of normal volume
• Reduced logging rates by 5%.
• Reduced wood volume at break-up to 62,000 cords (about ½ of normal volumes)
• Aggressive cost savings initiatives (including Lean Manufacturing) have reduced operating costs in 2008 by over $7,000,000.

BU
ILD
WIT
H U
S.™
Approval of our Application
is Warranted

BUILD WITH US.™
97
The Proposed Amendments…
• Maintain protection of community health and the environment
• Provide numerous environmental benefits
– Reduce greenhouse and nitrogen oxide emissions
• Equalize the “playing field” with the Canadian OSB industry
• Contribute to the Sustainability of LP in the Valley

BU
ILD
WIT
H U
S.™
LP requests a recommendation
from the CEC to approve our
application