svasti m ramratan_bsc_thesis_finaal
TRANSCRIPT
Anton de Kom Universiteit van Suriname
Photovoltaic-Thermal (PVT) Solar System;
Technical Feasibility Study of PVT applications for
Courtyard Marriott Hotel Paramaribo
Student: Svasti M Ramratan
Enrollment Number: 09WB1024
Supervisor: ir. P. Deosarran
Reviewer: ir. J. Narain
Date: December 7, 2016
STUDIERICHTING
Wb WERKTUIGBOUWKUNDE

2
Svasti M Ramratan (09WB1024)
Photovoltaic-Thermal (PVT) Solar System; Technical Feasibility Study of PVT applications for Courtyard Marriott Hotel
Paramaribo
Paramaribo, December 7, 2016
Supervisor: ir. P. Deosarran
Reviewer: ir. J. Narain
Anton de Kom University of Suriname
Faculty of Technology
Mechanical Engineering Dicipline
Leysweg 86, P.O.B. 9212 Paramaribo, Suriname
Keywords: Photovoltaic-Thermal Systems, Types of Solar PVT-systems, Energy efficiency, Feasibility
Report Number: 02PD2016

3
Anton de Kom Universiteit van Suriname
Photovoltaic-Thermal (PVT) Solar System;
Technical Feasibility Study of PVT applications for
Courtyard Marriott Hotel Paramaribo
Report submitted for the conclusion of the
Mechanical Engineering course at the Anton
de Kom University of Suriname, as a partial
requirement for obtaining the title Bachelor
of Science in Mechanical Engineering.
Svasti M Ramratan
Supervisor: ir. P. Deosarran Reviewer: ir. J. Narain
Mechanical Engineering discipline Mechanical Engineering discipline
Anton de Kom University of Suriname Anton de Kom University of Suriname
December 7, 2016
STUDIERICHTING
Wb WERKTUIGBOUWKUNDE

4
Acknowledgement
The completion of this thesis report would not have been possible without the support of many
people. My gratitude goes to the owner of Marriott Hotel Paramaribo, Arun Hindori, and the
managing director, Egon Von Foidl, for granting permission to conduct the project and Marriott
Hotel. And to the maintenance manager of Marriott Hotel, Mariano Alidikromo, and
maintenance second in command, Mike Rachman, for providing all the needed data and assisting
with the needed measurements to conduct the research of this project. My gratitude also goes to
my supervisor, ir. P. Deosarran, for all his feedback, guidance, for always being supportive, and
for always delivering quick responses during the development of the thesis project. I would like
to thank the Manager of the Mechanical Engineering division, ir. J. Narain, for providing his
guidance to correctly formulate this thesis report. I would also like to thank the manager of Blik
Bruining and Partners N.V., Vernon Bruining, for also providing information for the thesis report.
Many people have also provided needed literature and technical advices to formulate this report
which is greatly valued. My gratitude for this goes to Harrol Seepaul, Corrado Sirianni, Robbin
Gajadin, Atish Bisseswar, and Clint Ally. I would also like to thank all my friends, fellow students,
and every other faculty member who have supported me.
The love of my family has been the pillar that supported me through the mechanical engineering
bachelor course. In my life so far, nothing has exceeded the feeling of coming home and seeing
them smile.
Svasti M Ramratan
December 7, 2016

5
List of Symbols
Standard Nomenclature
Symbol Description Unit
Absorber thickness m Absorptivity -
Angle of incidence rad
A Area m2 𝐹′ Collector efficiency (modified) -
𝑛 Declination angle rad
𝑚 Defined variable -
𝑥 Dryness factor - Dynamic viscosity pa s Efficiency %
𝐾 Extension coefficient m-1 𝐹 Fin efficiency -
𝑢 Flow velocity m/s ℎ Fluid to tube heat transfer
coefficient
W/m2K
𝐿 Glass cover thickness m 𝐶𝑝 Heat capacity J/kg K 𝐹𝑅 Heat removal factor (modified) -
Hour angle rad �� Mass flow m3/h 𝑆 Modified solar radiation W
𝑈𝐿 Overall loss coefficient
(modified)
W/m2K
𝑈𝐿 Overall loss coefficient W/m2K Reflectance -
𝑟 Reflection -
𝑛 Reflection index cover glass -
G Sun Irradiance W 𝑆 Solar radiation per unit area W
𝑇 Temperature C
Temperature coefficient - Thermal conductivity W/mK 𝑘 Thermal conductivity of
absorber
W/mK
Transmissivity -
() Transmissivity-absorptivity
product
-
𝐷 Tube diameter m 𝑊 Tube spacing m 𝑄𝐿 Useful thermal energy W/s
V

6
Superscripts and Subscripts
(Super/Sub) Script Description
1 incident
2 refracted
// parallel perpendicular
a ambient
b beam
d diffusion
el electrical
i inside
L loss
PV photovoltaic
r refrigerant
ref reference
t total
th thermal
WD width and depth
VI

7
List of Abbreviations and Acronyms
D Dimensional
PV Photovoltaic
PVT Photovoltaic-Thermal
RPVT Refrigerant-based Photovoltaic-Thermal
SDG Sustainable Development Goals
UN United Nations
VRF Variable Refrigerant Flow
WPVT Water-based Photovoltaic-Thermal
VII

8
Table of Contents
Acknowledgement ........................................................................................................................... IV
List of Symbols ................................................................................................................................... V
List of Abbreviations and Acronyms ............................................................................................ VII
1 Introduction ................................................................................................................................ 10
1.1 Background ............................................................................................................................... 10
1.2 Problem Statement and Objectives .......................................................................................... 11
1.3 Project work activities to fulfill the objective .......................................................................... 12
1.4 Outline ....................................................................................................................................... 12
2 Solar Technology in Suriname .................................................................................................... 13
2.1 Solar Energy .............................................................................................................................. 13
2.2 Renewable Energy in Suriname ............................................................................................... 14
2.3 Solar Projects in Suriname ........................................................................................................ 14
2.4 Solar Energy for Courtyard Marriott Hotel Paramaribo .................................................. 15
3 Overview of PVT-Systems........................................................................................................... 16
3.1 Basic Concept of PVT-Systems................................................................................................. 16
3.2 Water based and Refrigerant based PVT-systems.................................................................. 18
4 Performance Analysis of the PVT-System ................................................................................. 20
4.1 Florschuetz Model .................................................................................................................... 20
4.2 Energy Coverage ....................................................................................................................... 23
4.3 Used Data .................................................................................................................................. 23
4.3.1 Measurements .................................................................................................................... 24
4.3.2 PVT Panel Design ............................................................................................................... 24
4.3.3 Expected Model Performance ........................................................................................... 26
4.4 Methodology of the performance analysis ............................................................................. 28
VIII

9
5 Model Analysis ............................................................................................................................... 30
5.1 Mathematical Model ................................................................................................................. 30
5.2 Model Results ...................................................................................................................... 36
5.3 Model Validation ...................................................................................................................... 41
6 Analysis of PVT applications for Marriott Hotel ...................................................................... 43
6.1 Analyzed PVT applications ...................................................................................................... 43
6.2 Results of the WPVT-system .................................................................................................... 44
6.3 Results of the RPVT-system ..................................................................................................... 47
6.4 Energy Coverage of the PVT-system ....................................................................................... 50
6.5 Discussion of the PVT-systems ................................................................................................ 52
7 Conclusion and Recommendations ............................................................................................. 54
7.1 Conclusions ............................................................................................................................... 54
7.2 Recommendations .................................................................................................................... 55
Appendixes......................................................................................................................................... 56
A Complete set Equations ............................................................................................................ 56
B Marriott Hotel with Solar Panels.............................................................................................. 58
C WPVT and RPVT-system Comparison.................................................................................... 61
References........................................................................................................................................... 62
IX

10
1 Introduction
“I’d put my money on the sun and solar energy. What
a source of power! I hope we don’t have to wait until oil
and coal run out before we tackle that. I wish I had
more years left.
—Thomas Edison, 1931
(Inventor, Businessman)
1.1 Background
The electricity demand of the building sector is rising due to the effect of increased living
standards. This development also takes place in Suriname. Within the building sector,
commercial buildings such as hotels use an estimated 45% of the total energy usage for cooling
in tropical regions and an estimated 15% for water heating [1, 2]. Next to the increasing electricity
demand, electricity grid prices in Suriname currently also continue to rise. A solution to reduce
the energy costs from the electricity grid, is to utilize renewable energy for water heating and
cooling. In the hotel industry solar energy is presently the most used renewable energy. Solar
panels can be conveniently integrated within buildings [3]. It can be used by photovoltaic systems
to generate electricity or by thermal solar systems for thermal energy. Another method is
combining solar photovoltaic and thermal technology, which has shown to have many benefits.
These photovoltaic-thermal solar systems (PVT-systems) produce electricity and heat
simultaneously and deliver a higher overall efficiency. This combined system also delivers a
higher electricity performance due to the thermal collector that is able to actively cool down the
photovoltaic solar cells that operate better at lower temperatures [4]. In executed studies the PVT-
system has reached thermal and electrical efficiencies of approximately 70% and 14% [21].
Different types of PVT-applications can be used when integrating this system into a building.
Depending on what the building requirements are, the system can be designed as a PVT air -,
water- or refrigerant based system. Focus can also be lain on either increasing the electricity
production or the thermal production of the PVT-system [5]. A mathematical model was
developed by Florschuetz [17] to analyze the performance of PVT-systems. The performance of
this system can be assessed in terms of the electrical and thermal output and efficiency of the
system [22]. The information that is needed to analyze this system is the solar panel environment
condition, its location, and the panel design specifications. The main input data to analyze this
system are the electrical- and thermal load, the sun radiation and the ambient temperature.
Currently Energiebedrijven Suriname (EBS) is the only utility grid in Suriname generating
electricity, and for a certain amount by means of fossil fuel [6]. Corporate Marriott has also set
environment goals for their hotels stating: “Our sustainability strategy supports business growth
and reaches beyond the doors of our hotels to preserve and protect our planet’s natural
resources”. One of the environment goals of Corporate Marriott is to further reduce energy and

11
water consumption with 20% for their hotels by 2020 [9]. Since March, 2016 it is also stated in the
Constitution of Suriname that individuals producing electricity by means of on-grid renewable
energy can redeliver excess electricity to the utility grid at closeout prices [10].
1.2 Problem Statement and Objectives
Marriott Hotel in Paramaribo uses electricity from the utility grid of Suriname to provide for
water heating and air cooling for the comfort of its guests. Using energy from the utility grid is
related to the increased costs of cooling and heating appliances due to higher electricity prices.
Marriott Hotel aims to reduce its energy usage [9] and using renewables, such as the PVT system,
can contribute to that goal. Integrating a PVT system can reduce the energy cost from the grid by
partially generating the electricity and heat that is needed for cooling and water heating. PVT-
systems can reach higher efficiencies than the conventional photovoltaic system and can cover
the energy usage of both cooling and water heating appliances, but the application of this system
is not yet tested for the environment conditions in Suriname. For the research in this thesis project
different types of PVT-systems are reviewed that can be integrated in commercial buildings and
the technical feasibility of the PVT-systems, which are applicable for Marriott Hotel Paramaribo,
is assessed.
The objective of this report can be split in two sections which are:
1. Investigating and gathering information on PVT-systems. The focus is lain on the
performance of applicable building integrated PVT-systems. The considered PVT-systems
are:
Water based PVT-system (WPVT-system)
Refrigerant based PVT-system (RPVT-system)
2. Investigating the performance of PVT-systems for Marriott Hotel as a case study. The
performance is analyzed to determine a monthly average yield of the system. The
analyzed aspects for the case study are:
The electrical and thermal power output and efficiency of the PVT-systems
The amount of energy that can be covered by the PVT-systems

12
1.3 Project work activities to fulfill the objective
The executed steps to fulfill the stated objectives were the following:
Gathering information on different types of building integrated PVT-systems namely the
water-, and refrigerant based PVT-systems. The focus is lain on the performance, built,
and thermal energy usage of the PVT-systems.
Performing the needed measurements and gathering relevant data to analyze the
performance of PVT-systems applicable for Marriott Hotel. The measurements which are
conducted are the ambient temperature and the electrical usage of the cooling and water
heating system from Marriott Hotel. The data which is gathered includes the architect
model of Marriott Hotel and the electrical and thermal energy usage of its cooling and
water heating appliances.
Analyzing the Florschuetz model [17] in Microsoft Excel and determining its validity by
implementing research data from Gaurracino et al. [22] and Ji et al. [23].
Analyzing the performance of PVT-systems for Marriott Hotel through the Florschuetz
model [17] in Microsoft Excel at steady state conditions.
Comparing the energy performance of the WPVT and RPVT- system.
Investigating the amount of energy that can be covered by the WPVT and RPVT-system
for Marriott Hotel.
1.4 Outline
The document is structured as follows. In chapter 2 the status of solar energy usage in Suriname
is given. This is followed by chapter 3 which gives general information on different types of PVT-
systems. In this chapter the different types of PVT-systems are explained based on the built,
performance and the practical uses of the system. Chapter 4 gives the method of how the energy
performance and how the energy coverage are analyzed. The Florschuetz model [17] is explained
in this chapter and the used data for the analysis of the PVT-system is given. The elaboration of
the Florschuetz model [17], which is also written in Microsoft Excel, is given in chapter 5 where
the research data from Gaurracino et al. [22] and Ji et al. [23] is used to test the validity of the
model. Chapter 6 gives the analysis of a WPVT and RPVT-application for Marriott Hotel by using
the Florschuetz model [17] and the panel design requirements that comply for Marriott Hotel.
The report is concluded with chapter 7 stating the conclusions and recommendations which are
drawn from the conducted research.

13
2 Solar Technology in Suriname
“Don’t you know yet? It’s your light that lights up
the world.
—Rumi, 1273
(Poet, Jurist, Islamic scholar, Theologian)
Current developments of solar energy in Suriname are given in this chapter. The relevance of this
information is: By knowing where Suriname stands today on solar technology, research can be
done from that point towards innovation. This chapter gives an indication of the sun irradiance
in Suriname, constitution agreements, executed projects and indicates the benefits of solar
technology for a hotel.
2.1 Solar Energy
Suriname has favorable environmental conditions for the use of solar as an energy source
according to the Investment and Development Corporation Suriname (IDCS). Suriname receives
large amounts of sunlight, with an average of 7.2 hours of sunshine per day and an average daily
solar irradiation of 5 kWh per square meter [16]. Figure 2.1 gives averaged hourly sun radiation
data measured at Anton de Kom Universiteit van Suriname within a time period of 6.00 to 19.00
[41].
FIGURE 2.1 Average irradiance data over a time period between 6.00 and 19.00 [41].
18.40
137.10
326.50
450.94
569.06
678.35709.16688.19629.54596.33
362.15
182.98
35.93
0.00
100.00
200.00
300.00
400.00
500.00
600.00
700.00
800.00
IRR
AD
IAN
CE
(W/M
2)
HOURLY TIME PERIOD
Average Hourly Radiation

14
In figure 2.1 the pattern of the irradiance throughout the day follows a sine function. This is a
general irradiation pattern during Earth’s rotation followed by a location close to the equator
such a Suriname. The radiation from the sun has specific wavelength characteristics depending
on the temperature within the atmosphere (at different geographic locations) and outside the
earth’s atmosphere [42]. Part of the solar radiation that enters the Earth’s atmosphere is absorbed
by it or the radiation is scattered by atmospheric constituents, which is called diffuse radiation.
Another part of the radiation arrives directly at the Earth’s surface, which is called beam or direct
radiation. Both are needed to determine the amount of solar radiation absorbed by a solar panel
[51].
2.2 Renewable Energy in Suriname
Recently renewable energy has gained more acknowledgement by the Suriname government
creating more opportunities and providing additional benefits for using renewables. Within the
Budgetary of Natural Resources of Suriname it is included that the ministry sets it as a priority to
stimulate the use of renewable energy in 2016 [11]. It is also stated in the Constitution of Suriname
that incoming March, 2016 individuals using renewables will be able to redeliver excess electricity
to the electricity grid at closeout prices if the yearly kWh production of the generated renewable
electricity exceeds the yearly kWh required amount of electricity [10]. Suriname also takes part of
the Sustainable Development Goals (SDG) of the United Nations (UN) that supports renewable
energy projects [8], hereby also motivating further research of renewable energy applications.
2.3 Solar Projects in Suriname
In Suriname many photovoltaic (PV) solar projects and thermal solar projects have been executed
and are still being carried out. The largest PV solar project in Suriname is a 5 MW solar plant of
IAMGOLD at its Rosebel open pit mine with 16000 solar panels and an estimated cost of $14
million [12]. This solar plant provides electricity that the mines use. Staatsolie Maatschappij
Suriname N.V. launched a 30 kW solar energy pilot project that is operational since 2015 to obtain
more information on solar technology for future large scale applications [13]. In 2014 EBS
Energiebedrijven Suriname received finances through the government of Suriname from the
Inter-American Development Bank (IDB) as part of a payment for a solar project of 500 kW at the
village of Atjoni [14].
A few companies/initiatives in Suriname that provide services for and products of solar
technology are Kapasi Solar N.V., Multi Solar, Marsol N.V., Guguplex Technologies. The types of
solar technologies that are offered range from PV panels (imported and made from PV cells) for
electricity generation and thermal solar panels for hot water usage.

15
2.4 Solar Energy for Courtyard Marriott Hotel Paramaribo
Courtyard by Marriott Paramaribo hotel opened in June 2009 and is located on the Suriname
River. The hotel has 140 hotel rooms which are air conditioned by means of Toshiba Carrier
Variable Refrigerant Flow (VRF) cooling systems. There are 29 active VRF units which use an
estimated 44% of the total electricity usage of the hotel (see table 2.1). The consumption water
heater of Marriott Hotel is a gas fired water heater of the manufacturer Lochinvar which uses an
approximately 12% of the total energy usage. The occupancy rate varies from 70% to 100% which
effects the energy usage of the hotel [15].
Average kWh/day Average kWh/Month
VRF (29 Units) 1247 37398
Water Heater 17.6 528
Electricity usage
of Marriott Hotel
- 85481
TABLE 2.1 The average measured daily VRF energy usage and estimated monthly usage with the entire
electricity load of Marriott Hotel.
Solar energy can be utilized for both the cooling and heating requirements by means of
photovoltaic and thermal solar panels. Applying solar energy for heating and cooling in a
commercial building, such as a hotel, has a high return on investment cost because of the high
electricity usage of heating and cooling. Hotels being one of the main attractions for tourists
makes a green initiative in a hotel also good for the tourism in a country. Brebbia et al. [29]
presented a study with economic benefits that can be gained in hotels through implementing
environmental initiatives. Along with the economic benefits there are also other factors that are
influenced in a positive manner with an environment strategy, which are:
Gaining competitive advantage by being a leader in the sector
Customer loyalty
Employee retention
Awards and recognition
Regulatory compliance
Risk management
Increased brand value
16
3 Overview of PVT-Systems
“It always seems impossible until it’s done.
—Nelson Mandela, 2013
(Activist, Politician, Philanthropist, Lawyer)
In this chapter information is given on PVT-systems and general information on the thermal effect
of photovoltaics. An overview is given on how a PVT-system is built, previous done studies on
the system and how these systems can be categorized.
3.1 Basic Concept of PVT-Systems
PVT-systems are combined photovoltaic and thermal collectors that produce both electricity and
thermal energy. Theoretical and experimental research has been documented on PVT-systems
since mid-1970s. By combining the photovoltaic and thermal collectors the system generates more
energy than the individual systems of the same size. The thermal collector also lowers the
operating temperature of the system which results in a higher electricity production [5]. Installed
PV panels reach temperatures as high as 50 to 60C. The electrical efficiency of individual PV
modules vary from 10.2 to 11.5% at high temperatures. Only 6 to 20% of the sun irradiance that
is absorbed by a PV module is converted into electricity and the remaining solar energy is
converted into heat, which increases the PV module temperature and reduces the efficiency [19].
The efficiency of a PV module is reduced by an average of 0.45% for each degree over 25C [20].
PV cells are made from semiconductor materials such as, polycrystalline silicon (p-Si),
monocrystalline silicon (c-Si), and amorphous silicon (a-Si) [31]. The upper and lower layer of the
cell are doped with different dopants which can modulate the electrical properties. This occurs
when the solar cells are exposed to sunlight and the electrons excite from the valence band, which
is the highest range of electron energies, to the conduction band, which is the lowest range of
vacant electron states, creating charged particles. High temperatures (above 25C) reduce the
band gap of the cell which effects the electrical parameters and hereby reduces the electrical
efficiency of the cell. [45]
Florschuetz [17] presented an equation set to determine the performance analysis of the PVT-
system by modifying the Hottel-Whillier model [25] that is used to analyze flat plate collectors.
This method can be used on different types of PVT-systems to determine the energy performance.
17
PVT-systems can generally be categorized by the medium of the thermal collector. Different types
of mediums that can be used for PVT-systems are air, water and refrigerant. Studies have been
conducted on these types of PVT-systems (Guarracino et al., 2016; Ji et al., 2009) and the
efficiencies of these systems have also been compared with each other [18]. The research of Zhang
et al. [18] indicated that air-based PVT-systems have a lower thermal removal effectiveness than
fluid-based PVT-systems. And between water-and refrigerant-based PVT-system, refrigerant-
based systems showed a higher performance. Air-based and water-based PVT-systems have
already made it on the market, while refrigerant-based systems are still in the experimental stage.
The air-based system has lower thermal performance characteristics compared to a water based
system due to lower heat capacity and thermal conductivity of air compared to water. The low
density of air causes the heat transfer volume to be at a larger size compared with the water based
system if it were to be used for water heating. This makes the system more suitable for air heating
requirements [49]. Refrigerant based PVT-systems have shown potential for building integration
but there are still technical and economic barriers that prohibit a wide application [18]. Other
PVT-systems that have also been researched on are heat pipe, dual fluid- and concentrator PVT-
systems [33]. The research of C. Good et al. [34] presented an estimated approach to determine
the range of how qualified a type of PVT-system is for building integration. The extent of the
research done in this project does not cover the other possible PVT-systems (such as concentrating
PVT Etc.), but focusses mainly on systems that have been considered promising for building
integration based on the research done by C. Good et al. [34]. A market survey of Task 35, 2008
[26] showed a list of manufacturers with PVT commercial products such as PowerTherm and
PowerVolt. The market of PVT-systems is still small, according to a technical report by J.
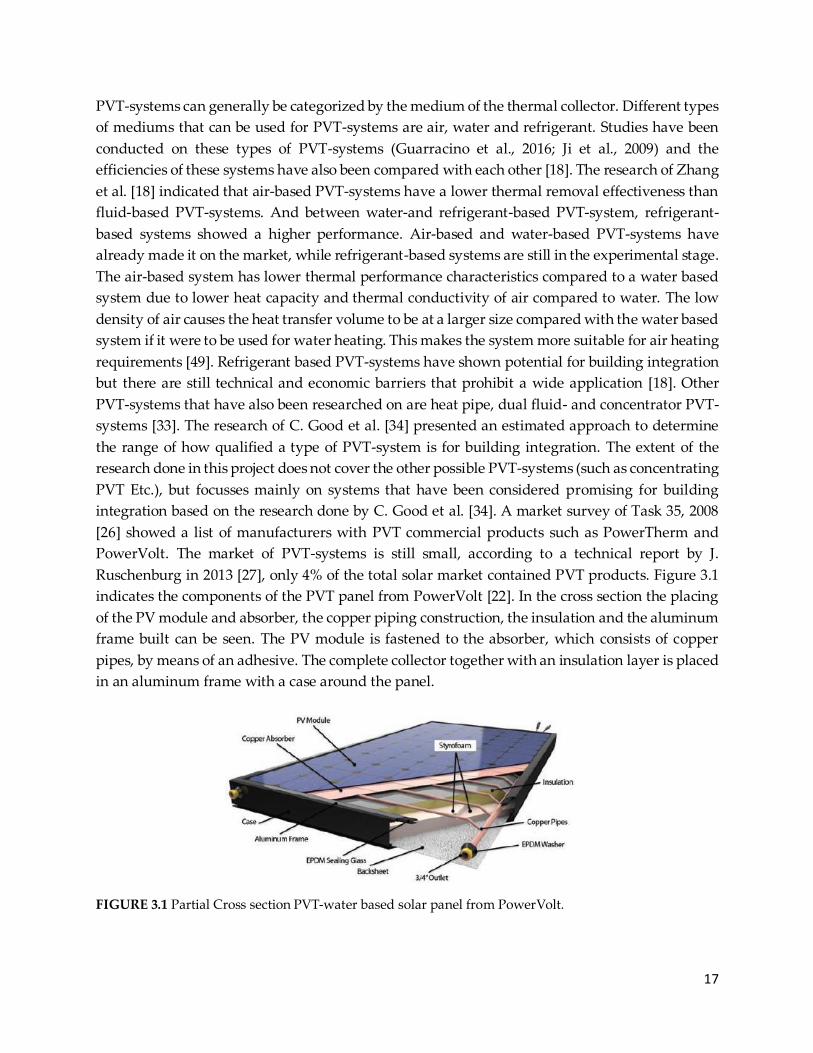
Ruschenburg in 2013 [27], only 4% of the total solar market contained PVT products. Figure 3.1
indicates the components of the PVT panel from PowerVolt [22]. In the cross section the placing
of the PV module and absorber, the copper piping construction, the insulation and the aluminum
frame built can be seen. The PV module is fastened to the absorber, which consists of copper
pipes, by means of an adhesive. The complete collector together with an insulation layer is placed
in an aluminum frame with a case around the panel.
FIGURE 3.1 Partial Cross section PVT-water based solar panel from PowerVolt.

18
3.2 Water based and Refrigerant based PVT-systems
Water-based PVT-system (WPVT-System)
The build of the WPVT-system is similar to conventional flat plate collectors. The absorber is
constructed with PV cells that can be connected in series, with the tubing of the medium placed
underneath. The fluid is forced through the tubes and cools the PV panels which leads to a higher
efficiency. The water extracts the heat and can directly be used as domestic water (open loop), or
the heat can be extracted for heating services and the water can return to the panel providing
cooling once again (closed loop). Guarracino et al. [22] presented a dynamic model of a WPVT-
system with a sheet and tube thermal collector for domestic water heating and electricity
generation. In the research of Guarracino et al. [22] it is given that the efficiency of the WPVT-
system dropped with 4% from the given nominal efficiency of 12.6% without water flow, and
with water cooling the efficiency stayed above the nominal efficiency. A schematic of the
experimental setup from research done by Haurant et al. [30] is given in figure 3.5. The
components in the figure are the PVT panels (1), the pump (2), the water tank (3), an axillary
heater (4), and micro inverters (5). Water flows to the PVT-panel from a pump that causes the
forced circulation of the water through the system. From the PVT-panel the water goes to the tank
and then through a valve before going back to the pump. In the water tank the heat is used to
warm up the domestic water which flows through the tank to be consumed. Before going to the
consumer it also goes through an axillary heater to reach the required temperature of 60C.
FIGURE 3.5 Schematic setup of a (closed loop) water-based PVT-system [30]
Refrigerant-based PVT-system (RPVT-system)
The RPVT-system is built by placing direct expansion evaporator coils under PV modules. This
allows the refrigerant to be evaporated when it passes through the PV modules in the tubes. The
coils under the PV module act as the evaporator, which allows the refrigerant to reach low

19
temperatures (0-20C). The refrigerant can flow through a heat pump system and be used for
domestic water heating [18]. Tsai [24] presents a study of a RPVT-system assisting a heat pump
water heater with electricity and thermal energy under real weather conditions. The behavior of
the system is theoretically and experimentally analyzed in this study. The results of this research
showed that the performance of the system was only for a small amount effected by weather
change. Figure 3.7 shows the schematic structure of the system used by Tsai [24]. The refrigerant
flows from the expansion valve through the PVT panel and evaporates going from liquid to vapor
phase due to the thermal energy transfer from the panel to the refrigerant pipes. The vaporized
refrigerant is then compressed in the compressor and brought to higher temperatures qualified
to heat the consumption water. The flow continues through the condenser in the tank and the
heat is extracted by the water in the tank. The refrigerant is cooled down and goes through a
valve and back to the PVT panel.
FIGURE 3.7 Schematic structure of a RPVT-panel [24].

20
D x 𝑊 − 𝐷
2
4 Performance Analysis of the PVT-System
“Sometimes the questions are complicated, but the
answers are simple.
—Theodor Seuss Geisel, 1991
(Writer, Cartoonist, Animator, Artist)
In this chapter a method is given to determine the performance for PVT-systems namely the
Florschuetz model [17]. Section 4.1 states the approach of the model followed by section 4.2 which
gives how the energy coverage is determined. The used data for the Florschuetz [17] model
analysis and of the PVT-application for Marriott Hotel is also given. The executed methodology
is stated in section 4.4.
4.1 Florschuetz Model
For a performance analysis of the PVT-system the electrical output, thermal output and total
efficiency are determined based on the modified equations of Florschuetz [17] on the Hottel-
Whillier model given in Duffie and Beckman [25]. This model is chosen because the sheet and
tube configuration that is used in the Florschuetz model [17] also applies for the PVT application
requirements in this project (See figure 4.1). This is one of the panel configurations which can be
integrated into a building. A steady state approach, which was given in Florschuetz [17], is
applied for this model to deliver a daily average yield of the PVT-system. This application is only
applicable for the specific given location and its steady state conditions over a certain time period.
Since this project aims for the daily average yield of one case study and only uses one type of PVT
collector configuration for all applications, a steady state approach is assumed to be acceptable
[35].
FIGURE 4.1 Cross section of the sheet and tube collector configuration [17]
W
Glass Cover
Collector Plate
dx
PV +
Thermal
cells
Tube

21
The section dx of figure 4.1 is given in figure 4.2 with the configuration of the PV and thermal
cells to indicate the local steady state energy balance of the panel.
FIGURE 4.2 Local energy balance of the absorber of the PVT collector [17]
Following figure 4.2 the local energy balance is given as
𝑑2𝑇
𝑑𝑥2=
1
𝑘 [𝑈𝐿(𝑇𝑃𝑉 − 𝑇𝑎) − 𝑆 + 𝑞𝐸] (4.1)
In this equations k is the thermal conductivity, is the thickness of the collector, UL is the thermal
loss coefficient, TPV and Ta are the PV- and ambient temperatures, and S is the absorbed irradiance.
It is assumed that the underside of the plates and tubes is well insulated. It is also assumed that
the temperature gradients that are transverse to the fluid flow direction are independent from the
temperature gradients parallel to the fluid flow. Temperature gradients across the thickness are
neglected in this analysis. It is also assumed that the thermal resistance across the adhesive is
negligible. This indicates that no energy transfer occurs across the surfaces that are normal to the
flow direction [17]. When the equations are applied the following boundary conditions are stated,
𝑑2𝑇
𝑑𝑥2|
𝑥=0
= 0 and 𝑑2𝑇
𝑑𝑥2|
𝑥=𝑊−𝐷
2
= 𝑇𝑃𝑉 (4.2)
The electrical efficiency 𝑒𝑙 is assumed to decrease linearly with the photovoltaic panel
temperature [17] and is determined by
𝑒𝑙
= 𝑟𝑒𝑓
(1 − 𝑟𝑒𝑓
(𝑇𝑃𝑉 − 𝑇𝑟𝑒𝑓 )) (4.3)
In this equation 𝑟𝑒𝑓 is the reference efficiency at the reference temperature 𝑇𝑟𝑒𝑓 of the panel. And
𝑟𝑒𝑓 is the reference temperature coefficient.
By defining the electrical efficiency as a ratio of the local electrical output and the incident energy,
the local electrical output can be stated as
𝑞𝐸 = 𝑒𝑙
𝑆
(4.4)
dx
PV Module
Adhesive
Absorber
qEdx
UL(TPV -Ta)
Sdx
−𝑘𝑑𝑇
𝑑𝑥|
𝑥
−𝑘
𝑑𝑇
𝑑𝑥|
𝑥+𝑑𝑥

22
In equation 4.4 stands for the absorptivity of the collector. By combining the equations 4.1 till
4.4 and rearranging the parameters the modified overall loss coefficient is obtained, which is
𝑈𝐿 = 𝑈𝐿 −
𝑆
𝑟𝑒𝑓
𝑟𝑒𝑓= 𝑈𝐿 −
𝑟𝑒𝑓
𝑟𝑒𝑓𝐺 (4.5)
With G as the incident irradiation. And rearranging again the modified equation to determine the
absorbed solar radiation per unit area is given as
𝑆 = 𝑆 (1 −
𝑒𝑙
) (4.6)
The thermal efficiency of the PVT-system can be determined with
𝑡ℎ
= 𝐹𝑅 ((1 −
𝑒𝑙) − 𝑈𝐿
(𝑇𝑖−𝑇𝑎
𝐺)) (4.7)
In equation 4.7 𝐹𝑅 stands for the modified heat removal factor, which is obtained by the
conventional matter of the Hottel-Whillier model but instead of 𝑈𝐿 the modified parameter 𝑈𝐿 is
used. The transmissivity-absorptivity product used is given by , and 𝑇𝑖 stands for the inlet
cooling medium temperature of the PVT-panel.
The useful thermal energy can be determined by
𝑄𝑢 = 𝐴𝑃𝑉𝐹𝑅
(𝑆 − 𝑈𝐿 (𝑇𝑖 − 𝑇𝑎) (4.8)
And the electrical output of the PVT panel is
𝑄𝑒 =𝐴𝑃𝑉 𝑆
𝑒𝑙
[1 −
𝑟𝑒𝑓
𝑟𝑒𝑓
𝑒𝑙
(𝐹𝑅 (𝑇𝑖 − 𝑇𝑎) +
𝑆
𝑈𝐿
(1 − 𝐹𝑅 ))] (4.9)
The overall steady state energy balance can be given as
𝑄𝑆 = 𝑄𝑢 + 𝑄𝐿 + 𝑄𝑂𝐿 + 𝑄𝑒 (4.10)
In equation 4.10 QL stands for the overall thermal losses and QOL stands for the optical losses. The
overall efficiency of the PVT-panel is simply determined by the sum of the thermal efficiency and
the electrical efficiency given in equation 4.11.
𝑡
= 𝑒𝑙
+ 𝑡ℎ
(4.11)
Besides the modified equations by Florschuetz [17] of the Hottel-Whillier model, determining the
performance of the PVT-system follows the same mathematical steps and assumptions as the
conventional Hottel-Whillier method given in Duffie and Beckman [25]. The complete
mathematical procedure that is followed for this project is given in Chapter 5.

23
4.2 Energy Coverage
To make an assessment on the amount of energy that can be covered by the PVT-system the
method of Herrande et al. [28] is used.
The percentage of the electrical energy demand that is covered by the PVT-system can be
determined by equation 4.12.
𝐷𝐶𝐸(%) =𝐸𝑃𝑉𝑇 − 𝐸𝑙𝑜𝑠𝑠
𝐸𝑇
. 100 (4.12)
Here 𝐸𝑃𝑉𝑇 stands for the gross electrical energy produced by the PVT panel and 𝐸𝑙𝑜𝑠𝑠 stands for
the electrical energy consumed by the pump or compressor that circulates the medium. 𝐸𝑇 stands
for the annual electrical consumption. The research done in this project is done for the VRF
electricity demand by substituting the VRF demand for ET. The total demand of the hotel is also
determined using equation 4.12 by substituting the total electricity demand of the hotel for ET.
The percentage of the thermal energy demand covered is determined by
𝐷𝐶𝐻𝑊(%) =𝑄𝑃𝑉𝑇
𝑄𝑇
. 100 (4.13)
In this equation 𝑄𝑃𝑉𝑇 stands for the net thermal energy output of the PVT system and 𝑄𝑇 stands
for the total hot water demand.
The average percentage of energy demand covered is determined by
𝐷𝐶𝑎𝑣(%) =𝐷𝐶𝐸 + 𝐷𝐶𝐻𝑊
2 (4.14)
And the weighted average percentage over the time period of the annual electrical demand is
determined by
𝐷𝐶𝑤𝑎𝑣(%) =𝐸𝑇 𝐷𝐶𝐸 + 𝑄𝑇𝐷𝐶𝐻𝑊
𝐸𝑇 + 𝑄𝑇
(4.15)
4.3 Used Data
The data that was gathered for this project are: Measurements that were conducted at Marriott
Hotel for a case study of the PVT applications with environment conditions of Suriname;
Averaged hourly sun radiation data measured at Anton de Kom Universiteit van Suriname [41];
and panel design specifications of Gaurracino et al. [22] and Ji et al. [23]. The latitude of Anton de
Kom Universiteit is 5.8129° N and the latitude of Marriott Hotel is 5.8326° N. Based on a 1%
difference between the latitudes, the assumption is made that the difference of the irradiance from
Anton de Kom Universiteit and Marriott Hotel is negligible. For Marriott Hotel, WPVT and
RPVT-panel design specifications are used that comply with the hotel’s needs.

24
4.3.1 Measurements
The measured parameters were the ambient temperature, the VRF electrical usage, and the gas
fired water heater electrical usage. The measurements were conducted in March and April 2016.
VRF electricity measurements
The electrical usage of each individual VRF unit was measured to determine the average daily
usage of the systems. Then the overall usage off the 29 VRF units was determined. The electricity
measurements were conducted with an OM-DVCV Omega data logger from the maintenance
department of Marriott Hotel. The current and voltage accuracy of the instrument is 1.0 A and
0.4 V. To test how long the VRF units operated till reaching the desired room temperature
(which is set at 21C), the temperature of the hotel rooms were also measured. The average
operating duration of a VRF unit was one hour before reaching the desired room temperature.
Temperature measurements
The ambient temperatures and hotel room temperatures were measured with a Temperature and
Humidity USB Data Logger from the maintenance department of Marriott Hotel. The
temperature accuracy of the instrument is 2 C. The ambient temperature was measured from
the roof level of Marriott Hotel.
4.3.2 PVT Panel Design
For the analysis and validation of the Florschuetz model [17] written in Microsoft Excel the
research data of Gaurracino et al. [22] and Ji et al. [23] was used. These research papers
determined the performance of a PVT-system and had the availability of sufficient data to
conduct a performance analysis with the Florscheutz model [17]. The PVT-systems of Gaurracino
et al., [22] and Ji et al. [23] also had the ability for building integration which is needed to obtain
the objective of this project.
In table 4.1 and 4.2 the specifications of PVT panel obtained from Gaurracino et al. [22] and Ji et
al. [23] are given. In table 4.3 the specifications of the PVT applications suitable for Marriott Hotel
are given. Gaurracino et al. [22] used the design specifications from PowerTherm of the
manufacturer Solimpeks for a WPVT-system. And Ji et al. [23] used an experimental setup to
conduct the research for a RPVT-system.
The design specifications for Marriott Hotel are determined by using the parameters applicable
for water as a medium (such as mass flow and pipe diameter) from Gaurracino et al. [22] and the
design parameters applicable for refrigerant as a medium from Ji et al. [23]. The design of the
WPVT and RPVT-system are then equally sized to conduct a comparison study.

25
Specifications WPVT-system
Parameter Value
Nominal Power (W) 180
Total Surface Area (m2) 1.427
Total Aperture Area (m2) 1.42
Panel Dimensions (mm) 870x1640x150
Cell (mm) 125x125
Voltage at Maximum Power Point (MPP) (V) 4.98
Current at MPP (A) 36.16
Open circuit voltage (V) 5.4
Short circuit current (A) 44.46
Maximum operating pressure (bar) 4.15
Flow rate (m3/h) 0.0065
Reference PV module efficiency (%) 17.8
Reference temperature coefficient 0.00375
Reference temperature (C) 25
Type of solar cell Monocrystalline (c-Si)
Internal Piping Copper
Fluid medium Water
TABLE 4.1 Specifications WPVT-system from the research conducted by Gaurracino et al. [22]
Specifications RPVT-system
Parameter Value
Nominal Power (W) 300
Total Surface Area (m2) 5.49
Total Aperture Area (m2) 4.59
Voltage at Maximum Power Point (MPP) (V) 0.53
Current at MPP (A) 4.58
Open circuit voltage (V) 0.63
Short circuit current (A) 5.12
Maximum operating pressure (bar) 7
Flow rate (m2/h)) 0.0019
Reference PV module efficiency (%) 12
Reference temperature coefficient 0.0045
Reference temperature (C) 25
Type of solar cell Monocrystalline (c-Si)
Internal Piping Copper
Fluid medium R-22
TABLE 4.2 Specifications RPVT-system from the research conducted by Ji et al. [23]
26
Specifications of the WPVT and RPVT-system for Marriott Hotel
Parameter WPVT-System RPVT-System
Nominal Power (W) 200 200
Total Surface Area (m2) 1.37 1.37
Total Aperture Area (m2) 1.36 1.36
Voltage at Maximum Power Point (MPP) (V) 36.8 36.8
Current at MPP (A) 5.43 5.43
Open circuit voltage (V) 46.8 46.8
Short circuit current (A) 5.67 5.67
Operating pressure (bar) 10 4
Flow rate (m3/h) 0.0065 0.0019
Tube outside diameter (m) 0.01 0.007
Tube inside diameter (m) 0.008 0.006
Tube spacing (m) 0.095 0.130
Fluid to tube heat transfer coefficient (W/m2K) 500 76
Reference PV module efficiency (%) 12 12
Reference temperature coefficient 0.0045 0.0045
Reference temperature (C) 25 25
Fluid to tube heat transfer coefficient (W/m2K) 500 76
Type of solar cell Monocrystalline
c-Si
Monocrystalline
c-Si
Internal Piping Copper Copper
Panel Design Sheet and tube Sheet and tube
Fluid medium Water R-22
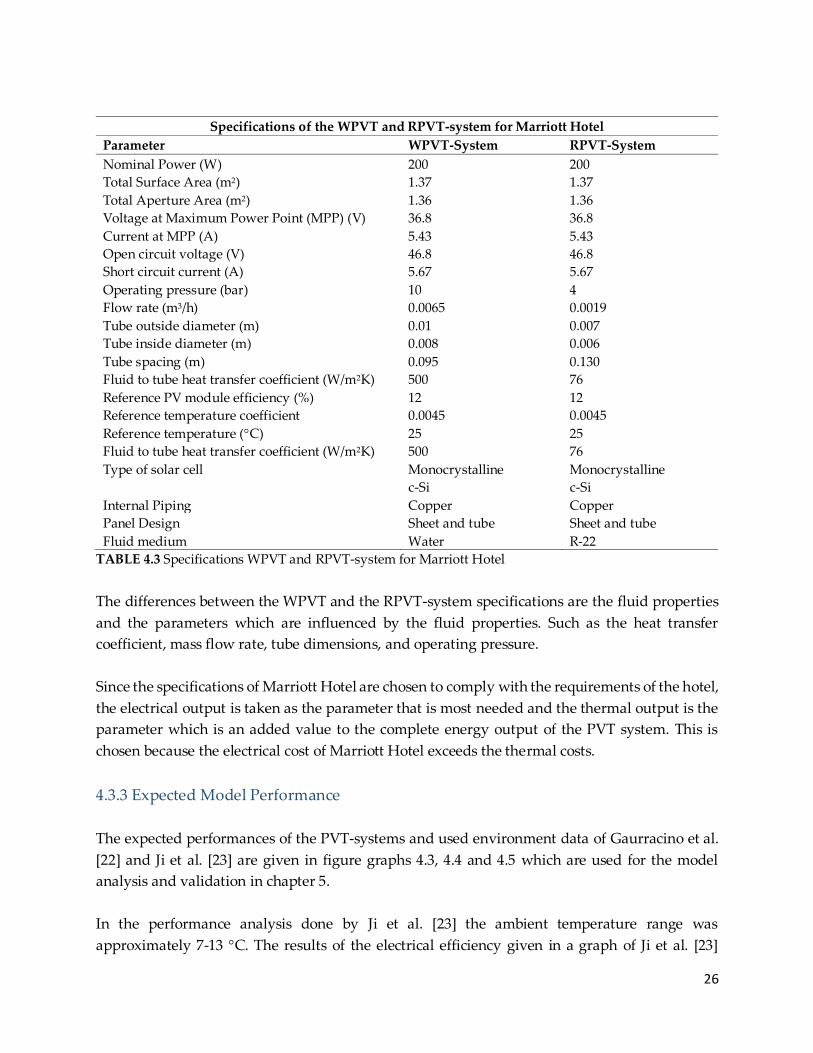
TABLE 4.3 Specifications WPVT and RPVT-system for Marriott Hotel
The differences between the WPVT and the RPVT-system specifications are the fluid properties
and the parameters which are influenced by the fluid properties. Such as the heat transfer
coefficient, mass flow rate, tube dimensions, and operating pressure.
Since the specifications of Marriott Hotel are chosen to comply with the requirements of the hotel,
the electrical output is taken as the parameter that is most needed and the thermal output is the
parameter which is an added value to the complete energy output of the PVT system. This is
chosen because the electrical cost of Marriott Hotel exceeds the thermal costs.
4.3.3 Expected Model Performance
The expected performances of the PVT-systems and used environment data of Gaurracino et al.
[22] and Ji et al. [23] are given in figure graphs 4.3, 4.4 and 4.5 which are used for the model
analysis and validation in chapter 5.
In the performance analysis done by Ji et al. [23] the ambient temperature range was
approximately 7-13 C. The results of the electrical efficiency given in a graph of Ji et al. [23]
27
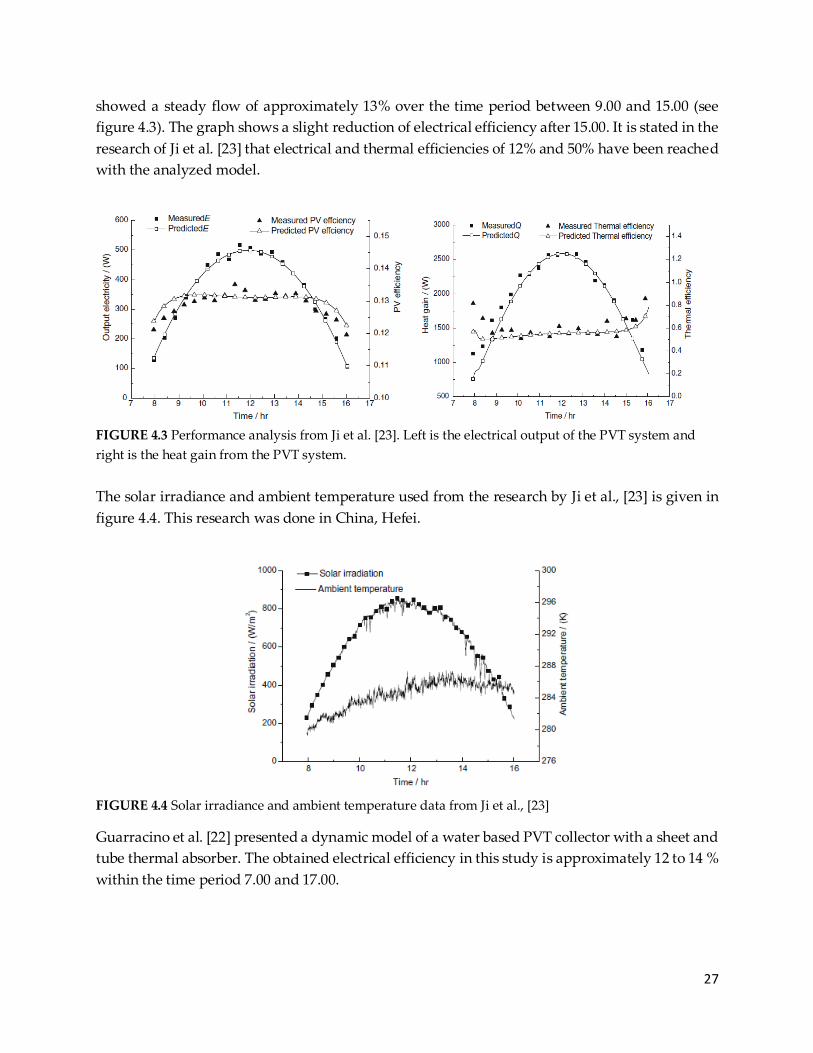
showed a steady flow of approximately 13% over the time period between 9.00 and 15.00 (see
figure 4.3). The graph shows a slight reduction of electrical efficiency after 15.00. It is stated in the
research of Ji et al. [23] that electrical and thermal efficiencies of 12% and 50% have been reached
with the analyzed model.
FIGURE 4.3 Performance analysis from Ji et al. [23]. Left is the electrical output of the PVT system and
right is the heat gain from the PVT system.
The solar irradiance and ambient temperature used from the research by Ji et al., [23] is given in
figure 4.4. This research was done in China, Hefei.
FIGURE 4.4 Solar irradiance and ambient temperature data from Ji et al., [23]
Guarracino et al. [22] presented a dynamic model of a water based PVT collector with a sheet and
tube thermal absorber. The obtained electrical efficiency in this study is approximately 12 to 14 %
within the time period 7.00 and 17.00.

28
FIGURE 4.5 Performance analysis of Guarracino et al. [22] indicating the electrical efficient, PV panel
temperature and fluid flow into the panel, over the measured ambient temperature within the time
period of a day.
For the WPVT and RPVT implementations of Marriott Hotel (which is given in chapter 6), it is
expected that the RPVT-system reaches a higher performance compared with the WPVT-system
[18]. The performance is also estimated to be higher than the obtained research from Gaurracino
et al. [22] (which is conducted in UK, London) and Ji et al. [23] (which is conducted in Hefei,
China) due to environment conditions of Suriname, which are more ideal to utilize solar energy
compared with the environment conditions of Gaurracino et al. [22] and Ji et al. [23].
The flow patterns of the graphs given in figure 4.3 and 4.5 are approximately the same flow
patterns that the WPVT and RPVT for Marriott Hotel are expected to have. The parameters that
will be analyzed are: Electrical Efficiency; Thermal Efficiency; Electrical output power; Useful
thermal heat; and Total Efficiency.
4.4 Methodology of the performance analysis
This section contains a methodology that will be followed to determine the performance analysis
of the PVT-systems. The mentioned WPVT and RPVT-systems in chapter 3 are applied for
Marriott Hotel through the given model in section 4.1 to obtain the performance of a PVT-system
case study with environment conditions of Suriname for a hotel. All the PVT-systems are
analyzed based on their performance by using the PVT model of Florschuetz [17]. When
analyzing the performance of the WPVT and RPVT systems for conditions of Marriott Hotel, a
systematic approach is taken. This methodology can be given by the following 4 steps in figure

29
4.6. In step one the specifications will be given of the PVT system. Step 2 will give a schematic of
how the PVT system looks like with the medium flow and boundaries explained. The relevant
assumptions of the model will be given in step 3 followed by the actual analysis of the PVT system
in step 4, in which the results will be given and discussed afterwards.
FIGURE 4.6 Methodology to determine the PVT-system performance.
•Specifying what the inputs are of the PVT-system. With this the design conditions ofthe PVT-system are stated that will be used to determine the performance of thesystem.
Step 1
•Giving a schematic of the PVT-system and stating the boundary of the systemindicating towhat extend andwhichcomponents of the systemwill be analyzed.
Step 2
•Stating the relevant assumptions to reduce the model to a manageable state thatfitswith the objective of this study.
Step 3
•Analyzing the PVT system based on the information gathered in steps 1 to 3 andapplying the Florschuetz model [17] to determine the performance of the system. Inthis step the results are givenand discussed.
Step 4
30
5 Model Analysis
“Respect is based on the awareness that everyone has
value.
—Brahma Kumaris
In this chapter the written Microsoft Excel model of the Florschuetz method [17] to determine the
PVT performance is explained and validated. The validations are done for the WPVT-system and
the RPVT-system by using Gaurracino et al. [22] and Ji et al. [23]. The Florschuetz model [17] will
be elaborated within the mathematical analysis, but only the direct application the conventional
Hottel-Whillier method will be given because the Hottel-Whillier model has already been
researched on in Suriname [40].
5.1 Mathematical Model
As was given in chapter 3, Zang et al. [18] indicated that the heat extracted from the air-based
PVT-system can mostly be used for room heating. Since Suriname has a warm tropical climate
this would not be useful for Marriott Hotel. Using the air-based system would mean sending out
the heated air into the atmosphere after heat extraction, which is loss of thermal energy delivering
a low overall efficiency. The thermal energy extracted from the WPVT and the RPVT-systems are
usable for water heating which is a need at Marriott Hotel.
The mathematical steps that have been executed for the WPVT and RPVT-systems are conducted
per hourly averaged time period. The basic assumptions that apply for the Hottel-Whillier [25]
model also count for this model. For the Florschuetz [17] model, the assumption is made that the
local electrical conversion efficiency of the solar cell array (absorber) can be represented as a linear
decreasing function of the local absorber operating temperature [17].
The applied mathematical model to obtain the performance of the WPVT and RPVT panel is
analyzed by determining the following:
1. Environment and location conditions for the WPVT and RPVT panels.
2. The radiation transmission and the absorption
3. The modified absorbed irradiance per unit area ��
4. The modified heat removal factor 𝐹𝑅 and modified overall loss coefficient 𝑈𝐿
5. The electrical 𝑄𝑒𝑙 and thermal 𝑄𝑢 output of the PVT panel and the total PVT panel efficiency

31
1. Environment and location conditions for the WPVT and RPVT panels.
Water-based PVT-system (WPVT-System)
Table 5.1 states the location’s conditions for the PVT panel of Guarracino et al. [22].
PVT panel state conditions
Location UK, London
Latitude 51.5074° N
Longitude 0.1278° W
Tilt Angle 31, 24, 16
Day # 244, 240, 198
TABLE 5.1 PVT panel state conditions of the WPVT-system, Guarracino et al. [22]
The solar panel tilt angle for a latitude greater that 50 can be determined by the rule of thumb:
For winter: 𝑇𝑖𝑙𝑡𝑊 = 90 − (𝐿𝑎𝑡𝑖𝑡𝑢𝑑𝑒) + 23 (5.1𝑎)
For summer: 𝑇𝑖𝑙𝑡𝑆 = 90 − (𝐿𝑎𝑡𝑖𝑡𝑢𝑑𝑒) − 23 (5.1𝑏)
The PVT panel analysis has been done for 3 days of the year: 1 September, 28 August and 17 July
(Day#: 244, 240 and 198). The optimum solar tilt angle of these days are: 31, 24, and 16. [39]
Refrigerant-based PVT-system (RPVT-System)
Table 5.2 states the location’s conditions for the PVT panel of Ji et al. [23].
PVT panel state conditions
Location China, Hefei
Latitude 31.87 N
Longitude 117.23 E
Tilt Angle 27.32
Day # -
TABLE 5.2 PVT panel state conditions of the RPVT-system, Ji et al. [23]
The solar panel tilt angle for the latitude between 25 and 50 can be determined by the rule of
thumb: 𝑇𝑖𝑙𝑡 = 0.76(𝐿𝑎𝑡𝑖𝑡𝑢𝑑𝑒) + 3.1 (5.2𝑎)

32
For locations at a latitude smaller than 25 the following rule of thumb is used:
𝑇𝑖𝑙𝑡𝑆 = 0.87(𝐿𝑎𝑡𝑖𝑡𝑢𝑑𝑒) (5.2𝑏)
2. The radiation transmission () and the absorption ()
The transmission and absorption (given in figure 5.1) are needed to determine the transmissivity-
absorption product (). This parameter is used in equation 4.7 to determine the thermal
efficiency. Before the absorption and transmission are determined, the optical properties of the
cover system must be determined along with the reflection of the radiation, and the absorbance
of the glazing which is fully described in Duffie and Beckman [25]. The transmittance, absorbance
and reflectance of the solar radiation by the solar collector are needed to determine the
performance of the collector. The assumption is made that the properties of the cover (which is
taken as iron glass) are independent of the wavelength.
FIGURE 5.1 Absorption of solar radiation (Under the absorber plate of the PVT panel) [25]
The transmissivity-absorption product () can be determined by
() =
1 − (1 − )𝑑
(5.3)
To obtain this parameter the following parameters, such as the angle of incidence, refraction,
refraction and transmission must first be determined.
The angle of Incidence (1) is determined by,
𝑐𝑜𝑠1 = 𝑠𝑖𝑛(sin 𝑐𝑜𝑠 + cos cos cos sin) + cos (cos cos cos − sin cos sin) +
(cos sin sin sin) (5.4)
In this equation is the declination angle, the slope of the collector, the surface azimuth
angle, the hour angle, and is the latitude.

33
The angle of Refraction (2) which is determined by
2 = 𝑠𝑖𝑛−1 (𝑠𝑖𝑛1
𝑛) (5.5)
With a reflection index of n = 1.52 for Iron tempered cover glass.
The reflectance (r) of the incident solar angle is
𝑟 =1
2(
𝑠𝑖𝑛2(2 − 1)
𝑠𝑖𝑛2(2 + 1)+
𝑡𝑎𝑛2(2 − 1)
𝑡𝑎𝑛2(2 + 1)) (5.6)
The perpendicular reflectance (r) of the incident solar angle is
𝑟 = (𝑠𝑖𝑛2(2 − 1)
𝑠𝑖𝑛2(2 + 1)) (5.7)
The parallel reflectance (rII) of the incident solar angle is:
𝑟|| = (𝑡𝑎𝑛2(2 − 1)
𝑡𝑎𝑛2(2 + 1)) (5.8)
Transmissivity obtained by absorption (a):
𝑎 = 𝑒−(
𝐾𝐿𝑐𝑜𝑠2
) (5.9)
In this equations L is the glass cover thickness and K is the extinction coefficient.
Transmittance obtained by radiation (r):
𝑟 =1
2(
1 − 𝑟1 + (2 − 1)𝑟
+1 − 𝑟||
1 + (2 − 1)𝑟||
) (5.10)
From the above mentioned equations the following can be obtained: The transmittance of the
collector ():
= 𝑎𝑟 (5.11)
The absorbance of the collector ():
= 1 − 𝑎 (5.12)
And the reflectance of the collector (d):
𝑑
= 𝑎 − (5.13)
3. The modified absorbed irradiance per unit area ��
The modified absorbed solar radiation per unit area is determined by equation 4.9 given in
chapter 4. The absorbed solar radiation S is determined by,

34
𝑆 = 𝐼𝑏𝑟𝑏()𝑏 + (𝐼𝑏𝑟𝑑 + (𝐼𝑏 + 𝐼𝑑)𝑟𝑟)()𝑑 (5.14)
The beam reflectance for the absorbed solar radiation is determined by
𝑟𝑏 =𝑐𝑜𝑠1
𝑐𝑜𝑠2
(5.15)
And the diffuse reflectance is determined by
𝑟𝑑 =(1 + 𝑐𝑜𝑠)
2 (5.16)
With
𝑟𝑟 =(1 − 𝑐𝑜𝑠)
2 (5.17)
Where is the reflectivity of the surrounding surfaces and is the slope of the collector. The
parameter ()b is the transmissivity-absorption product determined at the beam angle of the
incident solar irradiance (1) and ()d is the transmissivity-absorption product determined at the
diffuse angle of the incident solar irradiance. The diffuse angle is taken as 60 [42].
The beam irradiance 𝐼𝑏 is taken as the direct solar irradiance that is measured [41] and the diffuse
irradiance 𝐼𝑑 is estimated with the following [50]: 𝐼𝑑 = 𝐼𝐺 − 𝐼𝑏 (5.18)
Here 𝐼𝐺 is the global irradiance. The global irradiance is obtained from Solargis [43] for the
specified location. And of equation 5.14 can be determined with equation 5.12.
The electrical efficiency of the PVT-collector is assumed to decrease linearly with the temperature
of the absorber. It is determined by equation 4.3 that is given in chapter4.
To obtain the reference parameters the Evans-Florschuetz PV efficiency correlation coefficients
are used from Dubey et al., 2012 [44].
𝑇𝑃𝑉 is the PVT-panel temperature and 𝑇𝑟𝑒𝑓 stands for the panel reference temperature. The panel
temperature for pc‐Si PV modules (used in Guarracino et al. [22]) can be obtained with
𝑇𝑝𝑣 = 30 + 0.0175(𝐺 − 300) + 1.14(𝑇𝑎 − 25) (5.19)
The temperature for a-Si PV modules (used in Ji et al. [23]) can be obtained with
𝑇𝑝𝑣 = 30 = 0.0175(𝐺 − 150) + 1.14(𝑇𝑎 − 25) (5.20)
Here G stands for the sun irradiance and 𝑇𝑎 stands for the ambient temperature or environment
temperature. a-Si PV modules have a lower electrical efficiency resulting a slightly higher PV
temperature compared with pc-Si PV modules [31].

35
4. The modified heat removal factor 𝑭𝑹 and modified overall loss coefficient 𝑼𝑳
The modified heat removal factor is determined by
𝐹𝑅 =
��𝐶𝑝
𝐴𝑃𝑉 𝑈𝐿
(1 − exp (−𝐴𝑃𝑉 𝑈𝐿
𝐹′
��𝐶𝑝
)) (5.21)
In equation 4.4 the mass flow of the cooling medium is given by ��. And 𝐶𝑝 stands for the heat
capacity. The PV area is given by 𝐴𝑃𝑉 and 𝐹′ stands for the modified collector efficiency.
The modified collector efficiency is determined with the same method to determine the collector
efficiency as given by Duffie and Beckman [25] but instead of the overall loss coefficient, the
modified overall loss coefficient by Florschuetz [17] is used. The modified collector efficiency is
given in equation 5.22.
𝐹′ =1 𝑈𝐿
⁄
𝑊 [1
𝑈𝐿 [𝐷 + (𝑊 − 𝐷)𝐹𝑊𝐷
+1𝐶𝑏
+1
𝜋𝐷𝑖 ℎ𝑓𝑖]
(5.22)
From this equation FWD is determined by
𝐹𝑊𝐷 = (1 −𝐷
𝑊) 𝐹 +
𝐷
𝑊 (5.23)
The coefficient F is determined by
𝐹 =tanh (
𝑚(𝑊 − 𝐷)2 )
𝑚(𝑊 − 𝐷)/2 (5.24)
And the dimensionless parameter m is determined by
𝑚 = √𝑈𝐿
𝑘 (5.25)
In this equation is the absorber thickness, k is the thermal conductivity of absorber, D is the
outside tube diameter, Di is the inside tube diameter, hfi is the fluid to tube heat transfer
coefficient, W is the tube spacing for tube and sheet collector configuration, and Cb is the bond
(adhesive) conductance which can be determined by
𝐶𝑏 =𝑘𝑏 𝑏
(5.26)
With b as bond width, as the average bond thickness and kb as the bond thermal conductivity.
The modified overall loss coefficient is determined by equation 4.5 given in chapter 4. The
reference values, irradiance and transmittance have been explained in the previous equations.
The overall loss coefficient 𝑈𝐿 is determined by using the cover system parameters of Florscheutz
[22] given in table 5.3. The analyzed systems have one collector cover.

36
Number of Collector Covers 𝑼𝑳 [W/m2K]
None (Wind 5 m/s) 1 30
None (Wind 2.5 m/s) 1 30
one 0.92 7
two 0.84 3.5
TABLE 5.3 PVT panel cover system overall loss coefficient [17]
5. The electrical 𝑸𝒆𝒍 and thermal 𝑸𝒖 output of the PVT panel and the total PVT panel
efficiency
The power output and panel efficiency ultimately determine the performance of the PVT panel.
These parameters are plotted over a given time period to analyze and validate the model. The
equations of these parameters are given in chapter 4. The thermal- and, electrical efficiency, and
useful thermal energy of the PVT-system can be determined with equation 4.7 and equation 4.8
from chapter 4.
From the useful thermal energy the outlet temperature of the fluid medium can be determined
with
𝑄𝑢 = ��𝐶𝑝(𝑇𝑜 − 𝑇𝑖) (5.27)
With all the needed parameters determined with the above mentioned equation set the
performance of the PVT system can be analyzed.
5.2 Model Results
The WPVT and RPVT-system results are given in table 5.4 and 5.5. The performance graphs of
the WPVT-system are given in figure 5.2 till 5.5 and the graphs of the RPVT-system are given in
figure 5.6 and 5.9. The electrical output, panel temperature, and efficiency of the WPVT-system
is validated.
The WPVT graphical results
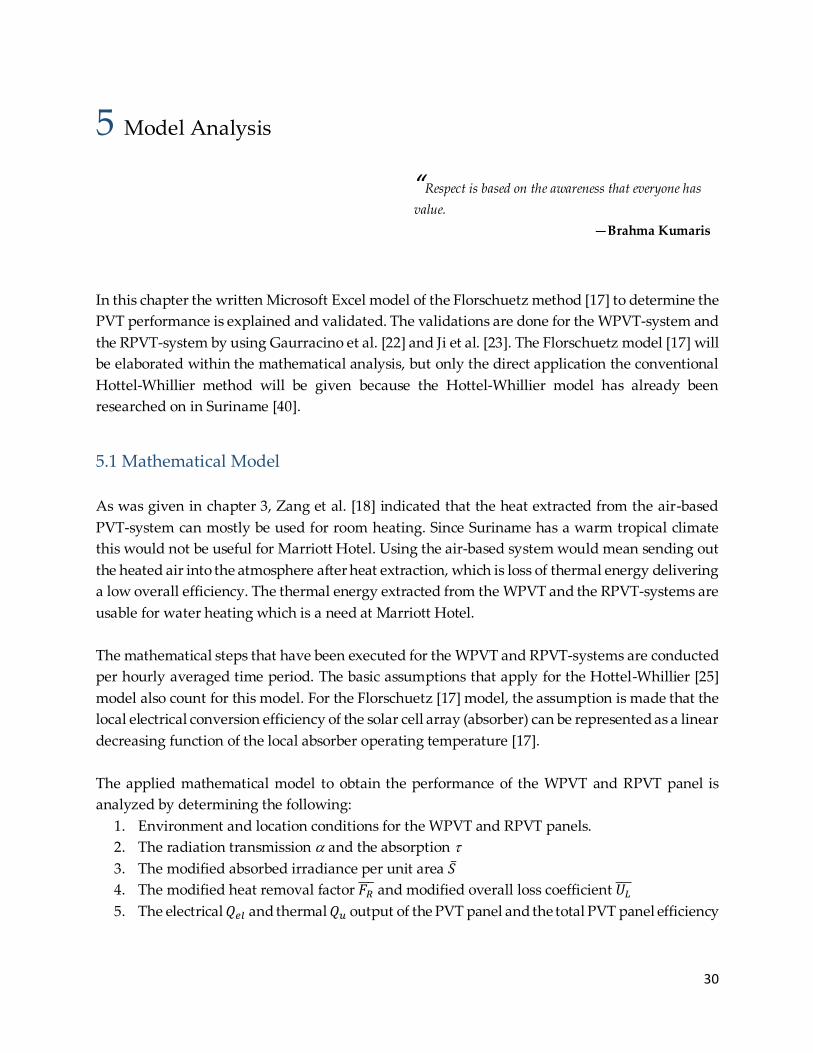
In figure 5.2 the results of the electrical efficiency of the WPVT are graphed. The graph flow
decreases from 12.14 % to 11.24% with an increase of the ambient temperature. The ambient
temperature increases between 9.00 and 12.00 which reduces the band gap of the cells within the
panel. This reduces the electrical efficiency (See chapter 3). With a decrease of the ambient
temperature from 13.00 to 16.00 the electrical efficiency increases again.
37
FIGURE 5.2 Electrical efficiency WPVT model
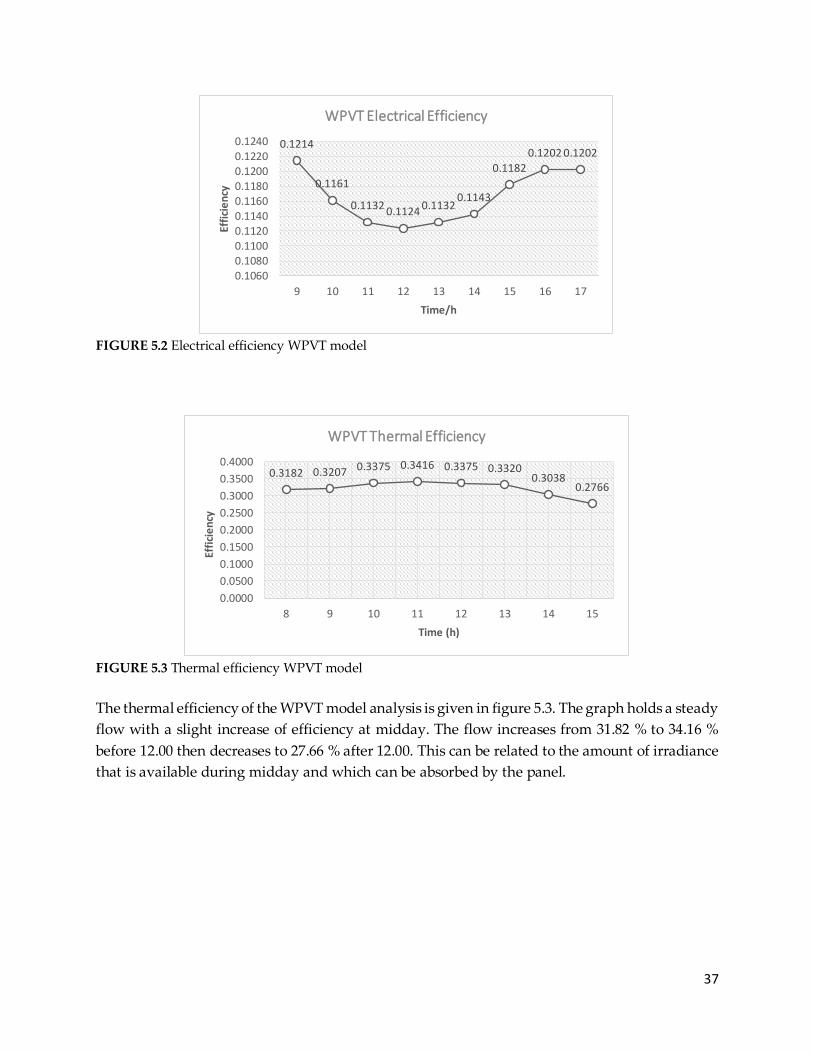
FIGURE 5.3 Thermal efficiency WPVT model
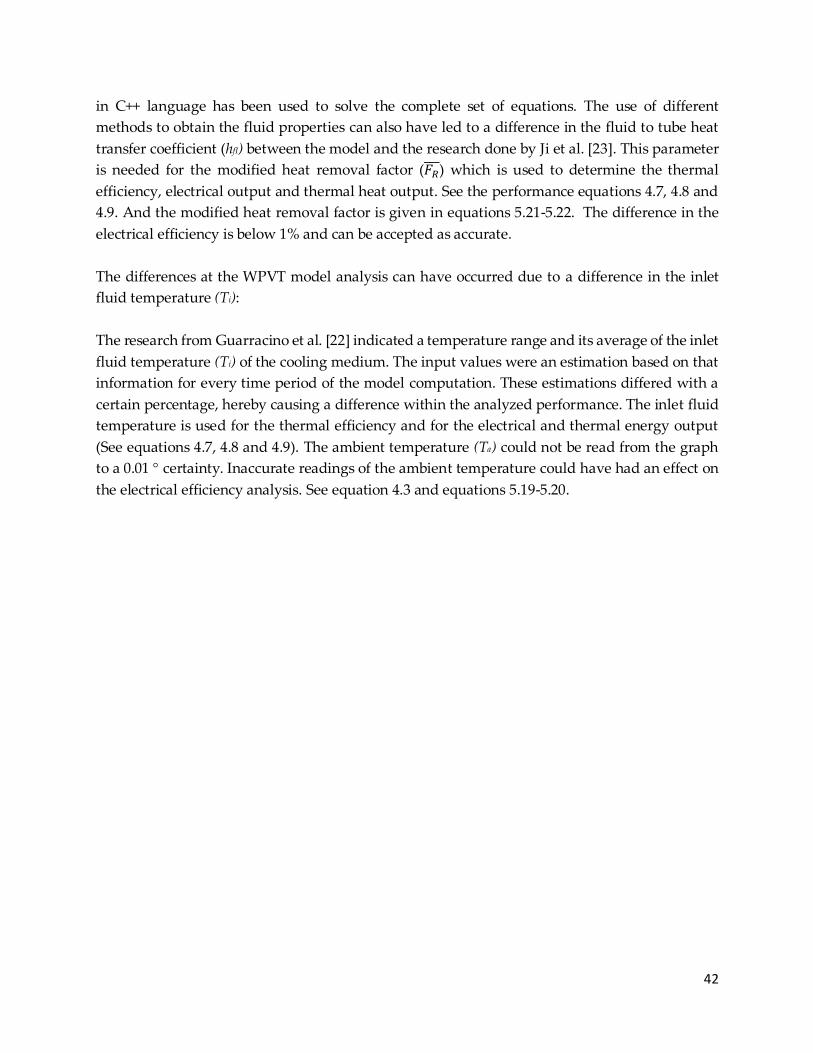
The thermal efficiency of the WPVT model analysis is given in figure 5.3. The graph holds a steady
flow with a slight increase of efficiency at midday. The flow increases from 31.82 % to 34.16 %
before 12.00 then decreases to 27.66 % after 12.00. This can be related to the amount of irradiance
that is available during midday and which can be absorbed by the panel.
0.1214
0.1161
0.1132 0.1124 0.11320.1143
0.1182
0.1202 0.1202
0.10600.10800.11000.11200.11400.11600.11800.12000.12200.1240
9 10 11 12 13 14 15 16 17
Effi
cie
ncy
Time/h
WPVT Electrical Efficiency
0.3182 0.3207 0.3375 0.3416 0.3375 0.33200.3038
0.2766
0.0000
0.0500
0.1000
0.1500
0.2000
0.2500
0.3000
0.3500
0.4000
8 9 10 11 12 13 14 15
Effi
cie
ncy
Time (h)
WPVT Thermal Efficiency

38
FIGURE 5.4 Thermal Output WPVT model
The thermal output of the WPVT system is given in figure 5.4. The thermal heat increases with
an increase of irradiance and ambient temperature and decreases with a decrease of these input
parameters. The generated thermal energy goes from 372 W to 701 W, then decreases to 205 W.
The dependence on the amount of irradiance can clearly be seen in this graph.
FIGURE 5.5 Electrical Output WPVT model
In figure 5.5 the results of the electrical output are graphed. The electrical output is lower than
the thermal energy output. The flow pattern is similar to the thermal heat flow pattern with an
increase of energy before 12.00-13.00 and a decrease of energy after 12.00-13.00. The effect the
irradiance has on the power output can also be seen in this graph.
372
620680 701 680
632
330
205
0
100
200
300
400
500
600
700
800
8 9 10 11 12 13 14 15
Po
we
r (W
)
Time (h)
WPVT Thermal Output
246
364409 424 409
380
201
122
0
50
100
150
200
250
300
350
400
450
9 10 11 12 13 14 15 16
Po
we
r (W
)
Time (h)
WPVT Electrical Output

39
The RPVT graphical results
FIGURE 5.6 Electrical Efficiency RPVT model
In figure 5.6 the results of the electrical efficiency of the RPVT are graphed. The graph flow
decreases from 12.98 % to 11.85% with an increase of the ambient temperature. The effect of a
temperature increase on the efficiency which is explained in chapter 3 is also shown here. The
obtained efficiency percentages are still higher than a conventional PV system, which reduces
with 0.45% for every degree above 25C.
FIGURE 5.7 Thermal Efficiency RPVT model
The thermal efficiency of the RPVT model analysis is given in figure 5.7. There is an increase of
efficiency when the irradiance and ambient temperature increase. The flow increases from 54.52%
to 60.41 % before 12.00 then decreases to 56.15 % after 12.00.
0.1257
0.1217
0.12000.1185
0.11930.1204
0.1241
0.1258
0.1140
0.1160
0.1180
0.1200
0.1220
0.1240
0.1260
0.1280
8 9 10 11 12 13 14 15
Effi
cie
ncy
Time (h)
RPVT Electrical Efficiency
0.5452
0.5806
0.59340.6041
0.59840.5912
0.57350.5615
0.5000
0.5200
0.5400
0.5600
0.5800
0.6000
0.6200
8 9 10 11 12 13 14 15
Effi
cie
ncy
Time (h)
RPVT Thermal Elfficiency

40
FIGURE 5.8 Thermal Output RPVT model
The thermal output of the RPVT system is given in figure 5.8. The thermal heat increases with an
increase of irradiance and ambient temperature and decreases with a decrease of these input
parameters. The generated thermal energy goes from 970 W to 1750 W, then decreases to 626 W.
FIGURE 5.9 Electrical Output RPVT model
In figure 5.9 the results of the electrical output from the RPVT-system are graphed. The electrical
output is also lower than the thermal energy output. The flow pattern is similar to the thermal
heat flow pattern with an increase of energy before 12.00-13.00 and a decrease of energy after
12.00-13.00.
970
15711690 1750 1700
1590
908
626
0
500
1000
1500
2000
8 9 10 11 12 13 14 15
The
rmal
Ou
tpu
t (W
)
Time (h)
RPVT Thermal Output
171
271292 304 295
277
166
116
0
50
100
150
200
250
300
350
8 9 10 11 12 13 14 15
Ele
ctri
cal
Po
we
r (W
)
Time (h)
RPVT Electrical Output
41
5.3 Model Validation
The margin for error is very large when verifying the model data with the graphed researched
data from Guarracino et al. [22] and Ji et al. [23] because the scaling from the graphs that are given
are between the 100 W and 500 W. And the scale size for the efficiency graphs are 1%. Hereby
the validation of the model is conducted by:
1. Following the flow pattern of the obtained graphs and analyzing if there are deviations
compared with the graphs of Guarracino et al. [22] and Ji et al. [23].
2. Comparing the given average performance of the research from Guarracino et al. [22] and Ji
et al. [23] with the averaged analyzed performance of the Florschuetz model which is executed
in Microsoft Excel.
The flow patterns of the efficiency and power output graphs from the model analysis (figure 5.2
till 5.9) can be considered as similar to the flow patterns from the graphs of Gaurracino et al. [22]
and Ji et al. [23] in chapter 4 (figure 4.3 and figure 4.5). The flow pattern of the electrical efficiency
indicates the dependence it has on the efficiency drop with an increasing ambient temperature,
which is explained in chapter 3. And the sine flow pattern of the electrical and thermal power
output indicates the dependence of these factors on the irradiance (given in chapter 2) which also
gives a sine flow pattern. The equations that relate the electrical and thermal power output and
thermal efficiency with the irradiance are given in section 4.1 and elaborated in section 5.1.
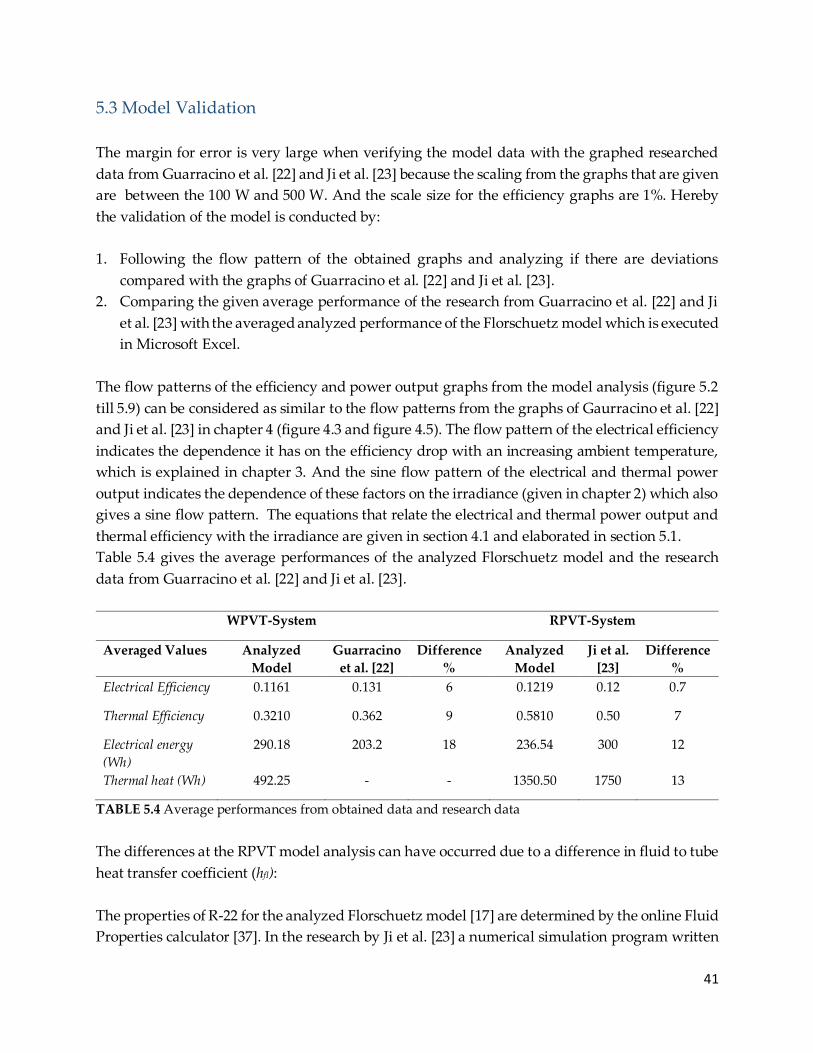
Table 5.4 gives the average performances of the analyzed Florschuetz model and the research
data from Guarracino et al. [22] and Ji et al. [23].
WPVT-System RPVT-System
Averaged Values Analyzed
Model
Guarracino
et al. [22]
Difference
%
Analyzed
Model
Ji et al.
[23]
Difference
%
Electrical Efficiency 0.1161 0.131 6 0.1219 0.12 0.7
Thermal Efficiency 0.3210 0.362 9 0.5810 0.50 7
Electrical energy
(Wh)
290.18 203.2 18 236.54 300 12
Thermal heat (Wh) 492.25 - - 1350.50 1750 13
TABLE 5.4 Average performances from obtained data and research data
The differences at the RPVT model analysis can have occurred due to a difference in fluid to tube
heat transfer coefficient (hfI):
The properties of R-22 for the analyzed Florschuetz model [17] are determined by the online Fluid
Properties calculator [37]. In the research by Ji et al. [23] a numerical simulation program written
42
in C++ language has been used to solve the complete set of equations. The use of different
methods to obtain the fluid properties can also have led to a difference in the fluid to tube heat
transfer coefficient (hfI) between the model and the research done by Ji et al. [23]. This parameter
is needed for the modified heat removal factor (𝐹𝑅 ) which is used to determine the thermal
efficiency, electrical output and thermal heat output. See the performance equations 4.7, 4.8 and
4.9. And the modified heat removal factor is given in equations 5.21-5.22. The difference in the
electrical efficiency is below 1% and can be accepted as accurate.
The differences at the WPVT model analysis can have occurred due to a difference in the inlet
fluid temperature (Ti):
The research from Guarracino et al. [22] indicated a temperature range and its average of the inlet
fluid temperature (Ti) of the cooling medium. The input values were an estimation based on that
information for every time period of the model computation. These estimations differed with a
certain percentage, hereby causing a difference within the analyzed performance. The inlet fluid
temperature is used for the thermal efficiency and for the electrical and thermal energy output
(See equations 4.7, 4.8 and 4.9). The ambient temperature (Ta) could not be read from the graph
to a 0.01 certainty. Inaccurate readings of the ambient temperature could have had an effect on
the electrical efficiency analysis. See equation 4.3 and equations 5.19-5.20.

43
6 Analysis of PVT applications for Marriott Hotel
“Once we accept out limits, we go beyond them.
—Albert Einstein, 1955
(Theoretical Physicist)
The given methodology in chapter 4 is applied in this chapter to determine the performance of
PVT applications for Marriott Hotel. The Microsoft Excel model explained in chapter 5 is used to
analyze the PVT-systems with the location conditions of Marriott Hotel. These steps are applied
for the WPVT and RPVT-system and documented in section 6.2 and 6.3. The chapter is concluded
with a discussion section by analyzing the performances of the WPVT and RPVT-system.
6.1 Analyzed PVT applications
The model analysis for Marriott Hotel is conducted over a time period between 9.00 and 17.00.
The performance is determined by using averaged hourly measured data within the given time
period. The performance of each averaged hour between 9.00 and 17.00 is determined in
Microsoft Excel for the WPVT and RPVT-system. This delivered eight efficiency and power
output results for each of the analyzed systems. The PVT panel is analyzed at the state conditions
mentioned in table 6.1. The panel design specifications given in table 4.3 of chapter 4 are used.
PVT panel state conditions
Establishment Courtyard Marriott Hotel Paramaribo
Location Anton Dragtenweg/ Paramaribo/Suriname
Latitude 5.8326° N
Longitude 55.1351° W
Tilt Angle 5
Azimuth 0
Day # 117
Time interval 9.00-17.00
TABLE 6.1 PVT panel state conditions
The sun irradiance and ambient temperatures are given in table 6.2. The table shows averaged
measured values within time periods of one hour. In this application the results of the

44
performance is given for the WPVT and RPVT implementation at Marriot Hotel’s environment
conditions.
Time-
Period
# Hour
Sun
Irradiance
(G, W/m2)
Ambient
Temperature
(Ta, °C)
1 9.00-10.00 450.94 28.97
2 10.00-11.00 569.06 29.30
3 11.00-12.00 678.35 28.73
4 12.00-13.00 709.16 30.13
5 13.00-14.00 688.19 30.73
6 14.00-15.00 629.54 30.67
7 15.00-16.00 596.33 29.73
8 16.00-17.00 362.15 28.23
TABLE 6.2 Sun Irradiance and ambient temperature
6.2 Results of the WPVT-system
The results of the performance analysis by following the given methodology of chapter 4 and
chapter 5 of the WPVT-system for Marriott Hotel is given in this section. A schematic of the
experimental setup from Guarracino et al. [22] is given in figure 6.1. In the figure a red boundary
is dashed around the PVT panel. Only this component will be analyzed on its efficiency.
FIGURE 6.1 Schematic of the PVT water-based system [22]
A simplified model is considered for the method of Florscheutz [17]. The main assumptions
made for the PVT- system are:
The system will be modelled with a one-dimensional, steady-state heat transfer [31].

45
The thermal capacities of the collector components, and the heat transfer from the
absorber to the conductive plate and the pipes for the PVT- system are negligible [31].
The top optical losses are accounted by the product (τα), where τ is the transmittance of
the front protective glass of the PVT module and α is the absorbance of solar radiation by
the cells [31].
The optical losses are subtracted from the incident solar radiation to get the net energy
available for conversion into heat and electricity [31].
The node temperatures of the PVT-collector are assumed to be uniform throughout the
respective surfaces [31].
The collector aperture area is equal to the front area of the PV module [31].
The fluid flow-rate is evenly distributed between the pipes and the thermal losses and
mixing effects at the inlet and outlet manifolds are negligible [22].
It is assumed that there is no dust or partial shading on the collector. (Losses due to cloud
shading is neglected).
The electrical resistances are neglected when evaluating the electrical energy output and
the electrical efficiency [22].
The reflection, absorption and transmission factors are calculated only for the incident
solar irradiance [22].
The changes in kinetic energy and potential energy are ignored in the energy equation set
[23].
The equations of the Florschuetz model which are used which have been explained in chapter 4
and elaborated in chapter 5 to obtain the results. The model has been used to determine the
performance of the WPVT-system, which is graphed in figure 6.2 till 6.5.
FIGURE 6.2 Electrical efficiency of the WPVT-system
In figure 6.2 the results of the electrical efficiency of the WPVT-system for Marriott Hotel are
graphed. The graph flow decreases from 12.14 % to 11.24% with an increase of the ambient
temperature.
0.1214
0.1161
0.1132 0.1124 0.1132 0.1143
0.11820.1202
0.1050
0.1100
0.1150
0.1200
0.1250
9 10 11 12 13 14 15 16
Effi
cie
ncy
time (h)
WPVT Electrical Efficiency
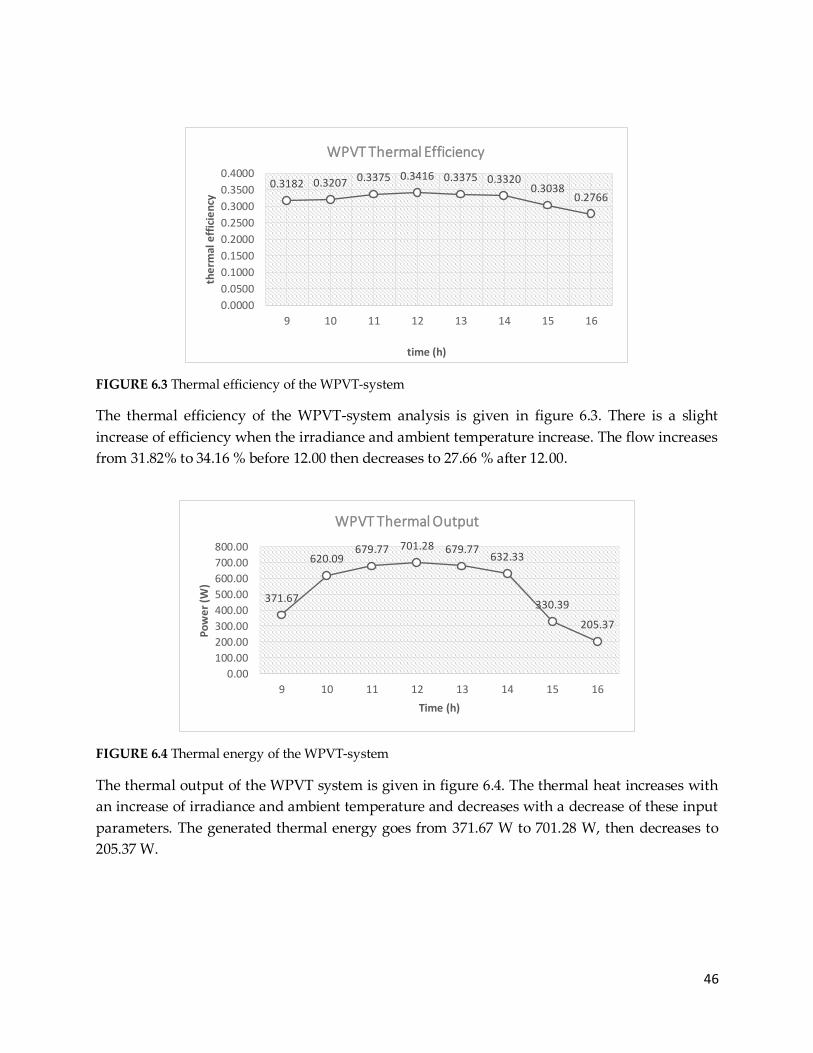
46
FIGURE 6.3 Thermal efficiency of the WPVT-system
The thermal efficiency of the WPVT-system analysis is given in figure 6.3. There is a slight
increase of efficiency when the irradiance and ambient temperature increase. The flow increases
from 31.82% to 34.16 % before 12.00 then decreases to 27.66 % after 12.00.
FIGURE 6.4 Thermal energy of the WPVT-system
The thermal output of the WPVT system is given in figure 6.4. The thermal heat increases with
an increase of irradiance and ambient temperature and decreases with a decrease of these input
parameters. The generated thermal energy goes from 371.67 W to 701.28 W, then decreases to
205.37 W.
0.3182 0.3207 0.3375 0.3416 0.3375 0.33200.3038
0.2766
0.0000
0.0500
0.1000
0.1500
0.2000
0.2500
0.3000
0.3500
0.4000
9 10 11 12 13 14 15 16
the
rmal
eff
icie
ncy
time (h)
WPVT Thermal Efficiency
371.67
620.09679.77 701.28 679.77
632.33
330.39
205.37
0.00
100.00
200.00
300.00
400.00
500.00
600.00
700.00
800.00
9 10 11 12 13 14 15 16
Po
we
r (W
)
Time (h)
WPVT Thermal Output

47
FIGURE 6.5 Electrical output of the WPVT-system
In figure 6.5 the results of the electrical output from the WPVT-system are graphed. The electrical
output is also lower than the thermal energy output. The flow pattern is similar to the thermal
heat flow pattern with an increase of energy before 12.00-13.00 and a decrease of energy after
12.00-13.00.
6.3 Results of the RPVT-system
In this section the refrigerant based PVT application is analyzed based on the methodology of
chapter 4. The PVT panel state conditions of table 6.1 and the sun irradiance and ambient
temperature of table 6.2 also comply for the RPVT-system. The PVT panel characteristics are
given in table 4.3 of chapter 4. The refrigerant used for the PVT-system is R-22. The refrigerant at
the inlet of the PVT panel is in liquid state, through the PVT panel in liquid-vapor state, and when
the refrigerant exits the PVT panel it is in vapor state. The characteristics needed for the analysis
of the PVT panel is of the refrigerant in liquid-vapor state when it goes through the PVT panel.
In Appendix A the additional heat calculations are given to determine the fluid to tube heat
transfer coefficient for R-22 in liquid-vapor phase. The properties of R-22 are determined with the
thermodynamic data given in Moran and Shapiro [36] and the online Fluid Property Calculator
[37]. A schematic of the refrigerant based system is given in figure 6.6. The system boundary is
once more placed with the panel considered, only this component will be analyzed based on its
performance.
245.64
364.46409.18 423.84 409.18
380.31
201.41
121.75
0.00
50.00
100.00
150.00
200.00
250.00
300.00
350.00
400.00
450.00
9 10 11 12 13 14 15 16
Po
we
r (W
)
Time (h)
WPVT Electrical Output

48
FIGURE 6.6 Schematic illustration of the refrigerant based PVT-system from Chow et al. [32]
The refrigerant based PVT-system has the same simplified assumptions as the water based
PVT-system given in section 6.3 of step 3 along with the following additional assumptions:
The refrigerant flow inside the evaporator tubing is one dimensional and homogeneous.
The liquid and vapor refrigerant have the same average transport velocity, i.e. the slip
between liquid and vapor is neglected [23].
The liquid and vapor phases are in saturated thermal equilibrium and the pressure of the
liquid and vapor at the same cross-section are equal [23].
The influence of the pressure drop on the physical properties of the liquid and vapor
refrigerant, such as temperature, density and enthalpy, has not been taken into account.
The applied equations for the RPVT-system are given in table 6.3. The obtained performance for
the RPVT-system is graphed in figure 6.7 till 6.10.
FIGURE 6.7 Electrical efficiency of the RPVT system
0.1257
0.1217
0.12000.1185
0.11930.1204
0.1241
0.1258
0.1140
0.1160
0.1180
0.1200
0.1220
0.1240
0.1260
0.1280
9 10 11 12 13 14 15 16
ele
ctri
cal e
ffic
ien
cy
time (h)
RPVT Electrical Efficiency

49
In figure 6.7 the results of the electrical efficiency of the RPVT-system for Marriott Hotel are
graphed. The graph flow decreases from 12.57% to 11.85% with an increase of the ambient
temperature. The RPVT graph flow is similar to the WPVT electrical graph flow.
FIGURE 6.8 Thermal efficiency of the RPVT system
The thermal efficiency of the RPVT-system analysis is given in figure 6.8. There is an increase of
efficiency when the irradiance and ambient temperature increase. The flow increases from 54.52%
to 60.41 % before 12.00 then decreases to 56.15 % after 12.00.
FIGURE 6.9 Thermal output energy from the RPVT system
The thermal output of the RPVT system is given in figure 6.9. The thermal heat increases with an
increase of irradiance and ambient temperature and decreases with a decrease of these input
parameters. The generated thermal energy goes from 970.24 W to 1749.55 W, then decreases to
625.98 W.
0.5452
0.5806
0.5934
0.60410.5984
0.5912
0.5735
0.5615
0.5100
0.5200
0.5300
0.5400
0.5500
0.5600
0.5700
0.5800
0.5900
0.6000
0.6100
9 10 11 12 13 14 15 16
the
rmal
eff
icie
ncy
time (h)
RPVT Thermal Efficiency
970.24
1570.581689.86 1749.55 1699.56
1589.84
908.40
625.98
0.00
200.00
400.00
600.00
800.00
1000.00
1200.00
1400.00
1600.00
1800.00
2000.00
9 10 11 12 13 14 15 16
Po
we
r (W
)
Time (h)
RPVT Thermal Output

50
FIGURE 6.10 Electrical output from the RPVT system.
In figure 6.10 the last obtained result is given which is the electrical output from the RPVT-system.
The electrical output here is also lower than the thermal energy output of this system. The flow
pattern is similar to the thermal heat flow pattern with an increase of energy before 12.00-13.00
and a decrease of energy after 12.00-13.00. The electrical output goes from 438.14 W to 671.07 W
and then decreases to 352.44 W at 16.00.
6.4 Energy Coverage of the PVT-system
The energy coverage is executed according to the procedure given in chapter 4. The results are
given in table 6.5. The average energy demand data of Marriott Hotel and the average energy
output data of the PVT-systems is given in table 6.4. Data of the WPVT and RPVT-system has
been used for the analysis. The assessment is done for a PVT system of 264 panels that can cover
the roof area of Marriott Hotel. In Appendix B an estimation of the solar panel system sizing for
Marriott Hotel is given. The size of the system is determined by using the maximum of roof area
that can be covered with solar panels. The electrical output is assumed to increase linearly with
the amount of panels. And according to the PVT panel characteristics of the company SmartClima
[47] the thermal output also linearly increases with the increase of panels. The total power output
is determined by multiplying the amount of panels with the average electrical and thermal output
of one panel and determining the monthly output. The average electrical and thermal output of
the WPVT are 3.49 kWh and 3.87 kWh per panel per day. And the average electrical and thermal
output of the RPVT are 4.45 kWh and 9.49 kWh per panel per day. It is assumed that the electricity
through a large inverter can cause an electrical energy reduction of approximately 15% [48] which
his included in the electricity output power of the WPVT and RPVT systems in table 6.4.
438.14
542.66
641.46 671.07 656.70593.07 559.22
352.44
0.00
100.00
200.00
300.00
400.00
500.00
600.00
700.00
800.00
9 10 11 12 13 14 15 16
Po
we
r (W
)
Time (h)
RPVT Electrical Output
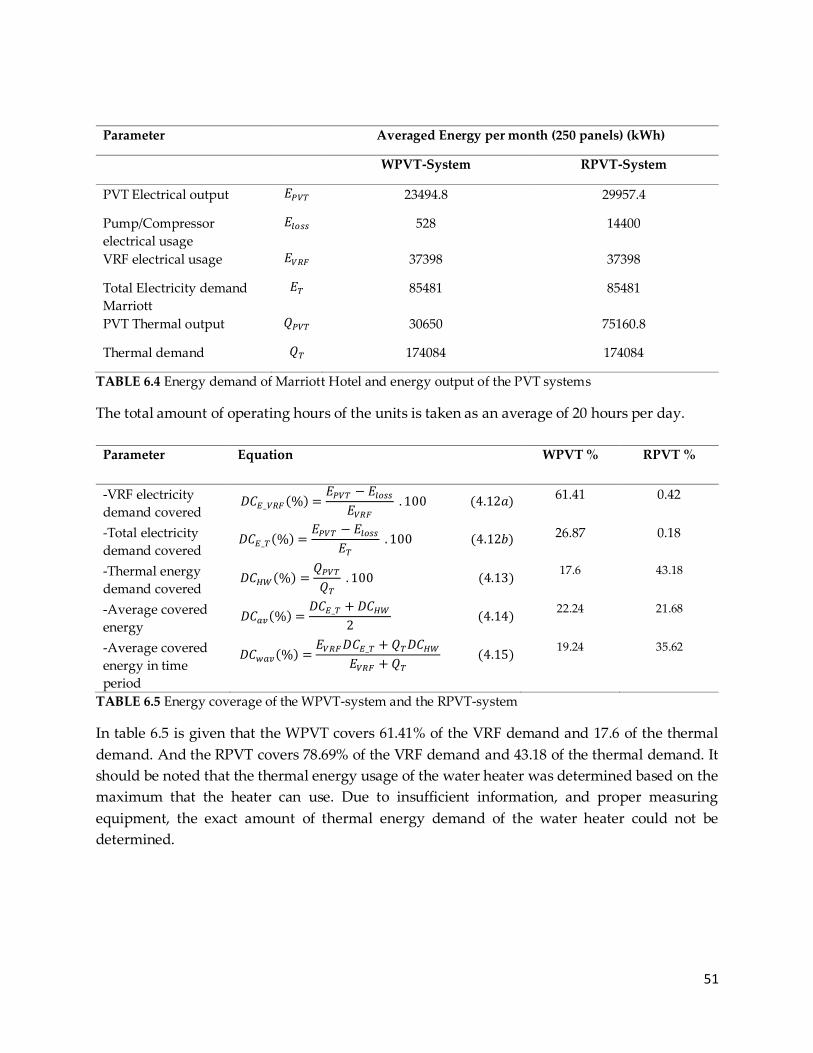
51
Parameter Averaged Energy per month (250 panels) (kWh)
WPVT-System RPVT-System
PVT Electrical output 𝐸𝑃𝑉𝑇 23494.8 29957.4
Pump/Compressor
electrical usage
𝐸𝑙𝑜𝑠𝑠 528 14400
VRF electrical usage 𝐸𝑉𝑅𝐹 37398 37398
Total Electricity demand
Marriott
𝐸𝑇 85481 85481
PVT Thermal output 𝑄𝑃𝑉𝑇 30650 75160.8
Thermal demand 𝑄𝑇 174084 174084
TABLE 6.4 Energy demand of Marriott Hotel and energy output of the PVT systems
The total amount of operating hours of the units is taken as an average of 20 hours per day.
Parameter Equation WPVT % RPVT %
-VRF electricity
demand covered 𝐷𝐶𝐸_𝑉𝑅𝐹 (%) =
𝐸𝑃𝑉𝑇 − 𝐸𝑙𝑜𝑠𝑠
𝐸𝑉𝑅𝐹
. 100 (4.12𝑎) 61.41 0.42
-Total electricity
demand covered 𝐷𝐶𝐸_𝑇(%) =
𝐸𝑃𝑉𝑇 − 𝐸𝑙𝑜𝑠𝑠
𝐸𝑇
. 100 (4.12𝑏) 26.87 0.18
-Thermal energy
demand covered 𝐷𝐶𝐻𝑊(%) =
𝑄𝑃𝑉𝑇
𝑄𝑇
. 100 (4.13) 17.6 43.18
-Average covered
energy 𝐷𝐶𝑎𝑣(%) =
𝐷𝐶𝐸_𝑇 + 𝐷𝐶𝐻𝑊
2 (4.14)
22.24 21.68
-Average covered
energy in time
period
𝐷𝐶𝑤𝑎𝑣(%) =𝐸𝑉𝑅𝐹 𝐷𝐶𝐸_𝑇 + 𝑄𝑇𝐷𝐶𝐻𝑊
𝐸𝑉𝑅𝐹 + 𝑄𝑇
(4.15) 19.24 35.62
TABLE 6.5 Energy coverage of the WPVT-system and the RPVT-system
In table 6.5 is given that the WPVT covers 61.41% of the VRF demand and 17.6 of the thermal
demand. And the RPVT covers 78.69% of the VRF demand and 43.18 of the thermal demand. It
should be noted that the thermal energy usage of the water heater was determined based on the
maximum that the heater can use. Due to insufficient information, and proper measuring
equipment, the exact amount of thermal energy demand of the water heater could not be
determined.
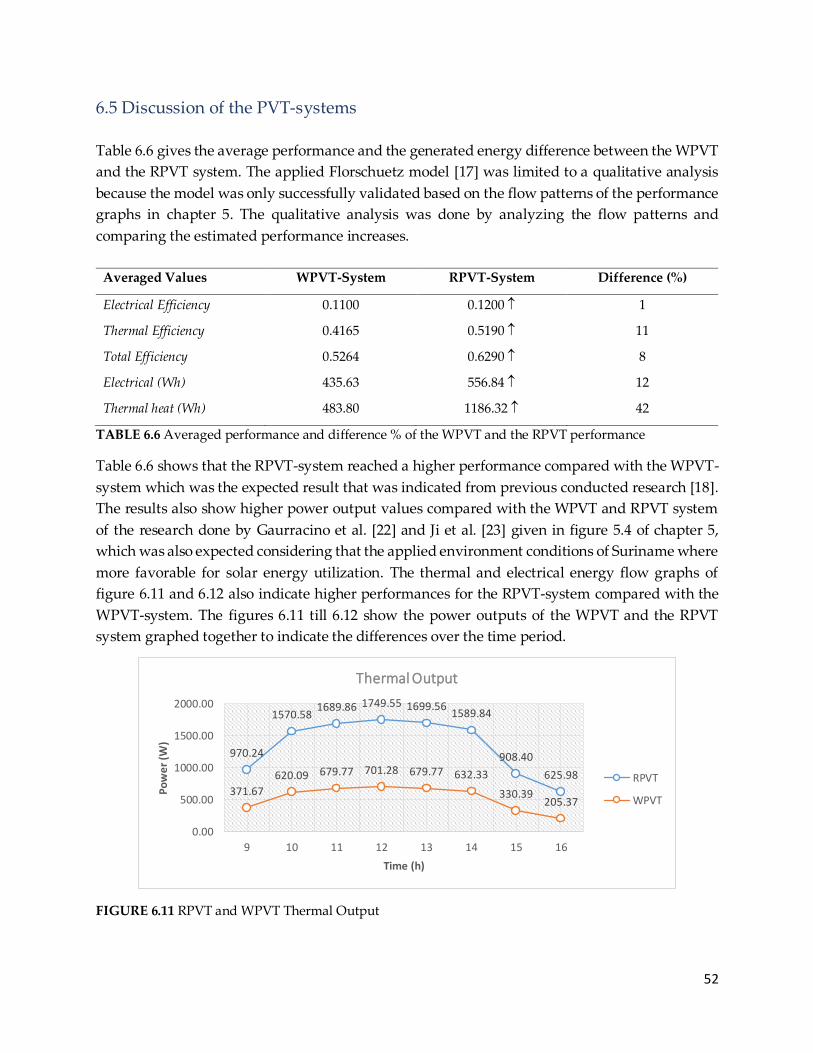
52
6.5 Discussion of the PVT-systems
Table 6.6 gives the average performance and the generated energy difference between the WPVT
and the RPVT system. The applied Florschuetz model [17] was limited to a qualitative analysis
because the model was only successfully validated based on the flow patterns of the performance
graphs in chapter 5. The qualitative analysis was done by analyzing the flow patterns and
comparing the estimated performance increases.
Averaged Values WPVT-System RPVT-System Difference (%)
Electrical Efficiency 0.1100 0.1200 1
Thermal Efficiency 0.4165 0.5190 11
Total Efficiency 0.5264 0.6290 8
Electrical (Wh) 435.63 556.84 12
Thermal heat (Wh) 483.80 1186.32 42
TABLE 6.6 Averaged performance and difference % of the WPVT and the RPVT performance
Table 6.6 shows that the RPVT-system reached a higher performance compared with the WPVT-
system which was the expected result that was indicated from previous conducted research [18].
The results also show higher power output values compared with the WPVT and RPVT system
of the research done by Gaurracino et al. [22] and Ji et al. [23] given in figure 5.4 of chapter 5,
which was also expected considering that the applied environment conditions of Suriname where
more favorable for solar energy utilization. The thermal and electrical energy flow graphs of
figure 6.11 and 6.12 also indicate higher performances for the RPVT-system compared with the
WPVT-system. The figures 6.11 till 6.12 show the power outputs of the WPVT and the RPVT
system graphed together to indicate the differences over the time period.
FIGURE 6.11 RPVT and WPVT Thermal Output
970.24
1570.581689.86 1749.55 1699.56
1589.84
908.40
625.98
371.67
620.09 679.77 701.28 679.77 632.33
330.39205.37
0.00
500.00
1000.00
1500.00
2000.00
9 10 11 12 13 14 15 16
Po
we
r (W
)
Time (h)
Thermal Output
RPVT
WPVT

53
FIGURE 6.12 RPVT and WPVT Electrical Output
The PVT panel of the RPVT system acts as an evaporator coil which allows the refrigerant to
evaporate when it passes through the module. This allows the refrigerant to evaporate at very
low temperatures (0-20C). The PV cells reduce to a similar temperature hereby also reducing the
temperature effect on the PV panel that is explained in chapter 3. This results that the PV panels
can than operate at higher efficiencies compared with the WPVT-system. Next to that is the effect
of the compressor which increases the pressure of the vapor and delivers it to the condensing unit
that can provide heating at a higher temperature compared with the WPVT-system [18]. The
refrigerant goes through the compressor which increases the temperature before entering the
water tank. This gives a higher overall performance of the RPVT compared with the WPVT-
system. It also causes a higher energy coverage of the RPVT compared with the WPVT-system
for the energy demand of Marriott Hotel.
It should be noted that although the RPVT-system reaches a higher performance, it still comes
with the technical limits that need to be addressed before integrating it to buildings [18]. The
technical aspects which are still being researched on are the refrigerant piping cycle that needs a
perfect seal to maintain high or low pressures at different sections and to prevent air from being
sucked into the system. There is also a high risk that needs to be investigated of refrigerant
leakage and achieving a balanced refrigerant distribution across multiple coils which are installed
at large PV panel areas [18]. And the WPVT-system is already commercially available and capable
for building integration [34], but only the knowledge of maintenance and operation lack.
171.43
271.06292.05 303.84 294.91
276.79
166.00
116.26
245.64
364.46
409.18 423.84 409.18380.31
201.41
121.75
0.00
50.00
100.00
150.00
200.00
250.00
300.00
350.00
400.00
450.00
9 10 11 12 13 14 15 16
Po
we
r (W
)
Time (h)
Electrical Output
RPVT
WPVT

54
7 Conclusion and Recommendations
“Women like men should try to do the impossible.
And when they fail, they’re failure should be a
challenge to others.
—Amelia Earhart, 1939
(Aviation Pioneer and Author)
7.1 Conclusions
The PVT-system which can generate electricity and heat from solar energy is the main subject of
this study. The system can be categorized in different types of designs and the focus was lain on
the WPVT-system and the RPVT-system. This system has been investigated on its performance
for environment conditions in Suriname. For this investigation Marriott Hotel Paramaribo was
approached as a case study. The objective by implementing the system for Marriott Hotel was to
reduce the amount of energy used by the utility grid. The system was investigated for the VRF
cooling system and gas fired water heating system of Marriott Hotel. The PVT-system can be
mathematically analyzed by the Florschuetz model [17]. This model was written in Microsoft
Excel and used to analyze the performance of the PVT-system at steady state conditions. The
model was first tested on its validity by implementing research data of Gaurracino et al. [22] and
Ji et al. [23]. The output of the model validation was qualitatively analyzed by comparing the
performance of the system which indicated similarities. The model was then used to analyze a
WPVT and RPVT-application with the environment conditions of Marriott Hotel.
The electrical and thermal energy generated by the WPVT-system per panel are 435 Wh and 485
Wh. And the electrical and thermal energy output of the RPVT-system are 556 Wh and 1186 Wh.
The RPVT-system reached a higher overall performance compared with the WPVT-system, but
the RPVT-system also still has its technical limits which needs to be researched if it were to be
used for large appliances and building integration [18]. The electrical energy usage of Marriott
Hotel that can be covered by the WPVT-system is 26% and the thermal energy which can be
covered is 17%. And with the RPVT-system, 0.18% of the electrical energy can be covered and
43% of the thermal energy based on the research of this project. The WPVT-system could cover a
higher electrical demand and the RPVT-system could cover a higher thermal demand based on
the research of this project.
55
7.2 Recommendations
A study should be conducted for different PVT collector configurations with environment
conditions of Suriname. It should be noted that the one dimensional steady state
application is not qualified for other PVT collector configurations. The steady state one
dimensional approach in this qualified for the panel configuration mentioned in Chapter
4. But a two dimensional study is needed to analyze other panel configurations. And a
dynamical model is needed for an in depth performance analysis which includes the
temperature distribution analysis and an analysis of the instantaneous yield for dynamic
conditions [35].
Research on the yearly performance of a PVT-system should be conducted through a pilot
project, hereby better predicting the performance of the PVT-system for commercial
applications in Suriname. Through an experimental study more reliable data can be
obtained, which also could be used to study the technical barriers that exist with the RPVT
system.
The complete PVT-system needs to be analyzed that can lead to a more accurate approach
when executing an experimental research. The PVT-system also consists of a
compressor/pump, tank, valve, auxiliary heater and condenser.
Before implementing renewables it is important to investigate if possibilities exists to
reduce the overall energy usage of Marriott Hotel beforehand.
A study should be done on an economic assessment of the PVT-system. This can deliver
a full feasibility report of a PVT-system implementation for Marriott Hotel.
For a continuation of this study, factors such as the landscape, and wind speed differences
that have an effect on the sun irradiance should be included for the analysis of this project.
And irradiance data measured at Marriott Hotel should be used. The exact thermal
demand data of the water heater should also be included.
For this analysis of the RPVT-system the refrigerant R-22 is used. It is recommended that
a study is conducted with an environmental friendly refrigerant such as R134a or R-104
for conditions in Suriname. This study would support reducing the usage of products and
systems which have high environmental impacts such as global warming.
A study should be done to investigating if the possibility exists to directly apply the DC
wattage generated by the PVT panel to the VRF system of Marriott Hotel (which has a DC
compressor), hereby being able to cover more energy with the PVT system by eliminating
the use of inverters which cause electrical energy losses.

56
Appendixes
A Complete set Equations
In this appendix the complete set of equations used are given in table A.1. And the additional
equations needed to calculate the heat transfer coefficient of the refrigerant R-22 through the PVT
panel is given.
Equations to determine the Energy Performance
Electrical efficiency 𝑒𝑙
= 𝑇𝑟𝑒𝑓
(1 − 𝑟𝑒𝑓
(𝑇𝑃𝑉 − 𝑇𝑟𝑒𝑓 )) (1)
PV temperature 𝑇𝑝𝑣 = 30 + 0.0175(𝐺 − 300) + 1.14(𝑇𝑎 − 25) (2)
Thermal efficiency
𝑡ℎ= 𝐹𝑅
((1 − 𝑒𝑙
) − 𝑈𝐿 (
𝑇𝑖 − 𝑇𝑎
𝐺)) (3)
Heat removal factor (modified) 𝐹𝑅 =
��𝐶𝑝
𝐴𝑃𝑉 𝑈𝐿 (1 − exp (−
𝐴𝑃𝑉 𝑈𝐿 𝐹′
��𝐶𝑝
)) (4)
Collector efficiency (modified) 𝐹′ =
1 𝑈𝐿 ⁄
𝑊 [1
𝑈𝐿 [𝐷 + (𝑊 − 𝐷)𝐹𝑊𝐷
+1𝐶𝑏
+1
𝜋𝐷𝑖ℎ𝑓𝑖]
(5)
1st Fin efficiency 𝐹𝑊𝐷 = (1 −
𝐷
𝑊) 𝐹 +
𝐷
𝑊 (6)
2nd Fin efficiency
𝐹 =tanh (
𝑚(𝑊 − 𝐷)2 )
𝑚(𝑊 − 𝐷)/2 (7)
Dimensionless parameter
𝑚 = √𝑈𝐿
𝑘 (8)
Overall loss coefficient (modified) 𝑈𝐿 = 𝑈𝐿 −
𝑟𝑒𝑓
𝑟𝑒𝑓𝐺 (9)
Transmissivity-absorptivity product () =
1 − (1 − )𝑑
(10)
Transmissivity = 𝑎𝑟 (11)
Absorptivity = 1 − 𝑎 (12)
Reflectance 𝑑
= 𝑎 − (13)
Transmissivity considering absorption 𝑎 = 𝑒
−(𝐾𝐿
𝑐𝑜𝑠2) (14)
Transmissivity considering reflectance 𝑟𝑁 =
1
2(
1 − 𝑟1 + (2𝑁 − 1)𝑟
+1 − 𝑟||
1 + (2𝑁 − 1)𝑟||
) (15)
TABLE A1 Complete set of Equations for the energy performance of the PVT-system

57
Equations to determine the Energy Performance
Useful thermal energy 𝑄𝑢 = 𝐴𝑐𝐹𝑅 (𝑆 − 𝑈𝐿
(𝑇𝑖 − 𝑇𝑎) (16)
Electrical Output 𝑄𝑒 =
𝐴𝑃𝑉𝑆𝑒𝑙
[1 −
𝑟𝑟
𝑒𝑙(𝐹𝑅
(𝑇𝑖 − 𝑇𝑎) +𝑆
𝑈𝐿 (1 − 𝐹𝑅
))] (35)
Solar radiation per unit area 𝑆 = 𝐼𝑏𝑟𝑏()𝑏 + (𝐼𝑏𝑟𝑑 + (𝐼𝑏 + 𝐼𝑑 )𝑟𝑟)()𝑑 (17)
Modified solar radiation 𝑆 = 𝑆 (1 −
𝑒𝑙
) (18)
Beam reflection 𝑟𝑏 =
𝑐𝑜𝑠1
𝑐𝑜𝑠2
(19)
Diffusion reflection 𝑟𝑑 =
(1 + 𝑐𝑜𝑠)
2 (20)
Reflection of radiation 𝑟𝑟 =
(1 − 𝑐𝑜𝑠)
2 (21)
Refraction angle 2 = 𝑠𝑖𝑛−1 (𝑠𝑖𝑛
1
𝑛) (23)
Perpendicular reflection 𝑟 = (
𝑠𝑖𝑛2(2 − 1)
𝑠𝑖𝑛2(2 + 1)) (24)
Parallel reflection 𝑟|| = (
𝑡𝑎𝑛2(2 − 1)
𝑡𝑎𝑛2(2 + 1)) (25)
Reflection of radiation 𝑟 =
1
2(
𝑠𝑖𝑛2(2 − 1)
𝑠𝑖𝑛2(2 + 1)+
𝑡𝑎𝑛2(2 − 1)
𝑡𝑎𝑛2(2 + 1)) (26)
Angle of incidence 𝑐𝑜𝑠 = 𝑠𝑖𝑛(sin 𝑐𝑜𝑠 + cos cos cos sin)+ cos (cos cos cos − sin cos sin)+ (cos sin sin sin) (27)
Total energy efficiency 𝑡
= 𝑒𝑙
+ 𝑡ℎ
(28)
Declination angle
𝑛= 23.45 (sin (
360
365×
284
𝑛)) (29)
TABLE A1 (continued) Complete set of Equations for the energy performance of the PVT-system
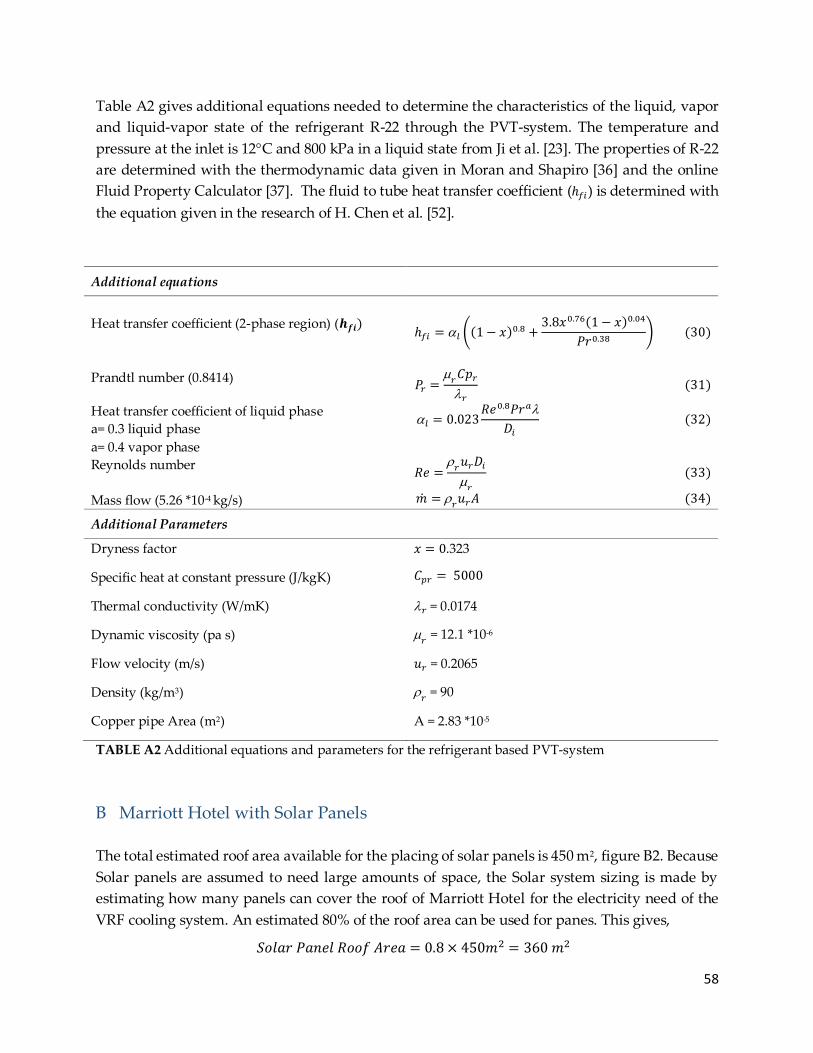
58
Table A2 gives additional equations needed to determine the characteristics of the liquid, vapor
and liquid-vapor state of the refrigerant R-22 through the PVT-system. The temperature and
pressure at the inlet is 12C and 800 kPa in a liquid state from Ji et al. [23]. The properties of R-22
are determined with the thermodynamic data given in Moran and Shapiro [36] and the online
Fluid Property Calculator [37]. The fluid to tube heat transfer coefficient (ℎ𝑓𝑖) is determined with
the equation given in the research of H. Chen et al. [52].
Additional equations
Heat transfer coefficient (2-phase region) (𝒉𝒇𝒊) ℎ𝑓𝑖 = 𝑙 ((1 − 𝑥)0.8 +
3.8𝑥0.76(1 − 𝑥)0.04
𝑃𝑟0.38) (30)
Prandtl number (0.8414) 𝑃𝑟 =
𝑟
𝐶𝑝𝑟
𝑟
(31)
Heat transfer coefficient of liquid phase
a= 0.3 liquid phase
a= 0.4 vapor phase
𝑙 = 0.023𝑅𝑒0.8𝑃𝑟𝑎
𝐷𝑖
(32)
Reynolds number 𝑅𝑒 =
𝑟
𝑢𝑟𝐷𝑖
𝑟
(33)
Mass flow (5.26 *10-4 kg/s) �� = 𝑟𝑢𝑟𝐴 (34)
Additional Parameters
Dryness factor 𝑥 = 0.323
Specific heat at constant pressure (J/kgK) 𝐶𝑝𝑟 = 5000
Thermal conductivity (W/mK) 𝑟 = 0.0174
Dynamic viscosity (pa s) 𝑟 = 12.1 *10-6
Flow velocity (m/s) 𝑢𝑟 = 0.2065
Density (kg/m3) 𝑟 = 90
Copper pipe Area (m2) A = 2.83 *10-5
TABLE A2 Additional equations and parameters for the refrigerant based PVT-system
B Marriott Hotel with Solar Panels
The total estimated roof area available for the placing of solar panels is 450 m2, figure B2. Because
Solar panels are assumed to need large amounts of space, the Solar system sizing is made by
estimating how many panels can cover the roof of Marriott Hotel for the electricity need of the
VRF cooling system. An estimated 80% of the roof area can be used for panes. This gives,
𝑆𝑜𝑙𝑎𝑟 𝑃𝑎𝑛𝑒𝑙 𝑅𝑜𝑜𝑓 𝐴𝑟𝑒𝑎 = 0.8 × 450𝑚2 = 360 𝑚2

59
From that is determined what amount of energy a system of that size can cover of the energy
demand from Marriott Hotel and if there is extra energy generated that can be sold to the grid.
The amount of solar panels that can be placed on that area are,
𝑆𝑜𝑙𝑎𝑟 𝑃𝑎𝑛𝑒𝑙 𝑅𝑜𝑜𝑓 𝐴𝑟𝑒𝑎
𝑃𝑉𝑇 𝑃𝑎𝑛𝑒𝑙 𝐴𝑟𝑒𝑎=
360𝑚2
1.36𝑚2= 264 𝑝𝑎𝑛𝑒𝑙𝑠
An illustration of how the panels can be integrated is given in this appendix. There must be noted
that more presentable methods need to be analyzed before implementing the panels, see figure
B2. The panels will be integrated with a tilt of 5 towards the southern direction. The Hotel has a
steep roof of 35, figure B1. The panels will have to be implemented with a construction below to
obtain the needed tilt of 5.
FIGURE B1 Marriott Hotels’ front view with the roof steepness given.

60
FIGURE B2 Marriott Hotel roof area (left) and the roof area available for solar panels (right) in dark blue.
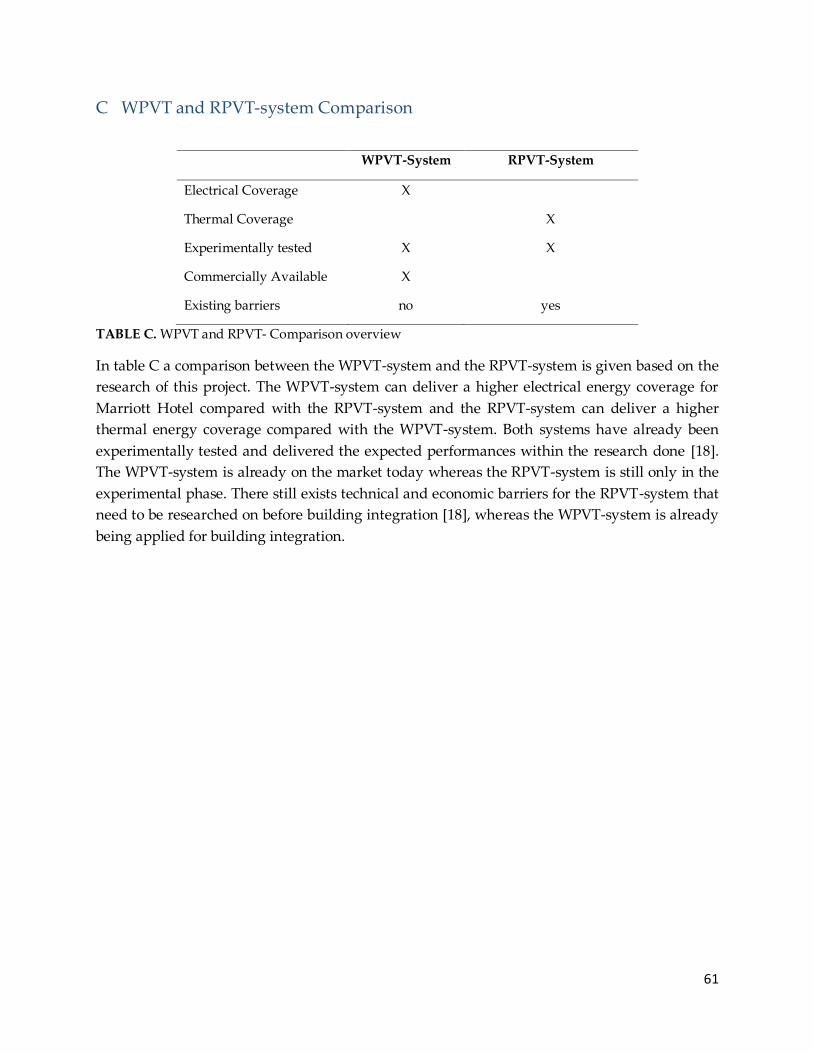
61
C WPVT and RPVT-system Comparison
WPVT-System RPVT-System
Electrical Coverage X
Thermal Coverage X
Experimentally tested X X
Commercially Available X
Existing barriers no yes
TABLE C. WPVT and RPVT- Comparison overview
In table C a comparison between the WPVT-system and the RPVT-system is given based on the
research of this project. The WPVT-system can deliver a higher electrical energy coverage for
Marriott Hotel compared with the RPVT-system and the RPVT-system can deliver a higher
thermal energy coverage compared with the WPVT-system. Both systems have already been
experimentally tested and delivered the expected performances within the research done [18].
The WPVT-system is already on the market today whereas the RPVT-system is still only in the
experimental phase. There still exists technical and economic barriers for the RPVT-system that
need to be researched on before building integration [18], whereas the WPVT-system is already
being applied for building integration.

62
References
[1] Naci Kalkan, E.A. Young, Ahmet Celiktas, Solar thermal air conditioning technology reducing the footprint
of solar thermal air conditioning, Renewable and Sustainable Energy Reviews 16 (2012), pp. 6352–6383.
[2] Qi Ronghui, Lu Lina, Huang Yu, Energy performance of solar-assisted liquid desiccant air-conditioning system
for commercial building in main climate zones, Energy Conversion and Management 88 (2014), pp. 749–757.
[3] Studying barriers to solar energy use in the significant four and five star hotels of Tehran, 2011, Armin Edelatnia,
Nakisa Zardoost, INSTROCT, Lulea University of Technology.
[4] Combined Photovoltaic and Solar Thermal (PV-T) systems; Design optimization and thermal annealing, 2013,
Frizo Huizinga, Utrecht University.
[5] T.T. Chow, A review on photovoltaic/thermal hybrid solar technology, Applied Energy 87 (2010) pp. 365–379.
[6] In april meer opwekcapaciteit voor EBS-centrale, StarNieuws, 10-03-2016.
http://www.starnieuws.com/index.php/welcome/index/nieuwsitem/34176?utm_source=www.hetnieuws.i
n&utm_medium=website&utm_content=suriname (Accessed: 11-03-2016).
[7] ICSU, ISSC (2015): Review of the Sustainable Development Goals: The Science Perspective. Paris: International
Council for Science (ICSU).
[8] SURINAME REPORT ON SIDS CONFERENCE 2014, July 2013, Ministry of Foreign Affairs, National
Institute for Environment and Development in Suriname (NIMOS).
[9] Marriott, 2016, Corporate Responsibilities: Environment, Our Environment Goals.
http://www.marriott.com/corporate-social-responsibility/corporate-environmental-responsibility.mi
(Accessed: 11-03-2016).
[10] Wet van 10 maart 2016, houdende vaststelling van regels betreffende elektriciteitsvoorziening, Elektriciteitswet
2016, S.B.2016 no. 42
[11] Budgetary of Natural Recources of Suriname, S.B. 2016 no.83. pp. 6-7.
[12] How Iamgold built a 5-MW solar plant in Suriname, CIM magazine, Kelsey Rolfe, 2015.
https://magazine.cim.org/en/2015/February/upfront/Sunny-days-ahead.aspx
(Accessed: 26-09-2016).
[13] Anual Report Staatsolie Maatschappij Suriname N.V., 2014.
[14] Specific Procurement Notice, 2014, Energiebedrijven Suriname, Institution: Inter-American Development
Bank. Project: Support to Improve Sustainability of the Electricity Service.

63
[15] Courtyard Marriott Hotel Paramaribo [Received data from: maintenance department; financial
department; executed measurements].
[16] Solar Opportunities in Suriname, Investment and Development Corporation Suriname, Mr. Imro San A
Jong, Deputy Director.
[17] L.W. Florscheutz, Extension of the Hottel-Whillier Model to the analysis of the combined Photovoltaic/Thermal
Flat Plate collector, Solar Energy, Vol. 22 (1978) pp. 361-366.
[18] X. Zhang et al., Review of R&D progress and practical application of the solar photovoltaic/thermal (PV/T)
technologies, Renewable and Sustainable Energy Reviews 16 (2012) pp. 599– 617.
[19] Rekha L et.al, Comparative analysis of single and multiduct air cooling in photovoltaic thermal hybrid system,
International Journal of Engineering and Technology (IJET), ISSN : 0975-4024 Vol 5 No 6 (2014).
[20] Popovici et al., Efficiency improvement of photovoltaic panels by using air cooled heat sinks, Energy Procedia
85 (2016) pp. 425 – 432.
[21] S. Bhattarai et al., Simulation and model validation of sheet and tube type photovoltaic thermal solar system
and conventional solar collecting system in transient state, Solar Energy Materials & Solar Cells, vol. 103 (2012),
pp. 184–193.
[22] I. Guarracino et al, Dynamic coupled thermal-and-electrical modelling of sheet-and-tube hybrid
photovoltaic/thermal (PVT) collectors, Applied Thermal Engineering (2016), doi: 10.1016/
j.applthermaleng.2016.02.056.
[23] Ji et al., Distributed dynamic modeling and experimental study of PV evaporator in a PV/T solar-assisted heat
pump, International Journal of Heat and Mass Transfer 52 (2009) pp. 1365–1373.
[24] H. Tsai, Modeling and validation of refrigerant-based PVT-assisted heat pump water heating (PVTA–HPWH)
system, Solar Energy 122 (2015) pp. 36–47.
[25] J.A. Duffie, W.A. Beckman, Solar Engineering of Thermal Processes, 4th edition, Wiley, New York, 2013.
[26] IEA SHC Task 35, Overview of PV/T products and projects, 2008.
[27] J. Ruschenburg et al., A Review of Market-Available Solar Thermal Heat Pump Systems A technical report of
subtask A, SHC, 2013.
[28] M. Herrando et al., Hybrid PV and solar-thermal systems for domestic heat and power provision in the UK:
Techno-economic considerations, Applied Energy 161 (2016) pp. 512–532.
[29] C. Brebbia et al., First International Conference on Sustainable Tourism, Sustainable Tourism, WIT Press,
2004.
http://green.hotelscombined.com/Gyh-The-Business-Case-For-Sustainability.php
64
[30] P. Haurant et al., A numerical model of a solar domestic hot water system integrating hybrid
photovoltaic/thermal collectors, Energy Procedia 78 ( 2015 ) pp. 1991 – 1997.
[31] Y Tripanagnostopoulos, Photovoltaic/Thermal Solar Collectors, Comprehensive Renewable Energy,
Volume 3 (2012), doi:10.1016/B978-0-08-087872-0.00308-5.
[32] T.T. Chow et al., Potential use of photovoltaic-integrated solar heat pump system in Hong Kong, Applied
Thermal Engineering 30 (2010) pp. 1066–1072.
[33] J. Allan, 2015, The Development and Characterisation of Enhanced Hybrid Solar Photovoltaic Thermal Systems,
School of Engineering and Design, Brunel University.
[34] C. Good et al., Hybrid photovoltaic-thermal systems in buildings – a review, Energy Procedia 70 (2015) pp.
683 – 690.
[35] H.A. Zondag, D.W. de Vries, W.G.J. van Helden, R.J.C. van Zolingen, A.A. van Steenhoven, The thermal
and electrical yield of a PV-thermal collector, Solar Energy Vol. 72, No. 2, (2002) pp. 113–128.
[36] J. Moran, et al. Fundamentals of Engineering Thermodynamics, 7th edition, Wiley, New York, 2011.
[37] Fluid Property Calculator, https://www.irc.wisc.edu/properties/ (accessed: 13-10-2016).
[38] The Barilla Solar Design Guide, Incorporates Renewable Heat Incentive, Solar Thermal Design Guide,
2011.
[39] Leading Edge Turbines Ltd t/as Leading Edge Power, England, Tilt Angles for Solar Panels,
https://www.leadingedgepower.com/shop/help-advice-faq/help-with-solar-panels/solar-panels-and-sun-
angles.html (accessed: 23-10-2016)
[40] S. Alakhramsing, (2012), Design, construction and experimental validation of a solar-water-heating-system for
an average family of five in Suriname, Technical Department, Mechanical Eng., Anton de Kom Universiteit
van Suriname.
[41] Department of electrical engineering, Technical faculty, Anton de Kom Universiteit van Suriname,
solar irradiance measurements from: April 2016.
[42] S. Sukhatme and J. Nayak, Solar Energy, Principles of thermal collection and storage, 3rd edition, Tata
McGraw-Hill, New Delhi, 2008.
[43] Solargis, http://solargis.com/ (accessed: 23-10-2016)
[44] S. Dubey et al., Temperature Dependent Photovoltaic (PV) Efficiency and Its Effect on PV Production in the
World A Review, Energy Procedia 33 (2013) pp. 311 – 321.

65
[45] D. M. Tobnaghi et al., The Effect of Temperature on Electrical Parameters of Solar Cells, IJAREEIE, Vol. 2,
Issue 12, (2013) pp. 2278 – 8875.
[46] Solimpeks Solar Energy Corporation, http://www.solimpeks.com/ (accessed: 26-10-2016)
[47] SmartClima, PVT Solar Panels, http://www.smartclima.com/solar-pvt-panel (accessed: 26-10-2016)
[48] Online Calculator | DC to AC amperage conversion run through an Inverter.
https://www.batterystuff.com/kb/tools/ac-to-dc-amperage-conversion-run-through-an-inverter.html
(accessed: 26-10-2016).
[49] C. A. Alrahman, (2015), Evaluation of a PVT Air Collector, Solar Energy Engineering, European Solar
Engineering School, Dalarna University Energy and Environmental Technology.
[50] Calculating Diffuse Radiation Values, Solar Radiation Monitoring Laboratory, University of Oregon,
http://solardat.uoregon.edu/DiffuseCalculation.html (accessed: 1-11-2016)
[51] HD Kambezidis, The Solar Resource, Institute of Environmental Research and Sustainable Development,
Athens, Greece (2012) Elsevier Ltd.
[52] H. Chena, S.B. Riffat, Investigation of a Hybrid Solar Heat Pump System, Procedia Engineering 21 (2011),
pp. 311 – 318.
[53] NREL, Renewable Resource Data Centre, Shining On, A primer on Solar Radiation Data,
http://rredc.nrel.gov/solar/pubs/shining/chap3.html (accessed: 11-1-2016)