sustaining free primary education and enrollment in … · especially mention william tsuma and...
TRANSCRIPT
~)iss Institute of Social Studies
Graduate School of Development Studies
SUSTAINING FREE PRIMARY EDUCATION AND ENROLLMENT IN KENYA
A R~search Paper presented by:
GEORGEYASHONOMBADO (KENYA)
In Partial Fulfi"ment of the Requirements for Obtaining the Degree of:
Master of Arts in Development Studies Specialization:
ECONOMICS OF DEVELOPMENT
Members of the Examining Committee: Dr. Arjun S. 8edi
Drs Jan van Heemst
The Hague, December 2004
This document represents part of the author's study programme while at the Institute of Social Studies; the views stated therein are those of the author and not necessarily those of the Institute.
Research papers and theses are not made available for outside circulation by the Institute.
Enquiries:
Postal Address: Institute of Social Studies P.O. Box 29776 2502 L T The Hague The Netherlands
Telephone: +31·70-4260 460 Telefax: +31-70-4260 799 email: [email protected]
Location: Kortenaerkade 12 2518 AX The Hague The Netherlands
Dedication
I dedicated this paper to my parents for their great support and humble upbringing for
past 28 years. In them have learnt a lot and this paper acts as one of the steps and
benefit generated from their teachings.
Thank you "baba" and "mama" Obadiah and Grace Okumu. May God bless you all and
may you live to see the fruits of your efforts.

Acknowledgements
First and foremost, I thank God almighty for the strength, ability and possibility to complete both this paper and the entire course. My biggest gratitude from the institute goes to my supervisors, Dr.Arjun Bedi for his comments generated from reading several of my draft which eventually went towards shaping the paper and Drs. Jan Van Heemst for his valuable comments during the seminar. Other appreciation goes to Prof Rob Vos and Dr.Jose' Cuesta for their comments and time to discuss the paper, Dr.Peter de Valk for his constant encouragement and Dr. Howard Nicholas for stimulating critical thinking during the entire course. Special thanks goes to Dr. Auma Okwany for her constant advice and encouragement during the entire program and for making Netherlands another home for me.
At ISS, I had an opportunity to establish good relationship with my colleagues; I would especially mention William Tsuma and Morro Camara since their presence was a motivating factor in completing my study. I also acknowledge, without mentioning names, the intellectual company of my ECD colleagues; it was a great experience to share lots of issues with you.
Outside ISS, I would particularly like to mention the emotional and spiritual support I got from my family- Debbie, Barnabas, Lilian, Benjamin, Askar, Robert and Evelyne- they all kept me going. Especially my sister Dr. Deborah Okumu and her children Grace Obuya and Jeremy Odero who reminded me of the need to hurry up. Among the family that I built in the Netherlands, I would like to whole-heartedly thank Auma Okwany and her son Nkinde Okwany, Rosanna and Mustapha, for providing me with a home and an environment to relax. Special thanks also goes to Ten Wolde family ('mama' and 'papa') for their unquantifiable hospitality. I will definitely miss their parental concerns and presences.
The very special thanks goes to Pauline Otieno Adala for her advice, motivation and in reinvigorating my ambition when I needed it most, especially towards the end of the course.
To my mother (Grace Okumu), this couldn't have been possible without you!
George Vashon Ombado December 2004
II

Table of content
CHAPTER ONE: Introduction ................................................................................................ 2
1.2 Justification and Significance ................................................................................................ 4
1.3.0 Statement of Problem .......................................................................................................... 5
1.3.1 Questions of Study .............................................................................................................. 6
1.4.0 Limitation and scope ........................................................................................................... 9
1.4.1 Data Source ......................................................................................................................... 9
1.4.2 Proposed Organization of the rest of the study ................................................................... 9
CHAPTER TWO: Theoretical Literature ............................................................................. 10
2.1.1 Back-ground in Economics of Education ......................................................................... 10
2.1.2 Governments Role on Education ...................................................................................... 11
2.1.3 Factors affecting schooling demand ................................................................................. 13
2.2.1 Analytical framework ....................................................................................................... 14
2.2.2 Empirical Specification /Methodology ............................................................................. 17
2.2.3 Data description and analysis: .......................................................................................... 19
CHAPTER THREE: Education enrollment trends and sustaining those enrollments ..... 20
3.1.0 Definitions as used in the paper: ....................................................................................... 20
3.1.1. Overview of enrollment ................................................................................................... 20
3.2.2 Education reform policy in Kenya: Historical Trends in Education sector •..................... 22
3.3.1 Challenges facing teaching ....................................................................................... : ....... 23
3.3.2. The Enrollment trend with introduction ofFPE .............................................................. 24
CHAPTER FOUR: Expenditure Analysis ............................................................................. 29
4. 1 Government's commitment as shown by expenditure ....................... ~ ................................ 29
4.2 Short comings of this commitment ...................................................................................... 33
CHAPTERFIVE: Malawi education system ........................................................................ 37
5.1 Challenges facing FPE in Malawi ........................................................................................ 39
5.2 How does Malawi finance FPE? .......................................................................................... 41
CHAPTER SIX: Policy recommendation .............................................................................. 45
Access: ....................................................................................................................................... 45
Financing .................................................................................................................................... 46
References: ................................................................................................................................ 48
Appendix ................................................................................................................................... 51

List of Tables
Table 2a Resource mobilization in education system 16
Table 3a The number of education institution in Kenya 23
Table 3b Projected values of enrollments after 2003 26
Table 3c Teachers Ratio 27
Table 4a Central Government % expenditure in social services(1998-2003) 29
Table 4.a.l Recurrent expenditure on levels of education 30
Table 4b Percentage expenditure on GDP 32
Table 4c Ratio of Government Expenditure to Revenue collection 36
Table 5a Enrollment trends after FPE 38
Table 5b Government Revenue as a % of GDP 40
Table 5c Grant to the government as a % of GDP 41
Table 5b Government expenditure on wages and salaries 43
List of Figures
Figure la Gross Enrollment Rates 1990-2003 2
Figure Ib Percentage of Teachers in Service Between 1993-2003 8
Figure 2a Average cost against enrolment rate 15
Figure 3a GER after FPE per province 28
Figure 4a Primary recurrent Expenditure 1993-1998 31
Figure 4b Primary Education Expenditure as % of Governments expenditure 31
Figure 4c Central Governments Recurrent Expenditure on social services 33
IV

AIDS
DFID
EFA
FPE
GABLE
GER
GNP
GDP
HIV
IMF
K.C.P.E
KIPPRA
KNUT
MDG
MoE
MOEST
MoH
MoRA
MTEF
PEAP
SAP
UPE
WMS
ACRONYMS
- Acquired Immune Deficiency Syndrome
-Department For International Development
- Education For All
- Free Primary Education
- Girls Attainment in Basic Literacy and Education
- Gross Enrollment Rate
- Gross National Product
- Gross Domestic Product
- Human Immunodeficiency Virus
- Interriational Monetary fund
- Kenya Certificate of Primary Education
- Kenya Institute of Public Policy Research and Analysis
- Kenya National Union of Teachers
- Millennium Development Goal
- Ministry of Education
- Ministry of Education Science & Technology
- Ministry of health
- Ministry of Home Affairs, National Heritage and Sports
- Medium Term Expenditure Framework
- Poverty Eradication Action Plan
- Structural Adjustment Programmes
- Universal Primary Education
-Wealth Fare Monitory Survey
v

SUSTAINING FREE PRIMARY EDUCATION AND ENROLLMENT IN KENYA
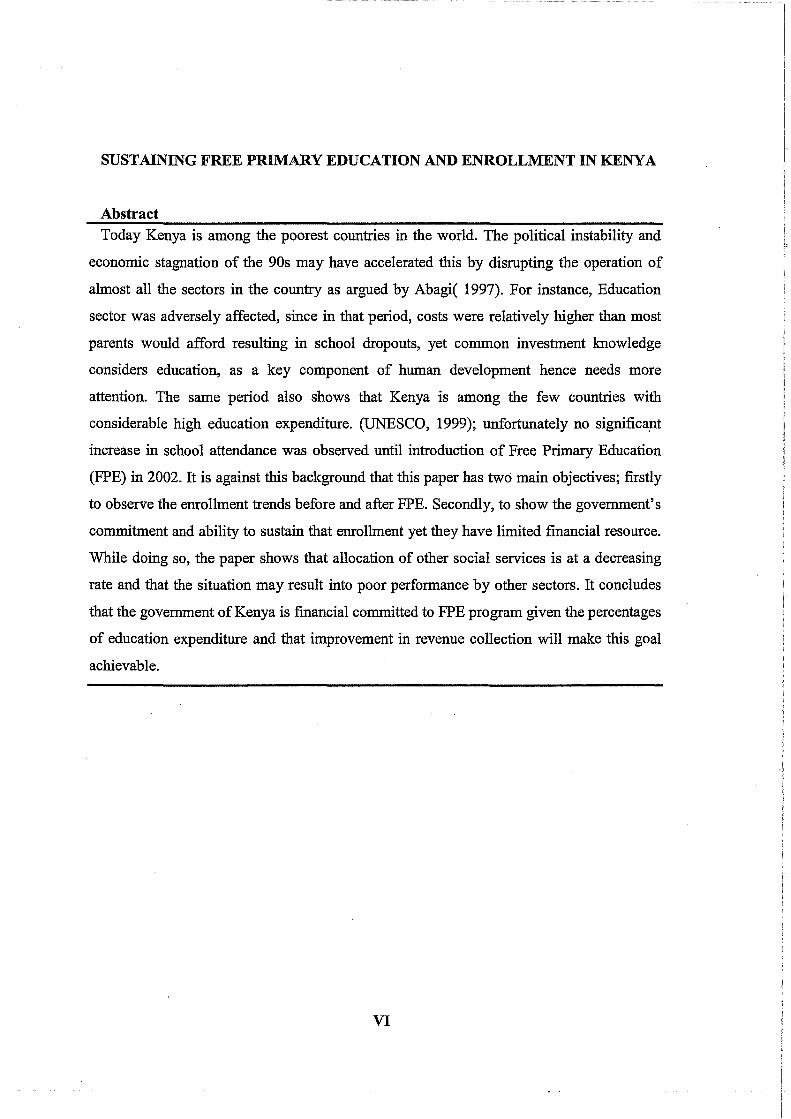
Abstract Today Kenya is among the poorest countries in the world. The political instability and
economic stagnation of the 90s may have accelerated this by disrupting the operation of
almost all the sectors in the country as argued by Abagi( 1997). For instance, Education
sector was adversely affected, since in that period, costs were relatively higher than most
parents would afford resulting in school dropouts, yet common investment lmowledge
considers education, as a key component of human development hence needs more
attention. The same period also shows that Kenya is among the few countries with
considerable high education expenditure. (UNESCO, 1999); unfortunately no significa:nt
increase in school attendance was observed until introduction of Free Primary Education
(FPE) in 2002. It is against this background that this paper has two main objectives; firstly
to observe the enrollment trends before and after FPE. Secondly, to show the government's
commitment and ability to sustain that enrollment yet they have limited financial resource.
While doing so, the paper shows that allocation of other social services is at a decreasing
rate and that the situation may result into poor performance by other sectors. It concludes
that the government of Kenya is financial committed to FPE program given the percentages
of education expenditure and that improvement in revenue collection will make this goal
achievable.
VI

CHAPTER ONE: Introduction
At Kenya's independence in 1963, priorities in education sectors were directed towards
expansion of higher education due to demand for skilled personnel from vacancies left by the
British government. (Abagi, 1999) After that it was clear that access to primary education was
becoming an important means of gaining employment since few people had either basic or
higher education. With that kind of need, demand for primary education has been changing,
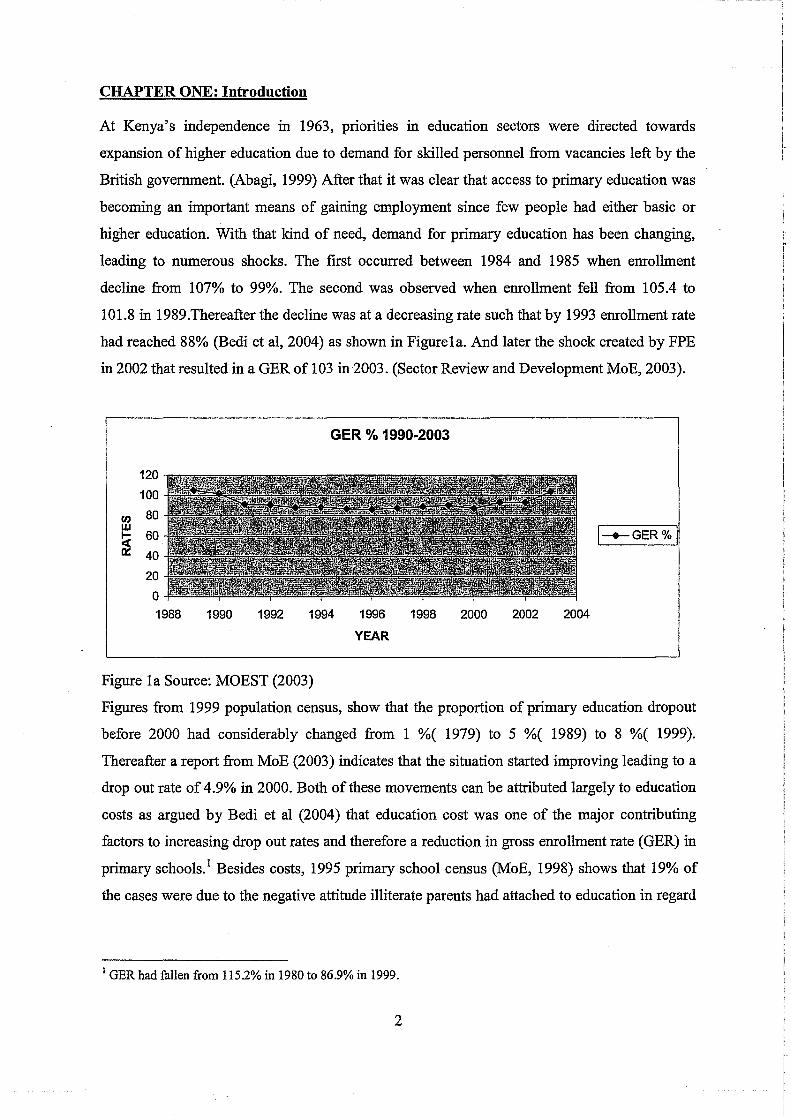
leading to numerous shocks. The first occurred between 1984 and 1985 when enrollment
decline from 107% to 99%. The second was observed when enrollment fell from 105.4 to
101.8 in 1989.Thereafter the decline was at a decreasing rate such that by 1993 enrollment rate
had reached 88% (Bedi et aI, 2004) as shown in Figure1a. And later the shock created by FPE
in 2002 that resulted in a GER of 103 in 2003. (Sector Review and Development MoE, 2003).
GER % 1990-2003
120
100
en 80 w
i 60
40
I-+-GER%I
20
0 1988 1990 1992 1994 1996 1998 2000 2002 2004
YEAR
Figure la Source: MOEST (2003)
Figures from 1999 population census, show that the proportion of primary education dropout
before 2000 had considerably changed from 1 %( 1979) to 5 %( 1989) to 8 %( 1999).
Thereafter a report from MoE (2003) indicates that the situation started improving leading to a
drop out rate of 4.9% in 2000. Both of these movements can be attributed largely to education
costs as argued by Bedi et al (2004) that education cost was one of the major contributing
factors to increasing drop out rates and therefore a reduction in gross enrollment rate (GER) in
primary schools. 1 Besides costs, 1995 primary school census (MoE, 1998) shows that 19% of
the cases were due to the negative attitude illiterate parents had attached to education in regard
1 GER had fallen from 115.2% in 1980 to 86.9% in 1999.
2

to what they were able to observe as an immediate benefit to education. This shows that school
demand factors have different dimensions.
It is under this scenario of decreasing enrollment that the government pledged to increase
education accessibility through introduction of FPE. I illustrate in the paper that the FPE
program went through financial difficulties as shown by change in 2003 expenditure pattern
when it was implemented by the newly elected administrative government of Kenya. And that
it was one of their fundamental pre-electoral pledges that contributed to their victory in
December 2002 general election. I would rightfully imagine that they didn't carefully consider
its implication on 2002-3 government budget constraints and logistical challenges involved.
This thought is supported by the fact that their adjustments weren't reflected in the government
budget yet the number of teachers had to be increased, more building structure needed to be put
in place to cater for expected increase school enrollment?
Adoption of FPE policy is therefore assumed to increase enrollment but this requires
substantial financial resources and management. I look at the public expenditure trends in
general on education and later that portion allocated to primary education. While I don't relate
expenditure to enrollment, I focus on both trends as a means of understanding education
expenditure patterns and the government's ability to meet the population needs on schooling
demand given their limited resources. This is important as it seeks to show the adjustments the
government has made in its overall expenditure given their limited revenue bracket. And such
expenditure is directed to public than private schools despite the fact that both have a role in
educating the population. The other reason of focusing on public schools is based on the fact
that there aren't sufficient data to enable me study private schools.
In explaining public expenditure on education and enrollment rates, I use Malawi to later draw
lessons on how they tackled FPE challenges. The two countries are similar in the following
ways: the FPE was introduced out of election pledge and that both lacked a comprehensive
policy framework that examined resources and included key stakeholders in its formulation,
both experienced an upsurge in enrollment in the initial phase of the program accompanied by
2 To avoid a crisis, the government opted to adjust its budget under emergency expenditure approval from parliament to cover the cost of teaching materials in the first six months in to FPE program (before end of financial year in June). This was a short-term remedy while the country needed commitment that would be continuous and sustainable.
3
overcrowded classrooms and inadequate teaching resources ... And while Kenya's case was
government driven Malawi's was donor driven. The manner in which Malawi managed FPE
for 10 years is useful as explained later on in the paper:
The study therefore focuses on the government's education expenditure pattern before and
after FPE and also analysis of primary schools enrollment trends. The next part of the paper
lays out the reasons for undertaking this study.
1.2 Justification and Significance
The debate on FPE in Kenya has generated a lot of controversy with a number of people
doubting the government's ability to continue with the program. This is made difficult by the
fact that while the government declared free and compulsory primary education, school
administrators argue that this is not possible unless the governments provide enough funds,
they will still impose certain charges on students. Inability to supply adequate funds will
therefore adversely affect the operation of most schools, which still depends on the
government. This is study is important, as it shows the proportion of budgetary allocation
adjustments as a result of FPE program.
In the ideal case, high education expenditure should lead to increased enrollment since more
resources are now available. For Kenya, less time was allocated to understand the needs of
school and government expenditure patterns. The paper will show an indicative sign of FPE
effectiveness in increasing school attendance if education expenditure is increased and the
government's ability to sustain this expenditure increase. This is important for policy makers,
as they can modify FPE policies if it seems not to increase enrollment. In that case,
restructuring government education expenditure is necessary.
Besides, Kenya is among the countries that committed herself to the provision of Education
For All (EFA) by 2015 and providing free and compulsory primary education was one of the
six goals used to guide countries in achieving EF A. This paper through the initial effect of FPE
on enrollment and expenditure pattern will indicate the direction the government is moving
towards achieving the Millennium Development Goal, (MDG). Hence other nations can use it
as a guide on effect ofFPE on education for all goals.
4
Lastly, source of funds can affect the long-term achievement of the program. Studies done by
Hillman and lenlmer (2000) in IMP working paper show that those countries that have been
identified as unlikely to achieve UPE completion have relatively low shares of goverriment
revenue to GDP. Kenya is among the countries with increasing shares of revenue to GDP as
shown later in the paper. This can translate into improvement on expenditures without
depending on the donors. The paper will therefore show revenue collection as a percentage of
GDP on both countries and also the percentage of grants they receive. And the proportion of
government expenditure on education to other sectors will determine sustainability of the
program. If donors are the major's contributors then their withdrawal will affect continuity of
the program. Analyzing government expenditure would also be of interest to donors; they will
be encouraged to invest in a program if the government is financially committed. A low tax
base can also affect the government's expenditure pattern (Adam, 1992) hence studying both
expenditure and revenue will be of great importance when looking at the government's ability
to continue with the program.
1.3.0 Statement of Problem
In 1988, the government began implementing SAP package; introducing cost sharing in basic
education with the hope that the government's revenue structure will improve. (Abagi, 1997b)
The ability of the governments to spend depends on how "much revenue it is able to collect.
However, education expenditure pattern has been consistent despite poor economic
performance and poor revenue collection before 2002.This changed in 2003, after the
government abolished user fee in primary schools and Kenya Revenue Authority (K.R.A)
began improving on it revenue collection. This increase can be made feasible if revenue is well
collected.
For instance, previous World Bank advice on total expenditure reduction implied that the
government had to restructure its overall expenditure. This reduction will affect the
government's ability if education sectors budgetary allocation is also reduced. Hence achieving
UPE by 2015 through FPE would be an uphill task. Especially, given the fact that the country
has been affected in the recent past by inadequate social and economic infrastructure in
revenue collection and expenditure this is shown by chronic fiscal deficits. (Abagi, 1997b)
Therefore a combination of poor economic performance and FPE is expected to increase the
overall government expenditure unless the government seeks assistances elsewhere.
5
One would expect, given the theoretical lmowledge of public expenditure on education
explained later in the paper, that emollment rates would improve as a result of increased
expenditure and availability of more resources before FPE. 3 Yet studies done by Kimalu et al
(2000) show that even with increase expenditure, emollment trends are still low. It is against
this that the governments set a target of 15% increase in primary school emollment between
1999-2005 as shown in the Poverty Eradication Action Plan (PEAP). Of importance to this
paper is understanding that the government is able to achieve this through increased budget.
1.3.1 Questions of Study
Overall question: What are the initial impacts of FPE on primary school emolment?
Subsidiary questions: Analyze FPE program in terms of the government· expenditure and
financial sustainability given their limited resources. What lesson can Kenya learn by
comparing her experience with that of Malawi in respect to FPE?
1.3.2 Challenges ofFPE
Primary education in Kenya has faced a number of shortcomings ranging from declining
resources allocation from government total expenditure as compared to secondary and
university levels to the following factors: increasing gender disparity (MOE, 2000) where in
2003 the sex ratio was 106:100(Economic Survey, 2004) and such imbalance according
Okwany (2004) is as a result of lack of a national gender policy, which manifest itself in high
repetition, drop-outs and poor performance among girls; Under emollment of handicapped
children who need special attention, (Karugu et aI, 1995) this is because there are few
specialized schools and few specialized trained teachers. In addition to the above challenges,
empirical studies on determinants of schooling decisions in Kenya and other developing
countries indicate that household income and wealth demand for labour, distance to school,
parental education and monetary costs plays a key role. (Bedi et aI, 2004; Matovu & Era,
2002).
3 Public expenditure on education was estimated at 28% of total government expenditure between 1991-2000 see Bedi et aI, 2004. Though the amount may be sufficient, poor management and targeting didn't yield the expected results.
6
In to regard to HIV/AIDS, one cannot ignore the fact that it tends to increase health
expenditures and therefore reduce overall household income. But this is not largely the reason
thal led to low enrollnienfsince studies done by Bedi etal (2004)didnof find a relationship
between HN prevalence rates and enrollment rates. Instead we accept the fact that it reduces a
household education purchasing power and also that frequent illness will lead to household
demanding less of schooling time.
The main areas of concern in this paper are; firstly, quality of education is adversely affected
when demand for schooling increases yet this doesn't match with the resources available. For
instance, according to the ministry of Education, the initial increase of an estimated 1.5 million
children previously not in school as at 2002 are believed to have led to overstraining of
resources as classes were now extremely full.
Secondly, the distribution of education should be relatively equal. Though one cannot ignore
the role played by teachers in educating students, less fund allocation to education in-put such
as textbooks and desk will have an effect on education outcomes. Even before introduction of
FPE teacher's remuneration received a higher portion of overall education expenditure.
Between 1992 and 1997 primary education received 55% of the total recurrent expenditure out
of which 97% went teacher's remuneration (Okwach, 1997). This might have today changed
given the fact that more textbooks were purchased after introduction of FPE. The large
numbers of primary school teachers whose average earning was increased by more than 100%
in 1997 makes the situation worse. A report from MOEST (2003) after teacher's salary award
reveals that teachers average earning is 6.7 times larger than GDP per capita. Their high
average earning and large numbers especially of primary school teachers makes the teacher's
wage-bill larger than a poor country like Kenya can sustain. On average primary school
7
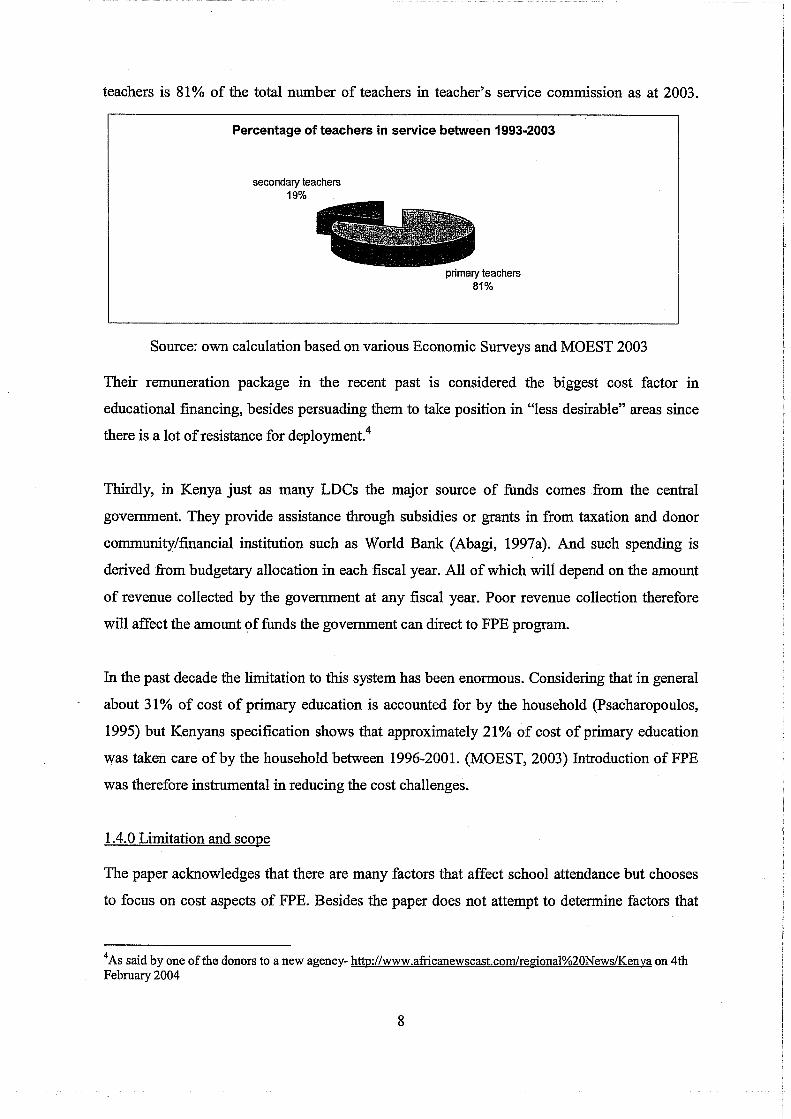
teachers is 81 % of the total number of teachers in teacher's service commission as at 2003.
Percentage of teachers in service between 1993-2003
secondary teachers 19%
primary teachers 81%
Source: own calculation based on various Economic Surveys and MOEST 2003
Their remuneration package in the recent past is considered the biggest cost factor ill
educational financing, besides persuading them to take position in "less desirable" areas since
there is a lot of resistance for deployment.4
Thirdly, in Kenya just as many LDCs the major source of funds comes from the central
government. They provide assistance through subsidies or grants in from taxation and donor
community/financial institution such as World Bank (Abagi, 1997a). And such spending is
derived from budgetary allocation in each fiscal year. All of which wiI1 depend on the amount
of revenue collected by the government at any fiscal year. Poor revenue collection therefore
will affect the amount of funds the government can direct to FPE program.
In the past decade the limitation to this system has been enormous. Considering that in general
about 31% of cost of primary education is accounted for by the household (psacharopoulos,
1995) but Kenyans specification shows that approximately 21% of cost of primary education
was taken care of by the household between 1996-2001. (MOEST, 2003) Introduction of FPE
was therefore instrumental in reducing the cost challenges.
1.4.0 Limitation and scope
The paper acknowledges that there are many factors that affect school attendance but chooses
to focus on cost aspects of FPE. Besides the paper does not attempt to determine factors that
4As said by one ofthe donors to a new agency- http://www.africanewscast.com/regional%20News/Kenya on 4th February 2004
8

affect school attendance but uses previous studies to show that finance is the major factor
affecting attendance. It also assumes that finance plays a key role in FPE success hence worth
analyzing. The results are not conclusive but will help in observing the direction of the
program.
It places more emphasis on public schools than private schools since the government's
expenditure is largely directed towards public schools. Hence the study excludes private
schools expenditure since their data's are readily available. But more can still be done at a
future date to ~nd out the impact of FPE on private schools.
1.4.1 Data Source
In order to provide evidence to answ~r these questions, the research uses a comparative
analysis of Malawi's experience and also Ministry of Education and strategic policy
documents, economic surveys, the government budgetary allocation to education in 200312004
and 2004/2005 and statistical abstract 2002. Documents written by Kenya Institute of Public
Policy Research and Analysis (KIPPRA), World Bank, UNESCO statistical yearbook & World
Education Reports, Malawi's study will also prove handy in this paper especially for policy
recommendation.
1.4.2 Proposed Organization of the rest of the study
In setting off to accomplish what has been proposed in this chapter, the following brief 'outline
will be adhered to: Chapter One, general introduction of study with its justification and
challenges facing primary education. Chapter two will focus on theoretical literature by
providing some of the determiners of sCllooling, theory and nature of data used in this study.
This chapter will also provide a economic background of education financing; provide a model
specification and lastly indicators of schooling in the data descriptions. The third will focus on
structure, background and reforms in education system, and the government's role. And mainly
show aspects of enrollment and it sustainability .The fourth chapter seeks to show the financial
capability of the government in supporting the program by looking at expenditure and revenue
trends. The fifth chapter highlights specific challenges that Malawi has encountered and how
they have managed to solve it. While the last chapter will recommend the policy that the
government can adopt given the following results and lessons learnt from Malawi.
9
CHAPTER TWO: Theoretical Literature
2.1.1 Back-ground in Economics of Education
Education is often considered, as an engine to economic growth and as a means towards trying
to improve the productivity of a nation. It is in this respect that early classical economists had
the view that principles in education investment are similar to those principles used in physical
capital investment. (Lourdes, 2002) Its inclusion therefore in National development planning is
essential as it plays a key role in improving production and human resource development.
(Forojalla, 1993) This is referred to as technical progress since education is among the other
production factors such as physical capital, natural resources and labour. And while referring to
Solow (1957), Fotojalla (1993) states that education accounts for 90% of total production. And
that human capital theories show that formal education is essential in improving production
capacity of the population. Hence the role-played by education in provision of skills,
knowledge and technology towards production cannot be ignored. Economist such as Schultz
(1963) and Becker (1964) asserted that an educated nation is a productive nation. Yet lack of
financial resource can become an impediment in acquiring it. As shown by World Bank, 2001
that many countries in Africa have performed poorly since 1988 due to reasons such as less
financial resources in education system and thus limitation in education access. In addition to
that, Africa is the only region where the numbers of children out of school has been increasing.
The importance of these relationships is affirmed by the several attempts in the early 90s to
estimate the total public cost of Universal Primary Education (UPE) in developing countries.
(Delamonica et aI, 2003) One of the results in those studies shows that achieving GER of 100
would require increased public expenditure. (Colclough, 1993) It is in this regard that I would
say that achieving UPE through FPE in specific countries and globally require an assessment
of financial capabilities and resource mobilization. And that the relationship between education
spending and economic conditions is important but not as simple as one might tend to imagine.
However GER may not be the best indicator or gauge of success but in a way it shows the level
in which government utilize its resource.
10
Its success can therefore be shown by net enrollment rates, (NER)s which more often than not
is not easy to calculate· in a number of developing countries due to lack of age data on those
children attending school, this encourages projections. Besides the indicators, in cases where
the demand side influences school enrollment through low returns due to social and
geographical rigidity, and social norms that discriminate against girls or through opportunity
cost, free access to publicly financed school will not adequately induce parents to send their
children to school. (Hillman, A & Jenkner, E 2004) These distortions show that education is
not an ordinary public good that should be subjected to free market forces. This is because an
ideological justification of a free market requires that we exercise choice when demanding for
education just as when buying a car or food. Yet this disguises the fact that choice is possible
only when we have a purchasing power.
It is in this regard that Ravallion et a1 (1999) asserts that public expenditure can only be
effective in its objective if the policy settings are right. For instance the policy of the
government expenditure should be guided by the type of good or service it tends to support.
And that majority of failure in the system is usually attributed to poor policy setting. They
further argue that it is hardly worth increasing spending in primary schools if there are other
distortions that prevent children from going to school other than cost- with out tackling those
distortions. For them Pro-poor expenditure needs to be accompanied by pro-poor policies.
Though this paper recognizes the importance attached to program benefits I have focused on
the ability of the system to achieve that benefit.
2.1.2 Governments Role on Education
The amount to invest in primary education by the state depends on economic, political and
social benefits associated with it results. This investment often yields economic returns at a low
pace with a combination of other assets. (Tomasevski, 2003) However being a public good, it
is assumed that the policy decision of the government to invest in education is based on social
welfare objective.6 And such investment decision should emerge from cost effective objective
through analyzing both the government revenue and expenditure. Given that the government
has the sole responsibility of providing education.
5 Attendance rate may be the best measurement since it is more accurate than enrollment rate. However attendance rates are rarely measured in most countries. Hence we opt for the second best (NER) 6 This is a function oftotal sum of individual welfare.
11
The state needs to provide free access to public financed primary schools where the numbers of
children from poor households are high. In some countries an inadequate public expenditure
management system prevents them from receiving basic education. It is under this background
that some researchers blame the government for the low enrollment and education attainment.
(Hillman and Jenkner, 2002). To them the government inability to supply sufficient resources
for primary education affects its demand. And the recommended public funding for education
coverage is estimated at 5-7 per cent of the GNP of any country. (Tomasevski, 2003) In this
case, lack of a collective specific figure does not undermine the belief that public investment in
education is necessary but emphasizes the need to ensure that education spending receive
adequate funding.
Based on this argument one can conclude that the budgetary allocation for education to GDP
will reflect a countries commitment and not ability in achieving FPE. For instance, countries
that put more priorities on the military and other sectors are often considered as lacking
commitment to educate their population, especially if their education system is notably weak
and inaccessible. This doesn't reflect inability to support the program but shows what the
governments considered as important to their day-to-day operations. As for Kenya, more
emphasis on public spending is placed on education as shown by the world Education report
2000 where Kenya is among the top countries with a higher percentage of public spending on
education in relationship to GNP. This is later confirmed in this paper. Unfortunately this is not
reflective of her education performance since enrollment trends have been declining until
introduction of FPE. And the ratio of government expenditure to education is also said to be
increasing with an existence of a small decreasing changes in enrollment trends before FPE.
The government should therefore ensure that this spending is directed to items that would
accelerate enrollment. Accordingto Abagi, (1997b) at end of 1996, the GoK was spendirig 42
times as much for a university student to a primary pupil.7Implying that the amount spent on
each university student would be enough to enable 41 pupils attendance primary school a year.
It is in this regard that Tomasevski, 2003 argued that diminished spending would lead to
exclusion of poorer students from schools. In order to increase accessibility and eventually
eliminate education patterns that promote social inequalities, the government has a duty to
reduce the cost of education. This will enable those who enroll in schools have opportunities
7 The ratio given is 1:3:42 primary, secondary and university at a price in ksh. Of2,774, 9418 and 115,812 per year respectively.
12

and capabilities to improve their well-being and later creates a productive and independent
society. All that will go towards accumulating human capital. While I aclrnowledge the
government's responsibility of ensuring that its population is educated, my reservations are
directed towards how effective will abolition of user fee improve the education system in
primary level.
2.1.3 Factors affecting schooling demand
Primary education demand is often a complex issue since it is determined by many factors. fu
order to appreciate this statement, one needs an in-depth study of numerous factors affecting
schooling demand. fu my case, I will list a few of the core factors responsible for schooling
demand but I aclrnowledge that each exert a different effect on success of schooling. And
though a country's success in education can be measured in several ways, I will focus on
school enrollment and attendance ratios as asserted by Bedi et al (2001) to be the commonest
indictors to measure this success.
As a start, I consider cost of education since it affects the decision of a parent to send a child to
school. The parents will demand more schooling if they are able to pay for costs such as books,
school fees and transportation to and from school. fu cases such as poor households, an
elimination of user charges will not easily create schooling accessibility or demand, especially
if schooling will deny the household member from contributing towards the total household
income through child labour. This shows that FPE can only increase attendance up to a certain
limit.
Secondly, parents are often stimulated to send their children to schools that are considered
successful. This is measured by the annual results obtained in K.C.P.E test score. fu fact a
number of studies have tried to show a relationship between the type of school and decision of
parents to invest in a Child's education. (Becker 1964; Bedi and Marshall, 2000) fu these
cases, good schools often attract a large number of students. Unfortunately results show that
such decisions are often made at the higher level of education and where individuals aren't
only willing to go to school but that they are able to afford their choice. In my case, parents are
in need of quality education but they have a weaker purchasing power for education.
13
Thirdly household characteristics such as household income, parents education, occupation,
and how they perceiye schooling attendance and outcome affects the decision on whether a
child should attend school or not. Such that high income households and educated household
are likely to send their children to school than those with low level of income and lower
education. (Behrman, 1987) There are still many other factors affecting schooling but the three
above are sufficient enough in provided background on primary education system in my case.
2.2.1 Analytical framework
A number of countries especially in sub-Saharan Africa have found it difficult to allocate
sufficient resources to public schools. A situation, though complex, is often blamed on socio
economics difficulties (Gibbon 1996). One of the fundamental issues in this paper is that many
children will be excluded from school as shown in the previous chapter if user fee are not
abolished or if there are insufficient resources allocated to schools. An analysis by Hillman
(2003) show that if costs are assumed to be fixed, the average costs of enrolled students to
class is reduced which therefore implies that no child should be excluded from school for the
reason that costs is extremely high. And though the tuition fee is often constant, other costs
will vary with the number of enrollment. For instance, costs contributed by parents for
construction will reduce when the number of enrollment increases, as such cost can change
from time to time. Before free education is introduced user fee is used to cover additional costs
and it assumes that a decline of school fee result in more parents sending their children to
school.
From figure 2a below, "dd" shows parent's education demand for their children and n for total
number of children attending school if attendance was compUlsory and financed by the
government. And A.C is the average costs of schooling. This implies that given that the tuition
cost (T.C) are fixed at T, an increase in the number of students enrolled would lead to a
reduction in A.C. but only up to a certain number of students, in this case n. There are only 'n'
students that can be accommodated in a classroom.
14
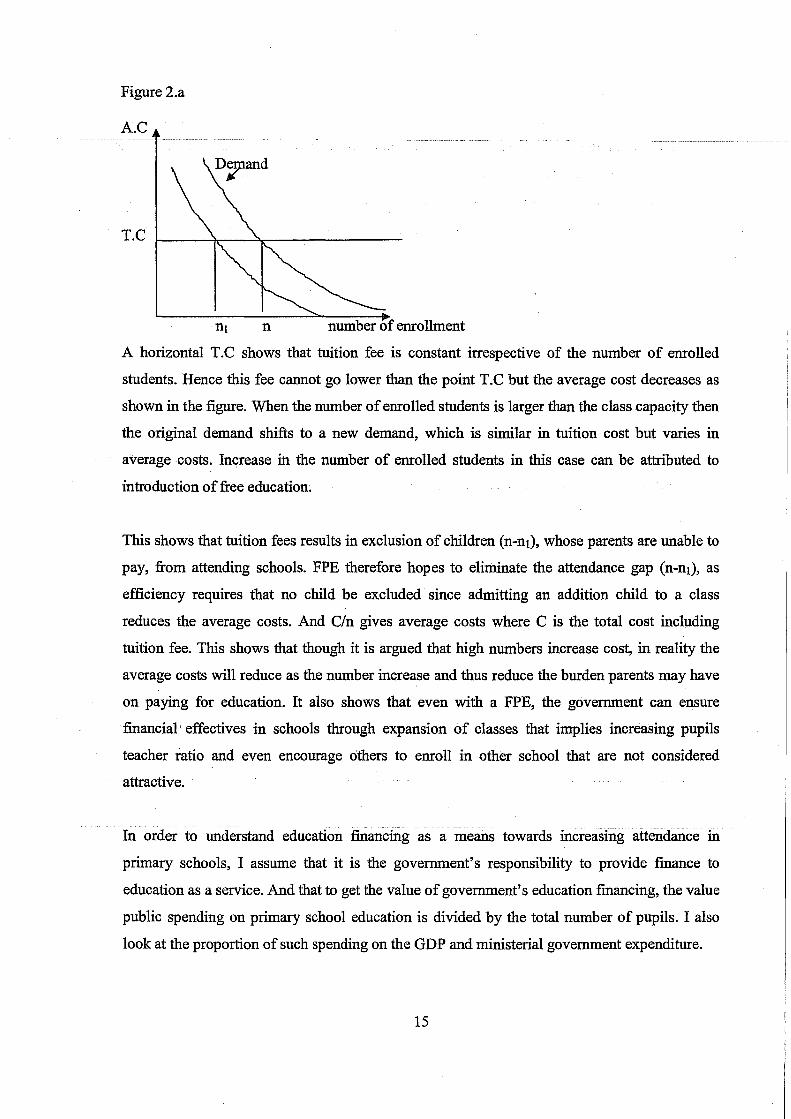
Figure 2.a
A.C
T.C
n number of enrollment
A horizontal T.C shows that tuition fee is constant irrespective of the number of enrolled
students. Hence this fee cannot go lower than the point T.C but the average cost decreases as
shown in the figure. When the number of enrolled students is larger than the class capacity then
the original demand shifts to a new demand, which is similar in tuition cost but varies in
average costs. Increase in the number of enrolled students in this case can be attributed to
introduction of free education.
This shows that tuition fees results in exclusion of children (n-nl), whose parents are unable to
pay, from attending schools. FPE therefore hopes to eliminate the attendance gap (n-nl), as
efficiency requires that no child be excluded since admitting an addition child to a class
reduces the average costs. And C/n gives average costs where C is the total cost including
tuition fee. This shows that though it is argued that high numbers increase cost, in reality the
average costs will reduce as the number increase and thus reduce the burden parents may have
on paying for education. It also shows that even with a FPE, the government can ensure
financial effectives in schools through expansion of classes that implies increasing pupils
teacher ratio and even encourage others to enroll in other school that are not considered
attractive.
In order to understand education financing as a means towards increasing attendance in
primary schools, I assume that it is the government's responsibility to provide finance to
education as a service. And that to get the value of government's education fmancing, the value
public spending on primary school education is divided by the total number of pupils. I also
look at the proportion of such spending on the GDP and ministerial government expenditure.
15

This financing can therefore be done in a number of ways as shown in table 2a. Where Donor
assistance involves contribution of donors to developmental budget thus increase developments
expenditure. Where as school projects involves Parents Teachers Association (PTA) funds
being used for hiring teachers and building new class room among many other purposes. In
case of community financing, the people living in the area next to a school can contribute
money towards building structures, towards hiring qualified personnel in the community to
offer their teaching services to the school at a minimal fee. This reduces the burden the school
can have on hiring teachers from TSC who may even be unwilling to be deployed in those
schools.
Table 2a: Resource mobilization in education system
Provider of education MOE; Public schools
Financing options Taxes Donor School Community User
-Fiscal assistance projects assistance charges
budget
Source: own interpretation of financing policy of the government
However, I do acknowledge that the community plays a minor role in education financing. But
many people recognize that fiscal budgeting and user fee plays a major role in education
financing (Colclough, 1997). This is often true since the most governments are the sole
financiers of primary education and thus able to decided on the amount of user fee or whether
they should face it out completely. And that this decision will also affect the enrollment trends
since most parents would act on such a policy. Therefore introduction of FPE implies that
education system will have to depend on fiscal budget, community assistance and donor aid.
This paper will focus on the fiscal budget since it is the main contributor of education
financing. Besides that it is the only instrument that the government can use to allocate enough
resources, which they are in control of to education sectors. The end results of any option are
varying since both the governments and the household will seek to derive some benefit from
enrolling in schools.
At the national level, the benefits of attending school are likely to be associated with the
increase of children's human capital. Since the government hopes that the child at some point
in future would be able to engage in a nation's production activity. The government therefore
tries to investment more in education by increasing education spendings. The objective is to
16
accelerate emollment and thus a more educated society, which in the long run would benefit
the society.
My focus on social demand therefore would imply that the key policy objective is to meet the
needs of parents and pupils but compare it with the government's ability to meet those needs.
According to Forojalla (1993) a reforms or expansion of education system will depend on the
aggregate demand for places. And that projected emollment figures at the current state provide
a basis to have a forecast on future demand for places at that future state. He assumes that the
opportunity cost remain constant in the period under study. The problem with this concept is
that it is open to manipulation, for instance reducing admission procedures so as to increase
public desire to go to school in the long run will affect the quality of education. However this
does not negate our study since the forecast emollment will still help in determining how much
the government will have to spend in order for the program to be successful.
2.2.2 Empirical Specification !Methodology
.. Testing governments financial commitment
In order to capture the relevant information-affecting emollment, I will use gross emollment
rate (GER)8 despite the fact that it doesn't provide good answers to question regarding
emollments in education. One can rightfully argue that a high GER of over 100% may be due
to repetition and over age children in school rather than success of primary education. Just as
previously mentioned GER is among the most common ways of measuring the success of
education system. Hence it is still useful in this analysis as it shows the utilization rates and the
number of children the system can maintain in the schools. Though a GER of 100% will not
show the success of education, but in a FPE program this numbers reflect on the government's
capability given their resources.
This is the reason why according to Colclough (1993) it is possible to define GER in line with
costs of schooling and the government's expenditure. The theoretical assumption is that an
increase in expenditure on primary school will led to increase in emollment. Provided that
costs per pupil remain constant or rather have a slight change. The problem with this condition
8 According to Bedi et al (2001) and co1clough(1993) GER measures the participation rate since it looks at the relationship between total enrolments and the number of those children in school whose age are with in the school going age.
17
is that costs are never constant and education costs also depend on the economic perfonnance
of a country. For instance increases in transportation cost as a result of increase in fuel cost will
not only affect individual cost but also the government's expenditure on cost it incurs while
transporting learning materials. The GER fonnula is given by the:
GER=f %y Cp.A
(1)
Where '%Y' represents the proportion of GDP expenditure on schooling, 'Cp' is the costs as a
percentage of income per capita and 'A' the number of those who should be in school in any
given society, keeping in mind primary school age of 6-13 in Kenya. It shows that GER is
directly proportion to GDP and inversely promotional to income per capita. It is further
believed that 'A' would nonnally remain constant in the short-tenn, but that an increase of
GER will theoretically be possible when the rate of change in GDP is greater than percentage
change in income per capita (Ibid) The proportion of GDP expenditure comprises of those
contributed by the public %Yg and by the private%Yp• The expenditure per pupil can also be
categorized as a government (Cpo) or private (Cpp) expenditure to primary schools. This cost is
further categorized as follows: Cpo as cost learning materials and teachers cost per pupil, while
Cpp represent cost per pupil on school unifonn and books. Hence the initial GER can be
expanded to include these categories and thus expressed as follows9 •
. GER = f %Yg +%Yp A[CPG+Cpp]
(II)
Another problem with this interpretation is that high expenditure by the government lO(increase
in %Y g) will not necessarily increase enrolment rate but instead lead to increase "A" or
increase in government expenditure pet pupil. This is so because if the expected age were to be
increased then both "A" and "Cpo" will increase therefore leading to high enrollment but the
GER will either remain unchanged or even go lower. However one is still able to determine the
government's commitment as either low or high by analyzing the values of public recurrent
expenditure directed to primary school as a percentage ofGDP expressed by %Yg and the same
recurrent expenditure but this time directed to each pupil as a percentage of GDP expressed by
Cpo. It is after this analysis that we consider a high GER to be a reflection of government's
commitment.
9 This analysis as previously been used by Colclough (1993) and Eicher (1984) 10 I do consider the expenditure and cost per pupils incurred by the government rather than private, since school under study are public school and also that information regarding private support are nor readily available.
18

This further followed through the formula below
GERIOO * X'gc * CGIOO * alOO XglOO=
GERc * Cgc * ac (III)
Where Xg denotes public expenditure as a percentage of GNP on primary school. GERc as the
current GER, GERlOO as GER of 100, Xgc refers to the current public expenditure on primary
school as a % of GNP.xgloodenotes public expenditure when GER is 100; Cgcrefers to the
current public expenditure per primary pupil as a % of GNP while CgIOO refers to that public
expenditure per primary pupil where GER is 100. Lastlyac, alOodenotes current proportion of
population, which is of school age, and those of school age when GER is 100 respectively.
When one assumes that cg and a don't change over time, the summarized equation would be:.
GERIOO * X'gc XgIOO =
GERc (IV)
Unfortunately this doesn't give the consequence of cost elimination in primary schools.
2.2.3 Data description and analysis:
The attendance rate in 1994 is therefore used to project the attendance rate in 2005, taking into
consideration the introduction of free primary education in 2002. With an estimated projected
emollment rate in 2005, one can calculate the total cost given the new emollment. Assumption
is made that the unit costs of education do not change in this study. In the survey, 64% of those
attending school went to private school while only 36% went to public school. This shows that
despite the cost, some parents still sent their children to private school not because they can
comfortably afford it, but because private school is often associated with high quality
education.
The study therefore is concerned as previously indicated with those attending public school and
assumption in this case is that FPE will lead to a shift from private school to public. Since the
information available doesn't allow us to look at private school but it provides the possibility
of analyzing the government's ability to encourage pupils to attend public school especially
now that education is free and also be able to maintain them in schools. The government
through FPE program can therefore reverse this trend by providing adequate resources to
public school. Hence an estimate of emollment rate and the government past and current
financial commitment as reflected in the analysis of fiscal budget would prove useful in
coming up with an indicative decision on the overall program.
19
CHAPTER THREE: Education enrollment trends and sustaining those enrollments
3.1.0 Definitions as used in the paper:
Education For All: I consider Education For All (EF A) as defined by Colclough and Lewin
(1993) as reaching those who have not been reached in provision of education. 11
Universal Primary Education: ill the broader context Universal Primary Education (UPE) could
simply mean a country has a primary GER of 100 or more (Colclough and Lewin, 1993).
Education financing: This is adapted from Colclough (1997) as the provision of direct
monetary contribution and support to school development. ill this paper references has been
placed on the ratios of spending on various education segments to GDP.
3.1.1. Overview of enrollment
ill Kenya, development of education has been a long-term objective of the government since
independence (IPAR, 1999). The reasons vary from basic needs and rights to other social
economic benefit such as reduced fertility, improved health and a productive nation.
Recognizing these benefits in 1990, Kenya joined the rest of the world in two global
conferences-the Jomtien in Thailand and later the World summit for children in Dakar, as a
sign of commitment in provision ofEFA by the year 2015 and also to provide Universal basic
education by 2000 and seeing that all children achieve UPE by 2015. One of the ways of
achieving FPE was through UPE (DFID, 2001). But even under that knowledge and
commitment enrollment rates have been declining until introduction of FPE in 2002. It is in the
background that one is able to compliment FPE ability to achieve EFA by 2015.
However such positive goals in EF A are still out of reach for many developing nations. For
instance in 2000, about 12Omillion children didn't enroll in primary school, a higher figure
than previous years (Delamonica et aI, 2003). And according to World Bank (2001) Africa has
the lowest enrollment rates at every level. This implies that signing documents alone in the
summits cannot translate into increase enrollment unless the governments are committed. This
commitment can be shown by the amount of resources allocated to education since a number of
studies have been done to show a link between school resources and their effectiveness to raise
education outputs such as high enrollment rates and better scores (Hanushek, 1996 and Prichett
11 All the eligible children (6-13yrs) are able to attend school under an acceptable minimum quality
20
et aI, 1999). For it is often assumed, with little evidence, that increased financing will lead to
high enrollment, which translates into development. Despite such studies, little is known on
how reorganization of public spending on primary education would have an impact on school
enrollment and quality of education. Particularly whether reduced cost can increase enrollment
in poor countries (Deiniger, 2001) or affect the quality of teaching and affect the governments
spending pattern.
In Kenya, just like many African countries it is expected that restructuring of existing patterns
of education spending will increase access and quality in education sector due to availability of
more resources. In some cases, it has been found that other issues maybe more important than
acquiring knowledge. Such that even if cost are reduced enrollment rates may still not increase
because there are other factors mentioned earlier that also affect schooling other than cost of
education. The authorities should be prepared to effectively manage the education system when
enrollments rates are high. Studies show that such high enrollments are often caused
elimination of user fees or where subsidies are provided in education. These policies would
lead to progressive trends since they focus on reducing primary cost to favor the poor and
hopefully leads to equal development (Castro-leal et aI, 1999).
This paper, contributes towards the debate by reaffirming that right policies can accelerate
enrollment. And that Kenya, just like other countries, considered FPE as absolutely no charge
in schools. Yet one knows that in.theory education was free but practically parents still had to
cater for the certain cost incurred by their children. For instance while the government
abolish<;:d tuition fee and also provided teaching material. They expected the parents to meet
cost involve in food, school uniform, writing material and other personal costs incurred by the
child. Under this program, given the scarcity of resources, one might question the ability of the
government to meet this objective. I attach two viewpoints on the word sustainability in the
following ways; any withdrawal by the donors would negatively affect the continuity of FPE if
a higher proportion of the overall education expenditure is met by the donors. Secondly, it is
hoped that FPE will not negatively affect the operations of other key sectors such as health.
Unfortunately if expenditure is increasing while school enrollment is reducing then the policy
needs to be reviewed, as this would imply the program is not sustainable.
21
However such policies reqUITe an in-depth understanding of the government's ability to
proceed with FPE program by looking at its expenditure pattern. A careful planning and
resource co-ordination will prove useful. And that increased spending alone doesn't reflect the
government's achievement but how such spending is done will yield greater results.
3.2.2 Education reform policy in Kenya: Historical Trends in Education sector.
The Education sector in Kenya has undergone numerous changes. Notably is a shift from 7-6-3
in 1964 to 8-4-4 in 1985. This implies that at the beginning of 1989 henceforth, individuals
were expected to complete eight years of primary education, and later four years of secondary
and university education to be considered to have successful completed education instead of 7-
6-3 respectively. Although age variations maybe observed in both cases, there is similarity in
accepted age (6 years and above) to join primary school. Hence the normal primary school age
is assumed to be between 6-14 years.
Secondly, the Implementation of Structural Adjustment Policy (SAP) in 1988 led to a policy
shift on education financing when the government succumbed to pressure from IMF IW odd
Bank by adopting user fee in their 1989-1993 National Development Plan. The objective at that
time was to reduce the government financial burden in provision of social services. That was
attributed to poor economic performance; increase debt repayment and increasing budget
constraints. They in particularly argued that this would reduce overall government expenditure
and thus reduces their budget deficits. Besides user fees was meant improve the quality of
education since more supplementary funds would be available to purchase books, teaching
materials, activity fees, tuition charges and examination fees. But instead it had a direct
negative impact on the economically disadvantaged families thus affecting their ability to have
access to education. (Abagi, 1997a) As such some researchers argue that success of UPE
depends on education becoming affordable to the poor (Oxfam, 2001) briefing paper. This
explains the benefit that Kenya intends to enjoy with introduction ofFPE.
These shifty-accelerated schools drop out since most parents could no longer maintain their
children in schools. Though there could be other reasons other than cost that led to the drop out
like parental education, early marriage, pregnancy, child labour etc for this trend, some
researches argue that increased costs played a key role in decline GER. This can be shown by
declining trends of gross enrollment from 98.2% in 1989 to 86.91 % in 1999(Bedi et aI, 2004).
22
And by tum of the century the nation was desperately in need of a system that would enable
their children enroll in schools. Unfortunately the government at that time didn't acknowledge
that they were able to reverse·the trend by absorbing substanthil amount of primary education
cost from parents. This denial went well with the opposition coalition party as earlier indicated.
3.3.1 Challenges facing teaching
The earlier chapters assumed that introduction of FPE education would increase school
accessibility and even with such an assumption, the country doesn't seem to be able to absorb
all the children that successfully complete primary education. And even with this kind of
optimism, the system still faces numerous challenges as discussed in this section. Some of
which are not the main issues in this paper but are mentioned below so that to understand the
broad view of the problems facing FPE.
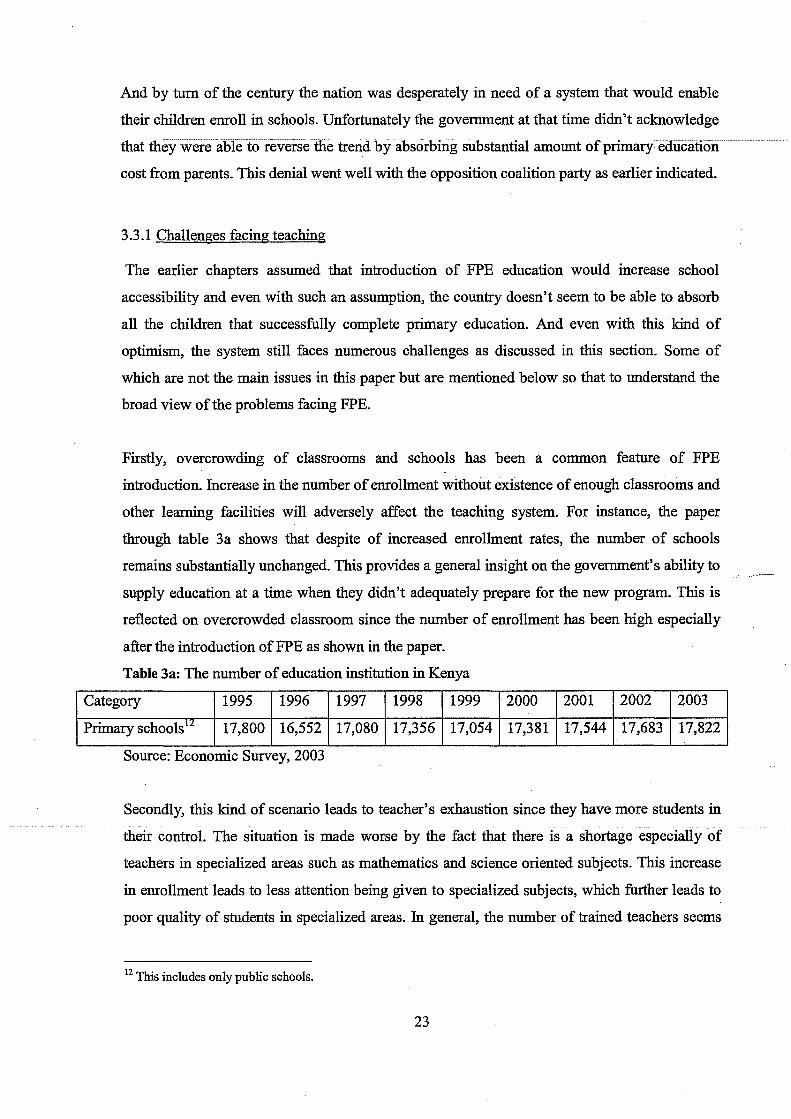
Firstly, overcrowding of classrooms and schools has been a common feature of FPE
introduction. Increase in the number of enrollment without existence of enough classrooms and
other learning facilities will adversely affect the teaching system. For instance, the paper
through table 3a shows that despite of increased enrollment rates, the number of schools
remains substantially unchanged. This provides a general insight on the government's ability to
supply education at a time when they didn't adequately prepare for the new program. This is
reflected on overcrowded classroom since the number of enrollment has been high especially
after the introduction of FPE as shown in the paper.
Table 3a: The number of education institution in Kenya
Category 1995 1996 1997 1998 1999 2000 2001 2002 2003
Primary schools l:':: 17,800 16,552 17,080 17,356 17,054 17,381 17,544 17,683 17,822
Source: Econorrnc Survey, 2003
Secondly, this kind of scenario leads to teacher's exhaustion since they have more students in
their control. The situation is made worse by the fact that there is a shortage especially of
teachers in specialized areas such as mathematics and science oriented subjects. This increase
in enrollment leads to less attention being given to specialized subjects, which further leads to
poor quality of students in specialized areas. In general, the number of trained teachers seems
12 This includes only public schools.
23
to have increased by 46% in 2000, but reduced in 2001 by almost the same amount 44.9%.
(MOEST, 2003) This decrease is due to the fact that the country already has many unemployed
teachers and thus rolling out more teachers would be ill advised especially when the
government has no capacity to employ them. This shows that there are more teachers in
general subjects than in specialized areas.
The situation is also compounded by the fact that primary school teachers are now required to
teacher all subject, yet their training period was inadequate to cover all the subjects at length.
Hence the policy demands that teachers are able to teach all the subjects is not practical as the
content of the courses are wide to be mastered in two years of diploma. The ends results will be
directed to poor teaching quality and thus negate performance. This paper therefore assumes
that teachers training and standard teacher pupil ratio would translate into increased quality of
education that would trigger more enrolment
Thirdly, teacher's deployments are not equally distributed due to the fact that most of them
wouldn't prefer to go to other harsh region. Resistance of teachers to move to areas were they
are needed most affects the government willingness to ensure that all students irrespective of
the region receive quality education. This also affects the enrollment of children in those harsh
regions as shown iater on in this particular chapter when reporting GER after FPE.
3.3.2. The Enrollment trend with introduction ofFPE
In terms of enrollment, WMS III shows that of total survey, 29.5% of those who didn't go to
school in the rural areas, and 34.5% in urban attributed their decision to cost factors. Hence the
need emerge to introduce free primary education to reduce the burden of providing education
to households. An increased change is observed in 2002 with the introduction of FPE, when
GER shifted to 103% from 93%-reflecting approximately 10% in enrollments as shows in
figure la.This confirms the crowding challenges mentioned earlier in this section. Of
importance is the stability in enrollment in mid 90s despite the fact that the figures are low.
The same table also shows GER trends before and after FPE implementation to confirm that
there are certain periods by which enrollment trends will change, more often than not as a
result of policy shift. This has also been explained elsewhere in the paper in terms of shocks.
Notably introduction of user fee in 1989 generated enrollment decline and thereafter abolition
of the same in 2002 led to an upsurge of enrollment.
24

One can count on this policy adjustments to explain the changes in enrollment. Of individual
cOIlcern is ~that the wealth characteristics of the household affects enrollment. This huge decline
and upsurge shows that policies affect the enrollment pattern. Hence, Enrollments will increase
or decrease depending on the type of policy in place. And how such policy will affect the
household's ability to purchase education and also their viewpoint on education return. This is
so because their household budget constraints and that logically, one would expect they would
priorities on basic consumption despite the fact that they aclmowledge the importance of
education. Hence their utility cannot be maximized on education but on consumption. ill this
context elimination of these costs generates high enrollment. And a number of studies
elsewhere have shown that elimination of costs have a positive effect on enrollment. However,
experience shows that free policies are not always absolutely free and that parents are still
expected to cater for certain aspect of education costs. And therefore the utility they derive
from school is lower because there household and school consumption is limited to the
household budget.
The number of enrolled students can show the utility derived from schooling, which is often
captured by gross enrollment rates. And while GER doesn't show the number of those who
should be in school, I still find it a useful tool in indicating the overall enrollment rates. Since
the number of children not enrolled are still high and that their inclusion in the education
system would still go way towards improving the nation productivity despite there advance
age. Another reason of considering GER instead of NER is that, data on school enrollment
segmented on ages seems to be lacking and yet they are required to calculate the net enrollment
rate. GER is therefore representative in this paper as it gives as a picture of what the
government has to continuously do to ensure that the education system is efficiently managed. .
And that GER still shows how much resource the governments needs to pump to school.
Therefore irrespective of ages, the governments will still have to ensure that education for all
succeeds.
As such GER is directly proportional to government expenditure since a higher GER will
imply more resource, coordination and management. Unfortunately the projected values do not
show that increased government spending will leads to increased enrollments. illstead while
education expenditure as a percentage of governments total spending increased in the 90s,
25
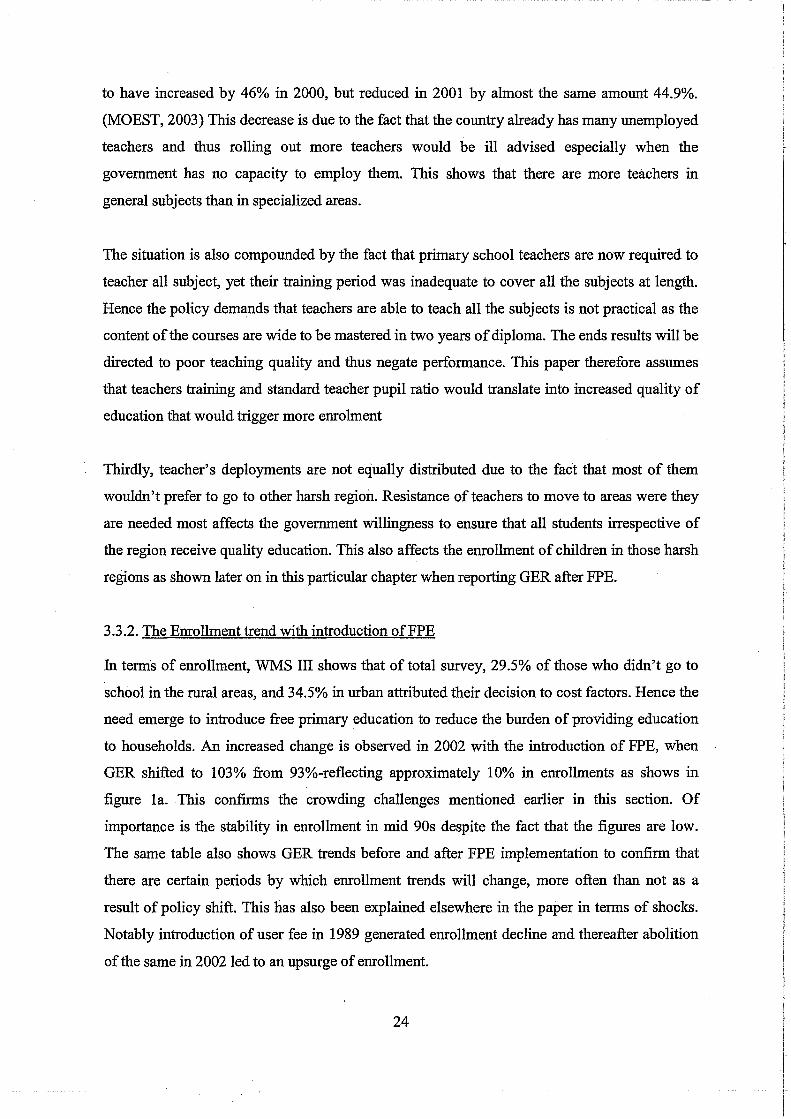
emollment rates declined until introduction of FPE. The declining changes in Gross emollment
rates during 2000-2002 and its upsurge in 2003 in capture table 3b and supplemented further
by Table A.3.1 This reflects an abrupt change in government policy. The values obtained on
emollment trends had been projected in percentage growth rates of primary school age
population as follows; period between 2000-2005 will have 6.16% per year while that between
2005-2010 will have 3.8% per year as used by population council of Kenya. This shows a
constant values but FPE is assumed not to increase emollment growth rates in the long run,
instead the paper assumes that emollments will increase in the short-run up to a certain point
before it begins increasing at a decreasing rate.
Table 3.b Projected values of emollments after 2003 2000 2002 2003 2005 2010 2015
Population of age 6-13years 6713.1 7126.627 7565.627 7853.121 8151.54 8461.298 . Number of emolled '000' 6,175.60 6,371.20 7,208.10 7305.049 7914.638 8461.409 GER 91.99 89.40 95.27 93.02 97.09 100 SOURCE: own calculation based on population census, 1999 and various economic surveys
The GER rates in on average is already high, but regional the paper still has a target of
achieving a higher GER since there are some region with extremely lower GER. Though this
doesn't show the success of the program in universalizing primary education by 2015, it gives
an indication of what the government will spend on the sector. Using NER would be the best,
but unfortunately this is not practically achievable in this paper. Hence using GER to explain
the government commitments is essential as it shows the level in which the government is able
to utilize it resources.
In order to do this effectively as shown in table 3b above, I have assumed a constant
emollment growth rate of 1.345% until 2015. It also shows a GER of 95.27 in 2003, but this is
not actually true with the implementation ofFPE and that the value also decreased to 93.02 in
2005 after implementation of FPE program under projected value. The rate of increase after
FPE was slightly lower in 2005 than 2003 above. This table will show that the actual values
differ with the projected value in the paper. The aim of this is to maintain the overall objective
of increasing education accessibility irrespective of age and this as to be equally distributed
across the country. For instance, In Kenya a GER of 100 has already been achieved with
introduction of FPE but this doesn't cater for the difference in regions; instead it provides an
average of GER, which is not reflective. However this shows that emollment rates can
decrease especially when overcrowded classrooms and constraint resource negatively affect
26
school perfonnance. Parents in this case are not enticed to send their children to overcrowded
schools. The implementation of FPE led to such conditions, more so since parents didn't
consider that there are other costs of educationtliiii must be mefby them in order for their
children to study well.
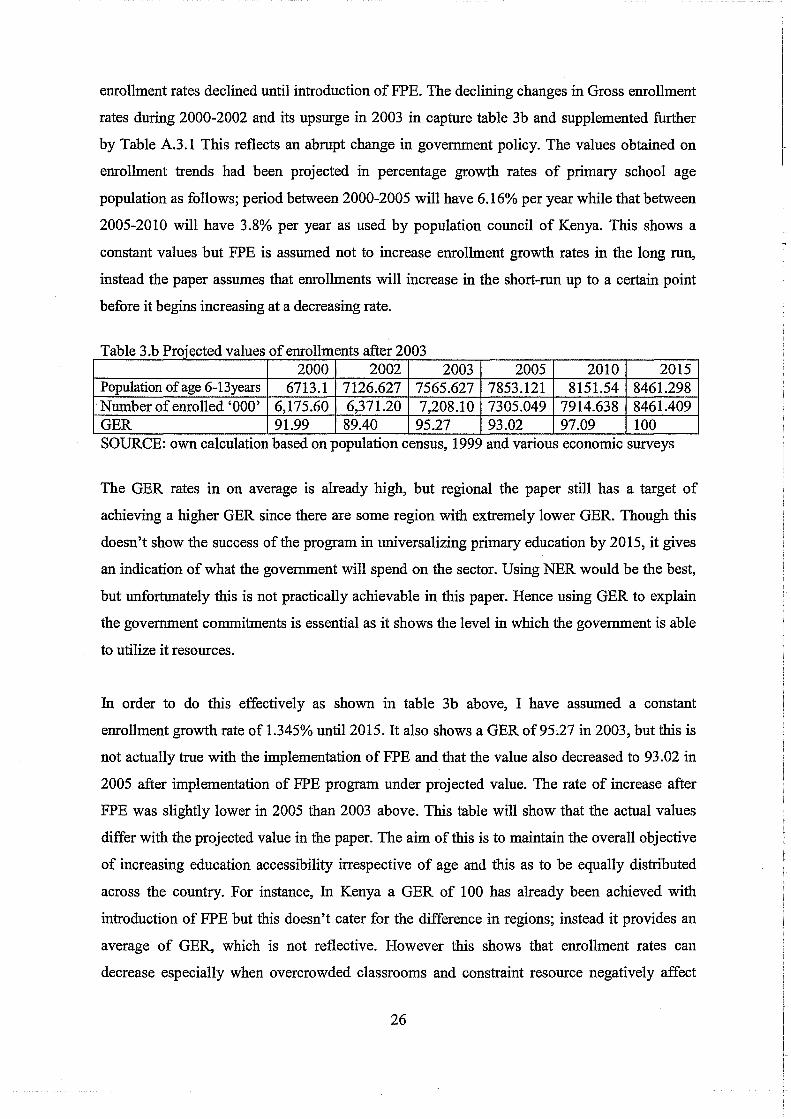
The effect of high enrollment leads to changes in pupils/teachers. This study shows as
indicated in table 3.c that the ration increase from 35(2001): 36(2002): 40(2002) but this can
not be true regionally. The table also captures secondary schools to show that continuity of
primary school is low and that this is one of the factors that encouraging low enrollment
Table 3.c Teachers ratio
Year 1995 1996 1997 1998 1999 2000 2001 2002 2003
Primary 30.42 30.36 30.43 30.78 32.50 34.52 34.91 35.79 40.35
Source: own calculation from various economIC survey and MOEST reports
On average, such increase does not show that resource is over constrained. But this may not be
true for individual schools, since some region have fewer schools and thus have high
enrollment of students and a high teacher to pupil's ratio. This ratio is however vital as an
impact of high enrollment since it shows the level in which teachers interact with their student.
Eventually an overcrowded classroom wi11lead to poor quality of teaching, as teachers easily
get exhausted. This wi11lower the demand for schools whose perfonnance in K.C.P.E is poor
and also it reflects the reward a child attaches to school enrolment generated from quality of
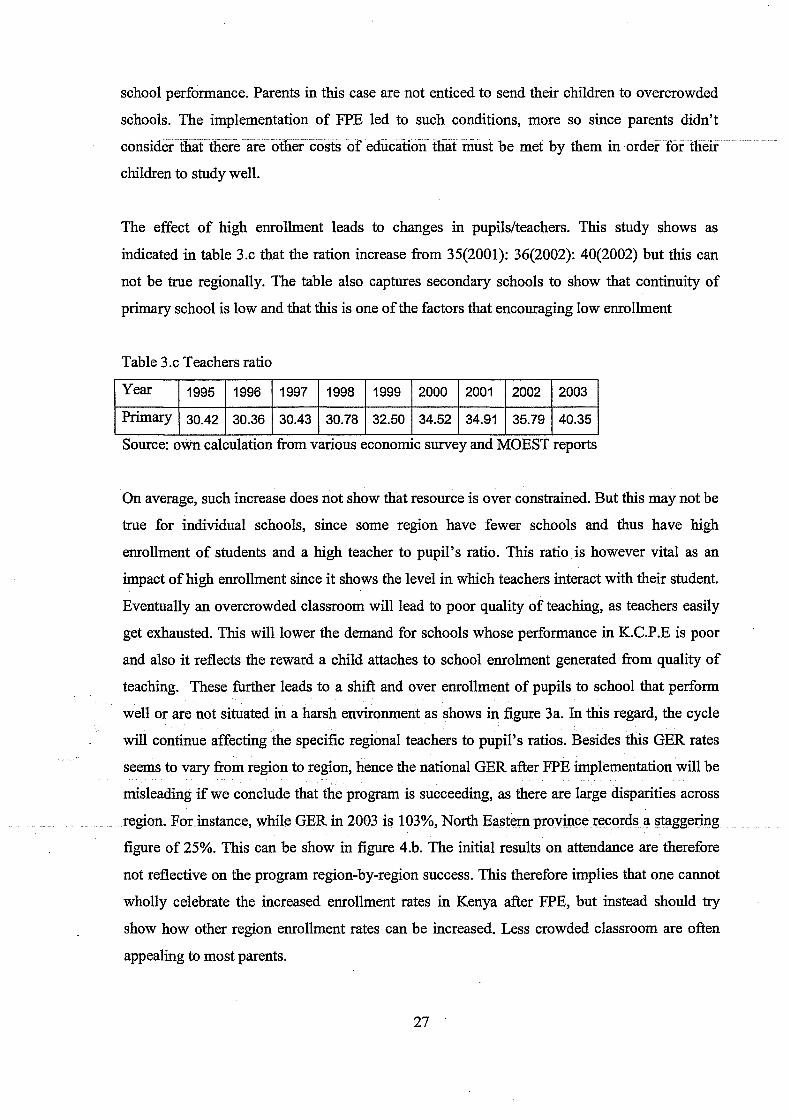
teaching. These further leads to a shift and over enrollment of pupils to school that perfonn
well or are not situated in a harsh environment as shows in figure 3a. In this regard, the cycle
will continue affecting the specific regional teachers to pupil's ratios. Besides this GER rates
seems to vary from region to region, hence the national GER after FPE implementation 'will be
misleading if we conclude that the program is succeeding, as there are large disparities across
region. For instance, while GER in 2003 is 103%, North Eastern province records a staggering
figure of 25%. This can be show in figure 4.b. The initial results on attendance are therefore
not reflective on the program region-by-region success. This therefore implies that one cannot
wholly celebrate the increased enrollment rates in Kenya after FPE, but instead should try
show how other region enrollment rates can be increased. Less crowded classroom are often
appealing to most parents.
27
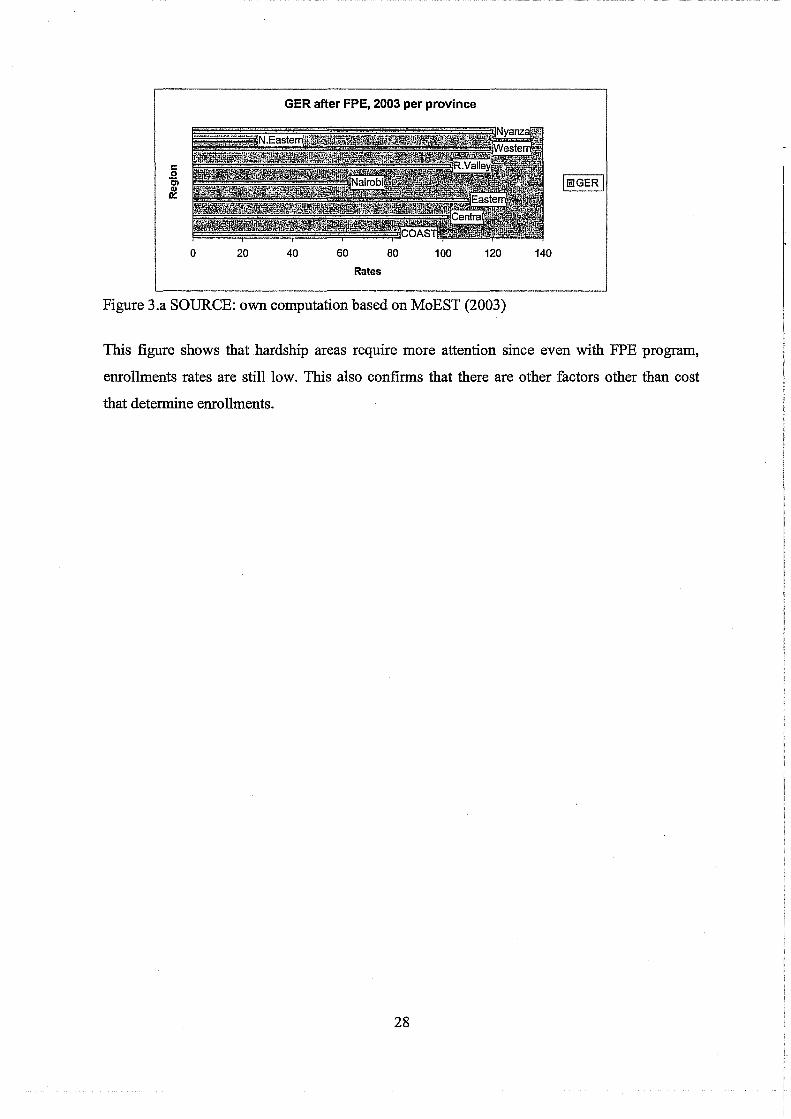
GER after FPE, 2003 per province
o 20 40 60 80 100 120 140
Rates
Figure 3.a SOURCE: own computation based on MoEST (2003)
This figure shows that hardship areas require more attention since even with FPE program,
enrollments rates are still low. This also confirms that there are other factors other than cost
that determine enrollments.
28

CHAPTER FOUR: Expenditure Analysis
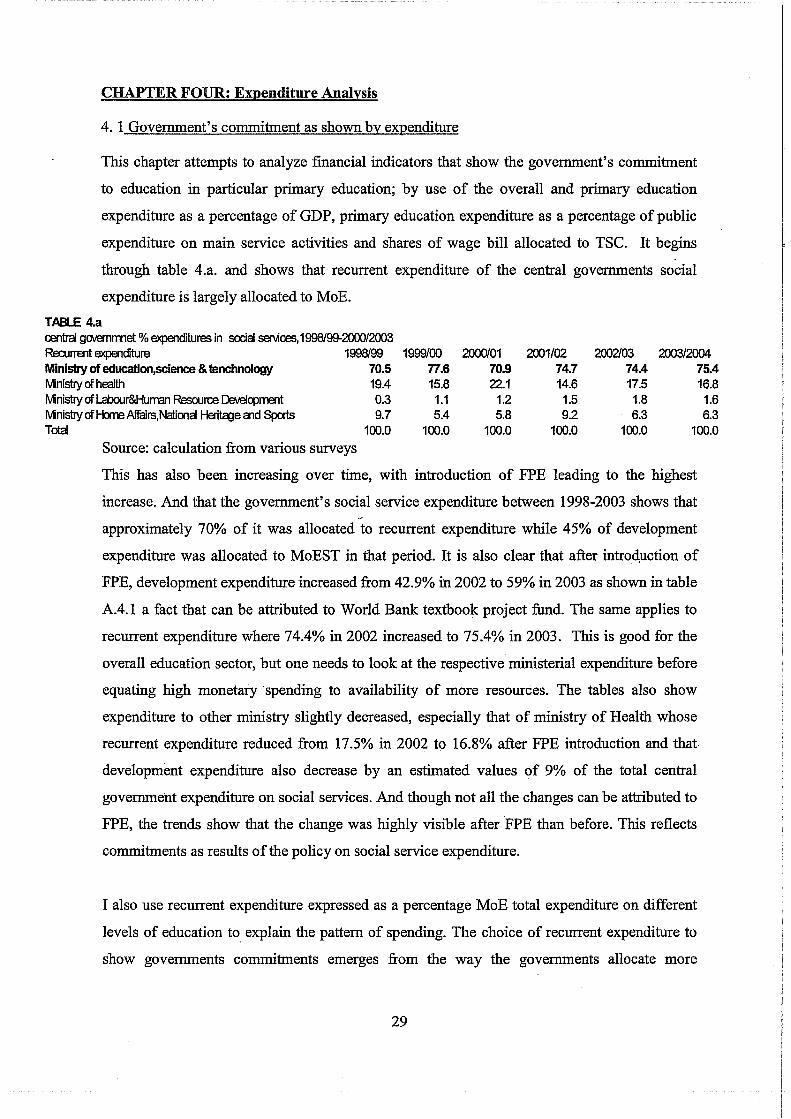
4.1 Government's commitment as shown by expenditure
This chapter attempts to analyze financial indicators that show the government's commitment
to education in particular primary education; by use of the overall and primary education
expenditure as a percentage of GDP, primary education expenditure as a percentage of public
expenditure on main service activities and shares of wage bill allocated to TSC. It begins
through table 4.a. and shows that recurrent expenditure of the central governments social
expenditure is largely allocated to MoE.
TABlE 4.a central gCNelTlrmet % expenditures in social services,1998/99-2000/2003 Recurrent expenditure 1998/99 1999/00 2000101 2001/02 2002103 200312004 Minisby of education,science & tenchnology 70.5 77.6 70.9 74.7 74.4 75.4 MnistJyofhealth 19.4 15.8 22.1 14.6 17.5 16.8 MnistJy of Labour&Human Resource Develq:>ment 0.3 1.1 1.2 1.5 1.8 1.6 MnistJy of Home Affairs,Nationai Heritcge CIld Sports 9.7 5.4 5.8 9.2 6.3 6.3 Total 100.0 100.0 100.0 100.0 100.0 100.0
Source: calculation from various surveys
This has also been increasing over time, with introduction of FPE leading to the highest
increase. And that the government's social service expenditure between 1998-2003 shows that '0
approximately 70% of it was allocated to recurrent expenditure while 45% of development
expenditure was allocated to MoEST in that period. It is also clear that after introd,uction of
FPE, development expenditure increased from 42.9% in 2002 to 59% in 2003 as shown in table
A.4.1 a fact that can be attributed to World Bank textbook project fund. The same applies to
recurrent expenditure where 74.4% in 2002 increased to 75.4% in 2003. This is good for the
overall education sector, but one needs to look at the respective ministerial expenditure before
equating high monetary . spending to availability of more resources. The tables also show
expenditure to other ministry slightly decreased, especially that of ministry of Health whose
recurrent expenditure reduced from 17.5% in 2002 to 16.8% after FPE introduction and that
development expenditure also decrease by an estimated values of 9% of the total central
government expenditure on social services. And though not all the changes can be attributed to
FPE, the trends show that the change was highly visible after FPE than before. This reflects
commitments as results of the policy on social service expenditure.
I also use recurrent expenditure expressed as a percentage MoE total expenditure on different
levels of education to explain the pattern of spending. The choice of recurrent expenditure to
show governments commitments emerges from the way the governments allocate more
29

financial resources to it than to the capital expenditure, which is often supported more by the
donor community. This allocation confirms the importance the governments attach on
education.
The problem with this goal of increasing accessibility through provision of more resources is
that, most government in developing nation and Africa to be specific, either lack financial
resources or political will (Hillman, A & Jenkner, E 2004). For recurrent expenditure it shows
that the government's spends more on primary schools than other levels of education. This
could be due to high number of school enrollment in primary schools than other levels as
shown in table 4a. However the paper doesn't attempt to look at the specific costs since my
scope is limited on the enrolment and how much the government spends due to increased
enrollment.
This section further shows that even with a high portion going to MoE, a large portion of
primary education expenditure has continuously been directed to teacher's salary and other
administrative cost. Just before the FPE program, 98% of recurrent spending by MoE went to
wages and salaries of staff depicted in the figure 4a.This is later confirmed in table AA.2 where
total MbEST expenditure as a percentage of government's main service spending as been
increasing. But the percentage increase on the administrative cost is also high.
T bl 4 R I I f d a e a: ecurrent expen lture on eve s 0 e ucatlon Sub-sector 1997 1998 1999 2000 2001 Primary 55.60 58.31 55.98 57.75 57.76
Secondary 22.50 23.97 26.78 25.82 26.09
University 14.88 12.13 11.49 11045 10.53
Teacher training 2.83 3.30 3.20 3.20 3.10
Others 4.19 2.29 2.55 1.78 2.52
Total 100 100 100 100 100
Source: MOEST (2003)
This particular state is not expected to immediately improve given the fact that the number of
teachers increased with introduction of FPE. And those teachers were awarded salary
increases, which the current government promised that they would implement those awards.
30
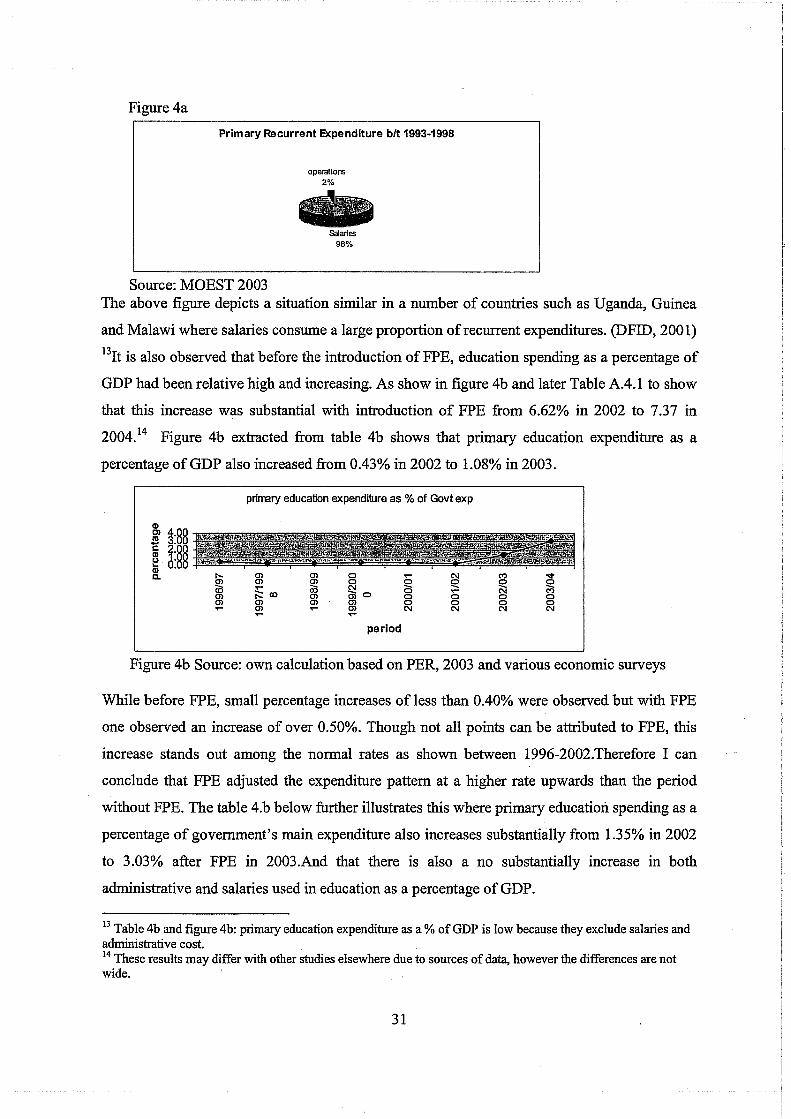
Figure 4a
Primary Recurrent EXpenditure bIt 1993·1998
operations 2%
Salarles 96%
Source: MOEST 2003 The above figure depicts a situation similar in a number of countries such as Uganda, Guinea
and Malawi where salaries consume a large proportion of recurrent expenditures. (DFID, 2001)
l3It is also observed that before the introduction of FPE, education spending as a percentage of
GDP had been relative high and increasing. As show in figure 4b and later Table A.4.1 to show
that this increase was substantial with introduction of FPE from 6.62% in 2002 to 7.37 in
2004.14 Figure 4b extracted from table 4b shows that primary education expenditure as a
percentage ofGDP also increased from 0.43% in 2002 to 1.08% in 2003.
primary education expenditure as % of Govt exp
m m .... ;:::co m m
m ~ m m ....
o ~ 0;0 m m
period
Figure 4b Source: own calculation based on PER, 2003 and various economic surveys
While before FPE, small percentage increases of less than 0.40% were observed but with FPE
one observed an increase of over 0.50%. Though not all points can be attributed to FPE, this
increase stands out among the normal rates as shown between 1996-2002.Therefore I can
conclude that FPE adjusted the expenditure pattern at a higher rate upwards than the period
without FPE. The table 4.b below further illustrates this where primary educatiOIl. spending as a
percentage of government's main expenditure also increases substantially from 1.35% in 2002
to 3.03% after FPE in 2003.And that there is also a no substantially increase in both
administrative and salaries used in education as a percentage of GDP.
13 Table 4b and figure 4b: primary education expenditure as a % of GDP is low because they exclude salaries and administrative cost. . 14 These results may differ with other studies elsewhere due to sources of data, however the differences are not wide.
31
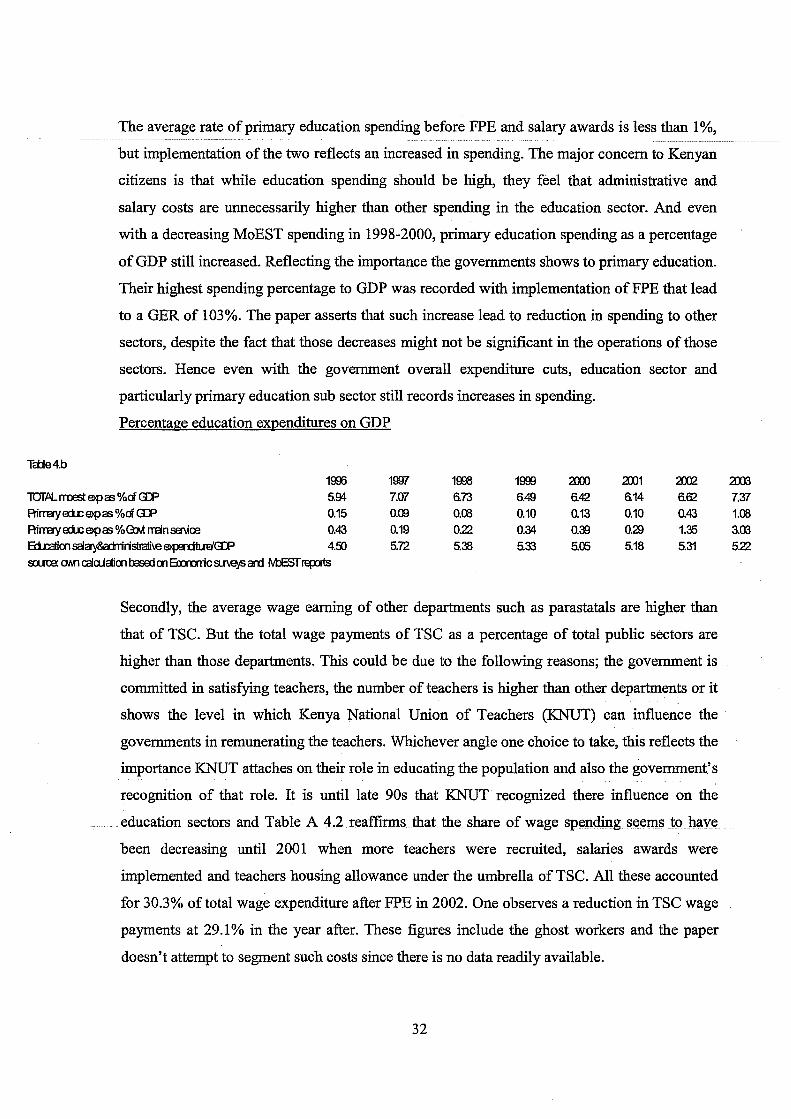
Tctie4.b
The average rate of primary education spending before FPE and salary awards is less than 1 %,
but implementation of the two reflects an increased in spending. The major concern to Kenyan
citizens is that while education spending should be high, they feel that administrative and
salary costs are unnecessarily higher than other spending in the education sector. And even
with a decreasing MoEST spending in 1998-2000, primary education spending as a percentage
of GDP still increased. Reflecting the importance the governments shows to primary education.
Their highest spending percentage to GDP was recorded with implementation of FPE that lead
to a GER of 103%. The paper asserts that such increase lead to reduction in spending to other
sectors, despite the fact that those decreases might not be significant in the operations of those
sectors. Hence even with the government overall expenditure cuts, education sector and
particularly primary education sub sector still records increases in spending.
Percentage education expenditures on GDP
1m3 1997 1938 1900 am axl1 a:xl2 lOfPl rmest Ellpas %d GF 5.94 7.UT 6.73 6.49 6.42 6.14 6.62 Airray Erl.c Ellp as %of GF 0.15 0.00 0.00 0.10 0.13 0.10 0.43 Airray Erl.c Ellp as %G::M I'l"Ein sef\ice 0.43 0.19 0.22 0.34 0.39 0.29 1.35 8:ir:alioosaay8a:iTiristrati\e ~GF 4.00 5.72 5.38 5.33 5.05 5.18 5.31 srute: OM! calaJaiioo I:Bsa:I 00 Eooraric SlJ\eYS ard I'vtJE.Sf rE{XlIf.s
Secondly, the average wage earning of other departments such as parastatals are higher than
that of TSC. But the total wage payments of TSC as a percentage of total public sectors are
higher than those departments. This could be due to the following reasons; the government is
committed in satisfying teachers, the number of teachers is higher than other departments or it
shows the level in which Kenya National Union of Teachers (KNUT) can influence the .
governments in remunerating the teachers. Whichever angle one choice to take, this reflects the
importance KNUT attaches on their role in educating the population and also the government's
recognition of that role. It is until late 90s that KNUT recognized there influence on the
education sectors and Table A 4.2 reaffirms that the share of wage spending seems to have
been decreasing until 2001 when more teachers were recruited, salaries awards were
implemented and teachers housing allowance under the umbrella of TSC. All these accounted
for 30.3% of total wage expenditure after FPE in 2002. One observes a reduction in TSC wage
payments at 29.1% in the year after. These figures include the ghost workers and the paper
doesn't attempt to segment such costs since there is no data readily available.
32
am 7.:rt 1.00 3.CX3 5.22

This study confirms that the central GoK is financially committed to increasing access to
primary education as it plays a huge role in financing primary education. However more
investments still need to be directed towards primary education, as percentage figures are still
lower for primary education. And that the social service recurrent financial portion allocated by
the government is directed to ministry of education is still high as shown in figure 4c. While
education as a share of public expenditure stood at 20.23 % in 2003/4 fiscal year a figure,
which is almost similar to the one, presented by Minister of education in an international forum
in 2003.
This allocation is not feasible since their commitment is not fully directed on factors that would
lead to improved enrollment. Instead teacher's remuneration seems to cover much of the
ministerial expenditure.
CENTRAL GOVT RECURRENT EXPENDITURE ON SOCIAL SERVICES(1998-2003)
iii M:JE
gM:JH
oM:JL
oM:JHA
Figure 4c Source: own calculation from various economic surveys
The paper therefore concludes that the government is financially committed towards the
success of FPE program shown by the proportion of expenditure directed to MoE. However
this willingness cannot translate into meaningful or sustainable spending since a large portion
is in fact directed on salaried teaching. While this will motivate teachers, little is known on
how teacher's motivation will influence school enrollment despite the fact that teachers are the
key instruments on teaching. The study also shows that while most of the government's
recurrent expenditure is directed to MoE, less is allocated to development expenditure.
4.2 Short comings of this commitment.
In the past decade the limitation to this system has been enormous. For instance this paper
recognizes that while teachers play an important role in transferring of knowledge. Their
remuneration package in the recent past is considered the biggest cost factor in educational
financing, besides persuading them to take position in "less desirable" areas since there is a lot
33

of resistance for deploymentY On the financial commitments Abagi (1997b) and Okwany
(2000) state that on average the bulk of 55 % of total recurrent expenditure estimated at 97%
on basic education went to teacher's salaries between 1992':'1997. A facfsupported by figure
4c. According to them this implies that other programs were under funded and that households
spend approximately 65% to cater for direct and indirect cost of education. In general about
31 % of cost of primary education is accounted for by the household (Psacharopoulos, 1995)
but Kenyans specification shows that approximately 21 % of cost of primary education was
taken care of by the household between 1996-2001. (MOEST, 2003)
To improve the situation of both enrollment and quality, donors such as the World Bank group
consider that more textbook and instruction materials reflect quality restoration; strengthen
examination system and greater investment in physical facilities (Brock-Utne, 2000).
Unfortunately all this restoration requires financial support of which most countries lack. This
is usually shown by low government revenue and expenditure as a percentage of GDP.
16(Gupta and Verhoeven, 2001). And that government's of developing countries should ensure
that the limited funds allocated to education sector yields the highest impact (World Bank,
1988) The GDP and public expenditure trends in this paper demonstrate that education
consumes a higher percentage of national production. While an increase in education
expenditure could translate into more education resources. This study does not seem to observe
that this increase was spent on teaching materials, provision of more textbooks and activities
that would encourage children to attend school. Instead more was spent on the administration
and teachers, which seems to be high but considered a normal trend in most of the countries.
This is risky since schooling demand not only depend on teachers presence and motivation but
also on issues like facilities available that would lead to improved exams performance. The
situation is made even worse by the high number of primary school teachers yet more teachers
are still needed.
The table AA.1 also shows that the share of government recurrent social spending on MoE is
far way larger than a number of departments. This can adversely affect provision of other
social services, which are key to a nations output such as health. The Current trend provided in
the paper shows that more focus is continuously being directed to the ministry of education
15 As said by one of the donors to a new agency- http://www.africanewscast.com/regional%20News/Kenya on 4th February 2004 16 However this doesn't necessarily lead to low education indicators especially if spending is efficient.
34
than any other ministry. With this kind of trend, one would expect that other social services
that are also important to the nation such as health are not given adequate attention. In order to
achieve that target, the governments ought to increase the resources available for this program.
And that such an increase should be directed to items that would make parents attach much
benefit to school attendance. It is this benefit that would encourage them to make a positive
choice of educating their children.
While it is true that the Government of Kenya (GOK) has continuously played a bigger role in
supporting primary education as shown by her education expenditure as percentage of gross
national product of between 5-7% on average in 1990-2000 as reported by UNESCO statistical
yearbook (1999) and confirmed in this paper in comparison to GDP. However this rises certain
challenges on her ability to continue with this trend without negatively affect her overall
expenditure, which will make provision of other essential social services unattainable. After
FPE, 75.4 % of the government recurrent expenditure on social service was allocated to
education sector. And that the results also shows that approximately 59% of the governments
social expenditure after FPE was allocated to Education while other important services such as
health recorded a reduction in both recurrent and development expenditure, as shown in Table
A.4.1. This creates an imbalance within the sectoral expenditure and which will negatively
affect the provision of other social services since other sectors receive less attention in terms of
finances.
In regard to the volume of revenue generated, there seems to be an improvement in recurrent
revenue collection, however this improvement does not balance of with the increase in
recurrent expenditure. Revenue collected seems to have been short from the budgeted values,
for instance as shown in table A.4.3 the recurrent revenue collected were approximately 13%
less of the estimated revenue. This does not translate well with the overall distribution of
financial resources. One observes a positive shift in 2003, to be 1.5% above the estimated
revenue. Besides the government intention of cutting the recurrent expenditure is not well
reflected in this paper. One observes that the government estimated expenditure was higher
than the actual before FPE, and introduction of FPE is accompanied by increased expenditure
of 1.5% on the expected revenue. And for Kenya, just as the just as many LDCs the major
source of funds has come from the central government. They provide assistance through
subsidies or grants in from taxation and donor community/financial institution such as World
35

Bank (Abagi, 1997a). This spending is often derived from budgetary allocation in each fiscal
year. In cases where the actual revenue collected is below the estimated revenue to be collected
one expects~ that the goveinIrfei:i.tsspeilmngwolild feduce.~Butit is-observed iliat ifi200 1, the
government revenue collection fell short by l3.07% and their recurrent expenditure was higher
than expected by 5%. It is therefore important to strengthen the revenue collection so as to
cater for the governments unexpected spending. However, currently revenue collection is said
to be improving and this will mean well for the overall government spending. Table AA.3
confirms this improvement in revenue collection.
A positive trend worth mentioning is that the overall ratio of government expenditure to
government revenue as been improving as shown in the table 4c. And that would enhance the
government's ability to priorities on education. Less than one in this case shows that the
government's expenditure is high, while greater than one shows high revenue collection.
Table 4.c Source: Calculation based African Development Report 2004
Ration of Government Expenditure to Revenue collection Period Revenue Expenditure Ratio
1994 1995 1996 1997 1998 1999 2000 2001 2002 2003 103,250 125,312 145,558 150,384 173,783 196,257 184,103 192,313 210,759 233,951 135,828 144,353 150,576 169,n2 184,359 206,366 181,154 231,098 245,000 235,079
0.76 0.87 0.97 0.89 0.94 0.95 1.02 0.83 0.86
The government therefore is able to improve its chances of succeeding in implementing FPE if
the above ratio exceeds one. And also that the amount collected is equally distributed
depending on the countries priorities, not only with-in the government departments but
effectively within the education sub-sector.
36
1.00
CHAPTER FIVE: Malawi education system
I use Malawi due to the following; there is a relevant contextual similarity between Malawi and
Kenya that is rooted on the fact that FPE was an electoral issue that contributed to both
governments victory. This was a political initiative that resulted in less time being directed to
planning before the startup. Besides that, they both had a lower primary enrollment rates before
introduction of FPE. Poverty levels are also high and therefore FPE helps in reducing the
[mancial burden households have on purchasing basic knowledge. However one cannot fail to
mention that difference observed in their popUlation size, Gross Domestic Product, foreign
debts and aid. These are issues that can indirectly or directly affect education sector, but that
cannot prevent this paper from sharing lessons between the two countries.
Ever since Malawi gained independence in 1964 they have made significant changes in
education system. For instance as shown by a shift on Education Development plan (1973-80)
that placed more emphasis to tertiary and secondary school as compared to primary levels, to a
strong emphasis on primary education as shown in Education Development plan (1980-1995).
During the first period, the government's core objective was to fill the middle level jobs that
had been left vacant by the colonist. However the main objective of the second plan was to
increase accessibility, equality and relevance of primary education. A situation in terms of
objective that has been maintained up-to date and the rationale behind this according to
Kadzmaira and Rose (2001) has been due the importance of addressing the needs of the poor,
particular from 1990s. This is true when one considers the popUlation demand on school
enrollment and acknowledges that school fees were a major constraint in this demand.
(Burchfield & KadZamira, 1996) And after 1994 general election the new government
appreciated the key role played by pledging to abolish school fee towards their victory but also
understand that its implementation was going to be useful in reducing poverty in Malawi.17
Primary enrollment levels increased with the abolition of school fee in 1994 and the upsurge
was higher than 100% to-date as shown in table 5a and that on average the net enrollment rate
(NER) between 1996-2002 stands at 100% while for Kenya in the same period stands at 69%(
17 Policy framework for poverty alleviation programme considers school fees among many other things, as a cause of poverty.
37

Unicef Report, 2004) this could explain the effect of FPE on the NER without providing details
on quality of education.
Table 5.a: Enrollment trends after FPE
1994 1995 1996 1997 1998 1999 2000 2001 2002
Primary (GER) 127 126.8 124.8 126.4 129.8 132.6 135.3 136 131.2
Source: World Bank: Development Indicators (2003), UNESCO Report (2001) and Africa Development Indicators (2004)
The table shows that many children including over age ones where not in school before
introduction of FPE. And a continuous GER of over 100 for almost 10 years reaffirms the need
of continuing with FPE program so as to educate more people.
However this kind of success does not come without difficulties, even with increased financial
support by the government and donors FPE still could not adequately ensure high quality
education in schools (Kadzamira and Rose, 2001). Aspects involving quality of education
emerges due increased pupils/teacher ratio, where education standards are lowered to
encourage continuity in the system. Besides, the means to support the program was not
automatic forthcoming, as such in practice, parents were expected to pay a substantial amount
of education cost despite the fact that basic education was theoretically free. The governments
therefore resorted to get more support from the donor community. This is later on shown by the
higher percentage of grants in GDP. Under this condition, policy experts feared that a
withdrawal of one of the key donors, would lead to a collapse of education sector in Malawi.
(Bembaum et al 1998) Besides high expenditure also had a negative budgetary implication
since less resources were now available to other sectors in the economy. ill Kenya with the
introduction of FPE, the ministry of education recorded the highest expenditure in 2002/2003
of approximately 70% of total central government social sector expenditure and the Ministry of
Health spent 20% (Economic survey, 2003). From this background, one cannot doubt that the
system was faced with numerous challenges. The following section will mention some of those
challenges relevant in the paper and how the country coped with those challenges.
38

5.1 Challenges facing FPE in Malawi
The program was initially implemented with less consultation, since it had excluded teachers,
parents, local leaders and the civil society. Yet their inclusion was going to be useful not only
in creating a positive image of the program (it was donor driven) but also in providing
expertise advice to government at the drafting stage. Lack of consultation implies that the
government had to use more resource on implementing the program since the community
wasn't involved. Hence the basic shortcoming at the initial stage of implementation is lack of
resource to cope with the increased enrollment, forcing the governments to depend on the
donors. FPE therefore at the initial stages increased the government dependence level.
Secondly, while the abolition of school fees were consistent with poverty reduction objective
of the government through economic growth and investing in human capital. It created over 1
million more students in primary schools. This led to an increase of teaching force by 75% that
is about 20,000 new teachers. This meant that more pressure was therefore exerted on an
already weak education system and on the government budget. This information is based on
the World Bank (1995) which further asserts that most of the new recruiters where untrained
school leavers, with about 4,000 retired teachers being recalled back to service. Hence at the
initial stage one can conclude that qualitY of education was compromised in the hope of
increasing education access to all eligible children. Recruiting untrained school leavers meant
that the students wouldn't receive specialized training, a situation that affects the output and
performance of students.
Thirdly, introduction of Free Primary Education in 1994 implied that the government had to
reorganize it's already over stretch of budgetary allocation. Since the limited public resource
was not sufficient enough to cater for :the upsurge of primary school enrollment. The
governments overall revenue pattern as a percentage of GDP seems relative lower in
comparison to Kenya though they have a lower population. However, this raises doubt on
either country effectiveness in implementing the program. Table 5b shows that Malawi at the
initial stages had a lower revenue collection to GDP but this has been improving over time
notably after five 5 years ofFPE implementation.
39
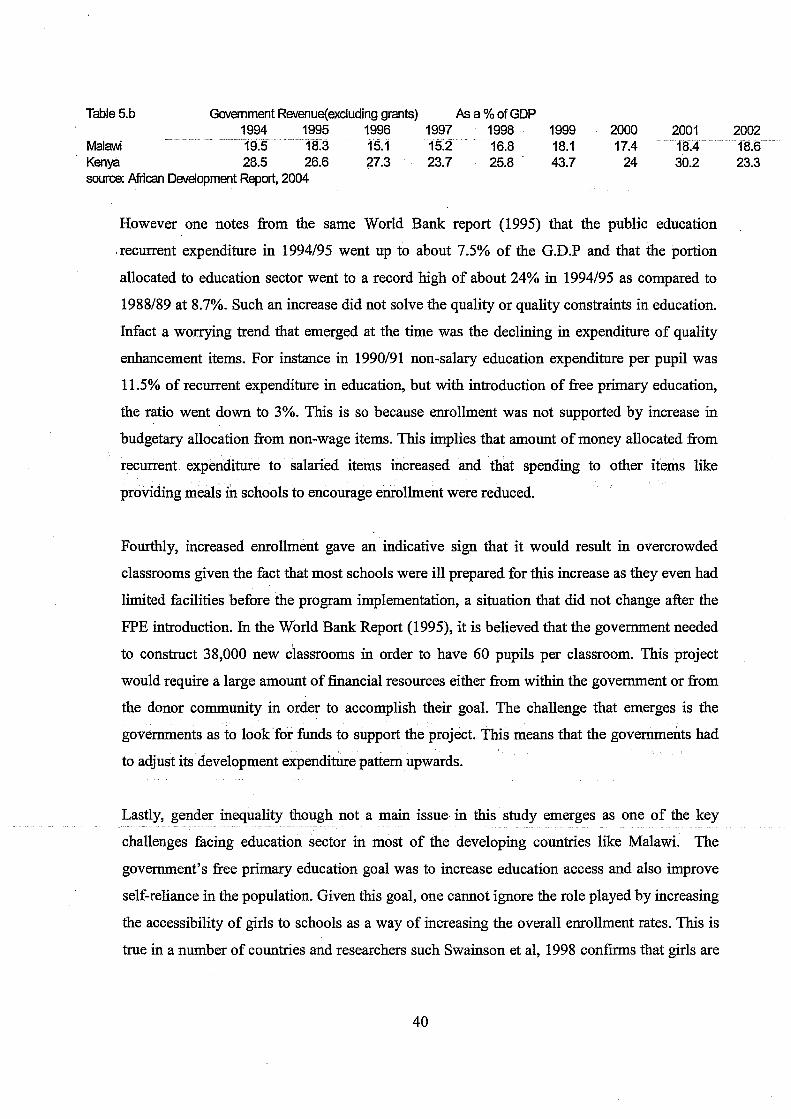
Table 5.b Government Revenue(excluding grants) As a % of GDP 1994 1995 1996 1997 1998 1999
MalaM 19.5 18.3 15.1 15.2 16.8 18.1 Kenya 28.5 26.6 ;27.3 23.7 25.8 43.7 source: African Development Report, 2004
2000 17.4
24
2001 18.4 30.2
However one notes from the same World Bank report (1995) that the public education
·recurrent expenditure in 1994/95 went up to about 7.5% of the G.D.P and that the portion
allocated to education sector went to a record high of about 24% in 1994/95 as compared to
1988/89 at 8.7%. Such an increase did not solve the quality or quality constraints in education.
Infact a worrying trend that emerged at the time was the declining in expenditure of quality
enhancement items. For instance in 1990/91 non-salary education expenditure per pupil was
11.5% of recurrent expenditure in education, but with introduction of free primary education,
the ratio went down to 3%. This is so because enrollment was not supported by increase in
budgetary allocation from non-wage items. This implies that amount of money allocated from
recurrent. expenditure to salaried items increased and that spending to other items like
providing meals in schools to encourage enrollment were reduced.
Fourthly, increased enrollment gave an indicative sign that it would result in overcrowded
classrooms given the fact that most schools were ill prepared for this increase as they even had
limited facilities before the program implementation, a situation that did not change after the
FPE introduction. In the World Bank Report (1995), it is believed that the government needed
to construct 38,000 new classrooms in order to have 60 pupils per classroom. This project
would require a large amount of financial resources either from within the government or from
the donor community in order to accomplish their goal. The challenge that emerges is the
governments as to look Jor funds to support the project. This means that the governments had
to adjust its development expenditure pattern upwards.
Lastly, gender inequality though not a main issue· in this study emerges as one of the key
challenges facing education sector in most of the developing countries like Malawi. The
government's free primary education goal was to increase education access and also improve
self-reliance in the population. Given this goal, one cannot ignore the role played by increasing
the accessibility of girls to schools as a way of increasing the overall enrollment rates. This is
true in a number of countries and researchers such Swainson et aI, 1998 confirms that girls are
40
2002 18.6 23.3
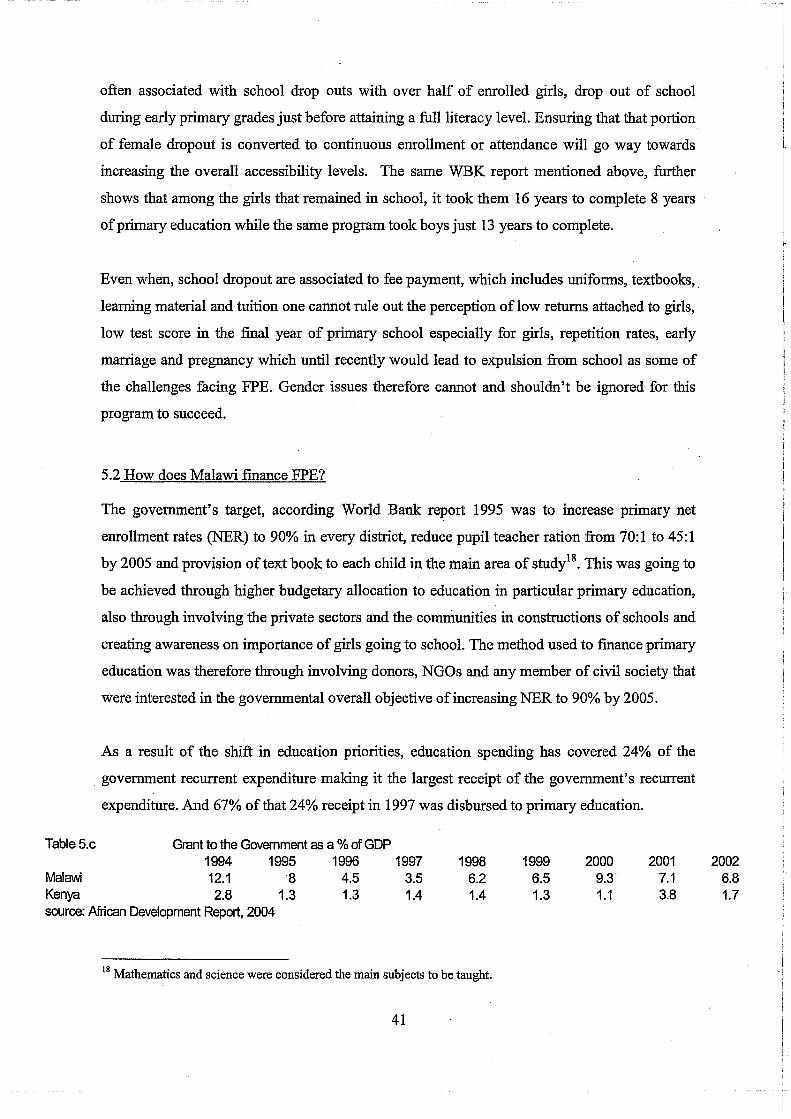
often associated with school drop outs with over half of enrolled girls, drop out of school
during early primary grades just before attaining a full literacy level. Ensuring that that portion
of female dropout is converted to continuous enrollment or attendance will go way towards
increasing the overall accessibility levels. The same WBK report mentioned above, further
shows that among the girls that remained in school, it took them 16 years to complete 8 years
of primary education while the same program took boys just 13 years to complete.
Even when, school dropout are associated to fee payment, which includes uniforms, textbooks, .
learning material and tuition one cannot rule out the perception of low returns attached to girls,
low test score in the final year of primary school especially for girls, repetition rates, early
marriage and pregnancy which until recently would lead to expulsion from school as some of
the challenges facing FPE. Gender issues therefore cannot and shouldn't be ignored for this
program to succeed.
5.2 How does Malawi finance FPE?
The government's target, according World Bank report 1995 was to increase primary net
enrollment rates (NER) to 90% in every district, reduce pupil teacher ration from 70:1 to 45:1
by 2005 and provision of text book to each child in the main area of study18. This was going to
be achieved through higher budgetary allocation to education in particular primary education,
also through involving the private sectors and the cOmnlunities in constructions of schools and
creating awareness on importance of girls going to school. The method used to finance primary
education was therefore through involving donors, NGOs and any member of civil society that
were interested in the governmental overall objective of increasing NER to 90% by 2005.
As a result of the shift in education priorities, education spending has covered 24% of the
government recurrent expenditure making it the largest receipt of the government's recurrent
expenditure. And 67% of that 24% receipt in 1997 was disbursed to primary education.
Table 5.c Grant to the Government as a % of GDP 1994 1995 1996 1997
Malavvi 12.1 8 4.5 3.5 Kenya 2.8 1.3 1.3 1.4 source: African Development Report, 2004
1998 6.2 1.4
18 Mathematics and science were considered the main subjects to be taught.
41
1999 6.5 1.3
2000 9.3' 1.1
2001 7.1 3.8
2002 6.8 1.7
(Kadzmaira and Rose 2001). This shows that the policy spending was more a pro-Poor than the
previous one, which tended to Javor the ricli.(Clisti-o-lealT99br Giventlieir low revenue
collection as a percentage of GDP. The Government resorted to assistance from donors. The
table 5c shows the overall government grants pattern after introduction ofFPE in 1994. And it
is clear from this table that at the beginning of the program, the government of Malawi
depended more on donors as shown in grants GDP ratio of approximately 12%. Though these
figures have been decreasing, it still shows that the FPE program in Malawi is a more donor
driven than government intended policy.
The main priority of the new government had been directed to the social sectors. And that one
interesting observation in the beginning of the programme is that most of the education
expenditure was directed to training new teachers that were hired in free primary education
policy. And this increased governments social sector expenditure at a time when there was
need to control the overall government expenditure and also improves its revenue collection.
The advantage of this spending is that while it accelerated government's expenditure, the long
term effect was to improve the quality of teaching. This would also translate into good
performance. And even with this positive thinking, the governments was still expected to trim
down its overall expenditure, among the ways used to control overall expenditure was a freeze
on hiring temporary staff; reduce purchase of vehicles while revenue collection was improved
by increasing efficiency of tax and tariff collection. This is confirmed from table 5a when
Revenue collection as a percentage of GDP improved from 15.6% in 1996 to 18.6% in 2002.
Other ways that were also used to confront financial constraints in education sector included
increase cost recovery at post primary education level, choice of least-cost alternatives in
project design and increases community involvement. In this case therefore one cannot rule out
the importance of monetary resource, instead one should analyze how this financial resources
can be sufficient in improving both enrollment and quality of primary education. This is
important to understand because other resources other than finance may come handy in
improving the success of the program.
As previous mentioned, the spending on government wages and salaries shoot up with the
introduction of FPE. Table 5d shows the changes in wage and salaries spending since the
program implementation. However, the spending increased in the first few years but started
42
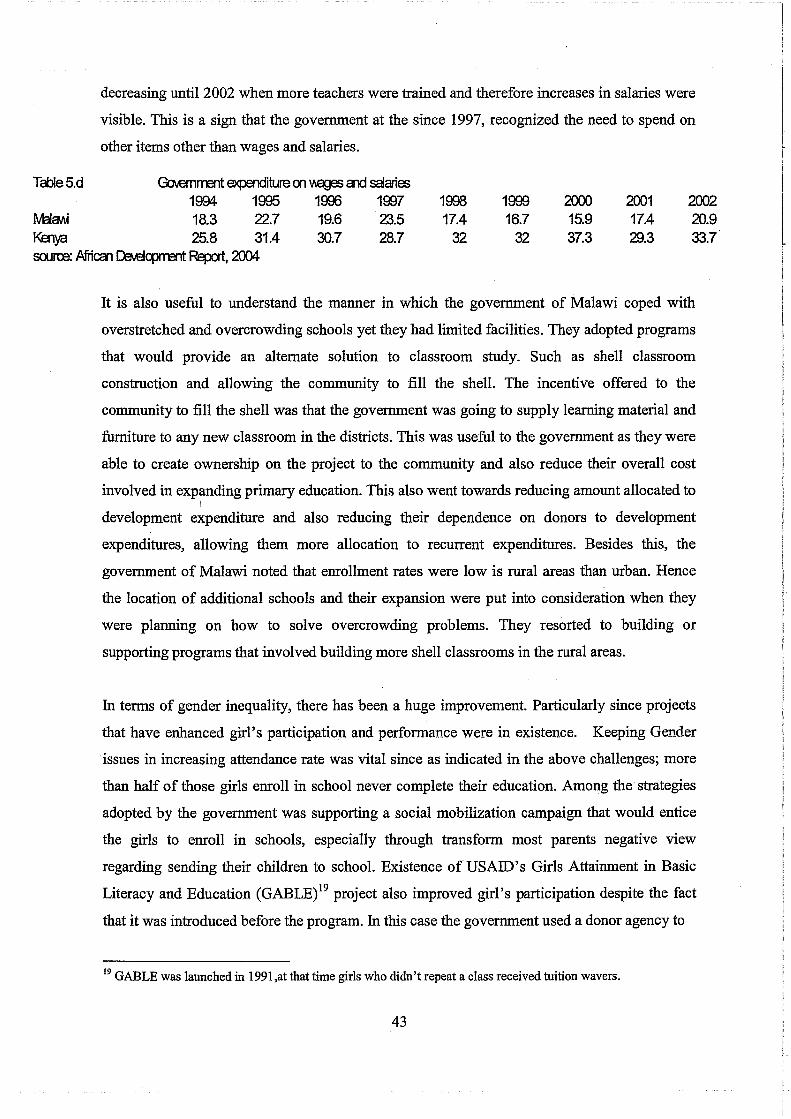
decreasing until 2002 when more teachers were trained and therefore increases in salaries were
visible. This is a sign that the government at the since 1997, recognized the need to spend on
other items other than wages and salaries.
Table 5.d GcM:mrrent e<penditure 00 VI.EIg8S end saaries 1994 1995 1996 1997
lVBIaM 18.3 22.7 19.6 ·23.5 Kalya 25.8 31.4 30.7 28.7 SCAJrre: AfiiCCll Le.,e/qJITl3rlt Repat, 2004
1998 17.4
32
1999 16.7
32
2000 15.9 37.3
2001 17.4 29.3
2002 20.9 33.7
It is also useful to understand the manner in which the government of Malawi coped with
overstretched and overcrowding schools yet they had limited facilities. They adopted programs
that would provide an alternate solution to classroom study. Such as shell classroom
construction and allowing the community to fill the shell. The incentive offered to the
community to fill the shell was that the government was going to supply learning material and
furniture to any new classroom in the districts. This was useful to the government as they were
able to create ownership on the project to the community and also reduce their overall cost
involved in expanding primary education. This also went towards reducing amount allocated to
development expenditure and also reducing their dependence on donors to development
expenditures, allowing them more allocation to recurrent expenditures. Besides this, the
government of Malawi noted that enrollment rates were low is rural areas than urban. Hence
the location of additional schools and their expansion were put into consideration when they
were planning on how to solve overcrowding problems. They resorted to building or
supporting programs that involved building more shell classrooms in the rural areas.
In terms of gender inequality, there has been a huge improvement. Particularly since projects
that have enhanced girl's participation and performance were in existence. Keeping Gender
issues in increasing attendance rate was vital since as indicated in the above challenges; more
than half of those girls enroll in school never complete their education. Among the strategies
adopted by the government was supporting a social mobilization campaign that would entice
the girls to enroll in schools, especially through transform most parents negative view
regarding sending their children to school. Existence of US AID's Girls Attainment in Basic
Literacy and Education (GABLE)19 project also improved girl's participation despite the fact
that it was introduced before the program. In this case the government used a donor agency to
19 GABLE was launched in 1991,at that time girls who didn't repeat a class received tuition wavers.
43
help it achieve its overall objective other than drawing money from the budget. So the
government did not only reduce the gender disparity but it involved the civil society in
achieving that goal.
Lastly, of importance to this paper is introduction of Medium Term Expenditure Framework
(MTEF) and Poverty Reduction Strategy Papers (PRSPs). Under which more attention was
paid to sectoral programs and spending. In the long run protecting the social sector despite
expenditure cuts. This study therefore shows that incorporating FPE in MTEF and PRSPs is
useful as it seeks to ensure that more funds are available for the program despite ad vocation of
government's expenditure cuts by donors.
44

CHAPTER SIX: Policy recommendation
Policy remains an important tool that determines the direction of any govermnets decisions, in
this case education outcome. This paper pays particular attention to the extent to which
abolition of costs will effect the government overall expenditure pattern and ability to increase
school enrollments. The government's Key issue involves maintaining a social contract with
electorate as promised before election, improving quality and developing capacity to sustain
the program. The following sections provide the policy option the government can analyze and
improve on to ensure that their objectives are realized.
Access:
This paper has shown that the demand of school did increase when direct cost such as such as
tuition fees were eliminated. This confirms that in Kenya, both direct and in-direct costs
significantly affected primary school attendance. And that FPE led to increase in school
enrollment. Unfortunately I didn't notice any substantial change in the supply side since the
number of schools remained relatively constant. It is important therefore to have a strategy that
would combine elimination of user fee with restructuring of the education institution through
expansion or building more schools. This can be made possible by increasing the development
expenditure and foster partnership with civil society and donor community. Malawi
government for instance asked the communities to fill the structure that the government had
already constructed. This eliminated the chances of having overcrowded classrooms. It is in
this respect that I reaffirm a recommendation that is similar from other studies that the
govemment should involve stakeholder~; this will go towards reducing the pressure exerted on
the government as a result of limited resources and eventually lead to improvements in
development expenditure.
Even with such shortcomings, the importance of increasing primary education access in any
developing country like Kenya is still undisputed. Especially when limitation of fiscal resource
may draw question on whether the government should focus on increasing access or on
improving quality. The program shouldn't just be a matter of increasing enrollment, since a
poor quality education to many children implies putting the counties limited resource into a
waste. In order fore the government to achieve it overall goal and thus benefit from it, they
45
need to ensure that FPE is not associated with bad quality education. There failure to do this
would in the long run have a negative effect on the countries productivity and thus growth.
The study has shown that despite the fact that enrollment rate increased nationally, the same
conclusion cannot be drawn when looking at provinces. Hence the government should provide
solution that would increases education access to region with low enrollment rates such as
Northeastern province, which has 25% after FPE. And though this is an increase from 17.8% in
2000 more needs to be done to increase that level. It is therefore right to say that increase in
government education expenditure will improve the overall school attendance in Kenya if the
spending is properly channeled. But that some disadvantaged region require more expenditure
allocation than others.
Lastly, in terms of increasing access through household direct costs, the government can
abolish uniforms as means of reducing the burden to parents. Though uniforms has its cons,
support for it removal is based on the interest of eliminating any predicament that may prevent
children from attending school. In some areas, children can hardly afford normal clothes, hence
eliminating uniform requirement would reduce household's costs on schooling.
Financing
This papers doesn't test whether Economic stability such as GDP and public spending on
education are related. However, the results have shown that education spending can increase
even when the GDP is low in comparison to other nations. An aspect that depends on a
particular government's priority. In Kenya, a large percentage of GDP has been allocated to'
education reflecting the government's commitment. Besides this, one needs to re-examine the
proportion of national resource allocated to education and its sub-sectors. The paper has shown
that a high percentage of spending is allocated to personnel cost such as wages and
administration. Yet such spending does not directly lead to increased accessibility but on
improving teacher's motivation. Unfortunately the government overall objective was to
increase accessibility. In this case, more financial resource should be directed to items such as
provision of textbooks, encouraging constructions of more schools. These are Items that will
enhance enrollments rates and thus increase accessibility. Therefore efficiency will be visible
when the spending bias from higher education and administrative and salary expenditure cease
or reduce. However, this does not undermine the important role played by teachers.
46

While the study shows that FPE relieved most parents on the burden they had to carry on
educating their children. On the other hand it has created more pressure on the government's
income and expenditure accounts. As such, the government needs to assess education
expenditure against education outcomes. This pressure should be welcomed if the above policy
is effective since one can't ignore its effect on increasing education accessibility. But such
spending should not exhaust governments social spending. More study should be devoted to
finding out the effectiveness of this policy in Kenya. This is important because supporting a
Policy that is not effective in achieving the actual purpose in which it is meant to serve would
drain the government's resource. The period of implementation may be too short in this case
for such an analysis. However the government can also use Malawi's example by adopting
Poverty Reduction Strategy Papers (PRSPs) in sectoral financing. In this case they are able to
channel Poverty reduction funds and activities to education sector. This will protect other
social service sectors such as health from reduction in spendings and more or equal funding.
The paper therefore proposes that the government effectively introduce education expenditure
in their MTEF and PRS
The government should therefore explore ways to broaden the resources for education rather
than rely on budgetary allocations. An example worth adopting from Malawi is the
involvement in Donor community in projects such as GABLE, where girls are encouraged to
attend school. This in the long run results into increased overall enrollment. A factor that
reaffirms that involving the stakeholders is key towards reducing pressure.
In conclusion to the overall paper, it is clear that the government of Kenya is committed in
ensuring that FPE succeed. But that it would be worthwhile if the government includes
stakeholders including donors in facilitating the programs success. Kenya can also increase its
income level through effective revenue collection which will go way towards reducing their
chances depending on the donors. However, the governments should reorganize the manner in
which it spends such revenue with a view of increasing expenditure to primary education.
47

References:
Abagi Okwach (1997a) 'Efficiency of Primary Education in Kenya: Situational Analysis and Implications for Education Reforms' Discussion paper 4, Nairobi: IP AR
Abagi Okwach (1997b) 'Public and Private investment in Education in Kenya: An Agenda For Action' IP AR
Becker. S.Gary (1994) Human capital a theoretical and empirical analysis with special reference to education. National Bureau of Economics Research, New York.
Becker, S. Gray (1964). A Theoretical and Empirical Analysis, with special reference to Education, New York: Columbia University Press.
Bedi Atjun, Kimalu, PauLK, Nafula Nancy, and Kulundu Damiano Manda (2004) 'The Decline in Primary School Emollment In Kenya' Journal of African Economies, v.13, no 1 pp.1-43
Behrman, J (1987). Schooling and other Human capital Investments: Can Effects be identified? Economics of Education Review, VoI.6, No 3 pp 301-305
Bernbaum, M. et aI., 1998, 'lesson learned,' in Evaluation ofUSAID/Malawi Girls Attainment in Basic Literacy and Education (GABLE) program (draft), Washington, D.C.:Academy for Educational Development
Brock-Utne, Birgit (2000) "Chapter 2" in Whose Education For All? The Recolonization of the African Mind Studies in Education Politics. Falmer Press, New York& London.
Castro-leal, F., Dayton., Demery,L., & Mehra,K (1999). Public spending in Africa: Do the poor benefit? World bank Research Observer, 14(1), pp.49-72
Castro-Leal, F., 1996, 'Who Benefits from Public Education Spending in Malawi? Results from the recent education reform,' World Bank Discussion Paper No. 350, Washington, D.C.: World Bank
Colclough Christopher and Lewin.M.Keith (1993). Educating all the children. Strategies for primary schooling in the south. Oxford: Clarendon press.
Colclough Christopher (1997): Marketing Education and Health in Developing' Countries; Miracle or Mirage? Oxford University Press Inc. New York.
Deineinger Klaus (2003) 'Does cost of schooling affect emollment by the poor? Universal primary education in Uganda.' Economics of Education Review.
Delamonica, E., Mehrotra,S., & Vandemoortele,J(2003,July-September) 'Education For All: How much will it cost?' Journal of Rural Development. VoI.22 p.3-29
48
DFID, 2001, 'The challenges of Universal Primary Education: strategies for achieving the international targets' DFID, London
Eicher, J.Christopher. (1984), 'Education Costing and Financing in Developing Countrieswith special reference to Sub-Saharan Africa', Staff Working Paper, 655. World Bank, Washington, D.C
Era Dabla-Norris and John Matovu (2002). Composition of Government Expenditure and Demand for Education in Developing countries. IMF working Paper WP/02178
Forojalla, S.B (1993) Education Planning for Development. The Macmillan Press Itd,London.
Gibbon Adebayo, Olukoshi .0 1996: Structural Adjustment and Socio-Economic Change in Sub-Saharan Africa; Some conceptual, Methodological Issues, Research, Report N. 102
Government of Kenya, 1997 National Development Plan 1997-2001. Nairobi: Government printers.
Gupta, Senjeev and Marijn Verhoeven, 2001,"The Efficiency of Government Expenditure: Experiences from Africa," Journal of Policy Modeling, Vo1.23 (May), pp. 749-77
Hanushek, E (1996) "Measuring investment in education," journal of Economic Perspectives 10(4): 9-30
Hillman Arye & Jenhner Eva (2002) ''User payments for Basic Education in Low-income countries" IMF working paper 021182
IPAR Policy brief (1999) "Education Reform in Kenya for the Next Decade: implementing policies for Adjustment and Revitalization." Education sector No.3, 1999
Kadzamira Esme and Pauline Rose (2001) 'Educational Policy choice and Policy practice in Malawi: Dilemmas and Disjuncture' Institute of Development Studies working paper 124
Karugu G K, Kivilu M, Kang'ethe R.W and Ngaba D (1995), Cost and Financing of special Education in Kenya. Nairobi: World Bank and Ministry of Education
Kimalu, P.K., Nafula, N., Kulundu, D.M., Arjun, S B., Mwabu, G., & Kimenyi, M.S (2001) "Education Indicators." KIPPRA Working paper No.4 May 2qQL.
Kimuyu Peter, Mbui Wagacha and Okwach Abagi (1999) "Chapter seven" in Kenya's strategic policies for the 21 st century. Institute of Policy Analysis and Research.
Lourdes Cecilia Blanca(2002) "Education Outcomes in Rural Bolivia: An Evaluation of the Program of Education Reforms" Institute of Social Studies, The Hague, The Netherlands
Ministry of Education Science & Technology (2003) Report on The Sector Review And Development.
Oxfam, 2001, "Education Charges: A Tax on Human Development Ministers," Oxfam Briefing paper No.3 Oxford, England
49
Okwany Auma, (2004) Entering the quagmire; Examining state-NGO interaction in the provision of Education for street Girls in Kenya NGO relations in Education Civil Society 177-202. Information Age Publishing
Patrinos, H.A and G. Psacharopoulos (1995) "Education Performance and Child labor in Paraguay" International Journal of Education Development, 15: 47-60
Pritchett, L and D. Filmer. (1999) "What education production functions really show"- A positive theory of education spending. Economics of Education Review 18: 223-239
Psacharopoulos, G., (1995) ''The profitability of investment in Education: concepts and methods," World Bank Human Capital Development and Operations policy working paper No. 63 Washington D.C
Ravallion Martin and Lanjouw Peter (1999). 'Benefit Incidence, public spending reforms, and the timing of the program capture.' World Bank Economic Review Vol. 13 pp 257-73 (May)
Republic of Kenya (1996-2003). Economic Survey. Government Printer. Nairobi
Republic of Kenya (2001) "Poverty Reduction Strategy Paper For the Period 2001-2004" Ministry of Finance and planning, Government Press
Republic of Kenya (2003 &2004) Public Expenditure Review. Ministry Of Planning and National Development.
Schultz, Theodore (1963). The Economic Value of Education, New York: Columbia University Press
Tomasevski Katarina (2003) Education Denied- cost and remedies Zed Books, London and New York Press. Chapters 2 & 6
UNESCO (2001) "Sub-Saharan Africa regional report- Education Statistics 2001" Socie' te' Edition Provence, Nimes
UNESCO (1999) "Statistical Yearbook"
UNICEF (2004) "The State of the World's Children 2004" UNICEF, Division of Communication, New York.
World Bank (1995), Staff Appraisal Report: Primary Education Project in Malawi. Human Resource Division, Africa Region: The World Bank.
World bank (1998). Education in sub-Saharan Africa: Policies of Adjustment, Revitalisation and Expansion. Washington, D.C: The World Bank
World bank (2001). A chance to Learn. Knowledge and finance for education in sub-Saharan Africa. Washington, D.C: The World Bank.
50

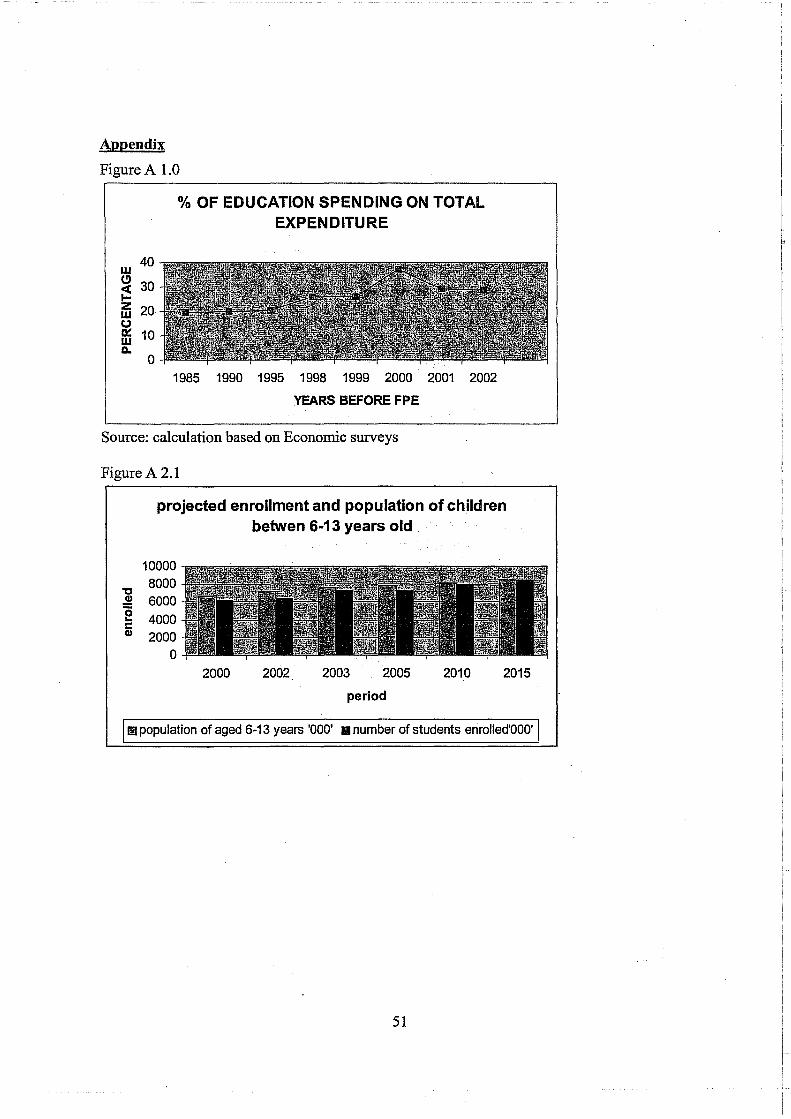
Appendix
Figure A 1.0
40 w C!) ~ 30
ffi 20· o 0:: 10 w 11. o
% OF EDUCATION SPENDING ON TOTAL EXPENDITURE
1985 1990 1995 1998 1999 2000 2001 2002
YEARS BEFORE FPE
Source: calculation based on Economic surveys
Figure A 2.1
projected enrollment and population of children betwen 6-13 years old
10000
"t:I 8000
.!!:! 6000 e 4000 c CD 2000
0 2000 2002. 2003 2005 2010 2015
period
f!l population of aged 6-13 years '000' III number of students enrolled'OOO'
51
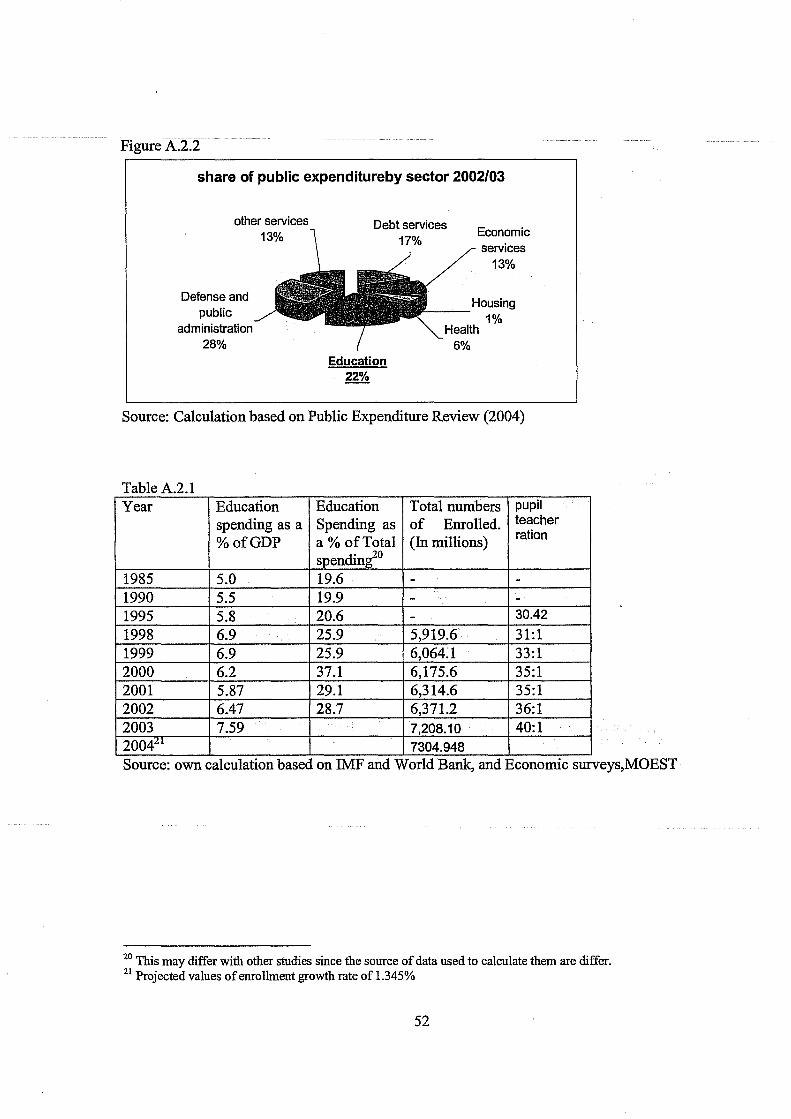
Figure A.2.2
share of public expenditureby sector 2002103
other services 13%
Defense and public
administration 28%
Debt services Economic services
13%
Education 22%
Housing '---- 1%
Health 6%
Source: Calculation based on Public Expenditure Review (2004)
Table A.2.1 Year Education Education Total numbers pupil
spending as a Spending as of Enrolled. teacher
%ofGDP a % of Total (In millions) ration
spending20
1985 5.0 19.6 - -1990 5.5 19.9 - -1995 5.8 20.6 - 30.42
1998 6.9 25.9 5,919.6 31:1 1999 6.9 25.9 6,064.1 33:1 2000 6.2 37.1 6,175.6 35:1 2001 5.87 29.1 6,314.6 35:1 2002 6.47 28.7 6,371.2 36:1 2003 7.59 7,208.10 40:1 2004:l1 7304.948 Source: own calculation based on IMF and World Bank, and Economic surveys,MOEST
20 This may differ with other studies since the source of data used to calculate them are differ. 21 Projected values of enrollment growth rate of 1.345%
52
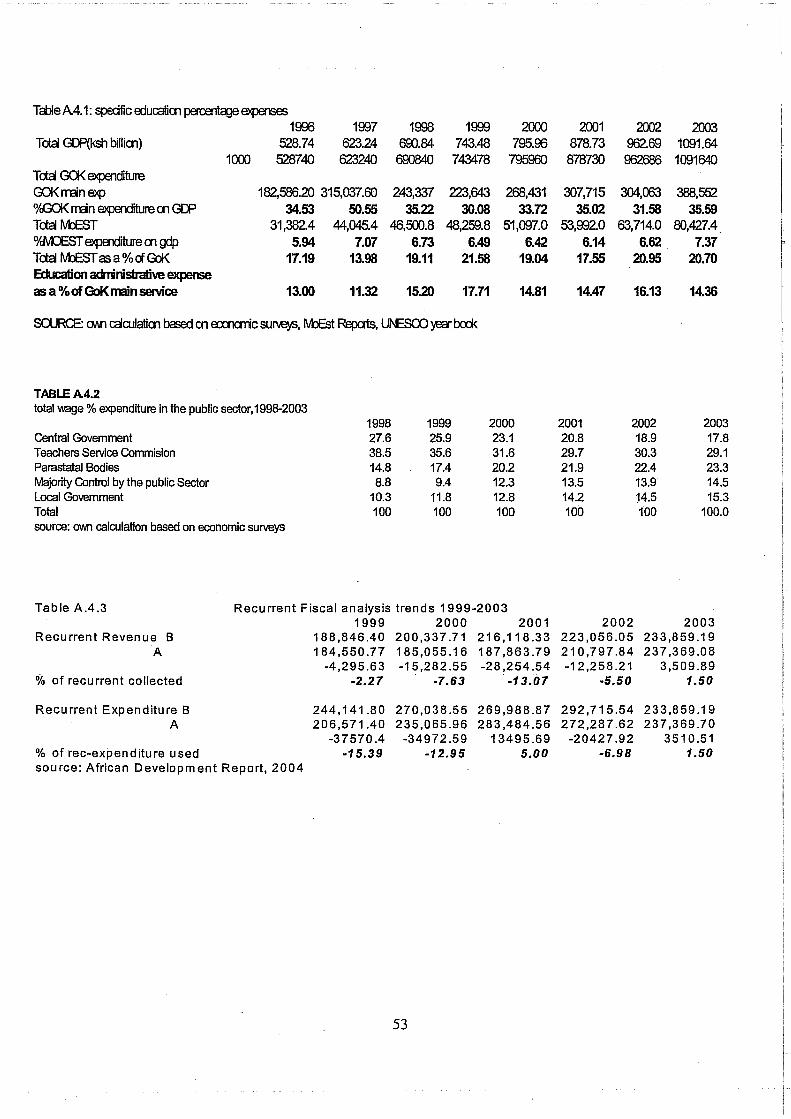
Tct>le A4.1: spedfic edUcatiCll perr.er1ta'Je eJqJ€I1S8S
1996 1997 1998 1999 2000 Tcta GI:F(ksh billiCll} 528.74 623.24 690.84 743.48 795.96
1000 528740 623240 690840 743478 795960 Tcta Ga< expenditure Ga< Il"Bn exp 182,586.20 315,037.60 243,337 223,643 268,431 o/cOO< Il"Bn expenditure crt GI::P 34.53 50.55 35.22 30.08 33.72 Tcta MJEST 31,382.4 44,045.4 46,500.8 48,259.8 51,097.0 %MJEST expenditure crt gdp 5.94 7.07 6.73 6.49 6.42 Tcta M:JEST as a % ct Gal< 17.19 13.98 19.11 21.58 19.04 Education acmnisb'alive expense as a %of GoKmain service 13.00 11.32 15.20 17.71 14.81
sa.JRCE: CM.fI caCUlatiCll based crt eccnaric suli.e'y'S, IVbEst Repats, Uf\ESOO 'y'fH bed<
TABLEA.4.2 total \lV8ge % expenditure in the public sector,1998-2003
1998 1999 2000 Central Government 27.6 25.9 23.1 Teachers Service Commision 38.5 35.6 31.6 Parastatal Bodies 14.8 17.4 20.2 Majority Control by the public Sector 8.8 9.4 12.3 Local Government 10.3 11.8 12.8 Total 100 100 100 source: OV\ll"l calculation based on economic surveys
Table A.4.3 Recurrent Fiscal analysis trends 1999-2003
Recurrent Revenue B A
0/0 of recurrent collected
Recurrent Expenditure B A
% of rec-expenditure used source: African Development Report, 2004
1999 2000 188,846.40 200,337.71 184,550.77 185,055.16
-4,295.63 -15,282.55 -2.27 -7.63
244,141.80 206,571.40
-37570.4 -15.39
270,038.55 235,065.96
-34972.59 -12.95
53
2001 216,118.33 187,863.79 -28,254.54
. -13.07
269,988.87 283,484.56
13495.69 5.00
2001 2002 2003 878.73 962.69 1091.64 878730 962686 1091640
307;715 304,063 388,552 35.02 31.58 35.59
53,992.0 63,714.0 80,427.4 6.14 6.62 7.37
17.55 20.95 20.70
14.47 16.13 14.36
2001 2002 2003 20.8 29.7 21.9 13.5 14.2 100
2002 223,056.05 210,797.84 -12,258.21
-5.50
292,715.54 272,287.62
-20427.92 -6.98
18.9 17.8 30.3 29.1 22.4 23.3 13.9 14.5 14.5 15.3 100 100.0
2003 233,859.19 237,369.08
3,509.89 1.50
233,859.19 237,369.70
3510.51 1.50