sustainable tourism in national parks and protected areas
TRANSCRIPT
Is the Information Technology Revolution Over?
David M. ByrneFederal Reserve BoardStephen D. Oliner
American Enterprise Institute and UCLADaniel E. Sichel1Wellesley College
ABSTRACT
Given the slowdown in labour productivity growth in the mid-2000s, some have argued that the boost to labour productivity from IT may have run its course. This article contributes three types of evidence to this debate. First, we show that since 2004 IT has continued to make a significant contribution to U.S. labour productivity growth, though it is no longer providing the boost that it did during the productivity resurgence from 1995 to 2004. Second, we present evidence that semiconductor technology, a key ingredient of the IT revolution, has continued to advance at a rapid pace. Finally, we develop projections of growth in trend labour productivity in the U.S. non-farm business sector. The baseline projection of about 1¾ per cent a year is better than recent history but is still below the long-run average of 2¼ per cent. However, we see a reasonable prospect — particularly given the ongoing advance in semiconductors — that the pace of labour productivity growth could rise back up to the long-run average. While the evidence is far from conclusive, we judge that "No, the IT revolution is not over."
RÉSUMÉ
Compte tenu du ralentissement de la croissance de la productivité du travail au milieu des années 2000, certains prétendent que la hausse fulgurante de la productivité du travail grâce à la TI a fini par s'estomper. D'une part, nous constatons que, depuis 2004, la TI contribue toujours de façon significative à la croissance de la productivité du travail aux États-Unis. Par ailleurs, nous présentons des preuves selon lesquelles la technologie des semi-conducteurs, un ingrédient clé de la révolution de la TI, a continué de progresser à un rythme rapide. Enfin, nous élaborons une projection de la croissance de base de la tendance de la productivité du travail dans le secteur des entreprises non agricoles aux États-Unis de 1,75 % par année. Bien que cette statistique laisse entrevoir des gains inférieurs à la normale (mais meilleurs que dans l'histoire récente), nous croyons raisonnablement — surtout compte tenu de la progression continue des semi-conducteurs — que le rythme de croissance de la productivité du travail pourrait revenir à sa moyenne à long terme de 2,25 %. Bien que ces preuves soient loin d'être concluantes, nous croyons que “non, la révolution de la TI n'est pas terminée”.
1 David M. Byrne is a Senior Economist at the Federal Reserve Board. Stephen D. Oliner is a Resident Scholar at the American Enterprise Institute and a Senior Fellow at the UCLA Ziman Center for Real Estate. Daniel E. Sichel is Professor of Economics at Wellesley College. We thank Andrew Sharpe and Chad Syverson for helpful comments and Sophie (Liyang) Sun for exceptional research assistance. We also thank Robert Gordon, Dale Jorgenson, and Dan Hutcheson for providing data and forecasts. The views expressed here are ours alone and should not be attributed to the Board of Governors of the Federal Reserve System, its staff, or any of the other institutions with which we are affiliated. Emails: [email protected], [email protected], [email protected].
20 NU M B E R 25 , S P R I N G 2013
THE RATE OF INCREASE IN labour productivity in the United States — an essential element determining improvements in living standards — slowed in the mid-2000s, as highlighted by Fernald (2012), Gordon (2012), Jorgenson (2012), and Kahn and Rich (2013), among oth-ers. If this development persists, the long-run outlook for economic growth, and for improve-ments in living standards, will have darkened. Accordingly, it is important to identify the source of the slowdown and assess the implica-tions for future growth.
One possible explanation of the slower pace of productivity growth is that the economy has taken a long time to recover from the financial crisis and Great Recession, as the repair of bal-ance sheets has proceeded slowly and as uncer-tainty about the strength of the recovery has held back investment.2 Although the slowdown in labour productivity growth started before the onset of the financial crisis, those developments could, nonetheless, be contributing to the con-tinued tepid advance. Another possibility — advocated most prominently by Cowen (2011) — is that the U.S. economy has entered a long period of stagnation as the easy innovations largely have been exploited already. Gordon (2012 and 2013) has offered a third take on the slowdown, related to Cowen’s. Namely, Gordon argues that the information technology revolu-
tion has mostly run its course and that the boost to productivity growth in the mid-1990s from those developments lasted only about a decade.3
Brynjolfsson and McAfee (2011) and others have made the opposite argument, that the informa-tion technology (IT) revolution still has a long way to run and will continue to dramatically transform the U.S. economy.4 Taking a middle ground, Baily, Manyika, and Gupta (2013) argue that technology (in IT or other fields) is not stagnating but that the future path of productiv-ity is very uncertain. The question raised by this debate is the central focus of this article: is the IT revolution in the United States over?5
Obviously, this question is difficult to answer. The structural transformations and economic benefits spawned by continuing advances in IT are challenging to track and quantify. For exam-ple, what will be the economic consequences of massively greater connectivity with handheld and other devices and ready access to huge amounts of information, of 3-D printing and other dramatic changes in manufacturing pro-cesses, and of the changes brought on by compa-nies like Google, Apple, Facebook, and Amazon that have rapidly come to dominate market seg-ments that were not even imagined some years ago? One way to cut through this complexity is to concentrate on a central theme in these devel-opments — the ability to harness ever-greater
2 Reinhart and Rogoff (2009) documented the typical pattern of slow recovery from financial crises. See Fernald (2012) for a discussion of the performance of productivity before, during, and after the Great Recession.
3 A large literature has examined these issues in the past. For our contribution to this literature and for citations to the earlier literature, see Oliner and Sichel (2000, 2002) and Oliner, Sichel, and Stiroh (2007). An interesting recent paper is Feenstra, Mandel, Reinsdorf, and Slaughter (2013), which presents evidence that about one-eighth of the pickup in labour productivity growth in the United States (and one-fifth of the pickup in multifactor productivity growth) after 1995 reflected mismeasurement in the terms of trade.
4 We use the term IT to refer to the collection of technologies related to computer hardware, software, and communication equipment. Other authors have used the term ICT (referring to information and communi-cation technologies). We regard the two terms as synonymous. Although the IT capital considered in this article encompasses a wide range of assets, it excludes intangible capital other than software. For research that takes intangible capital into account, see Corrado, Hulten, and Sichel (2009), Corrado and Hulten (2012), Corrado, Haskel, Jona-Lasinio, and Iommi (2012), and Oliner, Sichel, and Stiroh (2007).
5 For more on Brynjolfsson's and Gordon’s perspectives, see their debate on TED (Technology, Entertain-ment, Design) on February 26, 2013. Available at http://conferences.ted.com/TED2013/program/guide.php.
I N T E R N A T I O N A L P R O D U C T I V I T Y MO N I T O R 21

computing power that comes in progressively smaller and less expensive packages. That focus on the capital that lies behind the IT revolution drives the analysis in this article. Our analysis is by no means definitive, but we believe it pro-vides a useful contribution to the debate over whether the IT revolution is over.
Our evidence comes in three parts. First, we use the growth accounting framework devel-oped by Oliner and Sichel (2002) and Oliner, Sichel, and Stiroh (2007) to assess the contri-bution of IT to growth in labour productivity. This methodology is well suited to the task because it focuses on the contribution of IT to labour productivity growth from both the useof IT and from efficiency gains in the produc-tion of IT and because it can be updated with the most recent data to provide estimates through 2012. Our growth accounting evi-dence indicates that the contribution of IT to labour productivity growth in the United States from 2004 to 2012 stepped down to roughly its contribution from the mid-1970s to 1995. This evidence supports the view that the contribution from IT is no longer provid-ing the boost to growth in labour productivity that it did during the years of the productivity resurgence from 1995 to 2004. Nonetheless, the IT contribution remains substantia l , accounting for more than a third of labour productivity growth since 2004.
Those results indicate where the economy has been. For the second part of our answer, we use the steady state of our multi-sector growth model to assess the outlook for growth in labour
productivity. This part of the article allows us to translate alternative assumptions about the pace of technological progress in the IT sector and the rest of the economy into an overall growth rate of labour productivity. We find that a plau-sible assessment of these underlying trends points to labour productivity growth for the non-farm business sector of 1.8 per cent annu-ally. This projection is about the same as the average forecast of other productivity analysts.
Our baseline projection represents a modest pickup from the sluggish pace of labour produc-tivity growth experienced since 2004. The pickup reflects ongoing advances in IT and an assumption that those gains and innovations in other sectors spur some improvement in multi-factor productivity (MFP) growth outside of the IT sector relative to its tepid pace from 2004 to 2012.6 These developments feed through the economy to provide a modest boost to labour productivity growth. That said, our projection of growth in labour productivity falls short of the long-run average rate of 2¼ per cent that has prevailed since 1889 and suggests neither a return to rapid growth nor economic stagnation but rather a period of moderate gains.7
Given the ongoing advance in semiconduc-tor technology described below, along with the uneven pattern of productivity growth during earlier epochs of innovation, we also consider an alternative scenario in which a somewhat faster pace of improvement in IT spurs more rapid innovation throughout the economy.8 With plausible assumptions, this alternative scenario generates labour produc-
6 See Baily, Manyika, and Gupta (2013) for a discussion of ongoing innovation in different sectors of the econ-omy.
7 To calculate this long historical average, we used data on output and hours from Kendrick (1961) for 1889-1929 and from the Bureau of Economic Analysis (output) and Kendrick (hours) for 1929-47. Gordon (2010: 25) provides details about the sources of these data series. For 1947-2012, we used data from the Bureau of Labor Statistics on output per hour in the non-farm business sector. The growth rate over each period is calculated as the average log difference between the initial and final year of the period.
8 As Chad Syverson points out in his comments on this article (Syverson, 2013), electrification generated, after a long lag, a period of elevated growth in labour productivity that lasted for about a decade. That pickup was followed by a slowdown, but, subsequently, productivity growth rates picked up again.
22 NU M B E R 25 , S P R I N G 2013
tivity growth of about 2½ per cent, above the long-run historical average.
Finally, we reassess the pace of advance of semiconductor technology.9 We believe that these developments are an essential consider-ation, because exceptionally rapid improve-ments in semiconductor technology — making computing power faster, smaller, and cheaper — have been a key ingredient of the IT revolution. On this front, the official price indexes for semi-conductors developed by the Bureau of Labor Statistics (BLS) show that quality-adjusted semiconductor prices are not falling nearly as rapidly as they did prior to the mid-2000s. This development implies, all else equal, that the pace of technical progress in the semiconductor industry has slowed, a narrative that would com-port well with Gordon's view that the IT revolu-t ion in the United States largely is over. However, our reassessment indicates that tech-nical progress in the semiconductor industry has continued to proceed at a rapid pace. We also provide preliminary results from a separate research project that suggest the BLS price series may have substantially understated the decline in semiconductor prices in recent years.
Our three types of analysis, taken together, provide some useful insights into the question of whether the IT revolution is over. While the growth accounting evidence through 2012 confirms Gordon’s view that the contribution from IT has fallen since 2004, the results from our steady-state analysis and our evidence on semiconductor prices point in a more optimis-tic direction. To answer the question posed in the title of the paper: “No, we do not believe the IT revolution is over.” While our baseline projection anticipates a period of slightly sub-par gains for labour productivity, we see a rea-sonable prospect that the pace of labour
productivity growth could rise back up to its long-run average of 2¼ per cent or even move higher.
Growth Accounting: Analytical Framework, Data, and Results
This section assesses the contributions to the increase in labour productivity from 1974 to 2012 through the lens of a growth accounting model designed to focus on the use and produc-tion of IT capital.
Analytical FrameworkHere we provide a brief overview of the
growth accounting framework. Additional detail can be found in Oliner, Sichel, and Stiroh (2007), henceforth OSS, and the appendix to that article.
The model that underlies our analysis differs from that in OSS only with regard to the treat-ment of intangible capital. Here, we use the measure of non-farm business output in the Nat iona l Income and Product Accounts (NIPAs), which excludes most types of intangi-ble capital other than software. In contrast, OSS incorporated a broader set of intangible assets to explore the role of intangibles in driving pro-ductivity growth. Although that analysis yielded useful insights about the sources of growth, the standard output measure used here lines up with the official data for the United States.
The growth accounting model divides non-farm business into four sectors that produce final output: computer hardware, software, communication equipment, and a large non-IT-producing sector. We also include a sector that produces semiconductors, which are either con-sumed as intermediate input by the domestic final-output sectors or exported. Every sector is
9 For a discussion of the linkages between the pace of innovation in semiconductor manufacturing and semicon-ductor prices, see Aizcorbe, Oliner, and Sichel (2008) and Flamm (2007).
I N T E R N A T I O N A L P R O D U C T I V I T Y MO N I T O R 23
assumed to have constant returns to scale, and we assume the economy is perfectly competitive. In addition, as discussed in OSS, we allow for cyclical variation in the utilization of capital and labour and for adjustment costs that reduce mar-ket output when firms install new capital. The treatment of both adjustment costs and cyclical utilization follows that in Basu, Fernald, and Shapiro (2001).
The appendix to OSS shows that this model generates a standard decomposition of growth in output per hour:(1) ,
where the dots signify growth rates; Y is non-farm business output; H is aggregate hours worked; Kj is capital input of type j (where j = computer hardware, software, communication equipment, and an aggregate of all other tangi-ble capital); α
L and αjK are, respectively, the
income shares for labour and each type of capi-tal; q measures labour composition effects that create a wedge between aggregate labour input and hours worked; and MFP denotes multifactor productivity. Equation 1 expresses the growth in labour productivity as the sum of the contribu-tions from capital deepening, compositional changes in labour input, and multifactor pro-ductivity.10
The other key result from the model is an expression for the decomposition of aggregate MFP growth into sectoral contributions:(2) ,
where i indexes the final-output sectors (com-puter hardware, software, communication
equipment, and all other non-farm business); Sdenotes the semiconductor sector; and each µrepresents gross output in that sector divided by aggregate value added, both in current dollars. Thus, aggregate MFP growth equals a share-weighted sum of the sectoral MFP growth rates.
We estimate these sectoral growth rates with the “dual” method that employs data on prices of output and inputs, rather than data on quanti-ties. Because the necessary price data are avail-able much sooner than the corresponding quantity data, the dual method allows us to cal-culate more timely estimates of sectoral MFP growth.
DataFor the most part, the data sources track those
used in OSS and Oliner and Sichel (2000, 2002), which relied heavily on data from the BLS and the NIPAs. That said, we have made some changes to our data sources. We highlight briefly a few key changes here, with details on our data sources provided in an appendix avail-able online.11
For our capital deepening estimates, we are now working from a higher level of aggregation than in our earlier research. Previously, we built up estimates of capital deepening from data on 63 different types of assets, including detail on dif-ferent types of hardware and software. Now, for the period from 1987 to 2010 for which the BLS provides extensive data, we are starting directly with BLS estimates for hardware, software, and communication equipment; that is, we are using the BLS aggregation within these categories rather than doing our own aggregation. Similarly,
10 Equation 1 simplifies one aspect of the expression derived in OSS. Technically, the weight on the capital deep-ening term for type j capital equals its income share minus the elasticity of adjustment costs with respect to that type of capital. We have suppressed the adjustment cost elasticity in equation 1. Because empirical esti-mates of asset-specific adjustment cost elasticities are not available, OSS approximated the theoretically cor-rect weights with standard income shares. We do the same here and simply start from that point in equation 1. The approximation does not affect the total weight summed across the capital terms, as the theoretically cor-rect weights and the standard capital income shares both sum to one minus the labour share. But the approx-imation could result in some misallocation of the weights across types of capital.
Y· H·– αjK
j∑ K· j H·–( ) αLq· MFP·+ +=
MFP· µi MFP·i
i∑ µsMFP·
s+=
11 The Data Appendix can be found at http://www.csls.ca/ipm/25/appendix-byrne-oliner-sichel.pdf.
24 NU M B E R 25 , S P R I N G 2013

we are relying directly on BLS data for estimates of overall capital deepening. For 2011 and 2012 we extend the BLS data using NIPA data at this higher level of aggregation. Before 1987, the BLS does not provide the necessary detail for IT capi-tal on its website, and we splice in estimates from the data constructed in OSS.
For the decomposition of MFP growth into sectoral contributions, we now use different price indexes for the output of the communica-tions sector and the semiconductor sector. For the communications sector, we use the price index developed by Byrne and Corrado (2007), which falls more rapidly than does the NIPA
price index for communication equipment. For semiconductor prices, we use the new index developed for the Federal Reserve’s Industrial Production data.12 The Fed's series incorpo-rates a new hedonic index for microprocessors (MPUs) since 2006 that falls more rapidly than the current BLS price index.
ResultsTable 1 summarizes our growth accounting
results, both for the decomposition of labour productivity growth into capital deepening and aggregate MFP (to highlight IT use) and for the decomposition of MFP growth by sec-
12 This index was incorporated into the Industrial Production data in March 2013.
Table 1 Contributions to Growth of Labour Productivity in the U.S. Non-Farm Business Sectora
Source: Authors’ calculations.
a. Detail may not sum to totals due to rounding.
b. Measured as 100 times average annual log difference for the indicated years.
c. Sum of lines 3 and 13.
1974-1995(1)
1995-2004 (2)
2004-2012(3)
Change between 1974-
1995 and 1995-2004(2) – (1)
Change between 1995-
2004 and 2004-2012(3) – (2)
1. Growth of labour productivityb 1.56 3.06 1.56 1.50 -1.50
Contributions (percentage points per year):
2. Capital deepening 0.74 1.22 0.74 0.48 -0.48
3. IT capital 0.41 0.78 0.36 0.37 -0.42
4. Computer hardware 0.18 0.38 0.12 0.20 -0.26
5. Software 0.16 0.27 0.16 0.11 -0.11
6. Communication equipment 0.07 0.13 0.08 0.06 -0.05
7. Other capital 0.33 0.44 0.38 0.11 -0.06
8. Labour composition 0.26 0.22 0.34 -0.04 0.12
9. Multifactor productivity (MFP) 0.56 1.62 0.48 1.06 -1.14
10. Effect of adjustment costs 0.07 0.07 -0.02 0.00 -0.09
11. Effect of utilization -0.01 -0.06 0.16 -0.05 0.22
12. MFP after adjustments 0.50 1.61 0.34 1.11 -1.27
13. IT-producing sectors 0.36 0.72 0.28 0.36 -0.44
14. Semiconductors 0.09 0.37 0.14 0.28 -0.23
15. Computer hardware 0.17 0.17 0.04 0.00 -0.13
16. Software 0.06 0.10 0.08 0.04 -0.02
17. Communication equipment 0.05 0.07 0.02 0.02 -0.05
18. Other non-farm business 0.13 0.90 0.06 0.77 -0.84
Memo:
19. Total IT contributionc 0.77 1.50 0.64 0.73 -0.86
I N T E R N A T I O N A L P R O D U C T I V I T Y MO N I T O R 25

SoftwarComputand Sem
0
0.5
1
1.5
2
2.5
3
3.5
4
1974 1978
(per cent of no
Chart 1 Current-dollar
Source: Authors' ca
eers, Communication Equipment, iconductors
1982 1986 1990 1994 1998 2002 2006 2010
nfarm business output)
tor (to highlight efficiency gains in IT pro-duction).
As can be seen from the first three columns, labour productivity growth from 2004 to 2012 ran at just above an annual rate of 1½ per cent, down considerably from the elevated pace of the 1995-2004 period and in line with the disap-pointing average rate that prevailed over the prior two decades. The sources of labour pro-ductivity growth follow a similar pattern, with both the contribution of overall capital deepen-ing and MFP growth falling off over 2004-2012 to about the pace observed from 1974 to 1995.
The memo item in the table shows the com-bined contribution to labour productivity growth from the use and production of IT. That contribution was 0.64 percentage point from 2004 to 2012, down significantly from its value from 1995 to 2004 and even a little below its contribution from 1974 to 1995. Nonetheless, the contribution of IT to labour productivity
growth remains sizable, accounting for more than one-third of the growth in labour produc-tivity from 2004 to 2012. The substantial contri-bution of IT is notable given that the share of total income accruing to IT capital remains small and that the IT-producing sector has never accounted for as much as 7 per cent of current-dollar output in non-farm business (Chart 1).
As for the separate contributions from the use of IT (capital deepening) and from efficiency gains in the production of IT, the patterns are similar, with the contributions over 2004-2012 well off from the rapid pace during 1995-2004 and just a little below the contribution from 1974 to 1995. The slowdown in the contribution from the production of IT reflects both a slower pace of advance of MFP in each IT sector and a sizable step-down in the current-dollar output share of the industries producing computer hardware, communication equipment, and semiconductors. This drop reflects substantial movement of IT manufacturing from the United States to foreign locations. Indeed, as shown in Chart 1, the share of current-dollar non-farm business output represented by the production of computer hardware, communica-tion equipment, and semiconductors has fallen more than 70 per cent from its peak in 2000.13 In contrast, the output share of the software indus-try was higher from 2004 to 2012 than in either of the earlier periods.
These estimates reinforce Gordon’s story that the contribution of the IT revolution has been disappointing since the mid-2000s. That said, sorting out the implications of these results for the future role of IT in the U.S. economy is difficult. One possibility is that the IT revolution largely has run its course and will provide much less of a lasting imprint on living standards than did the earlier epochs
13 As discussed later in the article, these shares likely are understated because the domestic activity of these firms is mismeasured to some extent. However, correcting any such mismeasurement would leave the trends in Chart 1 intact.
Output Shares for IT Industries
lculations.
26 NU M B E R 25 , S P R I N G 2013

of innovation. Another possibility is that the boost to labour productivity growth is taking a pause during the transition from the personal computer (PC) era to the post-PC era. Just as a long lag transpired from the development of the PC in the early 1980s to the subsequent pickup in labour productivity growth, there could be a lagged payoff from the develop-ment and diffusion of extensive connectivity, handheld dev i ces , and ever-grea ter and cheaper computing power.
In 1987, Robert Solow (Solow, 1987:36) famously said “You see the computer revolu-tion everywhere except in the productivity data.” As highlighted by Oliner and Sichel (1994), computers comprised too small a share of the capital stock in 1987 to have made a large contribution to overall productivity growth. But, several years later, the imprint of the revolution became very evident. In a par-allel vein, one could now say: “You see massive connectivity and ever-cheaper computing power everywhere but in the productivity data .” Subsequently, those contributions could become evident in aggregate data. That, of course, is just speculation about the future. The next part of our analysis looks ahead to highlight plausible paths for labour produc-tivity growth in the years ahead.
Outlook for Productivity Growth
We now turn to the outlook for labour pro-ductivity in the United States. The first part of this section uses the steady state of our growth accounting model to develop estimates of future growth of labour productivity. We then compare the steady-state results to the projections from a variety of other sources.
Steady-state AnalysisWe update the steady-state analysis in Oliner
and Sichel (2002) and OSS to incorporate the lat-est available data. As in that earlier work, we impose a set of conditions on the growth account-ing model to derive an expression for the growth of labour productivity in the steady state. These conditions include that (i) real output in each sec-tor grows at a constant rate (which differs across sectors); (ii) real investment in each type of capital grows at the same constant rate as the real stock of that capital; (iii) labour hours grow at the same constant rate in every sector; (iv) the work week is constant; and (v) the growth contribution from the change in labour composition is constant.
Under these conditions, the appendix to OSS shows that the steady-state growth of aggregate labour productivity can be expressed as:(3)
with(4)
As before, the ’s denote income shares for each type of capital, is the semiconductor share of total costs in final-output sector i, is the change in labour composition, and the ’s denote current-dol-lar output shares in each sector. The expression for aggregate MFP growth in equation 4 is unchanged from equation 2, the expression that holds outside the steady state. Although no explicit terms for cap-ital deepening appear in equation 3, capital deepen-ing is determined endogenously from the improvement in technology. The terms in brackets capture the growth contribution from this induced capital deepening. Accordingly, equation 3 shows that steady-state growth in output per hour equals the sum of growth in MFP, the change in labour composition, and the contribution from the capital deepening induced by MFP growth.14
14 In the steady state, cyclical factors and adjustment costs have no effect on MFP growth. These effects disap-pear as a consequence of assuming that the work week is constant and that investment and capital stock grow at the same rate for each type of capital.
Y· H·– αiK αL⁄( )[
i∑ MFP·
i βisMFP·
s–( ) ] q· MFP·+ +=
MFP· µi MFP·i
i∑ µsMFP·
s+=
αiK
βis
q·
µ
I N T E R N A T I O N A L P R O D U C T I V I T Y MO N I T O R 27

Table 2 Steady-State GNon-Farm Busi
Source: Authors' es
a. Detail may not
b. Uses midpoint v
c. Uses upper-bouvalue for MFP gto midpoint val
d. After excluding
e. Equals the prodand the sector's
f. For effects of a
Source Growth of labour pr(per cent per year)
Contributions (perce
Capital deepening
Change in labour co
MFP
IT-producing secto
Other non-farm bu
Adjustmentsf
Memo:
MFP growth in othe
Steady-state growth in labour productivity depends on a large number of parameters — about 30 in all after accounting for those that lie behind the income shares and sectoral MFP growth rates shown in equations 3 and 4. We consider a range of values for these parameters. The complete list can be found in Appendix Table A1. Individually, most of these parameters do not have large effects on the steady-state growth rate. However, two parameters in equa-tions 3 and 4 are important: the rate of improve-ment in labour composition and MFP growth for non-farm business outside the IT-producing sector (“other non-farm business”). For labour
composition effects, we rely on the latest projec-tion based on the methodology in Jorgenson, Ho, and Stiroh (2005).15 In this projection, changes in labour composition boost labour productivity growth only 0.07 percentage point per year on average between 2012 and 2022, as educational attainment is anticipated to reach a plateau. To allow for uncertainty around this projection, we specify a range that runs from 0 to 0.14 percentage point. For MFP growth in other non-farm business, we use values that range from 0.06 to 0.62 per cent per year. The lower bound equals the average growth rate from 2004 to 2012, while the upper bound equals two-thirds of the much faster pace regis-tered from 1996 to 2004, which would be a nota-ble improvement over the recent performance.16
Using equations 3 and 4, we find that steady-state growth in labour productivity ranges from an annual rate of 0.88 per cent (when each parameter is set to its lower-bound value) to 2.82 per cent (using the upper-bound values). The wide range reflects the uncertainty about the future values of the underlying parameters. To obtain a baseline steady-state estimate, we set each parameter to the midpoint of its range. The resulting estimate of 1.80 per cent, shown in Table 2, is about 1/4 percentage point above the relatively small gains recorded on average since 2004. The contributions from capital deepening and MFP move up notably from the 2004-2012 pace, but these larger contributions are offset in part by the reduced contribution from labour composition.17
Table 2 also presents an alternative scenario that embeds a somewhat more optimistic view about the outlook for information technology.
15 We received this projection from Dale Jorgenson by email on December 19, 2012.
16 Although the steady-state projection does not apply to a specific time period, we think of it as pertain-ing to the outlook five to ten years ahead.
17 This contribution declines not only because of the projection that educational attainment will plateau, but also because the job losses during the Great Recession were skewed toward less educated workers, which shifted the mix of employment over 2004-12 toward more skilled workers, boosting the labour composition effect over that period.
rowth of Labour Productivity in the U.S. ness Sectora
timates.
sum to totals due to rounding.
alues for all parameters.
nd values for decline in IT-sector prices and upper-bound rowth in other non-farm business. All other parameters set ues.
the effects of adjustment costs and cyclical utilization.
uct of MFP growth in this sector (shown in the memo line) share of non-farm business output (which is close to one).
djustment costs and cyclical utilization.
History Steady State .
2004-12 Baselineb Alternativec
oductivity 1.56 1.80 2.47
ntage points per year):
0.74 1.03 1.34
mposition 0.34 0.07 0.07
0.48 0.70 1.06
rsd 0.29 0.38 0.46
sinessd,e 0.05 0.33 0.60
0.14 0.00 0.00
r non-farm business 0.05 0.34 0.62
28 NU M B E R 25 , S P R I N G 2013

tivity Growth
007:Table 12) and 13:Table 2-2); Fer-010), with adjust-roductivity Model
kfed.org/research/rve Bank of Phila- 2013, Table 7.
of .
2012-131.8
2.1
1.9
1.75
1.8
1.8
1.9
In this alternative scenario, we allow for faster MFP growth in the IT-producing sectors by set-ting the rate of decline in output prices in each component industry to its upper-bound value. With this change, semiconductor prices fall 6 percentage points (at an annual rate) more quickly than in the baseline, while the speedup in the other IT sectors ranges from about 1 per-centage point (software) to 3¾ percentage points (computer hardware). These price changes are not especially large in the context of the observed variation since 1974 (see Appendix Table A1). We assume that the resulting faster diffusion of new technology boosts MFP growth in the rest of non-farm business from the base-line value of 0.34 per cent annually to the upper-bound value of 0.62 per cent. All other parame-ters remain at their baseline values.
With these changes, steady-state growth of labour productivity rises to 2.47 per cent at an annual rate, almost ¾ percentage point above the baseline estimate. The faster assumed MFP growth directly augments the rate of increase in labour productivity. It also has a multiplier effect by inducing additional capital deepening. This scenario illustrates that it would not take a very large increase in the impetus from IT to raise labour productivity growth back to the neighborhood of its long-term historical aver-age of 2¼ per cent or above.
Other EstimatesTable 3 compares our steady-state results to
the projections of future growth in labour pro-ductivity from other analysts. The table displays the most recent projections from each source, along with the earlier projections that were pre-sented in OSS.18 As shown, the earlier projec-tions ranged from 2.0 per cent to 2.5 per cent at an annual rate, with an average of 2.3 per cent —
the same as the midpoint of the steady-state range in OSS. These earlier projections all have been revised down, some quite substantially. The average markdown from 2.3 per cent to 1.9 per cent virtually matches the downward revi-sion in our steady-state estimate. Thus, com-pared with projections from six years ago, the average projected growth of labour productivity has moved down from about the long-run his-torical average to a pace somewhat below that average.
We would stress that the similarity among these projections belies the high degree of uncer-tainty about future productivity growth. The range of estimates from our steady-state frame-work hints at this uncertainty. The low end of the range (less than 1 per cent) represents a dismal rate of productivity growth from a historical per-spective, while the top end (about 2.8 per cent) is well above the historical average. The only pro-jection in the table with a statistically-based con-fidence range is that from Kahn and Rich (2013).
18 With only a few exceptions, these projections refer to the non-farm business sector as defined by BLS over horizons of ten years or more. Among the exceptions, Kahn and Rich (2013) employ a five-year horizon, while there is no explicit projection period in Fernald (2012). In addition, Fernald's projection refers to the private business sector, which includes the farm sector.
Table 3 Alternative Projections of U.S. Labour Produc(per cent per year)
Sources: 2007 estimates from Oliner, Sichel, and Stiroh (22012-13 estimates from Congressional Budget Office (20nald (2012) “Benchmark Scenario” in Table 2; Gordon (2ment provided in private correspondence; Kahn-Rich PUpdate (February 2013) posted at http://www.newyornational_economy/richkahn_prodmod.pdf; Federal Resedelphia, Survey of Professional Forecasters, February 15,
a. Median forecast in the survey.
SourceAs
20071. Baseline steady-state estimate 2.3
2. Congressional Budget Office 2.3
3. John Fernald n.a.
4. Robert Gordon 2.0
5. James Kahn and Robert Rich 2.5
6. Survey of Professional Forecastersa 2.2
Average of lines 2 through 6 2.3
I N T E R N A T I O N A L P R O D U C T I V I T Y MO N I T O R 29
In their regime-switching model, the 75 per cent confidence band for productivity growth five years ahead runs from slightly below zero to about 4 per cent. Suffice it to say, productivity growth is extremely hard to predict. Almost all analysts have failed to anticipate the major shifts in growth over the past several decades, and we should not expect better going forward.
Trends in Semiconductor Technology
The contribution of information technology to economic growth depends importantly on the improvements in the semiconductor chips embedded in IT capital goods and on prices of those chips. This section presents the latest available information on technological progress in the semiconductor industry and on chip prices.
Technology CyclesAs discussed in Aizcorbe, Oliner, and Sichel
(2008), there is a broad consensus that the pace of technical advance in the semiconductor industry sped up in the mid-1990s, a develop-ment first brought to the attention of econo-mists by Jorgenson (2001). The standard definition of a semiconductor technology cycle is the amount of time required to achieve a 30 per cent reduction in the width of the smallest feature on a chip. Because chips are rectangular, a 30 per cent reduction in both the horizontal and vertical directions implies about a 50 per cent reduction (0.7*0.7) in the area required for the smallest chip component.
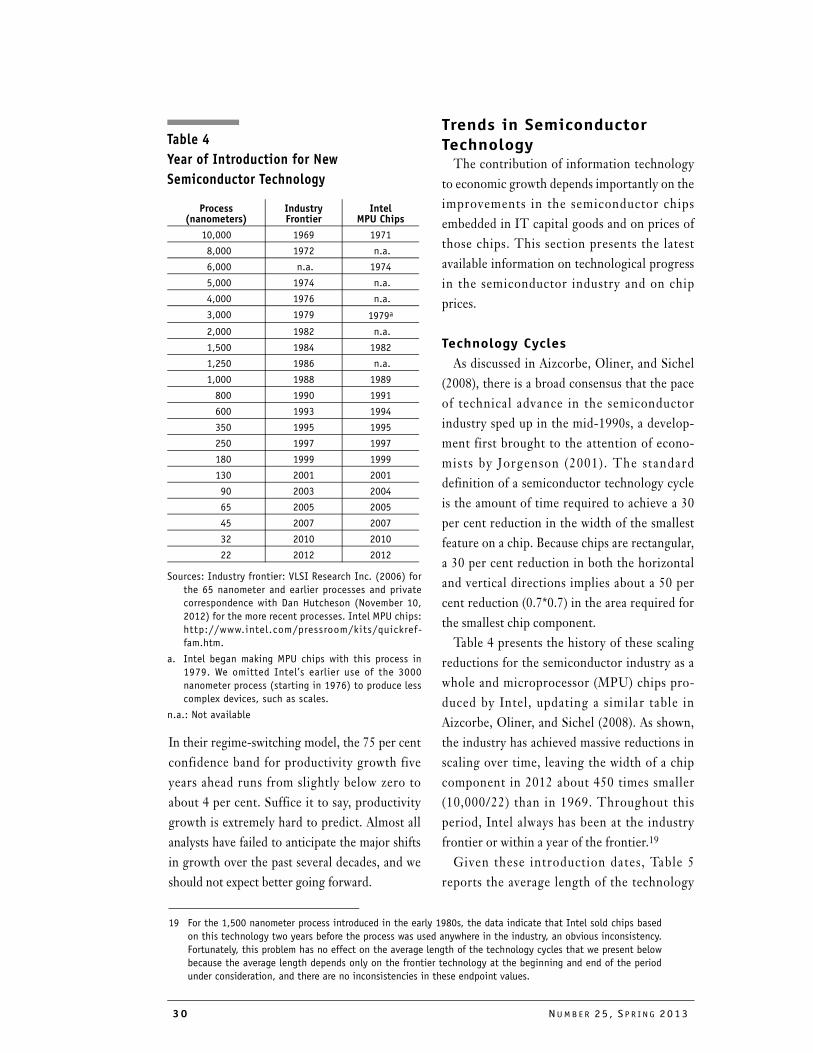
Table 4 presents the history of these scaling reductions for the semiconductor industry as a whole and microprocessor (MPU) chips pro-duced by Intel, updating a similar table in Aizcorbe, Oliner, and Sichel (2008). As shown, the industry has achieved massive reductions in scaling over time, leaving the width of a chip component in 2012 about 450 times smaller (10,000/22) than in 1969. Throughout this period, Intel always has been at the industry frontier or within a year of the frontier.19
Given these introduction dates, Table 5 reports the average length of the technology
19 For the 1,500 nanometer process introduced in the early 1980s, the data indicate that Intel sold chips based on this technology two years before the process was used anywhere in the industry, an obvious inconsistency. Fortunately, this problem has no effect on the average length of the technology cycles that we present below because the average length depends only on the frontier technology at the beginning and end of the period under consideration, and there are no inconsistencies in these endpoint values.
Table 4 Year of Introduction for New Semiconductor Technology
Sources: Industry frontier: VLSI Research Inc. (2006) for the 65 nanometer and earlier processes and private correspondence with Dan Hutcheson (November 10, 2012) for the more recent processes. Intel MPU chips: http://www.intel.com/pressroom/kits/quickref-fam.htm.
a. Intel began making MPU chips with this process in 1979. We omitted Intel’s earlier use of the 3000 nanometer process (starting in 1976) to produce less complex devices, such as scales.
n.a.: Not available
Process (nanometers)
Industry Frontier
Intel MPU Chips
10,000 1969 1971
8,000 1972 n.a.
6,000 n.a. 1974
5,000 1974 n.a.
4,000 1976 n.a.
3,000 1979 1979a
2,000 1982 n.a.
1,500 1984 1982
1,250 1986 n.a.
1,000 1988 1989
800 1990 1991
600 1993 1994
350 1995 1995
250 1997 1997
180 1999 1999
130 2001 2001
90 2003 2004
65 2005 2005
45 2007 2007
32 2010 2010
22 2012 2012
30 NU M B E R 25 , S P R I N G 2013

2008 2010 2012
ear scaling) Chips .
Years2.9
1.9
1.9
2.0
PPIFederal Reserve
-80
-70
-60
-50
-40
-30
-20
-10
0
1992 1994 1996 1998 2000 2002 2004 2006
(per cent change from previous year)
cycle (as defined above) for various periods. For the industry as a whole, the technology cycle averaged three years unti l 1993 and then dropped to about two years from 1993 to 2012. Within the later period, the scaling advances were especially rapid from 1993 to 2003 and a bit slower after 2003. Even so, the average cycle since 2003 has remained substantially shorter than the three-year cycle in effect before the 1990s. For Intel's MPU chips, there has been no pullback at all from the two-year cycle. The upshot is that the cycles in semiconductor tech-nology — a key driver of quality improvement in IT products — have remained rapid.
While the pace of miniaturization has been sustained, semiconductor producers have changed the approach used to translate these engineering gains into faster performance. His-torically, each new generation of technology in semiconductors has allowed for an increase in the number of basic calculations performed per second for a given chip design. However, as speed continued to increase, dissipating the gen-erated heat became problematic. In response, Intel shifted in 2006 toward raising “clock-speed” more slowly and boosted performance instead by placing multiple copies of the core architecture on each chip — a change enabled by smaller feature size — and by improving the design of those cores (Shenoy and Daniel, 2006).
The effect of this strategy on the rate of increase in performance for end users has been a matter of some debate. Pillai (2013) examines the record and presents evidence that scores for Intel MPUs on benchmark per-formance tests — based on standard tasks designed to reflect the needs of computer users — rose more slowly from 2001 to 2008 than in the 1990s. Our own examination of more recent data suggests the slower rate of per formance improvement has pers i s ted through 2012. Nonetheless , even on this slower trend, our results show that the end-
user per formance o f In te l ’s MPU ch ips improved roughly 30 per cent per year on average from 2001 to 2012. End users have continued to see substantial gains in perfor-mance, just not the extraordinary rate of increase recorded in the 1990s.
Prices for MPUsAdvances in semiconductor technology have
driven down the constant-quality prices of MPUs and other chips at a rapid rate over the past several decades.20 These declines, in turn, have lowered the prices of computer hardware, communication equipment, and other goods in which the chips are embedded, spurring the dif-
Table 5 Semiconductor Technology Cycles(Years needed for 30 per cent reduction in lin
Source: Authors' calculations from data in table 4.
Industry Frontier Intel MPUPeriod Years Period
1969-1993 3.0 1971-1994
1993-2012 2.1 1994-2012
1993-2003 1.9 1994-2004
2003-2012 2.3 2004-2012
Chart 2 Price Indexes for Microprocessors (MPUs)
Sources: BLS and Federal Reserve Board.
I N T E R N A T I O N A L P R O D U C T I V I T Y MO N I T O R 31

fusion of IT capital goods throughout the econ-omy. Thus, semiconductor prices play a central role in our assessment of whether the IT revolu-tion still has legs.
On this score, the recent data on MPU prices, as measured by the producer price index (PPI), are not encouraging. As shown by the solid line in Chart 2, from the late 1990s — when the BLS adopted the current PPI methodology — to 2007, MPU prices fell at an average annual rate of about 50 per cent. But the rate of decline slowed in each year after 2007, so much so that the price index barely fell at all in 2012. The PPI data, if correct, would indicate that a fundamen-tally adverse shift in semiconductor price trends has taken place over the past several years.
In a separate in-progress paper, we are devel-oping a new hedonic price index for MPUs, and some key results from that article are reported here. We compiled wholesale price lists for Intel MPUs and matched these prices to benchmark performance scores and other chip characteris-tics.21 We then estimated a hedonic regression back to 2006 using only the list price at the time of introduction. We omitted the list prices for subsequent periods because in many cases those prices were not adjusted down when a more powerful, closely-related chip entered the mar-ket, contrary to the pattern in earlier years. The absence of price adjustment raises concern that existing chips are being sold at a discount rela-tive to the constant list price that widens when new models are introduced. Thus, to the extent that significant chip sales are taking place at transaction prices that fall ever further below the list prices, a standard procedure that relied
on those list prices or other similar prices reported by manufacturers would be biased. Our hedonic index, which only uses prices at the time of each new chip’s introduction, provides a very rough way of avoiding this potential bias. This new hedonic index was incorporated into the Federal Reserve's March 2013 annual revision of its industrial production indexes.22
The key result from this new price index is that MPU prices have remained on a fairly steep downtrend, in sharp contrast to the picture painted by the PPI. The dashed line in Chart 2 presents the MPU price index constructed by Federal Reserve staff from its inception in 1992 through 2011, the final year that incorporates the new hedonic results. The Fed index of MPU prices fell at an average annual rate of 36 per cent from 2006 to 2011, somewhat less than that observed during the period of extraordinary productivity gains in the late 1990s, but substan-tially greater than the drop in the PPI in recent years. Moreover, unlike the PPI, the Fed's index provides no sign of a trend toward slower price declines over the past several years. All in all, the Fed's MPU price index lines up reasonably well with the MPU performance data described above — both series have reverted to historically normal rates of change after a period of unusu-ally rapid performance gains and price declines.
Other IT-Related Measurement Issues
Beginning in the 1970s, many studies of semi-conductors, computers, communication equip-ment, and software have concluded that quality-adjusted IT prices have fallen at remarkable
20 Chips other than MPUs and memory (including those used in smartphones) are often produced using a technol-ogy behind the frontier. These chips adopt new technology, albeit with a lag. This process transmits the price declines at the frontier to a wide range of different chips.
21 Although we do not have access to BLS' source data, comments by BLS staff indicate that published wholesale price lists for MPUs have been used to supplement the data collected by the PPI survey (Hold-way, 2001). We focus on Intel because of its large share of domestic MPU production.
22 For additional information, see the discussion of the revision at http://www.federalreserve.gov/releases/g17/revisions/Current/DefaultRev.htm. The price index is available at http://www.federalreserve.gov/releases/g17/download.htm.
32 NU M B E R 25 , S P R I N G 2013

rates, and indexes capturing these price declines have been incorporated into the NIPAs in many cases (Wasshausen and Moulton, 2006). How-ever, despite this considerable progress on mea-suring IT prices, some important measurement challenges remain to be addressed. Here, we list three rather different areas that, in our view, would benefit from additional research.
First, investment in software is the largest component of IT investment, and quality adjust-ment has proven difficult for this category. While the BEA has closely studied software prices, this area has proved a tough nut to crack, and the agency is still using proxies for the prices of a significant fraction of software. With these proxies, the BEA’s prices for own-account and custom software have increased in recent years. For prepackaged software, Copeland (2013) finds sizable declines in quality adjusted prices using scanner data.23 Those declines are faster than those in the PPI for prepackaged software and contrast sharply with the price increases for custom and own-account software, suggesting that further work on software prices would be valuable.
Second, even if well-constructed price indexes for all IT equipment and software were avail-able, the impact of the IT revolution may be understated for a very different reason. It has become common for U.S. manufacturing firms to outsource fabrication of electronics, fre-quently to offshore locations, but to retain the design and management tasks within the com-pany, often in domestic locations. Because these so-called “factoryless manufacturers” may cre-ate the intellectual property and bear the entre-preneuria l r isk for products with rapidly increasing quality, the real value-added of these
establishments arguably should reflect the inno-vation embodied in the product. Because in practice this activity is often classified within wholesale trade, the resulting output is not counted as part of the IT sector of the economy. Early studies of companies using the factoryless business model indicate this may be an apprecia-ble share of economic activity (Bayard, Byrne, and Smith, 2013, and Doherty, 2013).
Finally, IT as defined in this article does not encompass all products with significant elec-tronic content. We expect the prices for a broad array of electronic equipment would reflect the price declines for their semiconductor inputs, including navigation equipment, electromedical equipment, and a variety of types of industrial process equipment.24 In fact, the PPIs for the output of these industries increase in most cases, again raising an important question for price analysts to investigate.25
These three rather different concerns all point to the possibility that the full impact of the IT revolution has not yet been recorded.
ConclusionIs the information technology revolution
over? In light of the slower pace of productiv-ity gains since the mid-2000s, Robert Gordon has argued that the boost to productivity growth from adoption of IT largely had run its course by that point. Erik Brynjolfsson and others make the opposite case, arguing that dramatic transformations related to IT con-tinue and will leave a significant imprint on economic activity. We bring three types of evidence to this debate, focusing on the IT capital that underlies IT-related innovations in the economy.
23 Also, see Prud’homme, Sanga, and Yu (2005) for similar evidence using Canadian scanner data.
24 Even products within the IT category may benefit from a closer look. For example, Chwelos, Berndt, and Cockburn (2008) develop hedonic price indexes for personal digital assistants from 1999 to 2004 and find average price declines ranging from 19 to 26 per cent per year.
25 A BLS paper by Holdway (2011) on the use of hedonics indicates that resource constraints have limited the expansion of the use of hedonic techniques.
I N T E R N A T I O N A L P R O D U C T I V I T Y MO N I T O R 33

What does this evidence show? Our analysis indicates that the contributions of IT to labour productivity growth from 2004 to 2012 look much as they did before 1995, supporting Gor-don’s side of the argument. Our baseline projec-tion of the trend in labour productivity points to moderate growth, better than the average pace from 2004 to 2012, but still noticeably below the very long-run average rate of labour productiv-ity growth. On the more optimistic side, we present evidence that innovation for semicon-ductors is continuing at a rapid pace, raising the possibility of a second wave in the IT revolution, and we see a reasonable prospect that the pace of labour productivity growth could rise to its long-run average of 2¼ per cent or even above. Accordingly, with all the humility that must attend any projection of labour productivity, our answer to the title question of the paper is: No, the information technology revolution is not over.
ReferencesAizcorbe, Ana, Stephen D. Oliner, and Daniel E.
Sichel (2008) “Shifting Trends in Semiconductor Prices and the Pace of Technological Progress,” Business Economics, Vol. 43, No. 3, pp. 23-39.
Baily, Martin N., James L. Manyika, and Shalabh Gupta (2013) “U.S. Productivity Growth: An Optimistic Perspective,” International Productiv-ity Monitor, No. 25, Spring, pp. 3-12.
Basu, Susanto, John G. Fernald, and Matthew D. Shapiro (2001) “Productivity Growth in the 1990s: Technology, Utilization, or Adjustment?” Carnegie-Rochester Series on Public Policy, Vol. 55, pp. 117-65.
Bayard, Kimberly, David Byrne, and Dominic Smith (2013) “The Scope of U.S. Factoryless Manufac-turing.” http://www.upjohn.org/MEG/papers/baybyrsmi.pdf.
Brynjolfsson, Erik, and Andrew McAfee (2011) Race Against the Machine: How the Digital Revolution is Accelerating Innovation, Driving Productivity, and Irreversibly Transforming Employment and the Economy (Digital Frontier Press).
Byrne, David and Carol Corrado (2007) “Prices for Communications Equipment: Rewriting a 46-Year Record,” National Bureau of Economic Research conference paper, July.
Chwelos, P.D., Ernst. R. Berndt, and Iain M. Cock-burn (2008) “Faster, Smaller, Cheaper: An Hedonic Price Analysis of PDAs,” Applied Eco-nomics, Vol. 40, pp. 2839-56.
Congressional Budget Office (2013) The Budget and Economic Outlook: Fiscal Years 2013 to 2023. Washington (August). http://www.cbo.gov/sites/default/files/cbofiles/attachments/43907-Bud-getOutlook.pdf.
Copeland, Adam (2013) “Seasonality, Consumer Heterogeneity and Price Indexes: the Case of Prepackaged Software,” Journal of Productivity Analysis, Vol. 39, pp. 47-59.
Corrado, Carol, Jonathan Haskel, Cecilia Jona-Las-inio, and Massimiliano Iommi (2012) “Intangible Capital and Growth in Advanced Economies: Measurement Methods and Comparative Results,” IZA Discussion Paper No. 6733, July.
Corrado, Carol and Charles Hulten (2012) “Innova-tion Accounting,” The Conference Board, Eco-nomics Program Working Paper No. 12-04, October.
Corrado, Carol, Charles Hulten, and Daniel Sichel (2009) “Intangible Capital and U.S. Economic Growth,” Review of Income and Wealth, Vol. 55, No. 3, pp. 661-85.
Cowen, Tyler (2011) The Great Stagnation: How America Ate All the Low-Hanging Fruit of Modern History, Got Sick, and Will (Eventually) Feel Better Again (Dutton).
Doherty, Maureen (2013) “Reflecting Factoryless Goods Production in the U.S. Statistical Sys-tem.” http://www.upjohn.org/MEG/papers/Doherty_Reflecting%20Factoryless% 20GoodsProduction.pdf.
Feenstra, Robert C., Benjamin R. Mandel, Marshall B. Reinsdorf, and Matthew J. Slaughter (2013) “Effects of Terms of Trade Gains and Tariff Changes on the Measurement of U.S. Productiv-ity Growth,” American Economic Journal: Eco-nomic Policy, Vol. 5, No. 1 pp. 59-93.
Fernald, John (2012) “Productivity and Potential Output before, during, and after the Great Recession,” Federal Reserve Bank of San Fran-cisco, Working Paper 2012-18. http://www.frbsf.org/publications/economics/papers/2012/wp12-18bk.pdf.
Flamm, Kenneth (2007) “The Microeconomics of Microprocessor Innovation,” National Bureau of Economic Research conference paper, July.
Gordon, Robert J. (2010) “Revisiting U.S. Produc-tivity Growth over the Past Century with a View of the Future,” NBER Working Paper No. 15834. http://www.nber.org/papers/w15834.
Gordon, Robert J. (2012) “Is U.S. Economic Growth Over? Faltering Innovation Confronts the Six
34 NU M B E R 25 , S P R I N G 2013

Headwinds,” NBER Working Paper No. 18315. http://www.nber.org/papers/w18315.
Gordon, Robert J. (2013) “U.S. Productivity Growth: The Slowdown Has Returned After a Temporary Revival,” International Productivity Monitor, No. 25, Spring, pp. 13-19.
Grimm, Bruce (1998) “Price Indexes for Selected Semiconductors, 1974-96,” Survey of Current Business, Vol. 78, February, pp. 8-24.
Holdway, Michael (2001) “An Alternative Methodol-ogy: Valuing Quality Change for Microproces-sors in the PPI,” paper presented at Issues in Measuring Price Change and Consumption Conference, Bureau of Labor Statistics, Wash-ington DC, June 5-8, 2000. Revised January.
Holdway, Michael (2011) “Hedonic Methods in the Producer Price Index.” http://www.bls.gov/ppi/ppicomqa.htm.
Jorgenson, Dale W. (2001) “Information Technology and the U.S. Economy,” American Economic Review, Vol. 91, No. 1, pp. 1-32.
Jorgenson, Dale W. (2012) “A Prototype Industry-Level Production Account for the United States, 1947-2010,” Presentation at the WIOD Confer-ence, Groningen, The Netherlands, April 25.
Jorgenson, Dale W., Mun S. Ho, and Kevin Stiroh (2005) Productivity: Information Technology and the American Growth Resurgence (Cambridge, Mass.: MIT Press).
Kahn, James A. and Robert W. Rich (2013) Update to “Tracking Productivity in Real Time,” Cur-rent Issues in Economics and Finance, Vol. 12, No. 8, November 2006. Federal Reserve Bank of New York. http://www.newyorkfed.org/research/national_economy/richkahn_prodmod.pdf.
Kendrick, John W. (1961) Productivity Trends in the United States. National Bureau of Economic Research (Princeton, N.J.: Princeton University Press). http://www.nber.org/books/kend61-1.
Oliner, Stephen D. and Daniel E. Sichel (1994) “Computers and Output Growth Revisited: How
Big is the Puzzle?” Brookings Papers on Economic Activity, No. 2, pp. 273-334.
Oliner, Stephen D. and Daniel E. Sichel (2000) “The Resurgence of Growth in the Late 1990s: Is Information Technology the Story?” Journal of Economic Perspectives, Vol. 14, Fall, pp. 3-22.
Oliner, Stephen D. and Daniel E. Sichel (2002) “Information Technology and Productivity: Where Are We Now and Where Are We Going?” Federal Reserve Bank of Atlanta, Eco-nomic Review, Vol. 87, Third Quarter, pp. 15-44.
Oliner, Stephen D., Daniel E. Sichel, and Kevin J. Stiroh (2007) “Explaining a Productive Decade,” Brookings Papers on Economic Activity, No. 1, pp. 81-152. Appendix available at http://www.feder-alreserve.gov/pubs/feds/2007/200763/200763pap.pdf.
Pillai, Unni (2013) “A Model of Technological Progress in the Microprocessor Industry,” Jour-nal of Industrial Economics, forthcoming. http://papers.ssrn.com/sol3/papers.cfm?abstract_id=1873992.
Prud’homme, Marc, Dimitri Sanga, and Kam Yu (2005) “A Computer Software Price Index Using Scanner Data.” Canadian Journal of Economics, Vol. 38, No. 3, pp. 999-1017.
Reinhart, Carmen M. and Kenneth S. Rogoff (2009) This Time is Different: Eight Centuries of Financial Folly (Princeton, N.J.: Princeton University Press).
Shenoy, Sunil R. and Akhilesh Daniel (2006) “Intel Architecture and Silicon Cadence: The Catalyst for Industry Innovation,” Intel white paper.
Solow, Robert (1987) “We'd Better Watch Out” New York Times Book Review, July 12.
VSLI Research Inc. (2006) “Did Acceleration from a Three to Two Year Node Life Really Occur?” The Chip Insider, April 6.
Wasshausen, Dave and Brent R. Moulton (2006) “The Role of Hedonic Methods in Measuring Real GDP in the United States.” http://bea.gov/papers/pdf/hedonicGDP.pdf.
I N T E R N A T I O N A L P R O D U C T I V I T Y MO N I T O R 35
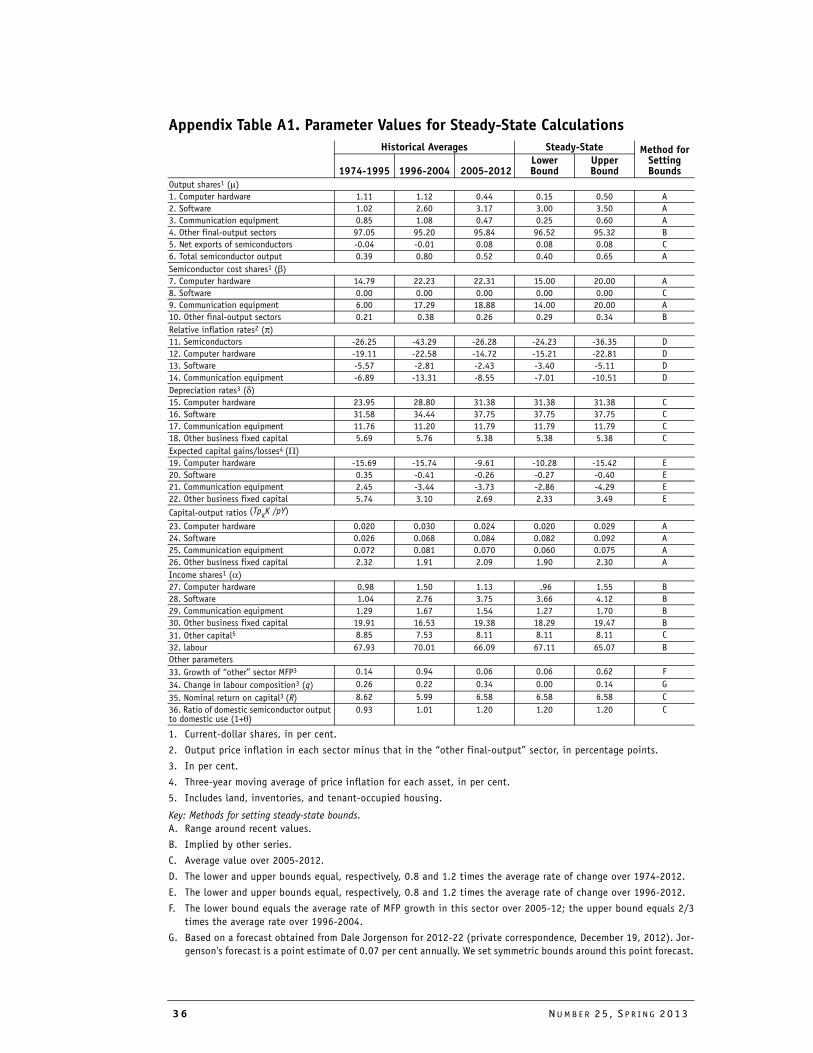
Historical Averages Steady-State Method forSetting Bounds1974-1995 1996-2004 2005-2012
Lower Bound
Upper Bound
Output shares1 (µ)1. Computer hardware 1.11 1.12 0.44 0.15 0.50 A2. Software 1.02 2.60 3.17 3.00 3.50 A3. Communication equipment 0.85 1.08 0.47 0.25 0.60 A4. Other final-output sectors 97.05 95.20 95.84 96.52 95.32 B5. Net exports of semiconductors -0.04 -0.01 0.08 0.08 0.08 C6. Total semiconductor output 0.39 0.80 0.52 0.40 0.65 ASemiconductor cost shares1 (β)7. Computer hardware 14.79 22.23 22.31 15.00 20.00 A8. Software 0.00 0.00 0.00 0.00 0.00 C9. Communication equipment 6.00 17.29 18.88 14.00 20.00 A10. Other final-output sectors 0.21 0.38 0.26 0.29 0.34 BRelative inflation rates2 (π)11. Semiconductors -26.25 -43.29 -26.28 -24.23 -36.35 D12. Computer hardware -19.11 -22.58 -14.72 -15.21 -22.81 D13. Software -5.57 -2.81 -2.43 -3.40 -5.11 D14. Communication equipment -6.89 -13.31 -8.55 -7.01 -10.51 DDepreciation rates3 (δ)15. Computer hardware 23.95 28.80 31.38 31.38 31.38 C16. Software 31.58 34.44 37.75 37.75 37.75 C17. Communication equipment 11.76 11.20 11.79 11.79 11.79 C18. Other business fixed capital 5.69 5.76 5.38 5.38 5.38 CExpected capital gains/losses4 (Π)19. Computer hardware -15.69 -15.74 -9.61 -10.28 -15.42 E20. Software 0.35 -0.41 -0.26 -0.27 -0.40 E21. Communication equipment 2.45 -3.44 -3.73 -2.86 -4.29 E22. Other business fixed capital 5.74 3.10 2.69 2.33 3.49 E
Capital-output ratios (TpKK /pY)
23. Computer hardware 0.020 0.030 0.024 0.020 0.029 A24. Software 0.026 0.068 0.084 0.082 0.092 A25. Communication equipment 0.072 0.081 0.070 0.060 0.075 A26. Other business fixed capital 2.32 1.91 2.09 1.90 2.30 AIncome shares1 (α)27. Computer hardware 0.98 1.50 1.13 .96 1.55 B28. Software 1.04 2.76 3.75 3.66 4.12 B29. Communication equipment 1.29 1.67 1.54 1.27 1.70 B30. Other business fixed capital 19.91 16.53 19.38 18.29 19.47 B31. Other capital5 8.85 7.53 8.11 8.11 8.11 C32. labour 67.93 70.01 66.09 67.11 65.07 BOther parameters33. Growth of “other” sector MFP3 0.14 0.94 0.06 0.06 0.62 F34. Change in labour composition3 (q) 0.26 0.22 0.34 0.00 0.14 G35. Nominal return on capital3 (R) 8.62 5.99 6.58 6.58 6.58 C36. Ratio of domestic semiconductor output to domestic use (1+θ)
0.93 1.01 1.20 1.20 1.20 C
Appendix Table A1. Parameter Values for Steady-State Calculations
1. Current-dollar shares, in per cent.
2. Output price inflation in each sector minus that in the “other final-output” sector, in percentage points.
3. In per cent.
4. Three-year moving average of price inflation for each asset, in per cent.
5. Includes land, inventories, and tenant-occupied housing.
Key: Methods for setting steady-state bounds.A. Range around recent values.
B. Implied by other series.
C. Average value over 2005-2012.
D. The lower and upper bounds equal, respectively, 0.8 and 1.2 times the average rate of change over 1974-2012.
E. The lower and upper bounds equal, respectively, 0.8 and 1.2 times the average rate of change over 1996-2012.
F. The lower bound equals the average rate of MFP growth in this sector over 2005-12; the upper bound equals 2/3 times the average rate over 1996-2004.
G. Based on a forecast obtained from Dale Jorgenson for 2012-22 (private correspondence, December 19, 2012). Jor-genson's forecast is a point estimate of 0.07 per cent annually. We set symmetric bounds around this point forecast.
36 NU M B E R 25 , S P R I N G 2013