sustainable technology & infrastructure monthly market … · > energy capital partners and...
TRANSCRIPT

GCA / 1
Performance of
Key Market
Indices
Notable
Corporate
Mergers &
Acquisitions and
Asset
Transactions
Corporate Transactions
> Energy Future Holdings, majority owner of Oncor, the TX energy delivery firm, announced its
$9.45bn acquisition by Sempra Energy, topping Berkshire Hathaway’s $9.0bn offer. The deal is
subject to closing conditions including bankruptcy court approvals
> Energy Capital Partners and a consortium of investors reached an agreement to buy Houston-
based natural gas and geothermal power generator Calpine Corp. for $5.6bn in cash
> A JV controlled by AES Corp. and Alberta Investment Management Corp. (AIMCo) completed the
acquisition of sPower, the Utah-based utility-scale solar developer that owns an operating
portfolio of 1.3 GW, from Fir Tree Partners and other minority owners for $853mm in cash
> Boulevard Acquisition Corp. II, a blank check company sponsored by Avenue Capital Group,
announced its merger with Estre Ambiental, the largest waste management company in Brazil
and Latin America for an implied enterprise value of $1.1bn
> Energy Development Corp, the largest geothermal power generator in the Philippines,
announced a consortium of investors including Macquarie Group and Singapore’s sovereign
wealth fund GIC has offered to buy 31.7% of the company for up to $1.3bn
> Siemens agreed to buy Tass International for an undisclosed sum. Tass software simulates
complex traffic scenarios, validating autonomous driving and driver assistance systems
Asset Transactions
> Northland Power Inc. completed the acquisition of British Wind Energy, which owns the $1.6bn,
252 MW Deutsche Bucht offshore wind project, from Highland
> Global Infrastructure Partners acquired a 50% stake in the 450 MW Borkum Riffgrund 2
offshore wind project in Germany from Danish wind energy developer DONG Energy
> Sempra Renewables, a unit of Sempra Energy, acquired the 281 MW Great Valley solar project
in Fresno County, CA from Canadian Solar subsidiary Recurrent Energy
> Global private asset manager Capital Dynamics completed the acquisition of the 280 MW
California Flats solar project in Monterey County, CA from PV manufacturer First Solar
Notable
Capital Raises
Corporate Transactions
> Tesla Inc. announced it would issue about $1.5bn through its first offering of high yield bonds
to ramp up production of the Model 3 sedan
> Israel’s Oryx Vision raised $50mm from Third Point Ventures, WRV and Union Tech Ventures to
further develop its LiDAR technology for self-driving automobiles
Asset Transactions
> British renewable infrastructure company Cubico closed debt financing for a 250 MW wind
power plant and a 350 MW solar facility in Mexico with $450mm
> Glennmont Partners completed the refinancing of its 40 MWe straw-fired biomass Sleaford
Renewable Energy Plant in Lincolnshire, U.K. with Deutsche Bank providing £150mm
Sustainable Technology &
Infrastructure Monthly
Market Update
August 2017 Review
About Greentech Capital Advisors
Greentech Capital Advisors is the largest global investment bank and asset management firm focused exclusively on
Sustainable Infrastructure. We are an expert team of 50 professionals working seamlessly on our clients' behalf in New York,
Zurich and San Francisco and through strategic partnerships in Asia. Our team of experienced bankers provides conflict-free
advice and thoughtful, innovative solutions with an intensely focused effort that does not stop until you achieve success. Our
investment banking advisory services focus on mergers and acquisitions, strategic advisory and capital raises. Our asset
management business offers a long only public equity fund that invests in companies which are solving resource constraints
around energy, water and food.
Index Performance August Ending Versus First Day of the
August YTD CY 2016 52 Wk High 52 Wk Low
Dow Jones Industrial Average (0.1%) 11.1% 13.4% (0.8%) 22.7%
NASDAQ Composite 1.0% 19.4% 7.5% 0.0% 27.4%
S&P 500 (0.2%) 10.4% 9.5% (0.4%) 18.5%
NASDAQ Clean Edge (2.1%) 19.9% (3.6%) (3.0%) 30.6%

GCA / 2
Selected Recent Sustainable Technology &
Infrastructure M&A Transactions (1/2)
Corporate Transactions
Deal Transaction Multiple(1)
Date Acquirer Target Target Description Subsector Value ($mm) Revenue EBITDA
8/30/2017 (2)
Sembcorp UtilitiesSembcorp Green
Infra
Developing or operating nearly 1,200 MW of wind
and solar capacity. Acquired from IDFC Private
Equity
Wind & Solar $222 ND ND
8/30/2017 (2)
Siemens Tass International Develops autonomous vehicle testing softwareAdvanced
MobilityND ND ND
8/23/2017 Tantalus Energate
Provides interactive demand management
solutions. Based in Ottawa, Canada. Acquired from
Cycle Capital Management and other minority
owners
Energy
EfficiencyND ND ND
8/23/2017WaterBridge
ResourcesEnWater Solutions
Produced water gathering and disposal company.
Based in Snyder, TXWater ND ND ND
8/23/2017 KPS Capital Partners C&D TechnologiesManufactures systems for power conversion and
storage of electrical power. Based in Blue Bell, PAStorage ND ND ND
8/22/2017 Solar SpectrumHorizon Solar
Power
Designs and installs residential and commercial
solar systems in Southern California. Creates 4th
largest residential solar system provider in U.S.
Solar ND ND ND
8/22/2017 (2)
Osram Digital LumensDevelops IoT solutions including intelligent
lighting systems for industrial buildingsIndustrial IoT ND ND ND
8/22/2017 BlueNRGY Green States Owns 18.7 MW PV solar facilities Solar $60 ND ND
8/21/2017 (2)
Sempra EnergyEnergy Future
Holdings
80% owner of Oncor, the Dallas, TX-based
electricity transmission and distribution companyUtility $9,450 2.4x 10.6x
8/21/2017 (2)
HPS Investment
Partners
Equity, Equity Group
Investments
Waste Industries
Provides non-hazardous solid waste collection,
transfer, recycling, and disposal services. Based in
Raleigh, NC
Waste
ManagementND ND ND
8/18/2017 (2)
Investors Led by
Energy Capital
Partners
CalpineLargest U.S. generator of electricity from natural
gas and geothermal resourcesPower $15,961 2.0x 9.3x
8/16/2017Boulevard
Acquisition Corp. IIEstre Ambiental
Provides full range of waste-related and
environmental services to over 31 million people in
seven Brazilian states
Waste
Management$1,100 2.4x 7.7x
8/15/2017Descartes Systems
GroupMacroPoint
Cleveland, OH-based electronic transportation
network providing location-based truck tracking
and predictive freight capacity data content
Advanced
MobilityND ND ND
8/14/2017 Target Grand Junction
Software platform provides logistics services and
local and same-day delivery in every North
American Market
Advanced
MobilityND ND ND
8/9/2017 DuPont GranularDevelops software and analytics platform for the
farming industry. Based in San Francisco, CAAgTech ND ND ND
8/9/2017 Sojitz
Alten RE
Developments
America
66.67% stake in solar power developer from parent
company Alten Renewable Energy DevelopmentsSolar ND ND ND
8/4/2017 Toyota Motor Corp. Mazda Motor Corp.5% stake in manufacturer and seller of passenger
cars, commercial vehicles and automotive parts
Advanced
MobilityND ND ND
8/2/2017 Aclara
GE Philippines
Meter & Instrument
Co.
Acquired GE’s majority interest in GE Philippines
Meter & Instrument Co., Inc. (GEPMICI), market
leader for electric meters in the Philippines.
GEPMICI is a JV between GE and Manila Electric
Company (Meralco)
Smart Meters ND ND ND
8/2/2017
Investors Led by
Macquarie Group and
Singapore's GIC
Energy
Development Corp.
31.7% stake in EDC, the Phillipines' largest
producer of geothermal energy from minority
shareholders. First Gen. Corp. will retain majority
ownership
Geothermal $1,280 ND ND
8/1/2017 Warburg Pincus Service Logic
Provides aftermarket maintenance, repair and
replacement services for commercial HVAC
equipment. Based in Charlotte, NC. Acquired from
Sterling Investment Partners
Energy
EfficiencyND ND ND
8/1/2017
Tennenbaum Capital
Partners, Goldman
Sachs BDC
Conergy Asia & ME
Pte Ltd
Builds, operates and manages solar power plants
in Japan, Australia, Thailand, the Philippines and
Myanmar. Acquired from Kawa Solar Holdings
Solar ND ND ND
8/1/2017 ORIX Corp.Ormat
Technologies
22.1% ownership stake in Ormat Technologies Inc,
a provider of alternative and renewable energy
technology based in Reno, NV
Solar &
Geothermal$627 ND ND
8/1/2017
AES Corp. and
Alberta Investment
Management Co.
sPower
Salt Lake City-based utility-scale solar developer
that owns an operating portfolio of 1.3 GW and a
development portfolio of over 10 GW. Acquired
from Fir Tree Partners and other minority owners
Solar & Wind $1,577 ND ND
Source: FactSet, company announcements, GCA estimates, SEC filings and third party providers.
(1) Transaction multiples represent LTM EV/Adj. EBITDA and LTM EV/Sales.
(2) Deal announcement.

GCA / 3
Selected Recent Sustainable Technology &
Infrastructure M&A Transactions (2/2)
Asset Transactions
Source: FactSet, company announcements, GCA estimates, SEC filings and third party providers.
(1) Transaction multiples represent LTM EV/Adj. EBITDA and LTM EV/Sales.
(2) Deal announcement.
(3) Represents implied asset price.
Deal Transaction Multiple(1)
Date Acquirer Target Target Description Subsector Value ($mm) Revenue EBITDA
8/25/2017Innergex Renewable
Energy
43 MW Wind
Projects
Two wind projects in France with a total capacity
of 43 MW from BayWa r.e.Wind $46 ND ND
8/24/2017 (2)
ArcLight Capital
Partners LLC
Goshen and
Rockland Wind
Projects
ArcLight Capital Partners LLC asked the Federal
Energy Regulatory Commission to authorize its
acquistion of equity stakes in the Goshen (124.5
MW) and Rockland (79.2 MW) wind projects in
Idaho from Mitsubishi Corp.
Wind ND ND ND
8/24/2017
Greenbacker
Renewable Energy
Company
27.8 MW Solar
Facilities
Five solar facilities in NC comprising 27.8 MW from
ConergySolar $21 ND ND
8/23/2017 Munich Re
Horse Creek and
Electra Wind
Projects
49% stake in Horse Creek and Electra, 230 MW
wind projects constructed in TX by Starwood
Energy Group with operations beginning in 2016
Wind ND ND ND
8/22/2017 Greencoat UK WindCorriegarth Wind
Energy Center
69.5 MW Windfarm in Inverness, Scotland from
InvenergyWind $234 ND ND
8/22/2017 Capital Dynamics California Flats
Solar Project
280 MW solar project in Monterey County, CA from
First SolarSolar ND ND ND
8/21/2017Bioenergy
Infrastructure Group
72 MW Biomass
and Waste-to-
Energy Facilities
72 MW portfolio of four biomass and waste-to-
energy facilities, 15 anaerobic digestion plants and
a materials recovery facility from Green Investment
Bank
Biomass ND ND ND
8/17/2017 (2)
Sammons Renewable
Energy
194 MW Solar
Portfolio
51% stake in 194 MW utility-scale solar portfolio
from Heelstone EnergySolar ND ND ND
8/17/2017D.E. Shaw
Renewables
Cuyama Solar
Project
40 MW solar project in Santa Barbara, CA from
First SolarSolar ND ND ND
8/17/2017 Northland Power
Deustche Bucht
offshore Wind
Project
252 MW windfarm in the German Exclusive
Economic Zone from Highland Group HoldingsWind $1,680 ND ND
8/14/2017 (2)
The Renewables
Infrastructure GroupBroxburn
20 MW battery storage project in Scotland from
RESStorage $26 ND ND
8/14/2017Pattern Energy Group
Inc.
Meikle Wind
Project
51% stake in 179 MW Meikle Wind facility located
in BC, Canada operating under a 25-year power
purchase agreement with BC Hydro for $68mm
from Pattern Energy Group LP
Wind $133 (3)
ND ND
8/14/2017 Nautilus13.3 MW Solar
Portfolio
13.3 MW community solar portfolio in MN from
ReneSola LtdSolar ND ND ND
8/11/2017 BlackRock200 MW Solar
Portfolio
90% stake in 150 MW Daydream and 50 MW
Hayman solar parks in North Queensland,
Australia from Edify Energy
Solar ND ND ND
8/10/2017 Sonnedix22 MW Solar
Portfolio
22 MW portfolio of PV plants in Extremadura and
Castilla la Mancha, Spain from Impax Asset
Management
Solar ND ND ND
8/10/2017EDF Energies
NouvellesPirapora III Project
80% stake in 92.5 MW solar project under
construction in Minas Gerais, Brazil from Canadian
Solar
Solar ND ND ND
8/9/2017Global Infrastructure
Partners
Borkum Riffgrund
2
50% stake in German 450 MW Borkum Riffgrund 2
offshore wind farm from DONG EnergyWind $3,024
(3)ND ND
8/8/2017 Sempra RenewablesGreat Valley Solar
Project
281 MW Great Valley solar project in Fresno
County, CA from Canadian Solar subsidiary
Recurrent Energy
Solar ND ND ND
8/3/2017 Dominion Energy11.76 MW Solar
Portfolio
11.76 MW PV portfolio in North Carolina from
Strata SolarSolar ND ND ND
8/3/2017 Firstar Development Solar Portfolio
Indirect, passive interests in the 48 MW Beacon
Solar Plant Site 2 and 36 MW Beacon Solar Plant
Site 5 in two installments from Capital Dynamics
Solar ND ND ND
8/2/2017 (2)
AES Tietê (AES Corp.)91 MW Solar
Portfolio
91 MW solar project in Tacaimbó, Brazil. Project
cost estimated at $96 millionSolar $24 ND ND
8/2/2017 (2)
BC Hydro Waneta Dam
Acquiring remaining 2/3 ownership in 496 MW
dam located in BC, Canada for $1.2bn from Teck
Resources
Hydro $1,800 (3)
ND ND
8/1/2017 (2)
Wells Fargo Central
Pacific Holdings Inc.
Great Valley Solar
Project
Wells Fargo asked the Federal Energy Regulatory
Commission to authorize its acquistion of
nonmanaging and passive equity stakes in the 281
MW Great Valley solar project in Fresno County, CA
from Sempra Energy
Solar ND ND ND
8/1/2017 NRG YieldNRG Wind TE
Holdco
Acquired remaining 25% stake in 814 MW, 12-
project wind portfolio from NRG EnergyWind $42 ND ND
8/1/2017
Eagle Creek
Renewable Energy
LLC
30 MW Hydro
Power Facilities
Acquired Maine-based hydro power facilities from
Madison Paper Industries, a partnership between
UPM (HEL: UPM) and Northern SC Paper Corp., a
subsidiary of The New York Times
Hydro ND ND ND

GCA / 4
Selected Recent Sustainable Technology &
Infrastructure Capital Raise Transactions
(1/3)
Corporate Transactions
Source: FactSet, company announcements, GCA estimates, SEC filings and third party providers.
(1) Deal announcement.
(2) Represents implied corporation price.
Amount
Date Company Transaction Description Raised ($mm) Subsector Selected Disclosed Investors
8/31/2017 (1)
Keyera Corp.
Keyera Corp., the Canadian oil and gas E&P business,
registered debt and equity securities for sale in future
offerings to be used for general corporate purposes and
acquisitions
$3,192 Oil & Gas ND
8/30/2017 Dwelo
Dwelo, a leading provider of smart apartments, raised $4.9
million to expand the company’s geographic reach and invest
in the platform's resident and manager experiences
$5 Smart Home Petersen Ventures
8/29/2017 (1)
NTPC
The Indian government, which owns 70% of NTPC, the
nation's largest electricity producer, is selling a 5% stake to
fund a widening government deficit
$28,200 (2)
Utility ND
8/29/2017 (1)
ContourGlobal LP
ContourGlobal LP announced it has plans for an initial public
offering that could raise as much as $1 billion. The firm
generates power through natural gas, coal, wind, solar and
hydropower
$1,000 Power ND
8/24/2017 Romeo PowerL.A.-based battery company Romeo Power raised $30 million
in seed funding$30 Storage ND
8/24/2017 Cubic Telecom
Cubic Telecom, an Irish startup that develops software
allowing cars and other devices to automatically connect to
service providers in any country, raised $46.5 million to
expand its team of engineers
$47 Advanced MobilityQualcomm, Valid, Audi Ventures, Irish
Strategic Investment Fund
8/23/2017 Roost
Creator of the Roost Smart Battery and the Roost Smart Water
Leak and Freeze Detector solutions raised $10.4 million in
Series B funding to continue product development
$10 Connected HomesAviva Ventures, Desjardins Insurance, Fosun
RZ Capital
8/22/2017 Innowatts
Houston, TX-based provider of advanced energy analytics for
energy providers and consumers raised $6 million in Series A
funding to strengthen its global foothold and drive product
innovation
$6 Energy EffiencyShell Technology Ventures, Iberdola Ventures,
Energy & Environment Investment
8/18/2017 Huochebang
Huochebang, the Chinese truck logistics firm, raised $56
million to attract new truck drivers and improve its matching
system algorithm
$56 Advanced Mobility All-Stars Investment
8/17/2017 ZingBox
Raised $22 million in a Series B funding round led by Dell
Technologies Capital and Triventures to increase headcount,
accelerate product capabilities and expand market reach
$22 Industrial IoT Dell Technologies Capital and Triventures
8/16/2017 TuSimpleRaised $20 million in Series B funding to invest in research,
development and recruitment$20 Advanced Mobility Sina, Nvidia
8/15/2017Peloton Computer
Enterprises
Calgary-based Peloton Computer Enterprises, a provider of
well data software solutions for the oil and gas industry,
raised an undisclosed amount of funding. Proceeds will be
used for general corporate purposes and acquisitions
ND Oil & GasSilver Lake Kraftwerk, TriWest Capital Partners
and HarbourVest Partners
8/10/2017 True Green Capital
True Green Capital Management LLC, an infrastructure asset
management firm, raised $350 million for commercial and
industrial solar investments
$350 Solar ND

GCA / 5
Selected Recent Sustainable Technology &
Infrastructure Capital Raise Transactions
(2/3)
Corporate Transactions
Source: FactSet, company announcements, GCA estimates, SEC filings and third party providers.
(1) Deal announcement
Amount
Date Company Transaction Description Raised ($mm) Subsector Selected Disclosed Investors
8/8/2017 Oryx Vision
Israeli startup Oryx Vision raised a $50 million Series B round
to develop and commercialize its innovative LiDAR
technology for self driving vehicles
$50 Advanced Mobility Third Point Ventures, WRV
8/7/2017 (1)
TeslaElectric car manufacturer plans to issue bonds to ramp up
production of its new Model 3 sedan$1,500 Advanced Mobility ND
8/3/2017 Booster FuelsBurlingame, CA-based mobile gas station operator raised $20
million to continue expansion into new geographies$20 Advanced Mobility
Madrona Venture Group, Version One,
Maveron, Perot Jain LP, RRE Ventures
8/1/2017 Volocopter
German flying air taxi developer raised $30 million to
continue development of its electric vertical take-off and
landing (eVTOL) vehicles
$30 Advanced Mobility Daimler
8/1/2017 Carwow
U.K.-based startup raised $39 million to expand
internationally. Carwow develops an online platform that
allows consumers to compare offers online and buy directly
from ‘trusted’ dealers that are registered with the platform
$39 Advanced MobilityVitruvian Partners, Accel Partners, Balderton
Capital

GCA / 6
Selected Recent Sustainable Technology &
Infrastructure Capital Raise Transactions
(3/3)
Asset Transactions
Amount
Date Company Transaction Description Raised ($mm) Subsector Selected Disclosed Investors
8/31/2017 (1)
Wind farm in the
Caspian Sea off the
coast of Azerbaijan
The Export-Import Bank of China will finance a wind farm in
the Caspian Sea off the coast of Azerbaijan as the third-
biggest crude oil producer in the former Soviet Union taps
clean energy to supply its domestic energy needs
$460 Wind ND
8/29/2017 (1)
Cerro Dominador solar
plant
Stalled 110 MW solar-thermal project in northern Chile
backed by EIG Global Energy Partners is seeking about $800
million in debt to resume construction
$800 Solar ND
8/23/2017 ReneSolaReneSola obtained 120 million yuan in financing for 30
megawatts of projects in China's Henan Province$18 Solar China Kangfu International Leasing
8/22/2017 Red Dirt wind project
Tax equity agreement for the Red Dirt wind project in
Oklahoma, a 300 MW wind farm owned and operated by Red
Dirt Wind Holdings, a subsidiary of Enel Green Power NA
$340 Wind Allianz, MUFG
8/21/2017Sleaford Renewable
Energy Plant
Refinancing of a 40 MW biomass power plant in Lincolnshire,
east England$194 Biomass Deutsche Bank
8/21/2017Tenaga Nasional
Berhad
Malaysia’s national utility corporation Tenaga Nasional
Berhad (TNB) raised RM 339 million ($79 million) for its first
large scale solar project. The 50 MW project will be located in
Mukim Tajung 12, Kuala Langat, Selangor
$79 Solar ND
8/15/2017Golden Concord
TJ Innova
Golden Concord will partner with TJ Innova to invest more
than 10 billion yuan in an electric-vehicle factory in eastern
China’s Suzhou city
$91 Advanced Mobility ND
8/15/2017 (1)
NorthVolt
NorthVolt announced it is fundraising to build a battery
storage plant that will output 35 GWh battery
production/year in Sweden
$118 Storage ND
8/9/2017 Cubico
Cubico closed financing for 350 MW PV plant in Mexico with
$450 million in debt, of which $220 million will be used for
the wind project and $230 million for the PV plant
$450 Solar & Wind
The Inter-American Development Bank (IDB)
Group, Canadian Climate Fund, China Co-
Financing Fund, International Finance
Corporation, Bancomext, Banobras, MUFG
8/9/2017 Zuma EnergíaThe Mexican renewable energy group secured a $600 million
loan for a 424 MW wind project in Mexico$600 Wind Mexican Development Banks, Santander, EKF
8/8/2017Alterra
Inovateus
1st Source Bank provided a $20.2 million construction loan, a
$9.7 million tax equity investment and a $10.2 million term
loan for Alterra’s Spartan solar project at Michigan State
University. Separately, Alterra completed a partnership
agreement with Inovateus, under which Alterra will manage
the project and hold a majority interest of at least 85%
$40 Solar 1st Source Corporation
8/7/2017
Canadian Solar
EDF Energies
Nouvelles
The 191.5 MW Pirapora I project secured a project financing
facility of $163 million$163 Solar Brazilian Development Bank
8/7/2017 Mongoose EnergyMongoose Energy completed financing for a 14.7 MW solar-
plus-battery farm in Stratford-Upon-Avon, U.K.ND Solar Social & Sustainable Capital, Close Brothers
8/3/2017 Strata SolarStrata Solar financed the development of the 5.88 MW
Clipperton Holdings PV PlantND Solar ND
Source: FactSet, company announcements, GCA estimates, SEC filings and third party providers.
(1) Deal announcement

GCA / 7
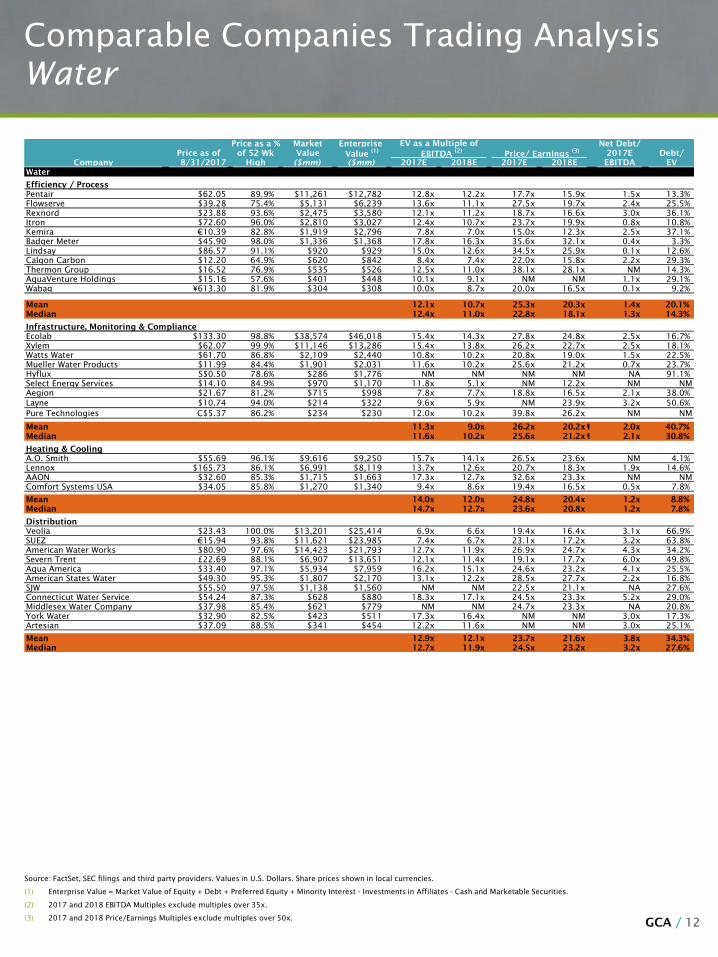
Comparable Companies Trading Analysis
Diversified Industrials and Energy
Infrastructure
Source: FactSet, SEC filings and third party providers. Values in U.S. Dollars. Share prices shown in local currencies.
(1) Enterprise Value = Market Value of Equity + Debt + Preferred Equity + Minority Interest - Investments in Affiliates - Cash and Marketable Securities.
(2) 2017 and 2018 EBITDA Multiples exclude multiples over 35x.
(3) 2017 and 2018 Price/Earnings Multiples exclude multiples over 50x.
Price as a % Market Enterprise Net Debt/
Price as of of 52 Wk Value Value (1)
EBITDA (2)
Price/ Earnings (3)
2017E Debt/
Company 8/31/2017 High ($mm) ($mm) 2017E 2018E 2017E 2018E EBITDA EV
Diversified Industrials
Diversified Industrials
GE $24.55 75.8% $212,553 $307,739 15.4x 13.9x 15.7x 14.3x 4.5x 43.7%
Siemens €109.80 82.2% $110,960 $142,110 10.4x 9.9x 13.9x 13.3x 2.1x 28.8%
United Technologies $119.72 95.9% $95,629 $115,029 10.7x 10.4x 18.2x 17.1x 1.6x 23.1%
Honeywell $138.27 98.6% $105,409 $111,981 13.0x 12.0x 19.5x 17.8x 0.8x 14.7%
Caterpillar $117.49 98.9% $69,433 $96,411 14.4x 12.3x 22.6x 17.9x 4.0x 38.6%
Mitsubishi ¥2,544 94.0% $36,747 $79,770 14.3x 14.4x 8.6x 8.7x 6.3x 59.7%
Hyundai ₩140,500 81.2% $33,195 $77,566 9.9x 9.2x 7.6x 6.4x 5.0x 82.0%
Danaher $83.42 94.8% $57,951 $68,822 16.4x 15.1x 21.1x 19.5x 2.6x 16.8%
Johnson Controls $39.59 85.7% $36,914 $51,772 10.4x 10.0x 14.7x 12.9x 2.8x 27.6%
ABB CHF22.20 89.2% $50,086 $51,484 10.3x 9.4x 18.7x 16.4x 0.3x 15.1%
Schneider €67.73 90.9% $48,045 $50,901 10.5x 9.8x 17.3x 15.6x 1.2x 18.4%
Emerson $59.04 91.7% $37,787 $39,863 11.8x 10.8x 22.0x 19.7x 0.6x 12.9%
Roper Technologies $230.66 96.7% $23,578 $28,557 17.8x 16.4x 24.9x 22.9x 3.1x 19.8%
Legrand €58.88 90.8% $18,623 $20,372 14.0x 12.7x 23.3x 20.7x 1.2x 12.0%
Rockwell $164.06 97.7% $21,059 $20,286 14.6x 13.6x 23.9x 22.2x NM 9.1%
Dover $84.88 96.9% $13,213 $16,450 12.0x 11.0x 19.7x 18.9x 2.4x 21.5%
OMRON ¥5,520 97.2% $10,731 $9,553 9.8x 9.0x 21.5x 18.9x NM NM
Hitachi ¥3,105 95.8% $6,069 $8,284 11.2x 9.3x 30.3x 20.2x 2.4x 29.7%
Alstom €29.88 93.0% $7,820 $7,581 10.6x 9.5x 19.9x 17.4x NM 32.0%
Mean 12.5x 11.5x 19.1x 16.9x 2.6x 28.1%
Median 11.8x 10.8x 19.7x 17.8x 2.4x 22.3%
Energy Infrastructure
Primary Equipment and Power Electronics
TE Connectivity $79.60 93.4% $28,129 $31,365 11.0x 10.7x 16.5x 15.6x 1.1x 12.7%
Delta Electronics NT$165.50 92.2% $14,245 $12,994 12.9x 11.6x 21.6x 18.9x NM 4.8%
Sensata $44.66 94.5% $7,647 $10,393 12.2x 11.4x 14.1x 13.0x 3.2x 31.4%
Yaskawa ¥3,330 96.7% $8,069 $8,074 14.2x 12.7x 25.9x 21.8x NM 4.0%
NGK ¥2,053 79.6% $6,110 $6,019 6.5x 5.8x 14.0x 11.8x NM 27.6%
Fuji Electric ¥606.00 88.7% $4,110 $5,557 8.1x 7.6x 13.0x 12.9x 1.9x 28.7%
LS Industrial Systems ₩58,200 96.0% $1,548 $1,737 7.6x 7.1x 15.0x 12.8x 1.0x 36.7%
SPX $24.10 82.4% $1,022 $1,306 8.6x 7.6x 13.8x 11.6x 1.9x 28.1%
Mean 10.1x 9.3x 16.7x 14.8x 1.8x 21.8%
Median 9.8x 9.1x 14.5x 13.0x 1.9x 27.9%
EPC and Services
Grupo ACS €31.76 86.4% $11,882 $15,652 5.9x 5.6x 13.2x 12.1x 0.9x 64.0%
Acciona €71.79 83.5% $4,887 $12,490 8.4x 8.0x 16.4x 14.6x 4.9x 70.1%
AECOM $33.50 82.3% $5,250 $8,556 9.0x 8.3x 11.5x 11.2x 3.3x 45.7%
Jacobs $54.49 85.9% $6,556 $6,142 9.3x 8.4x 17.2x 15.6x NM 4.6%
Quanta $35.93 92.6% $5,432 $5,963 8.9x 7.5x 17.8x 14.6x 0.6x 8.1%
Fluor $38.57 66.1% $5,396 $5,112 8.3x 5.8x 24.8x 15.1x NM 31.2%
MasTec $40.80 82.4% $3,376 $4,754 7.7x 7.3x 14.9x 13.7x 2.2x 29.2%
Stantec C$34.70 94.2% $3,150 $3,627 10.9x 9.5x 18.0x 15.1x 1.4x 17.6%
Amec Foster Wheeler £4.23 67.0% $2,123 $3,615 9.4x 9.2x 9.2x 8.7x 3.9x 48.2%
Dycom Industries $80.68 72.9% $2,507 $3,251 7.4x 7.1x 16.5x 16.5x 1.6x 23.4%
Balfour Beatty £2.69 89.8% $2,390 $2,749 13.7x 9.8x 23.1x 14.4x 1.6x 52.5%
Primoris $28.61 95.4% $1,472 $1,604 9.0x 7.8x 24.2x 19.7x 0.7x 15.1%
Bilfinger €34.04 83.6% $1,789 $1,446 14.5x 8.3x NM 27.3x NM 42.1%
Team, Inc. $12.35 31.1% $369 $721 12.1x 6.2x NM 19.1x 5.9x 52.9%
Mistras Group $18.91 71.5% $534 $625 9.9x 8.1x 40.7x 24.5x 1.4x 18.7%
Mean 9.6x 7.8x 19.0x 16.2x 2.4x 34.9%
Median 9.0x 8.0x 17.2x 15.1x 1.6x 31.2%
Oil & Gas Services
Select Energy Services $14.10 84.9% $970 $1,170 11.8x 5.1x NM 12.2x NM NM
Secure Energy C$7.47 62.0% $972 $1,139 9.6x 7.8x NM 42.9x 1.4x 16.1%
Pro Petro $11.51 75.2% $956 $947 6.7x 3.6x 24.7x 9.0x NM 1.7%
Newalta C$0.99 37.2% $70 $340 9.5x 7.5x NM NM 7.5x 79.5%
Mean 9.4x 6.0x 24.7x 21.4x 4.5x 32.5%
Median 9.5x 6.3x 24.7x 12.2x 4.5x 16.1%
EV as a Multiple of

GCA / 8
Comparable Companies Trading Analysis
Energy Technology
Source: FactSet, SEC filings and third party providers. Values in U.S. Dollars. Share prices shown in local currencies.
(1) Enterprise Value = Market Value of Equity + Debt + Preferred Equity + Minority Interest - Investments in Affiliates - Cash and Marketable Securities.
(2) 2017 and 2018 EBITDA Multiples exclude multiples over 35x.
(3) 2017 and 2018 Price/Earnings Multiples exclude multiples over 50x.
Price as a % Market Enterprise Net Debt/
Price as of of 52 Wk Value Value (1)
EBITDA (2)
Price/ Earnings (3)
2017E Debt/
Company 8/31/2017 High ($mm) ($mm) 2017E 2018E 2017E 2018E EBITDA EV
Energy Technology
Smart Grid Solutions
AMETEK $63.25 97.4% $14,598 $16,483 15.2x 14.1x 25.0x 22.5x 1.7x 14.6%
Keysight $40.86 94.7% $7,009 $8,220 12.3x 9.8x 16.3x 15.1x 1.8x 25.4%
Itron $72.60 96.0% $2,810 $3,027 12.4x 10.7x 23.7x 19.9x 0.8x 10.8%
Mueller Industries $29.83 67.9% $1,719 $2,067 NM NM NM NM NA 24.4%
ESCO Technologies $54.45 85.3% $1,407 $1,623 12.6x NM 23.7x NM 1.7x 16.3%
Badger Meter $45.90 98.0% $1,336 $1,368 17.8x 16.3x 35.6x 32.1x 0.4x 3.3%
SMA €37.19 99.5% $1,534 $1,058 9.5x 9.8x NM NM NM 2.5%
Smart Metering Systems £7.01 96.8% $813 $935 18.6x 14.3x 32.3x 24.8x 2.4x 14.1%
Silver Spring Networks $12.66 82.2% $678 $560 NM 18.3x NM 46.9x NM NM
EnerNOC $0.92 45.3% $78 $94 NM 4.6x NM 10.4x NM 50.3%
Utilitywise £0.67 33.2% $68 $80 8.0x NM 8.3x 7.1x 1.2x 35.1%
Mean 13.3x 12.2x 23.6x 22.4x 1.4x 19.7%
Median 12.5x 12.4x 23.7x 21.2x 1.7x 15.4%
Energy Storage
Tesla $355.90 92.0% $59,395 $67,275 NM 29.4x NM NM 7.1x 14.2%
Panasonic ¥1,466 92.9% $32,664 $33,146 6.0x 5.2x 19.5x 15.2x 0.1x 31.6%
BYD Electronic HK$46.60 81.4% $18,775 $24,263 10.6x 8.6x 22.9x 16.6x 3.8x 40.9%
Samsung SDI ₩196,500 99.7% $12,105 $11,669 23.8x 15.3x 20.4x 13.6x NM 8.7%
EnerSys $64.10 75.6% $2,782 $2,903 8.2x 7.7x 13.7x 12.9x 0.3x 22.7%
Plug Power $2.14 79.3% $481 $532 NM NM NM NM NM 12.9%
Ballard C$3.91 82.3% $550 $487 NM NM NM NM NM 1.5%
FuelCell Energy $1.54 27.2% $92 $202 NM NM NM NM NM 79.9%
Maxwell Technologies $5.57 86.0% $206 $187 NM NM NM NM 1.6x NM
Hydrogenics C$9.90 67.1% $120 $105 NM 34.9x NM NM 2.8x 13.9%
Ultralife $6.50 85.0% $101 $86 NM NM NM NM NA NM
Mean 12.2x 16.9x 19.1x 14.5x 2.6x 25.2%
Median 9.4x 11.9x 20.0x 14.4x 2.2x 14.2%
LED Lighting
Eaton Corp $71.76 87.9% $31,919 $39,729 11.6x 10.8x 15.6x 14.1x 2.3x 21.7%
OSRAM €68.98 93.8% $8,149 $7,689 9.3x 8.2x 21.4x 18.0x NM NM
Acuity Brands $176.79 63.5% $7,442 $7,609 11.9x 10.9x 20.5x 18.4x 0.3x 4.7%
Hubbell $112.79 89.6% $6,170 $6,894 11.6x 10.7x 20.5x 18.6x 1.2x 15.9%
Universal Display Corporation $127.10 97.3% $5,978 $5,612 NM 28.1x NM 44.4x NM NM
Cree $24.33 76.9% $2,377 $1,911 9.3x 9.7x NM 48.7x NM 7.6%
Fagerhult kr104.75 76.6% $1,522 $1,757 17.2x 15.1x 25.7x 22.1x 2.5x 20.9%
Epistar NT$30.55 90.3% $1,105 $1,171 5.3x 5.5x 40.9x 40.1x 0.1x 18.2%
Zumtobel €15.18 75.9% $785 $891 5.5x 5.2x 14.2x 11.7x 0.7x 23.0%
Veeco $18.90 55.0% $915 $884 18.4x 8.8x 46.7x 12.2x NM 30.7%
Dialight £8.02 71.9% $336 $320 11.1x 8.0x 22.2x 15.1x NM NM
Revolution Lighting $7.41 80.8% $156 $210 11.3x 7.4x 16.5x 10.4x 2.9x 25.8%
Energy Focus $1.79 32.5% $21 $8 NM NM NM NM 1.3x NM
Mean 11.1x 10.7x 24.4x 22.8x 1.4x 18.7%
Median 11.3x 9.2x 20.9x 18.2x 1.2x 20.9%
Energy/Facilities Management
Eaton Corp $71.76 87.9% $31,919 $39,729 11.6x 10.8x 15.6x 14.1x 2.3x 21.7%
OSRAM €68.98 93.8% $8,149 $7,689 9.3x 8.2x 21.4x 18.0x NM NM
Acuity Brands $176.79 63.5% $7,442 $7,609 11.9x 10.9x 20.5x 18.4x 0.3x 4.7%
Hubbell $112.79 89.6% $6,170 $6,894 11.6x 10.7x 20.5x 18.6x 1.2x 15.9%
Universal Display Corporation $127.10 97.3% $5,978 $5,612 NM 28.1x NM 44.4x NM NM
Cree $24.33 76.9% $2,377 $1,911 9.3x 9.7x NM 48.7x NM 7.6%
Mean 10.7x 13.1x 19.5x 27.0x 1.2x 12.5%
Median 11.6x 10.8x 20.5x 18.5x 1.2x 11.7%
EV as a Multiple of

GCA / 9
Comparable Companies Trading Analysis
Renewables
Source: FactSet, SEC filings and third party providers. Values in U.S. Dollars. Share prices shown in local currencies.
(1) Enterprise Value = Market Value of Equity + Debt + Preferred Equity + Minority Interest - Investments in Affiliates - Cash and Marketable Securities.
(2) 2017 and 2018 EBITDA Multiples exclude multiples over 35x.
(3) 2017 and 2018 Price/Earnings Multiples exclude multiples over 50x.
Price as a % Market Enterprise Net Debt/
Price as of of 52 Wk Value Value (1)
EBITDA (2)
Price/ Earnings (3)
2017E Debt/
Company 8/31/2017 High ($mm) ($mm) 2017E 2018E 2017E 2018E EBITDA EV
Renewables
Integrated PV and PV Manufacturing
Hanwha ₩49,150 92.9% $3,679 $18,105 6.2x 6.3x 5.6x 5.5x 1.5x 75.6%
SunPower $8.84 75.6% $1,233 $3,204 NM 13.0x NM NM 19.4x 65.1%
First Solar $46.96 93.5% $4,903 $3,041 9.0x 8.9x 22.5x 38.2x NM 12.9%
Canadian Solar $15.71 86.7% $911 $2,476 9.2x 7.1x 10.8x 9.3x 5.7x 101.2%
Yingli Green Energy $2.45 58.8% $45 $1,752 NM NM NM NM NM 94.7%
JA Solar $6.68 86.4% $318 $768 3.7x 3.3x 8.0x 13.6x 2.2x 116.1%
ReneSola $2.45 39.2% $50 $539 10.2x 7.6x NM NM 9.2x 116.1%
SolarWorld €0.47 7.2% $8 $344 NM NM NM NM NA 134.9%
Mean 7.6x 7.7x 11.7x 16.7x 7.6x 89.6%
Median 9.0x 7.3x 9.4x 11.5x 5.7x 97.9%
Solar Development
Abengoa €0.04 4.0% $43 $12,566 NM NM NM NM NA 90.1%
Sunrun $6.70 86.1% $711 $2,166 NM NM 6.7x 4.8x NM 54.9%
Vivint Solar $4.75 77.9% $544 $1,538 NM NM NM NM NM 57.3%
Scatec Solar kr46.30 93.3% $614 $1,162 10.0x 6.5x NM 34.4x 4.1x 55.6%
Etrion C$0.28 68.8% $73 $327 NM 23.0x NM NM 41.7x 102.0%
Mean 10.0x 14.8x 6.7x 19.6x 22.9x 72.0%
Median 10.0x 14.8x 6.7x 19.6x 22.9x 57.3%
IPPs
EDP €3.23 97.5% $14,020 $40,384 9.2x 9.2x 13.2x 12.7x 4.8x 58.6%
AES $11.04 82.9% $7,289 $29,634 7.6x 7.1x 10.5x 9.1x 4.7x 72.7%
NRG $24.91 94.9% $7,883 $25,415 9.6x 9.1x 23.2x 15.4x 5.7x 66.4%
Calpine $14.70 98.4% $5,301 $15,835 8.6x 8.0x 33.3x 16.8x 5.7x 75.3%
Dynegy $9.42 65.7% $1,237 $10,420 8.4x 7.2x NM 22.2x 7.1x 93.2%
Northland Power C$23.95 95.6% $3,312 $8,695 15.0x 11.9x 22.9x 16.1x 8.3x 64.6%
Boralex C$21.85 95.0% $1,322 $3,339 12.5x 11.0x NM 40.1x 7.5x 63.3%
Atlantic Power C$3.00 81.7% $276 $1,330 5.2x 7.7x 14.1x NM 3.2x 88.7%
Alterra Power C$5.35 72.3% $249 $628 14.0x 12.3x NM 40.6x 6.0x 44.3%
Mean 10.0x 9.3x 19.5x 21.6x 5.9x 69.7%
Median 9.2x 9.1x 18.5x 16.4x 5.7x 66.4%
Wind and Other
Vestas kr569.00 90.0% $19,600 $16,665 7.9x 7.5x 16.3x 14.8x NM 3.5%
Xinjiang Goldwind HK$8.59 82.1% $3,903 $6,282 7.8x 7.0x 7.7x 7.2x 3.3x 55.2%
Gamesa €12.55 59.7% $4,130 $3,223 1.8x 2.0x 9.7x 11.7x NM 20.1%
Suzlon ₹16.25 73.0% $1,352 $2,964 8.7x 7.9x 11.7x 6.1x 4.7x 58.6%
Ormat $41.80 98.2% $1,653 $2,244 NM NM 23.9x 22.5x NA 26.3%
Sinovel ¥1.86 65.3% $1,700 $1,730 NM NM NM NM NA 6.0%
Nordex €11.67 42.3% $1,346 $1,622 5.2x 5.4x 15.7x 16.3x 0.9x 49.1%
TPI Composites $20.34 87.3% $689 $684 7.9x 6.7x 20.3x 20.4x NM 18.8%
EV as a Multiple of

GCA / 10
Comparable Companies Trading Analysis
YieldCos
Source: FactSet, SEC filings and third party providers. Values in U.S. Dollars. Share prices shown in local currencies.
(1) Enterprise Value = Market Value of Equity + Debt + Preferred Equity + Minority Interest - Investments in Affiliates - Cash and Marketable Securities.
(2) 2017 and 2018 EBITDA Multiples exclude multiples over 35x.
(3) 2017 and 2018 Price/Earnings Multiples exclude multiples over 50x.
(4) Acquisition by Brookfield announced on March 7, 2017 and is expected to close in Q4 2017.
Price as a % Market Enterprise
Price as of of 52 Wk Value Value (1)
EBITDA (2)
Price/ Earnings (3)
Current Debt/
Company 8/31/2017 High ($mm) ($mm) 2017E 2018E 2017E 2018E Yield EV
YieldCos
North American YieldCos
Brookfield Renewables C$43.27 96.2% $10,238 $29,682 17.0x 15.7x NM NM 5.4% 36.7%
NextEra Energy Partners $41.46 99.9% $6,463 $10,684 13.0x 11.0x 23.3x 20.7x 3.5% 37.6%
NRG Yield $18.19 97.1% $3,345 $9,442 10.2x 9.5x 21.1x 18.4x 5.8% 62.4%
Atlantica Yield $20.76 90.8% $2,081 $7,620 9.6x 9.1x 42.3x 27.9x 4.4% 80.8%
TerraForm Power(4)
$13.96 95.0% $1,953 $6,801 15.3x 14.5x NM NM 0.0% 59.1%
Pattern Energy $25.12 98.8% $2,201 $5,009 13.1x 11.7x NM 47.1x 6.7% 36.5%
Innergex C$14.60 95.2% $1,264 $3,776 15.1x 13.0x 35.9x 29.5x 4.5% 69.7%
TransAlta Renewables C$14.20 87.4% $2,837 $3,648 10.5x 10.4x 17.5x 14.6x 6.6% 22.0%
8point3 $14.42 90.2% $1,140 $1,658 15.0x 14.2x 17.2x 15.4x 7.3% 43.4%
Mean 13.2x 12.1x 26.2x 24.8x 4.9% 49.8%
Median 13.1x 11.7x 22.2x 20.7x 5.4% 43.4%
European YieldCos
Saeta Yield €10.15 96.6% $984 $2,374 8.7x 8.6x 19.2x 17.8x 7.5% 72.0%
Greencoat UK Wind £1.22 96.3% $1,160 $1,381 6.2x 6.0x 8.2x 7.2x 5.3% 16.3%
Renewables Infrastructure £1.09 96.7% $1,319 $1,300 11.8x 11.6x 11.1x 11.4x 5.9% NM
NextEnergy Solar Fund £1.13 97.2% $832 $755 13.8x 13.9x 12.5x 14.3x 5.7% NM
John Laing Environmental £1.07 94.5% $523 $518 15.6x 15.2x 13.5x 14.0x 5.8% NM
Bluefield Solar Income £1.11 94.1% $528 $496 20.5x 20.1x 25.2x 26.6x 6.5% NM
Foresight Solar £0.94 94.9% $55 $49 NM NM NM NM 6.4% NM
Mean 12.8x 12.6x 15.0x 15.2x 6.2% 44.1%
Median 12.8x 12.8x 13.0x 14.2x 5.9% 44.1%
Other International YieldCos
TerraForm Global(4)
$5.05 99.0% $564 $1,680 11.1x 11.2x NM NM 0.0% 64.8%
Mean 11.1x 11.2x NM NM 0.0% 64.8%
Median 11.1x 11.2x NM NM 0.0% 64.8%
MLPs
Green Plains $18.55 62.1% $770 $1,710 9.1x 6.1x NM 17.3x 2.6% 63.3%
Enviva $29.15 95.3% $767 $1,040 10.1x 8.2x 27.4x 19.3x 7.8% 33.1%
Mean 9.6x 7.2x 27.4x 18.3x 5.2% 48.2%
Median 9.6x 7.2x 27.4x 18.3x 5.2% 48.2%
EV as a Multiple of

GCA / 11
Comparable Companies Trading Analysis
Advanced Mobility and Air and
Environmental Services
Source: FactSet, SEC filings and third party providers. Values in U.S. Dollars. Share prices shown in local currencies.
(1) Enterprise Value = Market Value of Equity + Debt + Preferred Equity + Minority Interest - Investments in Affiliates - Cash and Marketable Securities.
(2) 2017 and 2018 EBITDA Multiples exclude multiples over 35x.
(3) 2017 and 2018 Price/Earnings Multiples exclude multiples over 50x.
Price as a % Market Enterprise Net Debt/
Price as of of 52 Wk Value Value (1)
EBITDA (2)
Price/ Earnings (3)
2017E Debt/
Company 8/31/2017 High ($mm) ($mm) 2017E 2018E 2017E 2018E EBITDA EV
Advanced Mobility
Transportation / Mobility
Continental €189.55 90.1% $45,073 $49,780 6.1x 5.6x 11.8x 10.6x 0.5x 12.8%
Delphi $96.40 99.7% $25,724 $29,364 9.8x 9.2x 14.4x 13.2x 1.1x 13.9%
Michelin €114.50 92.5% $24,543 $27,429 5.4x 5.0x 12.1x 10.8x 0.6x 14.1%
Fortive Corp $64.97 96.3% $22,516 $24,759 16.1x 14.9x 23.3x 21.3x 1.5x 13.0%
Magna $48.10 98.4% $17,729 $20,901 5.3x 5.0x 8.2x 7.4x 0.7x 16.4%
Valeo €56.18 82.9% $16,007 $17,588 6.1x 5.4x 13.2x 11.5x 0.5x 23.1%
Xerox $32.27 97.8% $8,202 $12,206 7.2x 7.1x 9.6x 9.0x 2.2x 42.7%
GSE Systems $38.68 98.0% $9,792 $9,918 19.5x 16.1x 27.0x 23.2x 0.2x 6.2%
Faurecia €48.86 98.2% $8,018 $8,693 4.0x 3.7x 11.3x 10.1x 0.2x 27.1%
Garmin $51.50 92.4% $9,686 $8,558 11.8x 11.6x 18.4x 18.1x NM NM
TomTom €8.76 88.8% $2,421 $2,354 12.8x 11.3x 35.3x 27.0x NM NM
Descartes C$35.06 99.9% $2,124 $2,065 25.0x 21.6x NM NM NM NM
Cubic Corp $42.95 77.2% $1,165 $1,385 12.6x 9.7x NM 21.9x 2.0x 22.0%
ORBComm $11.06 92.2% $813 $976 19.7x 15.2x NM NM 3.3x 25.2%
Vaisala €39.96 82.3% $866 $776 13.2x 11.6x 24.4x 20.1x NM NM
CalAmp $18.54 88.8% $656 $696 13.2x 11.2x 16.1x 14.0x 0.7x 21.4%
Ituran $33.40 90.4% $784 $679 9.9x 8.8x 16.5x 16.0x NM NM
Iteris $6.42 92.9% $209 $191 NM NM NM NM 9.1x NM
MiX Telematics $9.79 100.0% $227 $191 7.0x 6.0x 25.4x 21.6x NM 1.3%
Trakm8 £0.88 37.3% $40 $45 8.3x 6.1x 12.9x 9.4x 0.9x 16.7%
Mean 11.2x 9.7x 17.5x 15.6x 1.7x 18.3%
Median 9.9x 9.2x 15.3x 14.0x 0.8x 16.6%
Automotive
Toyota ¥6,183 85.7% $183,310 $301,601 10.6x 10.3x 10.1x 9.7x 4.4x 60.4%
Daimler €61.23 83.6% $77,880 $196,558 8.4x 8.4x 6.7x 6.9x 5.0x 72.3%
Volkswagen €129.65 82.4% $76,216 $191,636 4.9x 4.6x 5.4x 5.2x 3.0x 84.8%
BMW €78.00 85.0% $60,392 $165,540 9.3x 9.2x 7.1x 7.1x 5.9x 68.3%
Ford $11.03 83.1% $43,922 $150,937 13.3x 12.5x 6.4x 7.1x 9.4x 96.7%
General Motors $36.54 94.8% $53,246 $115,022 6.9x 7.1x 5.9x 6.2x 3.7x 77.5%
Nissan ¥1,093 89.6% $41,916 $103,362 9.0x 8.7x 7.1x 6.9x 5.4x 69.7%
Honda ¥3,081 83.8% $50,709 $96,689 8.0x 7.7x 9.0x 8.4x 3.6x 64.4%
Hyundai ₩140,500 81.2% $33,195 $77,566 9.9x 9.2x 7.6x 6.4x 5.0x 82.0%
Tesla $355.90 92.0% $59,395 $67,275 NM 29.4x NM NM 7.1x 14.2%
Renault €74.35 81.9% $26,140 $65,984 8.5x 8.2x 4.8x 4.7x 5.1x 87.1%
Fiat Chrysler €12.65 97.9% $29,271 $31,454 2.0x 1.9x 6.1x 5.2x 0.5x 72.3%
Mean 8.3x 9.8x 6.9x 6.7x 4.8x 70.8%
Median 8.5x 8.5x 6.7x 6.9x 5.0x 72.3%
Air and Environmental Services
Solid Waste
Waste Management $77.11 99.9% $33,931 $42,977 10.8x 10.3x 24.2x 22.0x 2.3x 21.1%
Republic Services $65.24 99.5% $21,970 $29,718 10.7x 10.0x 27.3x 24.5x 2.8x 26.2%
Waste Connections $66.69 99.3% $17,498 $21,118 14.5x 13.4x 31.3x 27.6x 2.5x 19.0%
Covanta $14.35 87.0% $1,880 $4,715 11.4x 10.1x NM NM 6.8x 62.2%
Advanced Disposal Services $23.84 96.1% $2,104 $4,027 9.4x 9.0x 44.0x 37.9x 4.5x 47.8%
Casella $16.81 94.8% $707 $1,207 9.4x 9.0x 27.6x 23.1x 3.9x 41.7%
Mean 11.0x 10.3x 30.9x 27.0x 3.8x 36.3%
Median 10.7x 10.1x 27.6x 24.5x 3.3x 33.9%
Specialty Waste
Stericycle $71.89 81.7% $6,135 $8,963 10.5x 9.9x 15.6x 15.0x 3.3x 31.9%
Darling Ingredients $17.40 98.3% $2,866 $4,590 10.5x 9.6x NM 21.7x 3.7x 38.1%
Clean Harbors $54.09 87.8% $3,091 $4,379 9.7x 8.7x NM 43.4x 2.8x 39.6%
US Ecology $51.40 93.5% $1,122 $1,394 11.5x 10.6x 29.2x 25.1x 2.2x 19.9%
Heritage-Crystal Clean $19.50 98.2% $441 $445 9.1x 8.2x 20.9x 23.0x 0.1x 6.4%
Newalta C$0.99 37.2% $70 $340 9.5x 7.5x NM NM 7.5x 79.5%
Mean 10.1x 9.1x 21.9x 25.7x 3.3x 35.9%
Median 10.1x 9.1x 20.9x 23.0x 3.1x 35.0%
Pollution Control
Donaldson $47.25 96.6% $6,194 $6,507 15.4x 14.5x 26.4x 23.8x 0.7x 9.3%
Calgon Carbon $12.20 64.9% $620 $842 8.4x 7.4x 22.0x 15.8x 2.2x 29.3%
CECO $7.47 50.2% $258 $349 7.8x 6.7x 12.6x 9.3x 2.1x 34.4%
Advanced Emissions Solutions $10.38 84.7% $219 $190 NM NM 4.7x 2.7x NA NM
Mean 10.5x 9.5x 16.4x 12.9x 1.7x 24.3%
Median 8.4x 7.4x 17.3x 12.6x 2.1x 29.3%
EV as a Multiple of
GCA / 12
Comparable Companies Trading Analysis
Water
Source: FactSet, SEC filings and third party providers. Values in U.S. Dollars. Share prices shown in local currencies.
(1) Enterprise Value = Market Value of Equity + Debt + Preferred Equity + Minority Interest - Investments in Affiliates - Cash and Marketable Securities.
(2) 2017 and 2018 EBITDA Multiples exclude multiples over 35x.
(3) 2017 and 2018 Price/Earnings Multiples exclude multiples over 50x.
Price as a % Market Enterprise Net Debt/
Price as of of 52 Wk Value Value (1)
EBITDA (2)
Price/ Earnings (3)
2017E Debt/
Company 8/31/2017 High ($mm) ($mm) 2017E 2018E 2017E 2018E EBITDA EV
Water
Efficiency / Process
Pentair $62.05 89.9% $11,261 $12,782 12.8x 12.2x 17.7x 15.9x 1.5x 13.3%
Flowserve $39.28 75.4% $5,131 $6,239 13.6x 11.1x 27.5x 19.7x 2.4x 25.5%
Rexnord $23.88 93.6% $2,475 $3,580 12.1x 11.2x 18.7x 16.6x 3.0x 36.1%
Itron $72.60 96.0% $2,810 $3,027 12.4x 10.7x 23.7x 19.9x 0.8x 10.8%
Kemira €10.39 82.8% $1,919 $2,796 7.8x 7.0x 15.0x 12.3x 2.5x 37.1%
Badger Meter $45.90 98.0% $1,336 $1,368 17.8x 16.3x 35.6x 32.1x 0.4x 3.3%
Lindsay $86.57 91.1% $920 $929 15.0x 12.6x 34.5x 25.9x 0.1x 12.6%
Calgon Carbon $12.20 64.9% $620 $842 8.4x 7.4x 22.0x 15.8x 2.2x 29.3%
Thermon Group $16.52 76.9% $535 $526 12.5x 11.0x 38.1x 28.1x NM 14.3%
AquaVenture Holdings $15.16 57.6% $401 $448 10.1x 9.1x NM NM 1.1x 29.1%
Wabag ¥613.30 81.9% $304 $308 10.0x 8.7x 20.0x 16.5x 0.1x 9.2%
Mean 12.1x 10.7x 25.3x 20.3x 1.4x 20.1%
Median 12.4x 11.0x 22.8x 18.1x 1.3x 14.3%
Infrastructure, Monitoring & Compliance
Ecolab $133.30 98.8% $38,574 $46,018 15.4x 14.3x 27.8x 24.8x 2.5x 16.7%
Xylem $62.07 99.9% $11,146 $13,286 15.4x 13.8x 26.2x 22.7x 2.5x 18.1%
Watts Water $61.70 86.8% $2,109 $2,440 10.8x 10.2x 20.8x 19.0x 1.5x 22.5%
Mueller Water Products $11.99 84.4% $1,901 $2,031 11.6x 10.2x 25.6x 21.2x 0.7x 23.7%
Hyflux S$0.50 78.6% $286 $1,776 NM NM NM NM NA 91.1%
Select Energy Services $14.10 84.9% $970 $1,170 11.8x 5.1x NM 12.2x NM NM
Aegion $21.67 81.2% $715 $998 7.8x 7.7x 18.8x 16.5x 2.1x 38.0%
Layne $10.74 94.0% $214 $322 9.6x 5.9x NM 23.9x 3.2x 50.6%
Pure Technologies C$5.37 86.2% $234 $230 12.0x 10.2x 39.8x 26.2x NM NM
Mean 11.3x 9.0x 26.2x 20.2xNM 2.0x 40.7%
Median 11.6x 10.2x 25.6x 21.2xNM 2.1x 30.8%
Heating & Cooling
A.O. Smith $55.69 96.1% $9,616 $9,250 15.7x 14.1x 26.5x 23.6x NM 4.1%
Lennox $165.73 86.1% $6,991 $8,119 13.7x 12.6x 20.7x 18.3x 1.9x 14.6%
AAON $32.60 85.3% $1,715 $1,663 17.3x 12.7x 32.6x 23.3x NM NM
Comfort Systems USA $34.05 85.8% $1,270 $1,340 9.4x 8.6x 19.4x 16.5x 0.5x 7.8%
Mean 14.0x 12.0x 24.8x 20.4x 1.2x 8.8%
Median 14.7x 12.7x 23.6x 20.8x 1.2x 7.8%
Distribution
Veolia $23.43 100.0% $13,201 $25,414 6.9x 6.6x 19.4x 16.4x 3.1x 66.9%
SUEZ €15.94 93.8% $11,621 $23,985 7.4x 6.7x 23.1x 17.2x 3.2x 63.8%
American Water Works $80.90 97.6% $14,423 $21,793 12.7x 11.9x 26.9x 24.7x 4.3x 34.2%
Severn Trent £22.69 88.1% $6,907 $13,651 12.1x 11.4x 19.1x 17.7x 6.0x 49.8%
Aqua America $33.40 97.1% $5,934 $7,959 16.2x 15.1x 24.6x 23.2x 4.1x 25.5%
American States Water $49.30 95.3% $1,807 $2,170 13.1x 12.2x 28.5x 27.7x 2.2x 16.8%
SJW $55.50 97.5% $1,138 $1,560 NM NM 22.5x 21.1x NA 27.6%
Connecticut Water Service $54.24 87.3% $628 $880 18.3x 17.1x 24.5x 23.3x 5.2x 29.0%
Middlesex Water Company $37.98 85.4% $621 $779 NM NM 24.7x 23.3x NA 20.8%
York Water $32.90 82.5% $423 $511 17.3x 16.4x NM NM 3.0x 17.3%
Artesian $37.09 88.5% $341 $454 12.2x 11.6x NM NM 3.0x 25.1%
Mean 12.9x 12.1x 23.7x 21.6x 3.8x 34.3%
Median 12.7x 11.9x 24.5x 23.2x 3.2x 27.6%
EV as a Multiple of

GCA / 13
Comparable Companies Trading Analysis
AgTech, Industrial Biotechnology and
Building Materials
Source: FactSet, SEC filings and third party providers. Values in U.S. Dollars. Share prices shown in local currencies.
(1) Enterprise Value = Market Value of Equity + Debt + Preferred Equity + Minority Interest - Investments in Affiliates - Cash and Marketable Securities.
(2) 2017 and 2018 EBITDA Multiples exclude multiples over 35x.
(3) 2017 and 2018 Price/Earnings Multiples exclude multiples over 50x.
Price as a % Market Enterprise Net Debt/
Price as of of 52 Wk Value Value (1)
EBITDA (2)
Price/ Earnings (3)
2017E Debt/
Company 8/31/2017 High ($mm) ($mm) 2017E 2018E 2017E 2018E EBITDA EV
AgTech
Large Crop / Life Science
Monsanto $117.20 98.5% $51,489 $59,742 14.3x 12.8x 23.0x 20.4x 2.0x 16.5%
Syngenta CHF441.75 93.8% $42,556 $45,095 15.5x 15.2x 24.4x 24.2x 0.9x 12.4%
Archer-Daniels-Midland $41.32 86.3% $23,244 $29,053 9.1x 8.6x 15.8x 14.3x 1.8x 24.0%
Agrium C$122.48 83.3% $13,499 $19,012 10.6x 9.6x 19.7x 16.2x 3.1x 30.7%
Bunge Limited $74.63 89.1% $10,492 $14,740 9.8x 7.8x 18.3x 13.2x 2.2x 44.1%
Mosaic $19.98 58.1% $7,013 $10,298 9.9x 8.0x 25.6x 18.0x 3.1x 37.9%
Alico $32.00 96.4% $264 $446 NM NM NM NM NA 42.0%
Mean 11.6x 10.3x 21.1x 17.7x 2.2x 29.7%
Median 10.3x 9.1x 21.4x 17.1x 2.1x 30.7%
Irrigation / Equipment
Deere $115.93 87.5% $37,082 $67,718 17.9x 16.5x 17.5x 15.6x 8.1x 55.3%
CNH Industrial $11.36 93.7% $15,496 $35,715 14.5x 13.3x 25.4x 19.1x 8.2x 71.6%
Kubota ¥1,904 91.5% $21,472 $27,514 12.3x 11.2x 16.9x 15.4x 2.4x 26.3%
Mahindra & Mahindra ₹1,345 89.6% $13,065 $18,561 20.2x 17.4x 20.7x 18.0x 6.7x 41.1%
AGCO $68.45 92.5% $5,438 $7,051 10.5x 9.3x 22.4x 18.0x 2.3x 26.4%
Toro $61.68 83.5% $6,656 $6,686 15.4x 14.0x 25.6x 23.7x NM 5.0%
Valmont $143.55 86.9% $3,243 $3,589 9.9x 9.0x 20.3x 18.0x 0.8x 21.1%
Jain ₹98.65 82.3% $729 $1,256 7.3x 6.3x 17.3x 11.9x 2.9x 43.0%
Raven Industries $28.00 74.9% $1,011 $956 14.7x 12.4x 29.9x 24.2x NM NM
Lindsay $86.57 91.1% $920 $929 15.0x 12.6x 34.5x 25.9x 0.1x 12.6%
Mean 13.8x 12.2x 23.0x 19.0x 3.9x 33.6%
Median 14.6x 12.5x 21.6x 18.0x 2.7x 26.4%
Industrial Biotechnology
Archer Daniels Midland $41.32 86.3% $23,244 $29,053 9.1x 8.6x 15.8x 14.3x 1.8x 24.0%
Cosan R$38.59 87.0% $5,003 $7,647 4.9x 4.8x 13.5x 12.7x 1.3x 44.0%
Green Plains Renewable Energy $18.55 62.1% $770 $1,710 9.1x 6.1x NM 17.3x 4.4x 63.3%
SunOpta C$10.81 79.9% $746 $1,313 16.8x 12.3x NM 41.2x 6.2x 43.2%
MGP Ingredients $56.23 90.7% $940 $976 17.8x 15.5x 33.1x 28.9x 0.7x 4.5%
Renewable Energy Group $12.10 90.4% $468 $716 19.4x 5.7x NM 7.0x 6.7x 47.3%
Pacific Ethanol $5.00 45.7% $220 $370 9.3x 4.3x NM 9.0x 3.1x 58.0%
FutureFuel $13.48 81.3% $590 $358 NM NM NM NM NA NM
Amyris $2.47 13.6% $93 $267 NM NM NM NM NM 68.8%
Mean 12.3x 8.2x 20.8x 18.6x 3.4x 53.9%
Median 9.3x 6.1x 15.8x 14.3x 3.1x 47.3%
Building Materials
Multi-Industry
Saint-Gobain €46.08 87.9% $30,693 $38,790 7.6x 7.0x 15.5x 13.3x 1.6x 29.2%
CRH $34.91 91.8% $29,261 $37,146 9.3x 8.8x 16.9x 14.9x 1.8x 25.8%
Masco $36.77 93.4% $11,715 $13,864 10.5x 9.7x 18.6x 16.4x 1.5x 22.2%
Owens Corning $74.13 99.8% $8,243 $10,765 9.0x 8.1x 17.3x 15.2x 2.1x 25.0%
Beacon Roofing Supply $47.10 90.4% $2,844 $4,025 10.7x 9.7x 20.5x 17.9x 3.1x 30.2%
Armstrong World Industries $47.50 95.9% $2,512 $3,313 9.3x 8.6x 17.4x 15.7x 2.3x 26.6%
Simpson Manufacturing $43.78 90.4% $2,070 $1,931 10.6x 9.6x 20.9x 19.7x NM NM
Griffon Corporation $18.55 68.3% $877 $1,805 9.5x NM 20.9x NM 4.9x 55.3%
Gibraltar $29.25 60.9% $924 $952 9.2x 8.3x 19.9x 18.4x 0.3x 22.0%
Mean 9.5x 8.7x 18.7x 16.4x 2.2x 29.5%
Median 9.3x 8.7x 18.6x 16.0x 2.0x 26.2%
Sustainable Products/Materials
Kingspan €32.50 97.0% $6,920 $7,500 14.2x 13.4x 20.1x 18.8x 1.1x 10.7%
Cabot Corporation $52.68 85.9% $3,278 $4,134 8.1x 7.7x 14.9x 13.7x 1.4x 23.0%
Trex $76.00 92.6% $2,235 $2,226 14.6x 12.9x 25.4x 22.5x NM NM
Quanex $19.60 86.5% $675 $947 8.8x NM 23.9x 19.3x 2.5x 30.3%
DIRTT Environmental Solutions C$5.72 76.2% $387 $338 13.3x 8.0x NM 21.9x NM 3.8%
Aspen Aerogels $4.09 61.0% $96 $90 NM 11.7x NM NM 2.4x NM
Mean 11.8x 10.7x 21.1x 19.2x 1.9x 16.9%
Median 13.3x 11.7x 22.0x 19.3x 1.9x 16.9%
EV as a Multiple of

GCA / 14
GCA – The Largest Bank Focused
Exclusively on Sustainable Technology &
Infrastructure
San Francisco
New York
Zürich
Tokyo
Partnership with
Sangyo Sosei
Advisory Inc.
Investment Banking Asset Management
> Equity Private
Placements
> Debt Private Placements
> Project Finance Advisory
> Co-Managed Public
Offerings
$4bn
Capital Raising
> Corporate Sales
> Asset Sales
> Acquisitions
> Minority Investments
> Joint Ventures
> Fairness Opinions
$11bn
Mergers &
Acquisitions Strategic Advisory
> Strategic Consulting
> IPO Preparation
> Financial Restructuring
> Specialized Opinions
> Independent Capital
Markets Advice
>20 assignments
Public Equity
> GCA Sustainable Growth
Fund
$530mm
Who We Are
New York
640 Fifth Avenue
New York, NY 10019
T +1 212 946 3360
Zürich
Bahnhofstrasse 26
8001Zürich
T +41 44 578 3900
San Francisco
555 Mission Street, Suite 3300
San Francisco, CA 94105
T +1 415 697 1550
Jeff McDermott
Managing Partner,
New York
+1 212 946 3940
Steve Megyery
Partner,
New York
+1 212 946 3949
Senior Team Members - Supported by 50 Professionals across 3 Offices
Rob Schultz
Partner & COO,
New York
+1 212 946 3950
Jim Long
Partner,
Zurich
+41 79 510 3920
Damien Sauer
Partner,
Zurich
+41 44 578 3914
PJ Deschenes
Partner,
New York
+1 212 946 3362
Duncan Williams
Partner,
San Francisco
+1 415 697 1560
Michael Horwitz
Partner,
San Francisco
+1 415 697 1561
> 30+ years of experience
> >100 completed transactions
> Prior roles include Joint Global Head of
Investment Banking at UBS, Head of
Industrials at UBS and Head of
Industrials at Citigroup
> 25+ years of experience
> Prior roles include Managing Director
and Chief Operating Officer of Morgan
Stanley Fund Services
> Renewable Energy Infrastructure,
Biofuels and Environmental Services
> Prior roles include Member of Power
and Renewables Group at GE Energy
Financial Services; Founder / Partner of
Blue Wave Strategies, a Cleantech-
focused firm
> Private Placements, Venture Capital and
Private Equity Coverage
> Prior roles include Director of Sustainable
Infrastructure at Coady Diemar Partners
and Credit Suisse
> Energy Efficiency and Storage, Industrial
IOT/ Software, Renewable Energy and
Biotech
> Prior roles include Managing Director and
Head of Energy Technology at Robert W.
Baird and Head of Cleantech Research at
Stanford Group Company
> Environmental Services, Water, AgTech,
Advanced Mobility and Industrial IOT/
Software
> Prior roles include Managing Director and
Head of Industrial Growth Technology at
Wedbush Securities and Executive
Director at UBS Investment Bank
> European Coverage and Execution
> Prior roles include Head of M&A at AREVA
and Founding member of MGT M&A
Department, an investment bank
specialized in high growth companies
> European Coverage and Execution
> Prior roles include Managing Director at
Ecofin and Co-Chairman of Global Power
and Utilities Investment Banking at
Citigroup
David Smith
Partner &
Portfolio Manager,
New York
+1 212 946 2231
> 20+ years of experience
> Prior roles include Portfolio Manager of
the Gabelli Green Long Short Fund and
Long Only Fund, and Principal at
Longbow Capital Partners
Derek Bentley
Partner,
New York
+1 212 946 3948
> Solar, Renewable Energy Infrastructure
and Water
> Prior roles include Director in Energy
and Power at Bank of America Merrill
Lynch

GCA / 15
Disclaimer
This industry update, (the “Monthly Update”) was developed from publicly available information,
without any independent investigation or verification thereof by Greentech Capital Advisors, LLC, taken
together with its affiliates, (“GCA”), and GCA makes no representation or warranty as to the accuracy
and completeness of such information. The Monthly Update is not intended to provide, and should not
be relied upon for, legal, tax, regulatory, financial, accounting or investment advice. Prior to entering
into any transaction advised by GCA (a “Transaction”), you should determine, without reliance upon
GCA, the economic risks and merits (and independently determine that you are able to assume these
risks) as well as the legal, tax and accounting characterizations and consequences of any such
Transaction. In this regard, by accepting this Presentation, you acknowledge that (a) GCA is not in the
business of providing (and you are not relying on GCA for) legal, tax or accounting advice, (b) there
may be legal, tax or accounting risks associated with any Transaction, (c) you should receive (and rely
on) separate and qualified legal, tax and accounting advice and (d) you should apprise senior
management in your organization as to such legal, tax and accounting advice (and any risks associated
with any Transaction) and our disclaimers to these matters.
The Monthly Update does not purport to be complete on any topic addressed. The information in the
Presentation is provided to you as of the dates indicated and GCA does not intend to update the
information after its distribution, even in the event that the information becomes materially inaccurate.
Certain information contained in the Presentation includes calculations or figures which have been
prepared by GCA using physically available information and have not been audited or verified by GCA
or a third party. GCA has used data sourced from FactSet and has not reviewed or verified this data in
the preparation of the Monthly Update. GCA expressly prohibits any redistribution of the Monthly
Update without the prior written consent of GCA. The Monthly Update is not intended for distribution,
or use by, any person or entity in any jurisdiction or country where such distribution or use is contrary
to law, rule or regulation.
GCA is engaged in or may be engaged in the future in investment banking, securities trading,
brokerage activities and principal investing activities, as well as providing financial advisory services.
The Monthly Update is neither an expressed nor an implied agreement by GCA to act in any capacity
with respect to you, and any such agreement shall only be as set forth in an executed engagement
letter, the terms of which are to be agreed upon by you and GCA. The Monthly Update in no way
restricts GCA or its affiliates from any other engagement, including acting in any capacity in a manner
adverse to you.
No fiduciary, advisory or agency relationship between GCA, on the one hand, and you and your
affiliates, employees, officers, directors, or stockholders on the other hand, has been created in
respect of the Presentation, and none of your affiliates, employees, officers, directors, or stockholders
may rely on the Presentation.