sustainable service delivery models for rural water supply
TRANSCRIPT

Sustainable Service Delivery
Models for Rural Water Supply
Harold Lockwood and Goufrane Mansour, Aguaconsult, UK
Stef Smits, IRC, Netherlands
Susanna Smets, World Bank
Findings from sixteen
country study

Water MDG was met early in 2010…… but
sustainability under threat
91 percent of global population uses improved
drinking water source
2.6 billion people have gained access since 1990
Only 3 countries have below 50% coverage –
compared to 23 in 19906
630 million (1 in 10) without improved water – 80%
in rural areas
30 to 40% of schemes non-functional, many failing after few years
Sustaining access under threat - functionality, climate change,
institutional fragmentation
Source JMP, 2015

Sustainability examined in 16 countries with
World Bank programs to improve
operations and inform global solutions
Methodology:
Wide range of country contexts
Desk review and field visits
Support of local consultants, World Bank teams and local stakeholders
Outputs: Global Synthesis
Country Reports
Tool to help teams
do sustainability
assessment during project
preparation/review

Analytical framework recognizes:
context, building blocks, institutional
levels and service delivery models

Qualitative analysis enhanced through
application of a scoring framework Scoring applied to provide snapshot assessment of country progress
towards ideal situation of each building block
Based on four sub-questions for each building block (max. 8 points
per building block)
Scoring applied at sector level (max. 40 points) and at service delivery
level (max. 40 points) to identify progress, strength and weakness of
SDMs
Scores based on available secondary data and/or on interviews and
interpretation; question of rigour – ‘one finds what one is looking for’
0 – 2Most conditions are not yet in place, there are significant challenges and
much still needs to be done in many areas of the building block
3 – 5There is progress in some aspects, but more still needs to be done, or there
is mixed progress across the building block
6 – 8 All areas of each building block are being addressed, or there is significant
progress underway toward optimum conditions in the building block

Country Context and
Situational Analysis of
Rural Water Supply
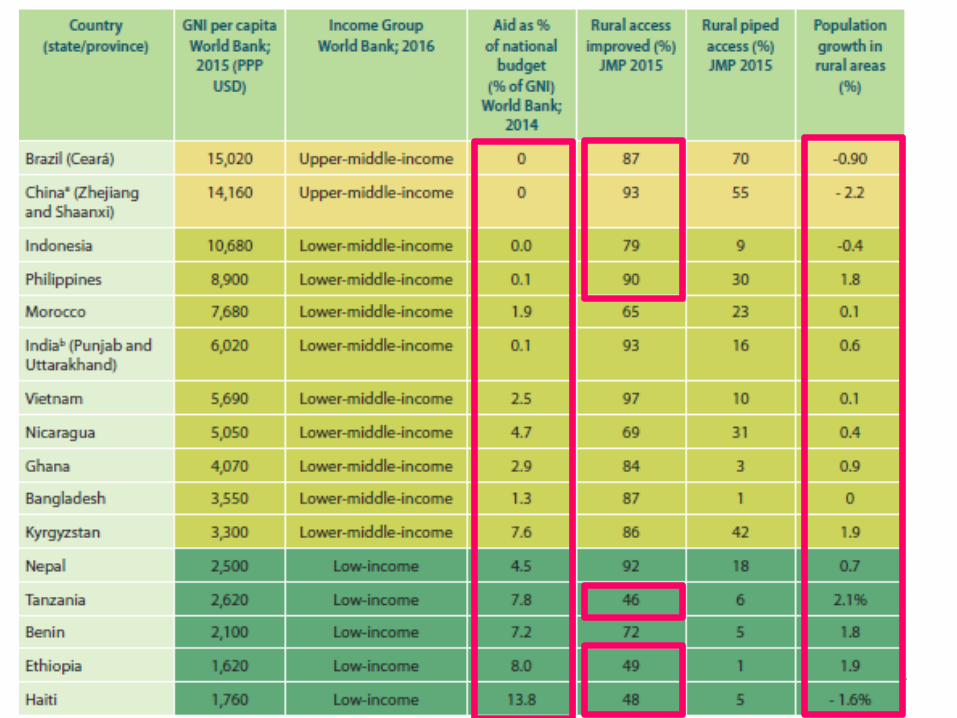

Access only partially predicted by increase in
GNI…and limited functionality monitoring
Nepal, Bangladesh, Ethiopia, Benin
made impressive progress despite
modest low GNI, but Tanzania,
limited progress, with GNI growth
Two thirds of countries have no
national system for tracking
functionality rates
1990- 2015

Contextual drivers as demographics and
decentralization matter for rural water supplyRural demographics:
Growing populations, increasing demand and
political importance – Ethiopia, Tanzania,
Philippines
Rising income levels with increasing demand for
higher service levels – Morocco
Shrinking rural populations with less human
resources to sustain services - Brazil, China
Extent of (fiscal) decentralization:
Highly decentralized with significant inter-
governmental transfers – China, India
Highly decentralized in ‘resource poor’ contexts
– Kyrgyzstan, Nepal, Benin
Stalled decentralization – Bangladesh
Country Progress
towards Sustainable
Rural Water Service
Delivery
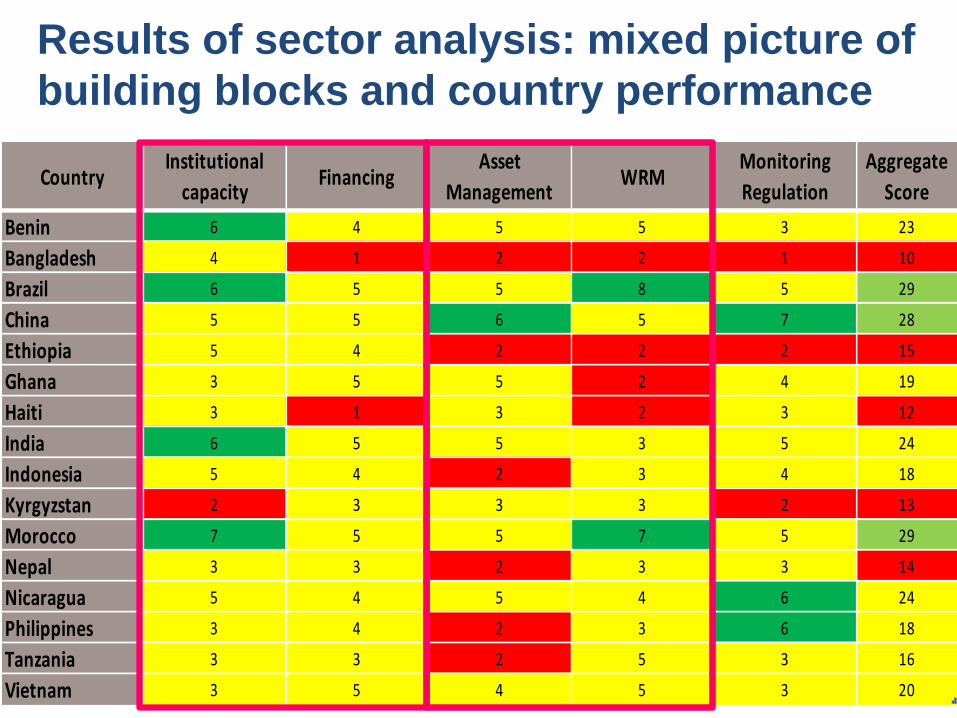
Results of sector analysis: mixed picture of
building blocks and country performance
CountryInstitutional
capacityFinancing
Asset
ManagementWRM
Monitoring
Regulation
Aggregate
Score
Benin 6 4 5 5 3 23
Bangladesh 4 1 2 2 1 10
Brazil 6 5 5 8 5 29
China 5 5 6 5 7 28
Ethiopia 5 4 2 2 2 15
Ghana 3 5 5 2 4 19
Haiti 3 1 3 2 3 12
India 6 5 5 3 5 24
Indonesia 5 4 2 3 4 18
Kyrgyzstan 2 3 3 3 2 13
Morocco 7 5 5 7 5 29
Nepal 3 3 2 3 3 14
Nicaragua 5 4 5 4 6 24
Philippines 3 4 2 3 6 18
Tanzania 3 3 2 5 3 16
Vietnam 3 5 4 5 3 20

Mapping overall aggregate sector score -
for building blocks with GNI per capita
Bangladesh
Benin
BrazilChina
Ethiopia
Ghana
Haiti
India
Indonesia
Kyrgyzstan
Morocco
Nepal
Nicaragua
Philippines
Tanzania
Vietnam
0
5
10
15
20
25
30
35
0 2000 4000 6000 8000 10000 12000 14000 16000
Av.
sec
tor
leve
l bu
ildin
g b
lock
sco
re (
max
=40
)
GNI per capita
Importance of political commitment and
leadership
e.g. ONEWASH national programme in Ethiopia
Performance of
Service Delivery
Models

Distribution of Service Delivery Models:
> 60 variants but CBM most common

Service Delivery Model scores: public
utilities and private sector are strongest
SDM scoresCommunity Based
Management
Local Government
ProvisionPublic Utility Private Sector
Supported Self-
supply
Bangladesh 13 10 21
Benin 10 19
Brazil 21
China 16 37 29
Ethiopia 7 8
Ghana 9 13
Haiti 5 13
India 22
Indonesia 23
Kyrgyzstan 15
Morocco 26 21 34 36
Nepal 14
Nicaragua 20
Philippines 14 18 26 25
Tanzania 17
Vietnam 8 18 24
Av. all countries 15 15 32 22 8

A nuanced picture for community-based
management: aggregation, systematic support
and contracting increases performance
Community management with no or very
limited external support, no monitoring or
regulation – resulting in poor performance
with consistently low scores
Stronger scores for associations or
federations of CBM (Brazil/Ceara,Tanzania)
Strong scores for CBMs provided with
structured support (Ethiopia), although
doubts about scalability due to specific
donor funding
Good scores for CBMs contracting private
sector services but retaining control – Haiti,
Tanzania
26%
14%
3%17%
40%
Association of CBM
CBM/ Private sector
Other
Supported CBM
Unsupported CBM

Public utility provision in rural areas
emerges as strong model in few countries
Public utility provision: In three countries - China, Morocco and
The Philippines
Water Affairs Companies in China are urban
utilities and perform well in almost all aspects
Absorbing rural populations is not
commercially attractive and incentives are
provided to support the process
Direct local government provision:
• Few examples, low scores: institutional capacity and financing is weak;
do not perform better than community management models
• Many are not corporatized entities: not able to operate on commercial
and autonomous basis; no ring-fencing of accounts from local
government budgets

Private service delivery models perform well,
but require effort and resources to scale Relatively common – found in 8 countries with range of contractual
mechanisms from build operate own, lease and concession
contracts - outperforms other models with consistently higher
financing scores
Aggregated approaches to linking schemes and/or management
Most are large-scale pilots and receive significant public funds such
as to facilitate transaction (enabling environment, project
preparation) and attract private investments (capex viability grants)
Vietnam framework to encourage domestic private finance
with capital support to investors; Thai Binh province
• Since 2012, capital from private sector is 39% of total
• 42% of total designed rural water supply capacity
• private sector participation include build-own-operate-
transfer (BOOT), build-own-operate (BOO) and O&M
contracts

Reflections on
strengthening rural
water supply services

Differentiation of ‘market’ will require
context-specific solutions
Highly dispersed rural populations
Service levels: basic, typically point source
Challenges:
Requires continuous public funding for on-going support; financing of capital maintenance; little economy in monitoring
Interventions
• Structured programs of support by local government or higher level;
• Focus on improving water quality;
• Public funding for capital maintenance costs
• Form of soft loans for some communities may be possible
Rural commuities and growth centres
Service levels: piped networks with or without household connections
Challenges: limited pool of skilled operators, limited markets, reluctance to pay and to charge/increase tariffs
Interventions:
• Technical support to service authority and providers; Promote willingness to pay; Simplified asset management; Improve access to repayable financing;
• Establish clustering of management contracts to be more attractive
• Improve monitoring
• Delegate regulatory functions
Concentrated rural populaitons
Service levels: Piped schemes, with household connections 24/7
Challenges:
Transparency in aggregation process, financial sustainability of absorbing rural areas; tariff adjustments
Interventions:
• Incentivize service providers to integrate peripheral rural areas;
• Strengthen asset management
• Improve regulation of service providers
• Performance benchmarking Support consumer-oriented practices
• Improve access to repayable finance

Key policy highlights1. There is a ‘missing middle’ in the enabling environment: investment in
systems, capacities and resources need to go down to service authority level.
2. Communities on their own can often pay “O&M plus” but not full cost
recovery: financing from tariffs can cover O&M (and beyond) but plan for
continued public financing for direct and indirect subsidies from taxes and
transfers.
3. The transition to higher service levels needs to be well managed: better
service levels with aggregated/larger, more complex schemes, will require
professionalized management, asset management, comprehensive monitoring
and introducing light touch regulation.
4. Dispersed and hard to reach people require explicit focus to avoid
stagnation: as countries move along the development trajectory vulnerable,
ethnic and minority groups will require tailored approaches.
5. Technical or management solutions are not the constraint, in the end it is
political engagement that may matter most: rural water sectors do not exist in
a vacuum and require an understanding and navigation of the political economy
to ensure that systems are in place to sustain services indefinitely.
