sustainable reverse osmosis desalination - rmit...
TRANSCRIPT

Sustainable Reverse Osmosis Desalination
Sasan Moridpour
B. Eng.
Submitted in fulfillment of the requirements for the degree of
Master of Engineering
School of Aerospace, Mechanical and Manufacturing Engineering
RMIT University, Australia
March 2014

___________________________________________________________________ ii
Declaration
To the best of his knowledge, the author confirms that this thesis contains no parts
formerly published or written by another person, except where appropriate
reference is made. Also this thesis has no material that has been accepted for the
award of any other degree in any other institution or university.
………………….
Sasan Moridpour
March 2014

___________________________________________________________________ iii
Acknowledgement
First and foremost, my deepest gratitude goes to my supervisors Aliakbar
Akbarzadeh, Abhijit Date and Reza Jazar for their support and guidance
throughout this research. I greatly appreciate everything I learnt from them.
Aliakbar was not only a supervisor but also a mentor, a guide and a father to me.
He taught me things that otherwise, I would have never been taught in a school.
I would also like to thank my family for their support without which this step
wouldn’t be as easy to be taken as it was. Kindest regards to my mom and dad
whose endless encouragement helped me the most throughout the hard times. I
will never forget your support.
Finally, many thanks to my sincere friends back home. They were always there
for me. I wish I can do the same for them.

___________________________________________________________________ iv
Summary
The need for fresh water is growing rapidly with the growth in population and
increase in industrial demands. The natural resources are no longer able to meet
the global demands. Desalination of salty water is a good solution to solve this
problem. Among all methods of desalination, Reverse Osmosis (RO) desalination
is the most promising and the most feasible method. Almost all of the large scale
desalination plants in Australia and more than 60% of all desalination plants
around the world are using reverse osmosis as the main method. Reverse osmosis
is a flexible method and can be used for desalination of a large range of feeds
from brackish water of rivers to very salty water of the Dead Sea. It works based
on the fact that semi-permeable membranes have a selective feature of passing
and only allow certain type of materials to pass and reject the rest. A reverse
osmosis membrane allows the fresh water to pass and stops most of the dissolved
particles including salt. Therefore, if salty water is pushed toward a membrane,
the salt particles will be stopped while fresh water passes the membrane and can
be collected at the other side.
However, despite having higher efficiency and relatively lower energy
consumption compared to other desalination methods, RO is still not feasible in
many regions around the world. Required electricity to operate an RO desalination
plant is not available in some remote areas and is very expensive in many others.
Therefore, introducing methods to reduce the electrical energy consumption of
reverse osmosis desalination is of great advantage. In addition, the discharge of
high concentrated brine is an economic and environmental issue which needs to
be addressed. This research proposes and tests two different methods to reduce the
electricity consumption and to utilize the reject brine and generate energy. All the
tests were conducted in Renewable Energy Lab of RMIT University, Melbourne.

____________________________________________________________________v
In the first method, pre-heating of the feed stream has been studied. Pre-heating is
believed to reduce the electricity consumption of reverse osmosis desalination by
increasing the temperature of salty water and thus decreasing its viscosity. The
contribution of this research is to provide the heat by a solar collector for the first
time. A solar pond was used to collect solar energy in the form of thermal energy
and to pre-heat the feed stream. RO desalination process was conducted with
different temperatures of feed water and the performance of the process was
monitored and recorded. The results showed that by increasing the temperature
from C to C with the thermal energy provided by a solar pond the specific
energy consumption of RO desalination process is reduced by up to 35%. This
results in considerable reduction in CO2 emissions. Also, recovery ratio showed a
significant improvement. Overall, the tests showed that by coupling the RO
desalination process with solar pond, and utilizing solar thermal energy for pre-
heating the salty stream, the performance of RO process improves considerably.
As the second part of the research, a method was designed to utilize the reject
brine and generate power. The method consists of running a forward osmosis
process by using the reject brine as well as the sea water in a continuous form.
First, the theoretical model which describes the process was developed. For this
purpose, the basic physics of forward osmosis process and osmotic membranes
were used to derive the required equations. These equations were later used in
order to predict the amount of potentially available osmotic power. The studies
showed that the available osmotic power is a function of the salinity gradient
across the membrane and also the available hydrostatic pressure at its saltier side.
With these predictions, the maximum osmotic power for any given salinity
gradient (as the most important design parameter) was calculated. Then,
supporting experiments were design and conducted to validate the theory. The
results showed that the Osmotic Power can be generated successfully in a
sustainable and continuous form. However, because of the inefficiencies which
are discussed in the thesis, the magnitude of the generated power was less than
predictions of the theory. The research was successfully able to address both of
the research questions and achieve the research objectives.

___________________________________________________________________ vi
Nomenclature
Q Heat
k Thermal conductivity
A Area
b Thickness
T Temperature
m Mass
c specific heat
D Diameter
l Length
ρ Density
V Volume
t Time
P Power
p Pressure
π Osmotic pressure
S Salinity
DP Driving pressure

__________________________________________________________________ vii
Table of Contents
Chapter 1 Introduction
1.1 Background .............................................................................................. 1
1.2 Research Objectives ................................................................................. 3
1.3 Thesis Structure ........................................................................................ 4
Chapter 2 Reverse Osmosis Desalination; A Green Process
2.1 Introduction .............................................................................................. 6
2.2 Energy Recovery Methods ....................................................................... 6
2.3 Reverse Osmosis Powered by Renewable Energy ................................. 10
2.4 Utilizing the Reject Brine ....................................................................... 13
2.5 Concluding Remarks and Research Gaps .............................................. 14
Chapter 3 Solar-Assisted Reverse Osmosis Desalination
3.1 Introduction ............................................................................................ 16
3.2 Proposed Method: Solar-assisted RO Desalination ................................ 18
3.3 Effect of Temperature on the Cross-membrane Flow ............................ 20
3.4 Experimental Facilities ........................................................................... 25
3.4.1 Reverse Osmosis Desalination Module .......................................... 25
3.4.2 Solar Pond ....................................................................................... 26
3.4.3 Heat Exchanger ............................................................................... 29
3.5 Test Procedure; Pre-heating the Feed Stream ........................................ 30
3.6 Results; the Effect of Pre-heating ........................................................... 32
3.6.1 Power Consumption vs. Feed Temperature .................................... 32
3.6.2 Recovery Ratio vs. Feed Temperature ............................................ 32
3.6.3 Specific Energy vs. Temperature .................................................... 34
3.6.4 CO2 Emission .................................................................................. 35
3.6.5 Initiate Time of Permeation ............................................................ 36

__________________________________________________________________ viii
3.7 The Temperature Function; Optimum Flow Rate .................................. 38
3.8 Summary ................................................................................................ 44
Chapter 4 Osmotic Power: Utilizing the Reject Brine
4.1 Introduction ............................................................................................ 46
4.2 Forward Osmosis .................................................................................... 48
4.3 Proposed Method: Harvesting the Osmotic Power ................................ 51
4.4 Theory of Osmotic Power ...................................................................... 53
4.5 Maximum Osmotic Power ...................................................................... 65
4.6 Experimental Facilities ........................................................................... 68
4.6.1 Membrane ....................................................................................... 68
4.6.2 Fittings/Caps ................................................................................... 70
4.6.3 Pumps .............................................................................................. 74
4.7 Experiment Procedure ............................................................................ 75
4.8 Results .................................................................................................... 76
4.9 The Effect of Feed Water Flow Rate ...................................................... 80
4.10 Summary ................................................................................................ 86
Chapter 5 Conclusion and Future Research
5.1 Conclusions ............................................................................................ 88
5.2 Contributions .......................................................................................... 91
5.3 Future Work ........................................................................................... 92

___________________________________________________________________ ix
Table of Figures
Figure 1.1: Thesis structure. .................................................................................... 4
Figure 2.1: RO desalination module. ...................................................................... 7
Figure 2.2: A series of desalination membranes. .................................................... 8
Figure 2.3: RO pressure exchanger. ........................................................................ 9
Figure 3.1: Solar-assisted reverse osmosis desalination plant. ............................. 18
Figure 3.2: Dynamic viscosity of seawater. .......................................................... 20
Figure 3.3: Testing the passage of distilled water through the membrane............ 21
Figure 3.4: Required power to push distilled water through the membrane. ........ 22
Figure 3.5: Rate of cross-membrane passage of distilled water............................ 23
Figure 3.6: Specific energy. .................................................................................. 24
Figure 3.7: Schematic picture of a solar pond....................................................... 27
Figure 3.8: Solar pond in renewable energy lab, RMIT University. .................... 28
Figure 3.9: Internal heat exchanger inside of the solar pond. ............................... 29
Figure 3.10: Internal heat exchanger in the solar pond at RMIT University. ....... 30
Figure 3. 11: Schematic procedure of the experiments. ........................................ 31
Figure 3.12: Required power for reverse osmosis desalination. ........................... 33
Figure 3.13: Recovery ratio. ................................................................................. 33
Figure 3.14: Specific energy. ................................................................................ 34
Figure 3.15: CO2 emission. ................................................................................... 36
Figure 3.16: Initiate Time of Permeability. ........................................................... 37
Figure 3.17: Heat exchanger’s tube. ..................................................................... 39

____________________________________________________________________x
Figure 3.18: The control mass. .............................................................................. 39
Figure 4.1: Different stages of a forward osmosis process. .................................. 50
Figure 4.2: Schematic picture of a FO plant coupled with RO plant. ................... 52
Figure 4.3: Schematic picture of a forward osmosis process. ............................... 53
Figure 4.4: Experiment to find corresponding osmotic pressure for different
salinities. ............................................................................................................... 57
Figure 4.5: Different salinities and corresponding osmotic pressures in different
temperatures. ......................................................................................................... 58
Figure 4.6: Permeate flow rate at different temperatures and salinity gradients. . 60
Figure 4.7: Comparison between the permeate rates in two different temperatures.
............................................................................................................................... 61
Figure .8: smotic ower for different salinities in C. ................................... 62
Figure .9: smotic ower at C and 3 C. .................................................... 63
Figure 4.10: Comparison between the available Osmotic Power in two different
temperatures. ......................................................................................................... 64
Figure 4. 11:The maximum Osmotic Power at 3 C as a function of pressure. . 67
Figure .1 : The maximum smotic ower at 3 C as a function of salinity. ... 67
Figure 4.13: The commercial RO membrane. ....................................................... 68
Figure 4.14: Schematic view of the membrane. .................................................... 69
Figure 4.15: A commercial membrane.................................................................. 70
Figure 4.16: Schematic view of fresh water and salty water inlets on a commercial
reverse osmosis membrane. .................................................................................. 71
Figure 4.17: Isometric view of the cap.................................................................. 71
Figure 4.18: Front view of the cap. ....................................................................... 72
Figure 4.19: Cross-sheared view of the cap. ......................................................... 72
Figure 4.20: Schematic plan of the cap for manufacturing process. ..................... 73
Figure 4.21: Membrane and the caps installed on both sides. .............................. 74

___________________________________________________________________ xi
Figure 4.22: Proposed experiment to harvest the Osmotic Power. ....................... 76
Figure 4.23: Osmotic pressure for 10,000 ppm; Theory and experiment. ............ 77
Figure 4.24: Density of osmotic power for 10,000 ppm. ...................................... 77
Figure 4. 25: Osmotic pressure for 50,000 ppm; Theory and experiment. ........... 78
Figure 4.26: Density of osmotic power for 50,000 ppm. ...................................... 79
Figure 4.27: The effect of dilution. ....................................................................... 82
Figure 4.28: Effect of salty water flow rate on the final osmotic pressure. .......... 85
Figure 4.29: Effect of salty water flow rate on the final osmotic pressure at higher
flow rates. .............................................................................................................. 86

Chapter 1
Introduction
1.1 Background
Providing fresh water for drinking and other domestic purposes has always been
an important matter all around the world. Some dry regions and remote areas are
facing physical and economical water scarcity and have been affected by the
water shortage related problems. Among those are Middle East, central parts of
Africa and some regions in America and Australia. For such places, providing
fresh water becomes a challenge and in many cases leaves not so many options
ahead. Seawater desalination, among all, is one of the most feasible. Desalination
technologies are not only used for delivering fresh water but also to purify and
treatment of waste water (Nicolaisen, 2003, Rautenbach and Linn 1996, Scrivani,
et al. 2007, Egozy and Korngold 1982). There are many different methods of
desalination and each has its advantages and disadvantages.
Old methods of water desalination were mostly based on evaporation and
distillation of seawater in order to provide the crew of ships with fresh water
during long sailings. These methods have been used for many centuries and have
been developed to fit the modern context of life. Multi-Effect Distillation (MED)
is still a popular desalination method in which the seawater is heated by hot steam
in different stages. Although distillation seemed to be efficient and simple, more
methods of desalination were invented along with the recent developments in
technology. Today, desalination plants around the world use various methods to
deliver fresh water. Flashing seawater into hot steam (Multi-Stage Flashing,

Chapter 1 Introduction _________________________________________________ 2
MSF), separating dissolved particles from ice crystals (Desalination by Freezing),
and using electricity to conduct electro-dialysis (ED) are of the most popular.
However, a recent invented and developed technology is currently finding its
significant role in desalination industry. Reverse Osmosis (RO), which is based on
a particular permeability feature of membranes, is now considered as the most
promising method for water desalination. During past few decades, membrane-
based desalination methods have been playing a key role in desalination industry.
Reverse osmosis, among all, is one of the most successful methods due to recent
developments in membrane technology. RO employs the feature of selective
passing of a semi-permeable membrane. A semi-permeable membrane only
allows the water molecules to pass while the salt molecules are stopped by the
membrane. This feature helps getting fresh water at one side of the membrane by
pushing salty water through the other side. The process of reverse osmosis
desalination is explained in detail later on chapter 4.
Since the introduction of reverse osmosis desalination and even before that, the
membrane technology has been developing continuously (Riley et al. 1966,
Lonsdale 1982, Glater 1998). Membranes of each generation had higher
efficiency and better performance than the generation before. With the current
available commercial membranes, reverse osmosis water desalination is no longer
an expensive and energy consuming process as it used to be during 70s and 80s.
Many reverse osmosis plants in different scales started to produce fresh water for
a big range of application all around the globe. Today, reverse osmosis provides a
major proportion of the world’s total desalinated fresh water .Approximately 7 %
of the world’s desalination plants are using reverse osmosis as the main method.
Among all, Middle East has the highest number of reverse osmosis desalination
plants and is followed by the United States of America, Northern Africa and
Europe. Reverse osmosis is also the most favorable method of desalination in
Australia. Recent technologies such as ―energy recovery‖ which harvests the high
pressure of reject brine and reuse it again, have increased the efficiency of reverse
osmosis desalination process drastically (Geisler et al. 1998, Geisler et al. 1999).
This remarkable invention brought the level of energy consumption for RO

Chapter 1 Introduction _________________________________________________ 3
process down to almost half and below most of other desalination methods.
Today, more than 90% of under construction new desalination plants use reverse
osmosis method.
However, reverse osmosis process still consumes a considerable amount of
electrical energy. For instance, a small conventional RO device needs 8-10
kilowatt-hours of electrical energy to desalinate sea water and produce one cubic
meter of fresh water. This is still very high when compared to energy
consumption for an industry-scale desalination plant, which is around 2.5 kWh per
cubic meters of fresh water. Although it is very good progress in reducing the
required energy, the problem is yet to be fully solved. Reminding the fact that the
process of desalination is mostly required in remote places where the electricity is
not available suitably or in hot and dry regions with severe fresh water crisis,
makes any options to reduce the R ’s energy consumption of great importance.
1.2 Research Objectives
The broad aim of this research is to make the process of reverse osmosis water
desalination more environmentally sustainable. For this purpose, the reduction of
power consumption and also utilizing the final brine before being discharged to
the sea, were two major concerns. Consistent with that broad aim, the following
objectives have been set for this study.
To use solar thermal energy to reduce the specific energy
consumption of Reverse Osmosis (RO) desalination process.
To understand the impact of solar thermal pre-heating on the
performance of cross-membrane flow.

Chapter 1 Introduction _________________________________________________ 4
To utilize the reject brine for sustainable power generation.
To make reverse osmosis desalination process more
environmentally friendly, by reducing its destructive effects such as
CO2 emissions and salt disposal.
1.3 Thesis Structure
Figure 1.1 illustrates the structure of steps has been taken to achieve the objectives
which were discussed in previous section.
Figure 1.1: Thesis structure.
Background and research
objectives
Chapter 1
Literature review, identifying
the current knowledge and the
gaps
Chapter 2
Conclusions and research
directions
Chapter 5
Proposing the method to reduce
the power consumption/
presenting the theoretical model
and supporting experiments along
with results
Chapter 3
Proposing the method to utilize
the discharge brine/ presenting the
theoretical model and supporting
experiments along with results
Chapter 4

Chapter 1 Introduction _________________________________________________ 5
In chapter 2, the existing methods for reducing the power consumption of the RO
process are reviewed. Different methods are compared and the most appropriate to
be implemented by a renewable source of energy is chosen and presented. Then
the state of art for utilizing the reject brine is studied. Finally, the major
limitations of the existing methods are identified.
This review of the existing literature is then followed by employing a known
method to reduce the energy consumption of reverse osmosis desalination process
(chapter 3). In the introduced method, instead of conventional heating methods
based on using fossil fuel, solar energy has been used. Solar energy in the form of
thermal energy, pre-heats the salty stream which is to be desalinated. First, the
proposed method is presented. The chosen solar collector and the reasons for
choosing it for the proposed method are then discussed. Afterwards, the
supporting experiments and the obtained results are presented. In addition, the
characteristics of the chosen solar collector which affect the final results are
investigated. At last, based on the comparison between the behaviors of proposed
solar-assisted reverse osmosis process with a normal RO process, the feasibility of
the proposed method is discussed.
In chapter 4, the proposed method for utilizing the discharge brine is introduced.
The theoretical model to predict the amount of available power by applying this
method is presented afterwards. Then, a detailed discussion on the available
power based on different parameters is made. Afterwards, the laboratory
experiments to support the theory are presented followed by the discussions about
the results and the feasibility of implementing the method.

Chapter 2
Reverse Osmosis Desalination; A Green Process.
2.1 Introduction
This chapter reviews the methods which have been developed and used to reduce
the power consumption of Reverse Osmosis (RO) water desalination or make it
more environmentally sustainable. Different methods have different approaches
toward this goal. Some are focusing on the performance of the membrane. Today,
membranes are far more efficient than the time reverse osmosis was developed
during 50s. Some others are focusing on the chemistry of the RO process. By
changing the balance between the dissolved particles or by adding chemicals to
the seawater, the rate of fresh water production has been increased. Finally, some
other methods are mostly concentrated on reducing the required power to run the
process of reverse osmosis desalination. The latest is what the presented chapter is
mainly concerned about. In this chapter, some of the most successful methods to
address the relatively high energy consumption of RO desalination are discussed.
Since utilizing the discharge brine was also one of this research’s concerns the
important approaches to do so have been reviewed as well, and the advantages
and disadvantages of each have been discussed.
2.2 Energy Recovery Methods
At the time it was developed, reverse osmosis process was a high energy
consuming method of desalination. At that time, RO used up to 8 kWh/m3 of
electricity in large scale plants. For small scale desalination processes, the

Chapter 2 Reverse Osmosis Desalination; A Green Process ____________________ 7
required energy was much more. The reason was that the high pressure discharge
brine from the membrane was disposed back to the sea. As shown in Figure 2.1,
seawater is pumped into the desalination module with a very high pressure, up to
70 bar. The high pressure is needed to push the flow through the membrane and
produce fresh water. However, only a small proportion of feed stream (seawater)
is passing the membrane and the rest is discharged at high pressure.
Figure 2.1: RO desalination module.
The fact that the reject brine has high pressure made it a valuable waste product.
The pressure drop for the reject brine is very small and it can be again enter
another desalination module directly. By adding membranes and repeating the
same process over and over, the pressure could be used to desalinate more
seawater, with no need of pumps. Figure 2.2 shows a series of membranes in
which the reject brine from each directly enters the next one. At each stage the salt
concentration increases and the pressure slightly drops. Obviously, the rate of
fresh water production decreases at each stage. In practice, the number of
desalination modules exceeds no more than six. This is because after that point,
although the pressure is still high, the concentration of brine is too high to be
pushed through the membrane. Therefore, despite the higher rate of fresh water
production, still the brine has to be rejected with high pressure.

Chapter 2 Reverse Osmosis Desalination; A Green Process ____________________ 8
Figure 2.2: A series of desalination membranes.
First attempts to utilize the pressure of rejected brine resulted in using hydro-
turbines after desalination process. In this approach, the high pressure reject brine
rotates a hydro-turbine and generates electricity. The electricity then can be used
to run the high pressure pumps for pressurizing the feed flow. This method
reduced the power consumption by 25% (Hoeting 1982). Also other studied
showed that using a centrifugal turbine recovers 27% and using a Pelton wheel
type turbine recovers almost 38% of the reject brine’s pressure (Darwish et al.
1989). However, due to inefficiencies of the turbines and high concentration of
salt in the reject brine and corrosion problems, this method did not become very
popular.

Chapter 2 Reverse Osmosis Desalination; A Green Process ____________________ 9
Figure 2.3: RO pressure exchanger.
Other energy recovery methods were implemented in reverse osmosis desalination
process to extract and reuse the exhaust brine’s pressure. Some of these methods
were successful to do so, including the development of piston-cylinder flow-work
exchanger. The method uses a reciprocating piston-cylinder mechanism. The
cylinder is divided to two sections by the piston, which is freely slipping inside
the cylinder. High-pressure reject brine flows at one section and low-pressure RO
feed water flows at the other. Reject brine pushes the piston pressurizes the feed
flow (Darwish et al. 1989). Figure 2.3 shows the schematic view of a desalination
unit equipped with pressure recovery device. The pressure recovery device is
usually an auxiliary source to provide a part of the required pressure for pumping.
Despite of the high efficiency, low speed and low capacity were the disadvantages
of this piston-cylinder pressure exchanger. However, this was later addressed by
the invention of a centrifugal rotor-based pressure exchanger by Leif J Hauge
during 90s.

Chapter 2 Reverse Osmosis Desalination; A Green Process ___________________ 10
The centrifugal pressure exchanger was consisting of a rotor in a continuous
rotational movement. The continuous rotation of the rotor causes a periodic
replacement between high pressure and low pressure fluids. It was first
successfully tested in Persian Gulf in 1990 and was later used in a commercial
scale for the first time at Norfolk, USA. The pressure exchanger was able to
recover more than 6 % of the reject brine’s pressure (Hauge 199 ). The
centrifugal type, however, has some limitations, for instance, the flow rates of
high pressure brine and low pressure feed have to be equal when exchanging
pressure. Today, the piston-cylinder type is more popular than the centrifugal type
in large scale plants.
More studies have tried to increase the efficiency of the pressure exchanger. For
example, the switch which replaces the feed water and brine in pressure exchanger
has been developed and modified for better performance. The fluid switcher
which itself consists of an integrated rotary cylinder system could operate with
approximately 77% of efficiency (Sun et al. 2008). The invention and application
of pressure recovery unit was a very successful attempt to reduce the energy
consumption of reverse osmosis desalination process.
2.3 Reverse Osmosis Powered by Renewable Energy
Among all attempts to make reverse osmosis desalination more energy efficient,
some are based on renewable sources of energy, particularly solar energy. Solar
energy has been used either as thermal energy, being collected and used for
desalination processes mostly based on evaporation, or as electrical energy, being
generated by photovoltaic panels. Both approaches have been tested during past
decades and have showed a promising potential for low-energy desalination. The
first solar-powered reverse osmosis desalination plant was built in Middle East in

Chapter 2 Reverse Osmosis Desalination; A Green Process ___________________ 11
late 70s. The standalone system, which only used solar photovoltaic panels as the
source of power, could provide 250 people with fresh water (Boesch 1982). At
that time, other solar-powered RO desalination plants were also installed in other
places around the world, such as one small brackish water RO desalination plant
in Mexico which started to operate in 1980. Soon, solar-powered reverse osmosis
desalination plants, with different scales and capacities, were installed all around
the world (Gocht et al. 1998, Ahmad and Schmid 2002, Richards and Schäfer
2002, Amati et al. 2008)
At the same time, some RO desalination plants also started to use wind energy as
their main source of power. The annual wind speed in coastal areas is usually high
and wind energy seems to be a feasible source of energy for desalination. A 6 kW
wind-powered desalination plant was built and operated in Germany in 1980.
With a nominal wind speed of 9 m/s and rotors of 10 m diameter, the plant could
produce fresh water by an average amount of 6 cubic meters per day (Petersen et
al. 1981). The specific energy consumption of the German wind desalination plant
was 11 kWh per cubic meter of fresh water. It was very high because at that time
the pressure recovery technologies had not been developed yet. This was the
beginning to build more wind-powered reverse osmosis plant all around the
planet. For regions where conventional electrical energy is expensive if the is
great access to high wind energy, a wind-powered RO desalination plant is cost-
competitive (Forstmeier et al. 2007).
Most of the attempts to link renewable energy with reverse osmosis desalination
plant are providing the desalination plant with the required electricity. Using solar
PV panels and wind turbines are the direct methods, while power can be generated
indirectly by solar thermal energy. Solar thermal energy has greatly been used to
couple an Organic Rankine Cycle (ORC) with RO desalination process. In such a
combined process, ORC generates work using low grade temperature from a solar
collector. The work itself can be converted into electricity or directly used for
desalination. While solar thermal assisted RO desalination is still not used in
large scales and far away from being commercialized, the process shows

Chapter 2 Reverse Osmosis Desalination; A Green Process ___________________ 12
promising aspects (Kosmadakis et al. 2009, Kosmadakis et al 2010). The
advantage of combining organic Rankine cycle with desalination is that the feed
water, because of its high thermal capacity, can be used as a heat sink for the ORC
and in return, the feed water gets warmer, which improves the performance of the
RO desalination. As mentioned, the renewable energy has mostly been used to,
directly or indirectly, generate electricity. This research, on the other hand, uses
the solar thermal energy not to provide the RO desalination plant with the required
electricity but to directly pre-heat the feed water and increase its temperature. As
said before this is believed to have a considerable effect on the membrane’s
permeability.
Previous studies have shown the effect of feed temperature on the characteristics
of the RO desalination process. With higher temperatures, the permeability of
membrane increases. This means that with same power, more fresh water can be
produced and the specific energy consumption of a reverse osmosis desalination
process reduces. The temperature is proven to have a significant effect on the
recovery ratio as well (Sassi and Mujtaba 2012, She et al. 2012). Jin et al. (2008)
have studied the effect of temperature on the separation performance and fouling
for brackish water reverse osmosis membranes. Based on a model which
considers the characteristics of the solute and solvent, they have tested the fouling
and permeation properties of the membrane in 15, 25 and 35°C. Their model and
also the supporting experiments confirmed water permeability increases with
temperature. Also with higher feed water temperature, the energy consumption
reduces.
Zhao and Zou (2011) also studied the effect of working temperature on the
separation properties of forward osmosis desalination. They studied the permeate
characteristics of forward osmosis phenomenon in 25, 35 and 45°C. They found
that higher temperature would cause higher rate of water recovery and higher
initial fluxes. Sassi and Mujtaba (2013) also studied the effect of daily and
seasonal temperature on the performance of reverse osmosis desalination process.
They suggest that the number of required membrane modules in winter is more

Chapter 2 Reverse Osmosis Desalination; A Green Process ___________________ 13
than what is required in the summer, for the same amount of fresh water
production. They also found that summer operation needs less pressure and thus
has lower power consumption.
However, despite of the advantages of higher temperatures, it has only been
applied and tested in laboratory scale and is yet to be applied to real life
desalination plants. Finding a method with high amount of available thermal
energy which can be applied to larger scale plants is of great advantage. However,
there might be some minor disadvantages as well. Higher temperatures will
probably reduce the membrane’s life and its performance over the last years.
Though, the cumulative performance is still acceptable (Al-Bahri et al. 2001) and
is worth applying. This research discusses the feasibility of using a solar collector
to provide the thermal energy for pre-heating the RO feed water.
2.4 Utilizing the Reject Brine
A side product of any desalination process is a salty solution with a concentration
higher than that of the feed stream. In reverse osmosis plants, the salinity of the
output brine is usually about twice as that of the seawater, which is usually
disposed back into the sea. Although many attempts have been made to utilize the
reject brine before being disposed, high concentrated brine is still considered as a
waste product.
A novel method was introduced by Leob to utilize the reject brine by diluting it
with brackish water (Leob 1976). The method was named Pressure Retarded
Osmosis (PRO), as it is batch process and the generated power is available after a
certain period and for a limited time. Although the theories and experimental
studies are not revealing all aspects of PRO, the first pressure retarded osmosis

Chapter 2 Reverse Osmosis Desalination; A Green Process ___________________ 14
was built in 2009 in Norway and showed acceptable performance (Achilli and
Childress 2010). The power density through PRO is still relatively small and
seems to be away from large-scale commercialization. The presented research
studies the feasibility of running a continuous form of forward osmosis
phenomenon based on the pressure retarded osmosis.
2.5 Concluding Remarks and Research Gaps
Although solar energy has been used in many researches to better the performance
of reverse osmosis process, the usage of solar thermal energy for pre-heating the
feed flow has not been studied as a solution for larger scale desalination plants.
Pre-heating is proven to have a considerable effect on the performance of reverse
osmosis desalination process. Furthermore, the source of energy for pre-heating
remains a problem which needs more investigations. Therefore, finding a feasible
and practical source of solar thermal energy which can be coupled with a
desalination process seems to be of a great advantage. This study presents and
investigates a reliable source of solar thermal energy for pre-heating the feed
stream of a desalination plant. The main concern for this purpose would be the
feasibility of providing a sustainable energy source and also coupling it with the
desalination process.
Also the discharge of the reject brine is a main issue, from both economic and
environmental concerns, in any desalination plant. The high concentration of salt
has a destructive effect on the environment and also is a waste of osmotic energy.
Despite of many researches and methods to overcome these issues, not so many
are addressing them at the same time. Development of a sustainable method to
utilize the reject brine is yet to be achieved and is of great interest. From what has
been mentioned above, the research questions may be briefed as following:

Chapter 2 Reverse Osmosis Desalination; A Green Process ___________________ 15
Is it feasible to pre-heat the feed stream of desalination process by a
sustainable and reliable source of solar thermal energy?
How much improvement will be achieved by sustainably pre-heat the feed
water of desalination process?
Is it feasible to utilize the high concentrated reject brine for power
generation? What are the prospects, advantages and disadvantages?
How far can these methods go to make reverse osmosis desalination process
more environmentally sustainable?

Chapter 3
Solar-Assisted Reverse Osmosis Desalination
3.1 Introduction
In past decades, Reverse Osmosis (RO) has become the most used method for sea
water desalination. Almost two third of desalination plants around the world are
using reverse osmosis as the main method. Although reverse osmosis requires a
relatively low amount of energy, it is still not feasible in some places with serious
shortage of energy.
Reverse osmosis and its related issues are not only limited to production of big
scales of fresh water. Small RO devices are playing an important role as well. In
past few years, small RO water desalination devices were of the most used
devices all around the world, for providing households with fresh water wherever
needed. They can desalinate saline water of different salt concentrations and
produce enough drinkable water for small applications. The quality of produced
water –which is the most and somehow the only important parameter- is always
kept in an acceptable range. While the desalination device is designed to deliver
high quality water, the energy consumption and other environmental aspects of
the device are usually neglected. Today, a small commercial RO device for
seawater desalination, which is available in the market, consumes up to 10 kWh of
electrical energy to produce.
During past decades, many attempts have been made in order to reduce the energy
consumption of reverse osmosis desalination process. These attempts include
modifying the characteristics of the process, developing membrane materials with

Chapter 3 Solar-Assisted Reverse Osmosis Desalination _____________________ 17
higher efficiencies or introducing chemical reactions to ease the passage of water
through the membrane or the separation of salt from it. Renewable energy also has
a trending role in making reverse osmosis more feasible. Most of the methods
which are based on renewable energy are aiming to provide green electricity in
order to provide the RO plant with its whole or partial electricity needs. Solar
photovoltaic (PV) panels and wind turbines are of those to achieve this goal.
However, renewable energy can be used in other forms as well, to solve the cost
related and energy related issues of reverse osmosis process. The aim of this
chapter is to investigate the feasibility of using solar energy, in the form of
thermal energy, to reduce the energy consumption of RO desalination process.
Solar energy has been used to increase the saline feed water’s temperature before
the desalination process. This is believed to have a considerable effect on the
required energy to produce fresh water and also the recovery ratio and fresh water
flow rate. This chapter shows the proposed method and discussed the results and
other aspects of its application.
This chapter is continued by introducing the proposed method. The role of solar
energy in solar-assisted reverse osmosis desalination is presented and justified.
The proposed method consists of application of solar energy to reduce the power
consumption of a conventional reverse osmosis process, based on well-known
methods. After explaining the method and the arrangement of new desalination
plant, the experimental facilities and the procedures of the tests are presented.
Afterwards, the characteristics of the solar collector are studied mathematically.
Finally, the results and the feasibility of the method have been discussed.

Chapter 3 Solar-Assisted Reverse Osmosis Desalination _____________________ 18
3.2 Proposed Method: Solar-assisted RO Desalination
Solar PV Panels can be used to run the RO device off the grid and totally
independent. PV panels, as shown in Figure 3.1 charge, a battery and then the
battery directly runs the RO device. Using a battery between the PV Panels and
the RO device provides the opportunity to have a regulated and constant power
source, even when the sun radiation is fluctuating, or during night time. However,
this was not the major concern of this research. Proposed method aims to conduct
a process of RO desalination with less electricity. For this purpose, solar energy
has been used to heat up the saline feed water.
Figure 3.1: Solar-assisted reverse osmosis desalination plant.

Chapter 3 Solar-Assisted Reverse Osmosis Desalination _____________________ 19
The temperature of the feed stream has a considerable effect on the performance
of a cross-membrane process and is discussed later in this chapter. The effect of
feed water temperature on the RO process has previously been studied and is well
known. This research’s main goal is to use a renewable source of energy to pre-
heat the feed water and investigate its results and feasibilities. For this purpose,
solar pond was chosen as the renewable source of energy. Solar pond is able to
harvest the solar energy in the form of thermal energy which is of great interest to
achieve the aims of this research. It is simultaneously a solar collector and a heat
storage mechanism with a relatively high thermal capacity. High thermal capacity
allows the pre-heating to continue over longer periods of times with a continuous
performance. Another important feature of solar pond is its compatibility with a
desalination process. Solar pond, by its nature, needs salt for storing the solar heat.
The required salt for the solar pond can be provided by the desalination plant.
Some desalination plants and salt production plants have successfully been
coupled with solar pond.
As shown in Figure 3.1, the saline water is pumped through the internal heat
exchanger in the solar pond and is heated up. By controlling the characteristics of
the solar pond, the final temperature of the feed stream can be determined. The
warm water then goes to the conventional process of reverse osmosis. This pre-
heating improves the efficiency of the reverse osmosis desalination process and
reduces its energy consumption. The test procedures and outcomes are presented
in this chapter. Discussions were made as required.
In order to validate the proposed method, the performance of a cross-membrane
flow was studied independently. Following chapter shows the proposed
experiments to reveal the effects of temperature on a cross-membrane flow, in the
absence of other parameters.

Chapter 3 Solar-Assisted Reverse Osmosis Desalination _____________________ 20
3.3 Effect of Temperature on the Cross-membrane Flow
Many theories have been developed to explain the behavior of a membrane with
feed flows of different temperatures and to show the physics behind it. It is now
well known that in normal situations where the sea water is within a reasonable
range of salinities and temperatures is being desalinated by reverse osmosis
process, a warmer feed flow needs less amount of energy to be desalted. The most
prominent reason for this is that with temperature, the viscosity of the seawater
reduces. It is consistent with the reality to imagine the membrane pores as tiny
pipes for the water to flow through. One of the resistive forces during this motion
would be the friction of pores’ walls. Heating the flow and thus lowering its
viscosity causes the frictional losses to decrease and water to flows smoother
through the pores. Therefore, less energy is required to push the flow across the
membrane. Figure 3.2 shows the viscosity of seawater as a function of
temperature. As seen, temperature has a considerable effect on water’s viscosity.
Figure 3.2: Dynamic viscosity of seawater.

Chapter 3 Solar-Assisted Reverse Osmosis Desalination _____________________ 21
Sea water in different regions has different temperatures. The temperature of sea
water around Victoria, Australia is usually between 5 to 10 degrees. The dynamic
viscosity of such water can be found from the figure to be approximately around
1.4 mPa.s. By increasing its temperature to for example 45 degrees, the viscosity
drops to 0.6 mPa.s. This is a 60 percent reduction, and has a considerable effect on
reduction of the fricitional head losses. This would result in great savings in
consumed power to push the flow across the membrane.
In order to test the accuracy of this claim, an experiment has been done. The goal
of the experiment was to investigate the effect of temperature on the performance
of the RO process, in absence of other parameters. Other parameters which are
involved in the passage of water across the membrane are mostly related to the
total amount of dissolved solids inside it. Without dissolved particles, the only
involved parameters in passage of water across the membrane would be the
hydraulic characteristics of the water.
Figure 3.3: Testing the passage of distilled water through the
membrane.
When there is no interactions between the dissolved particles and the membrane,
the passage of water can be assumed to be similar to the flow of water along
pipeline, however a tiny one. Distilled water serves very well for this purpose, as
it does not generate any osmotic pressure. When there is no osmotic pressure

Chapter 3 Solar-Assisted Reverse Osmosis Desalination _____________________ 22
gradient across the membrane, the only cross-membrane force would be the
pump’s pressure which is to defy the frictional forces along the membrane pores.
In this experiment, as shown in Fig 3.3, a pump pushes distilled water through the
high salinity side of the membrane. The major proportion of water, which is
shown as rejected, comes out of the same side. However, a small proportion,
passed, passes the membrane and comes out of its other side. This flow which
comes out from the membrane’s permeate side has been measured for different
water temperatures at the inlet. To do so, the experiment started with a feed
temperature of 10 degrees. A heating element was placed in the distilled water
tank to increase the temperature. The temperature was then gradually increased to
43 degrees.
Figure 3.4: Required power to push distilled water through the
membrane.
For each temperature, the test was repeated and the power consumption and the
permeability were recorded. Recorded data for power consumption is shown in
Figure 3.4. Power consumption is obtained by measuring the voltage and the
34
36
38
40
42
44
46
48
50
5 10 15 20 25 30 35 40 45 50
Pumping Power
(W)
Temperature ( C)

Chapter 3 Solar-Assisted Reverse Osmosis Desalination _____________________ 23
current which desalination device draws from the power source, while pushing
distilled water from one side of the membrane to the other. As shown in Figure
3.4, with the raise in temperature, the total required power has reduced by almost
20 percent. As mentioned before, in this experiment other affecting parameters
were minimized by zeroing the dissolved particles in the fluid. This measurement
can be accounted for as the dependency of required power to push the flow
through the membrane to the temperature.
On the other hand, measurements showed a significant increase in the flow rate of
permeate flow. As shown in Figure 3.5, the flow rate has increased from 17.6
liters per hour at 1 C to .3 liters per hour at C.
Figure 3.5: Rate of cross-membrane passage of distilled water.
Having these results, a new parameter can be defined to give a better idea about
the effect of temperature. Energy per unit of permeate flow, is the amount of
required energy to push a certain amount of water through the membrane. As
shown in Figure 3.6, to permeate one liter of fresh water, less energy is required
14.0
16.0
18.0
20.0
22.0
24.0
26.0
28.0
0 10 20 30 40 50
Permeate Flow Rate
L/h
Temperature ( C)

Chapter 3 Solar-Assisted Reverse Osmosis Desalination _____________________ 24
when the temperature is higher. The experiment showed that there is a 40% drop
in the required Energy per Unit of Permeate Flow, when the temperature was
increase from 1 C to C.
Figure 3.6: Specific energy.
As discussed before, this experiment was designed and conducted to show the
dependency of cross-membrane flow to the temperature in a general situation.
Knowing this, the temperature was proven to have a considerable effect on the
characteristics of a reverse osmosis process, since the required energy for RO is
mostly consumed to push the flow through the membrane. In following sections,
the outcomes of a normal reverse osmosis process is presented, which has been
conducted to desalinate salty water. Recalling the main goal of this research, the
effect of pre-heating by a solar collector has been investigated. Next section
presents a summary of the experimental facilities which were used.
1.00
1.20
1.40
1.60
1.80
2.00
2.20
2.40
2.60
2.80
3.00
5 10 15 20 25 30 35 40 45 50
Specific Energy (kWh/m3)
Temperature ( C)

Chapter 3 Solar-Assisted Reverse Osmosis Desalination _____________________ 25
3.4 Experimental Facilities
After seeing the effect of temperature on passage of distilled water through the
membrane, a series of experiments were conducted to investigate the same
scenario about a normal process of reverse osmosis desalination. Some of the
main facilities to do so are mentioned below:
3.4.1 Reverse Osmosis Desalination Module
The reverse osmosis desalination device which was used for the experiments is a
small scale domestic system (12V, 9A, DC), with the ability to provide fresh
water for small applications. It consists of a suction pump, high pressure pump,
RO membrane and fresh water and brine discharges. There was no need to do any
modifications on the system as it satisfied the requirements and also main goals of
the experiments. All the piping and connections to the solar collector as well as
the gages and monitoring systems were installed outside of the system. Some of
the specifications of the device are mentioned in Table 3.1.
Table 3.1: Specifications of the RO desalination device.
Power 12 Volts, 9 Amps, DC
Membrane FILMTEC™ SW3 -2521
Recovery Ratio 4%
Water production 560 lit/day

Chapter 3 Solar-Assisted Reverse Osmosis Desalination _____________________ 26
3.4.2 Solar Pond
As discussed before, among all solar collectors, solar pond was chosen to provide
the heat for pre-heating the feed water for RO desalination process, due to its high
efficiency to serve as a solar heat storage system. Solar pond is a pool of water in
which the heat from the sun can be absorbed and stored. That is because of its
principal difference with a regular pool. In a regular pool of water (e.g. a
swimming pool), the solar radiation goes deep inside the pool and reaches its
bottom and heats up the body of water at that level. This body of water becomes
warmer and lighter than other layers inside the pool. Due to natural convection,
the warm water, which now has a lower density, moves upward. Once it reaches
the surface of the pool, all the heat will be lost. This process continuously happens
and no heat is stored inside a regular pool of water. On the other hand, solar pond
has the benefit of storing the heat by suppressing the natural convection, by
adding salt.
In solar pond, salt is added to different depths of the pond in such a way that three
different layers form, as displayed in Figure 3.7. Upper convective zone (UCZ) is
the top level on the surface of the solar pond, with a thickness of only about 15cm.
The water all around the UCZ is to be almost fresh and thus has the same density.
Therefore, different sub-layers can replace each other within the UCZ, as shown
in the picture with the circles, representing local circulations. The next level
further down in the pond is the Non-Convective Zone (NCZ). Inside the NCZ, as
we go deeper inside the pond, the concentration of salt increases gradually.
Thickness of the NCZ is about 130 cm and may vary due to the total depth of the
pond and different operating conditions. In the Non-Convective Zone, each sub-
layer is heavier (denser) than the sub-layer above it and lighter than the one
below. This prevents any vertical movement due to natural convection in the
NCZ. That is actually why the layer has been named so. At the bottom of NCZ,
the salinity is at its highest and the water is almost saturated with salt. There is
where the third layer starts. Lower Convective Zone (LCZ) is the last level sitting

Chapter 3 Solar-Assisted Reverse Osmosis Desalination _____________________ 27
at the bottom of the solar pond, with a thickness of about 60 cm. The water all
around the LCZ is almost saturated with salt and has a density of approximately
1200 kg/m3. Because of the uniform density of water all around the LCZ, water
can travel between any two points in that layer, as shown with local circulations in
the picture. This results in the whole LCZ to be in thermal equilibrium. Sub-layers
in the LCZ can easily replace by each other within the layer but cannot travel up
to the NCZ, as their density is more than that of sub-layers of NCZ.
Figure 3.7: Schematic picture of a solar pond
The formation of the solar pond produces a temperature gradient as shown in
Figure 3.7. The temperature of Upper Convective Zone is almost equal with the
ambient temperature. Inside the Non-Convective Zone, the temperature increases
gradually until it reaches a maximum at the border of the Lower Convective Zone.
From there, the temperature remains constant up to the very bottom of the pond.
Lower Convective Zone is where the heat is stored.

Chapter 3 Solar-Assisted Reverse Osmosis Desalination _____________________ 28
Solar pond is not only a solar collector but also a very practical solar heat storage
mechanism. The advantage of a solar pond is the consistency of the temperature at
its bottom. Once the solar pond is fully established, the temperature is not
sensitive to the changes of the ambient temperature. Also the heat is available at
any time of the day, all around the year. The high thermal capacity of water
provides a long lasting source of heat at the bottom of the solar pond.
Figure 3.8: Solar pond in renewable energy lab, RMIT University.
The solar pond that has been used for this research is the 55m2 pond located in the
Renewable Energy Lab (REL) at the School of Aerospace, Mechanical and

Chapter 3 Solar-Assisted Reverse Osmosis Desalination _____________________ 29
Manufacturing Engineering, RMIT University, Melbourne. The temperature at its
bottom can reach up to 80 degrees during hot seasons.
3.4.3 Heat Exchanger
In order to extract the heat from the solar pond and transfer it to the feed water, a
heat exchanger has been used. The internal heat exchanger is a long spiral pipe
which is located deep inside the solar pond on its walls, as shown in Figure 3.9.
The pipe is installed on a frame on the inner wall of the solar pond. It is made of
reinforced polyethylene and has an outer diameter of 32 mm and thickness of
3mm, with a thermal conductivity of .37 W m C.
Figure 3.9: Internal heat exchanger inside of the solar pond.
The plastic is non–corrosive and is ideal for the low-pH environment of LCZ. The
heat exchanger has a total active length of almost 560 meters, which allows a
perfect heat transfer between the LCZ and the fluid. No working fluids were used

Chapter 3 Solar-Assisted Reverse Osmosis Desalination _____________________ 30
as the medium and the saline water was directly pumped into the heat exchanger
before entering the desalination plant.
Figure 3.10: Internal heat exchanger in the solar pond at RMIT
University.
3.5 Test Procedure; Pre-heating the Feed Stream
Saline water at a constant salinity of 10,000 ppm (1% salt concentration) was
desalinated several times, each one with different temperatures. A salt
concentration of 1% is very close to that of brackish water which is a very
common source for desalination process. For this purpose, saline water was
manually produced by mixing tap water with NaCl, and was then used as the
working fluid in a closed circuit for RO desalination. Figure 3.11 shows the
procedure of the experiments. The salty water is initially stored in first storage
tank. During each experiment, the salty water is pre-heated by the solar thermal
energy through the solar pond. Water at the outlet of the heat exchanger has a
temperature of almost equal to that of Lower Convection Zone (LCZ) of the solar

Chapter 3 Solar-Assisted Reverse Osmosis Desalination _____________________ 31
pond. The salty water is then stored in a second tank in order to be naturally
cooled down to the desired temperature for each test, before being desalinated.
After the desalination module, fresh water stream and reject brine are separated.
Monitoring systems were installed to monitor the fresh water’s characteristics
such as flow rate and salinity. After the measurements and data acquisition, both
the fresh water stream and the reject brine head back to the first storage tank and
are mixed again for next series of experiments. Therefore, the total amount of
water and salt and thus the concentration of the feed fluid remains the same for all
the tests.
Figure 3. 11: Schematic procedure of the experiments.
The minimum temperature of sea water is slightly above zero. In order to simulate
that condition, second tank was stored in a big industrial refrigerator for a large
range of feed temperatures.

Chapter 3 Solar-Assisted Reverse Osmosis Desalination _____________________ 32
3.6 Results; the Effect of Pre-heating
Tests started with feed water at 4 C. Then, the temperature was increased by 1
degree for each step until 45 degrees, which is approximately the highest
temperature a normal commercial RO membrane can stand. As shown in Figure
3.11, data acquisition systems were deployed after the desalination module to
monitor the performance of the desalination process. That included measuring the
flow rate of fresh water which also results in calculation of the recovery ratio and
also checking the fresh stream’s salinity. These measurements were recorded for
further data analysis. Also, a digital multi-meter was used to monitor and record
the electrical power consumption of the desalination module for each test. The
experiments were conducted many times and showed a satisfying repeatability on
the results. In this section, the average recorded data for each parameter is
presented and discussed:
3.6.1 Power Consumption vs. Feed Temperature
A data acquisition system, consisting of a multi-meter and a recorder, was placed
after the PV Panels to monitor the power consumption while the desalination. It
was noticed that with the temperature increasing, the voltage remained fairly the
same at the nominal voltage of the RO device which was 12 V. However, the
drawn current reduced considerably. As shown in Figure 3.12, the total required
power is 8 Watts at C which is 15% less than that at C.
3.6.2 Recovery Ratio vs. Feed Temperature
Recovery ratio is the ratio of produced fresh water flow rate to that of the feed
stream. It is a very important parameter in desalination plants and depends on the
size of the plant as well as the desalination method. In a big industrial scale
reverse osmosis plants, where many membranes are connceted in series, the

Chapter 3 Solar-Assisted Reverse Osmosis Desalination _____________________ 33
recovery ratio is around 50 percent. However, in a small device using a single
membrane, recovery ratio is much lower.
Figure 3.12: Required power for reverse osmosis desalination.
Figure 3.13: Recovery ratio.

Chapter 3 Solar-Assisted Reverse Osmosis Desalination _____________________ 34
As shown in Figure 3.13, recovery ratio increases when the feed water
temperature increases. It is 5.6% at C and increases to 7. % at C. This was,
however, predictable as the viscosity of the feed fluid reduces due to high
temperature. With the reduction of the viscosity, the friction losses along the
membrane pores will reduce and the flow rate of the permeate flow through the
membrane will increase.
Figure 3.14: Specific energy.
3.6.3 Specific Energy vs. Temperature
Knowing these sets of data, again a new parameter can be defined to give a more
practical idea about the effect of temperature. By dividing the total amount of
power consumption by recovery ratio, the required energy per unit of fresh water
can be obtained. With the total amount of energy consumption decreasing and the
recovery ratio increasing, the amount of required energy to produce one cubic
meter of fresh water also decreases. As shown in Figure 3.14, the required specific

Chapter 3 Solar-Assisted Reverse Osmosis Desalination _____________________ 35
energy when the experiment began with cold water was 5.8 kWh, in order to
produce one cubic meter of fresh water. This however was reduced to
approximately 3.75 kWh at 45 C, which is a significant drop of 35%.
3.6.4 CO2 Emission
If the reverse osmosis plant is using grid as a source of electricity instead of
renewable energy, as most of the plants do, then the high cost is not the only
disadvantage. One of the destructive consequences of consuming electricity is the
production of Carbon Dioxide. As a greenhouse gas, Carbon Dioxide has a
significant effect on the global warming. Many countries have passed laws and
regulations to reduce the CO2 emissions.
The amount of CO2 production due to electricity is related to the source of
electricity and also the method with which the electricity is generated, and thus
varying in different countries. One of the major concerns of this research was to
lesser the footprint of reverse osmosis desalination and reduction of CO2 was of
great interest. Figure 3.15 shows CO2 production per cubic meter of produced
fresh water as a function of temperature based on Australia’s rate of CO2
production due to electricity consumption. As seen, the experiments showed a
reduction of 35% on the amount of CO2 production. The produced Carbon
Dioxide can be reduces by minimizing the usage of grid electricity. Running a
whole process of reverse osmosis desalination by renewable sources of electricity
zeroes the amount of emitted CO2.

Chapter 3 Solar-Assisted Reverse Osmosis Desalination _____________________ 36
Figure 3.15: CO2 emission.
3.6.5 Initiate Time of Permeation
When the desalination device starts to operate, the high pressure pump starts to
increase the pressure of salty side in the membrane. After a while, fresh water
comes out from the permeate outlet of membrane. There is always a delay from
the moment that the pressure starts to increase until fresh water comes out of the
membrane. This Initiate Time of Permeability was noticed to be changing as the
temperature increased. Figure 3.16 shows the trend with which the Initiate Time
of Permeability is dependent to the temperature, as was seen during the tests. As
seen, with cold feed water, it takes much longer to produce fresh water. When the
temperature increases, the delay time reduces.

Chapter 3 Solar-Assisted Reverse Osmosis Desalination _____________________ 37
Figure 3.16: Initiate Time of Permeability.
As seen in graphs heating the feed water from C to C has a considerable
effect on the performance of the RO device and the characteristics of the
desalination process. With the improvements in the membrane technology,
membranes can bear higher temperatures and thus the temperature of feed water
can even go higher. However, as it is shown by the experiments, the graphs seem
to be asymptotic. This means that the effect of temperature is decreasing in higher
temperatures. Therefore, if the financial aspects of the desalination process are
considered, the final feed temperature will be a matter of optimization between the
costs and feasibilities of the renewable energy source and the costs of desalination
process. If only the environmental aspects are of the importance and
consideration, higher temperatures result in lower electricity consumption and less
emission of CO2.

Chapter 3 Solar-Assisted Reverse Osmosis Desalination _____________________ 38
3.7 The Temperature Function; Optimum Flow Rate
Using the heat exchanger helps extracting the heat from the bottom of solar pond
and transfers it to the feed flow. This process of heat transfer, however, has a
limitation due to the heat transfer rate and the heat exchanger characteristics. In
this section, the amount of available heat and the maximum temperature of the
feed flow, as a function of the heat exchanger characteristics, have been studied.
The heat exchanger is supposed to deliver enough heat to the feed stream in order
to increase its temperature to the desired level. The final temperature depends on
the characteristics of the heat exchanger such as the total length and the pipe
diameter and etc. It also depends on the flow rate of the feed water. In order to
reach the temperature, the flow rate should not exceed a critical limit. If it does,
the final temperature will not be the desired one and would be lower, instead.
The following is a simplified theoretical model of the heat exchanger. Principal
laws of fluid mechanics and heat transfer have been used to obtain a relationship
between the flow rate, the desired temperature, and the length and other
characteristics of the heat exchanger. In the presented model, the conduction is
considered as the only way of heat transfer. The effect of convection is small and
thus neglected. This is because the heat exchanger is placed at the bottom of the
solar pond in the LCZ region, where the temperature is uniform and the thermal
capacity is very high. Therefore, convectional streams are very small and can be
neglected.
The heat exchanger is a circular pipe with a total length (L) of 560m and outer
diameter (OD) of 32mm and thickness (b) of 3mm.

Chapter 3 Solar-Assisted Reverse Osmosis Desalination _____________________ 39
Figure 3.17: Heat exchanger’s tube.
Figure 3.18: The control mass.
A control mass has been chosen along the feed stream as shown in Figure 3.18a.
The control mass has a mass of dm and length of dl. The outer area of the control

Chapter 3 Solar-Assisted Reverse Osmosis Desalination _____________________ 40
mass is also dA. Equation 3.1 shows the heat flux (Q) between the solar pond and
the feed stream through the heat exchanger.
(3.1)
Where k is the thermal conductivity and is .37 W m C for plastic tubes, A is the
practical area through which, the heat is being conducted (m2), b is the thickness
of the pipe (m), and ΔT is the difference between the temperature (K) of the feed
stream and that of the solar pond. In this equation, Q is flux thus is the amount of
transferred heat in time unit. To find the total amount of heat, the factor t as the
duration of the process can be added to the equation:
(3.2)
Rewriting the above equation in the differential form, following is the heat flux
between the solar pond and the control mass in Figure 3.18:
(3.3)
On the other hand, the relationship between the total amount of heat transferred to
a fluid and the raise in temperature can be found as:
(3.4)
In which, m is the total mass of the fluid (kg), C is the specific heat (J/kg.K) and
ΔT is the total raise in fluid’s temperature (K). To apply it to the control mass, the
differential form will be used:

Chapter 3 Solar-Assisted Reverse Osmosis Desalination _____________________ 41
(3.5)
Combining the equations (3.3) and (3.5), we have:
(3.6)
From the Figure 3.18, dA and dm can be rewritten as following:
(3.7)
And,
(3.8)
Substituting above in Equation 3.6:
(
) (3.9)
This after simplification becomes:
(
) (3.10)

Chapter 3 Solar-Assisted Reverse Osmosis Desalination _____________________ 42
Where, ΔT is the total raise in temperature during the control mass flowing inside
the heat exchanger (K). Assuming the initial temperature of the feed stream to be
T0 and the final temperature to be T (both in Kelvins), the equation becomes:
(3.10)
Integrating from both side of the equation:
∫
∫
(3.11)
∫
∫
(3.12)
(3.13)
In which, t is the duration of the control mass flowing inside the heat exchanger
(duration of heating process) and T is the final temperature of the control mass at
the outlet. Following equation shows t:
⁄ (3.14)
Where L is the total length of the heat exchanger and v is the velocity of the
control mass. Velocity can be found as following:
⁄ (3.15)

Chapter 3 Solar-Assisted Reverse Osmosis Desalination _____________________ 43
Where, is the flow rate and a is the cross section are of the pipe which is equal
to πD2/4. Therefore, the duration of heating process, t, would be:
(3.16)
Substituting equation (3.16) in equation (3.13) gives the final relationship between
the outlet temperature and the flow rate of the feed stream:
(
)
(3.17)
Or:
V
(3.18)
Equation 3.18 gives the final temperature of the feed stream as a function of the
internal heat exchanger. As seen, with higher flow rates, the final temperature
would be lower. This is because of simple fact that the total thermal energy which
is stored in the solar pond is constant and limited, and so is the transferred heat.
Therefore, if the goal is to reach above a certain temperature, there should be a
limit on the amount of flow rate. Any flow rates above that will be too high and
the final temperature will not reach the desired level. Equation 3.19 shows the
flow rate as a function of other parameters.
(3.19)

Chapter 3 Solar-Assisted Reverse Osmosis Desalination _____________________ 44
This equation can be used to find the maximum allowed flow rate, if T is set to the
desired temperature.
This section gave an idea about the size of the heat exchanger according to the
desalination unit’s size and the amount of fresh water which is to be produced.
3.8 Summary
This chapter was aiming to increase the efficiency of the reverse osmosis process
by reducing the total amount of required power to desalinate saline water and
produce one cubic meter of fresh water. This was achieved by heating the feed
saline water before entering the desalination plant. The feed stream temperature
was believed to have a considerable effect on the process of desalination, reducing
the amount of required power. It was later proved by proposed experiments.
As the temperature increases, the viscosity of the fluid reduces. With a lower
viscosity, a fluid needs less energy to flow in a pipe or through tiny pores, as in
the membrane. To prove this, an experiment was designed to study the passage of
water through the membrane in the absence of other parameters. In any
membrane-based process, osmotic pressure plays an important role. Therefore,
distilled water was used to minimize such effects. Distilled water was then
pumped into a membrane. In this case, the pumping pressure was used to push the
water through the membrane to the other side. Experiments showed that
temperature has a considerable effect on the rate of cross-membrane water
passage. In higher temperatures, the flow rate of distilled water passing the
membrane increased and the pumping energy to do so was decreased. This proved
that in the absence of other parameters, water with higher temperature passes the
membrane easier. Knowing that, as the major part of this research, it was desired

Chapter 3 Solar-Assisted Reverse Osmosis Desalination _____________________ 45
to increase the temperature of saline water before the process of reverse osmosis
desalination so that the required power for such process reduces.
To achieve that, solar pond was used to collect and store solar radiation in the
form of heat. Because of its high thermal capacity, solar pond can store big
amount of thermal energy. Solar pond was placed before the desalination unit, in
the reverse osmosis desalination plant. The heat from the solar pond was then
transferred to the saline feed stream using an internal heat exchanger. The saline
water with different temperatures was pumped into the desalination unit,
afterwards. Experiments showed that higher temperature results in higher flow
rates of produced fresh water and also less required power per its volume unit. For
instance, the specific energy consumption reduced by a considerable amount of
35%, when the temperature was increased from C to C.
The experiments were repeated so that the obtained results become validated and
repeatable. All the tables and graphs showing the results of experiments both for
cross-membrane distilled water and reverse osmosis desalination process are
presented and discussed.

Chapter 4
Osmotic Power: Utilizing the Reject Brine
4.1 Introduction
High concentration saline stream is, as well as the fresh water, one of the major
products of a reverse osmosis desalination plant. Disposing this high
concentration brine is an environmental and economic challenge. Re-injection to
the desalination system, re-injection into aquifer and disposing into evaporation
ponds are currently some methods which are being used. However, these methods
are not suitable for big-scale desalination plants where the flow rate of discharged
brine is very high. While sometimes used for some industrial applications such as
production of salt or cooling, the high concentrated brine is usually disposed back
to the sea as a reject product. Although not being feasible all the time, utilizing the
discharged brine before rejection has always been a major concern.
Ahmed et al. (2003), discussed some methods of post-treatment to get salt from
the brine. The methods are mostly using the brine in a series of cooling vessels,
solar evaporation ponds and crystallizer ponds to give different types of salts as
the result. Collares Pereira et al. (2007) show the designing parameters of a solar
dryer for salt recovery from a Multiple-effect distillation (MED) plant. Tanaka et
al. (2003) discussed an advanced method in which the discharge brine from a
reverse osmosis desalination plant is introduced to ion-exchange membrane
electro-dialysis (ED) salt production plant. Salt production methods based on
electro-dialysis (ED) seem to be feasible because the discharged brine is richer
with electrolyte compared to normal seawater. Also a hybrid process Reverse

Chapter 4 Osmotic Power: Utilizing the Reject Brine ________________________ 47
Electro Dialysis (RED) and reverse osmosis can be used as a desalination and
power generation plant. RED can be used to utilize to solutions of very high
salinity difference to generate electricity. After this process, the high salinity fluid
will have a lower salinity and can be re-injected into the reverse osmosis
desalination plant (Li et al. 2013). According to Ahmed et al. (2001), the process
of desalination can be considered a far more important method than just that to get
fresh water from. Further treating of salt by-products can result in multiple uses of
evaporation ponds, using bitterns to generate electricity from solar ponds, and
prospects for resource recovery from bitterns. According to Farahbod et al.
(2013), solar evaporation ponds can be used as an inline stage after the
desalination plant to increase the concentration of salt and ease the process of
crystallization, with a high efficiency during hot and dry seasons.
Other methods consisting of dilution of high concentrated brine which generates
low gradient heat and combing a multi-stage distillation (MED) desalination with
Mechanical Vapor Compression (MVC) are also considerable, as they utilize the
saline stream before being disposed to the sea and may also result in having a zero
discharge desalination plant (Nadav and Ophir 1982, Fernández-López et al.
2009).
Many of these methods need special facilities and depending on the size and the
location of the desalination plant might or might not be feasible. Current research
aims to propose a method which is able to be coupled with desalination plants
with any size and any salinities of discharged brine. The salinity of the discharged
brine depends on the salinity of the feed water and the size of the reverse osmosis
desalination plant. However, most of the big Sea Water Reverse Osmosis
(SWRO) plants reject the brine with approximately 5-7% concentration of salt.
This is twice as the salt concentration of sea water. Water at this high rate of
concentration has destructive effects on the sea life and coastal ecosystem.
Because of these negative effects, the reject brine is usually dumped far away
from the shore. Long pipelines are used to carry the reject brine, several hundred
meters further down into the ocean. For instance, Victorian desalination plant

Chapter 4 Osmotic Power: Utilizing the Reject Brine ________________________ 48
produces 450,000 m3 of fresh water at maximum capacity and approximately
disposes the same amount of high concentrated brine, more than one kilometer
away from the shore. This however does not totally solve the environmental
problems but reduces their prominence. Furthermore, piping in such scale deep
inside the ocean and its maintenance processes are not economically and
logistically feasible all the time.
The main goal of this research is to utilize the reject brine before disposing it into
the sea, by diluting it and harvesting its energy. The research aims to reduce the
environmental footprint of the high concentrated brine stream and also to utilize
its latent osmotic energy. A method is introduced to generate energy and also to
reduce the salt concentration of reject brine, thus its negative environmental
effects. The method is based on the natural phenomenon of forward osmosis, and
results in generating power and also diluting the brine. After introducing the
proposed method, the physics of the process of forward osmosis and the theories
behind the method are discussed. The theories show the expected amount of
power generation and also discuss the final concentration of salt in the reject
brine. Then the proposed experiments to support the theory are presented. The
experimental facilities and the procedure of the experiments and also the variables
of the experiments are explained afterwards. Finally, the results of the
experiments including the actual power generation are presented. At last, the
results and the possible reasons of any deviations from the theory are discussed.
Further discussions are made about the feasibility of applying the proposed
method in a real-time scale and also possible ways of improving the method.
4.2 Forward Osmosis
When two fluids with different concentrations of dissolved particles sit beside
each other with a semi-permeable membrane in between, a natural phenomenon

Chapter 4 Osmotic Power: Utilizing the Reject Brine ________________________ 49
occurs in which the flow with lower concentration tends to enter the higher
concentration fluid, through the membrane. This process, which occurs naturally,
is called Forward Osmosis. A semi-permeable membrane is a porous media with a
feature of selective passing. It only lets certain types of materials to pass and stops
the rest. For instance, a seawater forward osmosis membrane –the same as a
reverse osmosis membrane- in the most ideal case only lets the pure water pass
and stops the dissolved particles including salt. The most natural forward osmosis
happens inside human’s body where in kidney the water and the salt and other
minerals need to be maintained in a balance. Currently, most of the commercial
semi-permeable membranes are made of either cellulose acetate or polyamide.
When the concentration of dissolved particles is different at two sides of the
membrane, a cross-membrane pressure appears. This pressure is called osmotic
pressure and tends to push the low concentrated fluid toward the high
concentrated side. Osmotic pressure is a function of the concentration gradient
across the membrane. Greater difference in the concentration of two sides results
in higher osmotic pressure. The dissolved particles are any organic and inorganic
substances within a solution. In sea water, salt is a major dissolved particle and is
its most important impurity in the process of producing fresh water. Current
research focuses on Forward Osmosis (FO) process of sea water. Therefore, to
simplify the physics of the problem, salt is assumed the only considerable
dissolved particle in sea water.

Chapter 4 Osmotic Power: Utilizing the Reject Brine ________________________ 50
Figure 4.1: Different stages of a forward osmosis process.
If two salty solutions at the atmospheric pressure sit at two sides of a membrane,
osmotic pressure appears (Figure 4.1a). The osmotic pressure causes a flow from
the less salty side to the saltier side (Figure 4.1b). Because of the membrane’s
feature of selective passing, only the pure water passes the membrane and salt
molecules are stopped from going to the other side. Fresh water passes the
membrane and increases the level of saltier solution (Figure 4.1c). If fresh water is
provided continuously, the level of salty water will increase continuously.
Meanwhile, the passage of fresh water and mixing with the higher salinity
solution will dilute it and reduce its salinity. Therefore, the salinity gradient across
the membrane will reduce and so will the osmotic pressure. On the other hand, as

Chapter 4 Osmotic Power: Utilizing the Reject Brine ________________________ 51
the level of salty water increases, the hydrostatic pressure of the water column
will also increase. This is a resisting pressure against the passage of fresh water.
The process of forward osmosis will continue to the point when the osmotic
pressure (which is now reduced due to dilution) is equal to the difference of
hydrostatics of two columns. At this point, the fresh water flow stops (Figure
4.1d).
Forward osmosis has been used in a very big range of application such as
industrial wastewater treatment, food industry, seawater desalination, water
filtration, and also medical operations related to drug injection to the human body
(Petrotos and Lazarides 2001; Jiao et al. 2004; Kravath and Davis 1975). One of
the most important applications of forward osmosis is Pressure-Retarded Osmosis
(PRT), where the hydrostatic pressure of salty water column is used to generate
power. The available pressure of a PRT process when the solutions are sea water
and fresh water, is 11 to 15 bar (Loeb 1976; Loeb 2002; Aaberg 2003; Jellinek
and Masuda 1981).
4.3 Proposed Method: Harvesting the Osmotic Power
This research proposes using a forward osmosis module after a Reverse Osmosis
(RO) desalination process to generate power. The proposed method is based on
using the high concentrated saline stream to run one or a series of Forward
Osmosis (FO) processes. Reject brine is used in one side of the membrane with
the sea water on the other side to generate the salinity gradient and thus the
osmotic phenomenon. The difference between the salt concentration in sea water
and the reject brine results in the appearance of the osmotic pressure and the
cross-membrane flow. The higher the salinity difference is the more osmotic
pressure will be generated. Although fresh water makes a higher salinity
difference with reject brine, it is not available in most of the areas with

Chapter 4 Osmotic Power: Utilizing the Reject Brine ________________________ 52
desalination plants and though not feasible to be used. Sea water has been chosen
because of its availability near any desalination plant. The salinity of the reject
brine in a Sea Water Reverse Osmosis (SWRO) plant is approximately 6% while
the salinity of the sea water is only 3%. A stream of 6% salt concentration has an
osmotic pressure difference of about 20 bars compared to a stream of 3%, which
can be harvested using this method.
A schematic view of the proposed method is shown in Figure 4.2. As seen, the
waste product of the reverse osmosis desalination device is the feed for the
forward osmosis device. A semi-permeable membrane is used as the FO module
to generate the osmotic pressure. Sea water, as low concentrated fluid, is flowing
in one side and the discharge brine, from the RO device, is flowing on the other
side as high concentrated fluid.
Figure 4.2: Schematic picture of a FO plant coupled with RO plant.
As two fluids with different salinities pass along the membrane, osmotic pressure
gradient occurs. If the osmotic pressure is greater than difference in two side’s
hydrostatic pressure, a driving force appears which tends to push the low salinity
fluid into the high salinity fluid. The amount of low salinity fluid which passes the
membrane is added to the high salinity stream and increases the flow rate of the

Chapter 4 Osmotic Power: Utilizing the Reject Brine ________________________ 53
saline side of the membrane. If the saline flow is already pressurized, by
increasing the flow rate the stream will deliver an extra power at the outlet of the
membrane. This Osmotic Power is a function of the cross-membrane flow and the
static pressure of the high concentrated side in the membrane. The theory of this
phenomenon is discussed in next section.
4.4 Theory of Osmotic Power
The Osmotic Power is the power which is delivered by the high salinity fluid at
the outlet of the membrane due to the raise in its flow rate. When the high salinity
flow enters the membrane it has a power of P which is equal to the fluid’s
pressure, p, multiplied by its flow rate, . Inside the membrane, the low salinity
fluid will cross the membrane because of pressure gradient across the membrane,
and is added to the high salinity fluid, as shown in Figure 4.3. This increases the
flow rate inside the high salinity side of the membrane. Therefore, the high
salinity fluid, when coming out of the membrane, has a higher flow rate than
when going in. That extra flow rate results in the delivery of an extra power.
Figure 4.3: Schematic picture of a forward osmosis process.

Chapter 4 Osmotic Power: Utilizing the Reject Brine ________________________ 54
The power of the high salinity flow that enters the membrane can be found as:
(4.1)
Where, p1 is the gage pressure (Pa) and 1 is the flow rate of the high salinity flow
(m3/s), both at the inlet. During the time the salty flow is passing the membrane, a
proportion of the fresh water from the low salinity side will be added to it due to
forward osmosis phenomenon. Therefore, the flow rate will be increased at the
outlet of the membrane, as following:
(4.2)
Where, fresh is the total amount fresh water from the low salinity side, passing the
membrane and entering the saline side (m3/s). The delivered power at the outlet
would be:
(4.3)
If neglecting the pressure drop of high salinity flow along the membrane, the
pressure at the outlet would be the same as the inlet.
(4.3)
And the delivered power at the outlet would be:
(4.4)

Chapter 4 Osmotic Power: Utilizing the Reject Brine ________________________ 55
Therefore, the total generated Osmotic Power which is the difference of delivered
power at the outlet and at the inlet would be:
(4.5)
(4.6)
( ) (4.7)
(4.8)
fresh is the flow rate of permeate flow from the low salinity to high
salinity side. This cross-membrane permeate flow is a function of the pressure
gradient across the membrane as well as the membrane’s characteristics. The
complicated physical and chemical characteristics of the membrane can be
simplified to an acceptable point where the only involved parameters in the
permeate flow rate are the pressure gradient and the permeability of the
membrane. Permeability, K, is a parameter which shows the ability of low salinity
to pass the membrane. Based on the manufacturer’s claim the permeability of the
membrane which was used in the experiment is 1.25 lit/m2.h.bar, which was later
verified by experiments.
Knowing the permeability of the membrane, the permeate flow rate can be found
from the following simplified equation:
(4.9)
Where, A is the effective area of the membrane, π is the osmotic pressure gradient
and Δp is the static pressure gradient across the membrane. The effective area of

Chapter 4 Osmotic Power: Utilizing the Reject Brine ________________________ 56
the membrane is 1.2 m2.
Because the low salinity side is exposed to the
atmosphere, its gage pressure is zero and therefore delta p becomes equal to the
static pressure of the high salinity flow. This pressure is generated by the high
salinity flow pump, as shown in Figure 4.3, and can be adjusted by the valve
located after the membrane. Therefore:
(4.10)
(4.11)
As mentioned before, π, is the osmotic pressure gradient across the membrane and
is a function of the salinity difference. To find the osmotic pressure corresponding
different salinity gradients for our experimental membrane, a simple experiment
was conducted. In that experiment, a system was set up as shown in Figure 4.4.
The high salinity side of the membrane was filled with NaCl solution of different
concentrations and the low salinity side was connected to a small fresh water tank
to provide it continuously with fresh water. A valve was placed at the outlet of the
high salinity side to seal the system and a pressure gage was installed before the
valve for monitoring the pressure rise.

Chapter 4 Osmotic Power: Utilizing the Reject Brine ________________________ 57
Figure 4.4: Experiment to find corresponding osmotic pressure for
different salinities.
If the valve is closed, the fresh water passing the membrane will increase the
pressure of the salty solution. Because of the water’s very small compressibility,
even small passage of fresh water results in the pressure to increase considerably.
This process continues until the static pressure of the salty side becomes equal to
the osmotic pressure gradient. From this point, fresh water will not pass the
membrane and the system reaches a steady state. The pressure which is shown by
the gage at this point is equal to the osmotic pressure difference between the
tested solutions. The test was conducted for different salinity gradients at C
C and 3 C and the osmotic pressure corresponding to each salinity gradient was
recorded. Figure 4.5 shows the recorded osmotic pressures for each salinity
difference.

Chapter 4 Osmotic Power: Utilizing the Reject Brine ________________________ 58
Figure 4.5: Different salinities and corresponding osmotic pressures in
different temperatures.
As shown in the Figure 4.5, osmotic pressure, regardless of the temperature of the
permeate flow, has fairly a linear relationship with the salinity. Therefore,
following equations were used for the osmotic pressure:
At C:
(4.12a)
At C:
(4.12b)
0
5
10
15
20
25
30
0 5000 10000 15000 20000 25000 30000 35000
Osm
oti
c P
ress
ure
(b
ar)
Salinity Difference (ppm)
5 deg
20 deg
35 deg

Chapter 4 Osmotic Power: Utilizing the Reject Brine ________________________ 59
At 3 C:
(4.14c)
These relationships help us to calculate the osmotic pressure at different salinity
gradients. Using Equations 4.11 and 4.14, the flow rate of fresh water across the
membrane can be calculated as a function of the salinity gradient and the static
pressure of the high salinity side, as following:
At C:
(4.15a)
At C:
(4.15b)
At 3 C:
(4.15c)
Figure 4.6 contains the diagrams showing the flow rate of fresh water at different
temperature with different salinity gradients. The horizontal axis is the static
pressure of the high salinity side and the vertical axis is the flow rate of the
permeate flow. Each red line stands for one salinity gradient. Numbers on the red
lines in first diagrams show the corresponding salinity differences for each line. In
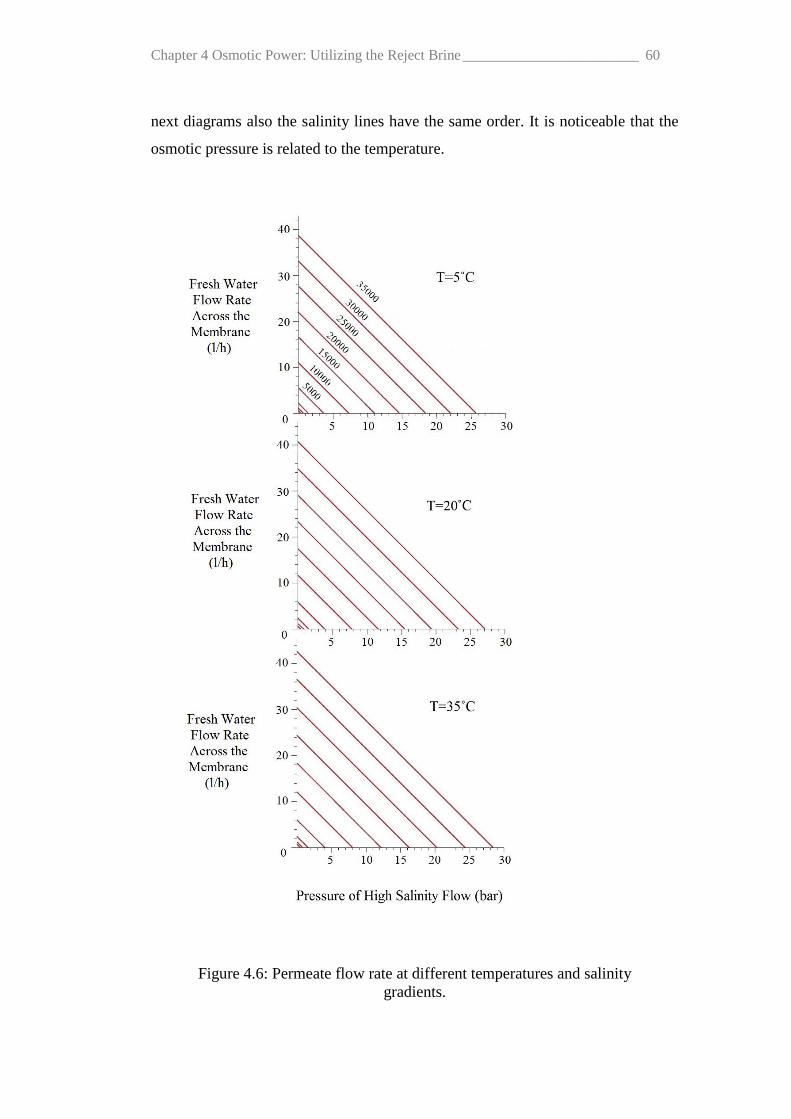
Chapter 4 Osmotic Power: Utilizing the Reject Brine ________________________ 60
next diagrams also the salinity lines have the same order. It is noticeable that the
osmotic pressure is related to the temperature.
Figure 4.6: Permeate flow rate at different temperatures and salinity
gradients.

Chapter 4 Osmotic Power: Utilizing the Reject Brine ________________________ 61
Figure 4.7: Comparison between the permeate rates in two different
temperatures.
Figure 4.7 shows a comparison between osmotic pressure in C and 3 C.
Salinity lines have the same order as that of Figure 4.6. In order to find the
Osmotic Power as a function of the salinity gradient, Equation 4.15 is substituted
in Equation 4.8:
At C:
(4.16a)

Chapter 4 Osmotic Power: Utilizing the Reject Brine ________________________ 62
At C:
(4.16b)
At 3 C:
(4.16c)
As the equation shows, Osmotic Power is a second order function of the high
salinity flow pressure, and also a function of the salinity gradient. Figure 4.8
shows the available osmotic power with different salinity gradients for C:
Figure 4.8: smotic ower for different salinities in C.

Chapter 4 Osmotic Power: Utilizing the Reject Brine ________________________ 63
Figure 4.9: smotic ower at C and 3 C.
The horizontal axis is the static pressure of the salty side of the membrane. The
vertical axis is the theoretical available Osmotic Power. The numbers on the lines
represent the salinity differences. As seen, the curves get bigger and shift to the
right with the raise in the salinity difference. It means that the available Osmotic
Power increase with higher salinity differences. However, to reach the maximum,
higher pressure is required in the high salinity side of the membrane. Also it is

Chapter 4 Osmotic Power: Utilizing the Reject Brine ________________________ 64
noticeable that with the same pressure of the membrane’s salty side higher
salinity difference results in greater Osmotic Power. Due to the dependency of
osmotic pressure to the temperature, the Osmotic Power is also dependent to the
temperature. Figure 4.9 shows the curves of Osmotic Power for different salinities
and different pressures of high salinity stream at 2 C and 3 C respectively.
As seen, the behavior of the curves is generally the same. However, there is a shift
due to the change in temperature. The Figure 4.10 shows a comparison between
the available smotic ower in C and 3 C. The salinity lines are in the same
order as before.
Figure 4.10: Comparison between the available Osmotic Power in two
different temperatures.

Chapter 4 Osmotic Power: Utilizing the Reject Brine ________________________ 65
As the temperature increases, the salinity lines move to the right side and the
peaks are rising which means with the same salinity difference there is more
Osmotic Power available. However, it requires more pressure at the salty side to
reach the peak. It is also noticeable that with the same pressure of high salinity
flow, the available Osmotic Power is greater when the temperature is higher.
4.5 Maximum Osmotic Power
As discussed in previous section, each salinity gradient has a different potential in
generating the osmotic power, depending on the static pressure of the saline side.
The salinity based Osmotic Power curves are quadratic functions with a maximum
point. This maximum point is the maximum available corresponding Osmotic
Power for a desired salinity difference. To find the maximum available Osmotic
Power, the equation of the power curves is considered again:
(4.17)
Where, P is the available Osmotic Power and p is the static pressure of the salty
side. As discussed in the previous section, the equation can be extended as
following:
(4.18)
Maximum point of the curve can be found by finding the derivative of P curves
with respect to the variable p.

Chapter 4 Osmotic Power: Utilizing the Reject Brine ________________________ 66
(4.19)
(4.20)
The point which zeros this equation will be the maximum point.
It shows that the maximum Osmotic Power is available when the static pressure at
the salty side of the membrane is half of the osmotic pressure difference across the
membrane. By substituting the above in the Equation 4.18, the amount of
available Osmotic Power will be found as following:
(4.21)
It is noticeable that the maximum point is also shifting on a quadratic line which is
only a function of the salinity difference. After the values for permeability and are
of the membrane are substituted in the equation, the maximum Osmotic Power
can be found as a function of the static pressure of the salty side.
Figure 4.11 shows the maximum Osmotic ower curve for 3 C. The units are
changed so that the output power is in Watts. By substituting the relationship
between salinities and osmotic powers, the maximum Osmotic Power equation
can be found as function of the salinity difference, as shown in Figure 4.12.

Chapter 4 Osmotic Power: Utilizing the Reject Brine ________________________ 67
Figure 4. 11: Maximum smotic ower at 3 C.
Figure 4.12: Maximum smotic ower at 3 C by salinity.

Chapter 4 Osmotic Power: Utilizing the Reject Brine ________________________ 68
4.6 Experimental Facilities
In following section, the experimental facilities and the devices which have been
used to validate the theory is presented. All the experiments were conducted in
Renewable Energy Lab (REL), at RMIT University.
4.6.1 Membrane
The membrane which was used for the experiment was a commercial spiral
wound polyamide thin-film RO membrane, as shown in Figure 4.13. The
characteristics of the membrane are brought in Table 4.1.
Figure 4.13: The commercial RO membrane.

Chapter 4 Osmotic Power: Utilizing the Reject Brine ________________________ 69
Figure 4.14: Schematic view of the membrane.
Table 4.1: Characteristics of the membrane.
Brand FILMTEC
Model SW30-2521
Membrane Type Polyamide Thin-Film Composite
Total Length 533 mm
Total Diameter 61 mm
Permeate Pipe Diameter 19 mm
Active Area 1.2 m2
Recovery Ratio (SWRO) 4%
Salt Rejection 99.4%
Permeability 1.25 lit/h.m2.bar
Maximum Operating Press. 69 bar
Maximum Pressure Drop 1.0 bar

Chapter 4 Osmotic Power: Utilizing the Reject Brine ________________________ 70
4.6.2 Fittings/Caps
In order to perform the suitable experiments to observe and study the Osmotic
Power, two caps were designed and manufactured to be placed on each side of the
membrane. A normal commercial reverse osmosis membrane, as shown in Figure
4.15 and Figure 4.16, was designed with a pipe at the center which is for the low
salinity flow and some holes around it which all go through the membrane layers,
as the high salinity flow inlet and outlet. This geometry obviously was not suitable
for a single inlet single outlet streams.
Figure 4.15: A commercial membrane.
A fitting (cap) had to be designed to form only one inlet and outlet at each side of
the membrane. During the process of manufacturing the caps, accuracy of the
dimensions was of a great importance. The clearances and all the O-rings where
designed in such a way that the membrane is sealed even under high pressures.
Any leakage would disrupt the results of the tests.

Chapter 4 Osmotic Power: Utilizing the Reject Brine ________________________ 71
Figure 4.16: Schematic view of fresh water and salty water inlets on a
commercial reverse osmosis membrane.
Another aspect which was important beside the pressure was the highly saline
environment. The caps should bear the effects of very salty stream for a long
period of time. Finally, stainless steel was chosen as the material because of its
resistance against high pressure and also against corrosion.
Figure 4.17: Isometric view of the cap.

Chapter 4 Osmotic Power: Utilizing the Reject Brine ________________________ 72
Figure 4.18: Front view of the cap.
Figure 4.19: Cross-sheared view of the cap.

Chapter 4 Osmotic Power: Utilizing the Reject Brine ________________________ 73
Figure 4.20: Schematic plan of the cap for manufacturing process.

Chapter 4 Osmotic Power: Utilizing the Reject Brine ________________________ 74
After manufacturing the caps, they had to be well adjusted on the membrane’s
sides in such a way that no leakage occur during the tests. To achieve that goal,
suitable O-rings were made in the RMIT University’s workshop to feel the
clearance between the membrane and the caps. Figure 4.21 shows the final
assembly of the membrane.
Figure 4.21: Membrane and the caps installed on both sides.
4.6.3 Pumps
As shown in Figure 4.22, two pumps have been used for the experiment. The low
salinity flow pump is a small (12V, 2A) DC pump only to circulate the low
salinity solution in the system. The low salinity tank is exposed to the air and has
an atmospheric pressure, both at the inlet and at the outlet.

Chapter 4 Osmotic Power: Utilizing the Reject Brine ________________________ 75
During the initial experiments, the low salinity pump was not being used and the
low salinity side of the membrane was connected to the fresh water tank with
circulations in the system. However, it was observed that air bubbles were coming
out of the membrane to the surface of fresh water in the tank. It was then decided
to circulate the fresh water to prevent any air blockage inside the system which
may affect the performance of the membrane. After the fresh water pump was
installed, no air bubbles were observed.
The high salinity pump is a bigger, 5 bar, stainless steel pump. The pump has to
generate high pressure in the high salinity flow. Because of the highly saline flow
in the pump, it has to be stainless steel to prevent any damage due to corrosion.
The pumps were set to flushing regularly to remove the salt from them.
4.7 Experiment Procedure
At the beginning, all the valves are open and both the pumps start to run. This is to
flush all the air bubbles from the surface of the membrane and remove the
particles which are stuck in the membrane and may affect the process. After a few
minutes, the valve at the outlet of the membrane’s salty stream will be closed, in
order to trap the flow inside the membrane. This causes the pressure of the salty
side to increase. The system is not very sensitive to the high salinity stream valve.
Thus, it takes a few minutes for the salty flow to reach steady state and the
pressure to stop at a certain level. Therefore, the valve has to be closed slowly
until the flow rate is set to the desired level. During the experiment, the pressure
is known and is set to a constant level. Also, the level of fresh water in the tank is
observed. Any drop in the level is the amount of fresh water which passes the
membrane and enters the salty stream. This added flow has been appeared as an
excess power at the outlet of the membrane, which is the delivered smotic

Chapter 4 Osmotic Power: Utilizing the Reject Brine ________________________ 76
ower. The experiments were conducted for both 1 and ppm
salinities at C.
Figure 4.22: Proposed experiment to harvest the Osmotic Power.
4.8 Results
The experimental results satisfied the research goals very well in terms of
producing Osmotic Power. The results also showed a reasonable correspondence
with the theory in terms of dependency to the involved parameters such as the
salinity and the salty side pressure. However, the amount of generated Osmotic
Power was much lower than predicted. During the experiments, the limitation was
the pumping pressure on the salty side which was supposed to be provided by
pump 1, as shown in Figure 4.22. The maximum available pressure from the salty
pump was 5 bar and it was not possible to pressurize the salty side beyond that
limit. This limited us in covering the whole range of available osmotic pressure.
Figure 4.23 shows the test results for the salinity gradient of 10,000 ppm across
the membrane.

Chapter 4 Osmotic Power: Utilizing the Reject Brine ________________________ 77
Figure 4.23: Osmotic pressure for 10,000 ppm.
The black line is the theoretical line which was explained in section 4.4, and the
red dots are the experimental data points. When the salty side was pressurized, the
osmotic power started to be generated. As seen, the experimental generated
osmotic power has the same trend as that of the theoretical prediction; however,
the magnitude is much lower.
Figure 4.24: Density of osmotic power for 10,000 ppm.
0.0
20.0
40.0
60.0
80.0
100.0
120.0
0 1 2 3 4 5
Density of Osmotic Power
(mW/m2)
Pressure of Saline Side (bar)

Chapter 4 Osmotic Power: Utilizing the Reject Brine ________________________ 78
There are different reasons for having lower osmotic power in practice. The most
important one is the simplifying assumptions which were made during the
development of theoretical model. For instance, while using reverse osmosis
membranes to perform forward osmotic process, the characteristics of a reverse
osmosis membrane were assumed to be the same as those of a forward osmosis
membrane. While reverse osmosis membranes are designed to be perfectly
suitable for reverse osmosis desalination, they are not performing as well in the
forward osmosis process. This is believed to be the most significant source of
divergence between the theory and the experiments. Also, the effects of fouling
and aeration have been neglected, although tried to be remained small. It is
believed that in a more ideal condition, the osmotic power which is predicted by
the theory can be achieved.
Figure 4. 25: Osmotic pressure for 50,000 ppm.

Chapter 4 Osmotic Power: Utilizing the Reject Brine ________________________ 79
One of the key parameters affecting the amount of generated power is the surface
area of the membrane. Power density can be calculated from the produced power
divided by the active area of the membrane. Figure 4.24 shows the density of
osmotic power for 1 ’ ppm salinity gradient.
The test was repeated for a salinity gradient of 50,000 ppm across the membrane.
The test results and theoretical prediction are shown in Figure 4.25. Again due to
the limitations of pumping pressure, the pressure of saline side during the test was
limited to 5 bar. As presented in Figure 4.25, the experimental results followed the
trend of theoretical predictions. However, the magnitude of the generated osmotic
power was much less. Figure 4.26 shows the density of osmotic power.
Figure 4.26: Density of osmotic power for 50,000 ppm.
The experiments showed that the generated osmotic power was much less than the
maximum available power based on the theory. This has two main reasons:
A reverse osmosis membrane was used to conduct a forward osmosis
process. In this case, the performance of the membrane is not as ideal as a
0
0.2
0.4
0.6
0.8
1
0 1 2 3 4 5
Density of Osmotic
Power (mW/m 2 )
Pressure of Saline Side (bar)

Chapter 4 Osmotic Power: Utilizing the Reject Brine ________________________ 80
forward osmosis membrane. Therefore, the permeability and the recovery
ratio of the membrane was less than those of an ideal one, as was assumed
by the theory.
The permeability of the membrane was assumed to be constant to simplify
the theoretical calculations. However, the permeability is a function of
pressure gradient, salinity gradient and also the temperature.
4.9 The Effect of Feed Water Flow Rate
Along the length of the membrane, some of the parameters such as the salinity and
the osmotic pressure will change and the Osmotic Power generation will be
affected. In this section, these changes along the membrane’s length (or series of
membranes) have been studied. As discussed before, the power generation in the
proposed method is directly related to the amount of low salinity fluid passing the
membrane.
(4.8)
This cross-membrane flow is a function of total pressure gradient across the
membrane.
(4.9)
It was assumed that the pressure drop due to friction, along the membrane is
negligible. Therefore, while the pressure gradient is the difference between the

Chapter 4 Osmotic Power: Utilizing the Reject Brine ________________________ 81
osmotic pressure and the static pressure, the only variable parameter along the
membrane’s length would be the osmotic pressure gradient. smotic pressure
itself is a function of salinity gradient across the membrane.
During the process of generating Osmotic Power, because of the driving pressure,
low salinity fluid passes the membrane and enters the high salinity fluid. Driving
pressure can be defined as following:
– (4.22)
Where, DP is the driving pressure (bar), π is the osmotic pressure difference (bar)
and p is the static pressure difference (bar) across the membrane. The passage of
fresh water through the membrane causes a mixing between fresh water and the
high salinity solution. This mixing dilutes the high salinity fluid and therefore
reduces its salinity. This results in the cross-membrane driving pressure to
decrease.
The reduction in the driving force causes the cross-membrane permeate flow to
decrease which finally reduces the amount of generated Osmotic Power. Dilution
of the high salinity flow is a natural phenomenon. It is actually the soul of
generating Osmotic Power, and so inevitable. The effect of dilution is
considerable when the length of membrane is long or when the system is running
with an array of membranes in series.
The dilution effect is a function of both the salinity gradient across the membrane
and flow rate of the high salinity fluid. Salinity gradient has a direct effect on the
dilution. The higher the salinity gradient the more the fresh water passes the
membrane and is mixed with the high salinity flow. On the other hand, the flow
rate of the high salinity flow has a reverse effect on the dilution. The lower the

Chapter 4 Osmotic Power: Utilizing the Reject Brine ________________________ 82
flow rate, the more time the fresh water has to mix with the high salinity flow and
dilute it.
Figure 4.27: The effect of dilution.
As the fresh water enters the saline side, the salinity of the high concentrated
stream reduces. If salty water enters the membrane with a flow rate of salty, its
salinity at the outlet of the membrane would be:
(4.23)
Where, S0, S1 and S2 are the salinities (ppm) of permeate flow, saline flow at the
inlet and saline flow at the outlet of the membrane, respectively. Assuming the
salinity of the permeate flow to be zero (salinity of fresh water), the equation
becomes:
(4.24)
Substituting fresh from the Equation 4.23:

Chapter 4 Osmotic Power: Utilizing the Reject Brine ________________________ 83
(4.25)
It is noticeable that fresh is a function of osmotic pressure itself. Therefore at the
outlet of the membrane, where the osmotic pressure is lower than the inlet, the
permeate flow rate is also lower and needs to be updated in the equations.
However, in this study, the changes in fresh water flow rate have been neglected.
Equation 4.12a shows the relationship between the osmotic pressure and the
salinity difference in C as following:
(4.12a)
Where, the salinity difference, S, is in parts per million (ppm) and the osmotic
pressure, π, is in bars. Now the Driving Pressure (DP) can be calculated for both
inlet and outlet of the membrane.
At the inlet:
– (4.26a)
Using the Equation 4.12a:
– (4.26b)
At the outlet:
– (4.27a)

Chapter 4 Osmotic Power: Utilizing the Reject Brine ________________________ 84
– (4.27b)
It was assumed that the pressure drop along the membrane due to friction losses is
negligible:
(4.31)
Combining Equations 4.27a and 4.25, the Driving Pressure at the outlet can be
found as:
– (4.32)
Above equation shows that the final Driving Pressure is dependent to both the
fresh water and the saline water’s flow rate. The greater the ratio of fresh water
flow rate to saline flow rate is, the lower the Driving Pressure will be at the outlet
of the membrane. It is also related to the static pressure of the saline side. With
higher pressures at the salty side, less fresh water passes the membrane and the
dilution will reduce. Obviously, reducing in the flow rate of permeate flow results
in the generated Osmotic Power to reduce.
Figure 4.28, which shows the final osmotic pressure, is a solution for this equation
when the salinity of the salty flow is 10,000 ppm. The area and the permeability of
the membrane were assumed to be the same as our experimental membrane.

Chapter 4 Osmotic Power: Utilizing the Reject Brine ________________________ 85
Figure 4.28: Effect of saline flow rate on the final osmotic pressure.
The horizontal axis represents the flow rate of the salty stream. When the flow
rate is very small, permeate flow has enough time to mix with the salty solution
and reduces its salinity to a point where the osmotic pressure at the outlet is
negligible. With higher flow rates, the mixing will be less and therefore the drop
in osmotic pressure will be smaller. The red line on the diagram shows the
corresponding osmotic pressure for 1 ppm salinity difference at C. That is
the maximum available Driving Pressure within the membrane and happens at the
membrane’s inlet and when the static pressure of the salty side is zero. As
discussed before, when the static pressure of the salty side is higher, less dilution
will happen and the final osmotic pressure at the membrane’s outlet will be
higher.

Chapter 4 Osmotic Power: Utilizing the Reject Brine ________________________ 86
Figure 4.29: Effect of salty water flow rate on the final osmotic
pressure at higher flow rates.
At very high flow rates, the final all the curves will merge and the final osmotic
pressure will be approximately the same as the osmotic pressure at the inlet. This
is because the ratio of permeate flow to salty flow is very small and the mixing
between them will not change the salinity of the salty flow considerably.
Following diagram is the extended of the previous diagram and shows the final
osmotic pressure at higher ranges of flow rates
4.10 Summary
This chapter presents and investigates a method of utilizing discharge brine from a
desalination process. The method employs a membrane-based process of forward
osmosis in order to generate power from highly saline brine. Therefore, it is the
most compatible with a reverse osmosis desalination plant, where providing

Chapter 4 Osmotic Power: Utilizing the Reject Brine ________________________ 87
membranes and related technologies is relatively feasible, although it is applicable
in any plant with different methods of desalination.
Any stream of saline water, as that discharged from a RO desalination plant, has a
high potential of generating power through forward osmosis. A method has been
proposed to harvest this potential. The saline water which has a high concentration
of salt is pumped into the membrane continuously. The other side of the
membrane is filled with fresh water or any low concentrated fluid. The salinity
gradient drives a flow from low salinity side to the high salinity side. This
increases the flow rate of high salinity side at the outlet of the membrane which
can be harvested in the form of power. Calculations showed that the optimum
pumping pressure for the high concentration flow is half of the osmotic pressure
due to salinity gradient across the membrane. This results in the highest cross-
membrane flow rate which consequently results in delivering the highest amount
of power by the high salinity flow at the outlet. Supporting experiments were
conducted afterwards to validate the theoretical calculations.
One of the other advantages of this method is the dilution of high salinity water as
a result of forward osmosis. This, happening in large scales, can address one of
the major environmental concerns of any desalination plant, which is the disposal
of very high concentrated salt.
In the present chapter, the proposed method and its applications have been
discussed in details. All the theoretical calculations and supporting experiments to
validate them have been presented. Afterwards, the experimental procedure, are
presented and discussed. Finally, some side-parameters have been studied and the
calculations are brought where applicable.

Chapter 5
Conclusion and Future Research
5.1 Conclusions
The presented research was concerned about providing the required thermal
energy for pre-heating the reverse osmosis desalination’s feed water, from a solar
collector. To achieve that goal, solar pond was chosen as the main source of
thermal energy. Solar pond is a solar collector and a heat storage mechanism
simultaneously. It is a pool of water, in which, the natural convection has been
suppressed by injecting salt to the lower levels. The density of each layer is higher
than the layer above. So even if become warmer, water cannot move vertically as
it is still heavier than the layer above it. This results in storing the heat at the
bottom. Because of its high thermal capacity, solar pond can provide low gradient
heat for a long period of time at a high rate. Also because of the nature of the solar
pond which needs salt to operate, it is a good choice to be coupled with a
desalination process. From a desalination plant, infinite amount of salt is available
which gives the chance to build and operate larger solar ponds. A heat exchanger
has been installed inside the solar pond to extract the heat from its bottom and
transfer it to the working fluid. The working fluid in the present research was the
sea water itself.
Pre-heating the feed water was believed to have a considerable effect on the
permeability of the membrane and its performance by reducing the fluid’s
viscosity. A series of experiments were conducted to support this idea. The
experiments were based on pushing distilled water through the membrane, in

Chapter 5 Conclusion and Future Research ________________________________ 89
different temperatures. Distilled water was used to cancel other involved
parameters such as the salinity and the osmotic pressure. In the absence of other
parameters, distilled water showed a good support of the idea. With higher
temperatures, the permeability and the production rate of the membrane increased.
Moreover, the required power to push the fluid through the membrane reduced
considerably.
After the effects of temperature on the feed water’s characteristics (i.e. viscosity)
was proved, an experimental setup was designed and built for pre-heating the
saline stream and bring it to different temperatures prior to desalination process.
In the system which was set up the saline stream is pumped into the solar pond’s
internal heat exchanger. At the outlet of the heat exchanger, the temperature of the
saline stream is high. So based on the desired temperature, it was left in a cooling
tank for a while to reach the desired temperature while cooling down naturally,
and then was pumped into the desalination plant. The test was conducted with
different feed temperatures and the performance of desalination plant was
monitored and recorded.
The results showed a significant improve in the performance of the RO
desalination device. As the temperature increased from 5°C to 35°C, the power
consumption reduced by 15%, while the recovery ratio increased by
approximately 30%. Having these to parameters, required specific energy was
found to be reduced by 35% which was quite significant. Furthermore, the amount
of emitted CO2 per cubic meter of produced fresh water was calculated to reduce
by 35% as well. Also the characteristics of the heat exchanger according to the
final desired temperature of feed stream were determined. This research showed
that using solar energy in the form of thermal energy is an effective way to reduce
the amount of specific energy for a reverse osmosis desalination process.
Although in large scales the method might be not feasible, for smaller scales, it
promises a low energy consuming, sustainable process of desalination.

Chapter 5 Conclusion and Future Research ________________________________ 90
The second part of the presented research was concerned about the high
concentrated salty brine which is discharged from the reverse osmosis
desalination plant. The objective of the research was to utilize it and generate
power. This was achieved by running a process based on forward osmosis
phenomenon. The energy of the brine was extracted while diluting it with a lower
concentrated fluid.
First, the theoretical model for the forward osmosis process was developed. The
model describes the amount of generated Osmotic Power as a function of different
involved parameters such as the pressure gradient and salinity gradient across the
membrane. Then, supporting tests were conducted to validate the theoretical
model. To generate the osmotic power, a commercial reverse osmosis membrane
was used. The high salinity discharge brine from the RO plant was pumped into
one side of the membrane, and low salinity fluid was flowing through the other
side. Because of the pressure gradient across the membrane there is a cross-
membrane flow. The pumping pressure of the salty side was set to half of the
osmotic pressure gradient, as it was the optimum point according to the theory.
Therefore, with the pressure of the saline flow and the amount of low salinity fluid
which passes the membrane and is added to the saline flow, the highest amount of
osmotic power is achievable.
The tests were conducted for 10,000 and 50,000 ppm salinity gradients across the
membrane. They showed a good agreement with the theoretical model in terms of
the trend on which the osmotic power is generated, however, the magnitude of the
osmotic power was much less than what predicted by the theory. Two reasons are
believed to be causing this. First is the usage of a reverse osmosis membrane to
run a forward osmosis process. It was assumed that the RO membrane behaves
ideally in the reverse direction of its conventional application. Also the
permeability of the membrane was assumed to be constant in the theoretical
model. These assumptions resulted in an optimistic prediction by the theory.
Although the amount of generated power was much less than the theory, the
osmotic power could be generated in a steady and sustainable way. The research

Chapter 5 Conclusion and Future Research ________________________________ 91
showed the feasibility of coupling a forward osmosis power plant with a reverse
osmosis desalination plant to generate power.
The conclusions and findings of this study can be briefed as following:
Pre-heating the feed stream has a considerable positive effect on the
performance of the reverse osmosis process and can be considered as a
feasible option for small scale desalination plants.
Solar pond is a reliable source of solar thermal energy to be used for pre-
heating the feed.
By increasing the feed temperature from 5°C to 35°C, specific energy
consumption in a small scale desalination module reduces by 35%.
It is also possible to harvest some of the consumed energy in the forms of
osmotic power. However, it is strongly suggested that appropriate
membranes specifically made for forward osmosis be used, as reverse
osmosis membranes are very inefficient for generating osmotic power.
5.2 Contributions
Reverse osmosis desalination process was coupled with solar energy.
Solar pond as a solar collector and heat storage system was used to
provide the required heat for pre-heating the feed stream of the
desalination process. Since it is a solar collector, solar pond does not
have any CO2 emissions and is totally a green source of energy.
A method was designed and tested to generate osmotic power by
using a conventional commercial reverse osmosis membrane. The
research showed the feasibility and scales of a possible forward
osmosis power plant to be coupled with a RO desalination plant.

Chapter 5 Conclusion and Future Research ________________________________ 92
5.3 Future Work
Using a forward osmosis membrane, to generate osmotic power, results in higher
efficiencies and better performance. To design a real life forward osmosis plant,
the changes in the permeability should be taken into account. Also the effect of
pressure drop along the membrane is considerable when membranes are
connected in series within a forward osmosis module.

References _________________________________________________________ 93
References
Aaberg, R. J. (2003). Osmotic power: A new and powerful renewable energy
source?, Refocus, 4(6), 48-50.
Achilli, A., Childress, A. E., (2010). Pressure retarded osmosis: From the vision
of Sidney Loeb to the first prototype installation — Review, Desalination, 261(3),
205-211.
Ahmad, G. E. and Schmid, J. (2002). Feasibility study of brackish water
desalination in the Egyptian deserts and rural regions using PV systems, Energy
Conversion and Management, 43(18), 2641-2649.
Ahmed, M., Arakel, A., Hoey, D., Coleman, M. (2001). Integrated power, water
and salt generation: a discussion paper, Desalination, 134(1–3), 37-45.
Ahmed, M. Arakel, A., Hoey, D., Thumarukudy, M. R., Goosen, M. F.A. , Al-
Haddabi, M., Al-Belushi, A. (2003). Feasibility of salt production from inland
RO desalination plant reject brine: A case study, Desalination, 158, 109-117.
Al-Bahri, Z. K., Hanbury, W. T., Hodgkiess, T. (2001). Optimum feed
temperatures for seawater reverse osmosis plant operation in an MSF/SWRO
hybrid plant, Desalination, 138(1–3), 335-339.

References _________________________________________________________ 94
Amati, V., Zapater, C., Sciubba, E., Marcuello, J. U. (2008). Process simulation of
a reverse osmosis desalination plant powered by photovoltaic panels for
Kalymnos Island, ASME International Mechanical Engineering Congress and
Exposition, Boston, October 31–November 6, 209–17.
Boesch, W. W. (1982). World's first solar powered reverse osmosis desalination
plant, Desalination, 41(2), 233-237.
Collares Pereira, M., Mendes, J.F., Horta, P., Korovessis, N. (2007). Final design
of an advanced solar dryer for salt recovery from brine effluent of an MED
desalination plant, Desalination, Volume 211, Issues 1–3, 222-231.
Darwish, M. A., Abdel-Jawad, M., Hauge, L. J. (1989). A new dual-function
device for optimal energy recovery and pumping for all capacities of RO systems,
Desalination, 75, Pages 25-39.
Egozy, Y., Korngold, E. (1982). Effect of the energy crisis on water desalination
and waste water recycling by ion exchange, Desalination, 40(1–2), 181-189.
Farahbod, F., Mowla, D., Jafari Nasr, M.R., Soltanieh, M. (2013). Experimental
study of a solar desalination pond as second stage in proposed zero discharge
desalination process, Solar Energy, 97,138-146.
Fernández-López, C., Viedma, A., Herrero, R., Kaiser, A.S. (2009). Seawater
integrated desalination plant without brine discharge and powered by renewable
energy systems, Desalination, 235(1–3), 179-198.

References _________________________________________________________ 95
Forstmeier M. Mannerheim F. D’Amato F. Shah M. Liu Y. Baldea M. and
Stella, A. (2007). Feasibility study on wind-powered desalination, Desalination,
203(1–3), 463-470.
Geisler, P., Hahnenstein, F. U., Krumm, W., Peters, T. (1998). Pressure exchange
system for energy recovery in reverse osmosis plants, Desalination, 118(1–3), 91
IN2-IN7.
Geisler, P., Hahnenstein, F. U., Krumm, W., Peters, T. (1999). Pressure exchange
system for energy recovery in reverse osmosis plants, Desalination, 122(2–3),
151-156.
Glater, J. (1998). The early history of reverse osmosis membrane development,
Desalination, 117(1–3), 297-309.
Gocht, W., Sommerfeld, A., Rautenbach, R., Melin, Th., Eilers, L., Neskakis, A.,
Herold, D., Horstmann, V., Kabariti, M. and Muhaidat, A. (1998). Decentralized
desalination of brackish water by a directly coupled reverse-osmosis-photovoltaic-
system—A pilot plant study in Jordan, Renewable Energy, 14(1–4), 287–292.
Hauge, L. J. (1995). The pressure exchanger - A key to substantial lower
desalination cost, Desalination, 102(1–3), 219-223.
Hoeting, W. A. G. (1982). Seawater reverse osmosis with energy recovery,
Desalination, 40(3), 357-361.
Jellinek, H.H.G., Masuda, H. (1981). Osmo-power. Theory and performance of an
osmo-power pilot plant, Ocean Engineering, 8(2), 103-128.

References _________________________________________________________ 96
Jiao, B., Cassano, A., Drioli, E. (2004). Recent advances on membrane processes
for the concentration of fruit juices: a review, Journal of Food Engineering, 63(3),
303-324.
Jin, X., Jawor, A., Kim, S., Hoek, E. M. V. (2009). Effects of feed water
temperature on separation performance and organic fouling of brackish water RO
membranes, Desalination, 239 (1–3) 346-359.
Kosmadakis, G., Manolakos, D., Kyritsis, S., Papadakis, G. (2009). Economic
assessment of a two-stage solar Organic Rankine Cycle for reverse osmosis
desalination, Renewable Energy, 34(6), 1579-1586.
Kosmadakis, G., Manolakos, D., Kyritsis, S., Papadakis, G. (2010). Design of a
two stage Organic Rankine Cycle system for reverse osmosis desalination
supplied from a steady thermal source, Desalination, 250(1), 323-328.
Kravath, R. E., Davis, J. A. (1975). Desalination of sea water by direct osmosis,
Desalination, 16(2), 151-155.
Li, W., Krantz, W. B., Cornelissen, E. R., Post, J. W., Verliefde, A. R.D., Tang, C.
Y. (2013). A novel hybrid process of reverse electro dialysis and reverse osmosis
for low energy seawater desalination and brine management, Applied Energy,
104, 592-602.
Loeb, S. (1976). Production of energy from concentrated brines by pressure-
retarded osmosis: I. Preliminary technical and economic correlations, Journal of
Membrane Science, 1, 49-63.

References _________________________________________________________ 97
Loeb, S. (2002). Large-scale power production by pressure-retarded osmosis,
using river water and sea water passing through spiral modules, Desalination,
143(2), 115-122.
Lonsdale, H. K. (1982). The growth of membrane technology, Journal of
Membrane Science, 10(2–3), 81-181.
Nadav, N., Ophir, A. (1982). Production of electrical power from concentrated
brines, Desalination, 40(1–2), 197-211.
Nicolaisen, B. (2003). Developments in membrane technology for water
treatment, Desalination, 153(1–3), 355-360.
Petersen, G., Fries, S., Mohn, J., Muller, A. (1981). Wind and solar powered
reverse osmosis desalination units – design, start up, operating experience.
Desalination, 39, 125-135.
Petrotos, K. B., Lazarides, H. N. (2001). Osmotic concentration of liquid foods,
Journal of Food Engineering, 49(2–3), 201-206.
Rautenbach, R. Linn, T. (1996). High-pressure reverse osmosis and Nano-
filtration a ―zero discharge‖ process combination for the treatment of waste water
with severe fouling/scaling potential, Desalination, 105(1–2), 63-70.
Richards, B. S. and Schäfer, A. I. (2002). Design considerations for a solar-
powered desalination system for remote communities in Australia, Desalination,
144(1–3), 193-199.

References _________________________________________________________ 98
Riley, R. L., Merten, U., Gardner, J. O. (1966). Replication electron microscopy
of cellulose acetate osmotic membranes, Desalination, 1(1), 30-34.
Sassi, K. M., Mujtaba, I. M. (2012). Effective design of reverse osmosis based
desalination process considering wide range of salinity and seawater temperature,
Desalination, 306, 8-16.
Sassi, K. M., Mujtaba, I. M. (2013). Optimal operation of RO system with daily
variation of freshwater demand and seawater temperature, Computers & Chemical
Engineering, 59, 101-110.
Scrivani, A. El Asmar, T. Bardi, U. (2007). Solar trough concentration for fresh
water production and waste water treatment, Desalination, 206(1–3), 485-493.
She, Q., Jin, X., Tang, C. Y. (2012). Osmotic power production from salinity
gradient resource by pressure retarded osmosis: Effects of operating conditions
and reverse solute diffusion, Journal of Membrane Science, 401–402, 262-273.
Sun, J., Wang, Y., Xu S., Wang S. (2008). Energy recovery device with a fluid
switcher for seawater reverse osmosis system, Chinese Journal of Chemical
Engineering, 16(2), 329-332.
Tanaka, Y., Ehara, R., Itoi, S., Got, T. (2003). Ion-exchange membrane
electrodialytic salt production using brine discharged from a reverse osmosis
seawater desalination plant, Journal of Membrane Science, 222, 71-86.
Zhao, S., Zou, L. (2011). Effects of working temperature on separation
performance, membrane scaling and cleaning in forward osmosis desalination,
Desalination, 278 (1–3), 157-164.

References _________________________________________________________ 99