sustainable energy benchmarking and greenhouse gas accounting
TRANSCRIPT

Sustainable Energy Benchmarking and Greenhouse Gas Accounting for Municipal
Government Operations
Prepared by,
Lyndsay Hazen, Graduate Student
Dr. Anu Ramaswami, Professor and Director, Program on Sustainable Urban Infrastructure
University of Colorado Denver
Spring 2009
City of Durango, Colorado
Sustainable Energy Benchmarking and Greenhouse Gas Accounting: City of Durango Municipal Government Operations
University of Colorado Denver, IGERT, Program on Sustainable Infrastructure Page 2
Acknowledgements:
Thanks to Greg Caton, Nancy Andrews, and the many City of Durango staff members that helped collect the vast
amounts of data required for this project.
La Plata Electric Association: Susan Maxwell and Ray Pierotti
Atmos Energy: Pennelin Fugate

Sustainable Energy Benchmarking and Greenhouse Gas Accounting: City of Durango Municipal Government Operations
University of Colorado Denver, IGERT, Program on Sustainable Infrastructure Page 3
Contents
Executive Summary ......................................................................................................................... 5
Introduction to Sustainable Energy Futures ................................................................................... 9
The Business Case for Sustainable Energy: ............................................................................. 9
Sustainable Energy Planning and Greenhouse Gas Accounting: ............................................. 9
Greenhouse Gases (GHGs): ..................................................................................................... 9
Developing a Sustainable Energy Plan: ................................................................................. 10
2. Goals & Objectives: City of Durango’s Municipal Operations ................................................. 12
City of Durango Municipal Operations Overview:................................................................. 13
3. GHG Inventory Method ............................................................................................................ 15
Method and Scopes: .............................................................................................................. 15
4. Municipal Government Energy and GHG Analysis.................................................................... 18
Reporting Year ....................................................................................................................... 18
4.1 Buildings and Facilities Sector ............................................................................................. 18
Buildings and Facilities Energy Consumption and Energy Intensity ...................................... 18
Buildings and Facilities Sector Energy Flow Overview: ......................................................... 19
Buildings and Facilities Emission Factors ............................................................................... 20
4.2 Transportation Sector ......................................................................................................... 22
Vehicle Fleet Fuel Consumption and Fuel Economy/Energy Intensity: ................................ 22
Transportation Emission Factors: .......................................................................................... 23
Employee Commute Emissions: ............................................................................................ 23
4.3 Materials and Waste Sector ................................................................................................ 25
Annual Material Flow for Materials and Waste: ................................................................... 25
Emission Factors for Materials and Waste: ........................................................................... 25
5. Green Power ............................................................................................................................ 28
6. Conclusions: .............................................................................................................................. 29
Sustainable Energy Benchmarking and Greenhouse Gas Accounting: City of Durango Municipal Government Operations
University of Colorado Denver, IGERT, Program on Sustainable Infrastructure Page 4
Status of Durango’s Path toward Greening Government Goals: .......................................... 29
Works Cited ................................................................................................................................... 30
List of Figures:
Figure 1. Breakdown of Durango’s Municipal Government Greenhouse Gas Emissions by Sector
......................................................................................................................................................... 6
Figure 2. Durango’s Municipal Government Greenhouse Gas Emissions by Energy Source ........ 6
List of Tables:
Table 1. Durango Government Operations Overview ................................................................. 13
Table 2. Buildings and Facilities Sector Benchmarks ................................................................... 19
Table 3. Building Sector Emissions Summary .............................................................................. 21
Table 4. Transportation Benchmarks ........................................................................................... 22
Table 5. Transportation Energy Flow Emissions ........................................................................... 23
Table 6. Employee Commute Material Flow and Emissions Summary: ...................................... 24
Table 7. Materials and Waste Summary Table ............................................................................ 27
Table 8. Green Power Offsets ...................................................................................................... 28
Table 9. Greening of Government Goals ..................................................................................... 29
Acronyms:
CO2e: carbon dioxide equivalent
GHG: Greenhouse Gases
ICLEI: Local Governments for Sustainability
IPCC: International Panel on Climate Change
GWP: Global Warming Potential
EIA: Energy Information Administration
EF: emission factor

Sustainable Energy Benchmarking and Greenhouse Gas Accounting: City of Durango Municipal Government Operations
University of Colorado Denver, IGERT, Program on Sustainable Infrastructure Page 5
Executive Summary
The City of Durango governs 9.8 square miles (25.5km) of land, operates over 318,000 square
feet of buildings and facilities, and serves approximately 18,000 people. The City seeks to
develop a sustainable energy plan for its municipal government operations that leverages
energy efficiency, energy conservation and renewable energy with economic savings and
business opportunities. To accomplish this plan, the City of Durango seeks to implement the
three steps described in this report:
Greenhouse Gas Emissions Inventory: The first step in developing a sustainable energy
plan is to develop a greenhouse gas emissions (GHG) inventory. The greenhouse gases
included in this report are carbon dioxide, methane and nitrous oxides, represented as
carbon dioxide equivalents or CO2e. A GHG emissions inventory provides a consolidated
accounting of the emissions from city government’s use of fossil fuel energy.
Sustainable Energy Goals: Once a GHG inventory is complete, the next step is to
establish realistic goals and timeframes for energy use and emissions reductions.
Sustainable Energy Action Matrix: Using the GHG Inventory and the Sustainable Energy
Goals for guidance, targeted actions to reduce the GHG emissions from municipal
operations are evaluated and compiled into an Action Matrix. The Sustainable Energy
Action Matrix will be a working document used to provide preliminary insight into the
“how” component of implementing a sustainable energy plan and achieving emission
reductions.
Results from Durango’s municipal government GHG emissions accounting are summarized next.
GHG Emissions Inventory: In 2008, Durango’s total municipal government GHG footprint was
14,582mt-CO2e. The buildings and facilities sector contributes about 75% of the total
emissions, transportation 18%, and materials and waste seven percent. Figure 1 shows the
City’s municipal government emissions subdivided into local government sectors. The greatest
emission sources were from buildings and facilities (38%), followed by the wastewater
treatment plant and pumps (15%), and the city vehicle fleet (13%). Figure 2 shows Durango’s
municipal operations GHG emissions by energy source. Electricity usage is the greatest source
of emissions, representing 63% of all emissions, followed by natural gas at 11%. The footprint
results show that the bulk of Durango’s GHG emissions are associated with buildings and
facilities energy use.

Sustainable Energy Benchmarking and Greenhouse Gas Accounting: City of Durango Municipal Government Operations
University of Colorado Denver, IGERT, Program on Sustainable Infrastructure Page 6
Figure 1. Breakdown of Durango’s Municipal Government Greenhouse Gas Emissions by Sector
About 75% of Durango’s municipal government emissions are associated with buildings and facilities (shown in shades of blue). The City and Airport vehicle fleet (including Durango Transit and the Police Dept.) and employee commute (shown in red) contribute 18%. About 7% of Durango’s emissions (shown in green) are associated with the embodied energy of materials (including paper, cement, asphalt, and fertilizer) used by the City.
Figure 2. Durango’s Municipal Government Greenhouse Gas Emissions by Energy Source
Buildings and Facilities
38%
Airport9%
Streetlights/Traffic Lights/Park Lights/
Irrigation6%
Water Treatment/ Pumps
7%
Wastewater Treatment/ Pumps
15%City and Airport Vehicle Fleet
13%
Employee Commuting
5%
Waste and Recycling
2%
Fugitive Emissions from Wastewater
Treatment1%
Materials4%
2008 GHG Emissions by Local Government Sector
2008 Emissions: 14, 438 mt-CO2ePer-Person Served Emissions: 0.8 mt-CO2e/person
Natural Gas Usage11%
Electricity Usage63%
Gasoline7% Diesel
6%
Propane0%
Employee Commute (gasoline&
diesel)5%
Embodied Energy of Key
Materials (upstream production emissions)
7%
2008 GHG Emissions by Energy Source

Sustainable Energy Benchmarking and Greenhouse Gas Accounting: City of Durango Municipal Government Operations
University of Colorado Denver, IGERT, Program on Sustainable Infrastructure Page 7
Sustainable Energy Goals: For step two, the City of Durango has adopted Colorado’s Greening
of Government Goals: a 20% reduction in energy use and a 25% reduction in transportation
fuel use by June 1st, of 2012.
Sustainable Energy Action Matrix:
The Sustainable Energy Action Matrix is a valuable tool for tracking the progress and assessing
and comparing the cost-benefits of various sustainable energy strategies.
Current Actions: The GHG Inventory reports the City’s energy consumption and emissions
status as of 2008. Since 2008, the City of Durango has undertaken a number of actions to
reduce energy consumption and improve the efficiency of municipal operations. A few of the
actions that are currently being implemented include: instituting an energy efficient computer
power policy, purchasing smaller replacement vehicles, and installing renewable energy
technologies at the Wastewater Treatment Plant and the Recreation Center. The City of
Durango’s current initiates have been included in the Action Matrix as a strategy for tracking
progress during the timeframe between GHG Inventory Reports.
Next Steps: The Sustainable Action Matrix provides a preliminary assessment and comparison
of the cost-benefits for the City’s “Next Steps”. A summary of the Actions assessed is provided
below.
Buildings and Facilities:
Increasing the efficiency of the City’s lighting was a major target for the Climate Action
Matrix. It is recommended the City transition its buildings and facilities to LED tube lighting
which uses 50% less energy than T12s and 30% less energy than T8s. The City’s indoor lighting
could be further retrofitted by installing motion sensors and identifying opportunities to
decrease the lighting wattage in buildings. Estimated Savings: $40,000 annually in electricity
costs and a 3.0% reduction in GHGs (from the 2008 baseline).
It is also recommended that City replace its current streetlights with LED streetlights,
which are 25% more efficient. Estimated Savings: $4,000 annually in electricity costs and a
1.7% reduction in GHGs.
A four-day work week for four of the City’s buildings (City Hall, River City Hall, Carnegie
Building, and General Services) was assessed. Estimated Savings: $4,000 annually in electricity
and heating costs and a 0.31% reduction in GHGs.

Sustainable Energy Benchmarking and Greenhouse Gas Accounting: City of Durango Municipal Government Operations
University of Colorado Denver, IGERT, Program on Sustainable Infrastructure Page 8
Other recommendations include performing a detailed building retrofit analysis for all
City buildings, particularly the Recreation Center (the City’s largest energy consumer). A
detailed technical analysis for the City’s water/wastewater pumps and motors is also
recommended.
Transportation:
A low cost initiative to improve the City’s vehicle fleet economy is to provide Eco-Driving
Training for employees. Studies indicate driving the speed liming, accelerating properly, and
reducing idling can improve vehicle fuel economy by 12%. Estimated Savings: $49,000 annual
in fuel costs and a 1.5% reduction in GHGs.
For the City’s existing diesel engine vehicles, it is recommended the engines be
retrofitted with new smart valve technology, which has been proven to improve fuel economy
by 20%. Estimated Savings: $30,000 annually, a 0.9% reduction in GHGs.
It is suggested the City seek opportunities to improve the fuel economy of the Police
Fleet. Strategies include using hybrid-electric vehicles and downsizing to 6-cylinder vehicles
where appropriate. Such strategies could improve the fuel economy of the Police fleet by 55%.
Estimated Savings: $36,000 annually in fuel costs, and a 1.7% reduction in GHGs.
The City should also seek opportunities to replace its solid waste and recycling fleet with
hydraulic-electric hybrids. Considering the stop and go nature of trash trucks, hybrid-electrics
could potentially improve the fuel economy of the Solid Waste & Recycling fleet by 20%.
Estimated Savings: $12,000 annually in fuel costs and a 0.3% reduction in GHGs.
Sustainable Energy Benchmarking and Greenhouse Gas Accounting: City of Durango Municipal Government Operations
University of Colorado Denver, IGERT, Program on Sustainable Infrastructure Page 9
Introduction to Sustainable Energy Futures
Sustainability is widely understood to encompass the three E’s: Economics, Environment and
Equity. In the context of the environment, sustainability refers to more efficient use of scarce
natural resources such as water, energy and minerals, as well as reducing or avoiding emissions
of toxic pollutants such as heavy metals, harmful pesticides, and carcinogens. Sustainability
entails facilitating human activities that simultaneously promote economic development,
environmental protection, and social equity.
The Business Case for Sustainable Energy:
There has been much interest nationally, in the State of Colorado, and in several Colorado cities
in developing sustainable energy plans. These plans are motivated by the projected increase in
global demand for limited oil and gas resources, the increasing world-wide cost of fossil fuels,
our dependence on foreign oil which impacts national energy security, and our understanding
of the global and local environmental impacts of using fossil energy. These impacts include
local-scale air pollution from petroleum use in automobiles, local-scale air pollution from coal-
fired power plants, and global impacts of greenhouse gas emissions that is projected to have
local impacts in Colorado, including impacts on the snow pack, water supplies and local
agriculture. Looking toward a future with increased cost and reduced availability of fossil
energy, cities are embarking on sustainable energy plans that save money through energy and
resource conservation, generate jobs in the new green energy economy focused on energy
efficiency and renewable energy, and promote community-wide economic development.
Sustainable Energy Planning and Greenhouse Gas Accounting:
We use fossil fuel for almost all human activities – for cooling and heating our buildings, for
transportation, and for industrial production. An accounting of CO2 emissions from burning
fossil fuel promotes a comprehensive understanding of our fossil energy use. In addition, such
Greenhouse Gas accounting is also useful to represent human impact on climate.
Greenhouse Gases (GHGs):
The internationally recognized Greenhouse Gases (GHGs) include carbon dioxide (CO2),
methane (CH4), nitrous oxide (N2O) and three replacements for chloroflorocarbons—HFCs ,
PFCs , and sulphur 9exafluoride (SF8). The first three GHGs are dominant and account for more
more than 90% of GHGs emitted nationally (1). Carbon dioxide (CO2) is produced primarily

Sustainable Energy Benchmarking and Greenhouse Gas Accounting: City of Durango Municipal Government Operations
University of Colorado Denver, IGERT, Program on Sustainable Infrastructure Page 10
from the burning of fossil fuels and is the largest contributor to global warming. Methane (CH4)
is
produced largely from biodegradable waste
decomposition (naturally or in landfills) and
from fugitive emission in natural gas pipelines.
Nitrous oxide is often emitted from fertilizers,
combustion, and wastewater treatment plant
effluent. HFC, PFC, and SF6 are often found in
vehicle and building air conditioning units and
refrigerators and generally contribute trivially.
The different GHGs have different one hundred
year global warming potentials (ability to trap
heat in the atmosphere over time). For
example, according to the IPCC’s 2nd Assessment
Report, methane is twenty-one times better at
trapping heat than carbon dioxide. Nitrous
oxide is 310 times better at trapping heat than carbon dioxide. The GHGs are reported
together on a common standardized basis as metric tons (mt) of CO2e, called carbon dioxide
equivalents.
Developing a Sustainable Energy Plan:
Developing a sustainable energy plan for a community includes:
Kyoto Protocol/Internationally
Recognized Greenhouse Gases
100-Year Global Warming Potential
(GWP)
Carbon dioxide (CO2) 1
Methane (CH4) 21
Nitrous Oxide (N2O) 310
HFCs Varies: 140-11,700
PFCs Varies: 6,500-9,200
Sulphur Hexaflouride (SF8)
23,900
*The GWPs from the International Panel on Climate Change (IPCC) Second Assessment Report were used in this report as recommended by ICLEI Local Government Operations Protocol 2008, p166.

Sustainable Energy Benchmarking and Greenhouse Gas Accounting: City of Durango Municipal Government Operations
University of Colorado Denver, IGERT, Program on Sustainable Infrastructure Page 11
Conducting an inventory of CO2e emissions to understand fossil fuel use and associated GHG emissions in basic human activity sectors
Developing a matrix of actions that can be taken in each of the sectors to promote energy efficiency, conserve resources, save money and/or create business opportunity while mitigating CO2e emissions
Choosing and prioritizing among the available action options based on local economics, culture, civic engagement and political support to develop a practical sustainable energy action plan suited for implementation.
Developing an implementation plan for the prioritized actions, with outcomes assessment protocols
Some communities are also focusing on adaptation strategies such as, planning to adapt to water supply variation, peak oil prices, or other anticipated future trajectories.
Sustainable Energy Benchmarking and Greenhouse Gas Accounting: City of Durango Municipal Government Operations
University of Colorado Denver, IGERT, Program on Sustainable Infrastructure Page 12
2. Goals & Objectives: City of Durango’s Municipal Operations
The City of Durango seeks to be a leader in sustainable energy planning and has identified a
number goals and objectives for the local municipal operations.
In accordance with the Governor of Colorado’s Greening of Government Executive Orders,
Durango’s government operations and facilities will seek to achieve the following five goals by
June 30, 2012 (2):
-20% reduction in energy use
20% reduction in paper use
-10% reduction in water consumption
- 25% volumetric reduction in state vehicle fuel consumption
In Spring of 2009, Durango contracted with the IGERT Program on Sustainable Urban
Infrastructure at the University of Colorado Denver to assist in developing a sustainability plan
for the City of Durango’s Municipal Government Operations, based on the business case of
advancing the three E’s of sustainability. The objectives of the study were to:
Conduct an inventory of municipal government CO2e emissions, to understand fossil fuel
use and associated GHG emissions from the three main sectors of the City of Durango’s
Municipal Government Operations: buildings and facilities, transportation, and
materials.
Develop a matrix of sustainable energy actions that can be taken in each of the activity
sectors to promote energy efficiency, conserve resources, save money and/or create
business opportunities while mitigating CO2e emissions.
In this section we present background information about the City of Durango’s Municipal
Government Operations, after which Section 3 describes the methodology used and Section 4
develops the GHG inventory for Durango’s Municipal Government Operations.

Sustainable Energy Benchmarking and Greenhouse Gas Accounting: City of Durango Municipal Government Operations
University of Colorado Denver, IGERT, Program on Sustainable Infrastructure Page 13
City of Durango Municipal Operations Overview:
The GHG Inventory includes all City Municipal Operations and Facilities as well as the Durango-
La Plata Airport. (Buildings not included are cited in Table 1.) The City of Durango’s population
was estimated to be 15,559 in 2005 and 16,169 in 2008 (3). However, due to a year-round
tourism industry and a fluctuating student population from Fort Lewis College, a more realistic
population served by city government services was estimated to be approximately 17,000 in
2005 and 18,000 in 2008 (4). The number of City employees (full-time and part-time) grew
from 395 in 2005 to 425 in 2008. In 2005, the City of Durango owned and operated fifteen
buildings, totaling 270,736. Between 2005 and 2008, the Three Springs Police-Sub Station and
the LEED Library were built; expanding the City’s building square footage by 18 percent to
318,513 square feet. Table 1 lists key indicators for tracking local government’s growth.
Table 1. Durango Government Operations Overview
Municipal Government Overview:
Key Indicators: 2005 2008
Population (# of residents) 15,959 16,169
Population Served* (residents + part-time residents & students/tourists) 17,000 18,000
Total Land Area (square miles) 9.77 9.84
Full-Time Equivalent Employees** 280 310
Total City Employees 438 478
Full-time 258 284
Part-time/Temporary 179 193
Cooling Degree Days 108 165
Heating Degree day 7856 8368
Buildings and Facilities:
Number of City Buildings*** 15 17
Total Building Square Footage
270,736 318,513
Number of Servers 25 30
Number of Computers 298 302
Number of CRT Monitors NA 302

Sustainable Energy Benchmarking and Greenhouse Gas Accounting: City of Durango Municipal Government Operations
University of Colorado Denver, IGERT, Program on Sustainable Infrastructure Page 14
Airport:
Annual Arriving and Departing Passengers
210,000
270,000
Full-Time/Part-Time Employees 14/0 14/2
Water/Wastewater Treatment Plants
Population Served 17,000 18,000
Number of Customers 5335 5561
Water Treated (million gallons) 1294 1283
Wastewater Treated (million gallons) 722 735
Ave/Max Daily Load (million gallons) 2.0 / 3.0 2.0 / 3.0
Biosolids (short tons per year) 415 369
Streetlights
Total 762 863
100 Watt 18 22
175 Watt 55 115
250 Watt 542 579
400 Watt 147 147
Parks
Number 31 32
Parks (acres) 250 268
Open-Space (acres) 786 935
Percent Irrigated 71%
Vehicle Fleet (does not include airport fleet)
Total Fuel Consuming Units NA 213
Gasoline 120
Durango Transit NA 12
Police Department NA 21
Toyota Prius/Hybrid NA 2
Staff Car 2x2 NA 4
Staff Car 2x4 NA 4
Pickup 2x2 NA 10
Pickup 2x4 NA 20
MiniVan NA 12
Misc. Equipment/Surplus Equip NA 35
Diesel 80
Durango Transit 9
Dumptrucks/Recyle/SolidWaste/Street Sweepers etc. 60
Diesel Trucks (4x4) 6
Diesel Trucks (4x2) 5
Propane 5
Natural Gas 8
Durango Transit/Public Bus
Miles Served NA 77.5
# of Annual Passengers 296,269 365,048
Bike Paths and Lanes (miles) NA 11
*Population served includes a percentage of tourists and Fort Lewis students that are not included in standard population data. **Full-time equivalent number was approximated by the Human Resource Dept. ***The energy consumption from the City owned, but rented Silver Peaks Condo, Pingrey Daycare, and La Plata Youth Services were not included in the GHG Inventory.

Sustainable Energy Benchmarking and Greenhouse Gas Accounting: City of Durango Municipal Government Operations
University of Colorado Denver, IGERT, Program on Sustainable Infrastructure Page 15
3. GHG Inventory Method
Method and Scopes:
The GHG inventory is conducted using the advanced method developed by Ramaswami et al
(2008) (5). The method uses the standardized ICLEI protocol to report GHG emissions from in-
boundary activities. Out-of-boundary activities critical for Municipal Government Operations –
such as the purchasing of copier paper, cement, asphalt, fertilizer, and employee commute –
are added on to the in-boundary activities to yield a more holistic GHG footprint. The inclusion
of additional out-of-boundary (WRI Scope 3) activities is highly recommended by EPA’s Climate
Leaders Program. The Ramaswami et al (2008) inventory-footprint method for GHG
accounting was first pioneered by UCD with the City of Denver, and since by other cities such as
Portland, OR, Seattle, WA, Arvada, CO, Austin, TX, Minneapolis, MN. This is the first application
of the methodology to municipal government operations.
In-boundary activities include the following energy uses and are required to be reported by all
cities as per ICLEI and WRI guidelines (6).
BUILDINGS and FACILITIES–Emissions from the use of electricity and natural gas in municipal buildings and operations.
TRANSPORT –Emissions from the use of gasoline, diesel, and propane fuels in city owned vehicles.
Formally, the GHGs emitted directly from burning natural gas in buildings and gasoline/diesel in
vehicles are termed Scope 1 emissions by WRI, while CO2e emissions from power plants to
produce the electricity used within our community is termed Scope 2 emissions. Scope 1-2
plus solid waste emissions from in-boundary landfills are included in the “In-boundary”
activities and are required to be reported in a city’s GHG inventory as per ICLEI protocols.
Out-of-boundary activities designated by the WRI as Scope 3 are optional, but are highly
recommended by the EPA as they can lead to win-win strategies for GHG mitigation. The
following out-of-boundary activities, when added to in-boundary activities, yield a more holistic
account of a municipal governments CO2e footprint:

Sustainable Energy Benchmarking and Greenhouse Gas Accounting: City of Durango Municipal Government Operations
University of Colorado Denver, IGERT, Program on Sustainable Infrastructure Page 16
EMBODIED ENERGY OF CRITICAL URBAN MATERIALS: The associated GHG
emissions from the energy used to produce critical urban materials (fuel,
paper, asphalt, concrete, fertilizer) and from the waste and recycling that is
transported out-of-boundary.
Energy Use Sectors: To better communicate a municipal government’s overall energy use and
GHG emissions, classifying end-use of energy into three different sectors is useful (versus the
WRI in-boundary and out-of boundary activity classification). In this report, we consistently
report energy use and GHG emissions in the following three sectors:
Buildings and Facilities– Energy use in local government buildings and facilities.
Subdivided into the following local government sectors:
Buildings and Facilities
Airport
Streetlights and Traffic Signals (park irrigation included here)
Water Treatment and Distribution
Wastewater Treatment and Collection
Transport – Energy use to operate the City and Airport vehicle fleet and energy use for
employee commute. Generally termed Pump-to-Wheels (P2W) energy use.
City and Airport Vehicle Fleet
Employee Commute
Materials and Waste-- Energy use and associated GHG emissions from producing critical urban
materials and from waste disposal.
Upstream Fuel Production
Paper
Asphalt (Street Maintenance Division)
Concrete (Street Maintenance Division)
Fertilizer
Solid Waste and Recycling
Fugitive Emissions from the Wastewater Treatment Plant

Sustainable Energy Benchmarking and Greenhouse Gas Accounting: City of Durango Municipal Government Operations
University of Colorado Denver, IGERT, Program on Sustainable Infrastructure Page 17
Annual Energy Consumption/Material Flow Data: The annual Material/Energy Flow Analysis
tells us how much the municipal government is consuming. For energy (or materials use) in
each of the three main sectors, the following datasets were gathered: total kWh of electricity
consumed annually, total natural gas use consumed annually, and fuel consumed annually. By
benchmarking these consumption data on a per community member served, per square foot of
building space or other metrics, we can represent how efficient the municipal government’s
consumption patterns are.
GHG Emission Factors: GHG emissions factors tell us how clean our energy or materials are in
terms of how much CO2e is emitted per unit of the product consumed. For example, kg CO2e
emitted per unit kWh of electricity consumed.
Total emissions are computed as the product of how much is consumed and the GHG emissions
per unit of the product consumed. In the next section, consumption data and emission factors
for all three sectors are reported and an overall municipal government GHG inventory and
footprint is developed.

Sustainable Energy Benchmarking and Greenhouse Gas Accounting: City of Durango Municipal Government Operations
University of Colorado Denver, IGERT, Program on Sustainable Infrastructure Page 18
4. Municipal Government Energy and GHG Analysis
Reporting Year: This section reports energy (or materials) consumption data and associated
GHG emissions factor for 2005 and 2008 for the three main sectors:
Buildings
Transport (Tailpipe emissions)
Materials and Waste
For each sector, raw consumption data are presented first, the data are then normalized and
compared with benchmarking metrics after which emission factors are used to quantify GHG
emissions. The total GHG emissions from each sector are consolidated and reported in an
overall municipal government operations summary in Table 12. GHG emissions are reported in
terms of metric tons (mt) of carbon-dioxide equivalents, shown as CO2e.
4.1 Buildings and Facilities Sector:
Buildings and Facilities Energy Consumption and Energy Intensity:
The buildings sector energy use reports electricity and natural gas consumed in City buildings,
Airport buildings, Street lights and Traffic signals, Water Treatment/Distribution, and
Wastewater Treatment/Distribution. City buildings included in the building and facilities sub-
sector include: City Hall, River City Hall, Old Library, Mason Center, Communications Centers,
Recreation Center, Police Department, the Three Springs Police Substation, the Recycling
Center and various other smaller facilities such as cemeteries and Chapman Hill Ice Rink.
Electricity data was obtained from La Plata Electric Association (LPEA) for 2005 and 2008.
Natural gas data was obtained from Atmos Energy for City buildings and Source Gas for the
Airport. Based on the square footage of Durango’s city buildings (building data obtained from
the City of Durango), energy use intensity can be computed in terms of electricity and natural
gas use per kBTU used per square foot. These intensity numbers for buildings in Durango can
then be benchmarked with similar energy intensity metrics reported by the Energy Information
Agency (EIA) for commercial spaces in the Rocky Mountain region.

Sustainable Energy Benchmarking and Greenhouse Gas Accounting: City of Durango Municipal Government Operations
University of Colorado Denver, IGERT, Program on Sustainable Infrastructure Page 19
Table 2. Buildings and Facilities Sector Benchmarks
Buildings and Facilities Sector Benchmarks:
Commercial Buildings: City Hall
Durango Police
Department Rec.
Center
CBECS Mountain Census Division
CBECS National
Electricity (kWh/sq.ft) 72.8 18 105.8 15 14
(therm/per sq. ft) 0.55 0.37 2.38 1 0.9
(kbtu/per sq. ft. ) 128 99 344 NA 93
*Commercial Buildings Energy Consumption Survey (CBECS), 2003.
Buildings and Facilities Sector Benchmarks:
Water Treatment Plants: Durango
2005 Durango
2008 City of Denver
gallons treated per person/per day 209 195 150
watts per gallon of water treated 0.75 0.76 0.5
Wastewater Treatment Plants:
watts per gallon of wastewater treated 3.84 3.68 1
*Water/Wastewater people served: 17,000 in 2005 and 18,000 in 2008.
*City of Denver, GHG Inventory, 2007
Buildings and Facilities Sector Energy Flow Overview:
In 2008, the City of Durango consumed 10,773,073 kWh of electricity and 361,508 therms of
natural gas. Electricity use (kWh) increased by 10% and natural gas use (therms) increased by
15% between 2005 and 2008. A number of factors contribute to the increase in electricity and
natural gas use including an increase in building square footage and an increase in both cooling
and heating degree days in 2008 (see Table 1) (7).
To compare total energy usage, the electricity and natural gas data was converted to kBtus.
For electricity, one kWh is equivalent to 3,412 Btu. For natural gas, one therm is equivalent to
100,000 Btu. When measured in kBtus, the City of Durango’s total energy usage increased by

Sustainable Energy Benchmarking and Greenhouse Gas Accounting: City of Durango Municipal Government Operations
University of Colorado Denver, IGERT, Program on Sustainable Infrastructure Page 20
12% between 2005 and 2008. The Buildings and facilities sector energy use increased by 21%
while the other sectors total energy usage decreased between 2005 and 2008.1
Electricity by Sector: The City of Durango’s total electricity consumption continues to increase.
The Streetlights, Park Lights, and Irrigation Sector experienced the greatest increase, 32%, in
electricity usage between 2005 and 2008. The increase is most likely contributed to the
installation of 137 400 watt street lamps at Rivergate Drive, which, in itself, increased the kWh
usage by approximately 195,000 kWh annually. Electricity usage at the Airport increased by
226,359 kWhs (18%). A portion of the Airport’s electricity increase can be contributed to the
installation of a new air conditioning unit. For the buildings and facilities sub-sector, electricity
usage increased by 367,535 kWh (9%), likely contributable to standard service expansion
including the addition of two buildings to the City’s inventory: the LEED Library and the Three
Springs Police Station. At the Water Treatment Plant, electricity usage increased by four
percent and the Wastewater Treatment Plant experienced a three percent increase. Although
the Wastewater Treatment Plant has stabilized electricity consumption, it continues to be a
substantial electricity consumer, representing 25% of the City’s total electricity consumption.
Natural Gas by Sector: The buildings and facilities natural gas usage increased by 70,148
therms or 9%. The Recycling Center, River City Hall, and the Bodo Facility experienced the
greatest percent increases in natural gas consumption. Chapman Hill Ice Rink’s natural gas
consumption decreased by 66%, a likely result of the building being enclosed. City Hall’s
natural gas usage decreased by 15%, reflecting the efficiency of the building’s recently installed
boiler.
Buildings and Facilities Emission Factors:
The 2008 GHG emission factor for electricity (0.83 kg-CO2e/kWh) was calculated from Tri-State
Generation’s (LPEA’s parent company) 2007 energy mix ratio (8). An emission factor of 1.0 kg-
CO2e per kWh produced was used for the percent of electricity produced from coal. An
emission factor of 0.5 kg-CO2e per kWh produced was applied to the percent of electricity (9)
produced from natural gas. The emission factor for natural gas (5.3 kg-CO2e/therm) is from the
ICLEI protocol (10). These emission factors are in line with those reported by the EPA and EIA
Although the data indicates the Airport Terminal building’s natural gas consumption decreased by 36% between 2005 and 2008, it is hypothesized that the gas meter is inaccurate.
1
Sustainable Energy Benchmarking and Greenhouse Gas Accounting: City of Durango Municipal Government Operations
University of Colorado Denver, IGERT, Program on Sustainable Infrastructure Page 21
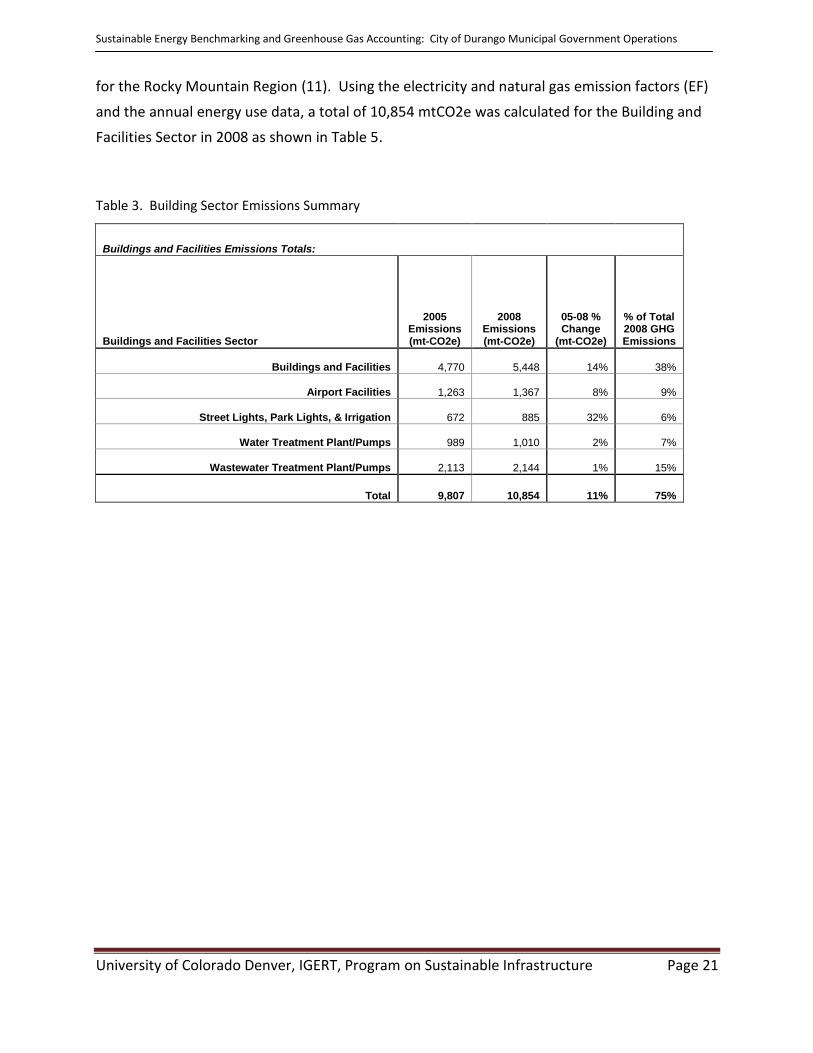
for the Rocky Mountain Region (11). Using the electricity and natural gas emission factors (EF)
and the annual energy use data, a total of 10,854 mtCO2e was calculated for the Building and
Facilities Sector in 2008 as shown in Table 5.
Table 3. Building Sector Emissions Summary
Buildings and Facilities Emissions Totals:
Buildings and Facilities Sector
2005 Emissions (mt-CO2e)
2008 Emissions (mt-CO2e)
05-08 % Change
(mt-CO2e)
% of Total 2008 GHG Emissions
Buildings and Facilities
4,770
5,448 14% 38%
Airport Facilities
1,263
1,367 8% 9%
Street Lights, Park Lights, & Irrigation
672
885 32% 6%
Water Treatment Plant/Pumps
989
1,010 2% 7%
Wastewater Treatment Plant/Pumps
2,113
2,144 1% 15%
Total
9,807
10,854 11% 75%

Sustainable Energy Benchmarking and Greenhouse Gas Accounting: City of Durango Municipal Government Operations
University of Colorado Denver, IGERT, Program on Sustainable Infrastructure Page 22
4.2 Transportation Sector
Vehicle Fleet Fuel Consumption and Fuel Economy/Energy Intensity:
Fuel use for gasoline, diesel, biodiesel, and propane was obtained from the City of Durango
General Services Department and the Durango-La Plata Airport. Fuel data sub-divided by
department/division was not available. Fuel consumption data from City employees’ commute
was obtained from an online survey distributed by the IGERT program in Spring of 2009.
Table 4. Transportation Benchmarks
Transportation Benchmarks:
Sectors: City of
Durango National Average
Durango Transit:
Loop/Trolley Gasoline (mpg) 8/7.5 varies
Loop/Trolley Diesel (mpg) 10/11.0 varies
Police Fleet:
Aspen Traditional.
Patrol Car*/Highlander
Hybrid
Police Fleet (mpg) 9 12.9/21.73
Employee Commute:
Drive to Work Alone 85% 77%
Average One-Way Commute (miles) 13 16
Average Fuel Vehicle Fuel Economy (miles) 22 21
*Source :http://www.aspenpitkin.com/depts/53/hybrid.cfm
*State of Colorado Employee Commute Survey, 2007
**U.S. Census Bureau, 2005

Sustainable Energy Benchmarking and Greenhouse Gas Accounting: City of Durango Municipal Government Operations
University of Colorado Denver, IGERT, Program on Sustainable Infrastructure Page 23
Transportation Emission Factors:
Emission factors for gasoline and diesel were obtained from GREET for pump-to-wheels
analysis, appropriate for vehicle operations (12). The emissions factors of 9.3 kg for gasoline
and 9.5 kg for diesel are in-line with those in ICLEI and IPCC. The emission factor for propane,
5.74 was from ICLEI (10) and the emission factor for B20 biodiesel was from the EIA-1605 (9).
The emissions factor for transportation fuels was combined with the total material flow
resulting in the total transport sector tailpipe emission at 1,439 mt CO2e for 2005 and 1,848
mt-CO2e for 2008. Details are provided in Table 7 below.
Table 5. Transportation Energy Flow Emissions
City and Airport Vehicle Fleet Summary Table:
Fuel
2005 Total MFA (gallons)
2008 Total MFA
(gallons)
2005 Vehicle
Fleet Emissions
Total (mt-CO2 e)
2008 Vehicle
Fleet Emissions
Total (mt-CO2 e)
2005 to 2008 % Change
in Emissions
2008 % of Total
Emissions
Gasoline 61,939 102,760 576 956 66% 6.62%
Standard Diesel 62,629 93,344 595 887 49% 6.14%
Biodiesel 32,000 0 260 0 0.00%
Propane 1,403 980 8 6 -30% 0.04%
Total 1,439 1,848 28% 12.80%
Sources: City of Durango, General Services; Durango La-Plata Airport
Employee Commute Emissions:
The ICLEI GHG Inventory Protocol recommends emissions from employee commutes are
included in a local government’s GHG inventory. Using the average full-time equivalent
employee, the average employee commute, and the average fuel economy of employee
vehicles the emissions from the City employees’ commute were estimated at 699 mt-CO2e for
2005 and 786 mt-CO2e for 2008.

Sustainable Energy Benchmarking and Greenhouse Gas Accounting: City of Durango Municipal Government Operations
University of Colorado Denver, IGERT, Program on Sustainable Infrastructure Page 24
Table 6. Employee Commute Material Flow and Emissions Summary:
Employee Commute Summary Table:
Employee Commute Data 2,005 2,008
2008 % of Total
Emissions
FTE Employees 280 310
Average One-Way Commute 13 13
Total Annual Commuting Miles 1,644,829 1,830,578
Gallons of Fuel Consumed
Gasoline 71,344 79,869
Diesel 3,725 4,599
Total Emissions 699 786 5.44%

Sustainable Energy Benchmarking and Greenhouse Gas Accounting: City of Durango Municipal Government Operations
University of Colorado Denver, IGERT, Program on Sustainable Infrastructure Page 25
4.3 Materials and Waste Sector
Annual Material Flow for Materials and Waste:
Annual Consumption of Key Materials: Consumption of transportation fuels was determined
from total fuel flow as summarized in Table 7. The consumption of paper for 2005 and 2008
was provided by the City of Durango’s Purchasing Division. The 2008 consumption of asphalt
and cement was provided by the City of Durango’s Street Maintenance Division. The 2008
consumption of fertilizer was provided by the City of Durango’s Parks Division. The 2005
consumption data for asphalt, cement, and fertilizer was assumed the same as 2008.
Annual Municipal Waste and Recycling: The annual tonnage of waste and recycling collected
from each City building and facility was estimated based on the size of the container, how full
the container generally is when it is serviced, and how many times a week the building is
serviced. The waste and recycling data was provided by the City’s Department of Sustainable
Services and the Solid Waste Division. Waste and recycling data for the Durango-La Plata
Airport was provided by the Airport. In 2005, Durango’s waste was transported to the Bondad
Landfill, which was approximately 20 miles from the Durango Transfer Station. In 2008,
Durango’s waste was transported to the Crouch Mesa Landfill in New Mexico, approximately 45
miles from the Durango Transfer Station. Currently, neither landfill uses a methane collection
and flaring system.
Annual Fugitive Emissions from Wastewater Treatment Plant: The daily amount of digester
gas (ft3/per day) produced at the wastewater treatment plant was provided for 2008. The 2005
digester gas was estimated based on an average of 2007 and 2008 data. Site specific daily
nitrogen load data (kg-N/day) was available for both 2005 and 2008. The wastewater data was
provided by the City’s Wastewater Division. Fugitive emissions from the Durango-La Plata
Airport wastewater treatment process (lagoons) were minimal and were not included in this
report.
Emission Factors for Materials and Waste:
Emission Factors of Key Materials: The GHG emission factors for producing transport fuels
were obtained from the Argonne National Laboratory’s GREET Model Well-To-Pump analysis as
2.0 kg-CO2e/per gallon for gasoline and 2.5 kg-CO2e/per gallon for diesel respectively (12). The
upstream emission factor for propane was obtained from the IPCC as 1.15 kg-CO2/per gallon
respectively (does not included CO2e) (13).

Sustainable Energy Benchmarking and Greenhouse Gas Accounting: City of Durango Municipal Government Operations
University of Colorado Denver, IGERT, Program on Sustainable Infrastructure Page 26
The emission factor for paper was obtained from the Global Warming Initiative as 2.95 kg-
CO2/per ream (14) (CO2e not calculated). The emission factors for 30% and 100% post-
consumer recycled paper, bleached chlorine free was calculated based on the Reach for
Unbleached organization’s estimation of a 37% reduction in greenhouse gas emissions from
100% recycled paper (15). The emission factor for asphalt was obtained from EIO-LCA and is
1.92 g-CO2e/per dollar, where all expenditures are in 1997 $ (16). The percent of cement in
concrete (10%) was obtained from the City’s local supplier. The emission factor for cement is
one mt-CO2e/per metric ton of cement and was obtained from the National Renewable Energy
Laboratory’s Life-Cycle Inventory Database (17).
Emission Factors for Waste and Recycling: The emission factors for waste and recycling were
obtained from the EPA WARM Model. The waste emission factor was 0.37 mt-CO2e/per short
ton of waste disposed at a landfill 45 miles away with no methane capture and flaring system
(18). The emission factors (mt-CO2e/per short ton) for individual recyclable materials were as
follows: aluminum,-3.73; glass, -0.08; mixed office paper,-0.93; and mixed plastics, -0.42.
Emission factors for the fugitive emissions sources of wastewater treatment plants were
calculated using the site specific data provided by the Wastewater Division and calculations
from the ICLEI Local Government Protocol (10). The nitrogen effluent emission factor is 1.55
kg-CO2e/per kg-N. The ICLEI calculation assumes approximately 1% of the methane captured at
wastewater treatment plants is not completely flared. Applying these emission factors to the
consumption data, the total GHG emissions from the material and waste sector are as shown in
Table 9.

Sustainable Energy Benchmarking and Greenhouse Gas Accounting: City of Durango Municipal Government Operations
University of Colorado Denver, IGERT, Program on Sustainable Infrastructure Page 27
Table 7. Materials and Waste Summary Table
GHG emissions from waste disposal and recycling and manufacture of key urban materials used and for the City of Durango are summarized in the table below.
Material
2005 Annual
Material/ Energy Flow
2008 Annual
Material/ Energy
flow
Total 2005 GHG
emitted MFA x EF (mt-CO2e)
Total 2008 GHG
emitted MFA x EF (mt-CO2e)
2005-2008 % -
/+
2008 % of Total
Emissions
Waste
505 727
677 727
5.04% (short tons)
(short tons) 7.39%
Recycling
145 154
-448 -507
-3.51% (short tons)
(short tons) 13.17%
Wastewater Treatment Plant
Fugitive Emissions
(CH4)+(N2O)
45,390 44,146
71 80
0.55%
cubic feet/ per
day
cubic feet/ per
day 12.68%
37 56
g N/per day
g N/per day
City Vehicle Fuel
Production (W2P) (same as Scope 1)
(same as Scope 1) 324 425
2.95% 31.33%
Paper 4,036 3,693
11 7
0.05% (reams) (reams) -36.65%
Asphalt
2,385 2,385
207 207
1.43% (metric
tons) (metric
tons)
Cement in Urban Concrete
25 25
5 5
0.03%
(cubic yards of
concrete)
(cubic yards of
concrete)
Fertilizer (18-18-18)
4 4
6 6
0.04% (tons) (tons)
Emissions Total: 1,551 1,736 11.93% 12%

Sustainable Energy Benchmarking and Greenhouse Gas Accounting: City of Durango Municipal Government Operations
University of Colorado Denver, IGERT, Program on Sustainable Infrastructure Page 28
5. Green Power
In 2005, the City of Durango purchased 63 blocks of green power for the months of November
and December. One block of green power equates to 100 kilowatt hours of electricity, and
costs roughly .80 cents. The cost includes 100 kilowatt hours of electricity as well as a
contribution to renewable energy rebate programs for local residents. In 2008, the City of
Durango further expanded its green power purchases. The green power program purchases
were subtracted from the City’s total emissions. Without the green power purchases total
emissions increased by 11%. Including the green power purchases, results in a 40% reduction in
total emissions between 2005 and 2008.
Table 8. Green Power Offsets
Major Sector
2005 (mt-
CO2e) 2008
(mt-CO2e)
2005-2008 % Change
2008 % of Total
Emissions
Buildings & Facilities
9,807
11,015 11% 75%
Transportation
2,137
2,635 23% 18%
Materials and Waste
852
950 11% 7%
Total
13,001
14,582 11%
Green Power Purchases (mt-CO2e) 0.5
6,784
Total w/G. Power Offsets (mt-CO2e) 12,796
7,654 -40%

Sustainable Energy Benchmarking and Greenhouse Gas Accounting: City of Durango Municipal Government Operations
University of Colorado Denver, IGERT, Program on Sustainable Infrastructure Page 29
6. Conclusions:
Status of Durango’s Path toward Greening Government Goals:
Table 9. Greening of Government Goals
Greening Government State Goal
City of Durango Status
(2005-2008)
Energy use: 20% Reduction 11% Increase
Vehicle fuel consumption: 25% Reduction 25% Increase**
*Water data is city-wide (not isolated for municipal government operations).
**Based of combined gallons of gasoline, diesel, and propane.
By performing a Sustainable Energy Benchmarking Analysis and Greenhouse Gas Inventory, the
City has undertaken the first step to reducing greenhouse gas emissions. The GHG Inventory
for 2005 and 2008 provides valuable baseline data for the City to assess and identify strategic
focal areas for emission reduction initiatives. The next step in the sustainable energy planning
process is to prioritize actions for a Climate Action Plan.

Sustainable Energy Benchmarking and Greenhouse Gas Accounting: City of Durango Municipal Government Operations
University of Colorado Denver, IGERT, Program on Sustainable Infrastructure Page 30
Works Cited
1. EPA. Inventory of U.S. Greenhouse Gas Emissions and Sinks: 1990-2005. Table: 1-5. [Online]
2007. http://www.epa.gov/climatechange/emissions/usinventoryreport.html.
2. Colorado, State of. Greening of State Government Executive Orders D011 07 and D012 07.
http://www.colorado.gov. [Online] 2007.
3. DOLA. Colorado Department of Local Affairs. Information and Publications/ Population
Data/Estimates. [Online] 2009.
http://www.dola.state.co.us/dlg/demog/population/estimates/Table5-07final.pdf.
4. Durango, City of. [Online] 2009.
5. Ramaswami, Anu. A Demand-Centered, Hybrid Life-Cycle Methodology for City-Scale
Greenhoue Gas Inventorie. Environmental Science and Technology. 2008, Vol. 42, 17, pp. 6455-
6461.
6. WRI. The Greenhouse Gas Protocol: A Corporate Accounting and Reporting Standard.
[Online] 2004. http://www.ghgprotocol.org.
7. NCDC. National Climatic Data Center. Land-Based Data. [Online] 2009.
http://www7.ncdc.noaa.gov/CDO/CDODivisionalSelect.jsp#.
8. Tri-State Generation . Electricity Generation Energy Mix. s.l. : Jonathan Beyer, 2007.
9. EIA. EIA 1605 Instructions: Voluntary Reporting of Greenhouse Gas Emissions. Appendix H of
Form EIA-1605: Fuel Emission Factors . [Online] 2007.
http://www.eia.doe.gov/oiaf/1605/pdf/EIA1605_Instructions_10-23-07.pdf.
10. ICLEI. International Local Government GHG Emissions Analysis Protocol. [Online] September
2008. http://www.iclei.org/index.php?id=8154.
11. eGRID. Emissions and Generation Resourse Integrated Database. [Online] 2006.
http://www.epa.gov/cleanenergy/energy-resources/egrid/index.html.
12. ANI, Argonne National Laboratory. The Greenhouse Gases, Regulated Emissions, and
Energy Use in Transportation. [Online] 2005.
13. IPCC and McCann. Annexx 3.2 Methodology for Industrial Processes. National Inventory
Report: Information on Greenhouse Gases Sources and Sinks in Canada (1990-2005). [Online] .
http://www.ec.gc.ca/pdb/ghg/inventory_report/2005_report/a3_2_eng.cfm.

Sustainable Energy Benchmarking and Greenhouse Gas Accounting: City of Durango Municipal Government Operations
University of Colorado Denver, IGERT, Program on Sustainable Infrastructure Page 31
14. GWI. The Green PDF Revolution. [Online]
http://www.greenpdf.com/graphics/TheGreenPDFRevolution.pdf.
15. RFU. Clean Paper Consumer Information. Reach for Unbleached Foundation. [Online]
http://www.rfu.org/cp/paperguide.htm.
16. EIO-LCA. Economic Input-Output Life Cycle Assessment; . [Online] Green Design Institute,
Carnegie Mellon University: Pittsburgh, PA , 2006. http://www.eiolca.net.
17. NREL. National Renewable Energy Laboratory. Life Cycle Inventory Database. [Online]
http://www.nrel.gov/lci/database/.
18. WARM. WAste Reduction Model. [Online] U.S. Environmental Protection Agency.
http://www.epa.gov/climatechange/wycd/waste/calculators/Warm_home.html.
19. NCDC. National Climate Data Center. Durango and 14th Street Weather Station. [Online]
2009. http://www4.ncdc.noaa.gov/cgi-win/wwcgi.dll?wwDI~StnSrch~StnID~20003376.
20. IPCC and McCann. Annex 3.2 Methodology for Industrial Processes. National Inventory
Report: Information on Greenhouse Gases Sources and Sinks in Canada (1990-2005). [Online]
http://www.ec.gc.ca/pdb/ghg/inventory_report/2005_report/a3_2_eng.cfm.