sustainable disposal cell covers: legacy management
TRANSCRIPT

DOE LM/GJ1156-2006 ESL–RPT–2006–02
White Paper
Sustainable Disposal Cell Covers: Legacy Management Practices,
Improvements, and Long-Term Performance
March 2006
Work Performed by S.M. Stoller Corporation under DOE Contract No. DE–AC01–02GJ79491 for the U.S. Department of Energy Office of Legacy Management, Grand Junction, Colorado


U.S. Department of Energy Sustainable Disposal Cell Covers: LM Practices, Improvements, and Long-Term Performance March 2006 Doc. No. S0224000 Page iii
Signature Page
Sustainable Disposal Cell Covers: Legacy Management Practices,
Improvements, and Long-Term Performance
March 2006 Prepared By: ____________________________________________________ Jody Waugh Environmental Sciences Laboratory* Reviewed By: _________________________________________
Clay Carpenter, Manager Land Management, S.M. Stoller Corporation
Approved By: __________________________________________ Rich Bush, Site Manager U.S. Department of Energy Office of Legacy Management *The Environmental Sciences Laboratory is operated by S.M. Stoller Corporation for the U.S. Department of Energy Office of Legacy Management, Grand Junction, Colorado.


U.S. Department of Energy Sustainable Disposal Cell Covers: LM Practices, Improvements, and Long-Term Performance March 2006 Doc. No. S0224000 Page v
Contents
Signature Page ............................................................................................................................... iii 1.0 Introduction ............................................................................................................................1 2.0 Design and LTS&M of Covers: State of the Practice ............................................................2
2.1 Regulatory Framework .................................................................................................2 2.2 Evolution of UMTRCA Cover Designs .......................................................................3
2.2.1 Early Designs .....................................................................................................3 2.2.2 Low-Permeability Designs.................................................................................4 2.2.3 Alternative Designs............................................................................................4
2.3 Current LTS&M of Disposal Cells...............................................................................5 2.3.1 Site Inspections ..................................................................................................5 2.3.2 Ground Water Monitoring .................................................................................5 2.3.3 Maintenance and Corrective Actions.................................................................6
3.0 Recommendations for Improving LTS&M of Disposal Cell Covers ....................................6 3.1 Monitor Hydrological Performance of Covers .............................................................6
3.1.1 Ground Water Monitoring of Disposal Cell Performance.................................7 3.1.2 Monitoring Covers as Early Warning Indicators ...............................................7
3.2 Evaluate Cover Design Renovations ............................................................................8 3.2.1 Performance of Low-Permeability Covers ........................................................8 3.2.2 Differing Roles of Plants on Covers ..................................................................9 3.2.3 Steps for Evaluation and Implementation of Cover Renovations....................11
3.3 Develop Long-Term Cover Performance Evaluation Methods..................................14 3.3.1 Long-Term Performance Evaluation Steps......................................................15 3.3.2 Natural Analogs of Long-Term Change ..........................................................16
3.4 Review Disposal Cell Designs and Monitoring Plans Prior to Closure .....................18 4.0 References ............................................................................................................................19
Table Table 1. Illustration of Risk/Cost Comparison for Vegetation Management Options ................. 12
Appendixes Appendix A. Case Study: Risk-Based Performance Evaluation at Burrell, Pennsylvania Appendix B. Case Study: Forensic Investigation of the Permeability of a Compacted Soil Layer Appendix C. Case Study: Possible Future Climate States at the Monticello, Utah, Site Appendix D. Case Study: Soil Morphology and Hydrology of Analog Sites for the Monticello,
Utah, Disposal Cell Cover

Sustainable Disposal Cell Covers: LM Practices, Improvements, and Long-Term Performance U.S. Department of Energy Doc. No. S0224000 March 2006 Page vi
Appendix E. Case Study: Use of Archaeological Analogs to Anticipate Long-term Performance of Modern Landfill Cover Designs

U.S. Department of Energy Sustainable Disposal Cell Covers: LM Practices, Improvements, and Long-Term Performance March 2006 Doc. No. S0224000 Page 1
1.0 Introduction The U.S. Department of Energy (DOE) Office of Legacy Management (LM) prepared a Strategic Plan (DOE 2004a) “. . . to make sure that our environmental remedies are working and will continue to protect future generations.” One of LM’s objectives, as stated in the Strategic Plan, is to “. . . provide continuous improvement in the effectiveness of long-term surveillance and maintenance (LTS&M) . . .” To accomplish this, the Strategic Plan states that LM will “. . . track and use advances in science and technology to improve sustainability and ensure protection.” The Strategic Plan also states that LM will use two indicators to measure success with respect to improving the effectiveness of LTS&M and the sustainability of remedies: 1) “Reduction in the cost of effectively operating, monitoring, and maintaining environmental remedies,” and 2) “Risk prevention to human health and environment [is] maintained or improved.” This white paper explores changes in strategies and applications of science and technology that may improve LTS&M and the sustainability of disposal cell covers at LM sites. There are two major sections: “2.0, Design and LTS&M of Covers: State of the Practice,” and 3.0, “Recommendations for Improving LTS&M.” The State of the Practice section reviews the regulatory framework for covers at most LM sites, the evolution of cover designs, and current LTS&M practices. The following recommendations for improving LTS&M strategies and practices for covers could reduce costs and the probability of risk to humans and the environment over the long term. These recommendations are based on lessons learned; results of cover performance evaluations by DOE, U.S. Environmental Protection Agency (EPA), and others; application of sound vegetation management practices; and recent advances in the science and technology of cover systems. Monitor and Model Hydrological Performance of Covers. The current strategy of monitoring ground water as an indicator of the hydrological performance of disposal cells does not provide the early warning necessary to implement corrective actions such as repairing or renovating covers. This strategy could result in significant increases in LTS&M costs at sites where ground water protection is required. Alternatively, direct monitoring and modeling of the hydrological performance of covers could provide an early warning if disposal cells are not performing as expected so that corrective actions could be implemented before contaminants reach ground water. Evaluate Cover Design Renovations. Existing LM covers that rely on compacted soil layers to limit water infiltration may fall short of permeability targets because of plant root intrusion and soil development processes. Plant establishment and root intrusion on covers are predictable consequences of natural ecological succession. Costs for herbicide spraying, used at many sites in an attempt to limit plant establishment and root intrusion, will continue to increase as ecological conditions of covers become more favorable for plant growth over time. LM should consider whether to continue herbicide spraying, to discontinue spraying and allow plant succession to progress naturally, or to enhance plant establishment and growth, thereby accelerating transformation to evapotranspiration (ET) type covers. The goal of accelerating this transformation—or cover renovation—is to accommodate inevitable ecological processes and thereby sustain a high level of performance with little maintenance. A stepwise approach is recommended that includes identifying high-priority sites, evaluating beneficial and detrimental

Sustainable Disposal Cell Covers: LM Practices, Improvements, and Long-Term Performance U.S. Department of Energy Doc. No. S0224000 March 2006 Page 2
effects of vegetation, analyzing risks and costs of LTS&M options, conducting fields tests of renovation designs, implementing renovations where warranted, and managing renovated covers as part of comprehensive vegetation management plans that include controlling weed infestations on parcels surrounding disposal cells. Develop Long-Term Performance Evaluation Methods for Covers. Notwithstanding longevity standards of 200 to 1,000 years for most LM disposal cells, current LTS&M strategies do not include evaluations of the effects of natural processes (e.g., climate change, soil development, ecological succession) on the performance and sustainability of covers. A strategy linking monitoring, risk-based performance models, and natural analog studies should be created to evaluate long-term performance scenarios. The strategy would involve developing reasonable future environmental scenarios for a site based on evidence from natural analogs, constructing probabilistic models of cover performance for future scenarios, performing sensitivity and uncertainty analyses, calculating the probability of meeting performance objectives for future scenarios, and monitoring performance and reaffirming long-term performance projections as part of LTS&M for the site. Review Disposal Cell Designs and Monitoring Plans Prior to Closure. LM and its stakeholders have a vested interest in sustainable remedies. Therefore, LM should have a pre-closure role in reviewing the design and implementation of remedies at sites that will be transferred to LM for LTS&M. LM should (1) review the sustainability of disposal cell designs, (2) provide performance monitoring recommendations prior to construction, (3) review the quality of materials and installation of monitoring instrumentation during construction, and (4) participate in verification monitoring of the disposal cell prior to transfer of the site for LTS&M. This involvement would better enable LM to interact with DOE offices and their contractors who are responsible for closure and to prepare more efficacious Long-Term Surveillance Plans before sites are transferred.
2.0 Design and LTS&M of Covers: State of the Practice Most disposal cells currently managed by LM were constructed under the Uranium Mill Tailings Radiation Control Act (UMTRCA) of 1978. The regulatory framework established design-based performance standards for the project. The cover design philosophy has undergone significant changes since the initial designs. Cover designs evolved to reflect changes in U.S. Environmental Protection Agency (EPA) standards and changes in politics, economics, and the state of the science (Waugh et al. 2001). 2.1 Regulatory Framework Authorized by UMTRCA, DOE established the Uranium Mill Tailings Remedial Action Project (UMTRA) to stabilize, dispose of, and control uranium mill tailings and other contaminated materials at inactive uranium ore processing sites. This act also (1) directed EPA to establish cleanup performance standards and to mandate remedial actions in accordance with the standards, (2) charged the U.S. Nuclear Regulatory Commission (NRC) to license the disposal facilities, and (3) directed DOE to provide long-term care.

U.S. Department of Energy Sustainable Disposal Cell Covers: LM Practices, Improvements, and Long-Term Performance March 2006 Doc. No. S0224000 Page 3
In 1983, EPA issued performance standards for the cleanup of inactive uranium mill sites (EPA 1983). Performance standards were established initially only for longevity and radon attenuation. The longevity standard was set at 1,000 years whenever reasonably achievable, with a minimum performance period of 200 years. The radon standard requires reasonable assurance that releases of radon-222 to the atmosphere will not exceed an average surface flux rate of 20 pCi m2 s–1 or will not increase annual average concentration in the air at any location outside the disposal site by more than 0.5 pCi L–1. In 1985, the 10th Circuit Court of Appeals set aside the ground water provisions of the act and remanded them to the EPA. In 1987, EPA published draft ground water standards in response to the 1985 ruling. In April 1989, DOE began incorporating the draft performance standards for water quality under the assumption that the standards would soon become final. In 1995, EPA published 60 Federal Register 2854 (EPA 1995), which requires that remedial action be conducted to ensure that the amounts of radioactive and associated hazardous constituents in ground water derived from uranium mill tailings meet certain concentration standards. 2.2 Evolution of UMTRCA Cover Designs 2.2.1 Early Designs Before ground water quality standards for UMTRCA sites were promulgated, the design process focused on the radon attenuation and longevity standards. These early designs consisted basically of three layers: (1) a compacted soil layer (CSL) or radon barrier overlying the tailings, (2) a rock riprap layer at the surface, and (3) and a layer of coarse sand or gravel sandwiched between the CSL and riprap. The cover on the Shiprock, New Mexico, disposal cell is an example of an early UMTRCA design. NRC accepted calculations of radon attenuation using the computer program RADON (NRC 1989) as a basis for compliance. The mathematical model implemented in RADON describes one-dimensional, steady-state radon diffusion through a two-phase multilayer system. The RADON program requires input data on the following properties of the tailings and cover layers: layer thickness, dry bulk density, porosity, moisture content, radium-226 activity, and radon-222 emanation coefficient. The factors that most influence radon flux are the soil moisture content of the CSL, the radon diffusion coefficient for the CSL, radium-226 activity in the tailings, and the radon-222 emanation fraction for the tailings (Smith et al. 1985). At drier sites, radon flux is particularly sensitive to the CSL water content and porosity because radon diffusion is elevated when interconnected pore spaces are filled with air (NRC 1989). RADON calculates porosity as a function of the dry-weight bulk density. NRC considers the long-term soil water content of the CSL to be the parameter that introduces the greatest uncertainty in radon attenuation calculations. In the absence of field data, NRC accepts the soil water content at which permanent wilting occurs as a reasonable value of the long-term soil water content. The permanent wilting point used by the UMTRA Project for design calculations is -15 bars (DOE 1989). The thickness of the CSL was computed by a trial-and-error procedure until the calculated radon flux at the surface was less than 20 pCi m2 s–1. With this procedure, the necessary thickness of the CSL could be minimized if materials with low radium-226 activity were placed as the upper tailings layer.

Sustainable Disposal Cell Covers: LM Practices, Improvements, and Long-Term Performance U.S. Department of Energy Doc. No. S0224000 March 2006 Page 4
The rock riprap layer was designed to protect the underlying CSL and tailings from erosion; the coarse sand was designed to act as a bedding layer for the rock and as a drainage layer to shed precipitation to the toe slopes of the disposal cell. The design process for the rock riprap centered on the erosion potential and the 1,000-year longevity standard. The rock armor was sized to prevent erosion of underlying layers given a probable maximum precipitation event, the most severe combination of meteorological and hydrological conditions possible at a site (DOE 1989). The selection of stone for the riprap layer was based on conservative rock durability standards and tests provided by NRC (1990) to ensure survivability of the armor. 2.2.2 Low-Permeability Designs After EPA published draft ground water quality standards in 1987, the UMTRA Project refined the cover design approach and placed greater emphasis on designing low-permeability CSLs (DOE 1989). An increasing body of literature suggested that CSL permeabilities achieved in the field were much greater than those predicted by laboratory tests. In the laboratory, CSL permeability is primarily a function of the microporosity of the soil matrix. In the field, saturated flow follows cracks, essentially bypassing the soil matrix. Daniel (1984), Smith et al. (1997), and others reported several possible reasons why CSL permeability is typically much greater in the field than in the laboratory: compaction of the CSL at less than the optimum water content, insufficient breaking up of the natural soil structure, inadequate bonding between lifts, desiccation and freeze-thaw cracking, and biointrusion. In 1989, the UMTRA Project informally adopted a standard specified in the Resource Conservation and Recovery Act of 1976 (RCRA) for designing low-permeability caps for disposal of hazardous waste in shallow-land burial facilities. RCRA guidance requires a CSL with a saturated hydraulic conductivity less than 1 × 10⁻⁷ centimeters per second (cm s−1) and that is equal to or less permeable than the liner material underlying the tailings (EPA 1989). The latter requirement was intended to prevent water from ponding, or “bathtubbing,” in the tailings. UMTRA Project design guidance suggested that this low conductivity could be achieved with either highly compacted native soil or bentonite-amended soil (DOE 1989). The new guidance also provided a framework or checklist for selecting and designing cover components based on site-specific needs. This approach gave options for including components intended to protect the CSL from processes that could increase permeability, such as freeze-thaw cracking and biointrusion. The cover on the disposal cell at Estes Gulch near Rifle, Colorado, is an example of a low-permeability cover. 2.2.3 Alternative Designs Advances in the science of cover performance and lessons learned from monitoring early covers contributed to the development of alternatives to low-permeability designs. In general, low-permeability covers attempt to resist natural processes rather than work with them and will likely require increasing levels of maintenance or retrofitting in the future (Clarke et al. 2004). The goal of alternative cover designs is to accommodate and enhance beneficial natural processes. For example, in many arid and semiarid ecosystems, relatively low precipitation, high potential ET, and thick unsaturated soils limit recharge (Gee and Tyler, 1994). Alternative covers that mimic this natural water conservation may provide long-term hydrological isolation of subsurface contaminants (Winograd, 1981; Reith and Thompson, 1992). Alternative covers

U.S. Department of Energy Sustainable Disposal Cell Covers: LM Practices, Improvements, and Long-Term Performance March 2006 Doc. No. S0224000 Page 5
generally consist of thick, fine-textured soil layers that store precipitation in the root zone where ET seasonally removes it (Anderson et al., 1993; Link et al., 1994; Ward and Gee, 1997; EPA, 2003). Capillary barriers consisting of coarse-textured sand and gravel placed below this soil “sponge” can enhance water storage and limit unsaturated flow (Stormont and Anderson 1998; Khire et al. 2000). The Monticello, Utah, disposal cell cover and the top slope of the Durango, Colorado, disposal cell cover contain components of alternative ET-type designs. 2.3 Current LTS&M of Disposal Cells Most sites currently managed by LM that have disposal cells are mill tailings sites remediated under Title I and Title II of UMTRCA. LM conducts LTS&M activities under a general license granted by the NRC in accordance with Title 10 Code of Federal Regulations Parts 40.27 (for Title I sites) and 40.28 (for Title II sites). LTS&M activities at these sites include, in general, site inspections, maintenance, monitoring, institutional controls, corrective actions, and administrative functions such as records management, stakeholder relations, and regulatory interactions. LTS&M of disposal cells consists of annual inspections, ground water monitoring (in most cases), maintenance, and corrective actions in accordance with site-specific Long-Term Surveillance Plans (LTSPs). LTSPs contain methods and procedures established by DOE and approved by NRC to verify compliance with license requirements (DOE 2001). 2.3.1 Site Inspections Site inspections are performed to verify the integrity of visible surface features; to identify changes or new conditions in surface features that may affect the long-term performance of the disposal cell; and to determine the need (if any) for maintenance, follow-up inspections, or corrective actions with respect to the condition of visible surface features (e.g. DOE 2004b, 2004c). Inspections are also intended to detect progressive changes in visible surface features over several years that may occur as a result of slow-acting natural processes (DOE 2001). This is accomplished by comparing inspection findings to baseline conditions as recorded in the completion reports. Results of follow-up investigations have led to revisions of LTSPs. The Burrell, Pennsylvania, site is an example. At Burrell, the LTSP required annual herbicide applications to control plant encroachment of the cover. A follow-up investigation found that root intrusion had indeed increased the permeability of the cover (Waugh and Smith 1997). However, a subsequent risk-based performance assessment found that the increased cover permeability was highly unlikely to increase risks to human health and the environment (Waugh et al. 1999). As a result, NRC accepted a revised LTSP that allows plants to grow without further intervention, thus significantly reducing annual maintenance costs (see Appendix A). 2.3.2 Ground Water Monitoring At disposal sites requiring ground water and surface water monitoring, water sampling and analysis plans are included in the LTSPs (DOE 2001). The LTSP specifies the frequency, extent, and locations of monitoring. Monitoring data are intended to demonstrate whether concentrations of ground water constituents are in compliance with license requirements. Monitoring data are also needed for evaluations of the performance of active and passive ground water remedies including pump-and-treat systems, permeable reactive barriers, natural flushing, and other

Sustainable Disposal Cell Covers: LM Practices, Improvements, and Long-Term Performance U.S. Department of Energy Doc. No. S0224000 March 2006 Page 6
natural attenuation remedies such as phytoremediation, bioremediation, and natural geochemical processes (DOE 2005). Hydrological performance of disposal cell covers is not measured directly but assumed to be functioning properly based on stringent cover design criteria and the results of ground water monitoring. Ground water monitoring data are intended as an indirect means of determining if the disposal cell is functioning as designed with respect to limiting water movement into tailings (DOE 2001). This strategy is based on the assumption that if the cover allows significant flux of rainwater into tailings and subsequent mobilization and leaching of tailings constituents into an underlying aquifer, then this breach will result in an increase in levels of tailings constituents in the aquifer as measured in samples from hydraulically down-gradient monitor wells. 2.3.3 Maintenance and Corrective Actions The LTSP for a site identifies routine maintenance activities considered necessary to keep the disposal cell functioning as designed (DOE 2001). The LTSP also specifies certification and reporting requirements to document that the maintenance activities are completed in accordance with specifications for the work. LTSPs also contain provisions for non-routine or unscheduled maintenance activities and corrective actions. Routine maintenance activities conducted in 2004 included erosion control, fence repairs, sign replacements, and vegetation and noxious weed control (DOE 2004b & c).
3.0 Recommendations for Improving LTS&M of Disposal Cell Covers
The LM Strategic Plan, Managing Today’s Change, Protecting Tomorrow’s Future (DOE 2004a), states that LM will use advances in science and technology to improve the effectiveness of LTS&M practices and the sustainability of remedies at LM sites. This section provides four recommendations for improving LTS&M of disposal cell covers. The recommendations are based on (1) lessons learned during several years of inspecting, monitoring, and maintaining covers; (2) results of follow-up investigations and studies at several sites; (3) application of accepted land management practices to LTS&M of disposal cells; and (4) advances in science and technology with respect to cover designs, monitoring methods, and long-term performance evaluations. 3.1 Monitor Hydrological Performance of Covers The current strategy for monitoring the hydrologic performance of disposal cells relies on ground water sampling and analysis of constituents in samples from wells downgradient of the disposal cell. This strategy assumes that detection or elevation of tailings constituents in ground water samples could indicate that the cover is allowing rainwater to pass into tailings, leaching contaminants into the underlying aquifer. Depending on the compliance strategy for a given site, this retrospective approach (after-the-fact detection of cover percolation) may produce ambiguous results with no clear recourse. An alternative strategy involves direct monitoring and modeling of the hydrological performance of covers as an early warning that disposal cells are not performing as expected so that corrective actions can be implemented before contaminants reach ground water. This strategy applies only to sites where ground water protection is required

U.S. Department of Energy Sustainable Disposal Cell Covers: LM Practices, Improvements, and Long-Term Performance March 2006 Doc. No. S0224000 Page 7
(DOE 2005). The strategy includes (1) prioritization of sites based on potential risks where performance of the cover matters, (2) identification of monitoring parameters that are the best measures of performance (e.g., percolation flux), and (3) clear performance goals as the basis for decisions concerning the need for corrective actions. 3.1.1 Ground Water Monitoring of Disposal Cell Performance Shiprock, New Mexico; Lakeview, Oregon; and Durango, Colorado are examples of potential problems with the retrospective monitoring approach. At Shiprock, New Mexico, where active remedies for ground water contamination are under way (DOE 2004d), the current monitoring strategy does not differentiate transient water in tailings from rainwater percolating through the cover. Monitoring water flux through the cover is needed to evaluate containment of the source and the long-term efficacy of ground water remedies. Ground water remediation could be problematic if percolation through the cover causes long-term source loading of the plume. The Lakeview, Oregon, disposal cell was constructed overlying an uncontaminated aquifer. The aquifer flows at a depth between 20 and 40 feet (ft) below the floor of the disposal cell (DOE 1994). Point-of-compliance (POC) wells in the uppermost aquifer are monitored once every 5 years (DOE 2004b). Results of the 2004 sampling indicated that concentrations of tailings constituents remained below regulatory limits and unchanged during the last 5-year period. However, a cover performance evaluation has shown that the hydraulic conductivity of the cover is several orders of magnitude above the design target (Waugh 2004a), potentially allowing significant percolation of rainwater into tailings. The Durango, Colorado, disposal cell was also constructed overlying an uncontaminated aquifer. As at Lakeview, ground water is monitored in samples from downgradient POC wells “to verify the initial performance of the disposal cell.” (DOE 2004b) In samples collected from one POC well, uranium concentrations increased substantially in 2004. It is unknown if the increase is related to transient drainage, cover percolation, or another source. At these and other sites where ground water protection is required, detection or elevation of contaminant levels in samples from POC wells may indicate that the cover is not functioning adequately. If clean aquifers become contaminated at sites where human health or environmental risks of are of concern, LTS&M costs could escalate, especially if ground water remedies need to be initiated for previously uncontaminated aquifers. 3.1.2 Monitoring Covers as Early Warning Indicators Ground water monitoring as a retrospective measure of the hydrologic performance of disposal cells does not provide the early warning necessary to implement corrective actions, such as timely and cost-effective repair or renovation of covers. Direct monitoring of disposal cell covers could provide early warning—as a leading indicator of performance—so that corrective actions could be implemented before contaminant levels rise, thus avoiding high-cost-to-repair scenarios (e.g., DOE 2002). Monitoring the performance of as-built cover systems at sites where the risks and costs of a cover failure are high will require instrumentation and strategies that can reliably detect spatial and temporal changes in performance parameters. Percolation flux is the key parameter. Most methods and instrumentation for monitoring percolation flux through covers, such as water

Sustainable Disposal Cell Covers: LM Practices, Improvements, and Long-Term Performance U.S. Department of Energy Doc. No. S0224000 March 2006 Page 8
budget methods and Darcy calculations, are indirect, tedious, and usually highly uncertain (Waugh 2005). Direct methods for monitoring percolation flux using pan lysimeters can be biased because of divergence of flow past the edges of the lysimeter. Large embedded lysimeters such as the 3-hectare lysimeter constructed at the Monticello, Utah, site are highly reliable but are expensive and impractical to install at most sites. Water flux meters are a new technology that may satisfy current and future LM needs for monitoring percolation flux in covers. Water flux meters are passive wick-type lysimeters that can be installed within or below a cover and are capable of directly monitoring unsaturated water fluxes ranging from less than 10 millimeters per year (mm yr−1) to more than 1,000 mm yr−1 (Gee et al. 2002). Water flux meters could be installed to verify performance either during or after construction, or to check performance if leading indicators of degradation are observed during LTS&M inspections. The greatest sources of uncertainty in monitoring percolation flux with water flux meters stem from the effects of natural heterogeneity, scale of preferential flow, and installation disturbances on soil hydraulic properties. A demonstration of water flux meters in the Lakeview, Oregon cover was installed in fall of 2005. 3.2 Evaluate Cover Design Renovations Most existing LM disposal cell covers rely on the low permeability of a CSL to limit water movement into underlying waste. As designed and constructed, many existing covers do not meet permeability targets. Some designs inadvertently create habitat for deep-rooted plants. Plant root intrusion and soil development have increased the saturated hydraulic conductivity of many CSLs several orders of magnitude above design targets. Therefore, at some sites, the low-permeability requirements may not be achievable or may require high levels of maintenance to sustain long-term performance. LTS&M practices at many sites include herbicide spraying to control plant establishment and root intrusion on covers. Herbicide application costs will continue to increase as ecological conditions become more favorable for plant growth. An alternative evapotranspiration ET cover design advocated by EPA (2003) and ITRC (2003), and installed at Monticello by DOE (Waugh and Richardson 1997, Berwick et al., 2000), relies on a thick soil sponge layer to store precipitation while plants are dormant and on evapotranspiration to dry the soil sponge during the growing season (see Section 2.2.3). Alternative covers can be designed and constructed to accommodate ecological processes and thereby sustain a high level of performance with little maintenance. Left unabated, natural ecological processes will eventually transform all existing low-permeability covers into ET-type covers. LM should evaluate the risks and costs of an LTS&M strategy that accelerates vegetation establishment and ET as a means for renovating low-permeability covers. 3.2.1 Performance of Low-Permeability Covers Existing data suggest that many low-permeability cover designs, once constructed, are not performing as expected. In some cases, experimental covers have been effective in limiting infiltration and percolation for the first few years after construction (e.g., Albright et al. 2004). Earlier EPA and DOE design guidance, and hence most existing EPA and DOE covers, rely on the low permeability of CSLs to limit percolation into buried waste (EPA 1989, DOE 1989). Although design targets and performance standards for CSLs vary, typically, the goal is a saturated hydraulic conductivity (Ksat) of less than 1 × 10⁻⁷ cm s−1. Multiple lines of evidence,

U.S. Department of Energy Sustainable Disposal Cell Covers: LM Practices, Improvements, and Long-Term Performance March 2006 Doc. No. S0224000 Page 9
including EPA and DOE field studies, laboratory studies, and monitoring data show that many existing CSLs fall short of the low-permeability targets and standards, often at the time of or shortly after construction and sometimes by several orders of magnitude (Daniel 1994, Melchoir 1994,1997, Benson et al. 1999, Albright et al. 2004). Several reasons are cited below. (Appendix B presents a forensic case study of a CSL that developed preferential flow in the short term.) Some of the factors influencing performance of low-permeability covers include,
• Unanticipated ecological consequences of designs that encourage biointrusion (Hakonson et. al. 1986 1992, Suter et al. 1993, Bowerman and Redente 1998).
• Compaction either dry or wet of optimum during construction (Daniel 1994, Benson et al. 1999).
• Desiccation cracking (Boyton and Daniel 1984, Daniel 1994, Benson et al. 2004).
• Differences between laboratory- and field-determined hydraulic conductivities (Rogowski 1990).
• Freeze-thaw cracking (Kim and Daniel 1992, Benson and Othman 1993).
• Differential settlement (Jessberger and Stone 1991, LaGatta 1992, Daniel 1994).
• Retention of borrow soil structure (clods) during construction and pedogenesis (soil development processes) after construction (Benson and Daniel 1990, Albright 2004, Benson et al. 2004).
Beginning in the mid-1990s, DOE requested assistance in evaluating the effects of biointrusion and other disturbances on the permeability of UMTRCA covers that rely on rock-armored CSLs (DOE 2004b, c; and all LTSM annual reports since the mid-1990s). Studies of these covers were warranted given the state of the science, UMTRCA Project guidance that allows cover performance monitoring (DOE 1989), and the evolution of UMTRCA covers toward alternative designs (Waugh et al. 2001). Results of these investigations of six UMTRCA covers (e.g. Waugh et al. 1999, Glenn and Waugh 2001, Waugh et al. 2001, Waugh 2004) support the following conclusions and indicate that UMTRCA covers designed to rely on CSLs to control water infiltration also may not have achieved permeability targets:
• Rock armor acts as a mulch, reducing evaporation (Groenevelt et al., 1989), increasing soil water storage (Kemper et al. 1994), and consequently creating habitat for woody plants.
• High water content and higher than expected permeability (mean Ksat = 1 × 10⁻⁵ to 1 × 10⁻⁴ cm/s) in covers with CSLs raise concerns about seepage from disposal cells.
• Observed causes of preferential flow include root intrusion, freeze-thaw cracking, seasonal desiccation, well-developed structure of borrow soils, and other soil development processes.
3.2.2 Differing Roles of Plants on Covers Even with no human interference, ecological development on covers is inevitable and may alter the functional performance of disposal cells in ways not initially anticipated. Plant communities develop and change in response to several interacting factors: propagule accessibility, climatic variability, changes in soil characteristics, disturbances such as fire, and species interactions such as herbivory, competition, or fluctuations in soil microbe populations. Plant community dynamics are manifested by shifts in species composition, vegetation abundance, and species

Sustainable Disposal Cell Covers: LM Practices, Improvements, and Long-Term Performance U.S. Department of Energy Doc. No. S0224000 March 2006 Page 10
diversity and may be accompanied by changes in rates of nutrient cycling, energy exchange, and water use. A key LTS&M issue is whether deep-rooted plants that establish on covers with CSLs will increase or decrease the likelihood of contaminant discharge. This issue can be argued two ways. Decaying plant roots may create conduits through which water and gases readily pass, thus increasing permeability and downward flow. Conversely, extraction of soil water from the cover by plants (transpiration) may significantly decrease recharge if habitat characteristics are manipulated to favor the establishment and resilience of a diverse plant community. Potential Detrimental Effects of Plants Plants can root through soil covers into underlying tailings, disseminating contaminants in aboveground tissues. Plants rooted in uranium mill tailings may contain elevated levels of uranium, molybdenum, selenium, radium-226, thorium-230, and polonium 210 (Clulow et al. 1991, Dreesen and Williams 1982, Hosner et al. 1992, Lapham et al. 1989, Markose et al. 1993). Radon-222 can be transported into the atmosphere as plant roots extract water from tailings (Lewis and MacDonell 1990, Morris and Fraley 1989). Roots may also alter waste chemistry, potentially mobilizing contaminants (Cataldo et al. 1987). Root intrusion can also physically degrade covers. Evidence suggests that covers with CSLs are vulnerable to desiccation and cracking from wet-dry cycles, freeze-thaw cycles, and biointrusion (Melchior et al. 1994, Kim and Daniel 1992). Macropores left by decomposing plant roots can act as channels for water and gases to rapidly bypass the soil mass in CSLs. Plant roots also tend to concentrate in and extract water from CSLs, causing desiccation and cracking. This degradation can occur even when overlying soils are nearly saturated (Hakonson 1986), indicating that the rate of water extraction by plants may exceed the rehydration rate of the compacted clay. In addition, roots may clog lateral drainage layers (DOE 1992), potentially increasing rates of infiltration through the underlying compacted soil. Potential Benefits and Goals of Plant Establishment As discussed in Section 2.2.3 “Alternative Designs”, the climate and ecology of arid and semiarid sites (relatively low precipitation and high potential ET), where thick unsaturated soil layers occur are beneficial for long-term hydrologic isolation of buried waste. As with other components of cover systems at these sites, the plant community may need to be “engineered” to achieve performance goals. Vegetation that is allowed to establish or is planted on low-permeability covers should have several attributes: (1) well-adapted to the engineered soil habitat, (2) capable of high transpiration rates, (3) limits soil erosion, and (4) structurally and functionally resilient. The plant establishment goal should be to emulate the structure, function, diversity, and dynamics of native plant communities in the area. Currently seeding of monocultures or low-diversity mixtures on engineered covers is common. Diverse plant communities consist of a mosaic of many species that structurally and functionally change in response to disturbances and environmental fluctuations. Diverse mixtures of native and naturalized plants will maximize water removal and remain more resilient given variable and

U.S. Department of Energy Sustainable Disposal Cell Covers: LM Practices, Improvements, and Long-Term Performance March 2006 Doc. No. S0224000 Page 11
unpredictable changes in the environment resulting from pathogen and pest outbreaks, disturbances, and climate fluctuations. Local indigenous ecotypes that have been selected over thousands of years are usually best adapted to climatic changes and biological perturbations. In contrast, exotic grass plantings common on disposal cell covers are genetically and structurally rigid and, thus, are more vulnerable to disturbance or eradication by single factors. Conversely, in some cases, non-native, naturalized species have broader ecological tolerances, are more readily established in disturbed and engineered soils, grow more rapidly, and transpire more water, at least in the first few years after planting, than local ecotypes. Successful long-term establishment of a diverse and resilient plant community requires the enlistment of practitioners knowledgeable in the science and methods of disturbed land revegetation. For revegetation of covers, LM should establish reasonable success criteria that are linked to performance, and then develop and implement a statistically sound monitoring plan to evaluate success relative to the revegetation criteria. 3.2.3 Steps for Evaluation and Implementation of Cover Renovations At many disposal cell sites, LM may need to decide whether to continue herbicide spraying on covers, to discontinue spraying and allow plant succession to progress naturally, or to enhance plant establishment and growth, accelerating the transformation to ET-type covers. Several steps are recommended for LM to acquire the information needed to make informed decisions. Although the focus here is vegetation management, the general process could be applied to other performance issues such as rock degradation, erosion, or soil permeability. 1. Identify high-priority sites. The first step is to develop a method for screening all existing
LM disposal cell sites to identify sites where vegetation matters—where plant establishment and growth on the cover could have either deleterious or beneficial effects with respect to the long-term performance of the disposal cell. The screening process will exclude disposal sites where ground water protection and radon attenuation are not required. The screening process will include criteria for type of cover design, current ecological state, and current LTS&M practices and costs. For example, covers that have thick protective layers overlying CSLs are probably less permeable and less vulnerable to root intrusion and soil development processes than covers without protective layers. Rock covers currently in an early state of ecological development (with few or no plants) would likely have lower priority than sites where plants establish rapidly, are sprayed regularly, and, hence, cost more to maintain. High-priority sites will be identified and further evaluated in Step 2.
2. Evaluate effects of vegetation on cover performance. The second step is to consider
advantages and disadvantages of vegetation on covers with respect to water infiltration, radon attenuation, biouptake of contaminants, and erosion protection. A holistic approach that considers the interactions and dynamics of these processes will be developed. For example, as plants dry the soil, water percolation rates will likely decrease, but radon flux rates will likely increase. Combinations of literature reviews, field sampling and monitoring, conceptual models, and numerical simulation models will be utilized to acquire the information needed to evaluate effects of vegetation on the full spectrum of interacting cover degradation and contaminant release processes.

Sustainable Disposal Cell Covers: LM Practices, Improvements, and Long-Term Performance U.S. Department of Energy Doc. No. S0224000 March 2006 Page 12
3. Analyze long-term risks and costs of LTS&M options. The LM Strategic Plan (DOE 2004a) lists two measures of success with respect to improving the effectiveness of LTS&M practices and the sustainability of remedies:
• Maintains or reduces risk to human health and environment, and
• Reduces the cost of operating, monitoring, and maintaining remedies.
Evaluations of the effects of vegetation on cover performance (Step 2) will be used to assess and compare long-term risks associated with the three LTS&M options (continue spraying, let vegetation establish without intervention, or enhance plant community establishment). Near-term and long-term costs of the three options will also be compared. Table 1 depicts an expected outcome of risk/cost analyses for a subset of disposal cells where herbicide spraying is currently required by the LTSP because of concerns about root intrusion in the cover.
Table 1. Illustration of Risk/Cost Comparison for Vegetation Management Options
Near Term* Long Term* LTS&M Option
Risk Cost Risk Cost Continue Spraying L-M L-M M-H M-H Natural Revegetation M-H L L-M L Renovation: Enhance Plant Establishment and Growth L-M M-H L L
* L = low, M = moderate, H = high.
Renovating the cover to enhance growth should reduce both near-term and long-term risks at some sites. Renovation would increase near-term costs with the expectation of reducing long-term maintenance costs. Field tests of cover renovations (Step 4) would be proposed for those sites.
4. Conduct field tests of cover renovation designs. A relatively low-cost renovation is enhancement of plant establishment and ET on existing covers consisting of rock overlying a CSL. A renovation could involve ripping the CSL along the contour of the disposal cell at about 2-meter intervals and then planting native shrubs in the rip rows.
As an example, the cover at the Shiprock, New Mexico, site, may be well-suited for this type of renovation. At the Shiprock site, ongoing cleanup of the terrace and floodplain aquifers may be prolonged if the disposal cell is a continuing source of contamination (DOE 2004d). Despite regular herbicide spraying, the abundance of plants has increased each year and the composition has shifted from shallower-rooted annuals to deeper-rooted woody shrubs. Conversion of the rock cover into an ET cover could reduce the likelihood of seepage from the disposal cell, reduce recharge of runoff water at the edge of the disposal cell, and eliminate the need for regular herbicide spraying that has been only marginally effective. The loam CSL has a high water-storage capacity and is a favorable soil for establishment of native shrubs with relatively high transpiration rates. Renovation could result in a sustainable, low-maintenance cover providing long-term containment of the source of ground water contamination.
U.S. Department of Energy Sustainable Disposal Cell Covers: LM Practices, Improvements, and Long-Term Performance March 2006 Doc. No. S0224000 Page 13
The performance, construction methods, and costs of any cover renovation would first be thoroughly evaluated in off-site field tests. Large off-site lysimeters offer the most direct and reliable means for evaluating erosion, soil-water balance parameters, and percolation flux (Gee and Hillel 1988), and have been used extensively to test the hydrologic performance of cover designs for hazardous waste (e.g., Ward and Gee 1997, Dwyer 2001, Waugh 2004a, Albright and Benson 2004). Large-scale off-site lysimeters can also accommodate demonstrations of construction practices and revegetation methods. Lysimeters are buried containers filled with soil and then planted. Lysimeters can be used to measure percolation flux directly with a precision of 0.5 mm yr−1 or better (Gee and Hillel 1988, Ward and Gee 1997). However, several conditions, if not addressed, can cause high bias (overestimation or underestimation) in percolation flux measurements. These conditions include changes in the thermal regime, creation of an artificial lower boundary, restriction of rooting depths, and the influence of edge effects. Lysimeter measurements of soil water balance can suffer from inaccuracy because of the artificial boundaries created at the sides and lower end of the lysimeter soil columns (Grebet and Cuenca 1991). Side boundaries can influence soil temperatures, causing vapor pressure gradients under unsaturated conditions and substantial preferential edge flow of water under saturated conditions (Cameron et al. 1992). The lower artificial boundary in lysimeters can cause drainage to be underestimated. Soil water content above this boundary must approach saturation to overcome surface tension and drain from the soil column unless vacuum systems are installed at the base to simulate suction gradients (Allison et al. 1994). Water accumulates, reduces drainage, and supplies plants with more water for transpiration than in the corresponding undisturbed profile. Overcoming this problem requires a depth significantly greater than the rooting zone. The Alternative Cover Assessment Project (ACAP) is a noteworthy and successful example of off-site tests of cover designs using lysimeters (Albright et al. 2004). ACAP, initiated in 1998 by EPA, conducted comprehensive lysimeter tests of prototype covers at 11 landfill sites across the country in climates ranging from arid to humid and from hot to cold. Both conventional low-permeability and alternative ET cover designs were monitored in side-by-side comparisons. The ACAP prototype tests were conducted using 10- by 20-meter drainage lysimeters instrumented for direct measurement of runoff, soil water storage, lateral drainage, and percolation flux for a full-depth cover profile. A mass-balance approach is used to calculate ET. A similar lysimeter facility is proposed for side-by-side tests of existing LM covers with designs for cover renovations.
5. Implement cover renovations where warranted. LM can use results of evaluations of
vegetation effects on cover performance (Step 2), long-term risk and cost analyses for LTS&M vegetation management (Step 3), and off-site field tests of cover renovation designs (Step 4) as the basis for deciding whether to implement cover renovations and associated changes in LTS&M strategies. Where warranted by the results of these evaluations, LM would prepare and submit revised LTSPs before implementing changes.
6. Develop integrated vegetation management plans. The ecology of disposal cell covers and
the ecology of land surrounding disposal cells are inextricably linked. Plant communities surrounding a disposal cell are a seed source for plant establishment on the cover and vice-versa. Hence, noxious weeds growing in areas surrounding a disposal cell are a seed

Sustainable Disposal Cell Covers: LM Practices, Improvements, and Long-Term Performance U.S. Department of Energy Doc. No. S0224000 March 2006 Page 14
source for noxious weed establishment on the cover and vice-versa. Given that LTS&M costs for controlling state-listed noxious weeds has escalated during the past few years, any plans to renovate and enhance plant growth on covers should be incorporated into a comprehensive and integrated LM vegetation management plan as part of the strategy for reducing LTS&M costs.
Weeds growing in areas surrounding a disposal cell can drastically alter the ecology of the cover plant community. The growth and spread of weeds on the cover could inhibit growth of desirable vegetation, increase soil erosion, and result in much lower ET rates than expected. An integrated vegetation management plan could have several components (e.g., Colorado Natural Areas Program 2000):
• Characterize the vegetation management area including the soils, ecology, land uses, and natural resources. The management area could also include parcels outside the DOE boundary that may influence the ecology inside (with the cooperation of landowners).
• Inventory and map weed infestations in the management areas.
• Develop vegetation management goals and objectives as a means for setting management priorities, focusing resources (time and money), and developing criteria for evaluating management actions. Goals describe the desirable end states. Management objective statements should be specific, measurable, and achievable.
• Set priorities for weed management.
• Select and implement weed management techniques, including management practices for prevention. Weed prevention is best achieved by establishing and maintaining healthy native plant communities that resist invasion. Other prevention techniques include early detection of weed populations, limiting weed dispersal, and minimizing disturbances. Weed control actions include pulling, mowing, cutting, seeding fertilizing, irrigating, livestock grazing, biological agents (insects), herbicides, and prescribed burning.
No single management technique is best for all weed control situations. An integrated strategy is a process of selecting and applying a combination of management techniques (e.g., biological, chemical, mechanical, and cultural) that combined will control a particular weed species or infestation efficiently and effectively (Colorado Natural Areas Program 2000). It involves first implementing appropriate prevention methods before implementing appropriate control actions.
3.3 Develop Long-Term Cover Performance Evaluation Methods Most disposal cell covers are engineered ecosystems. Therefore, for covers to be sustainable and to contain waste in landfills for 100s of years, they must accommodate long-term ecological change. Projections of how a changing environment may influence cover performance and risks over long time periods are crucial to improving LTS&M strategies and reducing costs. Current guidelines (DOE 1989, EPA 1989) do not address long-term changes in the environmental setting that may contribute to risk. Long-term processes and episodic events associated with climate change, soil development (pedogenesis), ecological succession, and geomorphological change are usually not considered. Furthermore, most current approaches for long-term

U.S. Department of Energy Sustainable Disposal Cell Covers: LM Practices, Improvements, and Long-Term Performance March 2006 Doc. No. S0224000 Page 15
performance evaluation rely on physically based models that neglect inherent and measurement uncertainty and are not sensitive to ecological change. 3.3.1 Long-Term Performance Evaluation Steps An alternative approach for evaluating the long-term performance of covers links probabilistic modeling with evidence derived from natural analogs to bound reasonable ranges of long-term change in the environmental setting. This approach can be applied initially during the design phase with the objective of building more sustainable covers, and during the stewardship phase to evaluate the long-term performance of existing covers. We recently teamed with Pacific Northwest National Laboratories (PNNL) and Sandia National Laboratories (SNL) on demonstrations of a risk-based, probabilistic modeling platform developed by PNNL called Framework for Risk Analysis in Multimedia Environmental Systems (FRAMES). Monticello, Utah, and Lakeview, Oregon, were used as demonstration sites (Ho et al. 2004, Peterson and Ho 2005). Peterson (2004) provides a comprehensive discussion of needed improvements in the FRAMES platform, including the need to link an unsaturated flow code with an ecosystem dynamics code. The general steps of a systematic approach for projecting long-term performance that links modeling and natural analogs follows (also see Ho et al. 2004). 1. Develop and screen future environmental scenarios. A scenario is a well-defined sequence
of processes or events that describe possible future conditions of the disposal cell. For example, a scenario might include a future climate state based on global change models, future ecological conditions and stages of soil development for the climate state, and a different land use. Future environmental conditions would be inferred from characteristics of natural analogs (see Section 3.2.2, “Natural Analogs of Long-Term Performance”).
2. Develop models of relevant future scenarios. Development of broad conceptual models of
future scenarios are developed first to guide the selection of mechanistic models. Detailed models are then selected and integrated into a total system model framework that links performance with risk, such as FRAMES (mepas.pnl.gov/FRAMESV1/index.html).
3. Develop values and uncertainty distributions for input parameters. Single deterministic
values might be assigned to some well-characterized parameters, but uncertainty distributions are preferable. The uncertainty and/or variability in other parameters may require the use of uncertainty distributions to define values. Uncertainty distributions for many environmental values will be based on the characterization of natural analogs. Some uncertainty distributions may be derived from literature, prototype tests in lysimeters, or monitoring results at similar sites.
4. Perform calculations and sensitivity/uncertainty analyses. Because performance
calculations (runs) will include stochastic parameters, a Monte Carlo approach is often used to rapidly create large suites of simulations that input different combinations of parameter values sampled from the uncertainty distributions. The results are a collection of uncertainty distributions that can be compared to the performance objectives. Sensitivity analyses indicate which input parameters the performance metrics are most sensitive to.

Sustainable Disposal Cell Covers: LM Practices, Improvements, and Long-Term Performance U.S. Department of Energy Doc. No. S0224000 March 2006 Page 16
5. Document results and iterate previous steps as needed. The results are presented as the probability (risk) of exceeding a performance objective. Results can be used to iteratively evaluate alternative designs and components and to select the most suitable cover design for conditions at a site.
6. Monitor key performance indicators. Use results of sensitivity analyses to help select
parameters for post-closure performance monitoring as part of the LTS&M strategy. The objectives of performance monitoring include (1) provide early warnings of possible deterioration of the cover, (2) compare actual performance results with model predictions, and (3) reiterate and refine long-term performance projections, particularly in response to changes in the environmental setting.
3.3.2 Natural Analogs of Long-Term Change Effective cover performance projections will require input data for reasonable future ecological scenarios (see Section 3.3.1, “Long-Term Performance Evaluation Steps”). Natural analog studies help identify and evaluate likely changes in environmental processes that may influence the performance of engineered covers, processes that cannot be addressed with short-term field tests or existing numerical models (Waugh et al. 1994). Natural analog information is needed to (1) engineer cover systems that mimic favorable natural systems, (2) bound possible future conditions for input to predictive models and field tests, and (3) provide insights about the possible evolution of engineered covers as a basis for monitoring leading indicators of change. Natural analogs also help demonstrate to the public that numerical predictions have real-world complements. Evidence from natural analogs can improve our understanding of (1) meteorological variability associated with possible long-term changes in climate; (2) vegetation responses to climate change and disturbances; (3) effects of plant community dynamics on ET, soil permeability, soil erosion, and animal burrowing; and (4) effects of soil development processes on water storage, permeability, and site ecology. Examples follow of natural and archaeological analogs for LM waste disposal sites that were characterized to discern possible long-term changes in environmental settings. Examples are given for climate change, pedogenesis (soil development), and ecological succession. Climate Change Climate data are required for designing and projecting long-term performance of engineered covers (Ho et al. 2004). Projections of long-term extreme events and shifts in climate states over hundreds and thousands of years may be required, as well as annual and decadal variability in meteorological parameters. Methods were demonstrated based on global change models and paleoecological evidence to establish a first approximation of possible future climatic states at sagebrush steppe sites such as Richland, Washington (Peterson 1996) and Monticello, Utah (Waugh and Petersen 1996). A preliminary analysis of paleoclimate data for Monticello yielded average annual temperature and precipitation ranges of 2 to 10 °C and 80 to 60 centimeters (cm), respectively, corresponding to late glacial and mid-Holocene periods. Instrumental records for regional stations were then used as a basis for selecting soil and vegetation analog sites that span a reasonable range of future climate states. Appendix C presents a case study of the use of climate change data to select ecological analog sites for the Monticello disposal cell cover.

U.S. Department of Energy Sustainable Disposal Cell Covers: LM Practices, Improvements, and Long-Term Performance March 2006 Doc. No. S0224000 Page 17
Soil Development Pedogenic (soil development) processes will change soil physical and hydraulic properties that are fundamental to the performance of engineered covers. Although rates and magnitudes of change vary, pedogenesis takes place to some degree in all soils. Pedogenesis includes processes such as (1) formation of macropores for preferential flow associated with root growth, animal holes, and soil structural development; (2) secondary mineralization, deposition, and illuviation of fines, colloids, soluble salts, and oxides that can alter water storage and movement; (3) soil mixing caused by freeze-thaw activity, animal burrows, and the shrink-swell action of expansive clays (Chadwick and Graham 2000); and (4) formation of lag layers by winnowing, frost heaving, movement of soil gases during and after rain, and the shrink-swell action of expansive clays (e.g., McFadden et al. 1998, Collis-George 1991, McDonald et al. 1996). Key soil physical and hydraulic properties have been measured in natural and archaeological soil profiles at climate analog sites to infer possible future pedogenic effects on the performance of the Monticello cover (see Appendix D). Ecological Change Without human intervention, ecological development will take place on all earthen covers whether intended or not. Changes in plant communities, particularly catastrophic losses of vegetation, will alter the performance of ET covers. Ecological change is inevitable and may alter the functional performance of all cover designs in ways not initially anticipated. Plant communities develop and change in response to several interacting factors: propagule accessibility, climatic variability, change in soil characteristics, disturbances such as fire, and species interactions such as herbivory, competition, or fluctuations in soil microbe populations. Plant community dynamics are manifested by shifts in species composition, vegetation abundance, and species diversity and may be accompanied by changes in rates of nutrient cycling, energy exchange, and transpiration. Plant community dynamics are complicated and effects are difficult to model and predict. Even in the absence of large-scale disturbances, seasonal and annual variability in precipitation and temperature will cause changes in species abundance, diversity, biomass production, and soil water extraction rates (Anderson et al. 1993, Link et al. 1994). It will be important to know how changes in the plant community inhabiting a cover may influence soil water movement, ET, and the water balance of a cover. In the long term, changes in the waste-site ecology will occur in ways that cannot be accurately predicted by models or short-term field tests. For example, successional changes in the vegetation can create small-scale topographic patterns that foster greater heterogeneity in the soil water balance. At arid sites, desert shrub communities that are likely to develop on covers tend to trap windborne sediments, causing a hummock-swale relief with variable soil physical and hydraulic properties (Link et al. 1994). Similarly, at humid sites, blowdown of mature trees growing on engineered covers will create depressions for water accumulation (Suter et al. 1993). Successional chronosequences provide clues of possible future ecological changes. For example, at the Lakeview, Oregon, disposal site, possible future responses of plant community composition and leaf area index (LAI) to fire were evaluated using a nearby fire chronosequence (Waugh 2004b). In addition, possible vegetation responses to climate change scenarios were

Sustainable Disposal Cell Covers: LM Practices, Improvements, and Long-Term Performance U.S. Department of Energy Doc. No. S0224000 March 2006 Page 18
evaluated at regional climate-change analog sites. LAI, as an index of plant transpiration, ranged from 0.15 to 1.28 for the fire chronosequence and from 0.43 to 1.62 for dry and wet climate analog sites. 3.4 Review Disposal Cell Designs and Monitoring Plans Prior to Closure Consideration of LTS&M requirements should begin during the remedy selection and design phases long before a site is turned over to LM. Disposal cells should be designed to satisfy long-term performance requirements, not just site closure requirements. LM and its stakeholders have a vested interest in reviewing designs and monitoring strategies to reduce LTS&M costs and “to make sure that our environmental remedies are working and will continue to protect future generations” (DOE 2004a). LM should have a role in both the cover design and construction phases of a site closure. At the front end of the design process, LM should review performance data for covers, including existing modeling and monitoring data for prototype designs. Where appropriate, LM should employ tools that are available for designing sustainable covers: (1) monitoring prototype designs with lysimetry or similar technologies, (2) risk-based performance assessment models, and (3) inferences from natural analogs to provide a reasonable range of future environmental scenarios as a basis for performance projections. EPA’s ACAP is an excellent example of the use of lysimetry to compare prototype designs. Results of ACAP lysimeter tests led to less expensive and more sustainable covers at several landfill sites across the country. Independent LM review during the construction phase would help ensure the quality of materials and construction practices. Where the risks and costs of a failure are high, LM should advocate monitoring to verify performance of the as-built cover system before the site is transferred. Performance verification monitoring before transfer of a site may be desirable for several reasons:
• Monitoring during construction ensures the quality of materials and construction for components of the cover, but does not verify the overall performance of cover systems. Typical compartmentalized approaches for designing covers can lead to unintended synergistic consequences when components are assembled and interact in a final cover system.
• Full-scale covers constructed with heavy equipment rarely achieve the stringent performance standards (e.g., hydraulic conductivity) as measured in small-scale prototype tests. Therefore, prototype tests can help compare and select designs but should not be viewed as a verification of as-built performance.
• Uncertainty in percolation flux predictions using water balance models are often one to several orders of magnitude greater than the percolation flux criterion. Therefore, model results should only be used as evidence of relative performance for comparing alternative designs but, again, should not be presented as verification of as-built performance.

U.S. Department of Energy Sustainable Disposal Cell Covers: LM Practices, Improvements, and Long-Term Performance March 2006 Doc. No. S0224000 Page 19
4.0 References Albright, W.C., C.H. Benson, G.W. Gee, A.C. Roesler, T. Abichou, P. Apiwantragoon, B.F. Lyles, and S.A. Rock, 2004. “Field water balance of landfill final covers.” J. Environ. Qual. 33:2317-2332. Allison, G. B., G. W. Gee, and S. W. Tyler. 1994. Vadose-zone techniques for estimating groundwater recharge in arid and semiarid regions. Soil Science Society of America Journal 58:6-14. Anderson, J.E., R.S. Nowak, T.D. Ratzlaff, and O.D. Markham, 1993. “Managing soil moisture on waste burial sites in arid regions,” Journal of Environmental Quality, 22:62−69. Benson, C., W. Albright, T. Abichou, S. Rock, E. MacDonald, L. Li, and X. Wang, 2004. Forensic Evaluation of a Conventional Cover with a Compacted Clay Barrier. In: Designing, Building, and Regulating ET Landfill Covers, U.S. Environmental Protection Agency, March 9-10, 2004, Denver, CO. Benson, C.H. and D.E., Daniel, 1990. "Influence of Clods on Hydraulic Conductivity of Compacted Clay," Journal of Geotechnical Engineering, 116(8):1231-1248. Benson, C.H., and M.A. Othman, 1993. Hydraulic conductivity of compacted clay frozen and thawed in situ. J. Geotech. Eng 119:276-294. Benson, C.H., D.E. Daniel, and G.P. Boutwell, 1999. Field Performance of Compacted Clay Liners. Journal of Geotechnical and Geoenvironmental Engineering 125:390. Berwick, J., T. Meiers, and J. Waugh, 2000. Expansive cover installed by DOE to contain mixed wastes in eastern Utah. EPA Tech Trends 37:2-4. Bowerman, A.G., and E.F. Redente, 1998. “Biointrusion of protective barriers at hazardous waste sites,” J. Envron. Qual., 27:625-632. Boynton, S.S., and D.E. Daniel, 1984. Hydraulic conductivity tests on compacted clay. Journal of Geotechnical Engineering 111:465-478. Cameron, K. C., N. P. Smith, C. D. A. McLay, P. M. Fraser, R. J. McPherson, D. F. Harrison, and P. Harbottle. 1992. Lysimeters without edge flow: An improved design and sampling procedure. Soil Science Society of America Journal 56:1625-1628. Cataldo, D.A., C.E. Cowan, K.M. McFadden, T.R. Garland, and R.E. Wildung, 1987. Plant rhizoshpere processes influencing radionuclide mobility in soil, PNL–6277, Pacific Northwest National Laboratory, Richland, Washington. Chadwick, O.A., and R.C. Graham, 2000. “Pedogenic processes,” in: M.E. Summer (ed.), Handbook of Soil Science, CRC Press.

Sustainable Disposal Cell Covers: LM Practices, Improvements, and Long-Term Performance U.S. Department of Energy Doc. No. S0224000 March 2006 Page 20
Clarke, J.H., M.M. MacDonell, E.D. Smith, R.J Dunn, and W.J. Waugh, 2004. Engineered containment and control systems: nurturing nature. Risk Analysis 243:771-779. Clulow, F.V., M.A. Mirka, N.K. Dave, and T.P. Lim, 1991. “226Ra and other radionuclides in water, vegetation, and tissues of beavers (Castor canadensis) from a watershed containing U tailings near Elliot Lake, Canada,” Environmental Pollution, 69:277–310. Collis-George, N., 1991. Drainage and soil structure: a review. Australian J. Soil Res. 29:923-933. Colorado Natural Areas Program, 2000. Creating an Integrated Weed Management Plan: A Handbook for Owners and Managers of Lands with Natural Values. Colorado Natural Areas Program, Colorado State Parks, Colorado Department of Natural Resources; and Division of Plant Industry, Colorado Department of Agriculture, Denver, Colorado. Daniel, D.E., 1984. Predicting hydraulic conductivity of clay liners. J. of Geotechnical Engineering, (American Soc of Civil Engineers), 110:285-300. Daniel, D.E., 1994. “Surface Barriers: Problems, Solutions, and Future Needs.” pp. 441-487, in G.W. Gee and N.R. Wing (eds.), In-Situ Remediation: Scientific Basis for Current and Future Technologies, Battelle Press, Columbus, Ohio. DOE, 1989. Technical approach document, revision II, UMTRA−DOE/ AL 050425.0002, U.S. Department of Energy, Albuquerque, New Mexico. DOE, 1992. Vegetation growth patterns on six rock-covered UMTRA Project disposal cells, DOE UMTRA Project Office, Albuquerque Operations Office, Albuquerque, New Mexico. DOE, 1994. Long-Term Surveillance Plan for the Collins Ranch Disposal Site, Lakeview, Oregon, DOE/AL/62350-19F, Rev. 3, Albuquerque Operations Office, Albuquerque, New Mexico. DOE, 2001. Guidance for Implementing the Long-Term Surveillance Program for UMTRCA Title I and Title II Disposal Sites, GJO-2001-215-TAR, U.S. Department of Energy Grand Junction Office, Grand Junction, Colorado. DOE, 2002. Draft: Long-Term Stewardship Science and Technology Roadmap, DOE/ID-10926, Idaho Operations Office, U.S. Department of Energy, Idaho Falls, Idaho. DOE, 2004a. Managing Today’s Change, Protecting Tomorrow’s Future, Strategic Plan, Office of Legacy Management, U.S. Department of Energy, Washington D.C. DOE, 2004b. 2004 Annual Site Inspection and Monitoring Report for Uranium Mill Tailings Radiation Control Act Title I Disposal Sites. DOE-LM/GJ758-2004, U.S. Department of Energy, Grand Junction, Colorado.

U.S. Department of Energy Sustainable Disposal Cell Covers: LM Practices, Improvements, and Long-Term Performance March 2006 Doc. No. S0224000 Page 21
DOE, 2004c. 2004 Annual Site Inspection and Monitoring Report for Uranium Mill Tailings Radiation Control Act Title II Disposal Sites. DOE-LM/GJ745-2004, U.S. Department of Energy, Grand Junction, Colorado. DOE, 2004d. Refinement of Conceptual Model and Recommendations for Improving Remediation Efficiency at the Shiprock, New Mexico, Site, GJO-2004-579-TAC, Office of Legacy Management, U.S. Department of Energy, Grand Junction, Colorado. DOE, 2005. A Review of Legacy Management Remedies: State of the Practice. DOE-LM/GJXXX-2005 (ESL-RPT-2005-06), U.S. Department of Energy, Grand Junction, Colorado. Dreesen, D.R., and J.M. Williams, 1982. “Mobility and bioavailability of uranium mill tailings contaminants,” Environ. Sci. Technol., 16:702–709. Dwyer, S. F. 2001. “Finding a Better Cover.” Civil Engineering. January, pp. 59–63. EPA, 1983. Health and environmental protection standards for uranium mill tailings, 48 Federal Register 602, 40 Code of Federal Regulations 192, Washington, D.C. EPA, 1989. Technical guidance document, final covers on hazardous waste landfills and surface impoundments. EPA/530–SW–89–047, Washington, DC. EPA, 1995. Groundwater standards for remedial actions at inactive uranium processing sites, final rule, 60 Federal Register 2854, 40 Code of Federal Regulations 192, Washington, D.C. EPA, 2003. Evapotranspiration Landfill Cover System Fact Sheet, EPA 542–F–03–015, Solid Waste and Emergency Response (5102G), Washington, D.C. Gee G.W., A.L. Ward, T.G. Caldwell, and J.C. Ritter, 2002. “A vadose zone water fluxmeter with divergence control,” Water Resources Research, 38(8):35-41. Gee, G.W., and D. Hillel, 1988. “Groundwater recharge in arid regions: Review and critique of estimation methods.” Hydrological Processes, 2:255−266. Gee, G.W., and S.W. Tyler (eds.), 1994. “Symposium: Recharge in arid and semiarid regions,” Soil Science Society of America Journal, 58:5−72. Glenn, E.D. and W.J. Waugh, 2001. Disposal Cell Cover Moisture Content and Hydraulic Conductivity, Long-Term Surveillance and Maintenance Program Shiprock, New Mexico Site. GJO-2001-204-TAR, U.S. Department of Energy Grand Junction Office, Grand Junction, CO. Grebet, P., and R. H. Cuenca. 1991. History of lysimeter design and effects of environmental disturbances, in R. G. Allen, T. A. Howell, W. O. Pruitt, I. A, Walter, and M. E. Johnson, eds., Lysimeters for evapotranspiration and environmental measurements. Proc. Int. Symp. Lysimetry, Honolulu, Hawaii. July 23-25, 1991. Am. Soc. Civ. Eng., New York. Groenevelt, P.H., P. van Straaten, V. Rasiah, and J. Simpson. 1989. Modification in evaporation parameters by rock mulches. Soil Technol. 2:279–285.

Sustainable Disposal Cell Covers: LM Practices, Improvements, and Long-Term Performance U.S. Department of Energy Doc. No. S0224000 March 2006 Page 22
Hakonson, T.E., 1986. “Evaluation of geologic materials to limit biological intrusion into low-level radioactive waste disposal sites,” LA–10286–MS, Los Alamos National Laboratory, Los Alamos, New Mexico. Hakonson, T.E., L.J. Lane, and E.P. Springer, 1992. “Biotic and abiotic processes,” pp. 101-146, in Deserts as Dumps? The Disposal of Hazardous Materials in Arid Ecosystems, C.C. Reith and B.M. Thompson (eds.), Univ. of New Mexico Press, Albuquerque, New Mexico. Ho, C.K., B.W. Arnold, J.R. Cochran, R.Y. Taira, and M. Pelton, 2004. A probabilistic model and software tool for evaluating the long-term performance of landfill covers. Environmental Modeling and Software Journal 19:63-88. Hosner, L.R., H.J. Woodard, and J. Bush. 1992. “Growth and selenium uptake of range plants propagated in uranium mine soils,” J. Plant Nutrition, 15:2743–2761. ITRC (Interstate Technology & Regulatory Council). 2003. Technical and Regulatory Guidance ITRC, 2003. Technical and Regulatory Guidance for Design, Installation, and Monitoring of Alternative Final Landfill Covers, Alternative Landfill Technologies Team, Interstate Technology and Regulatory Council. Jessberger, H.L. and K. Stone, 1991. Subsidence effects on clay barriers. Geotech 41:185-194. Kemper, W.D., A.D. Nicks, and A.T. Corey. 1994. Accumulation of water in soils under gravel and sand mulches. Soil Sci. Soc. Am. J. 58:56–63. Khire, M.V., C.H. Benson, and P.J. Bossher, 2000. “Capillary barriers: design variables and water balance,” Journal of Geotechnical and Geoenvironmental Engineering, 126:695-708. Kim, W.H., and D.E. Daniel, 1992. Effects of freezing on the hydraulic conductivity of compacted clay. Journal of Geotechnical Engineering 18:1083–1097. LaGatta, M.D., 1992. Hydraulic conductivity tests on geosynthetic clay liners subjected to differential settlement. MS Thesis, Univ. of Texas, Austin, TX. Lapham, S.C., J.B. Millard, and J.M. Samet, 1989. “Health implications of radionuclide levels in cattle raised near Uranium Mining and Milling Facilities in Ambrosia Lake, New Mexico,” Health Physics, 56:327–340. Lewis, B.G., and M.M. MacDonell, 1990. “Release of radon-222 by vascular plants: Effect of transpiration and leaf area,” J. Env. Radioactivity, 19:93–97. Link, S.O., W.J. Waugh, and J.L. Downs, 1994. “The role of plants on isolation barrier systems,” in G.W. Gee and N.R. Wing (eds.), In-Situ Remediation: Scientific Basis for Current and Future Technologies, Battelle Press, Columbus, Ohio.

U.S. Department of Energy Sustainable Disposal Cell Covers: LM Practices, Improvements, and Long-Term Performance March 2006 Doc. No. S0224000 Page 23
Markose, P.M., I.S. Bhat, and K.C. Pillai, 1993. “Some characteristics of 226Ra transfer from soil and uranium mill tailings to plants,” J. Environ. Radioactivity, 21:131–142. McDonald, E.V., F.B. Pierson, G.N. Flerchinger, and L.D. McFadden, 1996. “Application of a process-based soil-water balance model to evaluate the influence of Late Quaternary climate change on soil-water movement in calcic soils,” Geoderma, 74:167-192. McFadden, L.D., E.V. McDonald, S.G. Wells, K. Anderson, J. Quade, and S.L. Forman, 1998. “The vesicular layer of desert soils: Genesis and relationship to climate change and desert pavements based on numerical modeling, carbonate translocation behavior, and stable isotope and optical dating studies,” Geomorphology, 101-145. Melchior, S., K. Berger, B. Vielhaber, and G. Miehlich, 1994. “Multilayer landfill covers: Field data on the water balance and liner performance,” pp. 411–425, in G.W. Gee and N.R. Wing (eds.), In-Situ Remediation: Scientific Basis for Current and Future Technologies, Battelle Press, Columbus, Ohio. Melchoir, S., 1997. In-situ studies of the performance of landfill caps (compacted soil liners, geomembranes, geosynthetic clay liners, capillary barriers). Land Contamination Reclamation 5:209-216. Morris, R.C., and L. Fraley, Jr., 1989. “Effects of vegetation, a clay cap, and environmental variables on Rn-222 fluence rate from reclaimed U mill tailings,” Health Physics, 56:431–440. NRC, 1989. Calculation of radon flux attenuation by earthen uranium mill tailings covers, Regulatory guide 3.64, Washington D.C. NRC, 1990. Staff technical position design of erosion protection covers for stabilization of uranium mill tailings sites, Rockville, MD. Peterson, C., and C.K. Ho, 2005. Evaluation of FRAMES for Probabilistic Risk-Based Simulations of Long-Term Cover Systems. In: Proceeding of Waste Management ’05, Tucson, Arizona. Peterson, D.L., 2004 (Draft). An Ecohydrological Model for Assessing the Performance of Disposal Cell Covers, Prepared for U.S. Department of Energy, Grand Junction, Colorado. Peterson, K.L., 1996. “Projecting the Range of Potential Future Climate Change as an Aid in Assessing the Effectiveness of the Hanford Site Permanent Isolation Barrier,” in S.J. Ghan, W.T. Pennell, K.L. Peterson, E. Rykiel, M.J. Scott, and L.W. Vail (eds.), Regional Impacts of Global Climate Change: Assessing Change and Response at Scales That Matter, Battelle Press, Columbus, Ohio. Reith, C.C., and B.M. Thompson (eds.), 1992. Deserts as dumps? The disposal of hazardous materials in arid ecosystems, University of New Mexico Press, Albuquerque, New Mexico. Rogowski, A.S., 1990. "Relationship of Laboratory- and Field-Determined Hydraulic Conductivity in Compacted Clay Liner." EPA/600/2-90/025, Risk Reduction Engineering

Sustainable Disposal Cell Covers: LM Practices, Improvements, and Long-Term Performance U.S. Department of Energy Doc. No. S0224000 March 2006 Page 24
Laboratory, Office of Research and Development, U.S. Environmental Protection Agency, Cincinnati, OH. Smith E, R.J. Luxmoore, and G.W. Suter II, 1997. Natural physical and biological processes compromise the long-term performance of compacted soil caps, In: Barrier technologies for environmental management: Summary of a workshop, National Research Council, National Academy Press, Washington, DC. Smith W.J., R.A. Nelson, and K.R. Baker, 1985. Sensitivity analysis of parameters affecting radon barrier cover thickness, Proc, 7th Symp on Management of Uranium Mill Tailings, Low-level Waste, and Hazardous Waste, Colorado State Univ, Ft. Collins, Colorado. Stormont, J., and C. Anderson, 1998. Method to estimate water storage capacity of capillary barriers,” Journal of Geotechnical and Geoenvironmental Engineering, 124:297-302. Suter, G.W., II, R.J. Luxmoore, and E.D. Smith, 1993. “Compacted soil barriers at abandoned landfill sites are likely to fail in the long term,” J. Environ. Qual., 217-226. Technologies Team. Available on the Internet at http://www.itrcweb.org. Ward, A., and G. Gee, 1997. “Performance evaluation of a field-scale surface barrier,” J. Environ. Qual., 26:694−705. Waugh, W.J., 2004a. Design, Performance, and Sustainability of Engineered Covers for Uranium Mill Tailings. Proceedings of Long-term Performance Monitoring of Metals and Radionuclides in the Subsurface: Strategies, Tools, and Case Studies. U.S. Environmental Protection Agency, U.S. Department of Energy, U.S. Geological Survey, Nuclear Regulatory Commission, April 21-22, 2004, Reston, VA. Waugh, W.J., 2004b. Designing Sustainable Covers for Uranium Mill Tailings, pp, 157-173. In: W.R. Keammerer and J. Todd, Proceedings, High Altitude Revegetation Workshop, No. 16. Information Series No. 99, Colorado Water Resources Research Institute, Colorado State University, Fort Collins, Colorado. Waugh, W.J., 2005 (Draft). Tools for Evaluating Covers as Leading Indicators of the Performance of Waste Disposal Cells. Environmental Sciences Laboratory, U.S. Department of Energy, Grand Junction, Colorado. Waugh, W.J., and G.M. Smith, 1997. Effects of root intrusion on the Burrell, PA, uranium mill tailings disposal site, GJO-97-5-TAR, U.S. Department of Energy Grand Junction Office, Grand Junction, Colorado. Waugh, W.J., and G.N. Richardson, 1997. Ecology, Design, and Long-Term Performance of Surface Barriers: Applications at a Uranium Mill Tailings Site, pp. 36-49. In: Barrier Technologies for Environmental Management, National Research Council, National Academy Press, Washington, D.C.

U.S. Department of Energy Sustainable Disposal Cell Covers: LM Practices, Improvements, and Long-Term Performance March 2006 Doc. No. S0224000 Page 25
Waugh, W.J., and K.L. Petersen, 1996. “Climate Change and Uranium Mill Tailings in the Four Corners Region,” in S.J. Ghan, W.T. Pennell, K.L. Peterson, E. Rykiel, M.J. Scott, and L.W. Vail (eds.), Regional Impacts of Global Climate Change: Assessing Change and Response at Scales That Matter, Battelle Press, Columbus, Ohio. Waugh, W.J., G.M. Smith, D. Bergman-Tabbert, and D.R. Metzler, 2001. “Evolution of cover systems for the Uranium Mill Tailings Remedial Action Project, USA,” Mine Water and the Environment, 20:190-197. Waugh, W.J., K.L. Petersen, S.O. Link, B.N. Bjornstad, and G.W. Gee, 1994. Natural Analogs of the Long-term Performance of Engineered Covers, pp. 379-409. In G.W. Gee and N.R. Wing (eds.), In-Situ Remediation: Scientific Basis for Current and Future Technologies. Battelle Press, Columbus, OH. Waugh, W.J., S.J. Morrison, G.M. Smith, M. Kautsky, T.R. Bartlett, C.E. Carpenter, and C.A. Jones, 1999. Plant encroachment on the Burrell, Pennsylvania, disposal cell: Evaluation of long-term performance and risk, GJO-99-96-TAR, U.S. Department of Energy, Grand Junction, Colorado. Winograd, I.J., 1981. “Radioactive waste storage in thick unsaturated zones,” Science, 212:1457−1464

Sustainable Disposal Cell Covers: LM Practices, Improvements, and Long-Term Performance U.S. Department of Energy Doc. No. S0224000 March 2006 Page 26
End of current text

Appendix A
Case Study: Risk-Based Performance Evaluation at
Burrell, Pennsylvania
(Jody Waugh, Author)


U.S. Department of Energy Sustainable Disposal Cell Covers: LM Practices, Improvements, and Long-Term Performance March 2006 Doc. No. S0224000 Page A−3
The disposal cell cover at Burrell consists of a 90-cm compacted soil layer (CSL) overlying residual radioactive materials (RMM), a 30-cm sand and gravel drainage layer, and a 30-cm rock riprap layer. Within 3 years after construction, a diverse community of woody plants had established on the rock cover of the disposal cell, including sycamore, box elder, black locust, tree-of-heaven, and Japanese knotweed, an exotic perennial with a woody base. Within 10 years, Japanese knotweed had rooted through the rock layer and the underlying CSL. The original Long-Term Surveillance Plan (LTSP) specified annual applications of herbicides to aggressively control plant growth on the cover. Follow-up investigations at Burrell resulted in a change in the LTSP and a significant reduction in annual maintenance costs. In 1997, DOE conducted an investigation of the effects of root intrusion on the hydrologic performance of the cover (Waugh and Smith 1997). Air-entry permeameters (Stephens et al. 1988) were used at Burrell to measure the in situ saturated hydraulic conductivity (Ksat) of the CSL. The Ksat averaged 3.0 × 10⁻⁵ cm s-1 at locations where Japanese knotweed roots penetrated the CSL compared to 2.9 × 10⁻⁷ cm s-1 at locations where there were no plants. The weighted-average Ksat for the 6-acre cover, calculated using the community leaf area index (LAI) for Japanese knotweed, was 4.4 × 10⁻⁶ cm s-1. Plant community LAI was estimated with an LAI-2000 Plant Canopy Analyzer (Wells and Norman 1991, LI-COR, Inc. 1992). At a nearby site with a subsoil consisting of the same type of material as used for the CSL, the Ksat averaged 1.3 × 10⁻⁴ cm s-1. Earthworm holes, root channels, and soil structural planes all contributed to macropore flow of water in the subsoil. This nearby site was considered to be a reasonable analog of the long-term condition of the Burrell disposal cell cover. Two conclusions of the study were (1) plant roots had increased the Ksat of the cover by 2 orders of magnitude, and, in time, soil development would increase the Ksat by 3 orders of magnitude, but (2) root intrusion and associated drying of the cover would not likely increase radon flux above the 20 pCi m2 s–1 standard unless the western Pennsylvania climate changes. In 1999, DOE conducted a screening-level risk assessment of the effects of root intrusion and the increase in the Ksat of the CSL. The first phase of risk assessment evaluated concentrations and mobility of contaminants in tailings pore fluid. Composite tailings samples were retrieved from locations within the disposal cell that had the highest radium levels at the time of construction. Column leach tests conducted using composite samples encompassed a range of current, possible future, and, less likely, extreme chemical conditions. The results suggest that manganese, molybdenum, selenium, uranium, and radium-226 in pore fluid may exceed either the UMTRCA maximum concentration limits (MCLs), or an EPA risk-based screening level for one or more of the conditions tested. In other words, water extracted directly from the disposal cell, the worst-case exposure pathway, may be unsafe to drink. The second phase of the risk assessment evaluated ground water quality beneath the disposal cell for a range of conditions that might occur during the design life of the disposal cell. A combination of historical monitoring data from seeps and wells, soil water balance modeling, and ground water mixing calculations were used to estimate ground water quality for a range of possible future conditions, including changes in the ecology of cover soils and changes in the tailings pore water chemistry. No contaminants of concern (COCs) in DOE’s historical database for seeps and monitor wells came close to the UMTRCA MCLs or the EPA risk-based screening levels. Estimates of ground water quality for existing conditions were comparable to the

Sustainable Disposal Cell Covers: LM Practices, Improvements, and Long-Term Performance U.S. Department of Energy Doc. No. S0224000 March 2006 Page A−4
historical monitoring data. Even for extreme conditions, all model-predicted COCs, except radium-226, were well below MCLs and EPA risk-based screening levels. The results suggest that radium-226 in ground water could exceed the MCL by at most 10 percent, but only for a highly unlikely combination of conditions: (1) pore water with a pH of 4.5 or less, (2) a 2-to-3-orders-of- magnitude increase in the saturated hydraulic conductivity of the radon barrier because of root intrusion, (3) 1,000 years of radium-226 ingrowth, and (4) pore water contamination levels as high as that from the most contaminated tailings. Primarily because a pore water pH value of 4.5 is highly unlikely, radium is expected to remain relatively immobile in the disposal cell. The results also suggest that, in the future, because of increased evapotranspiration, contaminant concentrations in ground water would be substantially lower if native woodlands were allowed to establish. Regular denuding of the disposal cell with herbicides, on the other hand, would reduce evapotranspiration and, in time, may actually increase percolation through the cover. The results of this follow-up investigation were submitted to NRC as justification for eliminating the requirement for annual herbicide applications at Burrell. In 2002, NRC accepted the revised LTSP that allows plants to grow on the cover without further intervention. References LI-CORE, Inc., 1992. LAI–2000 Plant Canopy Analyzer: Operating Manual, LI-CORE, Inc., Lincoln, Nebraska. Stephens, D.B., M. Unruh, J. Havlena, R.G. Knowlton, Jr., E. Mattson, and W. Cox, 1988. “Vadose Zone Characterization of Low-Permeability Sediments Using Field Permeameters,” Ground Water Monitoring Review 8:59–66. Waugh, W.J., and G.M. Smith, 1997. Effects of root intrusion on the Burrell, PA, uranium mill tailings disposal site, GJO-97-5-TAR, U.S. Department of Energy Grand Junction Office, Grand Junction, Colorado. Wells, J.M., and J.M. Norman, 1991. “Instrument for Indirect Measurement of Canopy Architecture,” Agron. J. 83:818–825.

Appendix B Case Study:
Forensic Investigation of the Permeability of a Compacted Soil Layer
(C. Benson, W. Albright, T. Abichou, S. Rock, E. MacDonald, L. Li, and
X. Wang, Authors)


U.S. Department of Energy Sustainable Disposal Cell Covers: LM Practices, Improvements, and Long-Term Performance March 2006 Doc. No. S0224000 Page B−3
Introduction The objective of EPA’s Alternative Cover Assessment Program (ACAP) is to develop field-scale performance data for landfill final cover systems (Albright et al. 2004). Large-scale test sections simulating final covers have been constructed at 11 sites throughout the United States. Both alternative and conventional cover designs are being evaluated. The ACAP test sections in Albany, Georgia, were recently dismantled to allow construction of the full-scale cover and other remediation systems. During dismantling, the test sections were studied extensively. This case study describes some of the observations made when dismantling the test section that simulated a conventional cover. A schematic of the conventional cover profile is shown on Figure B−1. This cover relied on a compacted clay barrier as the primary means to limit percolation of water into the underlying waste. Measurements made on large hand-carved block samples collected during construction indicated that the as-built clay barrier had a saturated hydraulic conductivity of 4.0 x 10⁻⁸ cm/s.
300 m m in te rim co ver
150 m m to p so il
460 m mco m p acted c lay
Figure B−1. Cover Profile for the Albany, Georgia, Conventional Cover Design Test.
Water Balance Data The tests sections at Albany were completed in spring 2000. Both tests sections included a heavily instrumented lysimeter and a weather station to obtain a continuous record of the water balance. Water balance monitoring began shortly after construction was completed. Figure B−2 presents water balance monitoring results. Nearly 500 mm of precipitation was received during the first 6 months of monitoring. Percolation during this period occurred at a slow and steady rate. This period was followed by a drought lasting approximately 1 month, during which no precipitation occurred. Extensive drying of the cover occurred during the drought, as evinced by a large monotonic drop in soil water storage (Figure B−2).

Sustainable Disposal Cell Covers: LM Practices, Improvements, and Long-Term Performance U.S. Department of Energy Doc. No. S0224000 March 2006 Page B−4
0
500
1000
1500
2000
2500
3000
3500
4000
100
150
200
250
4/1/00 10/20/00 5/11/01 11/30/01 6/20/02 1/9/03 7/31/03
Cum
ulat
ive
Wat
er A
pplie
d, E
vapo
trans
pira
tion,
Surfa
ce R
unof
f, an
d P
erco
latio
n (m
m)
Soil Water S
torage (mm
)Precipitation
Soil Water Storage
Evapotranspiration
PercolationRunoff
Dry Period
Figure B−2. Water Balance Data for Albany, Georgia, Cover Monitored in a Large Lysimeter. The percolation record was markedly different after the drought. Rather than steady transmission of water, percolation was transmitted rapidly and periodically immediately following precipitation events. This effect is manifested as a stair-step pattern in the percolation record in Figure B−2. The drought also had a dramatic effect on the quantity of percolation transmitted by the cover. The change in the percolation record was indicative of the formation of preferential flow paths, most likely caused by shrinking and cracking of the compacted clay layer during the drought. Inspection of the surface of the cover also suggested that cracks penetrated the cover and that these cracks were conducting flow.

U.S. Department of Energy Sustainable Disposal Cell Covers: LM Practices, Improvements, and Long-Term Performance March 2006 Doc. No. S0224000 Page B−5
Forensic Investigation Full-scale construction activities at the site required dismantling the test sections during winter 2004. This provided an opportunity for a forensic evaluation of the clay barrier layer, including destructive testing. The forensic investigation included
• Field hydraulic conductivity tests using sealed double-ring infiltrometers (SDRIs) and two-stage borehole permeameters (TSBs).
• Collection of large (400-mm diameter) undisturbed block samples for large-scale laboratory measurements of hydraulic conductivity and the soil water characteristic curve.
• Dye tracers to mark flow paths in the clay barrier.
• Visual inspection of the clay barrier in test pits. Results and Conclusions Results of the field hydraulic conductivity tests are summarized in Table B−1. Laboratory hydraulic conductivity tests on the block samples are currently being conducted. In Table B−1, Kf is the field hydraulic conductivity measured during dismantling, and Ko is the as-built hydraulic conductivity. The hydraulic conductivity increased by a factor of approximately 3 to 5 orders of magnitude during the service life of the test section. Inspection of the clay showed that it was riddled with cracks, and these cracks most likely were responsible for the large increase in hydraulic conductivity. In addition, dye added to the SDRIs was observed in the drainage layer of the lysimeter in less than 1 hour, which strongly suggests that preferential flow was occurring through the cracks.
Table B−1. Results of Hydraulic Conductivity Tests.
Test Hydraulic
Conductivity (cm s-1)
Kf / Ko
As-Built 4.0 × 10⁻⁸ 1.0
SDRI 2.0 × 10⁻⁴ 5000
TSB-1 5.2 × 10⁻⁵ 1300
TSB-2 3.2 × 10⁻⁵ 800
TSB-3 3.1 × 10⁻³ 77,500
The area where dye pooled was excavated after the dye soaked into the test section. Dye was observed through the soil mass in the upper 150 mm of the cover. At greater depths, dye was found along crack surfaces, near the interface between soil and rocks, and in localized pores, all of which are indications that preferential flow was occurring in the clay barrier. The test results and observations of the soil structure suggest that the clay barrier weathered extensively during the relatively short service life of the test section. Consequently, the cover

Sustainable Disposal Cell Covers: LM Practices, Improvements, and Long-Term Performance U.S. Department of Energy Doc. No. S0224000 March 2006 Page B−6
was ineffective as a hydraulic barrier. Similar behavior is likely to exist in other covers employing unprotected, compacted clay barrier layers. References Albright, W.C., C.H. Benson, G.W. Gee, A.C. Roesler, T. Abichou, P. Apiwantragoon, B.F. Lyles, and S.A. Rock, 2004. “Field water balance of landfill final covers.” J. Environ. Qual. 33:2317-2332.

Appendix C Case Study:
Potential Future Climate States at the Monticello, Utah, Site
(Saxon Sharpe Desert Research Institute, Reno, Nevada)

U.S. Department of Energy Sustainable Disposal Cell Covers: LM Practices, Improvements, and Long-Term Performance March 2006 Doc. No. S0224000 Page C−3
Introduction Common cover design and performance evaluation approaches rely on instrumental climate records (e.g., DOE 1989). Many approaches implicitly assume that instrumental climate records and statistics adequately bound reasonable ranges of future climate. Instrumental climate records are rarely representative over the longer term because they are not extensive enough to capture the true variability of climate. Climate histories for the Colorado Plateau are, at best, 100 years long, and most are considerably shorter. The instrumental climate record for Monticello, Utah, is 52 years and the instrumental record for nearby Cedar Point, Utah, is 43 years. Use of records for only this time span such as these as a basis for designing and assessing the performance of disposal cell covers may not encompass climate-related events that the site will likely experience during the next 1,000 years. Proxies for past climate can provide records on the length and severity of droughts, intervals of increased effective moisture (a combination of increased precipitation and decreased temperature), and extreme events such as killing frosts. Knowledge of the frequency, duration, and magnitude of past climate states (defined here as periods of time during which a particular “type” of climate is dominant) relative to modern climate provides a means to assess the performance criteria of natural and engineered long-term cover sites. Past climate proxy records provided the basis for future climate estimates at Yucca Mountain, Nevada (Forester at al. 1999, USGS 2000, Sharpe 2002). These future climate estimates for Yucca Mountain have been input to models of the infiltration process to assess the performance of barriers for the storage of radioactive nuclear waste. Past Climate Records in the Four Corners Area One way to extend the instrumental climate record is to assess past climate using proxies such as geomorphological, geological, and geochemical evidence; and tree-rings, pollen, vegetation, and archaeological sites. These remains are common and well preserved on the Colorado Plateau because of the arid environment. Proxy records of past climate on the Colorado Plateau, and elsewhere, extend into the past for many tens of thousands of years. Proxy records can document past shifts in the magnitude, frequency, and duration of flood and drought periods; shifts from predominately winter to summer precipitation; and shifts in the annual distribution of temperature have been ascertained. Ely et al. (1993) found that floods during the last 5,000 years in the southwestern U.S. clustered into distinct time periods that coincided with cool, moist climate and frequent El Niño events. During this time span, floods were most numerous from about 4,800-3,600 yr B.P. (years before present), at about 1,000 yr B.P., and after 500 yr B.P. They decreased markedly between 3,600-2,200 and 800-600 yr B.P. Tree rings can also shed light on the magnitude, frequency, and duration of past climate events. Tree ring chronologies near Monticello (Schwartz 1994) indicate that the early 1900s were exceptionally moist and possibly cool, and the 1800s were relatively dry and possibly warm, but with fewer drought episodes than prior periods. Climate was more variable with an increased number of long, severe droughts and periodic moist periods before 1800 A.D. than afterward (Schwartz 1994). The most severe and longest droughts occurred before 1640 A.D. Four-hundred years of tree ring data from southeastern Utah (Fritts 1991) corroborates these findings suggesting that the droughts in the 1800s were not unusually severe when compared to droughts

Sustainable Disposal Cell Covers: LM Practices, Improvements, and Long-Term Performance U.S. Department of Energy Doc. No. S0224000 March 2006 Page C−4
of the 1600s. This same tree ring record was used to reconstruct precipitation in Moab, Utah (Cole et al. 1997). The frequency of drought events suggests that droughts occurred 9 times in the 1600s century, 4 times in the 1700s, and 7 times in the 1800s at Moab. In addition to tracking vegetation change, pollen records can be used to help determine the annual distribution of temperature and precipitation. In the Dolores, Colorado, area, only one drought occurred between 1,375 and 1,075 yr B.P. (at about 1,250 yr B.P.) but numerous droughts occurred between 1,075 and 775 yr B.P. (Breternitz et al. 1986). Growing seasons longer than 110 days occurred at about 1,400, between 1,250 through 1,150, and between 850−750 yr B.P. The period between 1,400 and 1,350 yr B.P. had numerous killing frosts (Breternitz et al. 1986). Packrat middens (nests) also provide a detailed vegetation history from which past climate may be inferred. Betancourt (1990), Sharpe (1991), and McVickar (1991) have published vegetation records from packrat middens from the southeastern Utah area from which Holocene vegetation succession and climate shifts are inferred. Changes in effective moisture and climatic variability are reflected in these records that collectively cover records older than the last 11,000 years. When used together, these proxy data provide a fairly detailed and robust long-term climate history. This history likely represents the climate variability that long-term cover sites will experience in the next 1,000 years better than historical records. Modern Climate Records in the Four Corners Area Modern climate summaries can include, but are not limited to, seasonal, annual, and extreme temperature and precipitation values; snowfall (average and extreme); snow depth (average and extreme); severe weather occurrences; and heating degree days, cooling degree days, and growing degree days. Periods of drought, wetter than average conditions, and shifts in the seasonality of temperature and precipitation to provide detailed data for Monticello and selected future climate analog sites. Future Climate Estimates for the Four Corners Area Future climate estimates for this report are based on the range and variability of past climates and computer-modeled global warming climate scenarios. The assumption is that past climate states will be repeated in the future so past climate states are used to represent future climate states. Computer-generated models are used to estimate global warming scenarios (Thompson et al. 1998, Hulme and Sheard 1999). This approach represents a reasonable range of variability encountered in the past and is expected to reasonably represent future climate. Selecting Future Climate Analog Sites Past climate can be categorized into climate states (a time period when one “type” of climate is dominant). Although past climate is composed of many different climate states, the reduction of climate states into several general categories provides a conservative estimate for future analog studies. By this it is meant that choosing several climate states rather than choosing one “worst case” scenario creates a more realistic basis for analog studies.

U.S. Department of Energy Sustainable Disposal Cell Covers: LM Practices, Improvements, and Long-Term Performance March 2006 Doc. No. S0224000 Page C−5
To compensate for the reduction of climate states in the past record relative to the types of climate that most likely occurred, and because spatial and temporal gaps in the paleoenvironmental record often exist, six general climate states were considered. This range of climate states will help to account for uncertainties associated with the paleoenvironmental record and the long time frame for future climate predictions. These climate states are considered to represent realistic, climate estimates for the selection of analog sites. Six future climate scenarios were selected based on a review of past climate proxy data and climate reconstructions and global climate change models. This approach provides a conservative estimate of climate change, while approximating reasonable future conditions. Assumptions for this approach include: Past climates provide insight into potential future climates. Climate states will vary in magnitude and duration in the future similarly to the way they have varied in the past. Climate is a driver for, and therefore affects, both biotic and abiotic processes. Although past climate proxies provide relative estimates of past climate parameters such as temperature and precipitation, it is often difficult to quantify those estimates. If those estimates are quantified, it is generally for a particular site that may have a short or truncated record or the site may contain temporal gaps. Elevations and microclimates may vary among sites, making correlation and quantification of sites across a geographical area problematic. However, published proxy records in the Four Corners Area sometimes provide estimates of climate conditions that can be used in a general way to reconstruct past climate states. For example, an increase in seasonal precipitation for a given period (Betancourt 1990) or change in temperature required for an assemblage of plants to occur (Breternitz et al. 1996) can provide boundaries between different climate states. Other examples include increased winter flooding corresponding to Southern Oscillation Index/El Niño conditions (Ely et al. 1993) from which precipitation estimates may be made. The climate states estimated for this report were developed in this way using published literature from the Four Corners Area (Anderson et al. 2000, Betancourt 1984, Betancourt 1990, Breternitz et al. 1996, Davis et al. 1984, Dean et al. 1985, Ely et al. 1993, Mead et al. 1987, Peterson 1988, Spaulding and Peterson 1980, West 1978) to estimate the range of climate variability during the last 5,000 years. Both seasonal and annual estimates were produced because past climate periods can vary seasonally, yet have the same annual average. Elements of past climate reported in the literature were used to produce seasonal estimates for four past climate states (relative to modern climate at Monticello): cold/dry, cold/wet, warm/dry, and warm/wet. Estimates on the timing and duration of these past states were not made because they are not needed for this analysis. Global warming scenarios were also investigated. Two disparate computer-generated global warming scenarios were selected: one scenario that is warmer/drier based on both January and July data (Hulme and Sheard 1999) and another scenario that is warmer and wetter in December−February and warmer but with no precipitation change in June through August (Thompson et al. 1998).

Sustainable Disposal Cell Covers: LM Practices, Improvements, and Long-Term Performance U.S. Department of Energy Doc. No. S0224000 March 2006 Page C−6
Once the past climate states were identified, geographic locations representing those climate states (future analog locations) were selected. Selection criteria for analog stations include
• Proximity to the Four Corners region to account for similar atmospheric circulation patterns.
• Stations with long and complete records, such as stations with periods of record exceeding 50 years and observations greater than 95 percent, if possible.
• Annual and seasonal temperature and precipitation values representing the past climate states.
• Stations located on the soil type used as the soil cover at the Monticello site. Table C−1 shows stations and values selected as initial possibilities for inclusion in this study. Values were obtained from the Western Regional Climate Center database (http://www.wrcc.dri.edu/climsum.html). The ranges of temperature and precipitation values in the initial selection were greater than the estimated ranges of past values, but these sites were included because they met the first two listed criteria.
Table C−1. Meteorological Records for Monticello and All Candidates for Climate Analogs.
Temperature (T) ºF Precipitation (P) in.
Jan Avg T
Jan P
July Avg T
July P
DJF T
DJF P
JJA T
JJA P
Annual T
Annual P
UT Monticello 24.9 1.5 68.4 1.5 37.9 3.8 81.3 4.1 46.1 15.2 UT Needles 28.3 0.6 78.4 0.9 44.0 1.5 92.2 2.3 53.3 8.5 UT Castleton 25.4 0.6 75.4 1.5 38.8 2.1 86.5 4.1 50.3 13.9 UT Blanding 27.8 1.4 73.0 1.2 41.6 3.9 85.8 3.0 50.1 13.4 UT Moab 30.1 0.7 80.3 0.8 45.8 2.0 95.2 2.1 55.8 9.0 UT Cedar Point 25.5 1.4 69.9 1.3 39.0 3.9 83.5 3.3 46.9 15.2 UT Montezuma Creek 28.0 1.7 70.8 1.1 38.0 3.7 84.1 3.0 47.2 12.8 UT Hovenweep 27.5 1.0 76.0 0.9 43.9 2.9 91.8 2.3 51.7 11.2 UT Bluff 30.2 0.7 78.8 0.7 46.0 2.1 93.4 1.7 54.5 7.8 UT Natural Bridges 29.2 1.0 74.1 1.4 41.9 2.8 86.4 3.5 50.6 12.6 CO Gateway 29.6 0.8 77.0 1.0 45.1 2.1 90.0 2.9 53.7 11.3 CO Mancos 28.1 1.5 67.3 1.8 41.9 4.0 81.4 4.3 47.1 16.7 CO Fort Lewis 22.9 1.7 64.6 2.1 38.6 4.4 78.5 5.1 43.1 18.4 CO Durango 24.9 1.6 67.5 1.9 41.9 4.9 83.0 5.1 46.3 19.1 CO Mesa Verde 29.0 1.9 71.4 1.8 41.5 4.9 83.7 4.5 49.3 18.1 CO Cortez 26.8 1.0 71.3 1.2 43.1 3.1 86.0 3.3 48.6 13.2 CO Uravan 28.8 0.9 77.0 1.3 45.1 2.5 92.1 3.1 53.0 12.7 CO Northdale 23.2 0.9 68.4 1.3 38.9 2.5 83.7 3.2 45.5 12.2 CO Yellow Jacket 26.2 1.2 70.6 1.5 39.9 3.6 83.8 3.8 47.8 15.9 AZ Betatakin 30.2 1.1 72.1 1.3 41.0 3.1 83.4 3.5 49.9 12.1
T = temperature; P = precipitation; DJF = December, January, February; JJA = June, July, August
The list was reduced to the sites in Tables C−2 and C−3 after further investigation and subsequent field reconnaissance. Field reconnaissance showed that Table C−2 sites are located on sandy/loam to silty/loam soils, similar to the Monticello disposal cell cover. Vegetation at all sites included sagebrush (Artemisia tridentata), which presently grows at the Monticello site,

U.S. Department of Energy Sustainable Disposal Cell Covers: LM Practices, Improvements, and Long-Term Performance March 2006 Doc. No. S0224000 Page C−7
although the sites ranged in elevation from 5,040 to 7,600 ft above mean sea level. Some of these selected climate states satisfy more than one climate state scenario. Long-term records exist for all these sites and include the following data:
• Average monthly maximum and minimum temperature
• Average monthly maximum and minimum precipitation
• Daily and monthly extremes
• Highest/lowest recorded temperatures and dates
• Heating degree days
• Cooling degree days
• Seasonal averages
Table C−2. Locations and Modern Climate States for Selected Climate Analog Sites.
Location Climate Statea Monticello, Utah Modern (reference) and global warming summer scenario A
Fort Lewis, Colorado Cold/wet
Needles District (Canyonlands National Park), Utah Warm/dry, and global warming winter scenario B
Mesa Verde National Park, Colorado Warm/wet and global warming winter scenario A
Blanding, Utah Global warming summer scenario B
Northdale, Coloradob Cold/dry aRelative to modern climate at Monticello, Utah. bNorthdale, Colorado, was initially selected as the analog site for the cold/dry future climate state but field reconnaissance determined that the site would not be as productive as a different location. Additional field work is required to select an alternate site for this climate state.
Table C−3. Elevations and Years of Meteorological Records for Selected Climate Analog Sites.
Location Station Elevation (feet above mean sea level)
Years of Record
Monticello, Utah 6,820 1948-2001
Fort Lewis, Colorado 7,600 1948-2001
Needles District (Canyonlands National Park), Utah 5,040 1965-2001
Mesa Verde National Park, Colorado 7,110 1948-2001
Blanding, Utah 6,040 1904-2001
Northdale, Colorado 6,680 1948-2000

Sustainable Disposal Cell Covers: LM Practices, Improvements, and Long-Term Performance U.S. Department of Energy Doc. No. S0224000 March 2006 Page C−8
Figure C−1 presents the elevation of each climate analog station is graphed below. These sites form an elevational, and hence, a climatic, gradient so temperature and precipitation values can be interpolated if desired.
Figure C−1. Elevation Gradient for Climate Analog Stations. Figures C−2 and C−3 display the climate analog stations along seasonal temperature and precipitation gradients. The figures shows the January and July temperatures and precipitation at each analog site and the average seasonal summer or winter temperature and precipitation. Note that each station does not hold the same position relative to the other stations between summer and winter or even between the monthly and seasonal averages. Therefore, it is important to consider seasonal averages when selecting analog sites rather than annual averages.
Fort Lewis, Colorado: cold/wet
Mesa Verde National Park, Colorado: warm/wet and global warming winter
scenario AMonticello, Utah:
modern and global warming summer scenario A
Northdale, Colorado: cold/dry
Blanding, Utah:global warming summer
scenario B
Needles (Canyonlands National Park), Utah: Warm/dry, global warming winter
scenario B
4000
4500
5000
5500
6000
6500
7000
7500
8000
0 1 2 3 4 5 6 7 8
Elev
atio
n (fe
et a
bove
MSL
)

U.S. Department of Energy Sustainable Disposal Cell Covers: LM Practices, Improvements, and Long-Term Performance March 2006 Doc. No. S0224000 Page C−9
January and December, January, February Average
0
1
2
3
4
5
6
20 25 30 35 40 45 50
Temperature º F
Prec
ipita
tion
/ inc
hes
Monticello, UT
Needles (Canyonlands), UT &Global Warming Scenario B
Blanding, UT
Fort Lewis, CO
Northdale, CO
January only December, January, February Average
Fort Lewis, CO
Monticello, UT
Northdale, CO
Mesa Verde NP, CO &Global Warming Scenario A
Blanding, UT
Needles (Canyonlands), UT &Global Warming Scenario B
Mesa Verde NP, CO &Global Warming Scenario A
Figure C−2. Climate Analog Stations Grouped by Winter Precipitation and Temperature.
Figure C−2. Climate Analog Stations Grouped by Summer Precipitation and Temperature.
July and June, July, August Average
0
1
2
3
4
5
6
60 65 70 75 80 85 90 95 100
Temperature º F
Prec
ipita
tion
/ inc
hes
Monticello, UT & Global Warming Scenario A
Needles (Canyonlands), UT
Blanding, UT & Global Warming Scenario B
Fort Lewis, CO Mesa Verde NP, CO
Northdale, CO
July June, July, August Average
Fort Lewis, CO
Mesa Verde NP, CO
Monticello, UT & Global Warming Scenario A
Northdale, CO Blanding, UT &Global Warming Scenario B
Needles (Canyonlands), UT

Sustainable Disposal Cell Covers: LM Practices, Improvements, and Long-Term Performance U.S. Department of Energy Doc. No. S0224000 March 2006 Page C−10
References Anderson, R.S., Betancourt, J.L., Mead, J.I., Hevly, R.H., and Adam, D.P., 2000, Middle- and Late-Wisconsin Paleobotanic and Paleoclimatic Records from the Southern Colorado Plateau, USA: Palaeogeography, Palaeoclimatology, Palaeoecology, v. 155, p. 31-57. Betancourt, J.L., 1984, Late Quaternary Plant Zonation and Climate in Southeastern Utah: The Great Basin Naturalist, v. 44, p. 1-35. Betancourt, J.L., 1990, Late Quaternary Biogeography of the Colorado Plateau, in Betancourt, J.L., van Devender, T.R., and Martin, P.S., eds., Packrat Middens: The Last 40,000 Years of Biotic Change: Tucson, The University of Arizona Press, p. 259-292. Breternitz, D.A., Robinson, C.K., and Gross, G.T., 1986, Dolores Archaeological Program: Final Synthetic Report, United States Department of the Interior, 900 p. Cole, K.L., Henderson, N., and Shafer, D.S., 1997, Holocene Vegetation and Historic Grazing Impacts at Capitol Reef National Park Reconstructed Using Packrat Middens: Great Basin Naturalist, v. 57(4), p. 315-326. Davis, O.K., Agenbroad, L.D., Martin, P.S., and Mead, J.I., 1984, The Pleistocene Dung Blanket of Bechan Cave, Utah: Contributions in Quaternary Vertebrate Paleontology: Carnegie Museum of Natural History Special Publication, v. 8, p. 267-282. Dean, J.S., Euler, R.C., Gumerman, G.J., Plog, F., Hevly, R.H., and Karlstrom, T.N., 1985, Human behavior, demography, and paleoenvironment on the Colorado Plateaus: American Antiquity, v. 50, p. 537-554. Ely, L.L., Enzel, Y.E., Baker, V.R., and Cayan, D.R., 1993, A 5000-Year Record of Extreme Floods and Climate Change in the Southwestern United States: Science, v. 262, p. 410-412. Forester, R.M., Bradbury, J.P., Carter, C., Elvidge-Tuma, A.B., Hemphill, M.L., Lundstrom, S.C., Mahan, S.A., Marshall, B.D., Neymark, L.A., Paces, J.B., Sharpe, S.E., Whelan, J.F., and Wigand, P.E., 1999, The Climatic and Hydrologic History of Southern Nevada During the Late Quaternary: Open-File Report 98-635, Denver, Colorado: U.S. Geological Survey. Fritts, H.C., 1991, Climate reconstructions data and display software. Program accompanying "Reconstructing large-scale climatic patterns from tree-ring data: a diagnostic analysis." Tucson, University of Arizona Press. Hulme, M., and Sheard, N., 1999, Climate Change Scenarios for the USA, Climatic Research Unit: Norwich, UK 6 p. http://www.cru.uea.ac.uk/~mikeh/research/usa.pdf McVickar, J.L., 1991, Holocene Vegetation Change at Cowboy Cave, Southeastern Utah, and its Effect Upon Human Subsistence [Master of Science thesis]: Flagstaff, Northern Arizona University, 146 p.

U.S. Department of Energy Sustainable Disposal Cell Covers: LM Practices, Improvements, and Long-Term Performance March 2006 Doc. No. S0224000 Page C−11
Mead, J.I., Agenbroad, L.D., Phillips, A.M. III, and Middleton, L.T., 1987, Extinct Mountain Goat (Oreamnos harringtoni) in Southeastern Utah: Quaternary Research, v. 27, p. 323-331. Peterson, K.L., 1988, Climate of the Dolores River Anasazi, University of Utah Anthropogical Papers 113: Salt Lake City, University of Utah Press, 152 p. Schwartz, E., 1994, A Dendrochronological Study of Holecene Climatic Fluctuations in the Canyonlands Area of Southeastern Utah [Master of Science thesis]: Saarbrucken, Universitat des Saarlandes, 90 p. Sharpe, S.E., 1991, Late-Pleistocene and Holocene Vegetation Change in Arches National Park, Grand County, Utah and Dinosaur National Monument, Moffat County, Colorado [Master of Science thesis]: Flagstaff, Northern Arizona University, 96 p. Sharpe, S.E., 2002, Future Climate Analysis – 10,000 to 1,000,000 Years After Present. Office of Civilian Radioactive Waste Management. MOD-01-001. MOL.20020422.0011. Yucca Mountain Project, 66 p. Spaulding, W.G., and Peterson, K.L., 1980, Late Pleistocene and Early Holocene Paleoecology of Cowboy Cave, in Jennings, J., ed., Cowboy Cave: Salt Lake City, University of Utah Press, p. 163-177. Thompson, R.S., Hostetler, S.W., Bartlein, P.J., and Anderson, K.H., 1998, A Strategy for Assessing Potential Future Changes in Climate, Hydrology, and Vegetation in the Western United States: U.S. Geological Circular 1153, 20 p. U.S. Geological Survey, 2000, Future Climate Analysis. ANL-NBS-GS-000008 REV 00. Denver, Colorado: U.S. Geological Survey, 83 p. West, G.J., 1978, Recent Palynology of the Cedar Mass Area, Utah [Dissertation thesis]: Davis, University of California, 175 p. Western Regional Climate Center, Historical Climate Summaries, http://www.wrcc.dri.edu/climsum.html.

Sustainable Disposal Cell Covers: LM Practices, Improvements, and Long-Term Performance U.S. Department of Energy Doc. No. S0224000 March 2006 Page C−12
End of current text

Appendix D Case Study:
Soil Morphology and Hydrology of Analog Sites for the Monticello, Utah, Disposal Cell Cover
Eric V. McDonald and Todd G. Caldwell Desert Research Institute, Reno, NV


U.S. Department of Energy Sustainable Disposal Cell Covers: LM Practices, Improvements, and Long-Term Performance March 2006 Doc. No. S0224000 Page D−3
Introduction Evapotranspiration (ET) covers are gaining acceptance at arid and semi-arid sites for waste site closure based on water-balance and related studies being conducted at the Monticello, Utah, Disposal Site (Waugh et al. 2004); the Nevada Test Site (Schafer et al. 2003), Sandia National Laboratories (Dwyer 1997), Pacific Northwest National Laboratories at Hanford (Gee et al. 1997) and at more than a dozen sites across the United States through the Environmental Protection Agency (EPA) Alternative Cover Assessment Program (ACAP) (Albright et al. 2004). ET covers cannot be viewed as static features. Covers will be subject to natural processes of change the same as any alluvial/colluvial landform, particularly after the period when cover maintenance ends. These changes, and their subsequent impact on long-term cover performance, are difficult to capture in performance modeling and, in many cases, are poorly understood. Among the most significant shortcomings is our understanding of the relationships between climate change, soil water dynamics, and soil morphologic development in arid regions (McDonald 2002). If the Holocene period is an example, the potential for change to these covers over 1,000+ years is significant. To supplement traditional approaches of cover design and performance prediction, a series of analog sites was identified to serve as predictive tools for how an ET cover could evolve over 1,000-year and 10,000-year periods. Instrumental climate records cover a limited period (<100 years). One way to extend the climate record is to assess past climate using proxies such as geomorphological, geological and geochemical evidence; and tree-rings, pollen, vegetation, and archaeological sites (Saxon 2003, Rhoade 2003). Proxies for past climate can provide records on the length and severity of droughts, intervals of increased effective moisture (a combination of increased precipitation and decreased temperature), and extreme events such as killing frosts. Knowledge of the frequencies, durations, and magnitudes, of past climate states (defined here as periods of time during which a particular “type” of climate is dominant) relative to modern climate provides a means to assess the performance criteria of natural and engineered long-term cover sites. By understanding how a cover could change over time, modifications can be made to ET cover design, maintenance, and monitoring in the near term that will improve its long-term performance. The most widespread use of ET covers is in arid and semi-arid regions where the following environmental processes will modify the cover over time:
• Pedogenic development
• Erosion, aeolian deposition, and other surface modifications
• Vegetation growth and succession
• Biointrusion from plants and animals
• Subsidence The goal of this project was to better characterize the geomorphic processes that will affect ET covers in the Four Corners Area, focusing on the 1,000-year performance period. Two analog sites were chosen to represent soil development and vegetation change.

Sustainable Disposal Cell Covers: LM Practices, Improvements, and Long-Term Performance U.S. Department of Energy Doc. No. S0224000 March 2006 Page D−4
Methods Site Description Analog sites were chosen parent material and particle size (sandy-loam to silt-loam) similar to characteristics of the found at the cap at the Uranium Mill Tailings Repository, Monticello, Utah, Disposal cell cover (Table D−1). Two proxy climates from Appendix B represent potential climatic scenarios of warm and dry (Blanding, Utah) and cold and wet (Fort Lewis, Colorado). The Blanding analog site, an abandoned kiva, will serve as a proxy for future soil development (~1,000 years) that may occur at the Monticello Disposal Cell. The Fort Lewis analog serves to help predict vegetation and/or climate change to the Monticello ecosystem.
Table D−1. General Site Information for Analog Sites
Location Elevation (ft) Years of Record Climate State Monticello, Utah 6,820 1948-2001 Modern (reference) Blanding, Utah 6,040 1904-2001 Warm/dry Fort Lewis, Colorado 7,600 1948-2001 Cold/wet
The Monticello Disposal Cell is located about 3 km south of Monticello, Utah, east of US Highway 191. The repository covers approximately 32 ha. The ACAP test section, a 3-ha lysimeter used to approximate the full cover, was used in this study. The Monticello site is situated in an arid climate, which annually receives 15.1 inches (384 mm) of precipitation on average (Western Regional Climate Center). Planted vegetation consists primarily of sagebrush (Artemisia tridentata). The Blanding, Utah, kiva site is located at the Edge of the Cedars State Park, a puebloan occupation complex approximately 35 km south of Monticello. These ruins were occupied ca. AD 1080-1130, subsequently abandoned and filled in with loess (Rhode 2003). Therefore, this site serves as an analog proxy for future, 1,000-year soil development at the Monticello Disposal Cell. There is no perennial vegetation on this site. The Fort Lewis site is located at the original Old Fort Lewis about 40 miles north of Farmington, New Mexico, and 17 miles southwest of Durango, Colorado. It is now known as the San Juan Basin Research Center. The 6,300-acre research center has an elevation of 7,600 ft and receives 18.5 inches of precipitation annually. Two sites were consisting of primarily oak (Quercus) forest and Ponderosa Pine (Pinus ponderosa) chosen to serve as a proxies for vegetation change. Soil Characterization Soils were described from trenches excavated at all reference and analog sites. Representative bulk samples for laboratory analysis were collected from each horizon in each profile. Soil characteristics were described according to standard methods employed by the USDA Natural Resources Conservation Service (NRCS) Soil Survey (Soil Survey Staff 1999) and soil geomorphic methods of Birkeland (1999).

U.S. Department of Energy Sustainable Disposal Cell Covers: LM Practices, Improvements, and Long-Term Performance March 2006 Doc. No. S0224000 Page D−5
All soils sampled in this investigation were analyzed in the DRI Soil Characterization and Quaternary Pedology Laboratory for physical and chemical parameters listed in Table D−2.
Table D−2. Laboratory Analyses
Analysis Analysis method Reference: Particle Size Distribution Laser Light Scattering Gee and Or (2002) Calcium Carbonate Chittick Apparatus Dreimanis (1962), Machette (1985) Bulk Density Ped and Excavation Grossman and Reinsch (2002)
Hydraulic Properties The tension infiltrometer (TI) method (Ankeny et al. 1988, Reynolds and Elrick 1991) was used to determine the soil hydraulic properties of discrete soil horizons at each of the three sites. Surface measurements were taken by first lightly clearing away surface debris, duff, and stones. Subsurface soil horizon measurements were conducted on terraces excavated to depth along the soil trench wall. Leveled terraces were carefully smoothed and cleaned using a gentle compressed air stream to avoid smearing pores. A steel template was placed onto the soil surface and leveled appropriately. Moistened contact sand was carefully spread onto the soil surface and within the template to maximize the hydraulic contact between the membrane material on the TI and the soil surface. The TI was filled with water, checked for proper adjustment of tension, and placed carefully onto the sand pad. Data were collected from differential pressure transducers (Casey et al. 2002) at intervals of 15 seconds. Manual readings were taken periodically to verify operation and to better identify when the intake rate was at or near steady state. When this occurred, the infiltrometer was reset to a lower tension level. Four tension steps were used for each test, typically at levels set to -12, -6, -2, and –0.5 cm. Prior to each individual test, pre-test soil samples were taken for initial water content (θi) and matric potential (ψi). Water content was determined gravimetrically. Initial matric potential was determined using a dew point potentiometer (Decagon Devices, Inc., Pullman, Washington) or the chilled mirror dew point technique (Gee et al. 1992). The most current model (WP4) was used with a range of 0 to –60 MPa (± 0.1 MPa). Initial conditions are required for more robust model parameterization. At the conclusion of each test, the infiltrometer and contact sand were removed and a bulk density sample was collected. Samples were obtained with a soil ring (5 cm diameter by 2.5 cm high) pressed into the soil near the center of the infiltrated area. The ring was removed using a hand trowel and leveled appropriately to better define the sample volume. Samples were stored in Ziploc bags to prevent water loss, returned to the laboratory for final volumetric water content (θf). Data were downloaded from the datalogger to a personal computer and post-processed at the DRI. Data were analyzed using a manual, semi-empirical method and a numerical method. The former method relies primarily on data collected toward the end of each tension step when the cumulative flux rate is constant in time, and provides estimates of the saturated hydraulic conductivity and conductivity – water potential function [K(ψ)]. The latter method uses all the data and results in estimates of the conductivity and water retention functions [ψ(θ)].

Sustainable Disposal Cell Covers: LM Practices, Improvements, and Long-Term Performance U.S. Department of Energy Doc. No. S0224000 March 2006 Page D−6
Wooding’s Analysis Vertical infiltration is initially governed by capillarity or sorptivity of water into the soil matrix, containing both vertical and horizontal components. Long-time infiltration becomes gravity driven and linear with time as soil capillarity forces are reduced. This long-time infiltration is then assumed to be at steady state. On the basis of Gardener’s exponential K(h) function, three dimensional, steady-state infiltration from a circular source was solved by Wooding (1968):
⎟⎠⎞
⎜⎝⎛ +=
απα
r41)hexp(K)h(q sat [1]
where Ksat is the fitted saturated conductivity (cm sec-1), h is the supply tension (-cm H2O), r is the infiltrometer radius (cm), and α (cm-1) is a curve fitting parameter related to soil pore-size distribution. The term q(h) is the steady-state infiltration at the given supply tension. The term left of the parenthesis is representative of vertical gravity flow, and the term on the right accounts for lateral movement due to capillarity. The resulting equation contains two unknowns, Ksat and α. Using the TI through a range of tensions, paired values of flux [q(h)] and tensions (h) are obtained. These known values are inputted to a nonlinear least-squares regression routine to solve for the two unknowns (e.g., Ksat andα) by minimizing error through iterative solutions (Logsdon and Jaynes 1993). HYDRUS modeling for parameter estimation In addition to using Wooding’s solution for obtaining Ksat and α, a complete set of hydraulic properties can be obtained through numerical inversion of the cumulative infiltration data (mL s−1) and known changes of boundary conditions (Simunek and van Genuchten 1996, 1997). Cumulative flux is measured with a pressure transducer mounted onto the TI, which is then programmed to collect data every 15 seconds. The change in pressure readings is converted to flux using the known diameter of the reservoir. To complete these analyses, an axisymmetric finite element code was applied (Simunek et al. 1996) to iteratively optimize parameters in the van Genuchten (1980) form of the soil water retention curve, and in the hydraulic conductivity equation derived by Mualem (1976) and modified by van Genuchten (1980). The retention curve has the form
mnvgrs
re
)h1(
1)h()h(
αθθθθ
θ+
=−−
= h < 0 [2]
and the unsaturated hydraulic conductivity function is defined as a function of θ,
2mm
1e
21esat 11K)(K
⎥⎥⎦
⎤
⎢⎢⎣
⎡⎟⎟⎠
⎞⎜⎜⎝
⎛−−= θθθ h < 0 [3]

U.S. Department of Energy Sustainable Disposal Cell Covers: LM Practices, Improvements, and Long-Term Performance March 2006 Doc. No. S0224000 Page D−7
where θe is the effective volumetric water content, θs is the saturated volumetric water content, θr is the residual water content as h→-∞, n and m are empirical parameters where m = 1-1/n, and αvg (cm-1) is an empirical fitting parameter similar, though not equal, to the inverse air entry value. The parameters are obtained by using a Levenburg-Marquardt optimization procedure that seeks to minimize the differences between measured responses in the field (e.g., cumulative flux) versus those predicted using the model. The objective function that results from the optimization routine is calculated using:
[ ]2
1
*,
1),,(),(),,( ∑ −∑=Φ
==
qjq n
iijijji
m
jj btzqtzqwvpqb [4]
where the first term on the right-hand side represents deviations between the measured and calculated space-time variables (e.g., observed pressure heads (ψi), water contents (θi and θf), and/or concentrations at different locations and/or time in the flow domain, or the actual or cumulative flux versus time across a boundary of specified type). In this term, mq is the number of different sets of measurements, nqj is the number of measurements in a particular measurement set, qj*(x,ti) represents specific measurements at time ti for the jth measurement set at location x(x,ti), qj(x,ti,b) are the corresponding model predictions for the vector of optimized parameters b (e.g., θr , θs , a, n, and Ks), and vj and wi,j are weights associated with a particular measurement set or point, respectively. The second term of Ф represents differences between independently measured and predicted soil hydraulic properties (e.g., retention, θ(h) and/or hydraulic conductivity, K(θ) or K(h) data), while the summation indices have meanings similar to the first term but now for soil hydraulic properties. The last term of Ф represents a penalty function for deviations between prior knowledge of the soil hydraulic parameters, bj*, and their final estimates, bj, with nb being the number of parameters with prior knowledge and j representing pre-assigned weights. HYDRUS-2D completes iterating when a global minimum M(b,q,p) is found. The result of the numerical inversion is a series of fitting parameters and physical properties of the soil that will be used in combination with future climatic scenarios to assess future long-term cover performance. Results Soil Morphology Properties Tables D−3 and D−4 present soil morphology and laboratory results. The horizon type and morphology of each profile is described in more detail below.

Sustainable Disposal Cell Covers: LM Practices, Improvements, and Long-Term Performance U.S. Department of Energy Doc. No. S0224000 March 2006 Page D−8
Table D−3. Laboratory Results for Monticello, Utah, and the Kiva Analog Site in Blanding, Utah
Site Horizon Depth Bulk Density %Gravel %Sand %Silt %Clay CaCO3
cm g cm-3 > 2 mm >62.5 μm 15 μm 3 μm <3 μm % Ap1 0−6 1.48 0.0 46.4 22.8 16.9 13.9 0.27 Ap2 6−20 1.70 0.0 41.9 24.9 16.9 16.3 0.27 BA 20−32 1.63 0.4 41.7 25.3 16.5 16.4 0.00
Bw/Bwk 32−55 1.52 0.5 36.2 26.0 19.3 18.5 0.27 Bwk1 55−79 1.49 0.3 38.2 23.6 19.8 18.4 0.49 Bwk2 79−99 1.56 1.9 39.8 24.5 18.0 17.8 0.93 Bwk3 99−126 1.65 0.1 44.2 22.5 15.8 17.4 0.81
B+k1b1 126−160 1.66 0.6 32.1 23.3 23.0 21.6 0.78 B+k2b1 160−178 1.71 8.1 31.5 11.5 31.4 25.6 0.59
Ap1 0−6 ND 0.0 44.4 24.6 17.5 13.7 0.27 Ap2 6−17 ND 0.5 41.9 24.6 16.9 16.7 0.27 BA 17−30 ND 3.9 39.3 23.6 19.7 17.4 0.61
Bwk1 30− 46 1.61 2.3 34.9 21.0 24.1 19.9 2.89 Bwk2 46−72 ND 0.3 39.7 22.3 20.3 17.7 1.16
Monticello Reference
Site
Bwk3 72−109 ND 0.8 44.1 20.6 18.3 17.2 0.60 A1 0−17 1.37 0.1 38.5 21.8 22.5 17.2 0.49 A2 17−31 1.33 0.1 41.0 19.7 20.6 18.7 0.22
A3 (Ac) 31−43 1.35 0.1 41.6 20.9 19.7 17.7 1.92 C 43−59 1.37 0.2 50.8 19.1 15.4 14.8 2.58
Ab1 59−71 ND 0.0 55.1 17.4 13.6 13.9 2.48 Cb1 71−96 ND 0.0 52.4 18.8 13.7 15.1 6.53 Acb2 96−117 ND 0.1 53.0 17.3 13.6 16.1 7.91 C1b2 117−143 ND 0.3 51.5 18.8 15.2 14.6 7.63
Blanding Kiva Site
C2b2 143−157 ND 0.7 50.4 20.4 14.7 14.5 2.68 ND – not determined

U.S. Department of Energy Sustainable Disposal Cell Covers: LM Practices, Improvements, and Long-Term Performance March 2006 Doc. No. S0224000 Page D−9
Table D−4. Laboratory Results for Fort Lewis Oak and Pine Analog Sites
Site Horizon Depth Bulk Density %Gravel %Sand %Silt %Clay CaCO3
cm g cm-3 > 2 mm >62.5 μm 15 μm 3 μm <3 μm % O1 +10 ND ND ND ND ND ND ND O2 +4 ND 2.2 50.4 26.4 16.2 7.1 0.71 A 0–5 ND 0.3 36.0 37.1 18.1 8.7 0.33
AB 5–12 1.30 0.0 32.0 35.6 19.1 13.3 0.27 AE 12–24 1.36 0.5 28.4 37.2 18.4 16.1 0.28 BA 24–38 1.54 5.8 27.1 35.7 18.8 18.5 0.26 B+1 38–78 1.69 0.0 27.0 33.0 20.0 20.0 0.33 B+2 78–124 1.54 0.0 26.5 31.5 20.5 21.5 0.38
AEb1 124–137 1.71 0.0 31.1 30.9 18.9 19.0 0.27 B+1b1 137–158 1.76 0.6 25.3 22.1 26.8 25.7 0.38
Fort Lewis Ponderosa
Pine
B+2b1 158–168 ND 1.0 24.5 29.6 21.6 24.3 0.22 A 0–7 0.99 1.2 44.7 30.2 17.0 8.2 0.36
BA 7–21 1.37 0.6 35.7 33.0 17.7 13.6 0.37 Bw1 21–41 1.46 1.1 33.8 33.6 16.4 16.2 0.32 Bw2 41–64 1.61 0.6 29.9 33.0 17.7 19.4 0.38
Bt1B1 64–91 1.68 5.6 34.0 24.2 20.4 21.4 0.38 2Bt1b1 91–116 1.62 55.5 49.6 16.7 17.1 16.6 0.27
Fort Lewis Oak
2B+2b1 116–135 ND 57.8 52.7 13.4 19.2 14.7 0.27 ND = not determined. Hydraulic Properties of Analog Sites A total of 11 measurements were conducted at three sites using multi-tension infiltrometry. Data were interpreted by Wooding’s analysis of constant flux and numerical inversion using the HYDRUS-2D code. Both analytical techniques matched the field data well in each case. Using coefficient of determination (r2) as one measure of success, the lowest r2 values obtained were 0.904 and 0.996 using Wooding’s approach and HYDRUS-2D, respectively. The results of the Wooding’s analysis, the saturated conductivity (Ksat) and Gardener’s α parameters, were obtained using supply tension and constant outflow as input variables. The α provides a measure of how quickly the hydraulic conductivity decreases with decreasing (more negative) tension; higher values of α translate into more rapid decline in conductivity with decreasing tension and a wider pore-size distribution. A more rapid decline could be caused by either larger pore classes that drain more readily under gravity, or soil water hydrophobicity (Yang et al. 1996) that can be caused by highly organic or fire-affected soils. The results of Wooding’s analysis (Table D−5) indicate that Ksat was highest at the Blanding kiva for all depths. The highly structured, albeit only 1,000-year old, prismatic ped features of the A horizon associated with the kiva allow for the most rapid transmission of water, with conductivity remaining above 2 cm hr-1 to depths >59 cm. The alpha term (α) illustrates the influence of soil development on hydraulic conductivity. The pore-size distribution widens as α increases from the reference Monticello site (0.126) to Fort Lewis (0.458). These results indicate that pore-size distributions are widening as larger pores develop either through bioturbation or pedogenic processes. Similarly, the large-pore network generally present in forested soils (Wilson and Luxmoore 1988) conducts water rapidly near saturation at the surface. However,

Sustainable Disposal Cell Covers: LM Practices, Improvements, and Long-Term Performance U.S. Department of Energy Doc. No. S0224000 March 2006 Page D−10
conductivity of the thicker BA horizon below was substantial lower with a larger α value. Both structured analog sites have higher α values and, thus, conductivity rapidly declines as the soil deviates from saturation (Figure D−1). Wooding’s solution is a limited to conductivity function for a given soil-water head. Numerical inversion allows not only the development of a robust unsaturated conductivity function, but also the water retention functions.
Table D−5. Results of Wooding’s Empirical Solution for Saturated Conductivity (Ksat) and Gardener’s α. Error is represented as the least squares residual (R2) between the actual flux and the calculated flux for
each supply tension.
Site Horizon Depth (cm)
Ksat
(cm hr-1) α
(cm-1) R2
Surface 0–7 1.69 0.126 0.983 BA 7–126 1.17 0.150 0.935
Bwk3 126–160 3.11 0.220 0.990 Monticello, Utah Reference Site
Btk1b1 160 + 1.06 0.182 0.966 Surface 0–17 2.03 0.139 0.993
A1 17–59 2.87 0.105 0.931 Blanding, Utah 1,000 yr Kiva
C 59 + 6.20 0.170 0.974 Surface 0–7 1.44 0.458 0.969
BA 7–43 0.82 0.304 0.904 Bt1B1 43–91 1.15 0.267 0.991
Fort Lewis, Colorado Oak Site
Bt2B1 91 + 1.24 0.222 0.985
Figure D−1. Surface Conductivity Functions for the Effective Supply Head (he)
In addition to using Wooding’s solution for obtaining Ksat and α, a complete set of hydraulic properties were obtained through numerical inversion of the cumulative infiltration data (mL sec-1) and known changes of boundary conditions, using the HYDRUS 2D program (Simunek and van Genuchten 1997). Initial moisture conditions and surface boundary conditions must be specified for unique parameter estimation. Table D−6 lists the initial soil moisture conditions used to model the cumulative infiltrometer data. Note the higher initial water contents at the Ft.

U.S. Department of Energy Sustainable Disposal Cell Covers: LM Practices, Improvements, and Long-Term Performance March 2006 Doc. No. S0224000 Page D−11
Lewis site were due to prevailing thunderstorms during data collection. The bulk densities and final water contents (θf) in Table D-6 were determined directly beneath the disk infiltrometer.
Table D−6. Initial Soil Moisture Parameters for Inverse Parameter Estimation
Site Horizon Depth (cm)
Initial Potential
(Mpa)
Bulk Density (g cm-3)
θi θf
Surface 0–7 ND 1.48 0.034 0.343 BA 7–126 ND 1.57 0.035 0.336
Bwk3 126–160 ND 1.56 0.043 0.324 Monticello, Utah Reference Site
Btk1b1 160 + ND 1.51 0.069 0.309 Surface 0–17 -13.8 1.52 0.070 0.380
A1 17–59 -8.92 1.43 0.056 0.371 Blanding, Utah -1,000 yr Kiva
C 59 + -36.5 1.37 0.057 0.385 Surface 0–7 -0.02 0.99 ND 0.382
BA 7–43 -0.01 1.36 0.200 0.340 Bt2B1 43–91 ND 1.60 0.194 0.264
Ft. Lewis, Colorado Oak Site
91 + -0.8 1.62 0.184 0.309 ND = not determined
One significant advantage of using HYDRUS-2D instead of the semi-empirical Wooding’s Equation [1] is that water retention functions can also be estimated for a limited soil-water suction range. The parameters θs, α, and n are related to the retention curve through Equation [2] and can be estimated through routine TI data collection. The results of the numerical inversion simulations using HYDRUS-2D are given in Table D−7.
Table D−7. Hydraulic Parameters from HYDRUS-2D and Associated Error (R2)
Site Horizon Depth (cm) θsat θvg N Ksat
(cm hr-1) R2
Surface 0–7 0.341 0.089 3.00 1.09 0.99950 BA 7–126 0.334 0.093 2.45 0.80 0.99940 Bwk3 126–160 0.324 0.132 2.89 2.38 0.99827
Monticello, Utah Reference Site
Btk1b1 160 + 0.324 0.122 3.66 0.61 0.99960 Surface 0–17 0.380 0.093 4.00 1.17 0.99931 A1 17–59 0.369 0.086 3.96 2.08 0.99910 Blanding, Utah
1,000 yr Kiva C 59 + 0.383 0.112 3.30 4.17 0.99921 Surface 0–7 0.394 0.500 1.56 16.70 0.99555 BA 7–43 0.320 0.124 3.75 0.19 0.99599
Fort Lewis, Colorado Oak Site Bt1B1 43–91 0.261 0.105 2.96 0.53 0.99839
Numerical inversion results for Ksat were typically lower for all sites compared to the Wooding’s solution (Table D−5). The Fort Lewis surface measurement was the most extreme case, which was roughly 10 times higher most likely because of ability of the numerical codes to simulate macro-pore flow more realistically than the simpler Wooding’s analysis. Saturated conductivities (he = 0 cm) were similar between reference site (Monticello) and the 1,000-year Blanding, Utah, kiva (Figure D−2A). The slight increase in clay content allows the Blanding, Utah, Kiva to retain

Sustainable Disposal Cell Covers: LM Practices, Improvements, and Long-Term Performance U.S. Department of Energy Doc. No. S0224000 March 2006 Page D−12
more water as soil water suction (h) becomes more negative (Figure D−2B). The Ksat values were highest at Fort Lewis because of the larger pore-network that both transmits water rapidly and drains quickly near saturation (h > -5 cm). Conductivity decreases quickly as the soil dries (h becomes more negative) and larger conduits fill with air. Thus, these large pores will only fill and transmit water under extreme precipitation events capable of saturating the soil.
Figure D−2. Results from the HYDRUDR-2D inversion for surface hydraulic conductivities (A) and water
retention characteristics (B) Subsurface horizons measurements indicate that at roughly 7 cm depth (Figure D−3) soil development at the Blanding kiva led to significantly higher values of Ksat (Figure D−3A) and greater water retention (Figure D−3B) with respect to Monticello. Results were more dramatic at lower depths. Conductivities were lowest at Fort Lewis due to higher silt and organic matter contents. These results were consistent with the lowest measured horizons (Figure D−4). Thus, soil development may increase the transmission of water deeper. However, soil water retention may also increase as aeolian deposition of fines and structural development increase with time.

U.S. Department of Energy Sustainable Disposal Cell Covers: LM Practices, Improvements, and Long-Term Performance March 2006 Doc. No. S0224000 Page D−13
Figure D−3. Results of the HYDRUDR-2D Inversion for Subsurface Horizon Hydraulic Conductivities (A) and Water Retention Characteristics (B)
Figure D−4. Results of the HYDRUDR-2D Inversion for Subsurface Horizon Hydraulic Conductivities (A)
and Water Retention Characteristics (B) Conclusions and Recommendations Preliminary soil characterization and hydrology results for two analog sites provide information about environmental processes that may affect the development of an ET cover. Fauna and flora bioturbation will increase soil mixing and development of macropore structure. Development of soil structure may limit deep transmission of soil moisture by increasing soil-water retention. However, deep transmission may be increased under extreme storm conditions that produce sustained saturated conditions. Soil mixing from bioturbation may enhance establishment of vegetation by providing a soil surface conducive to establishment of the germination of annual and perennial species. Accumulation of desert dust (eolian fines) will alter the cover over time and may promote better near-surface water retention and enhance development of desert pavements at the soil surface. Desert pavements increase surface stability by protecting the soil surface from erosion. Development of even weak desert pavements may help cover performance. Accumulation of dust promotes the development of fine-texture soil horizons, especially at the surface. The development of Av horizons and the accumulation of dust have been shown to lower infiltration and increase water retention in the upper 50 cm of the soil (Young et al. 2003, McDonald et al. 1996, McFadden et al. 1998). Increases in soil texture and related changes to soil water balance will directly effect desert ecology. Development of finer texture within the upper 50 cm of desert soils will limit the performance of large desert shrubs such as creosotebush (Larrea tridentata) (Hamerlynck et al. 2002). Consideration of interrelations between soil texture and soil water balance, including accounting for time-related changes in soil texture, will be important in developing revegetation strategies (McDonald 2002). The potential influence of soil development and dust accumulation on vegetation and moisture retention will have to be considered when designing ET covers.

Sustainable Disposal Cell Covers: LM Practices, Improvements, and Long-Term Performance U.S. Department of Energy Doc. No. S0224000 March 2006 Page D−14
Clearly, the evolution of a surface cover is dynamic and a critical element of any long-term stewardship program. However, current knowledge of soil and biologic process that may alter cap performance is very limited. Further study is needed to assess these effects and the environmental consequences. Numerical modeling of analog sites is key to understanding the evolutionary development of ET covers in the Southwest. The use of climate proxies (Appendix C) as input into model scenarios would increase current knowledge of hydrologic response to soil development and vegetation change. Further soil characterization of new analog proxies is needed to better model and predict evolutionary models of cap development. Future model validation using data from intensely monitored sites, such as the Monticello Disposal Cell Cover, would allow the application of soil-water balance models to predict reasonable cap performance as morphological and hydrological development continues. A neural network predictor could be established to link key variables between future climate-vegetation-soil morphology. References Albright, W.C., C.H. Benson, G.W. Gee, A.C. Roesler, T. Abichou, P. Apiwantragoon, B.F. Lyles, and S.A. Rock, 2004. “Field water balance of landfill final covers.” J. Environ. Qual. 33:2317-2332. American Society for Testing and Materials. 2000. Standard test method for determining the particle size distribution of alumina quartz by laser light scattering. C 1070-86 (reapproved 1992). 2000 Annual Book of ASTM Standards. 15.02:375-376. ASTM, Philadelphia, PA. Ankeny, M.D., T.C. Kaspar, and R. Horton. 1988. Design for an automated tension infiltrometer. Soil Sci. Soc. Am. J. 52:893-896. Benson, C., Abichou, T., Albright, W., Gee, G., and Roesler, A. (2000), Field Evaluation of Alternative Earthen Final Covers, International J. of Phytoremediation. 3(1), 1-21. Birkeland, P.W. 1999. Soils and Geomorphology. Oxford Press, New York, 372 pp Casey, F.X.M., and N.E. Derby. 2002. Improved design for an automated tension infiltrometer. Soil Sci. Soc. Am. J. 66:64-67. Dreimanis, A. 1962. Quantitative gasometric determinations of calcite and dolomite by using Chittick apparatus. J. Sediment. Petrol. 32:520-529. Dwyer, S.F. 1997. Cost comparison of alternative landfill final covers. Proceedings, International Containment Technology Conference, St. Petersburg, Florida. February. Gee, G.W., A.L. Ward and M.J. Fayer. 1997. Surface barrier research at the Hanford site. Land Contamination and Reclamation 5(3): 233-238. Gee, G.W., and Or, D. 2002. Particle-size analysis: In Dane, J.H. and G.C. Topp (eds.), Methods of Soil Analysis, Part 4. Physical Methods, Soil Science Society of America Book Series no. 5. p. 255-293.

U.S. Department of Energy Sustainable Disposal Cell Covers: LM Practices, Improvements, and Long-Term Performance March 2006 Doc. No. S0224000 Page D−15
Gee, G.W., M.D. Campbell, G.S. Campbell, and J.H. Campbell. 1992. Rapid measurement of low soil water potentials using a water activity meter. Soil Sci. Soc. Am. J. 56:1068-1070. Grossman, R.B., and T.G. Reinsch. 2002. Bulk density and linear extensibility: In Dane, J.H. and G.C. Topp (eds.), Methods of Soil Analysis, Part 4. Physical Methods, Soil Science Society of America Book Series no. 5. p. 201-225. Hamerlynck, E.P, McAuliffe, J.R., McDonald, E.V, and Smith, S.D. 2002. Impacts of desert soil processes and drought on contrasting Mojave Desert shrubs. Ecology: 83: 768-779. Logsdon, S.D. and D.B. Jaynes. 1993. Methodology for determining hydraulic conductivity with tension infiltrometers. Soil Sci. Soc. Am. J. 57:1426-1431. Machette, M.N. 1985. Calcic soils of the southwestern United States. Geol. Soc. Am. Spec. Pap. 203. Pp. 1-21. McDonald, E.V. 2002. Numerical Simulations of Soil Water Balance in Support of Revegetation of Damaged Military Lands in Arid Regions, Arid Land Research and Management: 16(3) 277-291. McDonald, E.V., Pierson, F.B., Flerchinger, G.N. and McFadden, L.D. 1996. Application of a process-based soil-water balance model to evaluate the influence of Late Quaternary climate change on soil-water movement in calcic soils: Geoderma, 74:167-192. McFadden, L.D., McDonald, E.V., Wells, S.G., Anderson, K., Quade, J., and Forman, S.L. 1998. The vesicular layer of desert soils: Genesis and relationship to climate change and desert pavements based on numerical modeling, carbonate translocation behavior, and stable isotope and optical dating studies, Geomorphology, p. 101-145. Mualem, Y. 1976. A new model for predicting the hydraulic conductivity of unsaturated porous media. Water Resource. Res. 12:513-522. Nelson, D.W., and L.E. Sommers. 1996. Total carbon, organic carbon and organic matter. In, Sparks, D.L.. ed., “Methods of Soil Analysis, Part 3: Chemical Methods,” Monograph No. 5. Am. Soc. Agron., Madison, WI. Pp. 961-1010. Reynolds, W.D. and D.E. Elrick. 1991. Determination of hydraulic conductivity using a tension infiltrometer. Soil Sci. Soc. Am. J. 55:633-639. Rhoades, J.D. 1996. Salinity: electrical conductivity and total dissolved solids. In, Sparks, D.L.. ed., “Methods of Soil Analysis, Part 3: Chemical Methods,” Monograph No. 5. Am. Soc. Agron., Madison, WI. Pp. 417-435. Shafer, D.S., M.H. Young, S.F. Zitzer, E.V. McDonald, and T.G. Caldwell. 2003. Coupled environmental processes and long-term performance of landfill covers in the Mojave Desert. Simunek, J. and M.T. van Genuchten. 1996. Estimating unsaturated soil hydraulic properties from tension disc infiltrometer data by numerical inversion. Water Resour. Res. 32:2683-2696.

Sustainable Disposal Cell Covers: LM Practices, Improvements, and Long-Term Performance U.S. Department of Energy Doc. No. S0224000 March 2006 Page D−16
Simunek, J. and M.T. van Genuchten. 1997. Estimating unsaturated soil hydraulic properties from multiple tension disc infiltrometer data. Soil Sci. 162(6):383-398. Simunek, J., M. Sejna and M.T. van Genuchten. 1996. The HYDRUS-2D software package for simulating water flow and solute transport in two-dimensional variably saturated media. Version 1.0. IGWMC – TPS – 53, International Ground Water Modeling Center, Colorado School of Mines, Golden, CO. Soil Survey Staff. 1999. Examination and description of soils in the field, in Soil Survey Manual (USDA-ARS): U.S Government Printing Office, Washington D.C. van Genuchten, M.T. 1980. A closed-form equation for predicting the hydraulic conductivity of unsaturated soils. Soil Sci. Soc. Am. J. 44:892-898. Waugh, W.J., 2004. Designing Sustainable Covers for Uranium Mill Tailings, pp, 157-173. In: W.R. Keammerer and J. Todd, Proceedings, High Altitude Revegetation Workshop, No. 16. Information Series No. 99, Colorado Water Resources Research Institute, Colorado State University, Fort Collins, Colorado. Western Regional Climate Center, Historical Climate Summaries, http://www.wrcc.dri.edu/climsum.html Wilson, G.V. and R.J. Luxmoore. 1988. Infiltration, macroporosity, and mesoporosity distributions on two forested watersheds. Soil Sci. Soc. Am J. 52:329-335. Wooding, R.A. 1968. Steady infiltration from a large shallow circular pond. Water Resource. Res. 4:1259-1273. Yang, B., P.S. Blackwell, D.F. Nicholson. 1996. A numerical model of heat and water movement in furrow-sown water repellent sandy soils. Water Resource. Res. 32:3051-3061. Young, M.H. E.V. McDonald, T.G. Caldwell, S.G. Benner, D. Meadows. 2003. Infiltration through desert pavements, Mojave Desert, CA. Vadose Zone J. Submitted.

Appendix E
Case Study: Use of Archaeological Analogs to Anticipate Long-term
Performance of Modern Landfill Cover Designs
D. Rhode
Desert Research Institute
Reno, Nevada


U.S. Department of Energy Sustainable Disposal Cell Covers: LM Practices, Improvements, and Long-Term Performance March 2006 Doc. No. S0224000 Page E−3
Introduction Isolation of hazardous and toxic waste products has become an increasingly important environmental problem in recent decades, as the amount of waste grows and its adverse health effects are better recognized. Landfills that contain and isolate hazardous materials, such as uranium mill tailings, are currently designed to prevent them from dispersion into the surface environment or groundwater reserves. These landfill designs typically include an engineered cover preventing surface erosion and limiting the entry of surface water into or through the hazardous waste "package", and subsurface barriers preventing groundwater flow into or out of the package. These landfills are optimally expected to operate for periods of 100-1000 years without requiring significant or continued maintenance and repair. Such designs must account for the inevitable modification of the original engineered parameters of both surface and subsurface barriers over the performance period. The long-term performance of a landfill cover may be strongly affected by pedogenesis, the activity of burrowing animals, root penetration, and other factors that modify the engineered cover characteristics. Because the landfill is expected to perform without significant maintenance for several centuries, the initial design must consider how materials and characteristics will change over time and whether those changes will significantly alter barrier performance. Design engineers usually address this problem using numerical modeling, attempting to identify the scale of events that would breach the protective barriers, and field monitoring of the design over a relatively brief interval typically less than 5-10 years. One useful approach toward expanding our understanding of long-term cover performance draws upon empirical measurement of natural and archaeological analogs. Measurement of analog sites will be able to (1) reasonably bound environmental parameters such as climatic variability and extreme events likely to occur during the cover's expected period of performance, (2) provide physical understanding of pedogenic and ecological processes likely to alter the cover during its performance period, and (3) allow for more representative long-term bounding parameterization for numerical modeling than can be obtained from short-term field tests. Archaeological sites can make useful analog sites for this purpose. Most importantly, archaeological deposits are often well-dated, providing the necessary chronological control to assess rates of pedogenesis and other environmental processes (Holliday, 1988; 1992). Some kinds of archaeological deposits and constructions effectively match the kinds of engineered barriers used in modern landfill construction. Post-depositional diagenetic processes operating on archaeological deposits often can be accurately assessed, that yield information directly applicable to anticipating the long-term performance of modern-day engineered deposits. The research presented herein describes part of a study of natural and archaeological analogs used to anticipate the long-term performance characteristics of the radiological waste disposal site at Monticello, Utah, one of several test sites in EPA's Alternative Cover Assessment Program. This 65-acre site, constructed between 1998 and 2000, stores uranium tailings generated during the previous four decades at the nearby mill facility. It is designed with an evapotranspiration cover, composed of fine-grained local soil, with a vegetation cover that is expected to return to native sagebrush shrubland composition within the next few decades. The performance of this cover will undoubtedly be altered through time as influenced by long-term biological succession, intrusion of organisms, pedogenesis, deposition of dust and other

Sustainable Disposal Cell Covers: LM Practices, Improvements, and Long-Term Performance U.S. Department of Energy Doc. No. S0224000 March 2006 Page E−4
particulates, runon and runoff events, and other factors. Measurement of local analog sites provides a way to establish realistic rates of these processes suitable for input into performance models of the Monticello disposal site. One promising archaeological analog for estimating regional rates of soil development was found at Edge of the Cedars Ruin (42SJ700), a puebloan occupation complex situated at the top of a low ridge, overlooking Westwater Draw on the outskirts of the present city of Blanding, Utah, 35 km south of Monticello. Most visibly, the site contains several roomblocks and associated ceremonial structures (Figure E−1), including a "Chacoesque" great house and great kiva (Complex 4), and a possible "road" structure as well (Hurst 2000). These Chacoan ruins were built and occupied ca. AD 1080-1130, with a possible post-Chacoan construction in one kiva in Complex 4 dated by dendrochronology to A.D. ca. 1220. These ruins were built atop an extensive earlier settlement (terminal Pueblo I period) dating ca. AD 900. Several smaller roomblocks lie adjacent to the great house on the ridgetop. Complex 6, one of these smaller roomblocks at the southern end of the ruin cluster, was partially excavated in 1970 (Green 1970). A pit structure known as Kiva 4, immediately east of this roomblock, was partly explored at this time. This pit structure was subsequently re-examined by Walker (1980) to better identify its architecture and age. Walker removed room fill from the north half of the structure, and left most of the fill in the south half intact. Much of the fill in Kiva 4 had been disturbed during the 1970 and 1980 excavations; nevertheless, an intact fill profile still existed that could be exposed to determine the age and sequence of post-occupation filling of the structure and to measure various soil and sediment properties of the fill to estimate rates of pedogenesis for the past ~1,000 years in this region. Methods and Objectives Our objectives in this project were to expose the intact sediment profile contained within the fill of Kiva 4, delineate and map the stratigraphic profile of the fill, gain a better estimate of the age of infilling of the structure, and measure several soil parameters important to water infiltration, including structure, organic and carbonate content and distribution, the extent of burrowing and root penetration, and hydraulic conductivity of different layers that may exist. To accomplish these tasks, we first removed backfill from previous excavations, following the excavation grid and map in Walker (1980). We removed fill by shovel and trowel from excavation squares 51S/E8 and 51S/E9 and the adjacent ~20 cm of 52S/E8 and 52S/E9. This trench was approximately 200 cm deep from datum level and exposed the kiva's east wall, its floor, and a cross section of much of the intact fill remaining in the south part of the structure. Stratigraphy of the profile exposed along the 51S/52S line was delineated visually, drawn to scale, and photographed. We also cleaned off the backfill from shallower previous excavations in squares 51S/10E, 52S/8E, 52S/9E, 52S/10E, and a small portion of 52S/7E. These shallower excavations revealed portions of the upper part of the remaining intact fill, and served as platforms for measuring hydraulic conductivity at different fill depths. Assessment of ages of infilling was attempted through the use of two radiocarbon dating of small pieces of charcoal exposed in the profile; radiocarbon dates were obtained using the AMS method by Beta-Analytic. Age of infilling was also evaluated by the distribution of ceramics collected by Walker (1980).

U.S. Department of Energy Sustainable Disposal Cell Covers: LM Practices, Improvements, and Long-Term Performance March 2006 Doc. No. S0224000 Page E−5
Figure E−1. Map of Edge of the Cedars Ruin (from Hurst 2000).
Complex 6
Kiva 4
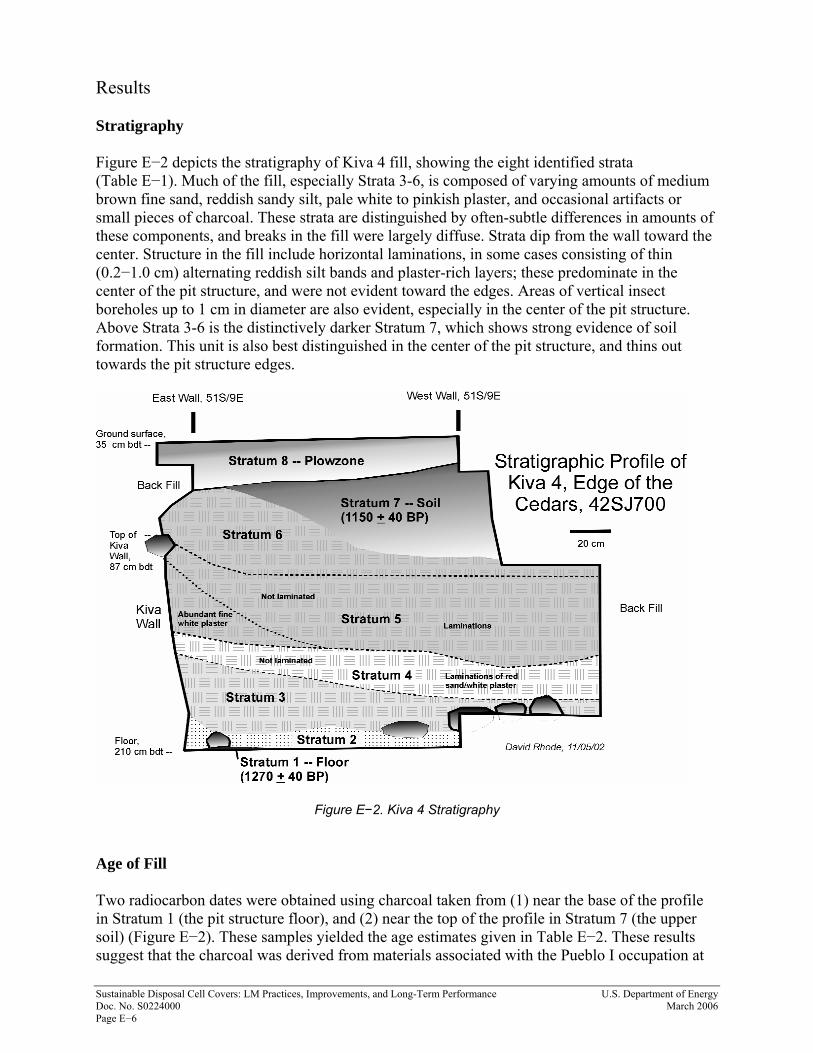
Sustainable Disposal Cell Covers: LM Practices, Improvements, and Long-Term Performance U.S. Department of Energy Doc. No. S0224000 March 2006 Page E−6
Results Stratigraphy Figure E−2 depicts the stratigraphy of Kiva 4 fill, showing the eight identified strata (Table E−1). Much of the fill, especially Strata 3-6, is composed of varying amounts of medium brown fine sand, reddish sandy silt, pale white to pinkish plaster, and occasional artifacts or small pieces of charcoal. These strata are distinguished by often-subtle differences in amounts of these components, and breaks in the fill were largely diffuse. Strata dip from the wall toward the center. Structure in the fill include horizontal laminations, in some cases consisting of thin (0.2−1.0 cm) alternating reddish silt bands and plaster-rich layers; these predominate in the center of the pit structure, and were not evident toward the edges. Areas of vertical insect boreholes up to 1 cm in diameter are also evident, especially in the center of the pit structure. Above Strata 3-6 is the distinctively darker Stratum 7, which shows strong evidence of soil formation. This unit is also best distinguished in the center of the pit structure, and thins out towards the pit structure edges.
Figure E−2. Kiva 4 Stratigraphy Age of Fill Two radiocarbon dates were obtained using charcoal taken from (1) near the base of the profile in Stratum 1 (the pit structure floor), and (2) near the top of the profile in Stratum 7 (the upper soil) (Figure E−2). These samples yielded the age estimates given in Table E−2. These results suggest that the charcoal was derived from materials associated with the Pueblo I occupation at

U.S. Department of Energy Sustainable Disposal Cell Covers: LM Practices, Improvements, and Long-Term Performance March 2006 Doc. No. S0224000 Page E−7
the site, rather than the later Chacoan-age occupation exhibited in Complex 4. The two calibrated age estimates are close, overlapping a century at two standard deviations; but they do not overlap at one standard deviation, suggesting that, most probably, the two samples represent two separate ages. If the midpoint of each age accurately reflects the age of deposition of its stratum, the pit structure filled in about 150 years and was essentially complete by A.D. 900. Ceramics suggest that the age of infilling is more complex. Major ceramic types found in the pit structure fill (Table E−3) are predominantly Pueblo I in age, but a few types are later (Pueblo II), including Mancos Black-on-white, Cortez Black-on-white, and Mancos Corrugated (Figure E−3). Some of these latter types are represented in significant proportions even at the lower depths of the fill (Table E−3). These Pueblo II-age ceramics may indicate that infilling of the pit structure began after A.D. 900. (In such a situation, the radiocarbon date from Stratum 7 may reflect the incorporation of "old wood" into deposits that were laid down a century or more later.)
Table E−1. Stratigraphy of Kiva 4, Edge of the Cedars Village (423SJ700)
Stratum Description Depth (cm)
0* Natural material into which the pit structure was excavated. Reddish (Munsell 5YR4/4) fine sandy silt with some clay; exposed only beneath floor at eastern base of profile.
---
1 Floor of pit structure. Dark gray brown (5YR4/2) fine sandy silt, mottled with pinkish white (5YR7/4) silty clumps (plaster?). Thin pinkish white silt layer occasionally continuous on floor as exposed in SE corner; dark gray silt appears continuous across floor as well. Occasional charcoal flecks throughout. 1-2 cm thick. Most of the excavation went to top of Stratum 1, except in SE corner, so Stratum 1 does not appear in much of stratigraphic profile.
1-2
2 Brown (7.5YR5/3) fine sand, occasional pinkish white silt flecks (probably plaster), occasional charcoal flecks and chunks, few to no clasts, some reddish silt lumps and flecks (< 1 cm diameter). Top boundary is not distinct and grades into Stratum 3 above. According to the excavator this unit was essentially sterile of artifacts.
10-20
3 Medium brown (7.5YR5/3) fine sand marked by abundant red silt flecks and lumps (usually small up to 3-4 cm diameter), pinkish-white plaster chunks (usually small, occasionally up to 15 cm long), flecks and fragments of wood charcoal, fragments of limestone, and occasional artifacts. Upper boundary is diffuse and gradational, marked primarily by increased concentration and size of plaster fragments. The orientation of red silt and white plaster lumps tends to be haphazard, large plaster plates horizontal, no laminations noted.
25-35
4 Abundant finely divided white silty plaster lumps and reddish brown fine silt and sand. At east end the mixture is heterogeneous, but grades and dips to interleaved white (5YR8/2) and red-brown (5YR5/6 grading to 7.5 YR5/6) alternating laminar deposits toward center of kiva (water-laid?). Diffusely to moderately well-bounded visually, depending on the amount of plaster.
11
5 Mottled to laminated and heavily bioturbated unit of fine sands and silts. Silty sands grading from medium brown (7.5YR5/4) to light brown (7.5YR6/4) mixed with finely divided whitish plaster flecks and lumps often in laminar alternations with reddish brown silts. Heavily bioturbated with insect casts, possible root casts. Similar to Stratum 4 but with more bioturbation and fewer (and smaller) whitish plaster lumps; plaster appears to be most concentrated near base of unit, adjacent with Stratum 4. Charcoal flecks throughout, occasional small limestone clasts. Boundary with Stratum 6 very diffuse to nonexistent.
32
6 Reddish brown (7.5YR5/3) fine silty sand, small flecks of plaster, flecks of charcoal, and reddish (5YR5/4) silty sand. Extremely diffuse lower margin, distinguished by less distinct mottling and bioturbation. More distinct upper margin.
20
7 Medium to dark brown (7.5YR4/2) silty fine sand with some clay, dark brown when moist, well developed prismatic vertical ped structure in center of profile, indicating developing soil in at least center of pit structure. Poorly developed/gradational with Stratum 6 near eastern wall of pit structure & profile. Abundant fine rootlets, contains charcoal flecks and potsherds.
18
8 Medium brown (7.5YR5/4) silty fine sand, marked with occasional small chunks of plaster and red silt, mottled. This is backdirt and plowzone covering the excavated units.
12
* Described by Walker (1980); not shown on profile.

Sustainable Disposal Cell Covers: LM Practices, Improvements, and Long-Term Performance U.S. Department of Energy Doc. No. S0224000 March 2006 Page E−8
Table E−2. Radiocarbon Dates from Kiva 4, Edge of the Cedars State Park, 42SJ700.
Stratum 2 Stratum 4 Lab # Beta-171112 Beta-171113
Conventional Age (B.P.) 1270 ± 40 1150 ± 40 Intercepts of Radiocarbon 720, 745, 760 890 Age with Calibration Curve (A.D.) 1 Sigma (68% probability) 685-780 870-965 Calibrated Result (cal A.D) 2 Sigma (95% probability) 670-870 780-990 Calibrated Result (cal A.D.)
Figure E−3. Time spans of main ceramic types found in Kiva 4 fill (after Varien 2000).
500
600
700
800
900
1000
1100
1200
Chapin Gray Chapin B/W Bluff B/R MoccasinGray
Mancos Gray DeadmansB/R
Cortez B/W MancosCorrug
Mancos B/W
Age
(A.D
.)

Table E−3. Distribution of ceramics in excavation units 51S9E and 50-51S8E, Kiva 4, Edge of the Cedars Ruin.
51S9E 50-51S8E COUNTS (Percent)
surf 0-40 40-95 95-130 130-150 150-180 180-200 95-130 130-150 150-180 180-190 190-200
Chapin Gray
217 (36)
10 (83)
74 (30)
43 (51)
85 (62)
39 (42)
9 (42)
26 (32)
74 (37)
34 (29)
36 (43)
Chapin B/W
3 (<1)
2 (2)
1 (1)
1 (1)
Abajo R/O
2 (<1)
Bluff B/R
19 (3)
2 (16)
14 (5)
4 (4)
2 (1)
7 (7)
1 (1)
7 (3)
3 (2)
4 (4)
Moccasin Gray
15 (2)
12 (4)
3 (3)
Mancos Gray
58 (9)
14 (5)
8 (9)
6 (4)
10 (10)
1 (2)
1 (1)
12 (6)
21 (17)
11 (13)
Deadmans B/R
1 (<1)
7 (2)
1 (1)
1 (1)
3 (3)
2 (2)
1 (<1)
Cortez B/W
21 (3)
7 (2)
3 (3)
9 (6)
4 (4)
1 (2)
1 (1)
2 (1)
3 (2)
3 (3)
San Juan Redware
29 (4)
10 (4)
5 (6)
13 (9)
5 (5)
1 (2)
4 (2)
3 (2)
4 (4)
Mancos Corrug
3 (3)
136 (23)
72 (29)
7 (8)
10 (7)
1 (1)
19 (51)
30 (37)
74 (37)
29 (24)
16 (19)
Mancos B/W
1 (1)
51 (8)
22 (8)
5 (6)
2 (1)
12 (13)
2 (5)
5 (6)
12 (6)
14 (11)
2 (2)
Monument White
1 (1)
36 (6)
13 (5)
4 (4)
6 (4)
12 (13)
4 (10)
11 (13)
13 (6)
9 (7)
6 (7)
Polychrome
1 (<1)
Devil Mesa
1 (<1)
1 (<1)
1 (<1)
4 (4)
16 (8)
1 (<1)
TOTAL 5 588 12 245 83 135 92 37 79 200 117 82
U.S. D
epartment of Energy
Sustainable Disposal C
ell Covers: LM
Practices, Improvem
ents, and Long-Term Perform
ance M
arch 2006
Doc. N
o. S0224000
Page E−9

Sustainable Disposal Cell Covers: LM Practices, Improvements, and Long-Term Performance U.S. Department of Energy Doc. No. S0224000 March 2006 Page E−10
Walker (1980) provided ceramic artifact counts in sequential excavated depths for one excavation unit, 51S9E, that span the entire sequence. The ceramic counts for this excavation unit provide some coarse-grained information of interest about trends in the distribution of artifacts in the stratigraphic column, though these trends may not be uniform across the pit structure as a whole (compare, for example, artifact counts in the adjoining units 50-51S8E). In this unit, most artifacts were found between 0-40 cm depth, which apparently included the surface and shallow subsurface component. Between 40-95 cm depth below datum, approximately correlative with Strata 6 and 7, ceramic artifact density declines dramatically. Artifact density increases significantly between ca. 95-130 cm (approximately the depth of Stratum 5), and remains moderately dense below 130 cm. If these trends are consistent elsewhere in the pit structure, they may indicate that Strata 2-5 contain significant deposits of domestic trash fill including abundant ceramic debris and other artifacts, mixed with degraded wall plaster and natural sand and silt lenses deposited during Pueblo II times, while the overlying Strata 6-7 were deposited later from predominantly natural sources and contain little or no domestic trash. References