sustainable development indicators for urban water systems: a case
TRANSCRIPT

ISSN 0378-4738 = Water SA Vol. 27 No. 2 April 2001 219Available on website http://www.wrc.org.za
Sustainable development indicators for urban water systems:A case study evaluation of King William’s Town, South Africa,
and the applied indicators
G Morrison 1, OS Fatoki 2*, E Zinn 1 and D Jacobsson 1
1 Water Environment Transport, Chalmers University, Goteborg 41296, Sweden2 Department of Chemistry, University of Fort Hare, Alice 5700, South Africa
Abstract
In the light of the increasing pressures on the world’s freshwater resources, changes in the present and future urban water systemsare called for in order to achieve sustainable development. The transformation from unsustainable practices demands tools thatmeasure progress and can warn of future trends. Sustainable development indicators (SDIs) have been suggested as tools for anumber of fields, including the urban water sector. This case study applied 20 SDIs to an urban water system in King William’sTown, a medium-sized city in the semi-arid, mostly underdeveloped Eastern Cape of South Africa. The main aims were twofold:To evaluate the sustainability of the urban water system, and to evaluate the individual factors according to criteria. A final workinglist of the 15 SDIs was found useful for the study area and was produced for use also in future studies.
Introduction
The increasing use of the world’s freshwater resources, coupledwith the acknowledged environmental deterioration and exhaustiveuse of limited resources and energy in a modern urbanised society,calls for changes in present and future urban water and wastewatersystems. As a large part of the world’s population still lacks accessto safe drinking water and adequate sanitation, and as globalurbanisation continues to increase, an expansion of these systemsis necessary. For these reasons, it is important that policy-makers,engineers and the general public have proper information so thatthe current situation can be evaluated, trends identified, and wayscan be found to a more sustainable future. Sustainable developmentindicators (SDIs) have been proposed in numerous fields as powerfultools for this work, and the urban water sector is no exception.Lundin et al. (1997) have compiled a number of proposed SDIs forthis sector, and also evaluated them in a case study (Lundin et al.,1999) on Sweden’s second largest city. This was in an urbanenvironment of a developed country with little stress on its freshwaterresources. A larger problem is facing developing countries withmoderate or much stress on their freshwater resources, and thereforedemands an additional study into the use of indicators in such areas.The aim of this study was to evaluate the use of 20 SDIs in urbanwater systems of King William’s Town, South Africa.
The urban water system of King William’s Town is currentlynot moving towards sustainability. Freshwater withdrawal fromthe Maden and Rooikrans Dams has passed acceptable levels andthe future plan of inter-basin transfer is not believed to guaranteethis resource beyond 2005. The treatment performance of theSchornville Sewage Treatment Works is poor and the removalpercentage of phosphorus is decreasing. Coupled with increasingconcentrations of P, N, and COD in the raw wastewater, the BuffaloRiver, already threatened by eutrophication and salinisation, isnow receiving increased nutrient loads and oxygen demand. Certain
aspects have been improving though. The water consumption percapita per day has stabilised around 230 l/cap·d and is well abovethe WHO minimum levels.
Introduction to indicators
An urban society needs a number of infrastructural installations tofunction properly. The provision of safe drinking water and theremoval and treatment of wastewater and storm water areprerequisites for a healthy population and the functioning city andurban water systems (UWSs) were initially designed in order tomeet these objectives. More recently, global awareness andrecognition of society’s negative influence on the environmenthave grown and call for additional purposes and goals of an urbanenvironment’s subsystems, including its UWS. In addition to theoriginal objectives, which mainly concerned human health, amodern water and wastewater system must consider energyefficiency, resource use, environmental effects, access to service,service quality and other aspects of sustainable development. Theobjectives of developing a UWS are to:
. preserve the quality of the raw water resource
. allow for sustainable use of the raw water sources
. supply the general population with safe drinking water insufficient quantity
. supply the general population with adequate sanitation and
. reduce the use of limited resources and energy to within thelevels of sustainability.
Indicators, in general, are pieces of information, which have awider significance than their immediate meaning (Bakkes et al.,1994). An indicator is useful if it is of fundamental interest indecision-making, simplifies or summarises important properties,visualises phenomena of interest and quantifies and communicatesrelevant information (Gallopin, 1997). In addition to its essentialquantifying function, further relevant functions include assessingconditions and trends (sometimes in relation to goals and targets),providing information for spatial comparisons, providing early
* To whom all correspondence should be addressed.((040) 602-2011; fax (040) 653-1643; e-mail: [email protected] 12 June 2000; accepted in revised form 19 December 2000.

ISSN 0378-4738 = Water SA Vol. 27 No. 2 April 2001220 Available on website http://www.wrc.org.za
warning information and anticipating future conditions and trends.Lundin et al. (1997; 1999) defined a sustainable UWS as “ a one
which over a long-time perspective provides required serviceswhile protecting human health and the environment, with a minimumuse of scarce resources”. With this definition in mind, the objectivesof a modern UWS can be listed as: a reliable supply of safe waterto all users for drinking, hygiene and household purposes, safetransport and treatment of waste, drainage of urban areas andrecovery of resources for reuse or recycling. When developing andevaluating SDIs for UWSs, this definition and its consequentobjectives may not be sufficient. Several other aspects arise thatmay be important for the assessment of existing systems and futuresolutions.
Lundin et al. (1997) initially proposed a list of 20 SDIs forurban water systems, by first categorising UWS in terms of fourenvironmental and technical systems: freshwater resources, drinkingwater, wastewater and sewage sludge. Each system was representedby a limited number of dimensions broken down into indicators,selected on the basis of five criteria, which are:
. move towards or away from sustainability
. availability of data of sufficient quantity and quality to providespatial and temporal trends
. non-overlap of the indicators
. ready existence of goals and objectives for the quantities andqualities measured by the indicator and
. the ease of understanding the information to be relayed by theindicator.
The indicators were subsequently tested in a limited case study inGoteborg (Lundin et al., 1999), where 14 were demonstrated asuseful in assessing the temporal variations of a UWS.
In this case study, 17 of the originally proposed 20 indicators(Table 1) were tested in an attempt to evaluate the sustainability ofthe UWS of the study area, and to evaluate the use of the individualindicators.
These SDIs were primarily developed for studies in developedcountries in Western Europe and North America. As this study wasto be performed for a developing country like South Africa,additional indicators were believed to be necessary to cover theadditional developmental aspects present. The 134 indicators bythe UNCSD Working List of Indicators of Sustainable Development(UNCSD, 1999) were reviewed as to which may have developmentalrelevance without overlapping the other 17 proposed indicators forurban water systems. Two indicators were chosen from theWorking. These are, access to drinking water and access to sanita-tion, respectively.
Another indicator chosen for this study is the economic indicator.
TABLE 1The 17 SDIs used in this case study (adapted from Lundin et al., 1997)
Suggested indicator Type Suggested reference value
Withdrawal% Pressure <100% of the raw water quantity
Raw water quality State All water should be drinkable according to Inter-national or National Standards
Protection Response All resources should be protected
Water consumption Driving force Sufficiency
Drinking water quality State % tap tests within WHO or National Standards
Chemical and energy use for water quality Efficiency As efficient as possible
Leakage,% Efficiency Low
Reuse,% Efficiency High
Wastewater production(litres per capita/day) Within STP capacity
Combined sewers,% <10% should be storm water
Treatment performance,% removal BOD, P and N Effectiveness At least according to regulation
Loads to receiving waters of BOD, P and N Pressure Below critical load
Chemical and energy use for wastewatertreatment Efficiency As efficient as possible
Resource use per removal of nutrients Efficiency As efficient as possible
Recycling of nutrients,% Effectiveness 100%
Quality of sludge Below International or National Standards
Energy recovery Efficiency As high as possible

ISSN 0378-4738 = Water SA Vol. 27 No. 2 April 2001 221Available on website http://www.wrc.org.za
The King Williams Town municipality serves people of differentsocio-economic groups including the poor, rural settlements.Affordability of the system both to the utility and to the consumersneeded to be evaluated.
Introduction to the case study
The study area
King William’s Town (KWT) is in the Eastern Cape Province ofSouth Africa (Fig. 1). The transitional local council (TLC) of thetown was established in 1994. It includes the previously indepen-dent municipalities of KWT, Bisho, and Ginsberg, as well as thefour towns of Zwelitsha, Phakamisa, Illitha and Dimbaza. Therural village of Tyutyu has been part of the TLC since 1995, whileother rural villages within the area have elected not to be included.A report prepared by Setplan (1997) for the KWT TLC estimatedthe population at some 150 000. The TLC includes an estimated 27535 households, of which some 10 730 live in shack houses (PalmerDevelopment Group, 1998). The population is mostly poor andexpected to grow fairly rapidly at approximately 3% per year. Theeconomy of the area is small and only a modest rate (2%) ofeconomic growth is expected within the next 10 years (PalmerDevelopment Group, 1998).
The four dams, Maden, Rooikrans, Laing and Bridle Drift(Fig. 2) are the raw water sources for towns in the Buffalo RiverCatchment area. Maden was meant to supply KWT and Rooikranswas meant to supply Zwelitsha together with Laing Dam. BridleDrift Dam supplies Mdantsane and East London (O’Keeffe et al.,1996). The KWT TLC is currently served by five existing sewagetreatment plants (STPs) located at Bisho, Breidbach, Schornville,Zwelitsha and Illitha, respectively but the two main STPs are theSchornville and Breidbach STPs (Fig. 3).
Application of the indicators to the case study
The SDIs enumerated above were applied to:. the freshwater resources. the drinking water and. the wastewater systems. developmentrespectively in the catchment area.
Freshwater resources
The freshwater resources withinthe catchment area of KWT wereassessed and quantified. ThreeSDIs - withdrawal, raw waterquality and protection were appliedto assess the sustainability of thesystem on this point:
Withdrawal
The withdrawal indicator iscalculated by dividing the annualfreshwater withdrawal by theannual available amount and wasapplied to the freshwater systemin the TLC. It shows whether ornot the withdrawal is at anacceptable level, and if future
TABLE 2Three additional indicators used in the case study
Suggested indicator Type Suggested reference value
Access to safe drinking water State 100%Access to adequate sanitation State 100%Affordability of services State 100%
Figure 2Map showing the dams of the TLC
Figure 1Map of South Africa and the location of the study area
shortages are to be expected. Therefore, it is a sensitive SDI andwould indicate an early warning. High quality data are usually easyto obtain on withdrawal volumes, as waterworks measure these, but

ISSN 0378-4738 = Water SA Vol. 27 No. 2 April 2001222 Available on website http://www.wrc.org.za
they need to be complemented with data from other consumers, e.g.irrigated agriculture and industries. Only estimations are possiblefor the available volumes of surface and groundwater. Databetween areas vary depending on climate, population, economicdevelopment and seasonal variations. The withdrawal indicatoralso relates to population and population growth, the future demandsfor agriculture and industry and ecosystem health. An indicatorshould be total withdrawal compared to available amount but thelatter is difficult to obtain.
The Maden and Rooikrans Dams supply three areas in theTransition Local Council (TLC) - KWT, Ginsberg and Breidbachvia the KWT Purification Works. The indicator was applied to the
Maden and Rooikrans Dam where datawere available. Estimation of the annualavailable volume of raw water in Madenand Rooikrans Dams put it at a total of 3.1x 10⁶ m3 (Gibb Africa, 1999). Previously,water was taken directly from both dams,but in 1995 to 1996 the pipes from MadenDam were stolen and have not beenreplaced yet. Fortunately, Maden Dam issituated upstream of the Rooikrans, andthe overflow from the former is collectedby the latter before being piped to theKWT Purification Works. As the two damsare now working in series, the totalwithdrawal volume has been allocated.The collected data show that the with-drawal volume increased by 50% between1993 (2 x 10⁶ m3) and 1998 (3 x 10⁶ m3)(Fig. 4).
The reference value for this indicatoris that the withdrawal should be <100% ofthe raw water quantity. The 1998 with-drawal equals approximately100% of thetotal annual volume. Thus, the possibilityof water shortages is clearly apparent.The engineering section considers theproblem to be “a lack of pipes”. Futureplans include reconnecting the two damswith pipes (reducing loss due to infiltrationand evaporation) and a further inter-connecting of dams, such as the largeWiggleswade Dam north of Bisho. This,it is believed, will cover the future rawwater needs of the TLC, but presently thisis not the case. The current trend is movingnot towards sustainability and futureincreases in water demand must beavoided. This indicator has been founduseful for the system and it shows thatfuture shortages should be expected ifcare is not taken. Several methods ofreducing the consumption of water maybe suggested such as installing water-efficient taps and toilets in new buildings(and the new RDP buildings), reusinggrey water where applicable and educatingthe public on methods of saving water.
Raw water quality
This indicator is essential for thesustainable future of freshwater eco-
systems, as well as for human health. This indicator also givesinformation on other activities that might affect the raw watersource, e.g. point sources of municipal discharges, industrialdischarges, and waste facilities, non-point sources such asagricultural and urban runoff and landfills. It also indicates theamount of treatment that is necessary to produce drinking water ofacceptable quality that may affect the cost of energy and chemicals.For larger supplies of water, the quality is usually measuredroutinely.
The two dams are currently monitored by different authorities:the Rooikrans Dam falls under the jurisdiction of Department ofWater Affairs and Forestry (DWAF), while the Maden Dam is
Figure 3Map showing existing sewage treatment plants in the TLC
(STP = sewage treatment plant; WPW = water purification works)
Figure 4Total freshwater withdrawal as compared to estimated annual amount

ISSN 0378-4738 = Water SA Vol. 27 No. 2 April 2001 223Available on website http://www.wrc.org.za
monitored by the TLC. DWAFcurrently measures 16 parametersto establish raw water quality of theRooikrans Dam. The reference valuefor this indicator is the Internationalor National Standards for raw waterquality. The water quality of thedam has been satisfactory for theentire period 1968 to1999. Onlyslight increases in the concentrationof nitrate plus nitrite, orthophosphateand dissolved sulphate have beenobserved. Although dissolved sul-phate most probably originates fromlong-distance sources of air pollu-tion, the increased levels of nutrientsmay be due to the decreasing waterlevels in the dam. This may allownutrients imbedded in the sediments to return to the water due toenhanced circulation. The natural exchange of nutrients betweenthe sediments and water will also increase with the decreasedvolume of water. Although no data for the smaller Maden Damwere available, it is assumed to have the same quality of water. Infavour of this assumption is the dam’s proximity to the RooikransDam, and the quality of water received by the waterworks. Thus forthis indicator, the system seems to be moving towards sustainability.
Informing the general public of the raw water quality may bedifficult, especially when coliform counts or phosphorusconcentrations are given. A comparison with raw water targetsshould exist and would probably aid in the understanding of thesituation. In this regard, the recently published Water QualityGuidelines of DWAF (1998) would be immensely useful incharacterising raw water qualities.
Protection
A high degree of protected water sources ensures present and futurefreshwater quality, assuming that the protection is functioningwell. The existence of a contingency plan indicates how prepareda community is for accidents and eventualities. Without protectionand contingency plans, there will be an increasing risk of raw waterpollution.
This indicator was tested on the water sources in the study area.There were no formal protections for the two dams, but both arelocated approximately 20 km from the main urban area of KingWilliam’s Town, of which almost about 10 km is by gravel road,that is, a remote area. No further development of the area is plannedand the Maden Dam is currently also used for trout fishing, whilesailing is allowed on the Rooikrans. No evidence of an existingcontingency plan for the eventuality of an accident that wouldpollute these sources beyond usage, was found, although, water isalready drawn from Laing Dam in periods of drought. A “DisasterCommittee”, with members from the Department of EnvironmentalAffairs and Tourism and from the Health Department of the TLC,among others, is responsible for action during times of crisis.
The lack of formal protection of the dams, as well as the non-existence of a contingency plan in cases of emergency, are problemsthat do not favour sustainability and need immediate attention. TheDisaster Committee on ground would be the appropriate body fordrawing up a contingency plan.
Drinking water
The consumption, treatment and distribution of drinking water areessential and important when evaluating the sustainability of asystem.
Water consumption
As the population increases and development progresses, increasingvolumes of water will have to be supplied for domestic andindustrial purposes. It is therefore important that water is notwasted unnecessarily. Data are available from the local waterworks,and the distribution to different sectors (e.g. agriculture, industry,and leakage) is also of interest. As the consumption of drinkingwater affects the use of energy and resources, it is well linked to thegeneral idea of sustainability. A suggested indicator is water use(l/cap·d) compared to target.
The KWT Water Purification Works is the main waterpurification works in the TLC and it receives raw water from theMaden and Rooikrans Dams. It supplies KWT, Breidbach andGinsberg. The raw water is treated with lime, chlorine and aluminiumsulphate. The water treatment plant reached 88% of its designcapacity in March 1994, and peak water demands push the worksinto overload mode.
Consumption was calculated by dividing inflow values at theKWT Purification Works by the Setplan population estimation(Setplan, 1997), which was adjusted according to projectedpopulation increases. The water consumption (including industrialuse and leakage) has increased from approximately 175 l/cap·d(mid 1993) to the peak of 1995 at 350 l/cap·d and now seems to bestabilising at around 230 to 240 l/cap·d (Fig. 5). Deduction of thelargest water-using industry using water from the PurificationWorks, King Tanning (2 109 m3/month, from O’Keeffe et al.(1996)), and leakage (20%) results in a domestic consumption ofjust under 200 l/cap·d. Note though that the King Tanningconsumption equals approximately less than 1% of the total wateruse.
The benchmark for this indicator is 25 l/d. The average waterconsumption in the TLC is well in excess of the benchmark as wellas the WHO minimum requirements (WHO, 2000). Thus, thesystem is moving towards sustainability on this point.
Drinking-water quality
In order to protect human health, the quality of drinking water is ofthe utmost importance. It should have, at the most, tolerable levels
Figure 5Water consumtion per capita per day
ISSN 0378-4738 = Water SA Vol. 27 No. 2 April 2001224 Available on website http://www.wrc.org.za
of bacteria or chemicals. Bulk drinking water quality is measuredat the treatment works, but this may deteriorate before reaching theconsumer due to corrosion or contamination. Factors such asleakage may cause a difference between measured drinking waterquality at treatment and actual quality at the tap.
The TLC performs regular water quality tests through aconsulting company - Pollution Control Technologies, East London,but the company feels reluctant to release the results to the public.However, the results of some analyses of nitrate and residualchlorine obtained for 1998 showed that the levels of nitrate arebelow the WHO recommendation of 45 mg NO
3-/l (Haglund and
Norman, 1984). The concentrations of chlorine seem to occasionallyreach inappropriately high levels. A measurement of the freechlorine in tap water at the Civic Centre in central KWT was0.79 mg/l. Compared to Swedish regulations of a maximum of0.4 mg/l (VA-Verket, 1997) - this is high. Although this onemeasurement should not warrant unnecessary concern, it indicatesthe importance of making all measurements accessible to researchersand managers. Current research has indicated that chlorine actingwith the assimilable organic carbon (AOC) or biodegradabledissolved organic carbon (BDOC) can form trihalomethanes inwater treatment plants, and this may have mutagenic effects onhuman cells.
Generally, the drinking water quality in the King William’sTown TLC is assumed to be good. It is said that there is never aproblem with either coliforms or E.coli at the treatment works andthat the turbidity in recent years has varied between 1 FTU and5 FTU, but is usually < 2. However, there is the need for currentdata to be made available to lend credence to this assumption. Theindicator is useful in tracking changes in drinking water quality.Informing the public of the importance of high quality drinkingwater and relating the current situation to regulations may alsoincrease concerns of its preservation and protection. The suggestedreference value for this indicator is 100% tap tests within regulation.This information is not available for the system and, therefore, anindication towards sustainability can not be confirmed.
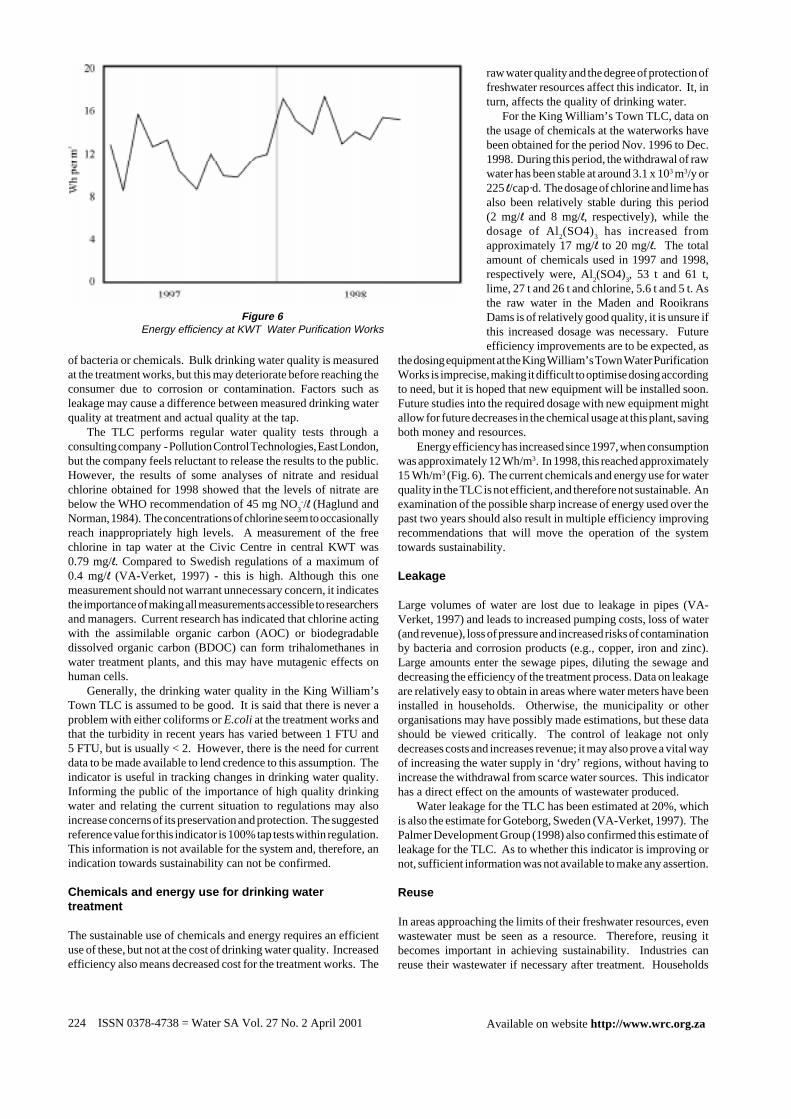
Chemicals and energy use for drinking watertreatment
The sustainable use of chemicals and energy requires an efficientuse of these, but not at the cost of drinking water quality. Increasedefficiency also means decreased cost for the treatment works. The
raw water quality and the degree of protection offreshwater resources affect this indicator. It, inturn, affects the quality of drinking water. For the King William’s Town TLC, data on
the usage of chemicals at the waterworks havebeen obtained for the period Nov. 1996 to Dec.1998. During this period, the withdrawal of rawwater has been stable at around 3.1 x 10³ m3/y or225 l/cap·d. The dosage of chlorine and lime hasalso been relatively stable during this period(2 mg/l and 8 mg/l, respectively), while thedosage of Al
2(SO4)
3 has increased from
approximately 17 mg/l to 20 mg/l. The totalamount of chemicals used in 1997 and 1998,respectively were, Al
2(SO4)
3, 53 t and 61 t,
lime, 27 t and 26 t and chlorine, 5.6 t and 5 t. Asthe raw water in the Maden and RooikransDams is of relatively good quality, it is unsure ifthis increased dosage was necessary. Futureefficiency improvements are to be expected, as
the dosing equipment at the King William’s Town Water PurificationWorks is imprecise, making it difficult to optimise dosing accordingto need, but it is hoped that new equipment will be installed soon.Future studies into the required dosage with new equipment mightallow for future decreases in the chemical usage at this plant, savingboth money and resources.
Energy efficiency has increased since 1997, when consumptionwas approximately 12 Wh/m3. In 1998, this reached approximately15 Wh/m3 (Fig. 6). The current chemicals and energy use for waterquality in the TLC is not efficient, and therefore not sustainable. Anexamination of the possible sharp increase of energy used over thepast two years should also result in multiple efficiency improvingrecommendations that will move the operation of the systemtowards sustainability.
Leakage
Large volumes of water are lost due to leakage in pipes (VA-Verket, 1997) and leads to increased pumping costs, loss of water(and revenue), loss of pressure and increased risks of contaminationby bacteria and corrosion products (e.g., copper, iron and zinc).Large amounts enter the sewage pipes, diluting the sewage anddecreasing the efficiency of the treatment process. Data on leakageare relatively easy to obtain in areas where water meters have beeninstalled in households. Otherwise, the municipality or otherorganisations may have possibly made estimations, but these datashould be viewed critically. The control of leakage not onlydecreases costs and increases revenue; it may also prove a vital wayof increasing the water supply in ‘dry’ regions, without having toincrease the withdrawal from scarce water sources. This indicatorhas a direct effect on the amounts of wastewater produced.
Water leakage for the TLC has been estimated at 20%, whichis also the estimate for Goteborg, Sweden (VA-Verket, 1997). ThePalmer Development Group (1998) also confirmed this estimate ofleakage for the TLC. As to whether this indicator is improving ornot, sufficient information was not available to make any assertion.
Reuse
In areas approaching the limits of their freshwater resources, evenwastewater must be seen as a resource. Therefore, reusing itbecomes important in achieving sustainability. Industries canreuse their wastewater if necessary after treatment. Households
Figure 6Energy efficiency at KWT Water Purification Works
ISSN 0378-4738 = Water SA Vol. 27 No. 2 April 2001 225Available on website http://www.wrc.org.za
can do the same by using grey water (sullage) and treated wastewaterfor non-potable purposes. Reusing wastewater for agriculturalirrigation enables a cyclic use of not only water but also plantnutrients, although care should be taken so that it does not containother components that may have detrimental effects on humansand/or have an adverse effect on environmental health.
In the King William’s Town TLC, water is not being recycledand reused, but King Tanning and the KWT golf course receiveapproximately 20% of the effluent (prior phosphorus removal andchlorination) from Schornville Sewage Treatment Plant (STP) forirrigation purposes (Gibb Africa, 1999). Both received individuallyjust under 0.2 x 10⁶ m3/year, for the period 1993 to 1996, but sincethen the meters have been malfunctioning. Breidbach STP uses allthe effluents for irrigation on sport fields. Generally, as far as thisindicator is concerned for drinking water, the system is not movingtowards sustainability.
Wastewater
Wastewater production
Increased production of wastewater can be caused by an increasein water usage or increased leakage of infiltration water andstormwater. This may have a number of detrimental effects:untreated water may be released into the environment due tocombined sewage overflows, sewage may be treated at decreasedefficiency and the amount of chemicals and energy used for sewagetreatment may increase. The minimisation of wastewater, i.e., onlywastewater is treated, is therefore important for environmentalsustainability.
The King William’s Town area is currently served by fiveexisting STPs located at Bisho, Breidbach, Schornville, Zwelitshaand Illitha, respectively. As some of the treatment were notdesigned to treat these volumes, or are nonfunctioning, untreatedand or partially treated sewage is discharged into the Buffalo Riverand its tributary, the Yellowwoods River. These rivers dischargeinto the Laing Dam, the main drinking water supply for the largesettlements of Zwelitsha, Illitha and Phakamisa.
The two main STPs in the TLC are the Schornville and theBreidbach Sewage Treatment Plants. The Schornville STP is thelarger of the two and is located within KWT proper, in an area of
the town called Schornville. Built in the 1960s, it initially onlyapplied mechanical and biological filters (biofilter) treatment butwas updated and expanded in the 1980s with a separate activatedsludge treatment step. Today the intention is that 60% of allincoming raw sewage should pass through the more effectiveactivated sludge treatment step with phosphorus removal throughchemical coagulation (further on referred to as the new section ofthe treatment plant). The remaining 40% passes through the oldsection of the plant with traditional sedimentation tanks, a biologicaltreatment step, a sludge digester tank as well as sand filters (GibbAfrica, 1999).
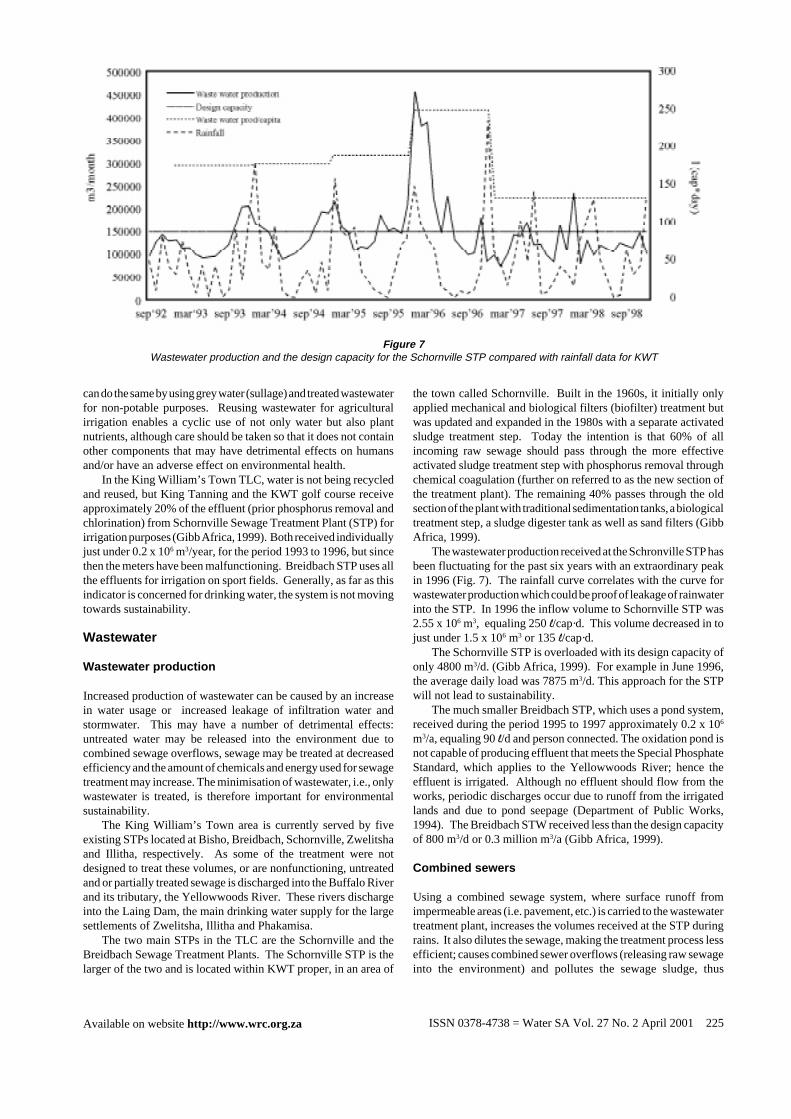
The wastewater production received at the Schronville STP hasbeen fluctuating for the past six years with an extraordinary peakin 1996 (Fig. 7). The rainfall curve correlates with the curve forwastewater production which could be proof of leakage of rainwaterinto the STP. In 1996 the inflow volume to Schornville STP was2.55 x 106 m3, equaling 250 l/cap·d. This volume decreased in tojust under 1.5 x 10⁶ m3 or 135 l/cap·d.
The Schornville STP is overloaded with its design capacity ofonly 4800 m3/d. (Gibb Africa, 1999). For example in June 1996,the average daily load was 7875 m3/d. This approach for the STPwill not lead to sustainability.
The much smaller Breidbach STP, which uses a pond system,received during the period 1995 to 1997 approximately 0.2 x 10⁶
m3/a, equaling 90 l/d and person connected. The oxidation pond isnot capable of producing effluent that meets the Special PhosphateStandard, which applies to the Yellowwoods River; hence theeffluent is irrigated. Although no effluent should flow from theworks, periodic discharges occur due to runoff from the irrigatedlands and due to pond seepage (Department of Public Works,1994). The Breidbach STW received less than the design capacityof 800 m3/d or 0.3 million m3/a (Gibb Africa, 1999).
Combined sewers
Using a combined sewage system, where surface runoff fromimpermeable areas (i.e. pavement, etc.) is carried to the wastewatertreatment plant, increases the volumes received at the STP duringrains. It also dilutes the sewage, making the treatment process lessefficient; causes combined sewer overflows (releasing raw sewageinto the environment) and pollutes the sewage sludge, thus
Figure 7Wastewater production and the design capacity for the Schornville STP compared with rainfall data for KWT
ISSN 0378-4738 = Water SA Vol. 27 No. 2 April 2001226 Available on website http://www.wrc.org.za
decreasing the possibility of recycling nutrients.The standard in South Africa is separate systems, with one set
of pipes for the domestic and industrial sewage, and another forsurface runoff. King William’s Town is no exception. Oneproblem is that backyard tap (standpipe) drains, which are oftenbuilt so that no rainwater can enter, are sabotaged. This may resultin large volumes of rainwater entering the sewage system duringheavy rains.
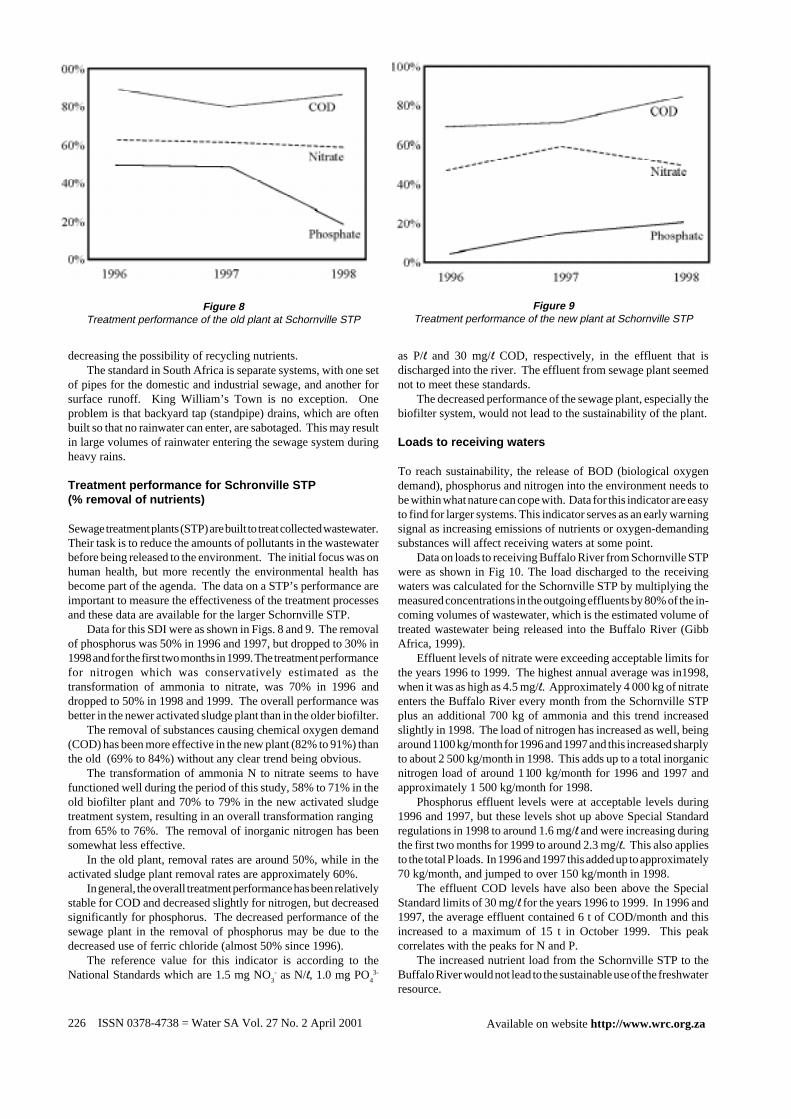
Treatment performance for Schronville STP(% removal of nutrients)
Sewage treatment plants (STP) are built to treat collected wastewater.Their task is to reduce the amounts of pollutants in the wastewaterbefore being released to the environment. The initial focus was onhuman health, but more recently the environmental health hasbecome part of the agenda. The data on a STP’s performance areimportant to measure the effectiveness of the treatment processesand these data are available for the larger Schornville STP.
Data for this SDI were as shown in Figs. 8 and 9. The removalof phosphorus was 50% in 1996 and 1997, but dropped to 30% in1998 and for the first two months in 1999. The treatment performancefor nitrogen which was conservatively estimated as thetransformation of ammonia to nitrate, was 70% in 1996 anddropped to 50% in 1998 and 1999. The overall performance wasbetter in the newer activated sludge plant than in the older biofilter.
The removal of substances causing chemical oxygen demand(COD) has been more effective in the new plant (82% to 91%) thanthe old (69% to 84%) without any clear trend being obvious.
The transformation of ammonia N to nitrate seems to havefunctioned well during the period of this study, 58% to 71% in theold biofilter plant and 70% to 79% in the new activated sludgetreatment system, resulting in an overall transformation rangingfrom 65% to 76%. The removal of inorganic nitrogen has beensomewhat less effective.
In the old plant, removal rates are around 50%, while in theactivated sludge plant removal rates are approximately 60%.
In general, the overall treatment performance has been relativelystable for COD and decreased slightly for nitrogen, but decreasedsignificantly for phosphorus. The decreased performance of thesewage plant in the removal of phosphorus may be due to thedecreased use of ferric chloride (almost 50% since 1996).
The reference value for this indicator is according to theNational Standards which are 1.5 mg NO
3- as N/l, 1.0 mg PO
43-
as P/l and 30 mg/l COD, respectively, in the effluent that isdischarged into the river. The effluent from sewage plant seemednot to meet these standards.
The decreased performance of the sewage plant, especially thebiofilter system, would not lead to the sustainability of the plant.
Loads to receiving waters
To reach sustainability, the release of BOD (biological oxygendemand), phosphorus and nitrogen into the environment needs tobe within what nature can cope with. Data for this indicator are easyto find for larger systems. This indicator serves as an early warningsignal as increasing emissions of nutrients or oxygen-demandingsubstances will affect receiving waters at some point.
Data on loads to receiving Buffalo River from Schornville STPwere as shown in Fig 10. The load discharged to the receivingwaters was calculated for the Schornville STP by multiplying themeasured concentrations in the outgoing effluents by 80% of the in-coming volumes of wastewater, which is the estimated volume oftreated wastewater being released into the Buffalo River (GibbAfrica, 1999).
Effluent levels of nitrate were exceeding acceptable limits forthe years 1996 to 1999. The highest annual average was in1998,when it was as high as 4.5 mg/l. Approximately 4 000 kg of nitrateenters the Buffalo River every month from the Schornville STPplus an additional 700 kg of ammonia and this trend increasedslightly in 1998. The load of nitrogen has increased as well, beingaround 1 100 kg/month for 1996 and 1997 and this increased sharplyto about 2 500 kg/month in 1998. This adds up to a total inorganicnitrogen load of around 1 100 kg/month for 1996 and 1997 andapproximately 1 500 kg/month for 1998.
Phosphorus effluent levels were at acceptable levels during1996 and 1997, but these levels shot up above Special Standardregulations in 1998 to around 1.6 mg/l and were increasing duringthe first two months for 1999 to around 2.3 mg/l. This also appliesto the total P loads. In 1996 and 1997 this added up to approximately70 kg/month, and jumped to over 150 kg/month in 1998.
The effluent COD levels have also been above the SpecialStandard limits of 30 mg/l for the years 1996 to 1999. In 1996 and1997, the average effluent contained 6 t of COD/month and thisincreased to a maximum of 15 t in October 1999. This peakcorrelates with the peaks for N and P.
The increased nutrient load from the Schornville STP to theBuffalo River would not lead to the sustainable use of the freshwaterresource.
Figure 8Treatment performance of the old plant at Schornville STP
Figure 9Treatment performance of the new plant at Schornville STP

ISSN 0378-4738 = Water SA Vol. 27 No. 2 April 2001 227Available on website http://www.wrc.org.za
Chemical usage for sewage sludge treatment
This indicator is in line with the demands of an increased efficientusage of chemicals and energy in order to reach a sustainableoperation of the sewage plant. The excessive dosage of certainchemicals (e.g. chlorine) may also have a detrimental effect onreceiving waters and humans (chlorine can be converted totrihalomethane which is a suspect carcinogen). Data are availableon energy and chemicals used in the treatment process at mostsewage treatment plants.
At the Schornville STP, lime is first applied to the incomingeffluent to adjust the pH. 20% of the flow is diverted after primarytreatment to the King Tanning and the golf course, while 60% of theremaining flow (equaling 48% of the incoming flow) passesthrough activated sludge and phosphorus removal steps, whereferric chloride is added. Both internal flows (from the activatedsludge system and the biofilter system, 80% of the total incomingflow) are finally treated with chlorine prior to release into BuffaloRiver.
The annual chemical usage at the sewage treatment plant was
estimated by averaging the available monthly values of one yearand multiplying by twelve. The use of chemicals has decreasedconsiderably over the last few years. Ferric chloride has decreasedfrom 73 t in 1996 to 44 t in 1998, lime from 47 t in 1996 to 39 t in1998 and chlorine from 11 t in 1996 to 5 t in 1998. Considering theusage per volume of treated sewage in Fig. 11; the trends are thesame. The dosage of FeCl
3 has decreased from 113 to 64 mg/l, lime
has decreased from just 35 to under 30 mg/l, and chlorine hasdecreased from 10 to around 5 mg/l. The decreased usage of ferricchloride has been unfortunate, as the concentrations of phosphorus(as well as nitrogen and COD) in raw wastewater have increasedand the consequence has been the increased effluent concentrationsand total loads to the Buffalo River. The decreased dosage ofchlorine may also be inappropriate, as ammonia concentrationsin the effluent have been increasing, ranging between 5 mg/l to20 mg/l in 1998. As a rule of the thumb, 10 mg Cl
2/mg NH
4+ (with
a contact time of 30 min. at 15 to 20oC) should be applied in orderto achieve sufficient sterilisation. The current dosage is considerablybelow this. Generally, the current usage of chemicals in theSchonville STP will not lead to sustainability of the treatment plant.
Figure 10Loads of phosphate, nitrate and COD to Buffalo River from Schornville STP
Figure 11Chemical usage at Schornville STP

ISSN 0378-4738 = Water SA Vol. 27 No. 2 April 2001228 Available on website http://www.wrc.org.za
Resource use per removal of nutrients for theSchornville STP
Measuring the efficiency of energy and natural resources used inthe removal of nutrients from sewage is important, as the efficiencyshould be continuously improved as the technology allows. Dataexist on the energy and chemicals used in the treatment process atmost wastewater treatment plants and this can be compared to theamount of nutrients removed.
As previously described, 48% of the incoming sewage toSchornville is treated with FeCl
3 at the activated sludge system to
chemically coagulate and precipitate phosphorus. The efficiencyof this process has been calculated by determining the degree ofphosphorus removed (inflow and new plant effluent concentrationstimes 48% of incoming volumes) and comparing this with theamounts of FeCl
3 applied. The efficiency of this removal varied
considerably every year - 180 kg FeCl3/ kg P in 1996, 131 kg FeCl
3/
kg P in 1997 and 84 kg FeCl3/kg P in 1998. One reservation to the
above calculation is that some of the phosphorus removed occurredin previous sedimentation steps without the aid of chemicalcoagulation. The increased efficiency must be viewed in the lightof a decreased dosage of ferric chloride in a period of increasinginfluent and effluent levels of orthophosphate.
The benchmark for the indicator is 75% removal rate. Thehighest removal rate at Schornville is 50% of sludge containing 1.5P mg/l (a typical value for this study) with a dosage approximately8 mg FeCl
3/l and an efficiency of around 12 kg FeCl
3 per kg P
removal. In the light of these values, the efficiency at the Schronvillesewage treatment plant must be viewed as poor and would not leadto sustainability.
Recycling of nutrients
The recycling of resources is a pillar of sustainable developmentand this naturally applies to water and wastewater as well. Therecycling of sludge as fertiliser decreases the need for commercialfertiliser, which requires large amounts of mined phosphorus, alimited resource. Commercial fertiliser also contains nitrogen, andas it is only the ammonia and nitrate forms of nitrogen that plantscan use, the fixing of atmospheric nitrogen to these forms foragriculture demands large inputs of energy. Increased usage ofsludge as fertiliser will decrease the energy and resource used inagriculture if they meet quality standards, especially with heavymetals.
At Schornville STP, dried sludge is given away to farmers whoare willing to collect it themselves. This results in erratic patternsof usage, as few have the possibility of transporting any considerablequantities. The percentage of sludge used for agricultural purposesin the study area was estimated at between 30 to 50%, with theremainder being deposited at local dumpsites. Although thisamount is considerable, future improvements are clearly possible.The indicator is useful for the system and the present practice wouldnot lead to sustainability.
Quality of sludge
The use of sludge as a fertiliser is currently under fierce debate inmany countries because of the risks coupled with its use. In manydeveloped countries, the use is regulated.
To ensure the reuse of sludge as fertiliser without jeopardisinghuman health, it must fulfil the public and legislative requirements.There are many aspects of interest when considering the quality ofsewage sludge as fertiliser, but the main aspect of the danger andan important reason for reservations as to its use has been heavy
metal contents of sludges. More recently in Europe, the possiblecontamination of parasites, bacteria and viruses led to increasedconcern (Albihn, 1999).
The detrimental effects of heavy metals and other chemicalcompounds are well documented (McLaughlin et al., 1999; McBride,1998; Senesi et al., 1999). Several factors are currently beingresearched, such as availability, actual crop uptake, chronic effectson human health as well as other uncertainties.
Application of this indicator to the STP has revealed thatquality tests, especially as regards to metal contents are not done onthe sludges before they are given to farmers or before they are beingdeposited on the local dumpsites where there could be leaching tothe environment. This approach would not lead to sustainability.
Energy recovery
Substantial amounts of energy are used for the collection andtreatment of sewage and energy is also produced in the treatmentprocess. Recovering some of it is in line with sustainabledevelopment. This can be done via biogas or heat pumps. Theseamounts of energy recovered by a plant should be recorded andshould be made available. This, however, is an uncommon practicein South Africa and there are no such records at any of the sewagetreatment plants in the King William’s Town TLC. Data were notavailable to apply this indicator to the case study.
Development
The previous indicators were developed with the urban systems ofEurope and the USA in mind. In a developing area such as this casestudy, other parameters must also be considered in order to evaluatethe sustainability of the water and sewage treatment plants. Thefollowing ISDs - access to safe drinking water and access tosanitation - have been proposed by the UN Commission onSustainable Development in their working list of Indicators ofSustainable Development (UNCSD, 1999). One other importantISD is the economic indicator that determines the cost or affordabilityof the services to the community in the TLC. This SDI is importantbecause of the different socio-economic groups that are served bythe TLC.
Access to safe drinking water
Safe drinking water is of the utmost importance in lowering the riskof faecal pollution and the frequency of associated diseases. “Safe”water does not contain biological and chemical agents atconcentration levels directly detrimental to health. Access isdefined as availability in the home or within a reasonable walkingdistance, although a more proper definition may be less than 200 mwhen in an urban area. An adequate amount of water should satisfymetabolic, hygienic and domestic requirements, and this is usuallydefined as 20 l/d (UNCSD, 1999). The World Health Organisation(2000) recommends a minimum of 15 to 20 l/d of clean water forconsumption (drinking and food preparation) and sanitation(bathing, cleaning etc,).
About 5 m. South African urban residents live more than 250m away from the nearest source of available water according to themost recent municipal survey of water provision. An additional4.4 m. people have access to communal standpipe at a distance ofless than 250 m (Goldblatt, 1999). This is largely due to the pre-democracy development policies. At present, The South Africangovernment has committed itself to ensuring that all people willhave access to at least 25 l/cap·d of clean water which is the benchmark for this indicator (ANC, 1994; DWAF, 1994).
ISSN 0378-4738 = Water SA Vol. 27 No. 2 April 2001 229Available on website http://www.wrc.org.za
The TLC services people of different socio-economic groups.Applying this indicator to the study area revealed variation inaccess to safe drinking water depending on the socio-economicgroup of people in the area. While access is about 100% in the richareas like King Williams Town and Bisho, it varies between 90 and95% in the poor areas like Illitha, Zwelitsha and Dimbaza. Ingeneral, access to safe drinking water is between 95 to 97% in thestudy area (reference value for the indicator is 100%).
Consumers in the rich areas pay full rate while those in poorinformal settlements pay flat rates that are subsidised. Whilesubsidisation of rates in the poor areas does not affect the qualityof water supplied, it does however affect the quality of service andthe quantity of water consumed. Many in the poor areas haveaccess only to standpipes (communal taps) within walking distancefrom their homes while in the rich areas almost all consumers havein-house taps. At the study area, the average water consumption isabove 50 l/cap·d (Palmer Development Group, 1998). The consumedaverage water per capita is well in excess of the WHO minimumlimits of 20 l/cap·d (WHO, 2000). However, it must be stressed thatwater consumption is not uniform in the study area as people in therich socio-economic group areas consume much more than those inthe poor socio-economic group areas. This indicator is very usefuland its application here shows that the system is moving towardssustainability in this regard.
Access to adequate sanitation
This indicator presents information that is useful for assessingsustainable development, especially as it relates to human health.The accessibility to adequate excreta disposal is fundamental todecrease faecal risk and the frequency of associated disease. Thisindicator can also provide evidence of inequity when studied froma geographic, social or economic point of view (UNCSD, 1999).This may prove to be especially useful in South Africa, due itsprevious political history. A sanitary facility is defined as a unit fordisposal of human excreta, which isolates faeces from contact withpeople, animals, crops and water resources. Suitable facilitiesrange from simple but protected pit latrines to flush toilets withsewerage. For any facility to be effective, it must be correctlyconstructed and properly maintained (UNCSD, 1999).
The SDI was applied to the case study. Sanitation in the studyarea is water borne and access to the system depends on the socio-economic group of the consumers. While access is a most 100% inthe rich areas of the TLC (e.g. King Williams Town and Bisho), itvaries between 80 and 90% in the poor areas like Illitha, Zwelitshaand Dimbaza. In general, access to sanitation is between 92 and95% in the study area (reference value for the indicator is 100%).This indicator is useful and its application here shows that thesystem is moving towards sustainability. Cost of the service in thepoor socio-economic group areas are again subsidised.
Economic indicator
Sustainability of the system needs to be assessed in terms ofaffordability both to the utility and to the consumers especially ina TLC that serves people from different socio-economic groups.The population of consumers currently served by the TLC includesthe poor, rural settlements as well.
This indicator was applied to the study area. Services suppliedare affordable to 100% of the people in the rich areas and they paythe full cost of services. Incidences of disconnection of services arerarely reported in these areas. In the poor areas, full cost of servicesis not affordable by a large number of people in the area and istherefore subsidised at a flat rate. Almost 100% of the population
in the area can afford this flat rate. However, it is doubtful if thiswill be sustainable. The idea of paying a flat rate does notencourage people to minimise wastage of drinking water fromleaking and broken pipes and it does not minimise cost of repairsand maintenance of sewer systems due to careless disposal ofwastes. The TLC also can afford the cost of providing the servicesto the areas they serve.
This indicator is very useful for the study area. It is the SDI thatwill determine accessibility to services. The idea of subsidisationof costs of service to the poor areas makes it affordable to both theutility and the consumers but it is doubtful if this is sustainable.
Suitability of indicators to the case study
The majority of the 20 proposed indicators were developed for usein the developed countries of Europe. Whilst conducting this studyin South Africa, it was evident that some of the basic conditions aredifferent from the situation in Europe. An evaluation of therelevance and importance of each of the indicators will be ofinterest. A summary of the evaluation of the SDIs in terms of dataavailability, suitability, awareness of and score is given in Appen-dix 1. A brief discussion on this evaluation is given below:
Freshwater resources
Withdrawal (%), as a SDI has a high relevance to the case study.The driving force is to save water since the demand is high andwater is scarce. There is an awareness of problems related to highwithdrawal and the SDI can predict a coming water shortage. Dataare available for this SDI and it is easy to apply in the study area.It is a suitable SDI.
Raw water quality has a very high relevance in the study areasince it has few water sources. There is awareness of this SDI in theTLC and raw water quality is good, but further downstream theproblems are more severe. The reasons for this are leaking landfillson the riverbanks and untreated effluents entering the river. Somedata are available for the SDI and can be applied. It is a suitableindicator.
A degree of protected sources as a SDI has relevance in theTLC. The driving force for this SDI is the prevention of pollutionof the water sources. In the TLC, the water sources are not protectedand the awareness for this SDI is not high. The SDI is not easilyapplicable to the study area and it is not a suitable indicator.
Drinking water
Water consumption (l/cap·d) SDI has a high relevance in the TLCthat has an uneven consumption pattern for water between the richand the poor. People in the rich socio-economic group consume alarge quantity of the water that is available. The awareness of thisSDI is high. The acknowledgement of the increasing populationand hence increasing water demand and the current uneven waterconsumption pattern between the rich and the poor has set newgoals for the TLC in order to achieve guaranteed water to all. Dataare moderately available for the SDI and it is a suitable indicator.
Drinking water quality as a SDI could have relevance to thecase study but measurements are not performed regularly on thedrinking water quality and data are difficult to obtain. Little datawere available for the SDI in the TLC and these were used to applythe indicator in the study area. The indicator is suitable.
The awareness of chemical and energy use for drinking wateris low in the TLC. The dosage is done manually and adjusted a fewtimes each day. However, data are readily available for theindicator in the TLC and it is a suitable indicator to use for the

ISSN 0378-4738 = Water SA Vol. 27 No. 2 April 2001230 Available on website http://www.wrc.org.za
system.Little is known about leakage in the system and data are not
available for this SDI in the TLC. The awareness of the problemrelated to this SDI is high in the TLC but little is done because ofthe cost of repairing or replacing leaking water pipes. It is not asuitable indicator for the system.
The relevance and awareness of reuse as a SDI is high in theTLC. A good example is the fact that wastewater from the STPs inthe study area is used to irrigate sport fields and a golf course, or sentto the industries. By increasing the reuse of water, a decrease of theeffluent to recipients and a decrease of the withdrawal are achieved.Data are moderately available for the indicator in the TLC and it issuitable for the study area.
Wastewater
The awareness and relevance of wastewater production as a SDI ishigh in the TLC. Data are readily available for the SDI. Thecapacity of the major STP has already been exceeded. This SDI isuseful because of population increase and new householdconnections through the extensive Reconstruction and DevelopmentProgramme. Plans for the building of a new, larger-scale STP forthe whole TLC is in progress. The indicator is suitable for the studyarea.
Combined sewers system is not a problem in the TLC asseparate systems are built and therefore, this SDI does not have ahigh relevance to the TLC. It is not a suitable indicator for thesystem.
The awareness of the STP’s treatment performance was nothigh in the TLC. However, data are moderately available for theSDI and it is a suitable indicator for the case study. A highertreatment performance is preferable for the environment. TheBuffalo River that receives effluent from the Schornville STP, forexample has a tendency towards eutrophication.
Loads to receiving waters as a SDI has great relevance to thestudy area. Reasons for this are that new houses are connected tothe existing bulk network almost every day and the capacities of theSTPs in the area have already been exceeded. Therefore, higherloads to the Buffalo River can be expected. The awareness of thisSDI is high and data are moderately available. It is a suitable SDIfor the case study.
The awareness of chemical and energy use for wastewatertreatment is low in the TLC and the relevance is moderate. Datawere readily available for the SDI. Dosage of chemicals at theSchornville STP is done manually. Therefore, efficiency might below. The SDI is suitable for the study area.
Resource use per removal of nutrient as a SDI is very relevantto the study area but the awareness is low. This SDI is useful forprotecting the environment and for saving money in terms oftreatment cost. Moderate data were available and the SDI wassuitable for the study area.
Recycling of nutrients was done to a small extent in the studyarea. The awareness of the SDI was low and little data are available.The relevance of the SDI is high to the study area. Sludge from theSTP is now deposited on local dumpsites and leakage may occurwhich may also reach recipients. It is a suitable indicator for thesystem.
The relevance and importance of the sludge quality is high forthe study area because of heavy metals concentrations in sludge andthe presence of microbes. There is moderate awareness of this SDIin the TLC but no quality testing of the sludge was performed. Itis a suitable SDI though, for the study area.
There were no facilities for energy recovery in the study area.
Though the SDI is relevant, the awareness for it is very low. Datawere not available for the SDI in the TLC and it was not a suitableindicator for the study area.
Access to drinking water and to adequate sanitation are extremelyimportant and are useful indicators for the study area. Theawareness for each of these indicators is high in the TLC and theyare suitable indicators for the system.
Economic indicator is also a SDI that has a high relevance to thestudy area because of the different socio-economic groups servedby the TLC. The awareness for the indicator is high in the TLC andis a suitable indicator.
Conclusion
20 SDIs were tested for urban and wastewater systems in the KingWilliam’s Town TLC and of these, 15 were found to be useful forthe current situation in the study area and were recommended forfuture studies (Appendix 2). Some SDIs like raw water withdrawal,drinking water consumption, chemical use, wastewater production,treatment performance, loads to receiving, recycling of nutrients,access to drinking water, sanitation and economic indicator wereeasy to apply in the study area as data were readily available. OtherSDIs, like drinking water quality, energy use, and quality of sludgewere difficult to apply because data were not readily available.With this list of indicators, the sustainability and future trends of thewater and wastewater systems in the TLC were assessed. Thecurrent situation for many indicators studied for the water andwastewater system in the TLC is not moving towards sustainabilityand some improvements are necessary in the operation of thesystems to make them sustainable.
Recommendation
It is recommended that system managers in the TLC should obtaindata on the following SDIs as indicated in Appendix 2 for futureuse to monitor sustainability of the systems in the TLC. These SDIsare: raw water withdrawal, raw water quality, drinking waterconsumption and drinking water and water reuse. Others includewastewater production, treatment performance, loads to receivingwaters, chemicals and energy use for sewage treatment, resourceuse/removal of nutrients, recycling of nutrients, quality of sludge,access to drinking water, access to sanitation and cost or affordabilityof services.
Acknowledgement
The authors will like to thank SIDA for granting MFS scholarshipsto E Zinn and D Jacobsson.
References
AFRICAN NATIONAL CONGRESS (1994) The Reconstruction andDevelopment Programme, Umanya Publications, Johannesburg.
ALBIHN A (1999) Kretslopp – mer smittsamt an hallbart? Forskningoch Framsteg.
BAKKES JA, VAN DER BORN GJ, HELDER JC, SWART RJ, HOPECW AND PARKER JDE (1994) An Overview of EnvironmentalIndicators: State of the Art and Perspectives. Environmental AssessmentTechnical Reports, United Nations Environmental Programme, NewYork, USA.
DEPARTMENT OF WATER AFFAIRS AND FORESTRY (1994) WaterSupply and Sanitation Policy White Paper: Water – An IndivisibleNational Asset, Government Printer, Pretoria.
DEPARTMENT OF WATER AFFAIRS AND FORESTRY (1998) Water

ISSN 0378-4738 = Water SA Vol. 27 No. 2 April 2001 231Available on website http://www.wrc.org.za
Quality Guidelines. Quality of Domestic Water Supply Vol. 1.Assessment Guide.
DEPARTMENT OF PUBLIC WORKS (1994) Yellowwoods RegionalSewerage Scheme: Feasibility Study. Project No. 17107-3231.
GALLOPIN GC (1997) Indicators and their use: Information for decision-making. In: Moldan B, Billharz S and Matravers R (eds.) SustainableIndicators. A report on the project on indicators of sustainabledevelopment, John Riley & Sons, Chichester, England.
GIBB AFRICA (1999) Greater King William’s Town Regional SewerageScheme, Initial Scoping Report, Job. No. J80220A, East London,South Africa.
GOLDBLATT M (1999) Assessing the effective demand for improvedwater supplies in informal settlements: A willingness to pay survey inVlakfontein and Finetwon, Johannesburg. Geoforum 30 (1) 27 – 41.
HAGLUND K and NORMAN J (1984) Kvavet – Ett vattenvardsproblem.Miljoeffekter, utslapp,reningsmetoder, kostnader, (IVL) SwedishEnvironmental Research Institute, Stockholm.
LUNDIN M, MOLANDER S and MORRISON G M (1997) Indicators forthe Development of Sustainable Water and Wastewater Systems.Sustainable Research Conference, Manchester.
LUNDIN M, MOLANDER S and MORRISON GM (1999) A set ofindicators for the assessment of temporal variation in the sustainabilityof sanitary systems. Water Sci. Technol. 39 (5) 235 - 242.
McBRIDE MB (1998) Growing food crops on sludge-amended soils:Problems with the US Environmental Protection Agency method of
estimating toxic metal transfer. Environ. Toxicol. & Chem. 17 (11)2274 - 2281.
McLAUGHLIN MJ, PARKER DR and CLARKE JM (1999) Metals andmicronutrients – Food safety issues. Field Crop. Res. 60 (1-2)143- 163.
OECD (1998) Towards Sustainable Development, Environmental IndicatorsOECD, Paris.
O’KEEFFE JH, VAN GINKEL CE, HUGHES DA, HILL TR and ASHTONPJ (1996) Buffalo River Project. A Situation Analysis of WaterQuality in the Catchment of the Buffalo River, Eastern Cape, withSpecial Emphasis on the Impacts of Low Cost, High-Density UrbanDevelopment on Water Quality. Vol. 1 WRC Report No. 405/1/96 &Vol. 2 (Appendices), WRC Report No. 405/2/96.
PALMER DEVELOPMENT GROUP (1998) Water Supply Services Model:Case Study of King William’s Town. WRC Report No. KV110/98.
SENESI GS, BALDASSARRE G, SENESI N and RADINA B (1999)Trace element inputs into soils by anthropogenic activities andimplications for human health. Chemosphere 39 (2) 343 - 377.
SETPLAN (1997) King William’s Town TLC Framework Plan for KWTTLC by Setplan, East London.
UNCSD (1999) United Nations Sustainable Development – Indicators ofSustainable Development. http://www.un.org/esa/sustdev/isd.htm.
VA-VERKET GOTEBORG (1997) Arsberattelse 1996 Goteborg.WHO (2000) The Management of Nutrition in Major Emergencies. Geneva.
Appendix 1List of the SDIs indicating data availability, suitability, scores and levels of awareness of the indicators in the
study area
SDI Data availability Awareness Suitability Score
Category: Freshwater resources
Withdrawal Readily available High Suitable About 100% of total annual volume
Raw water quality Moderate availability Moderate Suitable Satisfactory according to NationalStandards
Protection None Low Not suitable No source is protected
Category: Drinking Water
Water consumption Moderate availability High suitable Above WHO standard (20 l/cap·d)
Drinking water quality Not readily available Moderate Suitable % of tap tests within WHO or Nationalregulation is not quantified
Chemical and energy use Readily available Moderate Suitable Chemical dosage not appropriate;for the drinking water energy use is not efficient
Leakage Not readily available High Not suitable No score
Water reuse Moderate High Suitable Moderately reused
Category: Wastewater
Wastewater production Readily available High Suitable Above capacity of the STP
Combined sewers Not available High Not suitable Not used; no score
Treatment performance Readily available Low Suitable Below National regulation
Loads to receiving water Moderate High Suitable Above critical load to Buffalo River
Chemicals and energy use Readily available Low Suitable Not efficientfor wastewater treatment for chemical usage
Resource use per removal Moderate Low Suitable Not efficientof nutrient

ISSN 0378-4738 = Water SA Vol. 27 No. 2 April 2001232 Available on website http://www.wrc.org.za
APPENDIX 2Recommended Working List of SDIs for King William’s Town Urban Water System
Indicator Parameter(s) Suggested reference value
Category: Freshwater resources
Withdrawal Total withdrawal compared to available amount Less than 100
Raw water quality Concentrations of dissolved Na, N and coliform counts Below National Standardscompared to National Standards
Category: Drinking water
Water consumption Water use (l/cap·d) compared to WHO recommendation WHO recommendations (20 l/cap·d)
Drinking-water quality % of tap tests with regulation 100%
Chemical and energy use mg Cl/l and Wh/m3 Increasing efficiencyfor water supply
Category: Wastewater
Wastewater production l/cap·d STP capacity
Chemical and energy mg Cl/l, mg FeCl3/l, Wh/m3 Increasing efficiency
Treatment performance % removal of P, N, and BOD According to National regulations
Resource use per removal Kg FeCl3/kg P Increasing efficiency
of nutrient
Loads to receiving water % loads of N, P, and Na compared to the critical load Less than 100%for Buffalo River
Recycling of nutrients % of nutrients recycled Increasing towards 100%
Quality of sludge % of sludge quality tests within international regulations 100%
Category: Development
Access to drinking water % of population with access within 200 m 100%
Access to sanitation % of population with adequate sanitation 100%
Affordability % of population that could afford the cost of service 100%
SD1 Data availability Awareness Suitability Score
Recycling of nutrients Low Low Suitable Much below 100%
Quality of sludge Not available Low Suitable No score
Energy recovery Not available Moderate Not suitable No score
Category: Development
Access to clean drinking Moderate High Suitable 95 – 97%water
Access to adequate Moderate High Suitable 92 – 95%sanitation (water borne)
Affordability of services Moderate High Suitable 92 – 95%