“sustainable bio resources in india” - bengal … grass – co3 & co4 – as cattle feed i....
TRANSCRIPT

“Sustainable Bio Resources in India”
WBA - Roundtable Seminar - 26th Nov 2014
K.Krishan

INDIA – BIO RESOURCES AVAILABILITY

BIOMASS HAS VERY SIGNIFICANT CURRENT/FUTURE SHARE
IN INDIAN HOUSEHOLDS ENERGY CONSUMPTION (mill TOE)
NEED TO ENHANCE EFFICENCY & OPTIMISE ENERGY YIELD
2005
(156.8) 2030
(232.6)
All H/H : Electricity : 8.9 -> 48.7; LPG/N.Gas : 11.7 to 36.6; Biomass : 123.6 -> 138.9
Rural H/H : Electricity : 3.5 -> 19.9; LPG/N.Gas : 2.8 to 9.7; Biomass : 114.0 -> 130.7
Bio energy, currently, contributes 23.5% of India’s
primary energy (750 mill TOE) .

SOURCE AVAILABILITY (million hectares)
BIO RESOURCE APPLICATIONS
Forests Land 70.0 overall 28.8 open forest
(a) Fast growing bamboo/tree species
(under National Mission for Greener
India)
(b) Forest residues, lantana, etc., that
can be sustainably harvested/collected
(i) Cooking/Heating fuel
(ii) Feedstock for Boilers/Gasifiers (iii) Pyrolysis for Liquid BioFuels
Agriculture Land
141.0 nett cropped
200.0 gross
cropped
55.0 lying fallow for 6 months.
(i) 120 million tons of Agro Processing
units residues (bagasse, husk)
…………………………………………………
(ii) 600 million tons of agricultural
residues
(iii) Short cycle leguminous/silage crops cultivated when land is fallow.
(i) Feedstock for Boilers/Gasifiers
………………………………..
(ii) Pyrolysis for Liquid BioFuels
…………………………………
(iii) Feedstock for Bioethanol/Biogas Plants.
Grazing/Fallow Land
50.0 overall (a) Non edible oil seeds
(b) Algae with high lipid content
…………………………………………………
(c) Appropriate species of bamboo/trees
…………………………………………………
(d) Short cycle leguminous/silage crop
(e) Algae which gives high Biomass yield
(i) Production of SVO/Bio diesel
……………………………………..
(ii) Cooking fuel
(iii) Feedstock for Gasifier/Boilers
……………………………………..
(iv) Feedstock for
Bioethanol/Biogas Plants.
……………………………………. (v) Pyrolysis for Liquid BioFuels
Coastline 7517 km (including Islands)
(i)Algae with high lipid content or with
high biomass yield.
(ii) Sea Weeds
(i) Production of Biofuels through
Bio Ethanol Refineries or Hydro
treatment.
...................................... ii) Pyrolysis for Liquid BioFuels
BIO RESOURCES AVAILABILITY Sustainable Bio Resources, linked to land & coastline are summarized in chart below
INDIA – POTENTIAL for PLANTATIONS
• State of Forest Report 2009
– About 28.83 million (out of total 71 million) hectares is of open forest lands (tree cover of canopy density between 10-40%) &
– 0.28 million hectare of scrub land (tree cover of canopy density less than 10%).
• National Mission for Greening India
– Aims at increasing forest / tree cover on 5 million hectare forest / non forest lands and
– improves quality of forest cover on another 5 million hectare which will be taken up on degraded forest land.
• Therefore, identifying 2.0 million hectares for energy plantations may not be a major constraint, subject to enabling policy guidelines framed by the Ministry of Environment & Forest and Ministry of Rural Development.

Agricultural Crop Gross Area (mill hectares) Production
(mill MT) Cultivated Irrigated
Rice 43.5 22.4
Wheat 26.6 23.5
Other grains 29.4
Pulses 22.4
SUB TOTAL- FOOD
GRAINS 121.9 230-250
Oilseeds 27.7 6.5
Cotton 8.9 2.6
Sugarcane 4.2 4.0
Tea/Coffe 0.8
SUB TOTAL- CASH
CROPS 41.6 350-400
Agriculture waste (incl. inferior quality “dry” fodder)
(Indian Agriculturecharacterised by low farm yields – through sub-optimal farming of grains)
40% of land is under “1 season” mono cropping : potential for sustainable cultivation of “short cycle” cellulosic biomass, as animal feed + make agri residues surplus (to be feedstock for bio energy projects). Yields improvement through adding compost (produced from processing manure/bio waste)

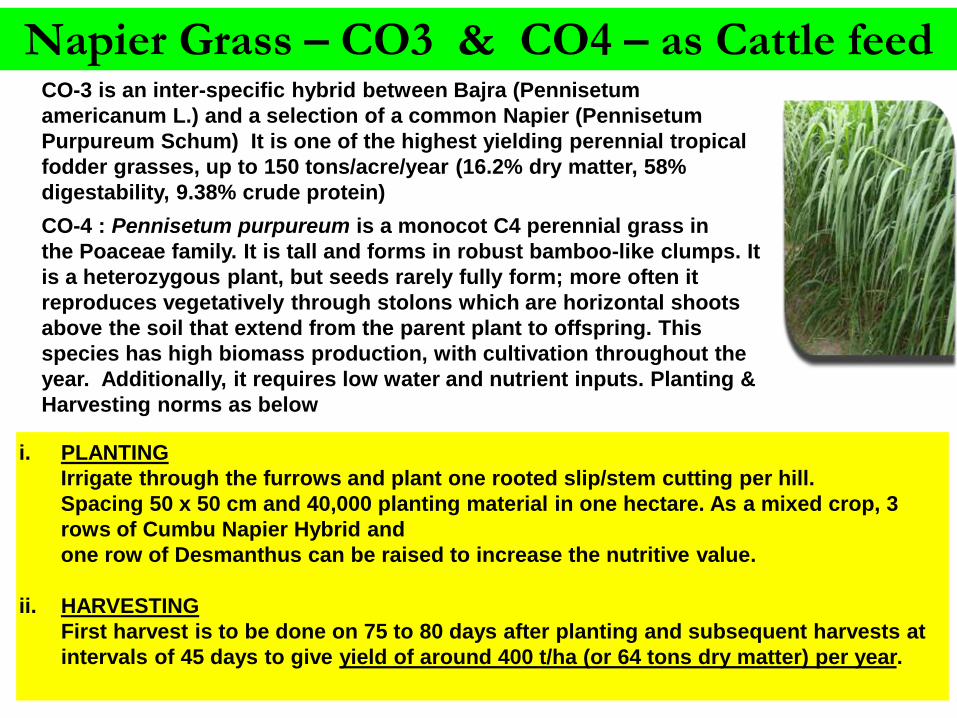
CO-4 : Pennisetum purpureum is a monocot C4 perennial grass in
the Poaceae family. It is tall and forms in robust bamboo-like clumps. It
is a heterozygous plant, but seeds rarely fully form; more often it
reproduces vegetatively through stolons which are horizontal shoots
above the soil that extend from the parent plant to offspring. This
species has high biomass production, with cultivation throughout the
year. Additionally, it requires low water and nutrient inputs. Planting &
Harvesting norms as below
Napier Grass – CO3 & CO4 – as Cattle feed
i. PLANTING
Irrigate through the furrows and plant one rooted slip/stem cutting per hill.
Spacing 50 x 50 cm and 40,000 planting material in one hectare. As a mixed crop, 3
rows of Cumbu Napier Hybrid and
one row of Desmanthus can be raised to increase the nutritive value.
ii. HARVESTING
First harvest is to be done on 75 to 80 days after planting and subsequent harvests at
intervals of 45 days to give yield of around 400 t/ha (or 64 tons dry matter) per year.
CO-3 is an inter-specific hybrid between Bajra (Pennisetum
americanum L.) and a selection of a common Napier (Pennisetum
Purpureum Schum) It is one of the highest yielding perennial tropical
fodder grasses, up to 150 tons/acre/year (16.2% dry matter, 58%
digestability, 9.38% crude protein)
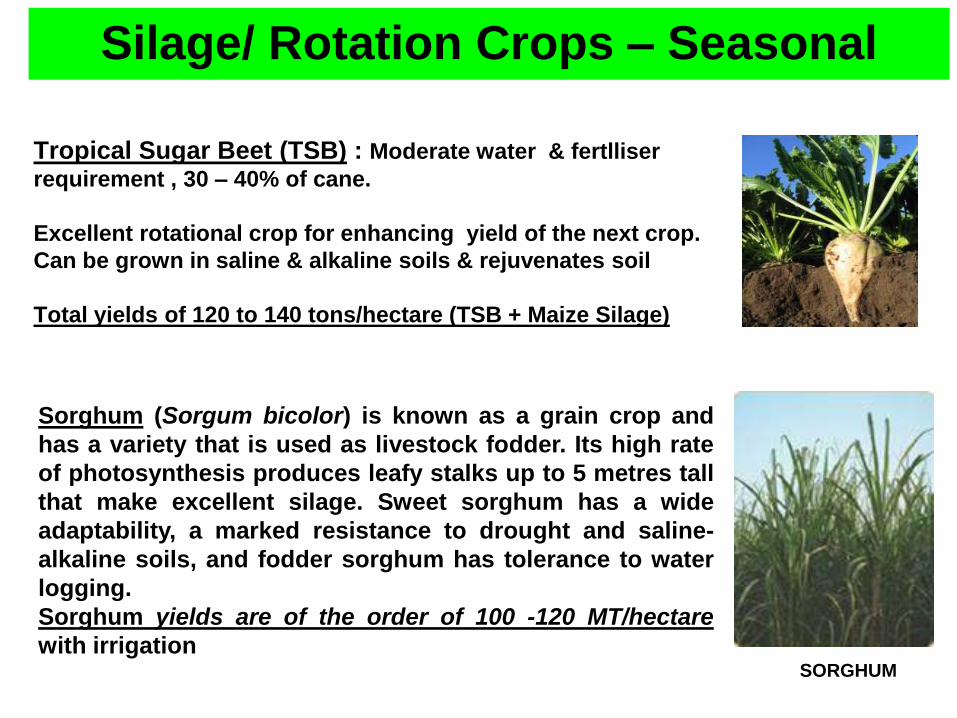
Sorghum (Sorgum bicolor) is known as a grain crop and
has a variety that is used as livestock fodder. Its high rate
of photosynthesis produces leafy stalks up to 5 metres tall
that make excellent silage. Sweet sorghum has a wide
adaptability, a marked resistance to drought and saline-
alkaline soils, and fodder sorghum has tolerance to water
logging.
Sorghum yields are of the order of 100 -120 MT/hectare
with irrigation SORGHUM
Silage/ Rotation Crops – Seasonal
Tropical Sugar Beet (TSB) : Moderate water & fertlliser
requirement , 30 – 40% of cane.
Excellent rotational crop for enhancing yield of the next crop.
Can be grown in saline & alkaline soils & rejuvenates soil
Total yields of 120 to 140 tons/hectare (TSB + Maize Silage)

Silage Preparation & Storage
Silage Pile Horizontal Silo’s (Bunkers)
India’s current fodder consumption (green + dry) is around 1 billion MT. Cultivating short cycle cellulosic biomass ,as 2nd crop in rain fed areas, can enhance availability to 2 billion MT … meeting needs of Animal feed as well as generating surplus for Bio-energy .
Milk production (annually 120 mill tons, targeted as 200 mill tons by 2021)
is a key element of farm households nutrition & income (from milk sales)
Poor quality fodder is a key cause of low milk yields in India …
70 million producers average only 6 to 8 liters/day of milk.

Rice Straw – Punjab, Haryana, UP, Bihar
Satellite picture of Punjab
(end Sept – early Nov))
> 40 million MT rice straw is annually generated in North India (Punjab, Haryana, Uttar
Pradesh & Bihar) where wheat is the winter crop & rice is summer crop. > 90% of this rice
straw is burnt in fields. Hence, significant resource for Cellulosic Ethanol production.

Source : Mint, 5th November, 2014
Black Carbon – from burning of Paddy straw –
reduces wheat output
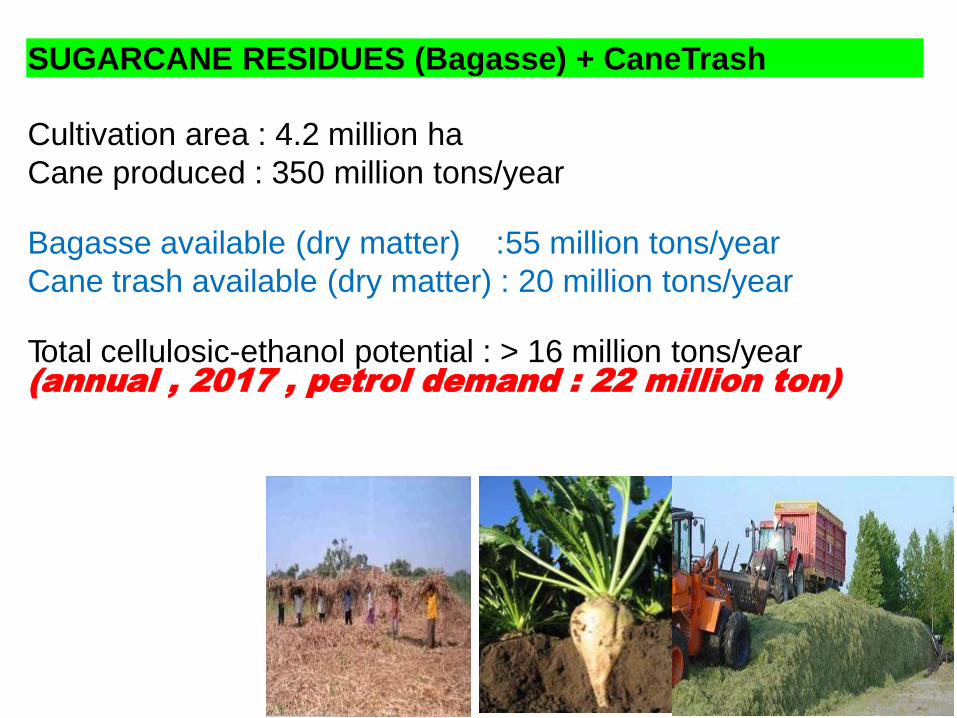
SUGARCANE RESIDUES (Bagasse) + CaneTrash
Cultivation area : 4.2 million ha
Cane produced : 350 million tons/year Bagasse available (dry matter) : 55 million tons/year
Cane trash available (dry matter) : 20 million tons/year Total cellulosic-ethanol potential : > 16 million tons/year (annual , 2017 , petrol demand : 22 million ton)
1
3
14
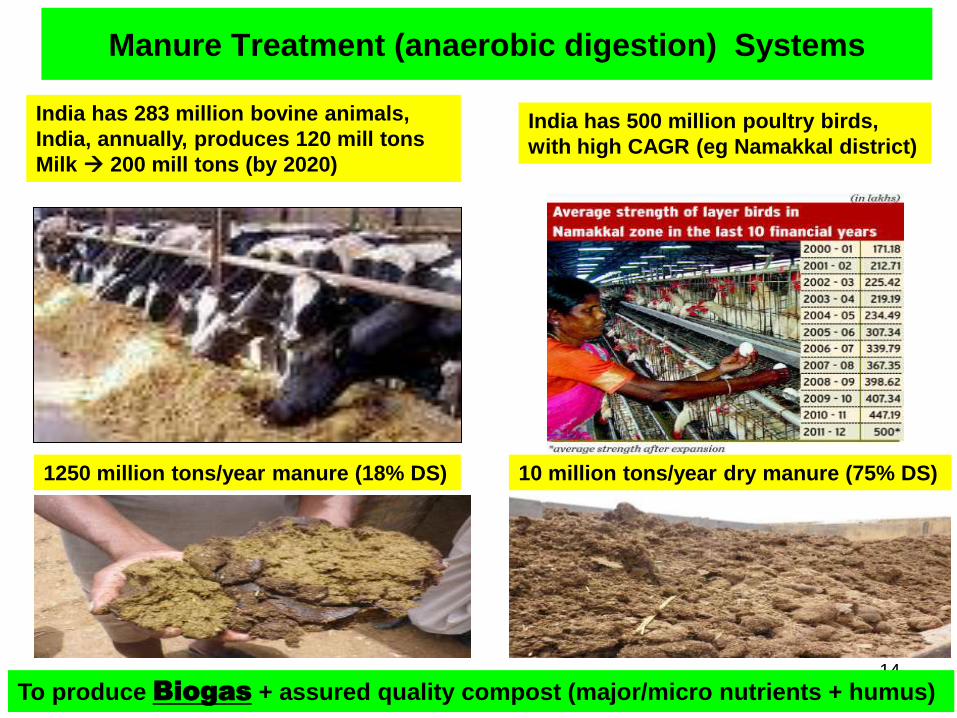
Manure Treatment (anaerobic digestion) Systems
10 million tons/year dry manure (75% DS) 1250 million tons/year manure (18% DS)
India has 500 million poultry birds,
with high CAGR (eg Namakkal district)
India has 283 million bovine animals,
India, annually, produces 120 mill tons
Milk 200 mill tons (by 2020)
To produce Biogas + assured quality compost (major/micro nutrients + humus)

• Indian farmers tend to cultivate grains (even with sub optimal returns, rather than vegetables ) as they are not perishable.
• Green Houses & Cold Chain infrastructure would (a) stimulate non grain farming (b) enhance farmers income (c) meet nutrition needs of the community (d) open up significant opportunities for exports
• Liquid CO2 controlled injection into Green Houses would double the yield
• Dry Ice (produced from liquid CO2) could meet cooling needs of “Pack Houses” & refrigerated transport.
• Compost will increase yields
Cold Storage
Cut Vegetables
Tomato Puree
Mango Pulp
India’s Horticulture output is 210 mill MT against NHM target of 350 mill MT waste (30
to 40% of output, which can be processed to produce biogas + organic fertiliser)
China’s vegetable output is 330 kg per capita (> 3 times Indian output & twice world average )
Horticulture linked Bio waste processing

MUNICIPAL SOLID WASTE … Indian Scenario
• Energy content in waste is not being used
• No creation of new jobs negative added value!!!

Sewage Treatment
• Sewage in Urban areas, estimated to be 37,700 MLD and anticipated
to grow to 50,000 MLD by 2020.. Higher if Industrial effluents is added.
CAGR of 1.60%
• Presently, only 34% being treated
• Contamination of ground water/ water bodies,
• Results in health and hygiene issues.
• Among multiple treatment technologies,
anaerobic treatment is preferred choice
– Since it uses minimal energy
– Produce energy rich biogas
– Produces sludge to compost

SOCIO – ECONOMIC IMPERATIVES –
OPTIMAL UTILISATION OF BIO RESOURCES
FOR ENERGY ACCESS & ENERGY SECURITY

Need to stimulate non farm economic activity Mint, 1st Oct, 2012
Around 8,000 “Urban Centres” (including about 4,000 “Census towns”).
These should be economic growth centres but suffer from poor energy access.
This could, potentially, lead to major socio-economic unrest.
Large Villages

Source : Mint, 4th November,
2014
Labor Force – needs productive employment

Source : Mint, 4th November,
2014
Need to ensure Energy Access – to avoid
social disparities & migration

Electricity Scenario
About 400 million households in India lack electricity access.
Furthermore, even where there is electricity access the quality as well as
availability of supply is very poor.
Equally significantly, the actual cost of electricity supply to rural
households is very high as the demand is typically from 6 PM to 11 PM,
(coinciding with the Indian grids peak load) is very high due to (a) power
purchase at peak rates (b) high distribution losses (c) high O&M costs due
to low grid utilization factor.
DDG based on diesel generator sets has been a solution for many
decades and regrettably often the only source of access to economically
disadvantaged communities, forming part of the 400 million households
without electricity access.
DDG hybrid solution (Solar + Biomass), has emerged as optimal techno-
economic solution for enhancing electricity access. Solar PV, Biomass
Gasification and Biogas Plants have proven business models, with
potential for wide scale replication.
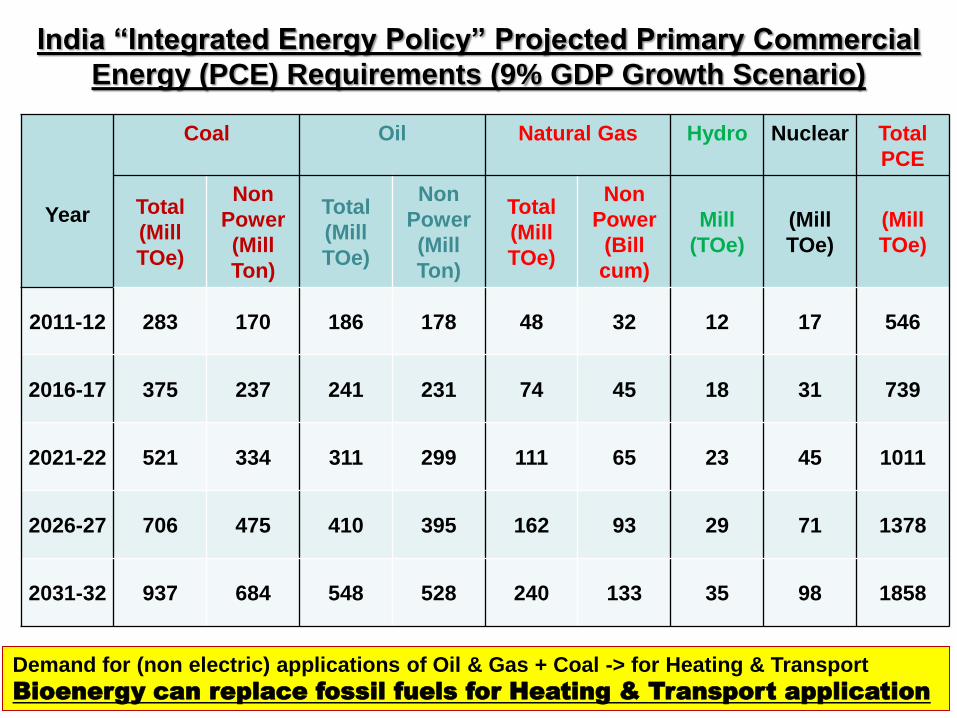
India “Integrated Energy Policy” Projected Primary Commercial
Energy (PCE) Requirements (9% GDP Growth Scenario)
Year
Coal Oil Natural Gas Hydro Nuclear Total
PCE
Total
(Mill
TOe)
Non
Power
(Mill
Ton)
Total
(Mill
TOe)
Non
Power
(Mill
Ton)
Total
(Mill
TOe)
Non
Power
(Bill
cum)
Mill
(TOe)
(Mill
TOe)
(Mill
TOe)
2011-12 283 170 186 178 48 32 12 17 546
2016-17 375 237 241 231 74 45 18 31 739
2021-22 521 334 311 299 111 65 23 45 1011
2026-27 706 475 410 395 162 93 29 71 1378
2031-32 937 684 548 528 240 133 35 98 1858
Demand for (non electric) applications of Oil & Gas + Coal -> for Heating & Transport
Bioenergy can replace fossil fuels for Heating & Transport application

Year
Fire Wood
& Chips Electricity Dung Cake Kerosene L.P.G.
8% 9% 8% 9% 8% 9% 8% 9% 8% 9%
2000 79.62 79.62 8.43 8.43 29.61 29.61 10.07 10.07 6.42 6.42
2006 88.64 88.78 18.17 19.26 36.97 37.33 12.68 12.77 15.85 16.87
2011 94.11 94.05 27.17 29.68 40.42 40.48 14.01 14.02 23.94 26.07
2016 98.44 98.50 38.38 42.28 41.93 41.35 14.84 14.70 33.11 35.93
2021 102.06 102.46 50.39 54.78 41.79 40.87 15.16 14.93 41.63 44.16
2026 104.64 105.07 61.37 64.95 40.95 40.28 15.17 14.93 48.11 49.63
2031 106.39 106.59 69.72 71.80 40.47 40.21 15.12 14.96 52.27 52.89
Demand Scenario of Various Energy Items for Household Consumption in India
(Mtoe)
Demand for Fire wood & chips + Dung cake forecast as > 130 mill Toe in 2031 !
Need for technology interventions to enhance efficiency of use
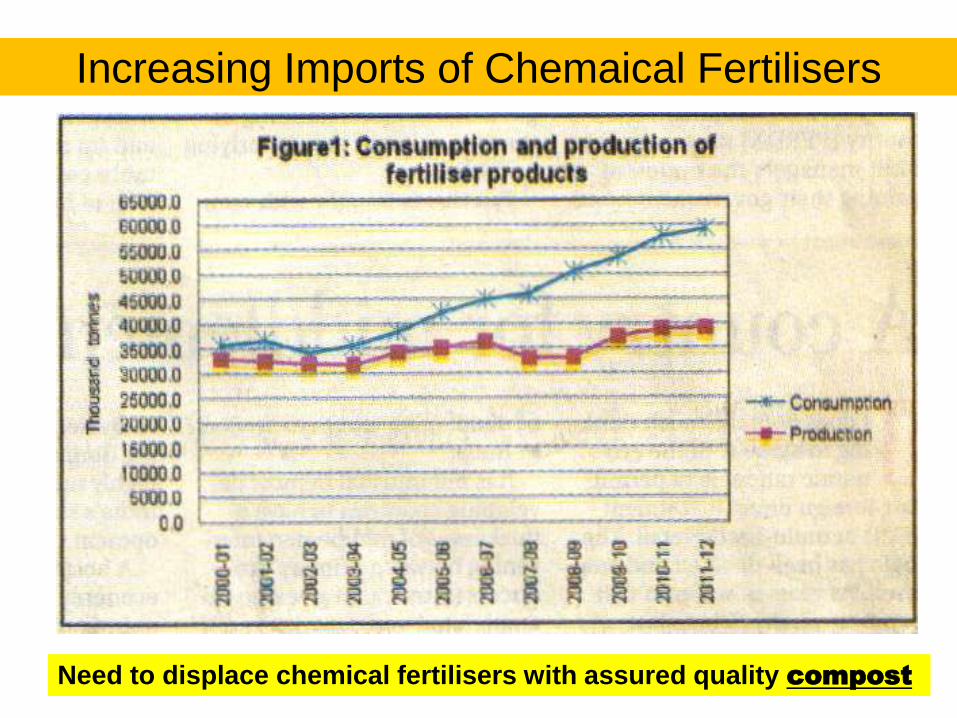
Increasing Imports of Chemaical Fertilisers
Need to displace chemical fertilisers with assured quality compost

INDIA – BIO ENERGY OVERVIEW

Biomass Processing Routes
Thermal Bio & Bio–Chemical Thermo–Chemical
Combustion
• Cooking Stoves
• Boiler (Steam)
• Power
• Ash (Residue)
Pyrolysis Gasification • Direct Composting
• Biomass to
Biogas (to
renewable CNG)
and Residue to
Composting
• Biomass to
Sugars for
conversion to
BioFuels
• Biomass to
Sugars for
conversion to
Biochemicals
• Oil
• Boiler / Engine
• Power
• Transport
Fuels
• Boiler/Engine
• Steam
• Power
• Refrigeration
• Ash (Residue),
Bio–Char
Gas to Liquid
Transport Fuel

ECONOMICS OF BIOMASS TO BIOENERGY
Biomass cost needs to evaluated, not as Rs./MT (with variations in moisture & ash
content) but as Rs./kg of “Dry organic matter”, which will have a uniform Calorific
Value of 4500 Kcal/Kg. Rs.4/Kg of dry organic matter would be realistic cost for
biomass, benchmarked with landed cost of coal. Hence giving attractive returns to
farmers
Value realization from processing biomass to bioenergy would typically be
Technology Option Bioenergy/Kg
Dry organic matter
Value
realization
Combustion (Steam Generation)
a) Stand alone Power Plant
b) Cogeneration Plant (with thermal
energy 45% of total energy)
1.1 KWe
0.88 Kwe + 2.7 KWth
Rs.6
Rs.7-8
DDG (Biomass Gasifier) 1.1 Kwe Rs.7-8
Combustion (Ind. Heating, replacing
furnace oil)
4 KWth Rs.12
2nd Gen Bio Refinery 0.3 L Bio Ethanol +
0.7 Kg “pith”
Rs.14-15
Biomethanation (digestable organic matter
80% of dry organic matter)
0.25 Kg CBG +0.25
Kg Compost + 0.5 Kg
CO2
Rs.14-15

Comparison of Paddy Straw use for
Bio-Ethanol vs. Power generation
Maximum power exported : 1 KWH/kg paddy straw (dry matter)
Bio-Ethanol generation
: > 0.3 liter/kg paddy straw (dry matter)
Return as biofuel from 1 kg paddy straw
Return as power from 1 kg paddy straw
= Rs 13
= Rs 6.5
Note (1) : Even at high biomass tariff paid in Punjab, developers are finding it
difficult to fire large amounts of paddy straw. Either biomass power plants
operate at low PLF or Plants with high PLF, fire only 25% paddy straw. Paddy
straw burning in Boilers causes slagging & corrosion
Note (2) : Paddy straw use in 2nd Generation Bio-Refineries, produces
Cellulosic Ethanol, Bio CNG & Pellets + Compost (thus productively using all
dry matter in biomass). Compost + treated effluent (liquid fertiliser)
increases farm yields & reduces chemical fertiliser use, hence makes
farmers stake holders to the project.

Comparison of Bagasse use for
Bio-Ethanol vs. Power Generation
Maximum power exported : 0.67 KWH/kg bagasse
Bio-Ethanol generation
: > 0.3 liter/kg bagasse
Return as biofuel from 1 kg bagasse
Return as power from 1 kg bagasse
= 0.21 USD
= 0.06 USD
Power & Steam requirement of Sugar Mill will be supplied by Cogeneration
Plant firing the “lignin” residue of Bio-Refinery no adverse impact on
Sugar Mill operations.

AGRICULTURE
FIELDS
DAIRY COWS
&
BUFFALOES
COMPOST
YARD
BIOMASS
DEPOT &
SILAGE
YARD
DIGESTATE
TREATMENT
PLANT
2nd GENERATION
BIO- REFINERY
CO -GENERATION
PLANT
Agriculture residues
Forage crops (for animal feed)
Animal feed
Compost (>75% dry solids)
Separated Solids
BIO CNG
Liquid fertilizer (integrated with micro irrigation systems)
2nd GEN BIO REFINERY - LINKAGE WITH SUSTAINABLE AGRICULTURE
Manure
BIOGAS
UPGRADATION
BIOGAS PLANT
LIQUID CO2
GREEN HOUSES
DRY ICE
Solid Fraction of Stillage
Feedstock for Bio-Refinery PELLETS
Liquid Fraction of Stillage
HORTICULTU
RE ACTIVITY
CELLULOSIC ETHANOL
Feedstock for Biogas Plant

# Plantations & Depots : National Mission for Greening India goals to be
converted to specific PPP programmes, MoF & MoEF to facilitate funding
mechanisms from NCEF & NABARD
# Cookstoves : Registered PoA to made effective through Carbon price
stabilisation mechanisms (NCEF, GCF, etc). Focus on mitigating health hazard
# BIOWASTE PROCESSING : State Pollution Control Boards to mandate Bio
waste processing to Compost & Energy. Capital subsidies for mitigating
health/ environment hazard & displacing chemical fertilisers.
# Biofuels & renewable CNG : MoP&NG to compute delivered cost of
Petrol/ Regasified LNG/ LPG … this will justify 2nd Gen Biofuel price of > $
0.7/litre & Biomethane price of > $ 0.9/Kg.
# DDG : CERC/ SERC’s to compute delivered cost of electricity, 6 to 11 pm, to
“rural” households with “peak power” purchase cost … this will justify tariff
of Rs 8-9/KWh
BIOENERGY – KEY SECTORS &
POLICY INTERVENTIONS REQUIRED