sustainability - wjec.co.uk · 1204 01a001 advice to candidates in this synoptic exercise you will...
TRANSCRIPT

1204
01A
001
ADVICE TO CANDIDATES
In this synoptic exercise you will be assessed on your ability to synthesise knowledge and understanding and skills derived from your A level course.You are reminded that assessment will take into account the quality of written communication used in your answers.The main focus of the materials in this Resource Folder is related to the sustainability of cities, and in particular, to their use of, and demands for energy. The cities of Luanda, Seattle and Taipei are given particular attention with supporting data from a wider context within Angola, the USA and Taiwan.
CJ*(W12-1204-01-A)
GCE A level
1204/01-A
GEOGRAPHY G4 SUSTAINABILITY
A.M. THURSDAY, 2 February 2012
RESOURCE FOLDER
Examination copy
To be given out at the start of the examination.
The pre-release copy must not be used.

BLANK PAGE
2
(1204-01-A)

Contents Page
INTRODUCTION TO THE CITIES OF LUANDA, SEATTLE AND TAIPEI
Figure 1 The economic growth of cities worldwide 4
Figure 2 Luanda, population growth 1950 – 2020 5
Figure 3 Seattle, population growth 1950 – 2020 5
Figure 4 Taipei, population growth 1950 – 2020 5
Figure 5 Population growth rates of Luanda, Seattle and Taipei 5
Figure 6 Density of population in Luanda, Seattle and Taipei in 2010 6
Figure 7 Built-up area of Luanda, Seattle and Taipei 7
TRANSPORT
Figure 8 Transport in Luanda, Seattle and Taipei 8 & 9
Figure 9 SO2 emissions in urban areas 10
Figure 10 SO2 concentrations in urban areas 10
CLIMATE AND ITS IMPLICATIONS FOR ENERGY
Figure 11 Air heating and cooling inside buildings 11
Figure 12 Mean monthly temperature, precipitation and relative humidity in Luanda, Seattle and Taipei 12
Figure 13 Comfort, temperature and relative humidity 13
ENERGY
Figure 14 Energy resources and usage for Luanda, Seattle and Taipei 14 & 15
Figure 15 Annual energy consumption per person in Angola, USA and Taiwan 16
Figure 16 Uses of energy in Angola, USA and Taiwan 16
ADDRESSING URBAN PROBLEMS
Figure 17 Solutions to urban problems in Luanda, Seattle and Taipei 17, 18 & 19
Sources 20
Turn over.
1204
01A
003
(1204-01-A)
3

INTRODUCTION TO THE CITIES OF LUANDA, SEATTLE AND TAIPEI
In developed countries, despite a decline in manufacturing, most cities have grown economically, and some have done so strongly. Particularly on the Pacific Rim of Asia, many cities have experienced spectacular economic growth, often accompanied by rapid population increase and growth in area of land covered. In many less economically developed areas, especially in Africa, economic growth has been slow, but where it has taken place, it is almost always in one or two large cities within the country.
Figure 1 The economic growth of cities worldwide
LuandaThe capital of Angola, Luanda is situated on the coast to the north of the country. From 1961 to 1975 the country was subject to a guerrilla war to gain independence from Portugal. After independence in 1975, a civil war broke out which claimed the lives of half a million people. This had a dramatic effect on average incomes. Adjusted to current values of US$, before independence average incomes stood at US$ 3568. At the end of the civil war they had fallen to US$ 1784 but have risen to US$ 5385 in 2008. It was impossible to calculate the Human Development Index (HDI) during the wars, but in 2009 it stood at 0.56. There are some regional headquarters (HQs) of companies, but no global companies have HQs located in Luanda.
(1204-01-A)
4
N
0 200 m
0 100100
200 km
LUANDA
A N G O L A
ZAMBIA
BOTSWANA
DEM. REP.OF THE CONGO
NAMIBIA
18°E
12°S
SOUTHATLANTICOCEAN
SeattleThis city is situated in the north-west of mainland USA. It has many successful industries, for example much of Boeing’s aircraft manufacture takes place there, and the worldwide headquarters of Amazon, Microsoft and Starbucks are located there. The city benefits from the high standard of living throughout the USA, and in many ways goes beyond that level. In 2008 the Seattle average income was US$ 43 012 compared with US$ 33 070 for the USA as a whole. The USA had a HDI of 0.96 in 2009. It can be reasonably expected that it is at least this level for Seattle. The USA has always had a high HDI, being at 0.89 in 1980.
Gulf of Mexico
GreatLakes
30°N
120°W0 500
1000 km0 500
1000 miles
NSEATTLE
San Francisco
Los AngelesPhoenix
Denver
NewOrleans
Dallas
Miami
USA
Houston
DetroitChicago New York
Washington
TaipeiThis city is the largest city in Taiwan. Its formal name is Republic of China. Taiwan is located off the coast of mainland China (the People’s Republic of China). In effect, it is independent, but much data about Taiwan is given as if it were part of China and many international organisations class it as China.Taipei has developed a world class electronics industry at a phenomenal pace. The headquarters and main manufacturing capacity of Acer, Asus and MSI computers are based there along with emerging software companies such as Cyberlink. In 2008 the average income for workers in Taipei was US$ 39 900. The UN does not recognise Taiwan as independent so has not calculated its HDI, but the government has calculated the HDI of Taiwan as 0.94 in 2009.
N RUSSIA
MONGOLIA
INDIA
CHINA
BURMA
KAZAKHSTAN
Beijing
TAIWAN
Shanghai
NEPALTAIPEI
KYR.N.KOR
S.KOR
BANGL.
BHU.
PHIL.
HONG KONG SAR.VIET.
THAI.
MacauS.A.R.
Mount Everest
Line ofActualContour
YellowSea
East ChinaSea
SouthChina Sea
100°E
40°N
20°N
0
0 400
800 km400
800 miles
Source: CIA The World Factbook

GROWTH OF CITIES
Figure 2 Luanda, population growth 1950–2020
Turn over.
1204
01A
005
(1204-01-A)
5
1950 1955 1960 1965 1970 1975 1980 1985 1990 1995 2000 2005 2010 2015 2020
8,000,000
6,000,000
4,000,000
2,000,000
0
projected
projected
projected
projected
1950 1955 1960 1965 1970 1975 1980 1985 1990 1995 2000 2005 2010 2015 2020
4,000,000
2,000,000
0
Figure 3 Seattle, population growth 1950–2020
Figure 4 Taipei, population growth 1950–2020
Figure 5 Population growth rates of Luanda, Seattle and Taipei
1950 1955 1960 1965 1970 1975 1980 1985 1990 1995 2000 2005 2010 2015 2020
4,000,000
2,000,000
0
1955 1960 1965 1970 1975 1980 1985 1990 1995 2000 2005 2010 2015 2020 0
1.25
2.50
3.75
5.00
Luanda Seattle Taipei
Sources: Planning Sustainable Cities, UNHABITAT, 2009; mongabay.com
Pop
ulat
ion
Pop
ulat
ion
Ann
ual g
row
th %
Pop
ulat
ion

(1204-01-A)
6
Cities vary in the area of land they need to accommodate their inhabitants. Those with low densities expand outwards and use surrounding rural land in large quantities. Low density settlement is often regarded as reflecting a high quality of life for the residents.
High density settlements make much less demand on the surrounding countryside, leaving more land available for food production. Some studies have found high levels of stress, ill health and crime with higher densities, but this appears to vary between different cultures.
In considering sustainability, food production and quality of life are important.
Figure 6 Density of population in Luanda, Seattle and Taipei in 2010
Seattle, area needed per 1 000 peopleDensity 1 285 persons/km2
Luanda, area needed per 1 000 peopleDensity 8 604 persons/km2
Taipei, area needed per 1 000 peopleDensity 15 236 persons/km2
Are
a km
2
0.8
0.6
0.4
0.2
0
Formal and informal housing in LuandaCourtesy Patrik Olsson
Suburbs in TaipeiCourtesy Christian Sodergren
Suburbs in SeattleCourtesy Clark Yerrington
Source: mongabay.com

Figure 7 Built-up area of Luanda, Seattle and Taipei in 2009
Turn over.
1204
01A
007
(1204-01-A)
7
20 km
10 km
5 km
Source: maps.google.com
Luanda
Seattle
Taipei
Water Built-up area
Built-up land area (km2)Luanda 555Seattle 2 470Taipei 174
N
N
N

TRANSPORT
Figure 8 Transport in Luanda, Seattle and Taipei
(1204-01-A)
8
Monorail, SeattleCourtesy Cliff Cooper
Traffic jam, LuandaCourtesy AkselP
LuandaTransport for both people and goods around Luanda is difficult. There are buses, but they are infrequent and overcrowded. Traffic is always heavy and roads are poor. The city centre is very overcrowded with little traffic control. Walking and cycling are possible but pavements are often blocked by cars, potholes, rubbish or vendors, and road surfaces are poor making it difficult for bicycles. There are no regular taxis in Luanda, only a few private drivers. No rail links exist within the city, only to other parts of Angola. As a result, pollution from traffic is limited, but is likely to increase rapidly as the country develops.
A recent holiday blog states, “In Angola, Luanda is a city made for 500,000 people that now heaves with 3.5 million. Since the war ended in 2002, Luandans have been importing cars at an astounding rate (since people can now drive places), overwhelming the road system (I am being generous here by using the word ‘road’). Driving across town is remarkably similar to driving around an oval track, with no lanes or directions marked, in bumper cars. Being a pedestrian is not for the faint of heart or those without eyes in the back of your head.”
Source: virtualtourist.com
SeattleReliable transport in Seattle depends on owning a car, with the average citizen of Seattle driving over 10,000 km within the city each year. There are two north–south commuter rail links, but they are inaccessible to many people.
There is a fairly extensive bus system, referred to as the Metro, but it has suffered from unreliability in the past. This was upgraded to a Bus Rapid Transport (BRT) system called RapidRide in 2010. Satnav guidance and low emission engines in the buses are aimed at tempting commuters to use public transport.

(1204-01-A)
9
Seattle (continued)
Campaigns, such as ‘One Less Car’, have been introduced to encourage citizens to give up one of their cars by offering some financial incentives. Bus journeys are now free within the CBD, but not for commuting in from the suburbs.
Along the city centre waterfront there is a light monorail and trolleybus system, but these are really only tourist attractions rather than serious attempts to ease traffic.
The large distances across the city deter walking and cycling. Traffic delays in Seattle are the second worst of all USA cities with drivers spending 53 hours per year stuck. Whilst Seattle as a whole has been reducing its carbon footprint since 1990, emissions from traffic are high and still increasing.
Source: seattlepi.com
Figure 8 Transport in Luanda, Seattle and Taipei (continued)
TaipeiTaipei city itself is compact so journeys are not long, but some people do travel from suburbs that are more distant. Only a few commuters use private transport, some use cars, but most prefer a motorcycle. The majority of commuters use trains. There is a very extensive Mass Rapid Transport (MRT) system of fast, clean and quiet trains. Few areas do not have a station nearby. In addition, there is a bus system with a high density of routes serving almost every locality. Both the MRT and buses use smartcards, (rather like the ‘Oyster card’ in London), so regular commuters do not need to queue to pay fares or buy tickets. Traffic delays are not common and only usually occur when a train breaks down or a line needs to be closed for maintenance. Despite this, the compact nature of Taipei means that there are quite high concentrations of pollutants around the city.
Source: yearbook.taipei.gov.tw
MRT station, TaipeiCourtesy Daniel Khamsing
Turn over.
1204
01A
009

(1204-01-A)
10
Figure 9 SO2 emissions in urban areas
3000
2250
1500
750
0
120
6080
100
2040
0
Angola
Angola
USA
USA
Taiwan
Taiwan
Figure 10 SO2 concentrations in urban areas
Source: NationMaster.com
Tho
usan
ds o
f met
ric
tonn
es/k
m2
Mic
rogr
ams
SO
2/m
3

Turn over.
CLIMATE AND ITS IMPLICATIONS FOR ENERGY
As a general rule, cities tend to have a much higher demand for energy than rural areas. The difference between the two is usually more pronounced in less developed countries. Although transport is a major contributor to the demand for energy within cities, it is not the only one. Other major demands for energy come from
• heatingandcooling
• powerforappliances
• lighting
• powerforindustry.
Figure 11 Air heating and cooling inside buildings
Air conditioning systems use considerable amounts of energy, usually electrical energy. On average, about 45 kWh of electricity are needed to cool 1m2 of floor space each year, although the energy usage is normally only confined to a hot season. This usage can become higher if there are high ceilings or if the amount of cooling needed is high. There are also areas of the world, particularly on the equator, where both temperatures and relative humidity are high throughout the year.
Older air conditioning systems can be very inefficient especially if they are not serviced regularly. Air conditioning is a luxury that cannot be afforded in many developing countries.
It has often been noted that many American homes are heated to a higher temperature in the winter than the temperature set for their air-conditioners in the summer.
Heating is not necessary inside buildings in many parts of the world, but usually, when average temperatures fall below 10°C, some form of heating is used. Direct heating, burning fuel oil or natural gas, are the two most common forms of heating. Both of these methods produce a direct contribution to CO2 emissions, although gas less so. Electricity can be used for heating indoor spaces. It is usually less efficient than oil or gas, but may involve less CO2 emissions depending on the method used to generate the electricity.
Heating is much more efficient when it is part of a combined heat and power scheme. These still remain small in number and are limited to well developed economies.
Good insulation can reduce the amount of energy required for heating by very large amounts. But the amount of energy reduction in air conditioning through insulation is more limited.
Source: energyinst
(1204-01-A)
11
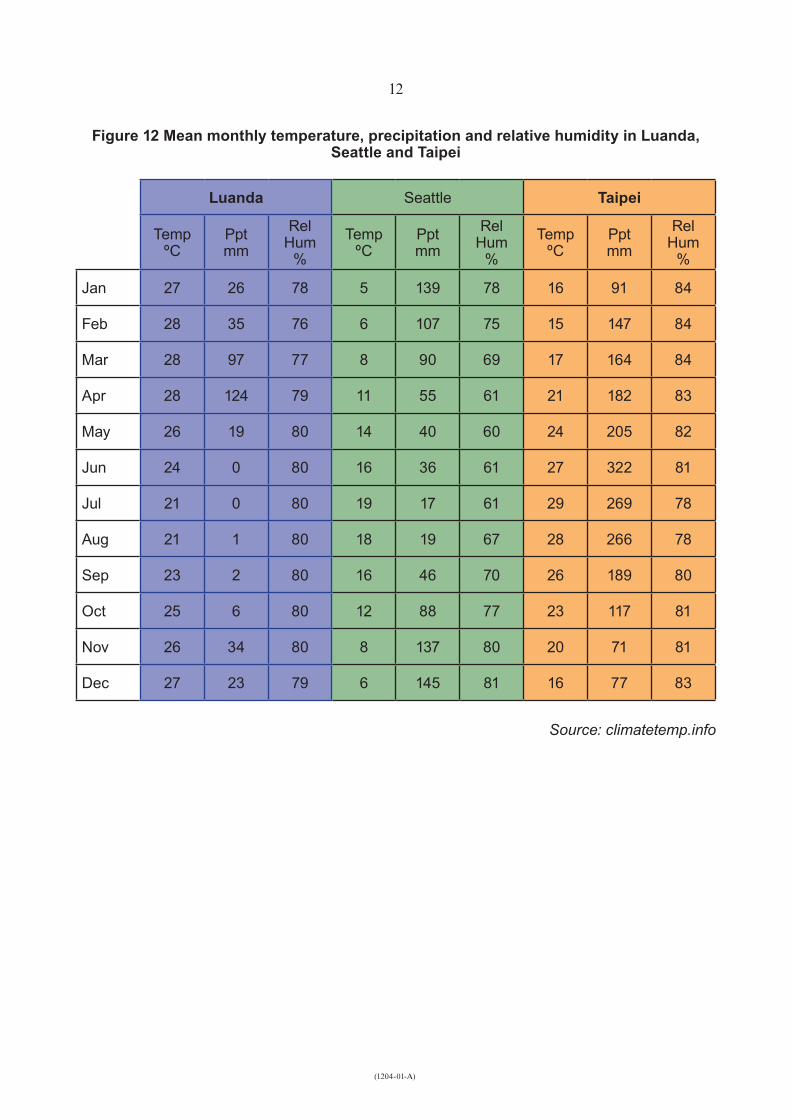
Figure 12 Mean monthly temperature, precipitation and relative humidity in Luanda, Seattle and Taipei
Luanda Seattle Taipei
TempºC
Pptmm
RelHum
%
TempºC
Pptmm
RelHum
%
TempºC
Pptmm
RelHum
%
Jan 27 26 78 5 139 78 16 91 84
Feb 28 35 76 6 107 75 15 147 84
Mar 28 97 77 8 90 69 17 164 84
Apr 28 124 79 11 55 61 21 182 83
May 26 19 80 14 40 60 24 205 82
Jun 24 0 80 16 36 61 27 322 81
Jul 21 0 80 19 17 61 29 269 78
Aug 21 1 80 18 19 67 28 266 78
Sep 23 2 80 16 46 70 26 189 80
Oct 25 6 80 12 88 77 23 117 81
Nov 26 34 80 8 137 80 20 71 81
Dec 27 23 79 6 145 81 16 77 83
(1204-01-A)
12
Source: climatetemp.info

Turn over.
The conditions under which human beings feel comfortable fall within a fairly narrow range. People are sensitive to high and low temperatures, and their sensitivity can be affected by the relative humidity of the surrounding air.
Figure 13 Comfort, temperature and relative humidity
(1204-01-A)
13
00
20
40
60
80
100
5 10 15 20 25 30
Too humid
Too cold Too hot
Too dry
Comfort
Indoor temperature ºC
Source: nesa1.uni-siegen.de
Rel
ativ
e hu
mid
ity %

ENERGY
Figure 14 Energy resources and usage for Luanda, Seattle and Taipei
Luanda
With vast stores of petroleum and a huge capacity for generating hydro-electric power, Angola is one of the most energy-rich countries in the world. Unfortunately, the long civil war left the country unable to fully take advantage of its energy resources. Many areas of the country are without electricity and, where electricity is available, such as in the capital, Luanda, its supply is intermittent and unreliable.
The Government of Angola is undertaking an ambitious scheme to reverse today’s situation as rapidly as possible. It is rehabilitating and expanding electricity generation, transmission and distribution systems, and building technical and managerial capacity.
Development of electricity capacity throughout the country depends a good deal on foreign aid. A major programme is underway to which USAID and the United Kingdom’s Department for International Development (DFID) were the two largest contributors in 2010.
In Luanda, only 38% of the population are connected to electricity supplies.
Seattle
The USA has huge energy reserves and is the major consumer of these reserves. 27% of the world’s coal reserves are in the USA. China is the largest consumer of coal, but the USA is not far behind, with almost all the coal being used to generate electricity. The USA is the largest consumer of oil, consuming 33% of all oil used in the world, three times more than China which comes second. Reserves exist, but only make up 1.7% of the world’s reserves. Natural gas reserves are also large making up 17.9% of the world’s reserves but coming second behind Russia in size of reserves. The USA is the world’s largest consumer of natural gas, consuming 21.6% of the gas used in the world each year.
20% of electricity in the USA is generated by nuclear power stations. The USA also has a large amount of HEP and is rapidly developing both on- and off-shore wind power sources. A large growth area for alternative energy has been biofuels, in particular, growing maize for conversion into diesel. Production of biofuels tripled between 2004 and 2008, but this is not without controversy in that many believe it is wrong to use land that could produce food for producing energy.
As a general rule, the USA has a policy of importing energy sources whilst conserving indigenous reserves. In reality, this is more complex, often determined by changes in market price.
In Seattle, almost 100% of the population are connected to electricity.
(1204-01-A)
14

Taipei
Taiwan does have reserves of petroleum, natural gas and coal but they are very small. The geography of the country does not provide much hydro-electric power capacity, so the domestic energy production capacity is quite limited. Taiwan generates nuclear power but all the uranium fuel used is imported. The six reactors produce about 9.82 million kilolitres oil equivalent (KLOE). All the easily reachable coal was mined by 1970 and much deeper reserves were then used. These became so expensive to mine that the last four mines were closed in 2001. The small oil and gasfields are decreasing in production, gas being 880 000 KLOE and oil 500 000 KLOE. Hydroelectric power is about 1.5 million KLOE.
The country requires 13 270 000 KLOE. The shortfall is made up from imported oil (49.8%), coal (33.2%) and natural gas (7.2%). The oil is imported from mainly Saudi Arabia, Kuwait and Iran. Coal is more locally sourced, coming mainly from mainland China, Indonesia and Australia. Similarly gas supplies are local with 60% from Indonesia and 40% from Malaysia.
In Taipei 99.9% of the population is connected to electricity.
Source:earthtrends.wri.org
Turn over.(1204-01-A)
15

Figure 15 Annual energy consumption per person in Angola, USA and Taiwan
Figure 16 Uses of energy in Angola, USA and Taiwan
(1204-01-A)
16
1
10
100
1 000
10 000
Angola
Angola
USA
USA
Taiwan
Taiwan
wat
ts/p
erso
n
71%
12%
12%
5%
1%
13%
18%25%
43%
29%53%
10%6%2%
Manufacturing Industry
AgricultureCommercial & Public Services
Transport
Residential
Source: eia.doe.gov

Turn over.
ADDRESSING URBAN PROBLEMS
Figure 17 Solutions to urban problems in Luanda, Seattle and Taipei
Luanda
1. The main aim of the Angolan government is to solve the immediate problems of Luanda and to work on sustainability in the longer term. More money is now becoming available. Angola’s oil production of about 1.9 million barrels a day surpassed Nigeria’s last year (2009) and Angola has become the largest producer of crude oil in Africa.
(1204-01-A)
17
4. Luanda Sul is also home to a modern shopping mall known as Belas. The better off live in cloistered villa developments and more of this kind of housing is planned as well as more basic accommodation. However, the construction of a tower intended for luxury apartments was halted midway after it was occupied by squatters. It is now a vertical slum where people live precariously close to balconies with no railings. There is no electricity, save for generators, or water supply and sewage system. Passers-by can see refuse simply thrown from the building on to the surrounding streets.
5. It is hoped to bring Formula 1 motor racing to Luanda to help boost the economy.
6. Opening businesses, improving basic homes and all the associated construction will increase energy demands over the next few years.
Source: thenational.ae
2. It is hoped to improve the roads in the city, first of all near to the waterfront so that imports and exports can be made easier. The amount of traffic, and vehicle emissions, are likely to increase in the foreseeable future.
3. There is already success in a suburb south of the city called Luanda Sul, which is teeming with new business parks and housing projects. To reduce the size of the slums (called musseques) that surround the centre of the city, the government is hoping to move large numbers of the population into Luanda Sul. The government has pledged to build a million homes in the next several years. Many of those will be prefabricated abroad and shipped to Angola. The people in these areas will have the opportunity to find jobs in the new business parks.
New building projects, LuandaCourtesy Leonardo Menezs

2. To increase public transport (aimed at reducing the number of car trips and miles driven), increase the efficiency of the transportation system, and reduce greenhouse gas emissions.
(1204-01-A)
18
Walking and cycling can be practical alternatives to driving, especially for short trips. Improvements to streets, intersections, side-walks, and other facilities will be made to improve access and safety. Such facilities are particularly important for children, senior citizens, and people with disabilities. Seattle will provide enough parking to meet mobility and economic needs, whilst limiting supply to encourage people to use non-auto modes.
3. To reduce consumption of fossil fuels in all new city government buildings in the following increments; 60% in 2010; 70% in 2015; 80% in 2020; 90% in 2025; and 100% by 2030 (new buildings will use no fossil fuel or greenhouse gas-emitting energy to operate).
Source: seattle.gov
New BRT bus, SeattleCourtesy Oran Viriyincy
Figure 17 Solutions to urban problems in Luanda, Seattle and Taipei (continued)
Seattle
Besides the ‘One Less Car’ campaign and improving buses, Seattle does have an official action plan to become a more sustainable city. Key elements are:
1. To reduce car use, the city will encourage increased use of walking, biking, and carpooling. To be effective, the city must provide for transportation alternatives and educate people on transportation choices. Transportation alternatives to the single occupancy-vehicle (SOV) need to address cost, convenience, and travel time.
Proportion of all trips made using non-SOV methods
2000 actual 2010 goal 2020 goal 53% 55% 60%

Turn over.(1204-01-A)
19
Taipei
1. Give the public a pleasant environment in which to wait for buses at MRT transfer points and medium and long distance bus stations.
2. Continue to introduce more commuter bus routes started in 2003, which encourage commuters to use the MRT and then transfer to buses. The routes will be mostly elevated roads or riverside roads to reduce the number of times the buses stop to pick up and drop off passengers, thus reducing travel time. Buses will run every five minutes, allowing large numbers of people to be transported in a short time, for the purpose of replacing private car use and resolving local traffic congestion problems.
3. Introduce more short-distance community shuttle bus services in residential areas.
4. Increase the number of bus lanes to strengthen the service efficiency of public transport into Taipei City.
The building of Taipei City riverbank cycle paths has been completed and they total 105 km in length. Bicycles are now allowed to be taken onto the MRT. Bicycle parking frames will be installed around MRT stations.
Energy conservation is set to become more than a money-saving measure, as Taipei City’s Department of Environmental Protection initiates an energy-saving competition with NT$1 million (US$ 290,000) in prizes to reward residents who save at least 10% of their normal electricity use. City residents who are able to save 10% of the electricity they use between June and August compared with their figure last year will be eligible to win prizes.
Source: yearbook.taipei.gov.tw
Motorcycles, TaipeiCourtesy Krzysztof
Figure 17 Solutions to urban problems in Luanda, Seattle and Taipei (continued)

Sources
Figure 1 https://www.cia.gov/library/publications/the-world-factbook/
Figures 2, 3 and 4 Planning Sustainable Cities, UNHABITAT, 2009
Figure 5 http://www.mongabay.com/cities_pop_01.htm
Figure 6 http://www.mongabay.com/cities_pop_01.htm
Figure 7 http://maps.google.com/
Figure 8 http://www.virtualtourist.com/travel/Africa/Angola/Provincia_de_Luanda/ Luanda-1922982/TravelGuide-Luanda.html http://www.seattlepi.com/search/pisearch.asp?userquery=one+less +car&x=35&y=6&group1=site http://yearbook.taipei.gov.tw/lp.asp? ctNode=36860&CtUnit=20527&BaseDSD=7&mp=100066
Figure 9 http://www.nationmaster.com/graph/env_so2_emi_per_pop_are-so2-emissions- per-populated-area
Figure 10 http://www.nationmaster.com/graph/env_so2_emi_per_pop_are-so2-emissions- per-populated-area
Figure 11 http://www.energyinst.org/information-centre/sigs/energy-management/links
Figure 12 http://www.climatetemp.info/
Figure 13 http://nesa1.uni-siegen.de/wwwextern/idea/keytopic/5.htm
Figure 14 http://earthtrends.wri.org/country_profiles/index.php?theme=6
Figure 15 http://www.eia.doe.gov/emeu/international/contents.html
Figure 16 http://www.eia.doe.gov/emeu/international/contents.html
Figure 17 http://www.thenational.ae/ http://www.seattle.gov/transportation/ http://yearbook.taipei.gov.tw/lp.aspctNode=36860&CtUnit=20527&BaseDSD =7&mp=100066
(1204-01-A)
20