sustainability within the polyester value chain
TRANSCRIPT
Sustainability within the Polyester Value Chain
Pieterjan Paul Van Uytvanck
Department of Chemical Engineering and Biotechnology
University of Cambridge
This dissertation is submitted for the degree of
Doctor of Philosophy
February 2015
Churchill College

2
Preface
The work described in this dissertation was carried out in the Department of
Chemical Engineering and Biotechnology, University of Cambridge, between October
2011 and February 2015. It is the original and independent work of the author, except
where specifically acknowledged in the text. Neither the present dissertation, nor any
part thereof, has been submitted to any other university.
This dissertation contains 44426 words and 48 figures.
Pieterjan Van Uytvanck
Department of Chemical Engineering and Biotechnology
University of Cambridge
February 2015
3
Acknowledgements
I wish like to extend my gratitude to the following people who have made the past
three years both interesting and enjoyable.
I would like to acknowledge my supervisor, Prof. John Dennis, for his continuous
guidance and help over the past three years. His interest in my work and challenging
questions always kept me on my toes.
I am very grateful for the financial support of my project by PCI Xylenes & Polyesters,
but even more so for the invaluable assistance from both Gordon Haire and Philip
Marshall, without their industrial expertise, I doubt I would be here today.
My studentship was funded by the EPSRC Doctoral Training Award and Churchill
College’s Pochobradsky Scholarship, and I am indebted to these bodies for their
financial support.
I would like to thank my close friends and family. Liam and James, for those
"productive" tea time discussions. Finally, I would like to thank Becky, who supported
me in many ways during my PhD, with encouragement, proof reading, and at times,
patience with me, especially when I was writing up!
4
Abstract
Polyethylene terephthalate (PET) is used to make textile fibres, bottles and packaging films. The global production in 2013 was 65 Mt, growing at 5-7% per year over the last decade. PET is manufactured by the continuous polymerisation of ethylene glycol and terephthalic acid, both of which are produced from fossil fuels.
This Dissertation examines the environmental impact of manufacturing PET using process modelling and life cycle assessment. The work focused on ways of reducing the environmental impact of the polymer manufacture by using biomass instead of conventional fossil fuels, either as a raw material for producing ethylene glycol or terephthalic acid, or as a fuel to supply process heating or electricity.
The environmental impacts of producing a PET bottle using ethylene glycol derived from two types of biomass, sugarcane and willow, were investigated and compared with conventional production. For sugarcane, the sugars were fermented to bioethanol, then dehydrated to ethylene. By using sugarcane, it was found that the global warming potential (GWP) and non-renewable resource use could be reduced by 28% and 16% respectively. Ethanol, and hence ethylene, can also be produced from willow, a lignocellulosic biomass, which could also potentially reduce non-renewable resource use by 16%. However, for sugarcane there was a significant increase in other environmental impacts, e.g. acidification and eutrophication potential; these increases were smaller when using willow. From supply chain analysis, the transport of finished and intermediate products only made a minor contribution to the environmental impacts.
The principal raw material for terephthalic acid is p-xylene, conventionally made from naphtha. It is feasible, however, to manufacture p-xylene by the catalytic conversion of sugars extracted from biomass sources. A PET bottle made using p-xylene derived from willow could reduce the GWP and non-renewable energy use by 32% and 2%, respectively, or 87% and 26% using sugarcane. Again, the disadvantage of using biomass was that all other environmental impact categories were increased over materials derived from petrochemicals.
Biomass can also be used for generating process heat or electricity. It was found that the best possible use of biomass within the PET value chain would be combustion to supply process heat, followed closely by burning to generate electricity. In fact, only where ethylene is produced via the fermentation of sugars from hydrolysed willow, and for one measure, GWP, was producing a chemical from biomass more sustainable than combustion for process heating. This conclusion is sensitive to the energy sources from which heat and grid electricity are otherwise produced and might therefore alter as future conventional energy sources change.
Finally, the possible savings in GWP and energy use by recycling PET bottles were evaluated for both closed-loop and open-loop systems. Open-loop recycling gave better savings for GWP and energy use when compared with closed-loop recycling. The transport associated with the international trade of baled bottles, largely imported by China, has a minimal effect on the possible savings by recycling.
This work has established that there is scope for improving the sustainability of the polyester industry; however trade-offs need to be carefully considered on a case by case basis.
5
Publications
The following papers have been published or are in progress for publication:
Published:
Impact of Biomass on Industry: Using Ethylene Derived from Bioethanol with the Polyester Value Chain.
Van Uytvanck, P.P., Hallmark, B., Haire, G., Marshall, P.J., Dennis, J.S., 2014. ACS Sustainable Chemistry & Engineering. 2, 1098-1105. doi:10.1021/sc5000804
Commercial report (in progress):
“The Outlook for Polyester Sustainability Improvements 2015-2025”
PCI Xylenes & Polyesters
In progress (delayed for commercial reasons):
Impact on the Polyester Value Chain of Using p-Xylene Derived from Biomass
Van Uytvanck, P.P., Dennis, J.S.
6
Contents
Preface ....................................................................................................................... 2
Acknowledgements .................................................................................................... 3
Abstract ...................................................................................................................... 4
Publications ................................................................................................................ 5
Contents ..................................................................................................................... 6
Chapter 1 Introduction ..................................................................................... 8
1.1 The Polyester Value Chain ............................................................. 8
1.2 Sustainability ................................................................................. 11
1.3 Life Cycle Assessment ................................................................. 13
1.4 Reducing the Environmental Impact of Using Polyester ............... 16
1.5 Aims and Objectives ..................................................................... 19
1.6 Organisation of the Dissertation .................................................... 20
Chapter 2 Polyester Literature Overview ....................................................... 22
2.1 PET Resin and Packaging ............................................................ 24
2.2 PET Packaging Substitutes .......................................................... 26
2.3 Polyester Fibres ............................................................................ 27
2.4 End of Life Studies ........................................................................ 28
2.5 Biomass Sourcing ......................................................................... 29
2.6 Conclusion .................................................................................... 32
Chapter 3 Methodology ................................................................................. 34
3.1 Life Cycle Assessment ................................................................. 34
3.2 Allocation ...................................................................................... 42
Chapter 4 The Production of Ethylene from Biomass .................................... 43
4.1 Introduction ................................................................................... 43
4.2 Analysis ........................................................................................ 43
4.3 Results .......................................................................................... 52
4.4 Discussion .................................................................................... 61
4.5 Conclusion .................................................................................... 66
Chapter 5 The Production of p-Xylene from Biomass ................................... 68
5.1 Introduction ................................................................................... 68
5.2 Analysis ........................................................................................ 69
5.3 Results .......................................................................................... 76
7
5.4 Discussion .................................................................................... 85
5.5 Conclusion .................................................................................... 87
Chapter 6 Alternative Uses of Biomass within the PET Value Chain ............ 88
6.1 Introduction ................................................................................... 88
6.2 Analysis ........................................................................................ 88
6.3 Results .......................................................................................... 94
6.4 Discussion .................................................................................... 98
6.5 Conclusion .................................................................................. 100
Chapter 7 Recycling, Landfill and Incineration ............................................ 101
7.1 Introduction ................................................................................. 101
7.2 Analysis ...................................................................................... 103
7.3 Results ........................................................................................ 119
7.4 Discussion .................................................................................. 128
7.5 Conclusion .................................................................................. 131
Chapter 8 Conclusions and Further Work ................................................... 132
8.1 Conclusions ................................................................................ 132
8.2 Further Work ............................................................................... 134
Nomenclature ......................................................................................................... 136
References ............................................................................................................. 137
Appendix A .............................................................................................................. 145
Appendix B .............................................................................................................. 160
8
Chapter 1 Introduction
The motivations for this research are that existing literature on the life cycle
assessment of polyester products varies significantly and the impacts of using
biomass as a raw material in the production of polyester have not been investigated
in detail. The key objective for this research is to perform a rigorous and detailed life
cycle assessment to quantify the environmental impacts associated with the
production of polyester from both fossil fuel and biomass sources. This Chapter
discusses the principal route, and alternative routes, to produce polyethylene
terephthalate (PET) polyester. It also sets out the background to sustainability and its
assessment using life cycle assessment. Finally, the objectives of the research are
discussed in detail.
1.1 The Polyester Value Chain
Polyethylene terephthalate (PET) is principally used to make textile fibres, bottles and
packaging films (McIntyre, 2003). In terms of annual production, it is ranked third,
behind polyethylene and polypropylene: 65 Mt was manufactured in 2013, an output
which has grown 5-7% per annum over the last decade (PCI Xylenes & Polyesters,
2013). Of the total PET production, around 30% is used to make bottles, 67% is used
for fibres and the remaining 3% for films and other uses (PCI Xylenes & Polyesters,
2013). The PET packaging resin sector has shown demand growth at 5% in 2013
(PCI Xylenes & Polyesters, 2013). Of the total global demand for all fibres of 82 Mt in
2013, approximately half was contributed by polyester staple and filament fibres (PCI
Xylenes & Polyesters, 2013). Currently, PET is most commonly manufactured by the
continuous polymerisation of ethylene glycol and terephthalic acid (Rieckmann and
Völker, 2003). Conventionally, both raw materials are derived from naphtha from
crude oil; however, ethylene glycol is also manufactured from natural gas (PCI
Xylenes & Polyesters, 2013).
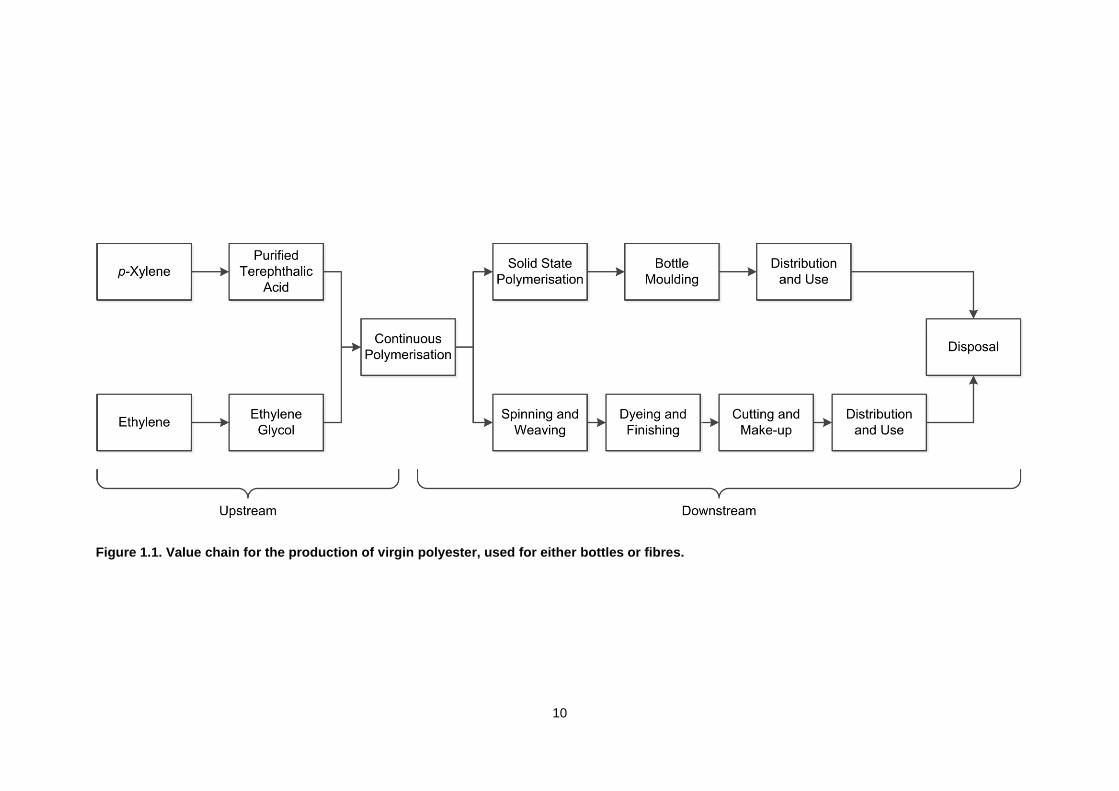
A ‘value chain’ is defined as the set of processes involved in producing the final
functional unit from the defined starting materials, where each process raises the
value of the output over that of the input. The value chain for virgin PET produced
from conventional crude oil and gas feedstocks is represented diagrammatically in
Figure 1.1. Virgin PET refers to the polymer being produced from its raw materials
rather than from recycled PET. From Figure 1.1, terephthalic acid is manufactured
9
solely by the oxidation of p-xylene, which, in turn, is separated from reformed
naphtha. Ethylene glycol is manufactured by the hydrolysis of ethylene oxide, which
is produced from the oxidation of ethylene. Ethylene is derived by steam cracking
naphtha or natural gas, depending on the regional production mix.
Downstream processing operations after the continuous polymerisation stage depend
on the desired end product. The degree of polymerisation needed for bottle-grade
PET is generally higher than that for fibre products and hence, typically, requires a
further, solid-state polymerisation stage, not needed for fibres (Culbert and Christel,
2003). The bottle-grade PET resin is injection-moulded into preforms and then stretch
blow-moulded to make bottles, which are filled and distributed. Fibre production
typically involves spinning, weaving, dyeing, finishing, cutting and make-up in order to
produce an item of clothing as the end product.
The end products also feature a use phase. For packaging, the environmental
impacts during use are generally small compared with those incurred during
production; however, for fibres, the use phase can account for a considerable
proportion of the total environmental impacts. This will be discussed in more detail
later. Considering the whole life, both end products will require a final disposal stage.
10
Figure 1.1. Value chain for the production of virgin polyester, used for either bottles or fibres.
11
1.2 Sustainability
The total human population reached seven billion in October 2011, increasing at a
rate of 80 million/year (Worldometers, 2014). This large and rapidly-growing
population places significant demands on the environment, both at a local and a
global level, because of the increasing consumption of resources and quantity of
waste generated. The environmental demands placed on the Earth by anthropogenic
activities have been the subject of many studies, from land use (Meyer and Turner II,
1994) to industrial ecology (Socolow et al., 1994). One measure of the demand on
the environment is the ‘global ecological footprint’, defined as the area of land and
water a human population requires to provide the resources it consumes and to
absorb the wastes generated (Wackernagel and Rees, 1998). Wackernagel et al.
(2002) have demonstrated a growing deficit between the global ecological footprint
and the available ‘carrying capacity’ of the earth. The carrying capacity is the
available capacity of ecosystems to produce useful materials, and to absorb waste
materials generated, without undergoing irreversible change. On this basis, in 1991,
the sum of human activities had exceeded the carrying capacity of the Earth by 20%,
a deficit which had increased to 50% by 2007 and is projected to exceed 100% by
2030 (Global Footprint Network, 2014), which means that resources equivalent to two
earths would be required to sustain human activity. The carbon footprint, i.e. the net
carbon dioxide emissions from the burning of fossil fuels, is the dominant driver of the
ecological overshoot (WWF et al., 2014). In essence, the total of anthropogenic
activities exceeds the ability of the Earth’s biosphere to absorb them.
It is becoming increasingly clear that the Earth’s natural capital can no longer be
considered a ‘free good’ in economic analysis. Natural capital, defined as the stock of
environmental assets, is so heavily used, that it has become the limiting factor for
some industries (Daly, 2005). A typical illustration of this concept is the fishing
industry, which is restricted by the decreasing numbers of fish, not by the number of
fishing boats (Daly, 2005). The lack of concern for natural capital and environmental
protection is often referred to as the ‘tragedy of the commons’ (Hardin, 1968). This
occurs when self-interested groups or individuals seek to maximise economic gain
from a common resource without regard for the collective interest; the results can be
extreme in the absence of prohibitive legislation (Hardin, 1968).
12
The free-market economy has its limitations with respect to sustainable resource and
environmental management. The principal causes are the conflicting economic and
environmental interests and the associated time-scales on which they operate. One
method to counter these limitations is through legislation to make the economic
activity accountable for the externalities caused. In the case of climate change, there
have been significant changes in public policy over the past decade, both on a
national and international level. For example, in the UK, the Climate Change Act
(2008) legally binds the UK to reduce total greenhouse gas emissions from 1990
levels by 26% before 2020 and by 80% before 2050 (UK Parliament, 2008). The
European Union (EU) has committed itself to reduce net greenhouse gas emissions
from 1990 levels by 20%, 40% and 80% by 2020, 2030 and 2050, respectively
(European Commission, 2014). The EU has also established the EU Emission
Trading System in an attempt to reduce greenhouse gas emissions from industry in a
cost-effective manner (European Commission, 2014). Global commitment is
encapsulated in the Kyoto Protocol, which initially required participating countries to
reduce greenhouse gas emissions by 5% against 1990 levels in the five year period
2008-2012 (UNFCCC, 2014). This has since been amended to an 18% reduction in
the eight year period 2013-2020; however, only 19 nations have ratified the
amendment (UNFCCC, 2014).
Despite these measures, annual, global anthropogenic emissions of CO2 from fossil
fuel use and cement production have continued to increase and were estimated to be
34.5 billion tonnes CO2 in 2013 (Olivier et al., 2013). Whilst anthropogenic
greenhouse gas emissions, measured on a CO2-equivalents basis, from the UK fell
22.5% between 1990 and 2012 (DECC, 2014), it is important to note that, allowing
for the emissions associated with imported goods and services, UK emissions have
actually increased (Barrett et al., 2013). In essence, as manufacturing has moved
offshore, the associated pollution has been exported (Barrett et al., 2013), thus
shifting the burden rather than achieving a true overall reduction in emissions.
The above emphasises the need for clarity and definition in considering sustainability.
A popular definition of sustainability was articulated by the Brundtland Commission
as “meeting the needs of the present without compromising the ability of future
generations to meet their own needs” (WCED, 1987). Since then, various other
13
definitions have emerged; however, the concept and common principles often remain
unchanged. The principles include: commitment to equity and fairness, prevention of
environmental damage and degradation, and recognising the interdependent nature
of the environment, economy, and society (Drexhage and Murphy, 2012). The latter
principle is often called the triple bottom line, essentially sustainability is a balance
between environmental, social and economic goals (Elkington, 1998). It is also
appropriate here to note that the environmental impact of a nation in its consumption
of a product is roughly proportional to (i) the size of the population, (ii) affluence per
capita, (i.e. the ability to purchase the product), and (iii) the environmental impact of
the technology associated with manufacture and use of the product (York et al.,
2003). Much research focuses on (iii); however, irrespective of how efficient the
technological aspects are, the effects of technical improvements can be readily
nullified by population growth and increase in affluence. Worse still, there are often
limits to the degree to which technology can be refined to increase efficiency,
imposed by, for example, thermodynamic constraints.
Having defined sustainability, the main problem is making the transition from the
qualitative statements to pragmatic implementation. Sensible and quantifiable
indicators are required to measure progress and improvements towards sustainable
development. Such an indicator might be level of carbon dioxide emissions, as is
used in many of today’s policies. However, this single indicator does not encompass
many other types of impact, such as the toxicity of waste streams. Furthermore, a
product with low impact on the environment when produced, can have a large impact
during use; e.g. a car. Essentially, sustainability cannot solely be measured based on
one indicator and it needs to account for the entire life cycle of a product. One tool
which achieves this is life cycle assessment (LCA).
1.3 Life Cycle Assessment
This section reviews life cycle assessment (LCA); further details on LCA methods are
provided in Chapter 3. LCA is a technique used to quantify the environmental impacts
associated with the whole life of a product or service, from the extraction of raw
materials to the disposal of waste at the end of the product’s life. LCA is a useful tool
in making decisions because different scenarios can be compared systematically to
14
determine which is the most environmentally sound. There are four stages in
constructing an LCA (ISO, 2006a, 2006b):
1. Goal and scope, definition of the system boundaries and the functional unit.
2. Inventory analysis, that is to say, the compilation and quantification of inputs
and outputs for the selected system throughout its life cycle.
3. Impact assessment, namely understanding and evaluating the magnitude and
significance of the potential environmental impacts for the product system.
4. Interpretation, the findings are evaluated in relation to the defined goal and
scope in order to reach conclusions and recommendations.
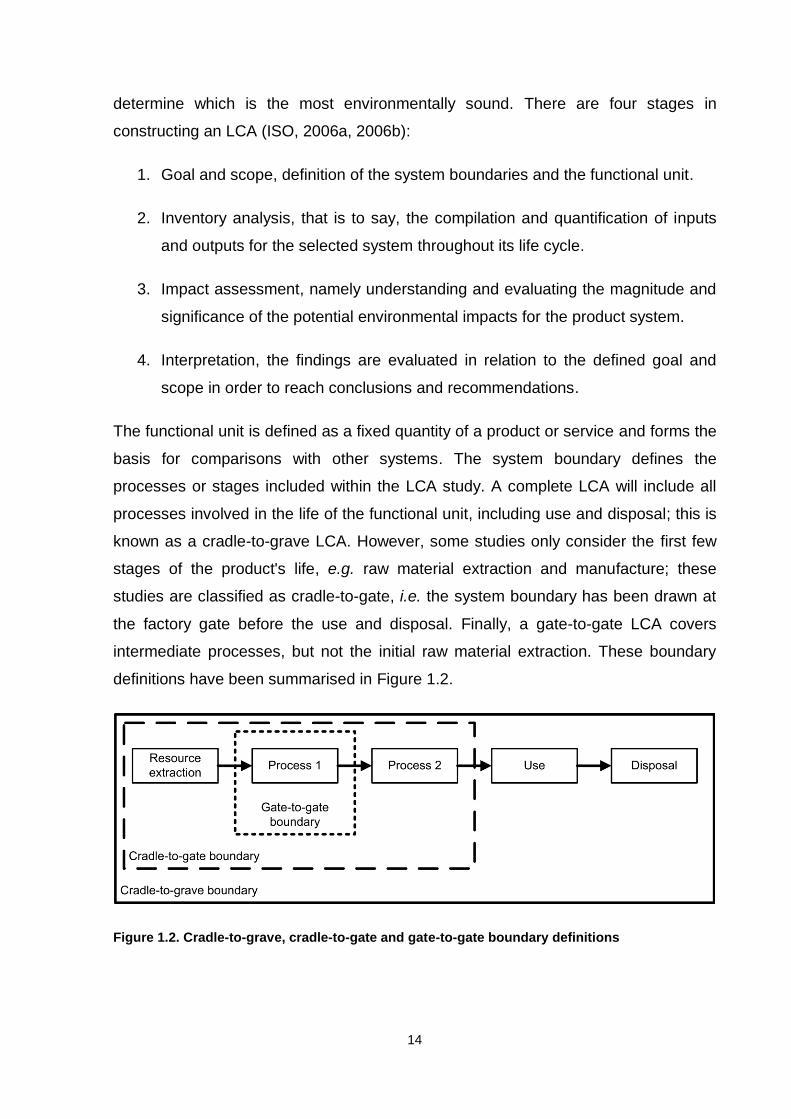
The functional unit is defined as a fixed quantity of a product or service and forms the
basis for comparisons with other systems. The system boundary defines the
processes or stages included within the LCA study. A complete LCA will include all
processes involved in the life of the functional unit, including use and disposal; this is
known as a cradle-to-grave LCA. However, some studies only consider the first few
stages of the product's life, e.g. raw material extraction and manufacture; these
studies are classified as cradle-to-gate, i.e. the system boundary has been drawn at
the factory gate before the use and disposal. Finally, a gate-to-gate LCA covers
intermediate processes, but not the initial raw material extraction. These boundary
definitions have been summarised in Figure 1.2.
Figure 1.2. Cradle-to-grave, cradle-to-gate and gate-to-gate boundary definitions
15
The main outcomes from LCA are a set of quantified environmental impact
categories, the impacts shown here are from the CML method (Guinée et al., 2002):
Energy requirements
Global warming potential
Abiotic depletion potential
Acidification potential
Eutrophication potential
Ozone depletion potential
Toxicity (human, freshwater, terrestrial, marine)
Photochemical ozone creation potential.
These environmental impact categories can be used to accurately compare
equivalent product systems.
Most studies publish the results for energy requirements and global warming
potential. Briefly, global warming potential is defined as the impact of human
emissions on the atmospheric absorption of radiation leading to an increase in global
temperature, a more detailed definition is provided in Chapter 3. The definitions of the
other environmental impacts used in this research are in Table 3.1 in Chapter 3.
Environmental impacts are quantified using a reference chemical. For example,
global warming potential is quantified in terms of the equivalent mass of carbon
dioxide. Emissions with the potential to cause global warming are converted to
carbon dioxide equivalents using their potency. The potency is dependent on how
effective the emission is at contributing to the environmental impact and how long the
effects of a particular emission remain after first release.
16
1.4 Reducing the Environmental Impact of Using Polyester
The environmental impacts of anthropogenic activities, such as global warming and
resource scarcity, are a growing concern. Increased legislation and incentives are
persuading many industries to develop greater efficiency, reduce waste, and
minimise the production and use of harmful raw materials or products. There is an
increased awareness within the polyester industry of the need to make production
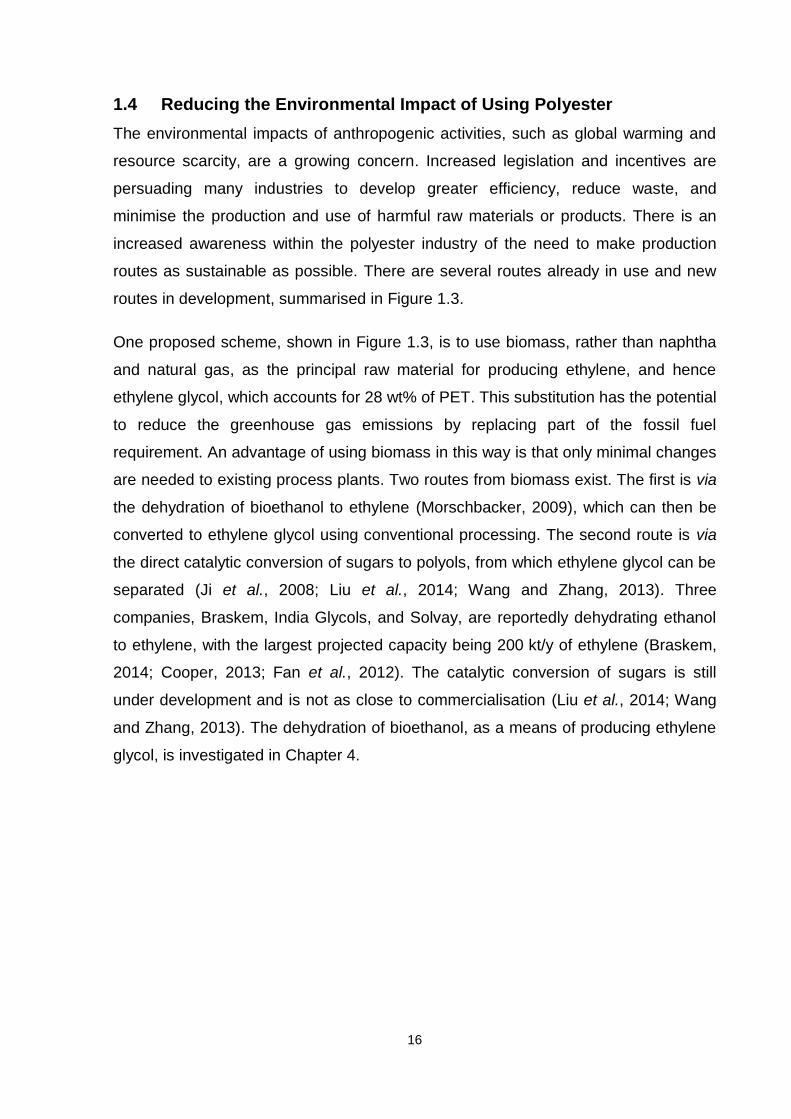
routes as sustainable as possible. There are several routes already in use and new
routes in development, summarised in Figure 1.3.
One proposed scheme, shown in Figure 1.3, is to use biomass, rather than naphtha
and natural gas, as the principal raw material for producing ethylene, and hence
ethylene glycol, which accounts for 28 wt% of PET. This substitution has the potential
to reduce the greenhouse gas emissions by replacing part of the fossil fuel
requirement. An advantage of using biomass in this way is that only minimal changes
are needed to existing process plants. Two routes from biomass exist. The first is via
the dehydration of bioethanol to ethylene (Morschbacker, 2009), which can then be
converted to ethylene glycol using conventional processing. The second route is via
the direct catalytic conversion of sugars to polyols, from which ethylene glycol can be
separated (Ji et al., 2008; Liu et al., 2014; Wang and Zhang, 2013). Three
companies, Braskem, India Glycols, and Solvay, are reportedly dehydrating ethanol
to ethylene, with the largest projected capacity being 200 kt/y of ethylene (Braskem,
2014; Cooper, 2013; Fan et al., 2012). The catalytic conversion of sugars is still
under development and is not as close to commercialisation (Liu et al., 2014; Wang
and Zhang, 2013). The dehydration of bioethanol, as a means of producing ethylene
glycol, is investigated in Chapter 4.
17
Figure 1.3. Detailed value chain including the range of feedstock sources and recycling routes.
18
As shown in Figure 1.3, biomass could also serve as the feedstock for terephthalic
acid, which accounts for the larger proportion, i.e. ~72% by mass, of the final PET
polymer. Therefore, biomass substitution for terephthalic acid has, in principle,
substantial potential for reducing greenhouse gas emissions and fossil fuel use.
There are several routes to produce terephthalic acid from biomass. One, currently at
demonstration plant scale, uses the direct catalytic conversion of biomass sugars to
produce reformate, from which p-xylene can be separated and then oxidised to
terephthalic acid using conventional processing (Blommel and Cortright, 2008; Virent,
2014). This route is studied in detail in Chapter 5. Another scheme, also at
demonstration plant scale, involves the catalytic conversion of isobutanol, derived
from the fermentation of biomass sugars, to, inter alia, p-xylene (Gevo, 2014; Tuck et
al., 2012). While other methods of converting biomass to p-xylene exist, e.g. via 5-
hydroxymethlyfurfural or catalytic fast pyrolysis, these routes are a long way from
scale up and commercialisation (Anellotech, 2014; Gevo, 2014; Lin et al., 2013;
Virent, 2014). Finally, to avoid the production of p-xylene as an intermediate, it has
been shown that terephthalic acid can be produced from sugars via muconate esters
(Cooper, 2013). Another route being considered is the replacement of terephthalic
acid with furandicarboxylic acid, derived from biomass. In this case, a different
polymer, polyethylene furanoate (PEF), is produced. This technology is also currently
at pilot scale (Avantium, 2014), but it is unclear if downstream PET processing
operations, such as continuous polymerisation, can be used for PEF.
It is important to note that all the above routes require sugars as key intermediates,
produced either (i) directly from sugarcane and sugar beet, or (ii) via the hydrolysis of
either starchy crops, e.g. corn or wheat, or of woody biomass or agricultural residues,
e.g. coppiced willow, corn stover or sugarcane bagasse. In most cases, lignin
residues are burnt for energy recovery (Davis et al., 2013). However, mechanisms
are under development for the breakdown of lignin (Davis et al., 2013). Of course,
waste biomass can also be used directly for process heating or for generating
electricity. These indirect uses of biomass are important, particularly where they
displace fossils fuels for the same duty; this is discussed in Chapter 6.
One of the most direct methods of reducing environmental impacts would be to
simply use less material. There are several mechanisms to reduce material demand,
19
such as, creating products with a longer life, reuse, reducing scrap material and
better utilisation. The process of ‘light-weighting’ PET bottles is briefly discussed in
Chapter 4 of this Dissertation.
PET packaging can be recycled, exemplified commercially by the mechanical
recycling of PET bottles, which are collected, baled and shredded into flake. PET
flake can then be used to produce new bottles, thereby avoiding the use of virgin
PET. Alternatively, mechanically-recycled PET flake can be used in melt-phase
spinning to make fibres. It is also possible to recycle PET chemically. This involves
the breakdown of the scrap polymer to chemical precursor by methanolysis,
glycolysis, or hydrolysis. Chemical recycling allows stricter control of the quality,
grade and degree of polymerisation. Considering the disposal, PET can be either
sent to landfill or incinerated with energy recovery. Recycling and disposal are
investigated in Chapter 7.
1.5 Aims and Objectives
The objective of the research presented in this Dissertation is to quantify and
compare the environmental impacts associated with the individual operations in the
polyethylene terephthalate (PET) value chain. Whilst the main focus is on fossil fuel
use and global warming potential, other environmental impacts are also considered in
order to provide a comprehensive picture of the systems analysed. To do this, life
cycle assessment (LCA) has been undertaken to compare the conventional process
route (with raw materials made from fossil fuels) to alternative process routes (using
biomass and recycling). As discussed in the literature survey in Chapter 2, there is
substantial scope to undertake rigorous life cycle assessment on PET production.
The environmental impacts of using biomass as a raw material, for the production of
ethylene and p-xylene, on the polyester value chain have not hitherto been
investigated thoroughly. This has been rectified in the present Dissertation. The land
area required for global polyester production from biomass at various degrees of
substitution has been quantified. The economic feasibility of using biomass as a raw
material feedstock for polyester production via the dehydration of bioethanol to
ethylene has also been considered.
20
Considering the triple bottom line of sustainability (Elkington, 1998), the focus of this
Dissertation is on the environmental sustainability of the polyester value chain; social
and economic issues are only briefly discussed.
1.6 Organisation of the Dissertation
In Chapter 2, the relevant literature on polyester is reviewed.
A detailed description of the technique of life cycle assessment used is provided in
Chapter 3.
In Chapter 4, the environmental impacts of using biomass-derived ethylene feedstock
in polyester production are investigated. The impact on land use of global scale PET
production from biomass and the economic viability of a dehydration process are also
assessed.
The sourcing of p-xylene from biomass is considered in Chapter 5. The sensitivity of
the results to different methods of allocating the environmental burdens has been
investigated in detail. The land requirements of cultivating biomass for the global PET
demand and economic potential of biomass derived p-xylene are discussed.
Biomass can be used as a feedstock for ethylene glycol and p-xylene production, but
it could also be burnt to provide heat or electricity to processes within the value chain.
In Chapter 6, the optimal use for biomass within the value chain is considered in
order to maximise the reduction of non-renewable energy use and global warming
potential.
The various recycling and disposal methods for polyester are investigated in Chapter
7, allowing for the impact of global materials transport, e.g. the shipping of baled
bottles from the EU and USA to China for recycling.
Finally, overall conclusions are drawn in Chapter 8.
An overview of the polyester value chain showing each analysis from Chapters 4-7
has been shown diagrammatically in Figure 1.4.

21
Figure 1.4. Overview of the processes analysed in each research chapter
22
Chapter 2 Polyester Literature Overview
In this Chapter the relevant literature on polyester and biomass is reviewed.
There have been several studies of the sustainability of various parts of the polyester
value chain; however, much of this research has been conducted by commercial
organisations, rather than academic researchers, resulting in a lack of peer-reviewed
literature. Other studies consider polyester as a constituent material, quantifying its
contribution to the environmental impact using pre-existing datasets. While the use of
pre-existing datasets serves its purpose for studies considering the manufacture of
polyester as a background process, much more detail is required when polyester is
the actual focus of the study, i.e. when it is the foreground process.
As noted in Chapter 1, most studies commonly present two measures of
environmental impact, namely non-renewable energy use and global warming
potential. In Table 2.1, these two measures have been used to compare studies and
indicate the variability in the literature. According to the international standards for
LCA, ISO 14040 and ISO 14044, there is no strict requirement for LCA studies to
consider a defined set of environmental impacts (ISO, 2006a, 2006b). Therefore,
many studies do not include additional environmental impacts, e.g. acidification or
eutrophication, beyond energy and global warming potential, and when they do, there
is little consistency among studies. Worse still, a range of different impact
assessment methods have been used in the literature, so that the results for other
environmental impacts are not easily comparable. The results from studies
summarised in Table 2.1 are normalised on the basis of 1 kg of PET for ease of
comparison. Most of the variation among studies can be accounted for by differences
in the system boundaries (i.e. the processes included in the study), the age of the
study and the assumed geographical location.
23
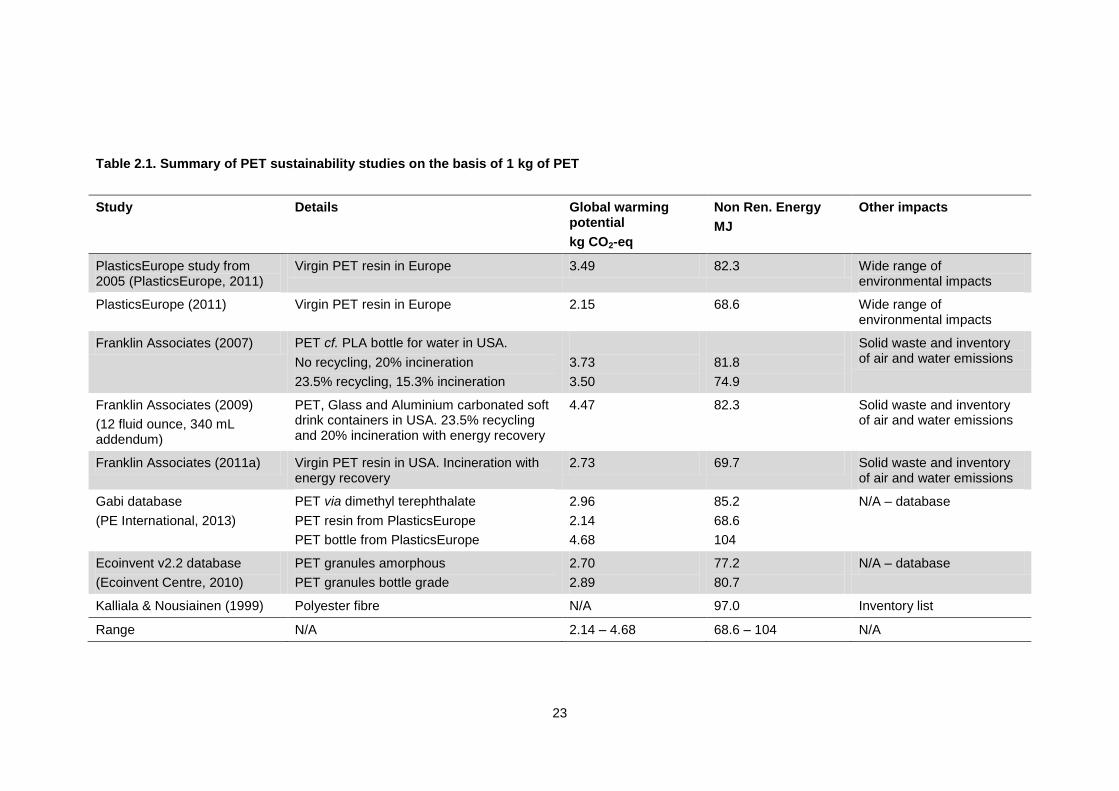
Table 2.1. Summary of PET sustainability studies on the basis of 1 kg of PET
Study Details Global warming potential
kg CO2-eq
Non Ren. Energy
MJ
Other impacts
PlasticsEurope study from 2005 (PlasticsEurope, 2011)
Virgin PET resin in Europe 3.49 82.3 Wide range of environmental impacts
PlasticsEurope (2011) Virgin PET resin in Europe 2.15 68.6 Wide range of environmental impacts
Franklin Associates (2007) PET cf. PLA bottle for water in USA.
No recycling, 20% incineration
23.5% recycling, 15.3% incineration
3.73
3.50
81.8
74.9
Solid waste and inventory of air and water emissions
Franklin Associates (2009)
(12 fluid ounce, 340 mL addendum)
PET, Glass and Aluminium carbonated soft drink containers in USA. 23.5% recycling and 20% incineration with energy recovery
4.47 82.3 Solid waste and inventory of air and water emissions
Franklin Associates (2011a) Virgin PET resin in USA. Incineration with energy recovery
2.73 69.7 Solid waste and inventory of air and water emissions
Gabi database
(PE International, 2013)
PET via dimethyl terephthalate
PET resin from PlasticsEurope
PET bottle from PlasticsEurope
2.96
2.14
4.68
85.2
68.6
104
N/A – database
Ecoinvent v2.2 database
(Ecoinvent Centre, 2010)
PET granules amorphous
PET granules bottle grade
2.70
2.89
77.2
80.7
N/A – database
Kalliala & Nousiainen (1999) Polyester fibre N/A 97.0 Inventory list
Range N/A 2.14 – 4.68 68.6 – 104 N/A
24
2.1 PET Resin and Packaging
A commonly-quoted LCA study of PET production was that conducted by the
Association of Plastics Manufacturers in Europe (PlasticsEurope, 2011), which
considered the impact of producing 1 kg of bottle-grade PET resin. The LCA
encompassed all the operations from the extraction of resources to produce the initial
raw materials to the production of bottle-grade PET; however, bottle moulding, use
and disposal were not included in the results. The study’s results were based on
averaging information from polyester producers in Europe in 2008. It was found that 1
kg of bottle-grade PET required 69.4 MJ of energy (99% from non-renewable
sources) and emitted 2.15 kg CO2-eq (PlasticsEurope, 2011). However, the research
did not consider some potentially-important operations, e.g. the effect of imported
PET, distribution of products, use, recycling and disposal. Compared with an earlier
version of the study, conducted in 2005 with process information from 1999, there
had been a 16% reduction in energy use, and 38% reduction in global warming
potential (PlasticsEurope, 2011). The reductions largely arose from improved process
efficiency in the production of purified terephthalic acid. While the efficiency of the
polymerisation stage had also improved, the efficiency gains from terephthalic acid
production were dominant (PlasticsEurope, 2011). Small savings in global warming
potential also arose from changes in external energy supply, such as the energy mix
used to generate grid electricity being less carbon-intensive at the later date
(PlasticsEurope, 2011).
Franklin Associates, a LCA consultancy based in the USA, has published several
studies, listed in Table 2.1, including a comparison of bottles made from PET with
polylactide (PLA) (Franklin Associates, 2007) and with glass bottles and aluminium
cans (Franklin Associates, 2009). PET resin was also compared with a range of other
resins (Franklin Associates, 2011a). The research focused on three environmental
categories: energy use, emissions of greenhouse gases and solid waste. Emissions
to water and those to the atmosphere outside of global warming were also quantified
but were not categorised into environmental impacts. The studies are, in essence, life
cycle inventories, i.e. completing the first two stages of life cycle assessment
(summarised in Section 1.3, with greater detail in Chapter 3, below); however, the
results give useful insight into the energy requirements and greenhouse gas
emissions even though drawing conclusions based on trade-offs allowing for a wider
25
range of environmental impacts is not possible. Overall, while the cradle-to-gate
analysis of the studies is detailed, the end of life analysis was simplistic; for example,
although the research considered energy recovery from incineration, the full
incinerator emissions were not considered (Franklin Associates, 2009). Whilst only
non-renewable energy requirements have been summarised in Table 2.1, the
contribution from renewable sources was approximately 1%. A comparison of the
results for Franklin Associates (2009, 2007) and Franklin Associates (2011a) in Table
2.1 suggests that the system boundary in the earlier studies included the bottle-
moulding process, whilst the later study did not, because the energy requirements
and carbon emissions were larger in the earlier reports.
In the latest study, Franklin Associates (2011a) collected process information from
producers and proceeded with averaging at different stages in the processes, using a
similar technique as PlasticsEurope (2011). Comparing research on the production of
virgin PET resin, i.e. Franklin Associates’ (2011a) study with PlasticsEurope (2011),
non-renewable energy requirements are within 2%. However, there is a substantial
difference in global warming potential of 27%, probably reflecting differences in
background energy sources and processing between the USA and Europe. For
example, the electricity grid mix used in the USA study is more carbon intensive,
having a larger fraction of natural gas (42% cf. 24%) and coal (9% cf. 6%) use, but a
lower fraction of nuclear (3% cf. 5%) than the European study. Another difference
between the studies is the system definition, Franklin Associates (2011a) allocated
15% of PET production via the dimethyl terephthalate route, an older technology, and
85% from the continuous polymerisation using purified terephthalic acid. The system
diagram from PlasticsEurope (2011) reflected PET production from purified
terephthalic acid only.
Finally, instead of creating new models, research such as the studies by Madival et
al. (2009) and Gironi & Piemonte (2011), use databases of processes, in particular,
those from Ecoinvent (Ecoinvent Centre, 2010) and Gabi (PE International, 2013).
These values have also been summarised in Table 2.1. These databases contain the
inventory analysis, the inputs and outputs, for individual processes or sets of
aggregated processes. The organisations responsible for the databases, e.g.
Ecoinvent and Gabi, either develop their own models of processes, collect averages
26
from industry, or use studies such as those from PlasticsEurope (2011). Given the
proprietary nature of these databases, it is impossible to ascertain the details of
calculations involved for each dataset.
2.2 PET Packaging Substitutes
In comparing polylactide (PLA) bottles with PET bottles, it was found that PLA bottles
required 15% more energy in their manufacture than PET bottles, for the same
function (Franklin Associates, 2007). However, the amount of fossil fuel required to
make PET bottles was greater because PET is made from crude oil, as opposed to
corn for PLA bottles. Franklin Associates (2007) concluded that, for the two plastics,
the greenhouse gas emissions were comparable within 5%, as were the waste and
other emissions. Other research (Gironi and Piemonte, 2011; Madival et al., 2009)
has shown various savings on global warming potential and non-renewable energy
use when using PLA instead of PET. Madival et al. (2009) and Gironi & Piemonte
(2011) considered environmental impacts other than global warming potential and
use of non-renewable energy, but there were considerable disparities between the
two studies in this respect.
Franklin Associates (2009), compared a glass bottle, an aluminium can and a PET
bottle of the same volume (12 fluid ounce, 340 mL). In terms of mass of packaging, a
340 mL container required 13.2 g aluminium, 211 g glass or 23.5 g PET. The relative
weights of the material are an important factor for transportation to distribution
facilities; however, the study did not include the transporting the final packaging in
the system boundary. On the basis of energy required for producing 10000 drinks
containers, there was little difference among packaging materials; aluminium required
20.3 GJ, glass 24.2 GJ, and PET 21.2 GJ. Of the 21.2 GJ energy required to make
the PET bottles, ~42% is embodied in the plastic. On the basis of greenhouse gases,
PET performed the most favourably with the aluminium and glass bottles producing
46% and 98% more greenhouse gases, respectively (on a CO2-equivalent basis). Of
course, this does not consider the end of life of the product. If the PET were to be
incinerated, greenhouse gas emissions would increase; however, with energy
recovery, heat or electricity could be generated from the energy embodied in the
plastic. This is not the case for glass or aluminium. Again, whilst the study listed
emissions to air and water, the lack of a more complete set of environmental impacts
27
for comparison amongst the materials, means that a definitive comparison of their
relative sustainability is not possible.
Amienyo et al. (2012) also compared aluminium, glass and PET as containers for a
given volume of a carbonated soft drink and showed that PET was favourable with
respect to global warming potential. However, their research used containers of
different sizes, which distorts the comparison significantly. Amienyo et al. (2012)
used database values for PET production from Gabi. Gabi is LCA software, which
contains datasets for a wide range of materials and energy sources and their
associated environmental impacts. Amienyo et al. (2012) showed that recycling PET
at 40-60% could reduce global warming potential of the packaging by 32-48%.
Franklin Associates (2009) also demonstrated that recycling has a net beneficial
effect.
2.3 Polyester Fibres
Although many studies exist on bottle-grade PET, there are few on fibres. One
investigation of fibres compared 100% cotton sheets with sheets made from fibres
containing 50% cotton and 50% polyester (Kalliala and Nousiainen, 1999). The
results suggested that although cotton fibre requires 40% less energy per unit mass
than polyester fibre in manufacture, cotton requires larger quantities of water, in
addition to the pesticides and fertilisers used in its cultivation, which have significant
negative environmental impacts. It was found that the 50/50 cotton-polyester sheets
had a lower impact than sheets made wholly from cotton, owing to greater durability
in use and lower laundering energy requirements. Another study (BSR, 2009)
confirmed the larger energy requirement for the production of polyester fibre, with
cotton requiring ~50 MJ/kg and polyester ~110 MJ/kg. It should be noted that, owing
to differences in fibre strength, different masses of fibres would be required to fulfil
the same function. Ideally, a functional unit, such as a sheet or t-shirt, should be
compared rather than fibres on a basis of unit mass; however, due to the limited
information available, a more detailed comparison is not possible.
Collins & Aumonier (2002) undertook a life cycle assessment of two items of male
apparel, namely polyester trousers and cotton briefs. The analysis determined the
energy footprints for the two products from resource extraction, through production
and manufacture, ending with use and disposal. Other environmental impacts were
28
not considered. The study showed that the energy use was dominated by the
consumer use phase, with 76% of the total life-cycle energy (~720 MJ in total for the
pair of polyester trousers) attributable to washing, drying and ironing. This
demonstrates that the phase of consumer use of clothing items contributes
significantly to their environmental impact. As noted with other studies, the focus on
one indicator (in this case, energy) is insufficient for a complete understanding of the
environmental impact. The dominance of the use phase for clothing has been
confirmed by other studies, e.g. Allwood et al. (2006), Steinberger et al. (2009) and
BSR (2009), but, generally, LCA analyses in the apparel industry are often limited in
scope. It is especially difficult to compare a functional unit such as sheets (Kalliala
and Nousiainen, 1999) with trousers and briefs (Collins and Aumônier, 2002)
because of the difference in function and associated consumer treatment of such
articles.
2.4 End of Life Studies
LCAs on waste management for PET feature a range of scenarios including
recycling, landfill, and incineration. Most studies suggest that recycling is favourable
with regard to energy use and greenhouse gas emissions in comparison to landfill
and incineration (Finnveden et al., 2005). Despite the greenhouse gases produced,
the next best alternative to recycling is incineration with energy recovery, leaving the
worst option as landfill (Moberg et al., 2005). Landfill results in the disposal of an
energy-rich waste, whereas for incineration with energy recovery, other fossil fuel use
can be avoided. For incineration, some research (Hu et al., 2009; Rieckmann and
Völker, 2003) suggests there are significant concentrations of heavy metals in the fly
ash, principally manganese and zinc used as catalysts in polymerisation; it was
unclear if the concentrations were above toxic levels. For recycling, larger collection
systems result in lower energy input requirements per unit mass processed (Song
and Hyun, 1999). The best scenario with respect to energy use was a combination of
closed loop, i.e. bottle-to-bottle, recycling and incineration with energy recovery;
however, with incineration, carbon emissions are increased, imposing a trade-off
between energy use and global warming potential (Song and Hyun, 1999).
In the fibre sector, Woolridge et al. (2006) showed that recycling by reusing the
clothing can save 324 MJ/kg polyester clothing compared to using virgin polyester. A
29
more comprehensive study investigated the open-loop recycling of PET bottles to
fibres (Shen et al., 2010). The research analysed a wide range of environmental
impacts and compared the results with virgin PET fibre and other commodity fibre
products. Depending on the recycling technology, mechanical or chemical recycling,
and the system boundaries drawn, savings in global warming potential of 25-75%
and non-renewable energy of 40-85% could be achieved relative to the use of virgin
material (Shen et al., 2010). It is much harder to recycle PET fibre than bottles,
because PET fibres are typically blended with other textile fibres and various
additives, such as dyes and finishing chemicals, which are difficult to remove to
create a clean stream of recycled PET (Shen et al., 2011).
Most studies of waste management compare the use of energy for recycling with that
for creating the same product from virgin polymer and generally show energy savings
when incorporating recycling. However, because the studies assess different
recycling schemes and processes, draw different boundaries and use various
allocation mechanisms, it is difficult to summarise the energy savings in a more
quantitative manner.
2.5 Biomass Sourcing
Given that some routes investigated in this Dissertation make use of biomass
sources, a brief overview covering the potential benefits and drawbacks of using
biomass is provided here. Finally, the optimal types of biomass for the production of
the raw materials for polyester are identified.
A wide range of commodity chemicals, of which polyester is one, could, in principle,
be generated from biomass, sugars and lignocellulose (Holladay et al., 2007; Werpy
et al., 2004). Biomass is seen as a good candidate to improve sustainability because
it is a renewable resource and it can lead to lower carbon emissions. It is a suitable
substitute for fossil-derived feedstock, as it makes use of existing process
technologies and established supply chains. There are however many broader
considerations to take into account when comparing the use of biomass to traditional
feedstocks. Firstly, the biomass needs to be sourced sustainably. This means that
important factors, such as use of fertiliser, water and land, must be accounted for in
rational comparative studies, such as a life-cycle assessment. There are also social
and ethical considerations associated with the use of biomass. For example, the
30
competition between food and biofuels, and the competition for cropland is growing
as indicated by the phenomenon of ‘land grabbing’ (Bringezu et al., 2012). 'Land
grabbing' occurs when local communities and individuals lose access to land that
they previously used, threatening their livelihoods (Friends of the Earth, 2014). The
land is acquired by outside investors and typically used for commodity crops,
including those used for biofuels. It is important for these social issues to be
addressed in addition to economic and environmental concerns, giving rise to the
triple bottom line for sustainability (Elkington, 1998).
There are many LCA studies on the production of ethanol from (i) first-generation
food crops, e.g. sugarcane (Luo et al., 2009a), sugar beet, corn, wheat and potatoes,
(ii) from second-generation lignocellulosic materials, e.g. willow (Stephenson et al.,
2010) and switch grass, and (iii) from waste residues, e.g. corn stover, wheat straw,
and molasses (Balat, 2011; Larson, 2006; Quirin et al., 2004; von Blottnitz and
Curran, 2007). Most studies of bioethanol production show savings in global warming
potential and fossil fuel energy use when compared with gasoline. The main factors
dominating the performance of bioethanol are crop productivity, climate and the
nature of the feedstock (von Blottnitz and Curran, 2007). When assessing studies of
bioethanol, the ranges for potential savings are large. This is owing to the different
assumptions made regarding the cultivation, conversion and allocation of by-products
(Quirin et al., 2004). Few studies, however, fully assess other environmental impacts;
for those that do, bioethanol is typically at a disadvantage when compared to fossil
fuels, with the key trade-offs being higher levels of acidification, eutrophication, and
ozone depletion due to their use of nitrogen compounds in agricultural production
(Quirin et al., 2004; von Blottnitz and Curran, 2007).
While it is difficult to compare biomass sources directly, because of their different
energy contents and processing requirements, some comparisons have been made
on the basis of their performance for producing transport fuels (Balat, 2011; Larson,
2006; Luo et al., 2009a; Quirin et al., 2004; Stephenson et al., 2010; von Blottnitz and
Curran, 2007). Sugarcane and willow both showed the largest potential for carbon
emissions savings over fossil fuels. The main biomass crops assessed in this
Dissertation are therefore sugarcane juice, cellulosic waste (sugarcane bagasse),
and finally, lignocellulosic willow (Ecoinvent Centre, 2010; Stephenson et al., 2010).
31
Three studies have considered biomass as a raw material for PET (Chen and Patel,
2012; Shen et al., 2011; Tabone et al., 2010). Tabone et al. (2010) proposed that
bioethanol produced from sugarcane in Brazil be dehydrated to ethylene. They
qualitatively concluded that ethylene from biomass would provide a saving in
greenhouse gas emissions and fossil energy use, over conventional manufacture,
but found an increase in other impact categories. The detail in the analysis of Tabone
et al. (2010) is limited; in particular, the inventory analysis does not include mass and
energy balances for the dehydration process, but rather assumed a blanket set of
emissions and energy requirements. Accordingly, a conclusive statement about the
environmental performance of ethylene derived from biomass cannot be made.
Tabone et al. (2010) also compared other polymers on a cradle-to-gate basis, which
does not account for use and disposal. Finally, Tabone et al. (2010) combined the
range of LCA impact categories into a single ranking of polymers. As discussed in
Chapter 3, combining environmental impact categories has no logical basis, because
it imposes priorities by weighting the impacts, which is entirely subjective. Instead the
tradeoffs amongst impacts should be considered.
Shen et al. (2011) and Chen & Patel (2012) examined bioethanol from both
sugarcane in Brazil and corn in the USA to make ethylene. The model for ethanol
dehydration used by Shen et al. (2011) was based on the simple model of Chen &
Patel (2012), which uses a mass balance based on stoichiometric conversion, with
the energy required based on the enthalpy of the dehydration reaction. The analysis
did not account for energy requirements in other process operations, such as
compression and separation, or waste water and gaseous emissions resulting from
the processes. Furthermore, neither study is transparent with respect to the
assumptions made and there is insufficient detail on the system boundaries. For
example, the transportation distances and sources of energy used in production can
significantly affect both energy requirements and carbon emissions. That said, Shen
et al. (2011) and Chen & Patel (2012) reported cradle-to-grave savings on the basis
of non-renewable energy use and greenhouse gas emissions, over conventional
production of PET, of, respectively, 15-26% and 17-26%. The cradle-to-gate
greenhouse gas saving was higher, at 35-53%, because it does not consider the end
of life incineration. Even though both studies were based on the same underlying
32
model, their results showed significant variation in the savings predicted, largely
owing to differences in the system boundaries.
Both studies (Chen and Patel, 2012; Shen et al., 2011) quantified non-renewable
energy use and greenhouse gas emissions only. This is severely limiting given that it
overlooks some of the major drawbacks of using biomass which can result in an
increase in other environmental impacts, especially eutrophication.
Chen & Patel (2012) also investigated the fermentation of processed corn to
isobutanol, which was then converted catalytically to p-xylene. The reported cradle-
to-grave savings were estimated to be 6-27% and 5-37% for non-renewable energy
use and greenhouse gas emissions, respectively (Chen and Patel, 2012). It is
therefore possible in principle to produce PET using both ethylene and p-xylene
derived from biomass, with combined cradle-to-grave savings in the range 21-42%
for non-renewable energy use, and 23-55% for greenhouse gas emissions (Chen
and Patel, 2012). The variation in these potential savings is large. The lower bounds
for non-renewable energy use and greenhouse gas emission savings were reported
by Gevo (Chen and Patel, 2012). The larger savings were from calculations by Chen
& Patel (2012), which used parameters for the bioconversion to isobutanol provided
by Gevo and assumed ideal conditions for the conversion from isobutanol to p-xylene
using reaction enthalpies; however, no further detail is provided of the analysis. The
assumption of ideal conditions is unlikely in practice, and therefore Chen & Patel’s
(2012) calculation presents the most favourable savings. The boundaries have not
been clearly defined and there is no transparency about any further assumptions
made in the model. It is therefore not possible to comment further on their analysis.
The direct catalytic route to p-xylene, investigated in this Dissertation, has not yet
been studied in the peer-reviewed literature.
2.6 Conclusion
In summary, although various studies on the sustainability of PET have been
undertaken, they do not paint a complete picture of its full life cycle assessment.
Also, while there have been previous LCA studies of PET from fossil fuel sources, the
impacts of using biomass as a raw material on the polyester value chain have not
been investigated rigorously in detail. There is therefore substantial scope to
undertake rigorous life cycle assessment on PET production, with clearly stated
33
assumptions, a clear definition of the system boundaries and a standard impact
assessment method. The protocol for calculating the latter can have a significant
impact on the results, giving inconsistencies when comparing results for the same
functional unit between different studies. Through the use of detailed modelling with
reference to industrial practice, and by stating and analysing the validity of
assumptions made, it is intended that the current research will link the various stages
of the value chain into a single comprehensive LCA.
34
Chapter 3 Methodology
This Chapter outlines the life cycle assessment (LCA) method used for the
quantification of environmental impacts. Details relevant to the process modelling and
allocation procedures of the studies conducted are discussed in their respective
Chapters.
3.1 Life Cycle Assessment
Life cycle assessment (LCA) is a systematic technique for identifying, quantifying and
assessing the environmental impacts throughout the entire life of a product, process
or service. It should be noted that LCA can be most accurately used as a
comparative tool between two equivalent systems; the absolute results from an LCA
need to be considered with caution given the difficulty in defining an unequivocal
system boundary (Cullen and Allwood, 2009).
The life-cycle stages typically included in a full LCA are: raw materials extraction,
processing, manufacturing, transportation, distribution, use and disposal. This is
particularly important because many studies claim the largest environmental impact
of some products, for example a car, can occur during its use, rather than in its
manufacture. This also means that the system under study has to be very carefully
defined. For the purpose of LCA, the defined process can be referred to as the
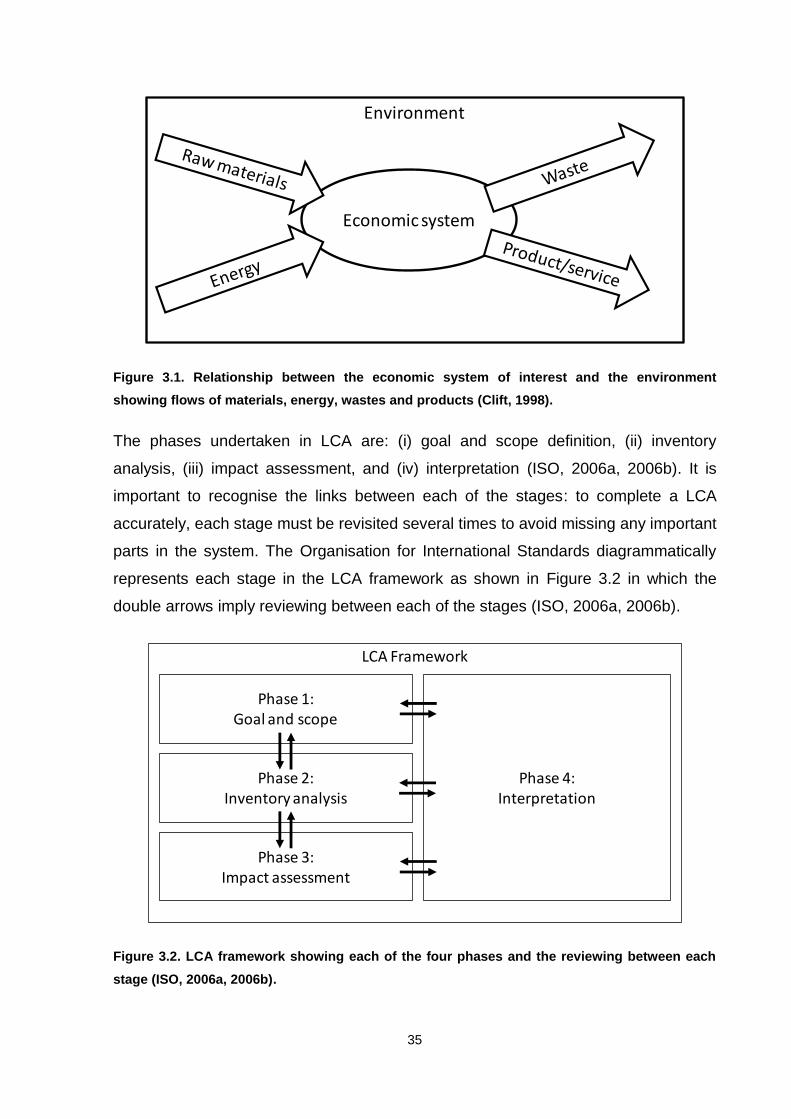
economic system (Clift, 1998). The economic system relates to the environment
through exchanges of flows of materials, energy, wastes and products, as shown in
Figure 3.1. A drawback of LCA is that accurate and detailed studies can be time
consuming. However, useful conclusions can often be drawn from the initial stages of
LCA, as discussed for some life cycle inventory studies in Chapter 2.
35
Environment
Economic system
Figure 3.1. Relationship between the economic system of interest and the environment
showing flows of materials, energy, wastes and products (Clift, 1998).
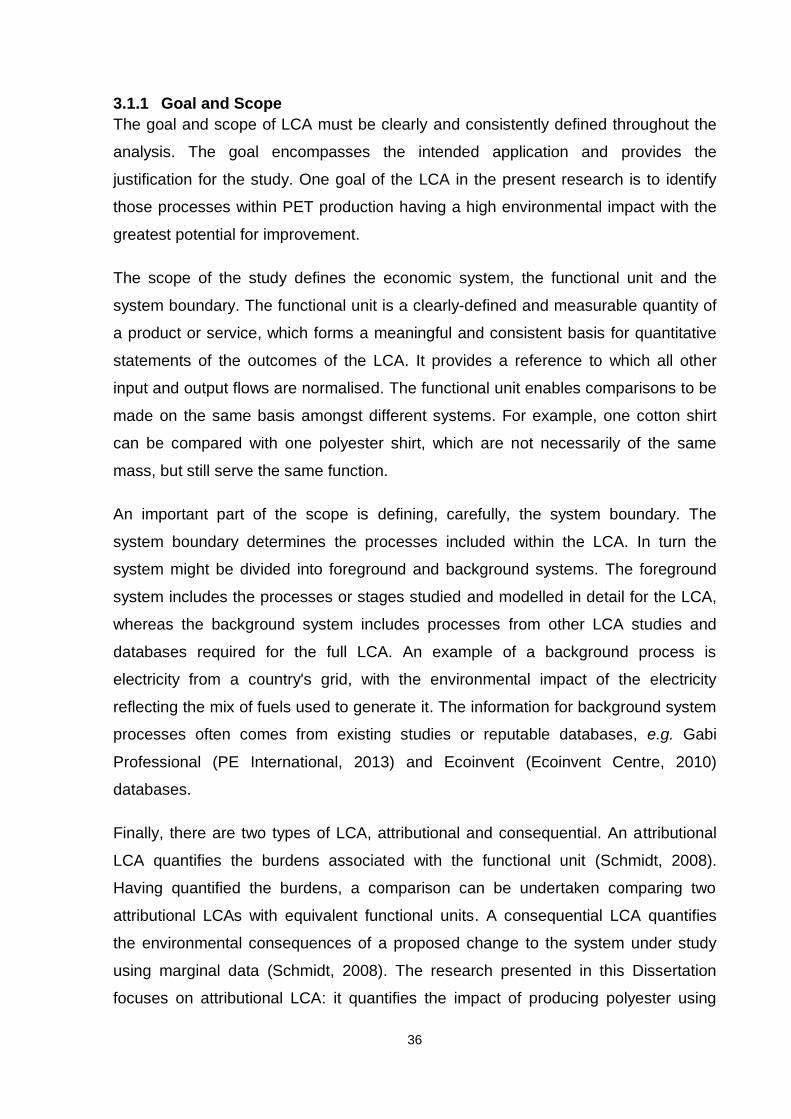
The phases undertaken in LCA are: (i) goal and scope definition, (ii) inventory
analysis, (iii) impact assessment, and (iv) interpretation (ISO, 2006a, 2006b). It is
important to recognise the links between each of the stages: to complete a LCA
accurately, each stage must be revisited several times to avoid missing any important
parts in the system. The Organisation for International Standards diagrammatically
represents each stage in the LCA framework as shown in Figure 3.2 in which the
double arrows imply reviewing between each of the stages (ISO, 2006a, 2006b).
LCA Framework
Phase 2:Inventory analysis
Phase 1:Goal and scope
Phase 3:Impact assessment
Phase 4:Interpretation
Figure 3.2. LCA framework showing each of the four phases and the reviewing between each
stage (ISO, 2006a, 2006b).
36
3.1.1 Goal and Scope
The goal and scope of LCA must be clearly and consistently defined throughout the
analysis. The goal encompasses the intended application and provides the
justification for the study. One goal of the LCA in the present research is to identify
those processes within PET production having a high environmental impact with the
greatest potential for improvement.
The scope of the study defines the economic system, the functional unit and the
system boundary. The functional unit is a clearly-defined and measurable quantity of
a product or service, which forms a meaningful and consistent basis for quantitative
statements of the outcomes of the LCA. It provides a reference to which all other
input and output flows are normalised. The functional unit enables comparisons to be
made on the same basis amongst different systems. For example, one cotton shirt
can be compared with one polyester shirt, which are not necessarily of the same
mass, but still serve the same function.
An important part of the scope is defining, carefully, the system boundary. The
system boundary determines the processes included within the LCA. In turn the
system might be divided into foreground and background systems. The foreground
system includes the processes or stages studied and modelled in detail for the LCA,
whereas the background system includes processes from other LCA studies and
databases required for the full LCA. An example of a background process is
electricity from a country's grid, with the environmental impact of the electricity
reflecting the mix of fuels used to generate it. The information for background system
processes often comes from existing studies or reputable databases, e.g. Gabi
Professional (PE International, 2013) and Ecoinvent (Ecoinvent Centre, 2010)
databases.
Finally, there are two types of LCA, attributional and consequential. An attributional
LCA quantifies the burdens associated with the functional unit (Schmidt, 2008).
Having quantified the burdens, a comparison can be undertaken comparing two
attributional LCAs with equivalent functional units. A consequential LCA quantifies
the environmental consequences of a proposed change to the system under study
using marginal data (Schmidt, 2008). The research presented in this Dissertation
focuses on attributional LCA: it quantifies the impact of producing polyester using
37
conventional processing, and then focuses on the comparison between equivalent
LCA systems by investigating the impacts of alternative processing relative to the
conventional processing, namely, switching to biomass feedstock. In the latter case,
the social and economic implications of the decision need to be taken into account;
however, these are only briefly discussed given the focus of this Dissertation is on
the environmental sustainability.
3.1.2 Inventory Analysis
The inventory analysis uses detailed process flowsheeting of all the operations in the
foreground system to give heat, mass and energy balances for all defined flows. The
final outcome of the inventory analysis is usually presented in a tabulated form,
showing the net material and energy flows into and out of the system. The details of
the operating conditions used are very important, because small changes can
sometimes have quite a significant effect on the rest of the process and,
consequently, the impact on the environmental impacts. The inventory analysis in this
Dissertation uses both Excel and process simulation software Unisim Design Suite
R400 (Honeywell, 2010) to model the processes.
3.1.3 Impact Assessment
The impact assessment determines the burden of the system on the environment.
The outcomes from the inventory analysis, namely the material, energy, waste and
product flows are all assigned to specific impact categories. These categories
quantitatively describe the total environmental burden, each with respective
standardised units; this is shown in Table 3.1. Each category is also typically
provided with timescales. This is because a compound which is quickly removed from
the environment may initially have a large effect on a shorter time scale, but over
longer periods of time, its relative impact diminishes. The typical time scales used
with these indicators are 20, 100, and 500 years. Most studies tend to present the
values for 100 years as this time-scale provides a sufficiently long duration over
which to observe and measure the environmental impact over a human lifetime.
As explained previously, it is left to the author's discretion as to which environmental
impact categories to include, given that there are no set requirements in the LCA
guidelines. One of the main environmental impact categories investigated in this
Dissertation is the global warming potential. Houghton (2009) describes the
38
greenhouse effect as a combination of the natural and enhanced greenhouse effect
The gases nitrogen and oxygen, which make up the bulk of the atmosphere neither
absorb nor emit thermal radiation. Water vapour, carbon dioxide and some other
minor gases (e.g. methane, nitrous oxide) present in the atmosphere absorb some of
the thermal radiation leaving the Earth’s surface and consequently act as a partial
blanket for the thermal radiation. The initial concentrations of these gases in the
atmosphere, before anthropogenic emissions, cause a difference of 20-30°C
between the actual average surface temperature on the Earth of about 15°C and the
temperature that would apply if greenhouse gases were absent. This is known as the
natural greenhouse effect. The enhanced greenhouse effect is caused by the
additional greenhouse gases present in the atmosphere arising from anthropogenic
activities, which result in the increase of global temperature; this is known as global
warming (Houghton, 2009). Table 3.1 lists the set of all environmental impact
categories considered in this research (Guinée et al., 2002). To find the impact of a
specific component in a given process flow, the flow is converted to one of the
standard flows given in Table 3.1 using a potency factor. For example, methane
contributes to global warming and it has a global warming potential of 34 kg CO2-eq1
over 100 years (Guinée et al., 2002). This means that the release of 1 kg of methane
to atmosphere is equivalent to releasing 34 kg CO2 to atmosphere in its effect on
global warming. As seen in Table 3.1, the units of kg CO2-equivalent are the standard
units used for global warming potential and so all the components contributing to
global warming in a particular process stream can be converted to a single measure.
In order the help rationalise t CO2-eq and an actual tonne of CO2 emission, Moura-
Costa and Wilson (2000) developed a method for accounting between the radiative
forcing effect of CO2 emissions and carbon sequestration and storage. This was
achieved by deriving an equivalence factor between t CO2-eq and t CO2-year. Hence,
removing 1 t CO2 from the atmosphere and storing it for 55 years counteracts the
radiative forcing effect of a pulse emission of 1 t of CO2, integrated over a 100-year
time horizon.
The environmental impacts listed in Table 3.1 are calculated using the CML impact
assessment method (Guinée et al., 2002). Many different methods have been
1 kg CO2-eq = kilogram of carbon dioxide equivalent, other units similarly defined with respect to other
elements or chemicals.
39
developed by different organisations to calculate the impact categories for
components, e.g. EDIP 2003, Impact 2002+, Impacts ILCD, ReCiPE, TRACI. It is
important to note that some impact methods may not use the same categories, whilst
others may define additional categories to those specified in Table 3.1; they may also
use different units to represent the categories. Furthermore, there are two methods of
impact assessment, mid-point and end-point methods. Mid-point methods take a
problem-oriented approach, and as such, translate impacts into environmental
themes such as those listed in Table 3.1. End-point methods, take a damage-
oriented approach, and quantify the environmental impact into issues of concern
such as human health, natural environment, and natural resources. End-point
methods often have a higher level of uncertainty than mid-point methods, because it
is difficult to predict the actual damage with certainty; however, the end-point
approach is often easier to interpret as it expresses the results as tangible
consequences. Another way to rationalise mid-point methods is to use normalisation.
Normalisation is when the quantified impact is compared to a certain reference value,
for example, the average environmental impact of a European citizen in one year.
The CML 2001 method (Guinée et al., 2002) was selected for the analysis of the
environmental impacts in the present Dissertation, because, apart from giving an
assessment of many different environmental impacts, it has been continuously
updated, with the latest revision in November 2010 being used by the Gabi software
databases used in this work (PE International, 2013). For the impact assessment
stage, the inventory analysis findings were imported into Gabi 6, which is life cycle
software capable of quantifying the environmental impact from the inventory table
using potency factors.
40
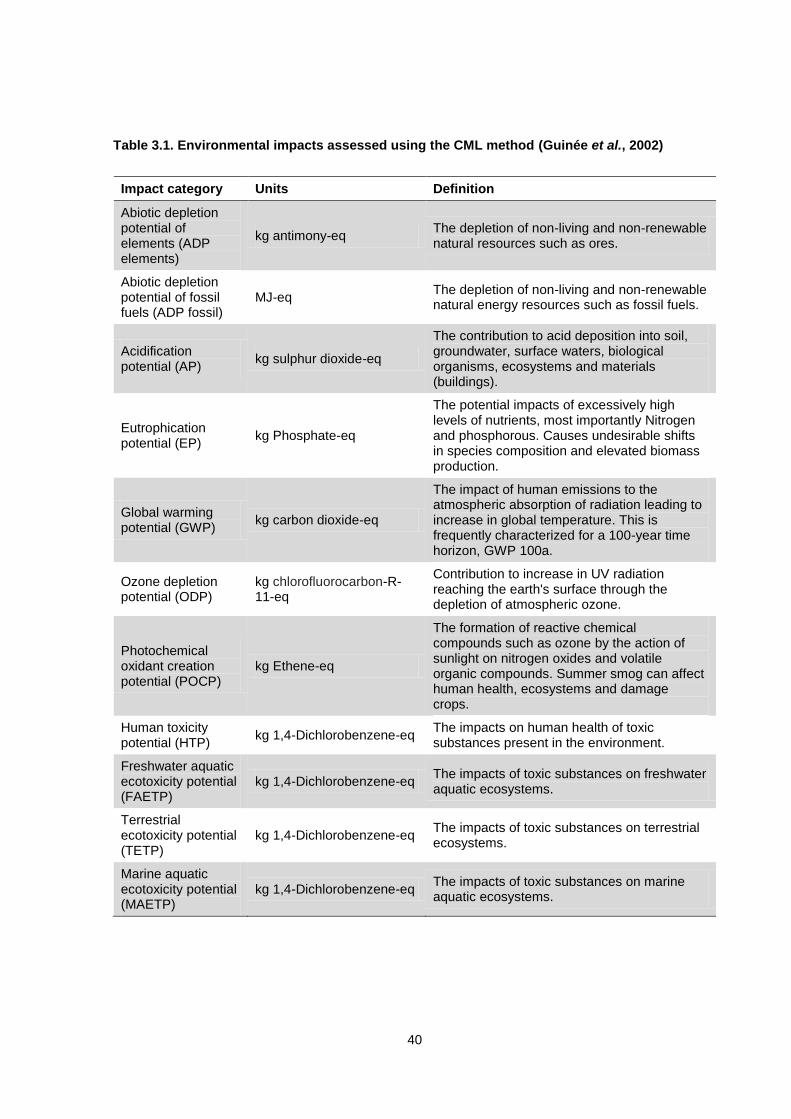
Table 3.1. Environmental impacts assessed using the CML method (Guinée et al., 2002)
Impact category Units Definition
Abiotic depletion potential of elements (ADP elements)
kg antimony-eq The depletion of non-living and non-renewable natural resources such as ores.
Abiotic depletion potential of fossil fuels (ADP fossil)
MJ-eq The depletion of non-living and non-renewable natural energy resources such as fossil fuels.
Acidification potential (AP)
kg sulphur dioxide-eq
The contribution to acid deposition into soil, groundwater, surface waters, biological organisms, ecosystems and materials (buildings).
Eutrophication potential (EP)
kg Phosphate-eq
The potential impacts of excessively high levels of nutrients, most importantly Nitrogen and phosphorous. Causes undesirable shifts in species composition and elevated biomass production.
Global warming potential (GWP)
kg carbon dioxide-eq
The impact of human emissions to the atmospheric absorption of radiation leading to increase in global temperature. This is frequently characterized for a 100-year time horizon, GWP 100a.
Ozone depletion potential (ODP)
kg chlorofluorocarbon-R-11-eq
Contribution to increase in UV radiation reaching the earth's surface through the depletion of atmospheric ozone.
Photochemical oxidant creation potential (POCP)
kg Ethene-eq
The formation of reactive chemical compounds such as ozone by the action of sunlight on nitrogen oxides and volatile organic compounds. Summer smog can affect human health, ecosystems and damage crops.
Human toxicity potential (HTP)
kg 1,4-Dichlorobenzene-eq The impacts on human health of toxic substances present in the environment.
Freshwater aquatic ecotoxicity potential (FAETP)
kg 1,4-Dichlorobenzene-eq The impacts of toxic substances on freshwater aquatic ecosystems.
Terrestrial ecotoxicity potential (TETP)
kg 1,4-Dichlorobenzene-eq The impacts of toxic substances on terrestrial ecosystems.
Marine aquatic ecotoxicity potential (MAETP)
kg 1,4-Dichlorobenzene-eq The impacts of toxic substances on marine aquatic ecosystems.
41
3.1.4 Interpretation
The final phase of the LCA is interpretation, which serves to identify the significant
issues based on the outputs of the prior stages. Consideration of the
comprehensiveness, consistency and sensitivity of the study enables conclusions
and recommendations to be made. This is a crucial stage in the analysis because it
brings together each previous stage and draws conclusions from the study. The
impact assessment serves to judge the size of the environmental impact. Careful
inspection of each different operation allows for processes with a major
environmental impact to be identified. Suggestions for targeted improvements can
then be made to most efficiently reduce the environmental impacts.
For any changes made to the system, there may be explicit trade-offs to take into
account. For example, while a new catalyst may operate at a lower temperature and
reduce the global warming potential of a unit operation, it might be that, in the
manufacture of the catalyst itself, large quantities of water are used. The trade-off
between reduction in global warming and increased use of water accordingly needs
to be made in a transparent way at the interpretation stage. This is not trivial given
that the impacts are in different units and therefore directly comparing the magnitude
of the impacts is not possible.
Whilst it is tempting to group the impact categories from Table 3.1, using a weighting
technique to combine them into one overall impact value, this should be avoided. It is
not possible to produce one number to represent how well the system performs with
respect to the environment, because this would require a weighting system which
consequently would place a higher value or priority on one category relative to
others. In any case, because the factors have different units, there is no logical basis
for combining them. In fact, these categories have been established as being equally
important and critical indicators for the environment. For example, trying to attain an
economic value, such as an environmental cost of a process, would inevitably place
a higher value on some indicators, perhaps global warming potential, either because
of subjectivity or because there is unjustified pressure from the government or media
to do so.
42
3.2 Allocation
In the case of multi-output or co-product systems, that is to say the process studied
has more than one useful output, it is not always straightforward to distribute
accurately the burdens of the system to the respective products. Ideally, wherever
possible, the system boundary should be expanded or redefined in order to attain a
more accurate representation of the environmental burdens associated with the
functional unit. In some cases, a more appropriate functional unit may need to be
selected to eliminate this problem.
Where it is not possible to re-define the system boundaries, allocation will be
necessary. Allocation is used in order to assign proportions of the inputs and outputs,
and hence partitioning the burdens to the different products. If allocation cannot be
avoided, then a causal method of allocation should be used. Causal allocation
involves apportioning the inputs and outputs amongst the different products to reflect
the physical relationships between them, e.g. mass and energy requirements. As a
last resort, if causal allocation is not possible, other methods of allocation, such as
economic value of the products, can be used. It should be noted, that allocation is
less rigorous than system boundary expansion and therefore allocation should only
be used as a last resort.
Biogenic carbon is a term used to describe carbon stored within biomass during the
growth phase of the plant. Carbon allocation is another allocation method. This is
defined as the carbon contained in one product divided by the carbon contained by
all products from the system. Carbon allocation is different from mass allocation
because it does not account for the water content of the biomass source. Water
content can significantly distort the mass allocation method, in particular for biomass
sources.
Details of the functional unit, system boundary definition, and where required,
allocation methods, are described in each respective Chapter.
43
Chapter 4 The Production of Ethylene from Biomass
This Chapter investigates the environmental impacts of the production of ethylene
derived from biomass sources sugarcane and willow, via the dehydration of
bioethanol. Ethylene is subsequently used within the polyester value chain as the raw
material feedstock for ethylene glycol production.
4.1 Introduction
Ethylene glycol accounts for 28 wt% of the final PET polymer. Producing the glycol
from biomass has the potential to reduce the greenhouse gas emissions and fossil
fuel requirements in PET processing. The route, investigated here, to obtain ethylene
glycol from biomass requires the initial fermentation of biomass to ethanol, which is
subsequently dehydrated to ethylene and then converted using standard catalytic
processes to ethylene oxide and subsequently to glycol. This route will be compared
with conventional processing from fossil fuel sources.
As discussed in Chapter 2, the types of biomass giving the largest savings in global
warming potential were sugarcane (juice and bagasse) and willow. Sugarcane is
conventionally grown in warm temperate to tropical regions; Brazil is the world’s
largest producer of sugarcane (Luo et al., 2009a). Lignocellulosic biomass is the
most abundant reproducible resource on the Earth (Balat et al., 2008) and there are
many potential crops for the production of second-generation bioethanol. In the UK,
significant attention has recently been paid to the use of the fast-growing perennial
energy-crop, willow, which can produce annually high yields of 7-12 dry t/ha and is
suitable for cultivation on low-quality land (Stephenson et al., 2010). In this
Dissertation, both sugarcane in Brazil and willow in the UK were chosen as starting
points for the manufacture of ethanol.
4.2 Analysis
4.2.1 Goal and Scope
As discussed earlier, an important element in LCA is to define the system rigorously
and, in particular, to define an appropriate functional unit. The functional unit, the
fixed reference quantity used as a basis for comparison between different systems,
was defined as one 500 mL carbonated soft drink (CSD) PET bottle after distribution
to a supermarket. As noted in Chapter 2, the life cycle impacts of PET fibres are
44
dominated by their use phase, e.g. the washing and drying of clothes (Allwood et al.,
2006; Collins and Aumônier, 2002). Therefore, this Chapter concentrates on bottle-
grade material where changes to the processing have a much greater influence on
the product’s overall environmental impact. The selection of a bottle also avoids the
need to address regional behavioural patterns for washing and drying of clothing, i.e.
the energy used in washing clothes can vary significantly by region.
The mass of PET in the bottle was assumed to be 23.5 g (Coca-Cola Enterprises,
2012; De Miranda et al., 2011). The scenarios described later explore inter alia the
effect of changes in geographical location of the final outlet for the bottles and the
distances over which material is transported between the processes in the value
chain. The boundary of the system studied encompasses all the processes directly
involved with the production of the bottles (the foreground system) and also the
secondary (background) processes. For background processes, e.g. the supply of
electricity, existing databases were used, giving geographically-dependent market
averages of processes. The scope did not include end-of-life processing, such as
recycling or disposal, since the aim was to compare the impact of feedstocks on
virgin PET. This is a cradle-to-gate LCA with the gate boundary drawn at the
distribution and includes transportation.
4.2.2 Value Chain
The processes involved in the production of PET bottles from (i) conventional fossil-
fuel sources and (ii) biomass are shown in Figure 4.1, with the difference between
the routes being in the production of ethylene. Bioethanol displaces the naphtha or
natural gas requirements for the production of ethylene. Irrespective of whether the
ethylene is made from naphtha or bioethanol, it is oxidised to ethylene oxide using
the oxygen-based direct oxidation process over a silver catalyst. The resulting
ethylene oxide is reacted in excess water to yield ethylene glycol. The manufacturing
plants for ethylene oxide and ethylene glycol are often contiguous, leading to energy
savings by heat integration, and avoiding the storage and transport of ethylene oxide,
which is hazardous.
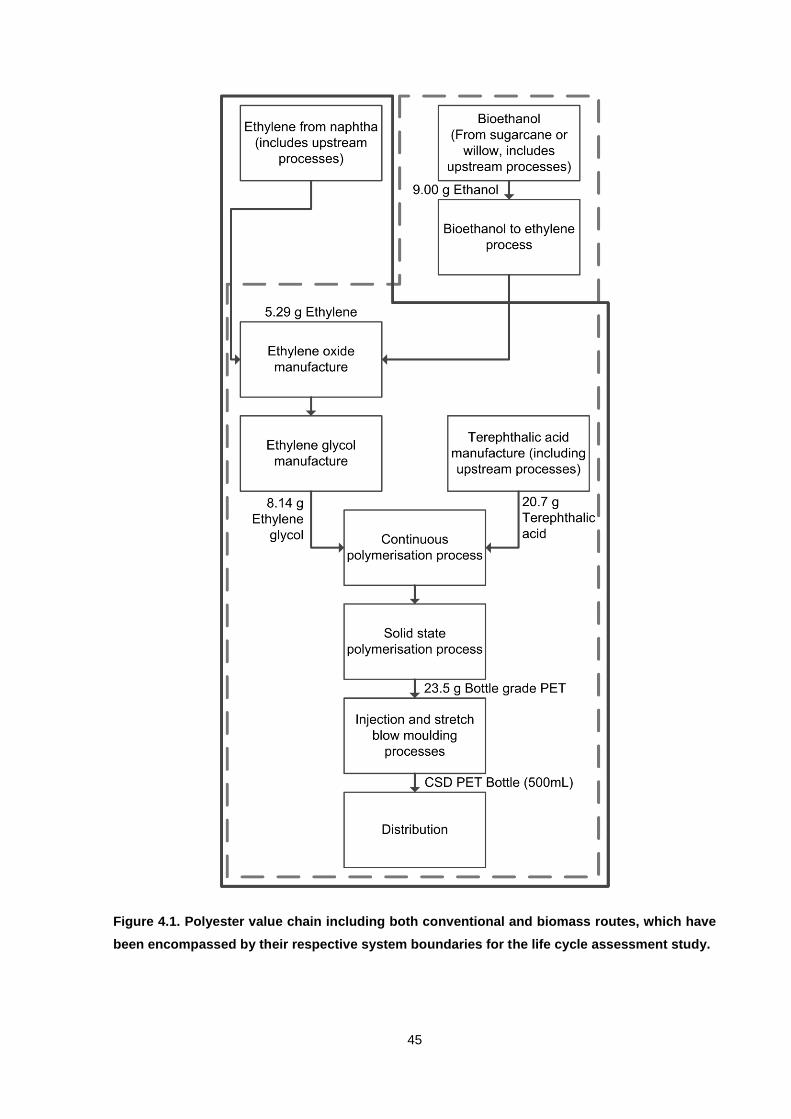
45
Figure 4.1. Polyester value chain including both conventional and biomass routes, which have
been encompassed by their respective system boundaries for the life cycle assessment study.
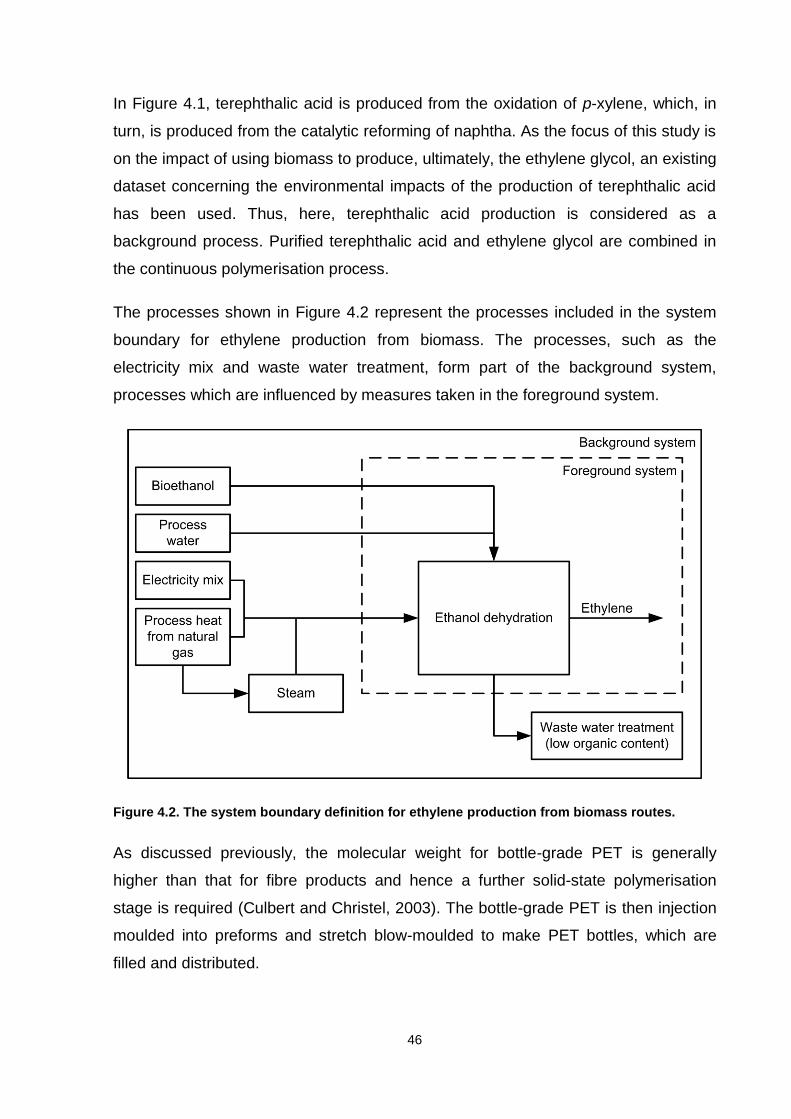
46
In Figure 4.1, terephthalic acid is produced from the oxidation of p-xylene, which, in
turn, is produced from the catalytic reforming of naphtha. As the focus of this study is
on the impact of using biomass to produce, ultimately, the ethylene glycol, an existing
dataset concerning the environmental impacts of the production of terephthalic acid
has been used. Thus, here, terephthalic acid production is considered as a
background process. Purified terephthalic acid and ethylene glycol are combined in
the continuous polymerisation process.
The processes shown in Figure 4.2 represent the processes included in the system
boundary for ethylene production from biomass. The processes, such as the
electricity mix and waste water treatment, form part of the background system,
processes which are influenced by measures taken in the foreground system.
Figure 4.2. The system boundary definition for ethylene production from biomass routes.
As discussed previously, the molecular weight for bottle-grade PET is generally
higher than that for fibre products and hence a further solid-state polymerisation
stage is required (Culbert and Christel, 2003). The bottle-grade PET is then injection
moulded into preforms and stretch blow-moulded to make PET bottles, which are
filled and distributed.
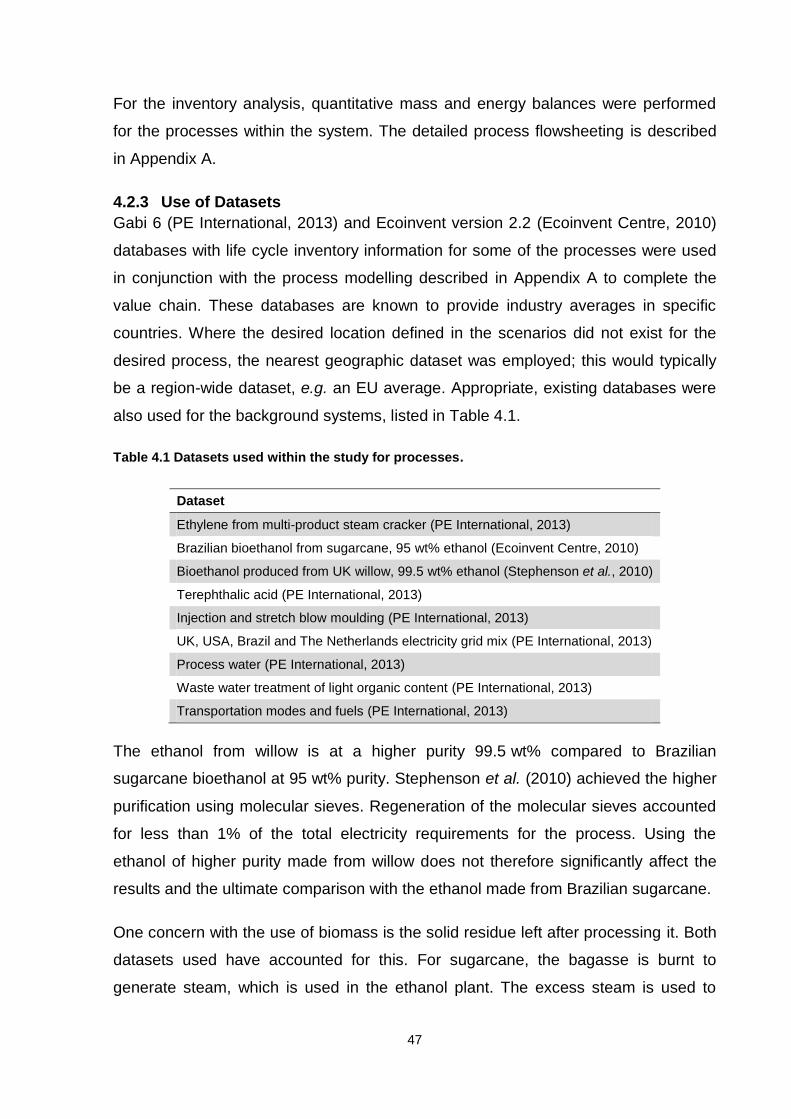
47
For the inventory analysis, quantitative mass and energy balances were performed
for the processes within the system. The detailed process flowsheeting is described
in Appendix A.
4.2.3 Use of Datasets
Gabi 6 (PE International, 2013) and Ecoinvent version 2.2 (Ecoinvent Centre, 2010)
databases with life cycle inventory information for some of the processes were used
in conjunction with the process modelling described in Appendix A to complete the
value chain. These databases are known to provide industry averages in specific
countries. Where the desired location defined in the scenarios did not exist for the
desired process, the nearest geographic dataset was employed; this would typically
be a region-wide dataset, e.g. an EU average. Appropriate, existing databases were
also used for the background systems, listed in Table 4.1.
Table 4.1 Datasets used within the study for processes.
Dataset
Ethylene from multi-product steam cracker (PE International, 2013)
Brazilian bioethanol from sugarcane, 95 wt% ethanol (Ecoinvent Centre, 2010)
Bioethanol produced from UK willow, 99.5 wt% ethanol (Stephenson et al., 2010)
Terephthalic acid (PE International, 2013)
Injection and stretch blow moulding (PE International, 2013)
UK, USA, Brazil and The Netherlands electricity grid mix (PE International, 2013)
Process water (PE International, 2013)
Waste water treatment of light organic content (PE International, 2013)
Transportation modes and fuels (PE International, 2013)
The ethanol from willow is at a higher purity 99.5 wt% compared to Brazilian
sugarcane bioethanol at 95 wt% purity. Stephenson et al. (2010) achieved the higher
purification using molecular sieves. Regeneration of the molecular sieves accounted
for less than 1% of the total electricity requirements for the process. Using the
ethanol of higher purity made from willow does not therefore significantly affect the
results and the ultimate comparison with the ethanol made from Brazilian sugarcane.
One concern with the use of biomass is the solid residue left after processing it. Both
datasets used have accounted for this. For sugarcane, the bagasse is burnt to
generate steam, which is used in the ethanol plant. The excess steam is used to
48
generate electricity. The sugarcane dataset used economic allocation for the co-
products ethanol and electricity. The ash resulting from the incineration of the
sugarcane bagasse is used as fertiliser for the growing of the cane. Because the ash
remains within the boundary of the sugarcane dataset, no further allocation is
required. The stillage, the remaining water from after ethanol distillation, is also
added to the soil as additional fertiliser, requiring no allocation (Ecoinvent Centre,
2010). For willow, lignin residue was assumed to be combusted at the plant to
produce electrical power to satisfy process requirements. In the case where excess
electricity was generated, Stephenson et al. (2010) allocated the enviornmental
burdens using the method of ‘system expansion’, whereby it was assumed that the
resulting electricity would displace the corresponding amount supplied by the
National Grid.
4.2.4 Allocation
Where there are two or more products from a system, allocation is used to partition
the burdens among the products. As discussed previously, where possible in LCA,
allocation should be avoided to reduce inaccuracies and improve transparency in the
study (Azapagic and Clift, 1999).
In the production of ethylene oxide, allocation was avoided by constraining the
process to produce only the ethylene oxide grade required for ethylene glycol
formation. An actual plant would produce ethylene oxide for a variety of uses and not
just to make glycol. Many of these additional uses require ethylene oxide of higher
purity, requiring additional purification steps. Accordingly, the boundaries were drawn
around the system to exclude the extra purification operations because they would
not be required. As discussed earlier, the ethylene oxide process is a net exporter of
heat generated by the exothermic reaction. In this case, allocation was avoided by
extending the boundaries to include the ethylene glycol process. The heat was then
used for the separation energy requirements in the ethylene glycol process.
The problem of allocation does, however, arise in the production of ethylene glycol,
because valuable by-products are formed, such as diethylene glycol and higher
glycols, which therefore should also bear their share of the burdens of production.
Here, the boundaries were first re-drawn to exclude further purification of the
diethylene and higher glycols. This is because the product of interest was ethylene
49
glycol and it would be illogical to assign any of the burdens of refining other glycols to
ethylene glycol. Regarding the upstream production and separation up to the point at
which nearly-pure ethylene glycol was formed (the operations defined in Figure A.3 of
Appendix A); it was not possible to avoid allocation, and therefore, mass-based
allocation was chosen. On a mass basis, ethylene glycol production forms 81 wt% of
the output and other glycols the remaining 19 wt%. Thus 81% of the burdens for the
production were allocated to ethylene glycol. Economic allocation was not chosen
because of the price volatility of the products over time skewing the final results as
well as outdating these results as soon as trends change. In principle, marginal
allocation (Azapagic and Clift, 1999) could be used, but the reaction model was
insufficiently refined in this work to investigate how the proportions of products could
be changed relative to one another by altering the process conditions.
As mentioned earlier, 1-3 wt% isophthalic acid is added in the continuous
polymerisation process for bottle grade PET. The production of isophthalic acid is
similar to that of terephthalic acid, yet, industrially, it is typically less efficient owing to
the use of older assets and manufacturing in smaller capacities, e.g. 150 kt/yr
isophthalic acid cf. 750-1000 kt/yr terephthalic acid (PCI Xylenes & Polyesters, 2013).
There was no isophthalic acid production dataset available within the databases.
Given that the final polymer contains 1-3 wt% isophthalic acid, the contribution to the
environmental impacts is small. By assuming isophthalic acid production would be
similar to terephthalic acid production, the terephthalic acid dataset was therefore
used and the environmental impacts were largely incorporated into the analysis.
A final case of allocation was encountered in filling and transporting filled CSD PET
bottles to the distribution centres. The filling of the bottles was allocated to the soft
drink. Allocation by mass was chosen for transport because the bulk of the functional
unit is the liquid. This type of allocation is further justified because heavier packaging
containers, e.g. glass, have a larger transport requirement. Therefore, in the model,
transport of only the bottle mass was calculated.
4.2.5 Scale
The scale of operation for each of the plant designs was 200 kt/y; representative of
typical plants midway through their operating life. However, plants being currently
built might well exceed 600 kt/y. In the life cycle assessment, production units were
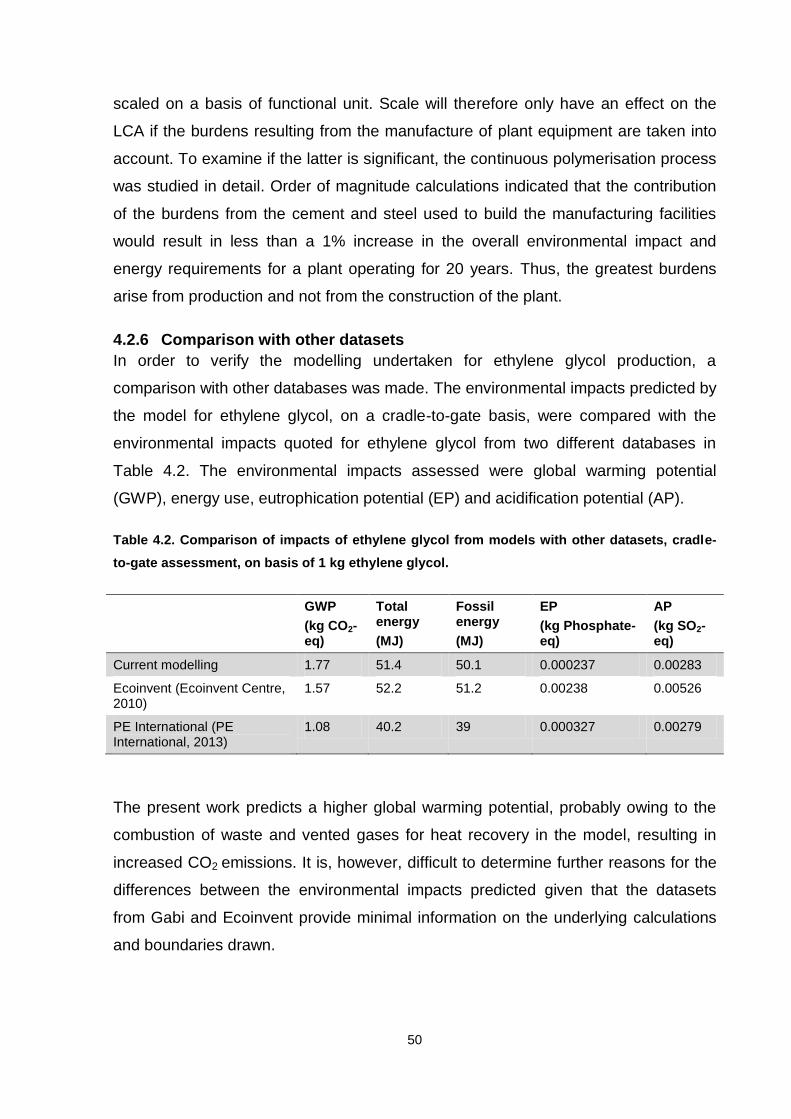
50
scaled on a basis of functional unit. Scale will therefore only have an effect on the
LCA if the burdens resulting from the manufacture of plant equipment are taken into
account. To examine if the latter is significant, the continuous polymerisation process
was studied in detail. Order of magnitude calculations indicated that the contribution
of the burdens from the cement and steel used to build the manufacturing facilities
would result in less than a 1% increase in the overall environmental impact and
energy requirements for a plant operating for 20 years. Thus, the greatest burdens
arise from production and not from the construction of the plant.
4.2.6 Comparison with other datasets
In order to verify the modelling undertaken for ethylene glycol production, a
comparison with other databases was made. The environmental impacts predicted by
the model for ethylene glycol, on a cradle-to-gate basis, were compared with the
environmental impacts quoted for ethylene glycol from two different databases in
Table 4.2. The environmental impacts assessed were global warming potential
(GWP), energy use, eutrophication potential (EP) and acidification potential (AP).
Table 4.2. Comparison of impacts of ethylene glycol from models with other datasets, cradle-
to-gate assessment, on basis of 1 kg ethylene glycol.
GWP
(kg CO2-eq)
Total energy
(MJ)
Fossil energy
(MJ)
EP
(kg Phosphate-eq)
AP
(kg SO2-eq)
Current modelling 1.77 51.4 50.1 0.000237 0.00283
Ecoinvent (Ecoinvent Centre, 2010)
1.57 52.2 51.2 0.00238 0.00526
PE International (PE International, 2013)
1.08 40.2 39 0.000327 0.00279
The present work predicts a higher global warming potential, probably owing to the
combustion of waste and vented gases for heat recovery in the model, resulting in
increased CO2 emissions. It is, however, difficult to determine further reasons for the
differences between the environmental impacts predicted given that the datasets
from Gabi and Ecoinvent provide minimal information on the underlying calculations
and boundaries drawn.
51
4.2.7 Scenarios
Two manufacturing locations for PET were considered, namely in the UK and the
USA. The following cases were considered.
Case 1: Manufacture of PET in the UK
The manufacture of terephthalic acid, continuous polymerisation and solid state
polymerisation were assumed to be collocated in northern England.
Scenario 1a. It was assumed that ethylene glycol would be manufactured, as
at present, from fossil fuel in The Netherlands and transported 600 km by ship
to the UK polymerisation plant.
Scenario 1b. Here, it was envisaged that ethylene glycol would be produced
from sugarcane bioethanol in Sao Paulo, Brazil and then transported 10000
km by ship to the UK (scenario 1b). While a 200 kt/y ethanol to ethylene
dehydration plant does exist in Brazil, it is currently producing ethylene for
polyethylene (Braskem, 2014).
Scenario 1c. The assumption is that ethylene glycol would be produced in the
UK from willow bioethanol, with the willow being grown and processed in the
UK.
In all UK scenarios, it was assumed that PET resin would be transported by road an
average distance of 300 km to bottle moulding and filling facilities and a further
150 km to supermarkets via distribution centres.
52
Case 2: Manufacture of PET in the USA
The continuous and solid state polymerisation plants were assumed to be located in
South Carolina. Terephthalic acid would be transported 650 km by rail from its site of
manufacture in Alabama to the polymerisation facilities.
Scenario 2a. This represents the conventional production of ethylene glycol
made from fossil fuel in Texas, with the glycol transported 1500 km to the PET
facilities.
Scenario 2b. This is the same as Scenario 1b, above, except that the glycol is
transported 9200 km by ship to South Carolina.
In both US scenarios, it was assumed that PET pellets would be transported on
average 1000 km by road to various bottle moulding and filling facilities, and a further
750 km by road to distribution centres for supermarkets.
In practice, owing to the diversity of supply chains, these scenarios (1a, 1b, 1c, 2a,
and 2b) are only indicative of a supply chain for a PET CSD bottle. However, the
scenarios have been chosen to capture the majority of the environmental impacts
associated from the transportation of materials.
4.3 Results
4.3.1 Savings on an Ethylene basis
The savings to global warming potential and non-renewable energy use on the basis
of 1 kg of ethylene are first assessed before the investigating the net effect for the
entire value chain. For this part of the analysis, ethylene is produced as described for
scenarios 1a (from conventional fossil fuels) and 1b (from sugarcane bioethanol).
As can be seen from Figure 4.3, producing ethylene from biomass can deliver
significant savings to the measures shown. It is more important, however, to
understand the net benefit of such process modifications within the context of the
entire value chain; this is discussed next.
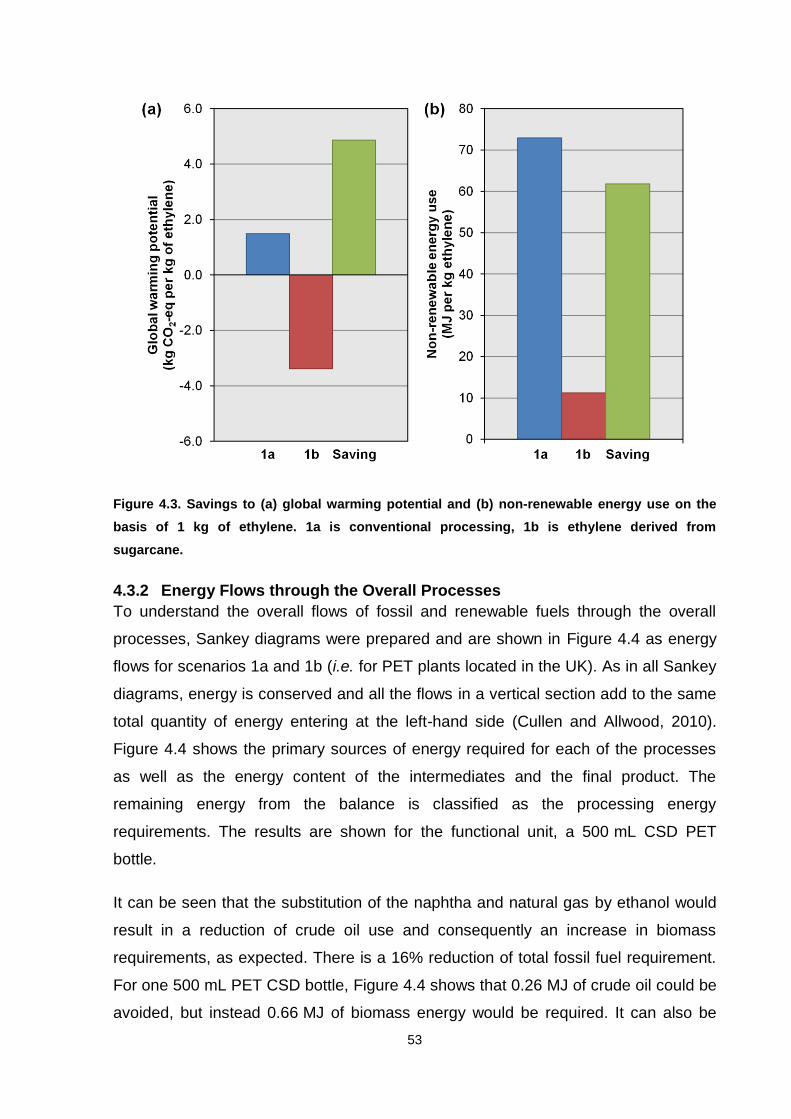
53
Figure 4.3. Savings to (a) global warming potential and (b) non-renewable energy use on the
basis of 1 kg of ethylene. 1a is conventional processing, 1b is ethylene derived from
sugarcane.
4.3.2 Energy Flows through the Overall Processes
To understand the overall flows of fossil and renewable fuels through the overall
processes, Sankey diagrams were prepared and are shown in Figure 4.4 as energy
flows for scenarios 1a and 1b (i.e. for PET plants located in the UK). As in all Sankey
diagrams, energy is conserved and all the flows in a vertical section add to the same
total quantity of energy entering at the left-hand side (Cullen and Allwood, 2010).
Figure 4.4 shows the primary sources of energy required for each of the processes
as well as the energy content of the intermediates and the final product. The
remaining energy from the balance is classified as the processing energy
requirements. The results are shown for the functional unit, a 500 mL CSD PET
bottle.
It can be seen that the substitution of the naphtha and natural gas by ethanol would
result in a reduction of crude oil use and consequently an increase in biomass
requirements, as expected. There is a 16% reduction of total fossil fuel requirement.
For one 500 mL PET CSD bottle, Figure 4.4 shows that 0.26 MJ of crude oil could be
avoided, but instead 0.66 MJ of biomass energy would be required. It can also be
54
seen that scenario 1b, in total, would need 16% more energy to produce the same
bottle.
Figure 4.5 shows the total energy requirements in each scenario as well as energy
requirements grouped by type, renewable and non-renewable. Comparing the other
bioethanol scenarios, 1c with 1a and 2b with 2a, there would be a 16% reduction in
fossil fuel use and a 16% increase in the total energy requirements. An important
result from Figures 4.4 and 4.5 is that the conversion of bioethanol to ethylene would
have, relative to the other processes, a small energy requirement, which would not
affect, substantially, the overall energy balance. As a result, the global warming
potential of the process converting bioethanol to ethylene is small, accounting for less
than 3% of the total global warming potential for scenario 1b, and therefore would not
counteract the carbon dioxide savings of using biomass.
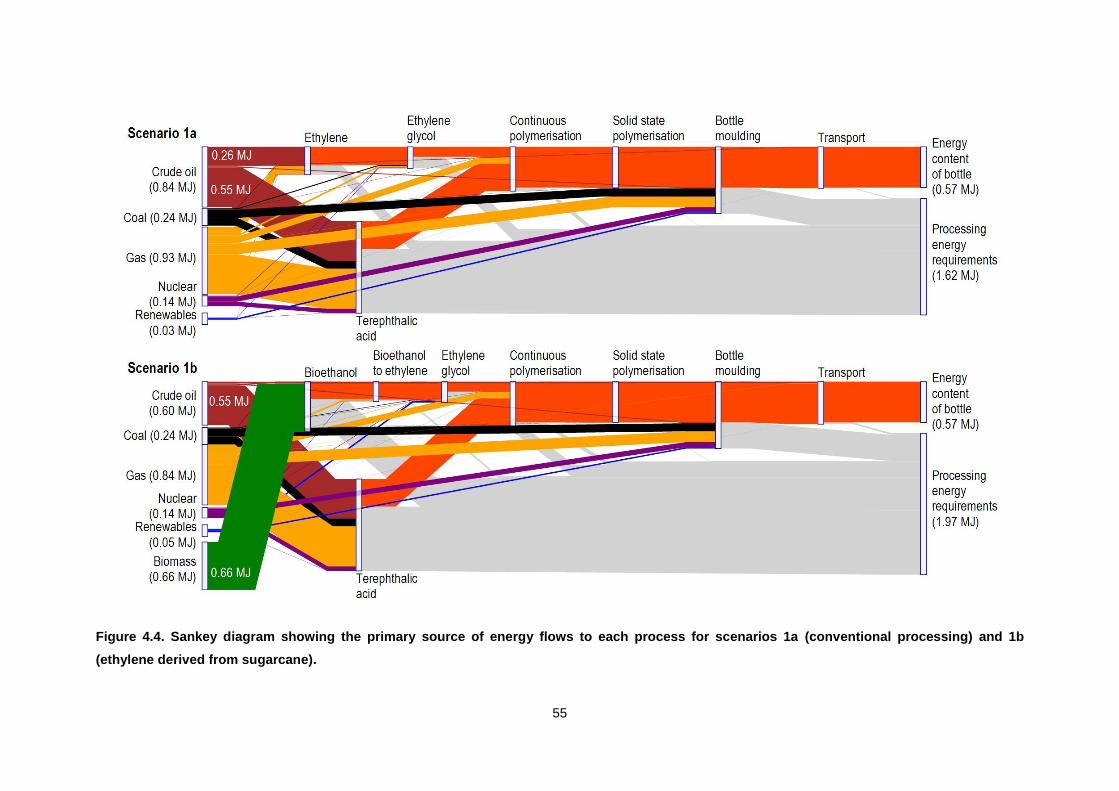
55
Figure 4.4. Sankey diagram showing the primary source of energy flows to each process for scenarios 1a (conventional processing) and 1b
(ethylene derived from sugarcane).
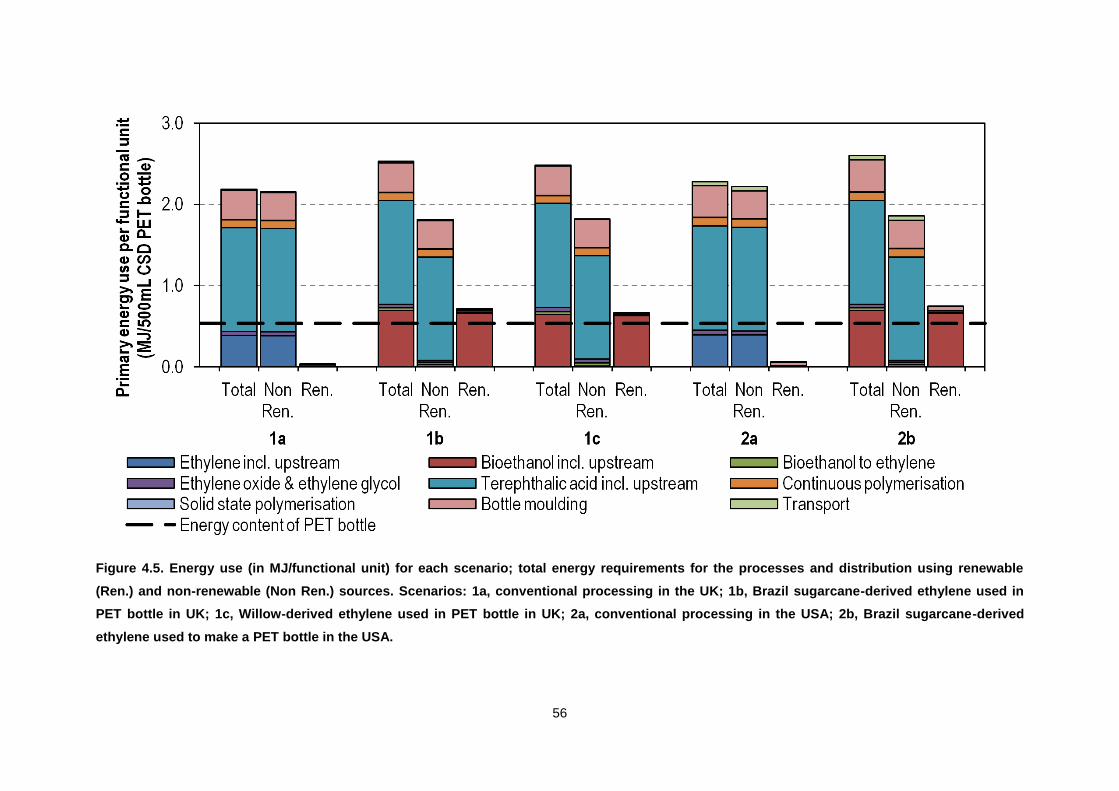
56
Figure 4.5. Energy use (in MJ/functional unit) for each scenario; total energy requirements for the processes and distribution using renewable
(Ren.) and non-renewable (Non Ren.) sources. Scenarios: 1a, conventional processing in the UK; 1b, Brazil sugarcane-derived ethylene used in
PET bottle in UK; 1c, Willow-derived ethylene used in PET bottle in UK; 2a, conventional processing in the USA; 2b, Brazil sugarcane-derived
ethylene used to make a PET bottle in the USA.
57
4.3.3 Impact Assessment
The results of the impact assessment are presented on the basis of the functional
unit chosen, a 500 mL CSD PET bottle. The impact categories used were defined in
Table 3.1. Figure 4.6 shows the performance of scenarios 1b, 1c, 2a, and 2b relative
to scenario 1a for the impact categories: fossil abiotic depletion potential, acidification
potential, eutrophication potential, global warming potential and marine aquatic
ecotoxicity potential. It can be seen that using sugarcane bioethanol would cause a
reduction in the impact categories of global warming potential and fossil abiotic
depletion potential compared with using ethylene from naphtha and natural gas.
However, in every other impact category, there would be an increase were
sugarcane bioethanol to be used. For the willow bioethanol, the difference for each
impact category when compared to the conventional feedstock would be less
significant than with ethanol from cane sugar.
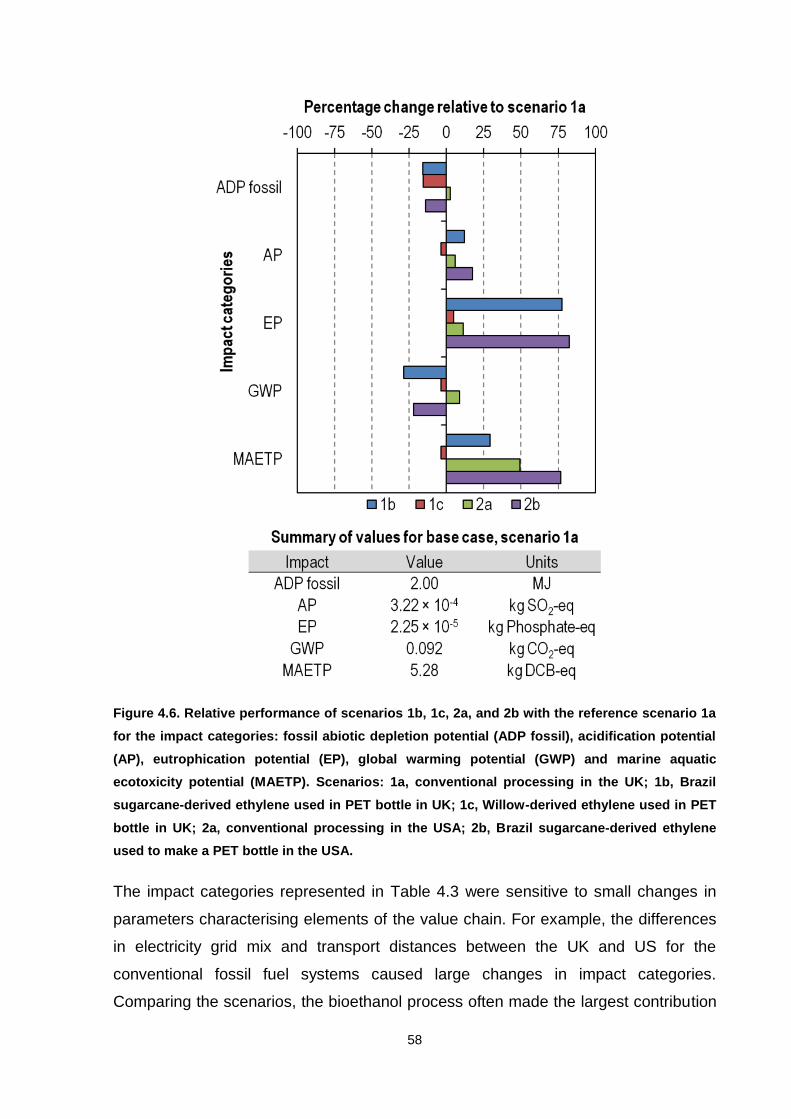
58
Figure 4.6. Relative performance of scenarios 1b, 1c, 2a, and 2b with the reference scenario 1a
for the impact categories: fossil abiotic depletion potential (ADP fossil), acidification potential
(AP), eutrophication potential (EP), global warming potential (GWP) and marine aquatic
ecotoxicity potential (MAETP). Scenarios: 1a, conventional processing in the UK; 1b, Brazil
sugarcane-derived ethylene used in PET bottle in UK; 1c, Willow-derived ethylene used in PET
bottle in UK; 2a, conventional processing in the USA; 2b, Brazil sugarcane-derived ethylene
used to make a PET bottle in the USA.
The impact categories represented in Table 4.3 were sensitive to small changes in
parameters characterising elements of the value chain. For example, the differences
in electricity grid mix and transport distances between the UK and US for the
conventional fossil fuel systems caused large changes in impact categories.
Comparing the scenarios, the bioethanol process often made the largest contribution
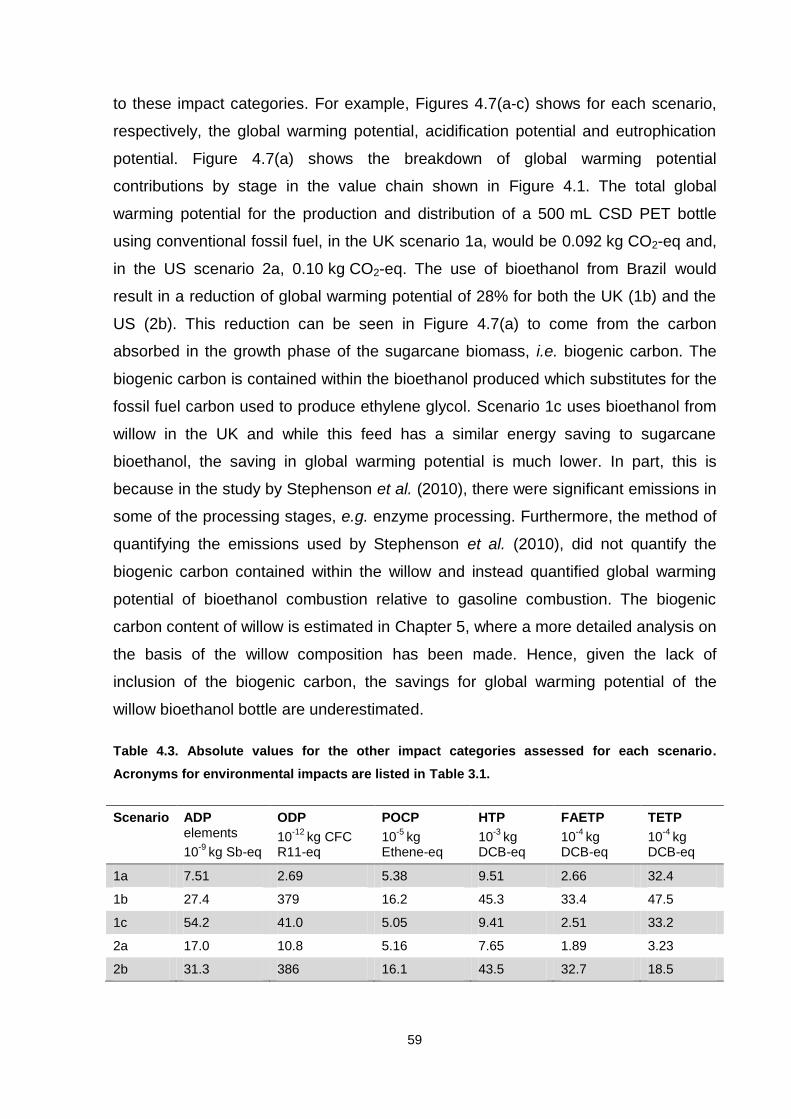
59
to these impact categories. For example, Figures 4.7(a-c) shows for each scenario,
respectively, the global warming potential, acidification potential and eutrophication
potential. Figure 4.7(a) shows the breakdown of global warming potential
contributions by stage in the value chain shown in Figure 4.1. The total global
warming potential for the production and distribution of a 500 mL CSD PET bottle
using conventional fossil fuel, in the UK scenario 1a, would be 0.092 kg CO2-eq and,
in the US scenario 2a, 0.10 kg CO2-eq. The use of bioethanol from Brazil would
result in a reduction of global warming potential of 28% for both the UK (1b) and the
US (2b). This reduction can be seen in Figure 4.7(a) to come from the carbon
absorbed in the growth phase of the sugarcane biomass, i.e. biogenic carbon. The
biogenic carbon is contained within the bioethanol produced which substitutes for the
fossil fuel carbon used to produce ethylene glycol. Scenario 1c uses bioethanol from
willow in the UK and while this feed has a similar energy saving to sugarcane
bioethanol, the saving in global warming potential is much lower. In part, this is
because in the study by Stephenson et al. (2010), there were significant emissions in
some of the processing stages, e.g. enzyme processing. Furthermore, the method of
quantifying the emissions used by Stephenson et al. (2010), did not quantify the
biogenic carbon contained within the willow and instead quantified global warming
potential of bioethanol combustion relative to gasoline combustion. The biogenic
carbon content of willow is estimated in Chapter 5, where a more detailed analysis on
the basis of the willow composition has been made. Hence, given the lack of
inclusion of the biogenic carbon, the savings for global warming potential of the
willow bioethanol bottle are underestimated.
Table 4.3. Absolute values for the other impact categories assessed for each scenario.
Acronyms for environmental impacts are listed in Table 3.1.
Scenario ADP elements
10-9
kg Sb-eq
ODP
10-12
kg CFC R11-eq
POCP
10-5
kg Ethene-eq
HTP
10-3
kg DCB-eq
FAETP
10-4
kg DCB-eq
TETP
10-4
kg DCB-eq
1a 7.51 2.69 5.38 9.51 2.66 32.4
1b 27.4 379 16.2 45.3 33.4 47.5
1c 54.2 41.0 5.05 9.41 2.51 33.2
2a 17.0 10.8 5.16 7.65 1.89 3.23
2b 31.3 386 16.1 43.5 32.7 18.5
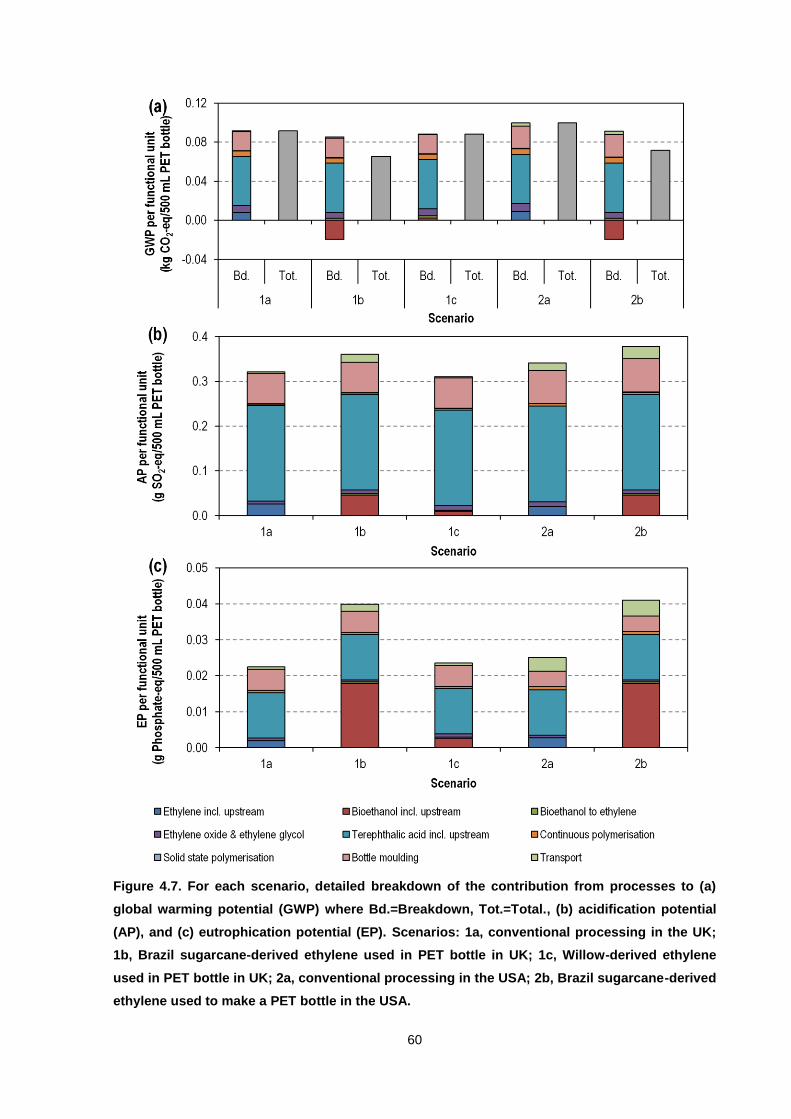
60
Figure 4.7. For each scenario, detailed breakdown of the contribution from processes to (a)
global warming potential (GWP) where Bd.=Breakdown, Tot.=Total., (b) acidification potential
(AP), and (c) eutrophication potential (EP). Scenarios: 1a, conventional processing in the UK;
1b, Brazil sugarcane-derived ethylene used in PET bottle in UK; 1c, Willow-derived ethylene
used in PET bottle in UK; 2a, conventional processing in the USA; 2b, Brazil sugarcane-derived
ethylene used to make a PET bottle in the USA.
61
4.4 Discussion
4.4.1 Interpretation
From the Sankey diagram in Figure 4.4, the substitution of the conventional
feedstock resulted in a reduction of crude oil and natural gas use and consequently
an increase in biomass requirement. Further, the sugarcane biomass route requires
about 16% more energy in total to produce the same bottle, 2.53 MJ compared to
2.19 MJ for scenario 1a. So, whilst there is a beneficial reduction of fossil fuel use by
using sugarcane biomass, there is also lower net energy efficiency in the conversion
processes from biomass relative to the conversion from naphtha and natural gas.
One limiting factor is the efficiency of the conversion of sugars from sugarcane to
ethanol, e.g. maximum theoretical yield of 0.51 kg ethanol per kg glucose. Because
biomass is a renewable energy source, this does not affect the reduction in fossil fuel
energy but it does mean that more biomass needs to be grown. This in turn results in
larger impacts related to agronomy, as well as larger land areas devoted to
sugarcane. Figures 4.4 and 4.5 also reflect the large energy requirements in
terephthalic acid production and bottle moulding, which are energy intensive
processes. As a consequence, Figure 4.7(a) shows that these processes also make
relatively large contributions to the global warming potential. Accordingly, because of
the other processes involved, the global warming potential and fossil fuel energy
savings of using biomass are lost to some extent when considering the end product,
particularly in view of the fact that only 28% by mass of PET is ethylene glycol.
Figures 4.5 and 4.7(a) also demonstrate that transporting materials would contribute
only in a minor way to the total global warming potential and energy requirement.
This important result demonstrates that global-scale supply chains for biomass would
be possible without significantly reducing the environmental impact savings made,
provided the energy dense products, e.g. ethylene glycol, are transported. However,
transport has other impacts, as discussed below.
A problem with using sugarcane ethanol would be an increase in all of the impact
categories, other than global warming potential. Two categories, acidification
potential and eutrophication potential, are examined in more detail in Figures 4.7(b)
and (c). Figure 4.7(b) shows that the acidification potential would increase for the
sugarcane bioethanol scenarios (1b and 2b) compared to the conventional processes
62
(scenarios 1a and 2a). The increase is attributable to both the bioethanol process
and the transport of ethylene glycol over the long distance from Brazil. The
contribution from the bioethanol processes arises in agronomy and particularly in the
manufacture of the required fertilisers. Quirin et al. (2004) also observed this impact
for cultivated biomass. The willow bioethanol, scenario 1c, has a lower acidification
potential; the study of Stephenson et al. (2010) suggested that synthetic fertilisers
could be avoided in growing willow by using organic sludge from local water
companies.
Figure 4.7(c) examined changes in eutrophication potential, arising largely as a result
of the leaching of fertilisers into natural water courses. Figure 4.7(c) shows that
growing sugar cane would be particularly troublesome in this respect. However, in
contrast to sugarcane, the willow biomass does not need high applications of
synthetic fertiliser and consequently its growth would not contribute significantly to
eutrophication. Transport is taken to affect eutrophication as a result of the release of
nitrogen oxide emissions from engines and so the large transportation distances from
Brazil to UK or US also contribute to the eutrophication category for sugarcane
ethanol. The process of conversion of bioethanol to ethylene, however, makes a
negligible contribution to the acidification and eutrophication potentials.
4.4.2 Sensitivity
The sensitivity of using two different sources of bioethanol – from sugar cane and
willow – has been demonstrated with scenarios 1b and 1c in the results. Another
study also showed that deriving ethylene from corn bioethanol, results in an increase
in global warming potential when compared with ethylene from naphtha (+35%) or
natural gas (+60%) (Ghanta et al., 2013). The key difference is the crop used, in this
case, corn, which has fertiliser requirements approximately three times higher than
sugarcane (corn: 149 kg/ha cf. sugarcane: 55 kg/ha) (Ecoinvent Centre, 2010;
Patzek et al., 2005). Furthermore, sugarcane bioethanol has a much higher ratio of
bioenergy energy output (energy contained in bioethanol) to fossil energy input
(energy required to make the bioethanol, including agriculture) when compared to
corn bioethanol, which means that corn is an energy intensive crop and it is therefore
difficult to accomplish the desired reductions in carbon footprint (von Blottnitz and
Curran, 2007).
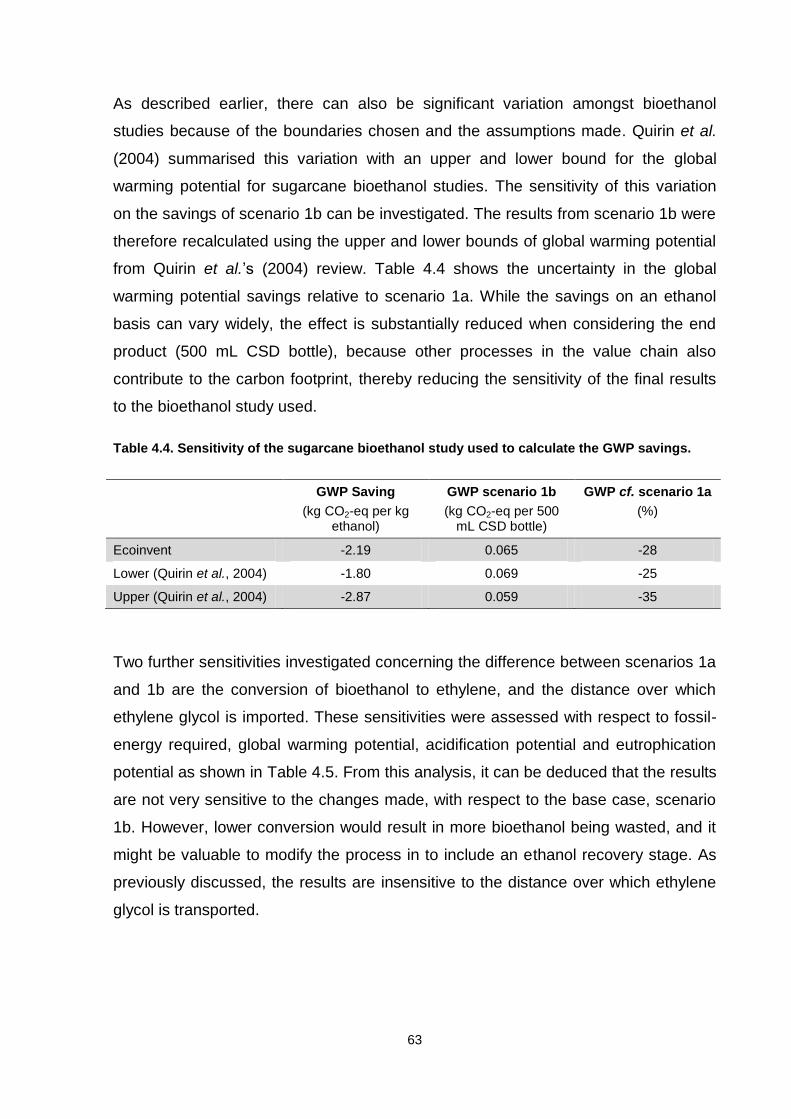
63
As described earlier, there can also be significant variation amongst bioethanol
studies because of the boundaries chosen and the assumptions made. Quirin et al.
(2004) summarised this variation with an upper and lower bound for the global
warming potential for sugarcane bioethanol studies. The sensitivity of this variation
on the savings of scenario 1b can be investigated. The results from scenario 1b were
therefore recalculated using the upper and lower bounds of global warming potential
from Quirin et al.’s (2004) review. Table 4.4 shows the uncertainty in the global
warming potential savings relative to scenario 1a. While the savings on an ethanol
basis can vary widely, the effect is substantially reduced when considering the end
product (500 mL CSD bottle), because other processes in the value chain also
contribute to the carbon footprint, thereby reducing the sensitivity of the final results
to the bioethanol study used.
Table 4.4. Sensitivity of the sugarcane bioethanol study used to calculate the GWP savings.
GWP Saving
(kg CO2-eq per kg ethanol)
GWP scenario 1b
(kg CO2-eq per 500 mL CSD bottle)
GWP cf. scenario 1a
(%)
Ecoinvent -2.19 0.065 -28
Lower (Quirin et al., 2004) -1.80 0.069 -25
Upper (Quirin et al., 2004) -2.87 0.059 -35
Two further sensitivities investigated concerning the difference between scenarios 1a
and 1b are the conversion of bioethanol to ethylene, and the distance over which
ethylene glycol is imported. These sensitivities were assessed with respect to fossil-
energy required, global warming potential, acidification potential and eutrophication
potential as shown in Table 4.5. From this analysis, it can be deduced that the results
are not very sensitive to the changes made, with respect to the base case, scenario
1b. However, lower conversion would result in more bioethanol being wasted, and it
might be valuable to modify the process in to include an ethanol recovery stage. As
previously discussed, the results are insensitive to the distance over which ethylene
glycol is transported.
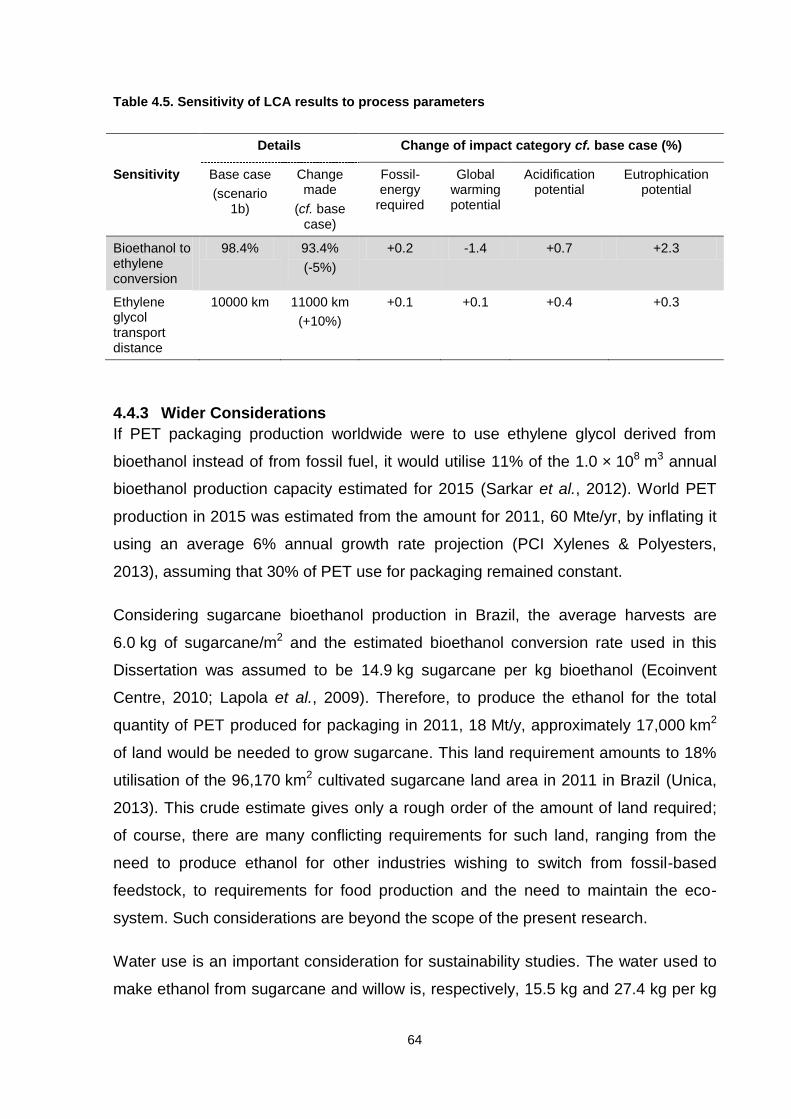
64
Table 4.5. Sensitivity of LCA results to process parameters
Details Change of impact category cf. base case (%)
Sensitivity Base case
(scenario 1b)
Change made
(cf. base case)
Fossil-energy
required
Global warming potential
Acidification potential
Eutrophication potential
Bioethanol to ethylene conversion
98.4% 93.4%
(-5%)
+0.2 -1.4 +0.7 +2.3
Ethylene glycol transport distance
10000 km 11000 km
(+10%)
+0.1 +0.1 +0.4 +0.3
4.4.3 Wider Considerations
If PET packaging production worldwide were to use ethylene glycol derived from
bioethanol instead of from fossil fuel, it would utilise 11% of the 1.0 × 10⁸ m3 annual
bioethanol production capacity estimated for 2015 (Sarkar et al., 2012). World PET
production in 2015 was estimated from the amount for 2011, 60 Mte/yr, by inflating it
using an average 6% annual growth rate projection (PCI Xylenes & Polyesters,
2013), assuming that 30% of PET use for packaging remained constant.
Considering sugarcane bioethanol production in Brazil, the average harvests are
6.0 kg of sugarcane/m2 and the estimated bioethanol conversion rate used in this
Dissertation was assumed to be 14.9 kg sugarcane per kg bioethanol (Ecoinvent
Centre, 2010; Lapola et al., 2009). Therefore, to produce the ethanol for the total
quantity of PET produced for packaging in 2011, 18 Mt/y, approximately 17,000 km2
of land would be needed to grow sugarcane. This land requirement amounts to 18%
utilisation of the 96,170 km2 cultivated sugarcane land area in 2011 in Brazil (Unica,
2013). This crude estimate gives only a rough order of the amount of land required;
of course, there are many conflicting requirements for such land, ranging from the
need to produce ethanol for other industries wishing to switch from fossil-based
feedstock, to requirements for food production and the need to maintain the eco-
system. Such considerations are beyond the scope of the present research.
Water use is an important consideration for sustainability studies. The water used to
make ethanol from sugarcane and willow is, respectively, 15.5 kg and 27.4 kg per kg
65
bioethanol (Ecoinvent Centre, 2010; Stephenson et al., 2010). The water required to
process lignocellulosic biomass is larger, primarily owing to the pre-treatment stages
prior to fermentation. In both cases, no irrigation is required during cultivation. When
comparing scenarios 1b and 1c, with 1a, the total water used was found to be similar,
and the processes for bioethanol accounted for < 10% of the total water used in their
respective scenarios. For scenario 1b, the water use was assessed by excluding the
Brazilian electricity grid mix given that a significant quantity of water is used in
hydroelectric power generation.
A basic economic assessment was performed, based on a reported capital
investment of $278 million by Braskem to construct a plant to produce 200 kt/y
ethylene from bioethanol (Schill, 2010). A capital depreciation allowance, deductable
before tax, of 15% on the total capital investment and a scrap value of 10% of the
capital investment at the end of the 20 years’ plant lifetime was assumed.
Corporation tax, without tax breaks, was estimated at 30% of profit, payable 1 year in
arrears. Based on the process modelling and inventory analysis, 1.7 kg of bioethanol
forms 1.0 kg of ethylene. With current bioethanol and ethylene prices at $674/t
bioethanol and $1,246/t ethylene respectively, the feedstock to product margin made
would be $99/t ethylene (Platts, 2013; Unica, 2013). Other operating expenses were
approximated based on the process modelling and typical costs of the utilities;
however, the analysis showed that these operating expenses would be insignificant
compared to the feedstock costs. The resulting net present value showed a
breakeven point after 20 years of production with a very low interest rate of 3%,
giving no incentive from the industry to invest. The most sensitive parameters in the
analysis were the feedstock and product prices. A hypothetical case can be
calculated to determine the conditions required for such an investment to be
profitable at a desired interest rate of 10% and also deliver an overall rate of return
on the investment of 10%. Increasing the value added margin, by artificially reducing
bioethanol price and increasing ethylene price, both by 22%, would result in the
desired investment criteria being met. Under these conditions, a positive net present
value and payback time would be achieved after 4 years of production.
Such an assessment has illustrated that the economics are sensitive to feedstock
and product price fluctuations owing to the small value-added margins. Incentives
66
such as tax cuts and grants would be necessary because the 22% change in prices
is artificially high and unlikely to occur in the near future. These strategies are
necessary unless the total investment cost can be reduced through further process
integration and economies of scale.
4.4.4 Further Process Improvements
Currently, the production of bioethanol and its conversion to ethylene have been
studied as independent processes. In the former, the ethanol is distilled to a purity of
95 wt%, but in the latter the ethanol would be diluted with water as discussed in
Appendix A. Integration of these processes could therefore reduce the distillation
energy requirements if, for example, a 50 wt% ethanol stream were sent directly to
the ethylene glycol process.
The functional unit defined was a 500 mL CSD bottle made of 23.5 g of PET. There is
potential to reduce the mass to 18 g while maintaining the same performance (De
Miranda et al., 2011). Thus, using 23% less polymer material results in a
commensurate reduction of 23% in all impact categories. With no tradeoffs, this
technique delivers global warming potential reductions similar to those provided by
substituting bioethanol from sugarcane. However, there is a limit to making lighter
bottles without compromising the strength of the bottle. Combining the benefits of
lighter bottles with bioethanol from Brazil, total savings in global warming potential
and use of fossil fuel energy of, respectively, 45% and 35% are possible.
4.5 Conclusion
In this Chapter, the environmental impacts of producing a PET bottle using ethylene
glycol derived from biomass, both sugarcane and willow, were investigated and
compared to conventional ethylene glycol production. The sugars contained in
sugarcane juice were fermented to bioethanol and the cellulosic sugarcane bagasse
was burnt for electricity generation. It was found that, by using sugarcane bioethanol
as a feedstock, the global warming potential and non-renewable resource use for a
PET bottle could be reduced by 28% and 16%, respectively. The main drawback of
using sugarcane as a feedstock is an increase in other environmental impacts, such
as acidification and eutrophication potential. This is largely caused by the cultivation
of the sugarcane, requiring fertilisers. Willow biomass was first deconstructed from
cellulosic biomass to fermentable sugars. Using willow bioethanol as a feedstock
67
could potentially reduce non-renewable resource use by 16%, and did not increase
other environmental impacts as significantly as sugarcane. From the scenario
analysis, the transportation of ethylene glycol from Brazil only resulted in a minor
increase of the environmental impacts.
68
Chapter 5 The Production of p-Xylene from Biomass
Biomass can be used as the principal raw material feedstock for the production of
p-xylene. This Chapter quantifies the environmental impacts of using biomass-
derived p-xylene within the polyester value chain for the production of a PET bottle.
5.1 Introduction
Chapter 4 has shown that producing PET from ethylene glycol derived from
sugarcane reduces fossil carbon emissions by ~28%. The objective of this Chapter is
to study the environmental impact and economic feasibility of using p-xylene
manufactured from biomass, rather than from naphtha, in the production of PET. For
this analysis, a LCA has been undertaken to compare (i) the conventional process
route (viz. with raw materials made from fossil fuel) and (ii) a modified process route
(viz. using p-xylene made from biomass).
Processes have been developed to hydrolyse cellulose and hemi-cellulose biomass
to sugars. Along with sugars already present in the biomass, these hydrolysed
sugars can be catalytically reformed to a range of paraffins, olefins, and aromatics of
similar composition to reformate (Blommel and Cortright, 2008) from which p-xylene
can be isolated using conventional separation techniques (PCI Xylenes & Polyesters,
2013). Reformate is a key intermediate from a catalytic reforming process, typically
containing high octane hydrocarbons, which can either be used in gasoline or as the
main feedstock for an aromatics unit, because it contains a high proportion of
benzene, toluene, and xylene. In the present research, it has been assumed that the
subsequent conversion of p-xylene to terephthalic acid would continue to use the
conventional oxidation process. The principal advantage of using biomass to produce
upstream chemicals, such as p-xylene, is that no changes are needed in the existing
downstream processes.
Terephthalic acid accounts for the larger proportion of PET, ~72 wt% of the total
polymer. Given that using biomass for the ethylene glycol, which accounts for the
remaining ~28 wt%, resulted in ~28% reduction of global warming potential and
~16% reduction of fossil fuel use, then bio-sourced terephthalic acid is likely to make
a substantial reduction in carbon emissions for the polymer, provided the savings are
not outweighed by additional emissions from the conversion of biomass to p-xylene.
69
Generally, the cradle-to-gate emissions for the conventional production of
terephthalic acid from naphtha results in carbon emissions of the order of 2.4-
3.1 kg CO2-eq per kg of purified terephthalic acid (Boustead, 2005; Li et al., 2014).
The range reflects the differences between studies and, particularly, system
boundaries used. In total, ~60 MJ of energy is required to produce one kg of purified
terephthalic acid, almost exclusively (~99.5% of the total energy) from fossil fuel
sources (Boustead, 2005); this includes both processing energy and energy
contained within terephthalic acid. It has been shown (Li et al., 2014) that
improvements in terephthalic acid processing can reduce cradle-to-gate carbon
emissions by between 4% and 24% from the upper 3.1 kg CO2-eq; however, a
substantial part of the emissions is associated with the preparation of the raw
materials for the terephthalic process associated with resource extraction and the
production of naphtha and p-xylene. Of course, if the starting material were biomass,
significant processing would also be required to convert this to the raw materials
needed for terephthalic acid production.
The research presented here investigates, for the first time, the environmental
impacts of converting the biomass to sugars and subsequent catalytic reduction of
the sugars to reformate. There are differences in the unit operations required to
produce sugars from different types of biomass. Accordingly, a number of different
crops have been investigated, namely sugarcane juice, cellulosic wastes, sugarcane
bagasse, corn stover and willow. As stated in Chapter 2, sugarcane and willow both
show the largest potential for savings in emissions of carbon. Corn stover was also
included in this study because it is an abundant source of biomass in the USA. US
corn bioethanol is one of the world’s largest sources for bioethanol, at 57% of global
bioethanol production. However, its performance with respect to different
environmental impacts is worse than sugarcane in a number of categories (Quirin et
al., 2004).
5.2 Analysis
5.2.1 Goal and Scope
For the reasons explained in Chapter 4, the analysis in the present Chapter
concentrates on bottle-grade material. The LCA undertaken in this Chapter also does
not include recycling or disposal, since the aim was to compare the impact of
70
different raw materials for the production of terephthalic acid on virgin PET. End-of-
life scenarios for PET are assessed separately in Chapter 7. The functional unit was
defined as one 500 mL CSD PET bottle after distribution to a supermarket. The mass
of PET used to make the bottle was assumed to be 23.5 g.
5.2.2 Value Chain
The processes involved in the production of PET bottles from (i) conventional fossil-
fuel sources and (ii) using p-xylene derived from biomass, are shown in Figure 5.1,
with the difference between the routes being in the production of p-xylene. Using
conventional technology, p-xylene is one of several products formed from the
catalytic reforming of naphtha. Biomass is, in the case of cellulosic biomass, first
converted to a solution of sugars (Davis et al., 2013), and then catalytically reformed
to a product of similar composition to reformate derived from naphtha in conventional
p-xylene production (Blommel and Cortright, 2008). The same separation processes
as used in conventional p-xylene production can then be used to isolate a stream rich
in p-xylene. The p-xylene, irrespective of starting material, is then oxidised to
terephthalic acid. The second raw material, ethylene glycol, is, in the initial analysis,
produced using conventional techniques, from naphtha and natural gas, oxidation to
ethylene oxide and hydrolysed to ethylene glycol, as described in Chapter 4.
Purified terephthalic acid and ethylene glycol are combined in the continuous
polymerisation process, which is followed by the solid-state polymerisation stage.
The bottle-grade PET is used to make bottles, which are filled and distributed. As the
focus of this study is the impact of using biomass to produce, ultimately, the p-xylene,
the models from Chapter 4 concerning the environmental impacts of the production of
ethylene glycol, polymerisation and bottle moulding have been used.
For the inventory analysis, quantitative mass and energy balances were performed
for the processes defined within the system. The detailed process flowsheeting and
sample calculations for the methods of allocation are described in Appendix B.
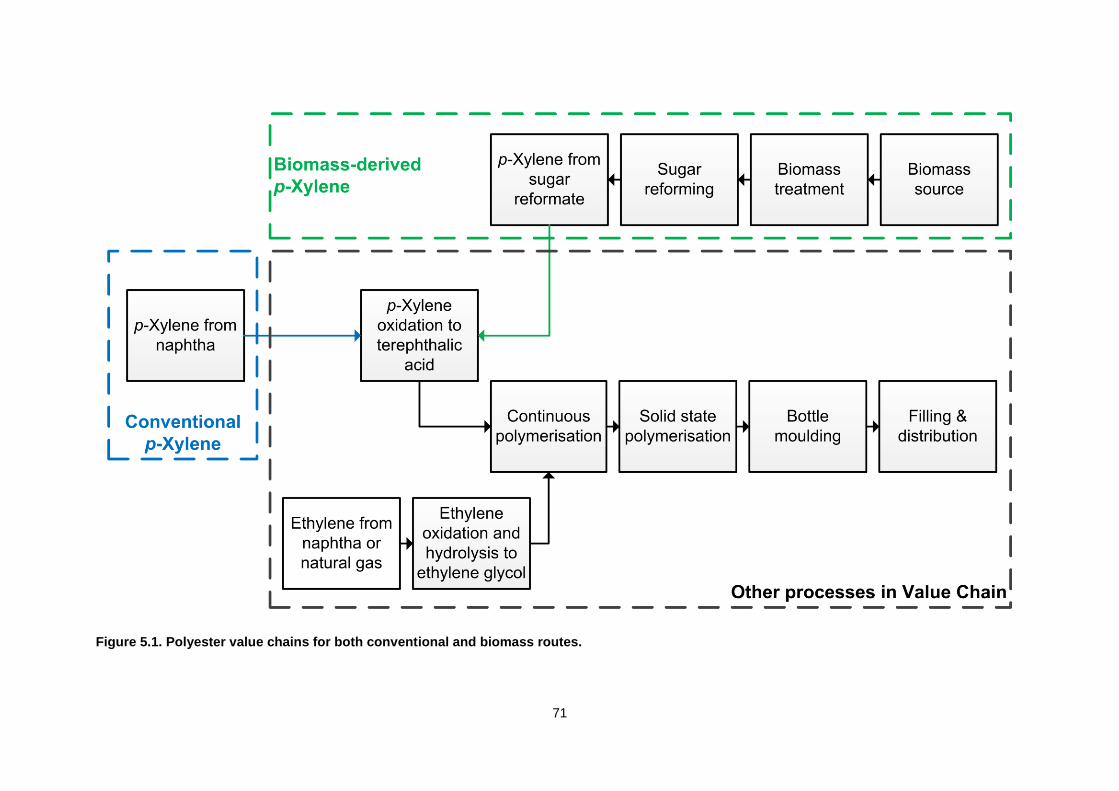
71
Figure 5.1. Polyester value chains for both conventional and biomass routes.

72
The processes shown in Figure 5.2 represent the processes included in the system
boundary for p-xylene production from biomass. The processes, such as the
electricity mix and waste water treatment, form part of the background system,
processes which are influenced by measures taken in the foreground system.
Figure 5.2. The system boundary definition for p-xylene production from biomass.
5.2.3 Allocation
Some of the processes described in Appendix B required allocation. While the details
of, and sample calculations on, the allocation methods can be found in Appendix B,
the rationale for using allocation is described here.
The conventional production of p-xylene from naphtha is a multi-product process.
There is a high level of integration within the process, e.g. heat integration, such that
it is not possible to identify the relationships between the products and feeds. It was
also not possible to redraw or expand the system boundaries for this analysis (the
preferred method). Allocation was therefore required. Economic and mass-based
allocation methods were used so that the sensitivity to the method of allocation could
be investigated later. Mass-based allocation makes use of the mass balances for the
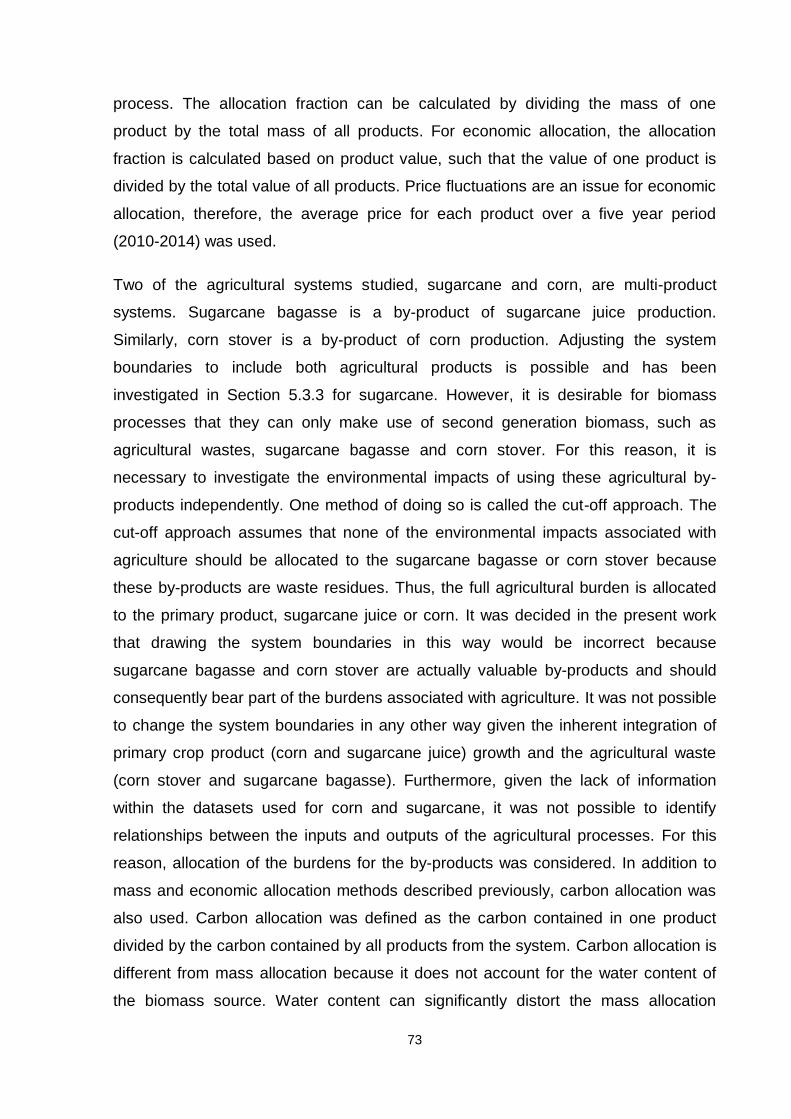
73
process. The allocation fraction can be calculated by dividing the mass of one
product by the total mass of all products. For economic allocation, the allocation
fraction is calculated based on product value, such that the value of one product is
divided by the total value of all products. Price fluctuations are an issue for economic
allocation, therefore, the average price for each product over a five year period
(2010-2014) was used.
Two of the agricultural systems studied, sugarcane and corn, are multi-product
systems. Sugarcane bagasse is a by-product of sugarcane juice production.
Similarly, corn stover is a by-product of corn production. Adjusting the system
boundaries to include both agricultural products is possible and has been
investigated in Section 5.3.3 for sugarcane. However, it is desirable for biomass
processes that they can only make use of second generation biomass, such as
agricultural wastes, sugarcane bagasse and corn stover. For this reason, it is
necessary to investigate the environmental impacts of using these agricultural by-
products independently. One method of doing so is called the cut-off approach. The
cut-off approach assumes that none of the environmental impacts associated with
agriculture should be allocated to the sugarcane bagasse or corn stover because
these by-products are waste residues. Thus, the full agricultural burden is allocated
to the primary product, sugarcane juice or corn. It was decided in the present work
that drawing the system boundaries in this way would be incorrect because
sugarcane bagasse and corn stover are actually valuable by-products and should
consequently bear part of the burdens associated with agriculture. It was not possible
to change the system boundaries in any other way given the inherent integration of
primary crop product (corn and sugarcane juice) growth and the agricultural waste
(corn stover and sugarcane bagasse). Furthermore, given the lack of information
within the datasets used for corn and sugarcane, it was not possible to identify
relationships between the inputs and outputs of the agricultural processes. For this
reason, allocation of the burdens for the by-products was considered. In addition to
mass and economic allocation methods described previously, carbon allocation was
also used. Carbon allocation was defined as the carbon contained in one product
divided by the carbon contained by all products from the system. Carbon allocation is
different from mass allocation because it does not account for the water content of
the biomass source. Water content can significantly distort the mass allocation
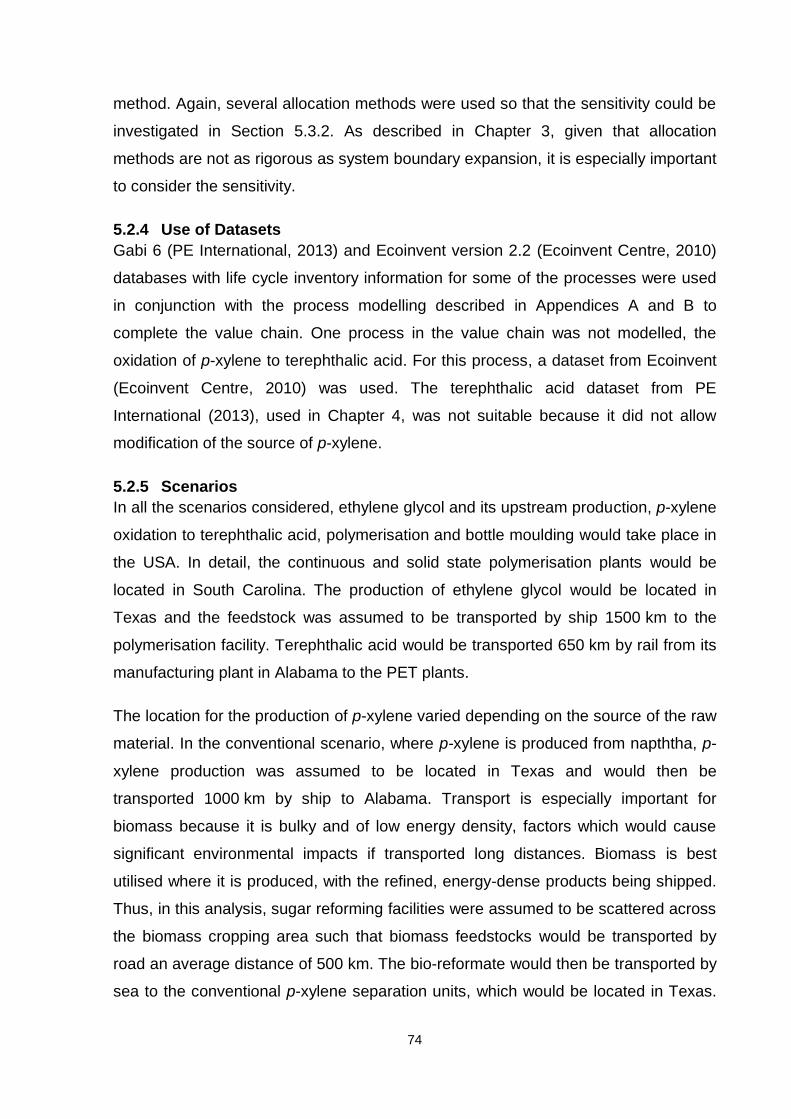
74
method. Again, several allocation methods were used so that the sensitivity could be
investigated in Section 5.3.2. As described in Chapter 3, given that allocation
methods are not as rigorous as system boundary expansion, it is especially important
to consider the sensitivity.
5.2.4 Use of Datasets
Gabi 6 (PE International, 2013) and Ecoinvent version 2.2 (Ecoinvent Centre, 2010)
databases with life cycle inventory information for some of the processes were used
in conjunction with the process modelling described in Appendices A and B to
complete the value chain. One process in the value chain was not modelled, the
oxidation of p-xylene to terephthalic acid. For this process, a dataset from Ecoinvent
(Ecoinvent Centre, 2010) was used. The terephthalic acid dataset from PE
International (2013), used in Chapter 4, was not suitable because it did not allow
modification of the source of p-xylene.
5.2.5 Scenarios
In all the scenarios considered, ethylene glycol and its upstream production, p-xylene
oxidation to terephthalic acid, polymerisation and bottle moulding would take place in
the USA. In detail, the continuous and solid state polymerisation plants would be
located in South Carolina. The production of ethylene glycol would be located in
Texas and the feedstock was assumed to be transported by ship 1500 km to the
polymerisation facility. Terephthalic acid would be transported 650 km by rail from its
manufacturing plant in Alabama to the PET plants.
The location for the production of p-xylene varied depending on the source of the raw
material. In the conventional scenario, where p-xylene is produced from napththa, p-
xylene production was assumed to be located in Texas and would then be
transported 1000 km by ship to Alabama. Transport is especially important for
biomass because it is bulky and of low energy density, factors which would cause
significant environmental impacts if transported long distances. Biomass is best
utilised where it is produced, with the refined, energy-dense products being shipped.
Thus, in this analysis, sugar reforming facilities were assumed to be scattered across
the biomass cropping area such that biomass feedstocks would be transported by
road an average distance of 500 km. The bio-reformate would then be transported by
sea to the conventional p-xylene separation units, which would be located in Texas.
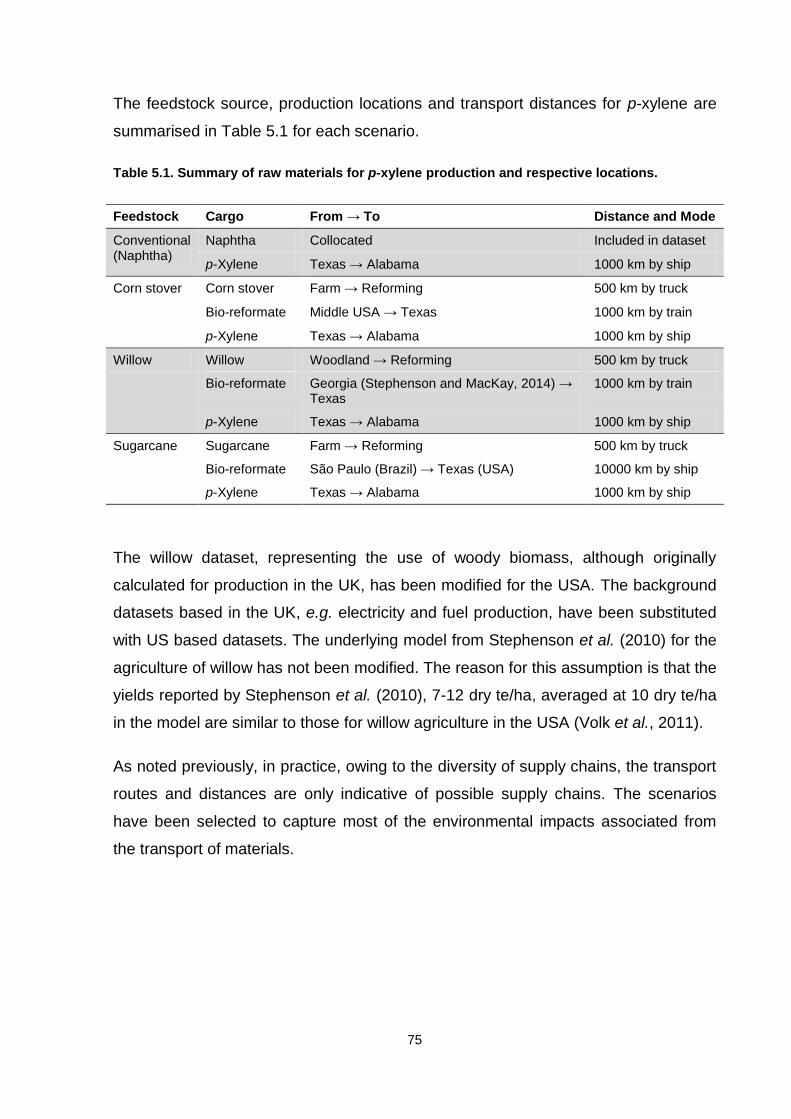
75
The feedstock source, production locations and transport distances for p-xylene are
summarised in Table 5.1 for each scenario.
Table 5.1. Summary of raw materials for p-xylene production and respective locations.
Feedstock Cargo From → To Distance and Mode
Conventional (Naphtha)
Naphtha Collocated Included in dataset
p-Xylene Texas → Alabama 1000 km by ship
Corn stover Corn stover Farm → Reforming 500 km by truck
Bio-reformate Middle USA → Texas 1000 km by train
p-Xylene Texas → Alabama 1000 km by ship
Willow Willow Woodland → Reforming 500 km by truck
Bio-reformate Georgia (Stephenson and MacKay, 2014) → Texas
1000 km by train
p-Xylene Texas → Alabama 1000 km by ship
Sugarcane Sugarcane Farm → Reforming 500 km by truck
Bio-reformate São Paulo (Brazil) → Texas (USA) 10000 km by ship
p-Xylene Texas → Alabama 1000 km by ship
The willow dataset, representing the use of woody biomass, although originally
calculated for production in the UK, has been modified for the USA. The background
datasets based in the UK, e.g. electricity and fuel production, have been substituted
with US based datasets. The underlying model from Stephenson et al. (2010) for the
agriculture of willow has not been modified. The reason for this assumption is that the
yields reported by Stephenson et al. (2010), 7-12 dry te/ha, averaged at 10 dry te/ha
in the model are similar to those for willow agriculture in the USA (Volk et al., 2011).
As noted previously, in practice, owing to the diversity of supply chains, the transport
routes and distances are only indicative of possible supply chains. The scenarios
have been selected to capture most of the environmental impacts associated from
the transport of materials.
76
5.3 Results
5.3.1 Feedstock Comparison
Figure 5.3(a) shows the global warming potential and Figure 5.3(b) the primary
energy use for a range of scenarios using conventional naphtha and biomass as a
feedstock for p-xylene for the functional unit of a 500 mL CSD PET bottle, defined
earlier. For these results, economic allocation has been used across all scenarios.
For the conventional processing, the results from the 2008 and 2013 process designs
can be compared with the p-xylene dataset from Gabi. All three scenarios have
similar levels of fossil energy requirements at 2.4-2.5 MJ per bottle; however, the
conventional 2008 and 2013 models feature global warming potentials ~20% lower
than the dataset. Because details of the inventory analysis of the p-xylene dataset
from Gabi are not in the public domain, it is difficult to determine the exact reason for
this discrepancy. The differences could arise due to different boundary conditions,
allocation methods, or due to process conditions, e.g. efficiency and catalysts.
Comparing the 2008 and 2013 plant designs, the energy requirements were similar.
Given the similarities in the results from the 2008 and 2013 designs, the biomass
scenarios shown in Figure 5.3 only used the separation model from the 2013 design
to separate p-xylene from the bio-reformate. The four biomass sources are now
compared with the conventional 2013 processing. Referring to Figure 5.3(b) first, it is
immediately obvious that a significant quantity of fossil energy is required to process
the biomass feedstock into bio-(p-xylene). Both corn stover and willow require 96-
98% of the fossil fuel used by the conventional 2013 scenario. While the sugarcane
scenarios require 85-87% of the conventional fossil fuel requirements, this is primarily
attributable to the effect of the Brazilian electricity grid, which uses a larger proportion
of hydroelectric power than the USA (grid mixes are country averages from the Gabi
database). The largest fossil energy requirement for the biomass scenarios is the bio-
reformate process. This includes both the biomass deconstruction and sugar
reforming processes. In detail, hydrogen production accounts for ~40% and electricity
accounts for ~46% of the fossil energy requirements of the bio-reformate process.
The largest electricity requirements are the operations of biomass milling, mechanical
vapour recompression (MVR) evaporation, and hydrogen recovery and compression.
The process heating requirements are satisfied by waste burning and heat
integration. The separation of p-xylene from the bio-reformate requires, in
77
comparison to other processes, very little fossil energy. The total energy for the
biomass scenarios is much greater. A large quantity of biomass energy goes into the
process and requires energy-intensive processing. Overall, in terms of saving fossil
fuel, there is very little benefit in using biomass to make p-xylene.
It is important to note that the renewable biomass energy content of the corn stover
and sugarcane bagasse scenarios are not accurately represented. This is owing to
the economic allocation factor for corn stover and sugarcane bagasse being very
small at 11% and 7% respectively. Thus the biomass energy is being largely
allocated to the higher priced corn and sugarcane juice. Due to this, the sugarcane
juice scenario, with an allocation factor of 93%, has an overestimated renewable
biomass energy content. The same argument applies to the global warming potential
results where the CO2 emission savings for corn stover and sugarcane bagasse are
underrepresented while the savings for sugarcane juice are overrepresented in
Figure 5.3(a). The sensitivity of allocation method is investigated later. The scenario
most accurately represented in Figure 5.3 is therefore the willow scenario because it
avoids the issue of allocation caused by agricultural co-products. The willow scenario
gives a CO2 emission reduction of 32% by using bio-(p-xylene), but only a 2%
reduction of fossil fuel energy. The bio-reformate process is the largest contributor to
global warming potential because of the emissions from the energy intensive
operations listed earlier, as well as the emissions from the waste burning (i.e. burning
lignin, biogas from waste water treatment, and waste gases from reforming) to
generate heat and electricity.
Regarding transport, the impact and energy requirement for each scenario is
relatively small because the transporting of bulky biomass was minimised by having
decentralised bio-reformate production facilities. Energy-dense bio-reformate was
then transported over larger distances.
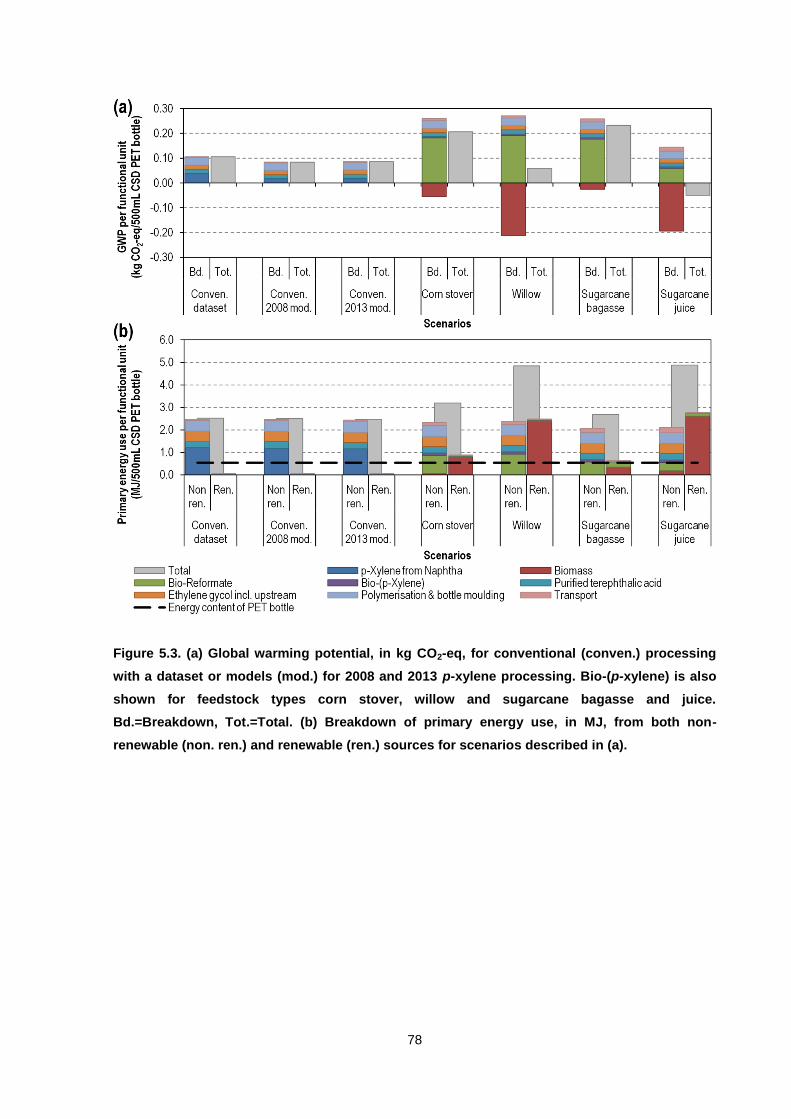
78
Figure 5.3. (a) Global warming potential, in kg CO2-eq, for conventional (conven.) processing
with a dataset or models (mod.) for 2008 and 2013 p-xylene processing. Bio-(p-xylene) is also
shown for feedstock types corn stover, willow and sugarcane bagasse and juice.
Bd.=Breakdown, Tot.=Total. (b) Breakdown of primary energy use, in MJ, from both non-
renewable (non. ren.) and renewable (ren.) sources for scenarios described in (a).
79
5.3.2 Sensitivity to Method of Allocation
Figure 5.4 represents the sensitivity of using different allocation methods in this LCA
on the basis of (a) global warming potential and (b) primary energy use. As discussed
earlier, for the conventional scenario, economic and mass allocation methods were
used. There is very little variation between the economic and mass allocation results
for the conventional scenario, meaning that the results presented in Figure 5.3 using
the economic allocation method are robust. For the willow dataset there is no
allocation issue, as noted earlier.
According to Figure 5.4(b), regardless of allocation method, the fossil energy
requirements are mostly unaffected by method of allocation. However, as shown in
Figure 5.4(a), changing the allocation method can tell a very different story about
greenhouse gas emissions. Using mass-based allocation, the corn stover scenario
appears to make a reduction of 18% to the carbon emission when compared to
conventional processing, yet an increase in carbon emission when using economic
and carbon allocation schemes. The fundamental problem here is that the allocation
method fails to represent accurately the reality of the causal relationship between
CO2 absorbed by the corn and corn stover. The same argument applies to sugarcane
juice and sugarcane bagasse. It is interesting that even with the least favourable
allocation method, using 50% carbon allocation; sugarcane juice presents a
favourable scenario with a 53% reduction in global warming potential and a 17%
reduction of fossil fuel use when compared to the conventional scenario. These
savings are significantly larger than the savings made by using willow biomass
discussed earlier.
A final sensitivity unrelated to allocation was also tested. It was thought that the
cellulase enzyme loading would be significant change in the impact assessment. The
enzyme loading was increased from 10 g of cellulase per kg of cellulose to 26 g of
cellulase per kg cellulose, which was used in the NREL report (Davis et al., 2013).
The sensitivity was investigated for the corn stover scenario using economic
allocation. For a 2.6 fold increase in enzyme loading, the global warming potential
and fossil energy use both increased by ~2%, so enzyme loading does not have a
large effect.
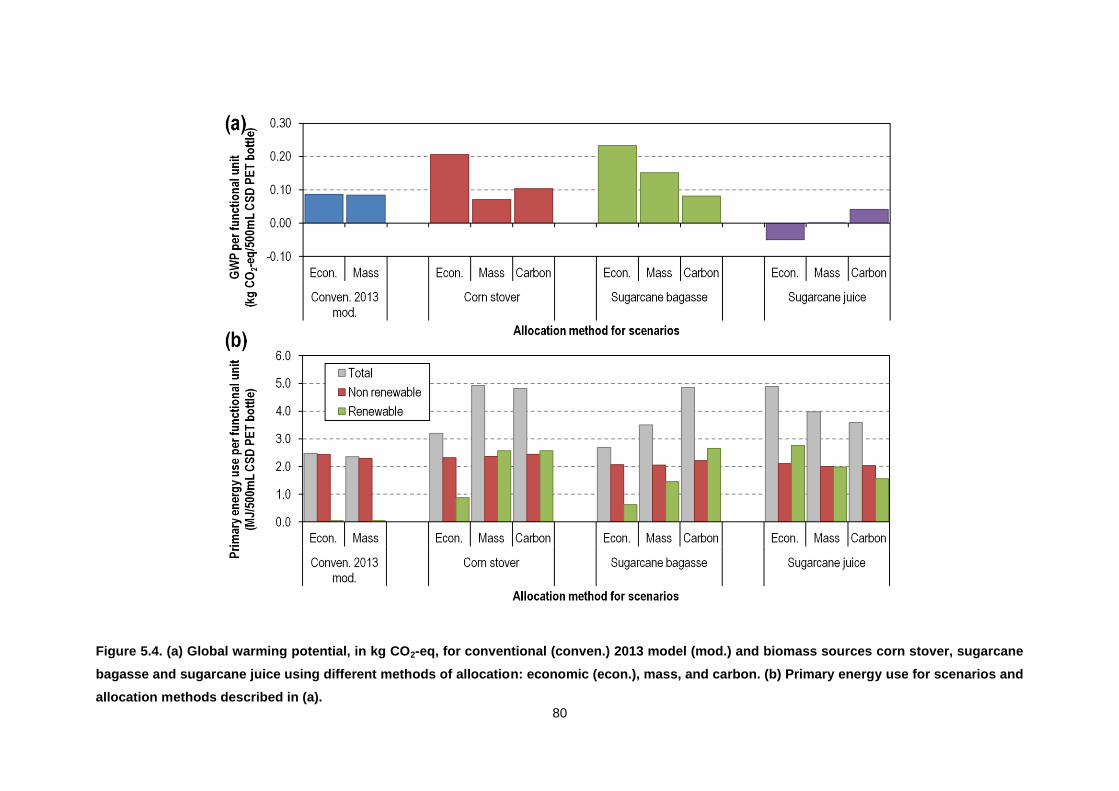
80
Figure 5.4. (a) Global warming potential, in kg CO2-eq, for conventional (conven.) 2013 model (mod.) and biomass sources corn stover, sugarcane
bagasse and sugarcane juice using different methods of allocation: economic (econ.), mass, and carbon. (b) Primary energy use for scenarios and
allocation methods described in (a).
81
5.3.3 Improved Scenarios by Avoiding Allocation
In order to avoid allocation, three additional sugarcane scenarios were investigated
and compared to the conventional 2013 scenario and willow scenario.
The first sugarcane scenario involves deriving bio-reformate from the whole
sugarcane crop, i.e. both 0.72 kg sugarcane juice and 0.28 kg sugarcane
bagasse are used to form bio-reformate. While the sugarcane bagasse would
still require the biomass deconstruction process, the sugarcane juice would be
fed directly into the evaporator to concentrate the sugars before reforming.
The second sugarcane scenario uses sugarcane juice only to form the bio-
reformate, but the sugarcane bagasse is burnt and used to generate electricity
in Brazil with a conversion efficiency of 35%. This scenario receives an
electricity credit equivalent to the grid mix in Brazil.
The third sugarcane scenario uses the second sugarcane scenario described
above (bio-reformate produced from sugarcane juice and electricity generated
from the combustion of sugarcane bagasse), but it also incorporates the
manufacture of bio-(ethylene glycol) from sugarcane bioethanol studied in
Chapter 4. This final scenario represents the impact of generating a ~100%
biomass-sourced bottle from sugarcane.
By using both sugarcane juice and sugarcane bagasse all three of these scenarios
manage to avoid allocation issues between the juice and bagasse by instead
expanding the system boundary thereby reflecting the causal relationships
transparently.
The results of these scenarios are shown in Figure 5.5 for the production of a 500 mL
CSD PET bottle for (a) global warming potential, (b) primary energy use, and (c)
eutrophication potential. Each sugarcane scenario presents increased savings in
global warming potential and fossil fuel energy use when compared with the
conventional scenario. The savings become substantial for the case of burning
bagasse, giving an overall 87% reduction global warming potential and 26%
reduction to fossil fuel energy use. Coupled with deriving ethylene glycol from
sugarcane bioethanol, the overall reduction in global warming potential is 114%, i.e.
the system, as defined, is effectively sequestering CO2 from the atmosphere. There
82
is also a reduction of 39% in fossil fuel energy use. However, it is important to realise
that total energy efficiency is much lower when using biomass: a 100% biomass-
sourced bottle uses 81% more energy in total than the conventional route. This is
because biomass enters the processing partially oxidised, typical formula of CnH2nOn,
which requires a substantial amount of energy to effectively hydrogenate and also
incurs a loss of ~30% of the carbon in the sugars to CO2 during the reforming (see
Appendix B).
The overall flows of fossil and renewable fuels through each of the processes in
Figure 5.1 are best understood using the Sankey diagrams, shown in Figure 5.6. Two
scenarios are represented here, the conventional processing and the 100% biomass
bottle from sugarcane. From the Sankey diagrams, the total energy, represented by
the scale of each flow, and energy conversion efficiency for each process is clear.
The burning of bagasse generates 0.48 MJ of electricity, which resulted in a credit
based on the Brazilian electricity grid mix. The large blue renewable flow represents
the substantial amount of hydroelectric power generation in Brazil.
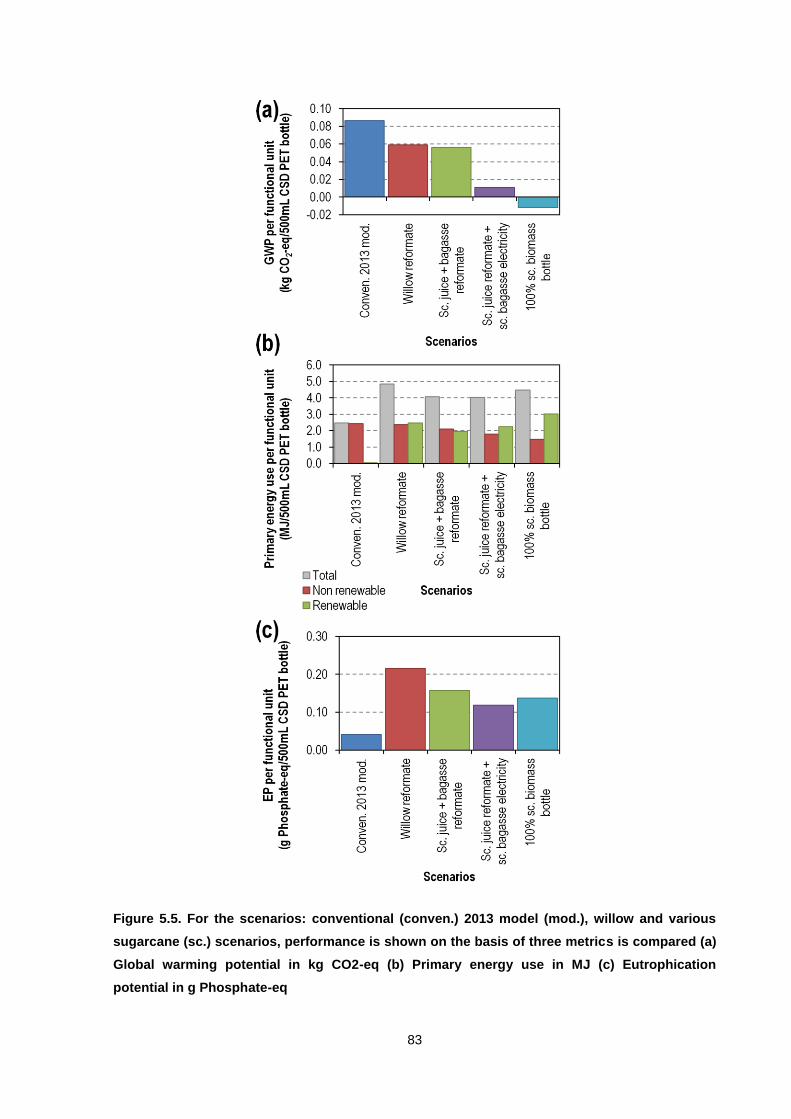
83
Figure 5.5. For the scenarios: conventional (conven.) 2013 model (mod.), willow and various
sugarcane (sc.) scenarios, performance is shown on the basis of three metrics is compared (a)
Global warming potential in kg CO2-eq (b) Primary energy use in MJ (c) Eutrophication
potential in g Phosphate-eq
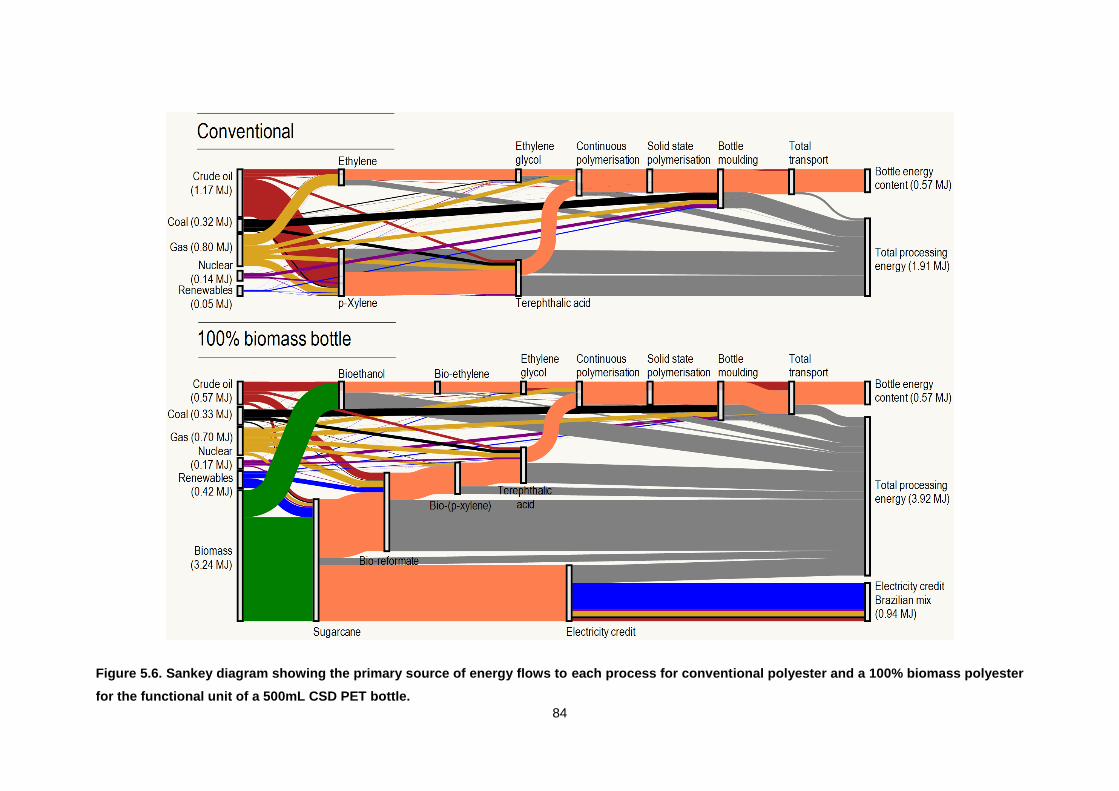
84
Figure 5.6. Sankey diagram showing the primary source of energy flows to each process for conventional polyester and a 100% biomass polyester
for the functional unit of a 500mL CSD PET bottle.
85
Figure 5.5(c) shows the eutrophication potential for each scenario. Eutrophication is
measured in g Phosphate-equivalents and represents the impact of nutrients such as
nitrogen and phosphorous compounds which can cause a shift in species
composition and biomass growth, e.g. algal bloom, which affects the survival of other
species and biodiversity.
In LCA, emissions, for example, small quantities of nitrogen compounds from the
burning of fossil fuels can contribute to eutrophication. For this reason, the
conventional scenario has a small ‘base line’ eutrophication potential. However, it is
the increase which is of interest. For the willow scenario, the production of willow
contributed only 5.5% to the total eutrophication; however, the combustion of
biomass waste in the biomass deconstruction process contributes 72% of the total
impact. For the sugarcane juice and bagasse reformate scenario, growing the
sugarcane contributed 21% to the total eutrophication, and nitrogen compound
emissions from waste combustion contributed to 49% of the impact. While normally
for agricultural products the eutrophication levels are significantly higher due to
fertiliser use, both willow and sugarcane use low quantities of fertilizer. The willow
dataset specifies the use of sewage sludge, which is applied once every three years
(Stephenson et al., 2010). Sugarcane cultivation contributes significantly more to
eutrophication signifying a higher use of fertilizers for this biomass feedstock. The
largest impact of eutrophication in this case, is caused by the burning of the wastes
from the biomass deconstruction process. Nitrogen contained within the biomass and
cells from waste water treatment is released on combustion and contributes to
eutrophication. The overall sugarcane scenarios are lower in eutrophication
compared to the willow scenario due to the use of sugarcane juice which does not go
through the biomass deconstruction phase.
The totals for other environmental impacts categories assessed using the CML
method, which have not been described in detail, are shown in Table B.8 of
Appendix B.
5.4 Discussion
Producing a 500 mL CSD PET bottle only from sugarcane biomass feedstocks and
using the sugarcane bagasse to generate electricity 0.48 MJ of electricity requires a
total of ~0.63 kg sugarcane. At average harvests of 6.0 kg sugarcane/m2, each bottle
86
with the above scenario requires ~0.1 m2 of land (Lapola et al., 2009). For scale,
hypothetically, if all PET packaging in 2013 (65 Mt/y × 30%) was made using
sugarcane, this would require ~520 Mt/y of sugarcane and a land equivalent of
~86,000 km2. To put this in perspective, total sugarcane production in 2013 from
Brazil was ~650 Mt/y. This crude estimate serves to give some order of the
respective amounts of biomass and land required, which would result in significant
competition with food, other land and fuel uses, and biodiversity.
Water use in the production of bioethanol for bio-(ethylene glycol) has been
discussed in the previous Chapter. Regarding agriculture, both sugarcane and willow
are not irrigated and rely on rainfall (Ecoinvent Centre, 2010; Stephenson et al.,
2010). Water use for the biomass deconstruction and sugar reforming processes to
produce bio-reformate from both sugarcane and willow has been assessed. Although
in the biomass deconstruction a significant amount of water is added for the caustic
wash and the acid and enzyme hydrolysis most of this water is recovered in the later
stages of waste water treatment and evaporation. Furthermore, water produced in
the sugar reforming stage can also be recycled into the biomass deconstruction after
separation from the product. Overall, no additional process water is required for the
production of bioreformate.
The production capacity of new conventional p-xylene facilities in 2013-2014 ranged
between 400 and 1000 kt/y (PCI Xylenes & Polyesters, 2013). World p-xylene
production capacity in 2013 is estimated to be ~38 Mt/y and production capacity is
expected to grow by ~15% in 2014 as new units are commissioned, while the
demand growth for p-xylene is ~6% (PCI Xylenes & Polyesters, 2013). Based on
supply and demand growth ratios, in 2014, p-xylene will be in over-supply; this trend
is expected to continue over the next five years as older assets close. Currently,
there are no commercial scale bio-reformate facilities in existence. Given the
projected over-supply of p-xylene, new biomass routes, which typically operate at
significantly smaller scales and are therefore unlikely to benefit from the same
economies of scale, will face significant barriers to entering the current p-xylene
market.
87
5.5 Conclusion
This Chapter, focused on an alternative route for producing p-xylene. Conventionally
p-xylene is derived from naphtha, however, new technologies have enabled p-xylene
to be derived from biomass. In the analysis, cellulosic biomass sources, willow,
sugarcane bagasse and corn stover, would first be deconstructed to a sugars
solution. Sugarcane juice could skip the deconstruction step. All sugar solutions
would then be concentrated prior to entering an aqueous reforming phase in the
presence of hydrogen. In the process, the sugars would form a range of
hydrocarbons similar in composition to reformate. From the reformate, p-xylene could
be extracted and used as a feedstock in PET production.
From the various feedstocks assessed, only willow and sugarcane, with both
sugarcane juice and bagasse included in the system boundary, could be reliably
assessed due to LCA allocation issues. Producing a PET bottle, using p-xylene
derived from willow, could reduce the global warming potential and non-renewable
energy use by 32% and 2% respectively. Using sugarcane juice for p-xylene
production and burning bagasse for electricity generation, resulted in larger savings
to global warming potential (87%) and non-renewable energy use (26%) when
compared with conventional bottle production. The use of biomass within the value
chain did increase all other impact categories, most notably, those for eutrophication
and acidification.
88
Chapter 6 Alternative Uses of Biomass within the PET Value Chain
This Chapter investigates how biomass can be used most efficiently in order to
reduce the global warming potential and non-renewable energy use. Routes
examined are the use of biomass in the production of raw material feedstocks,
ethylene or p-xylene, or the use of biomass as a fuel source for process heat or
electricity production.
6.1 Introduction
Chapters 4 and 5 have shown that the feedstock for the manufacture of PET,
ethylene glycol and p-xylene, can be produced from various types of biomass, such
as sugarcane, willow and corn stover, with the potential for reduced fossil fuel use
and greenhouse gas emissions. The objective of the present Chapter is to investigate
ways in which biomass could be introduced into the polyester value chain, other than
to make ethylene glycol or p-xylene. In particular, the use of biomass as a source of
fuel for (i) process heat or (ii) electricity has been studied. The resulting savings in
global warming potential and fossil fuel have been quantified and compared with
those predicted in Chapters 4 and 5. Conclusions are drawn about the most effective
use of biomass within the polyester value chain.
6.2 Analysis
6.2.1 Goal and Scope
In earlier Chapters, the functional unit was defined as a 500 mL carbonated soft drink
(CSD) PET bottle after distribution to a supermarket. In the present analysis, for
convenience in expressing the quantities of biomass involved, the functional unit has
been scaled up to 1 tonne of PET in bottle form, i.e. the functional unit is ~42,553
CSD PET bottles of 500 mL capacity, with each bottle weighing 23.5 g. The LCA did
not include recycling or disposal, since the aim was to examine virgin PET
production. A consideration of the recycling and disposal of PET is deferred until
Chapter 7.
When considering the most effective use of biomass, the parameter of interest is
quantity of biomass used per unit of saving. As discussed in Chapter 5, the different
types of wet biomass have various energy contents, principally owing to their differing
contents of moisture. Here, the base unit for comparison across all types of biomass
89
is therefore the total energy content of the wet biomass used per unit of saving. The
energy content of the biomass was assumed to scale with cost.
90
6.2.2 Value Chain
The processes involved in the production of PET bottles from conventional fossil-fuel
sources are compared in Figure 6.1 with the following modifications:
(i) ethylene, only, made from biomass,
(ii) p-xylene, only, made from biomass,
(iii) biomass used only for process heating, and
(iv) biomass used solely to generate electricity for the overall process.
Items (i) and (ii) have been considered in Chapters 4 and 5, respectively. As shown
in Figure 6.1, for (iii) and (iv), the background system for process heating or electricity
has been modified from the conventional sourcing to using biomass instead. Two
simple models have been assumed for the generation of process heat or electricity
from biomass. Both models for the combustion of biomass for process heat or
electricity are based on the same underlying assumptions. Biomass was assumed to
combust to near completion; 99.7% of the moles of carbon in the biomass are
converted to carbon dioxide. It is more difficult to assess the quantity of other
emissions such as, SO2 and NOx. An average from typical biomass burners was
assumed for these emissions per MJ of fuel input (Biomass Energy Centre, 2014).
When comparing with other datasets, emission levels were of the same order of
magnitude, but there was considerable variation, even among emissions predicted by
the databases (Ecoinvent Centre, 2010; PE International, 2013). The assumptions
used are summarised in Table 6.1.
Finally, process heat was assumed to be extracted from the burner at an efficiency,
%90InputEnergy Biomass
Output Heat . Electricity was assumed to be generated from the
biomass combustion at an efficiency of 35%, meaning that,
%35InputEnergy Biomass
Outputy Electricit . The efficiency estimates were guided by those
predicted by other databases (Ecoinvent Centre, 2010; PE International, 2013).
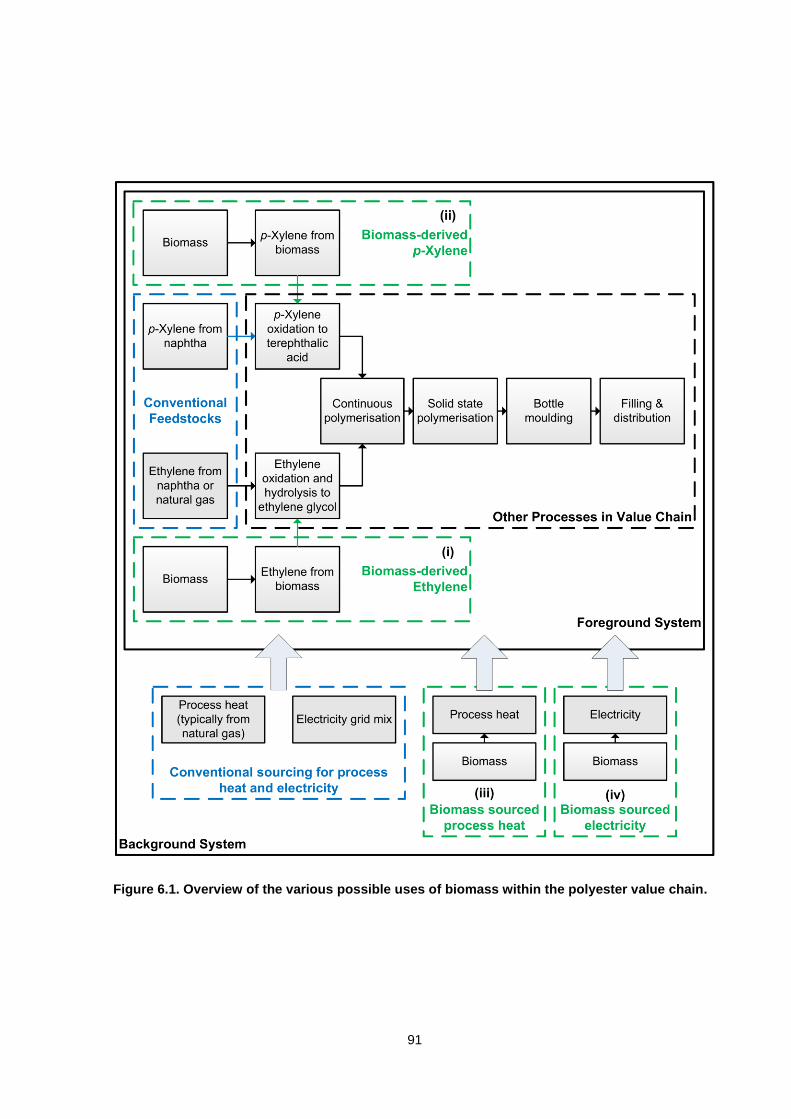
91
Figure 6.1. Overview of the various possible uses of biomass within the polyester value chain.
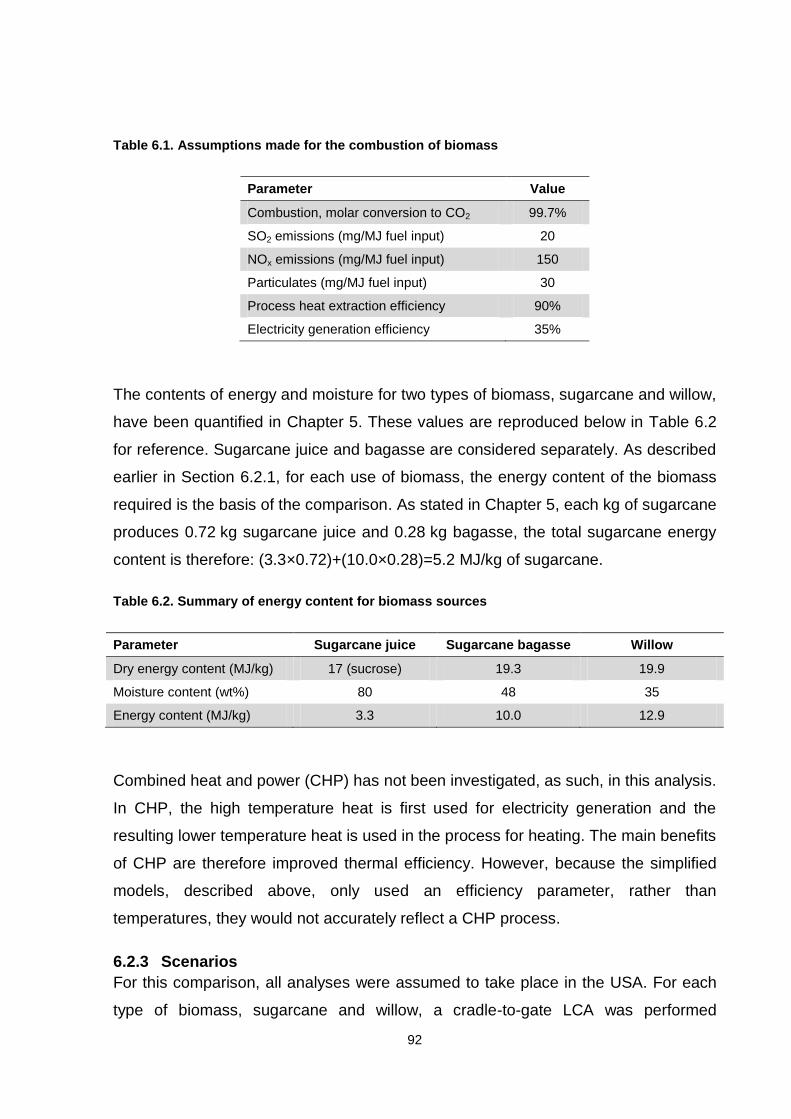
92
Table 6.1. Assumptions made for the combustion of biomass
Parameter Value
Combustion, molar conversion to CO2 99.7%
SO2 emissions (mg/MJ fuel input) 20
NOx emissions (mg/MJ fuel input) 150
Particulates (mg/MJ fuel input) 30
Process heat extraction efficiency 90%
Electricity generation efficiency 35%
The contents of energy and moisture for two types of biomass, sugarcane and willow,
have been quantified in Chapter 5. These values are reproduced below in Table 6.2
for reference. Sugarcane juice and bagasse are considered separately. As described
earlier in Section 6.2.1, for each use of biomass, the energy content of the biomass
required is the basis of the comparison. As stated in Chapter 5, each kg of sugarcane
produces 0.72 kg sugarcane juice and 0.28 kg bagasse, the total sugarcane energy
content is therefore: (3.3×0.72)+(10.0×0.28)=5.2 MJ/kg of sugarcane.
Table 6.2. Summary of energy content for biomass sources
Parameter Sugarcane juice Sugarcane bagasse Willow
Dry energy content (MJ/kg) 17 (sucrose) 19.3 19.9
Moisture content (wt%) 80 48 35
Energy content (MJ/kg) 3.3 10.0 12.9
Combined heat and power (CHP) has not been investigated, as such, in this analysis.
In CHP, the high temperature heat is first used for electricity generation and the
resulting lower temperature heat is used in the process for heating. The main benefits
of CHP are therefore improved thermal efficiency. However, because the simplified
models, described above, only used an efficiency parameter, rather than
temperatures, they would not accurately reflect a CHP process.
6.2.3 Scenarios
For this comparison, all analyses were assumed to take place in the USA. For each
type of biomass, sugarcane and willow, a cradle-to-gate LCA was performed
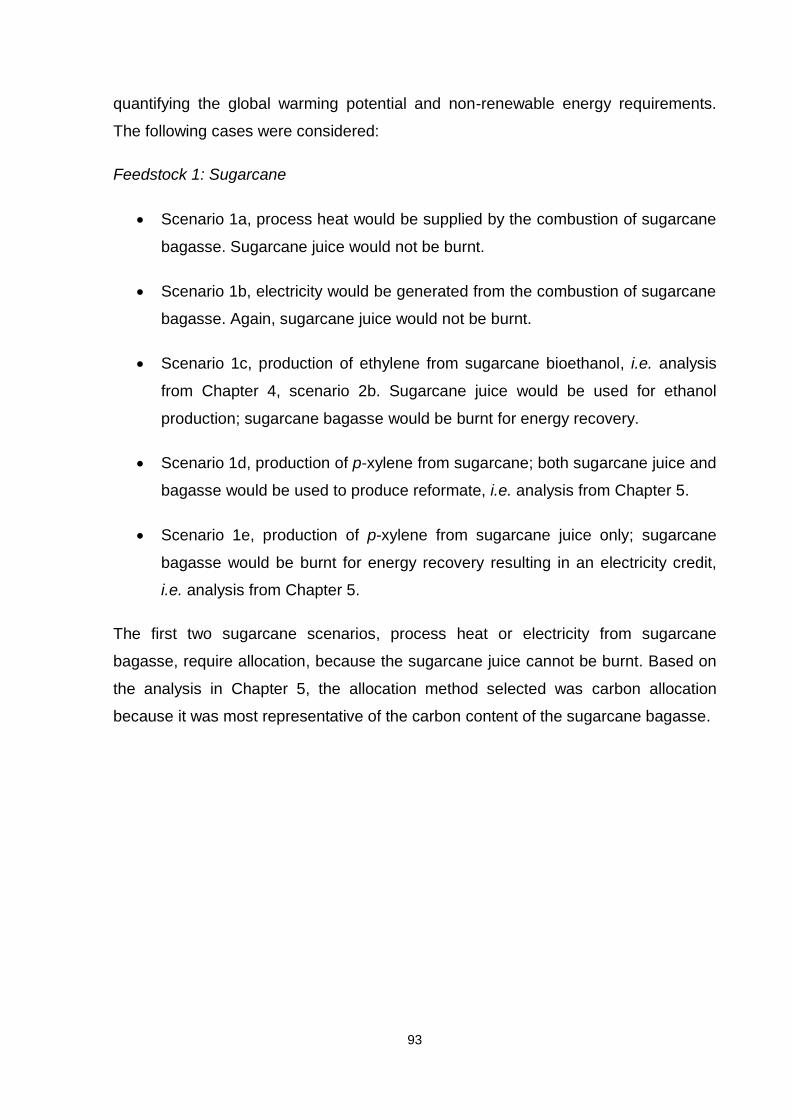
93
quantifying the global warming potential and non-renewable energy requirements.
The following cases were considered:
Feedstock 1: Sugarcane
Scenario 1a, process heat would be supplied by the combustion of sugarcane
bagasse. Sugarcane juice would not be burnt.
Scenario 1b, electricity would be generated from the combustion of sugarcane
bagasse. Again, sugarcane juice would not be burnt.
Scenario 1c, production of ethylene from sugarcane bioethanol, i.e. analysis
from Chapter 4, scenario 2b. Sugarcane juice would be used for ethanol
production; sugarcane bagasse would be burnt for energy recovery.
Scenario 1d, production of p-xylene from sugarcane; both sugarcane juice and
bagasse would be used to produce reformate, i.e. analysis from Chapter 5.
Scenario 1e, production of p-xylene from sugarcane juice only; sugarcane
bagasse would be burnt for energy recovery resulting in an electricity credit,
i.e. analysis from Chapter 5.
The first two sugarcane scenarios, process heat or electricity from sugarcane
bagasse, require allocation, because the sugarcane juice cannot be burnt. Based on
the analysis in Chapter 5, the allocation method selected was carbon allocation
because it was most representative of the carbon content of the sugarcane bagasse.
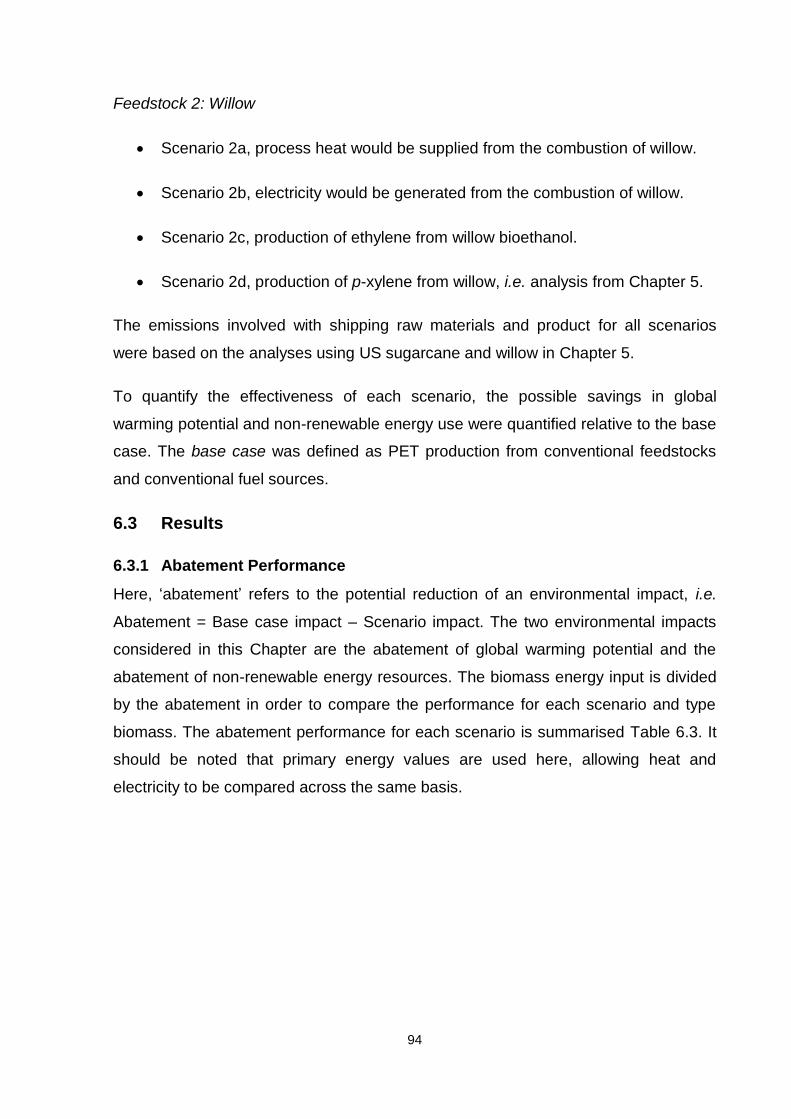
94
Feedstock 2: Willow
Scenario 2a, process heat would be supplied from the combustion of willow.
Scenario 2b, electricity would be generated from the combustion of willow.
Scenario 2c, production of ethylene from willow bioethanol.
Scenario 2d, production of p-xylene from willow, i.e. analysis from Chapter 5.
The emissions involved with shipping raw materials and product for all scenarios
were based on the analyses using US sugarcane and willow in Chapter 5.
To quantify the effectiveness of each scenario, the possible savings in global
warming potential and non-renewable energy use were quantified relative to the base
case. The base case was defined as PET production from conventional feedstocks
and conventional fuel sources.
6.3 Results
6.3.1 Abatement Performance
Here, ‘abatement’ refers to the potential reduction of an environmental impact, i.e.
Abatement = Base case impact – Scenario impact. The two environmental impacts
considered in this Chapter are the abatement of global warming potential and the
abatement of non-renewable energy resources. The biomass energy input is divided
by the abatement in order to compare the performance for each scenario and type
biomass. The abatement performance for each scenario is summarised Table 6.3. It
should be noted that primary energy values are used here, allowing heat and
electricity to be compared across the same basis.
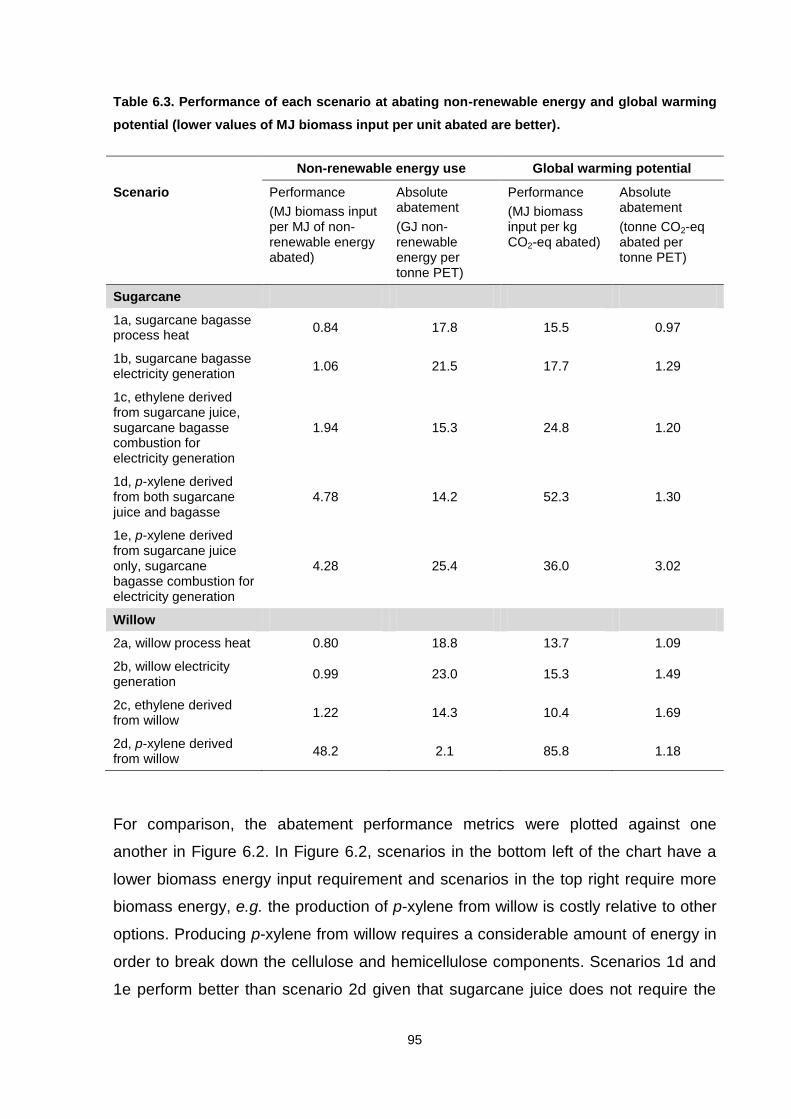
95
Table 6.3. Performance of each scenario at abating non-renewable energy and global warming
potential (lower values of MJ biomass input per unit abated are better).
Non-renewable energy use Global warming potential
Scenario Performance
(MJ biomass input per MJ of non-renewable energy abated)
Absolute abatement
(GJ non-renewable energy per tonne PET)
Performance
(MJ biomass input per kg CO2-eq abated)
Absolute abatement
(tonne CO2-eq abated per tonne PET)
Sugarcane
1a, sugarcane bagasse process heat
0.84 17.8 15.5 0.97
1b, sugarcane bagasse electricity generation
1.06 21.5 17.7 1.29
1c, ethylene derived from sugarcane juice, sugarcane bagasse combustion for electricity generation
1.94 15.3 24.8 1.20
1d, p-xylene derived from both sugarcane juice and bagasse
4.78 14.2 52.3 1.30
1e, p-xylene derived from sugarcane juice only, sugarcane bagasse combustion for electricity generation
4.28 25.4 36.0 3.02
Willow
2a, willow process heat 0.80 18.8 13.7 1.09
2b, willow electricity generation
0.99 23.0 15.3 1.49
2c, ethylene derived from willow
1.22 14.3 10.4 1.69
2d, p-xylene derived from willow
48.2 2.1 85.8 1.18
For comparison, the abatement performance metrics were plotted against one
another in Figure 6.2. In Figure 6.2, scenarios in the bottom left of the chart have a
lower biomass energy input requirement and scenarios in the top right require more
biomass energy, e.g. the production of p-xylene from willow is costly relative to other
options. Producing p-xylene from willow requires a considerable amount of energy in
order to break down the cellulose and hemicellulose components. Scenarios 1d and
1e perform better than scenario 2d given that sugarcane juice does not require the
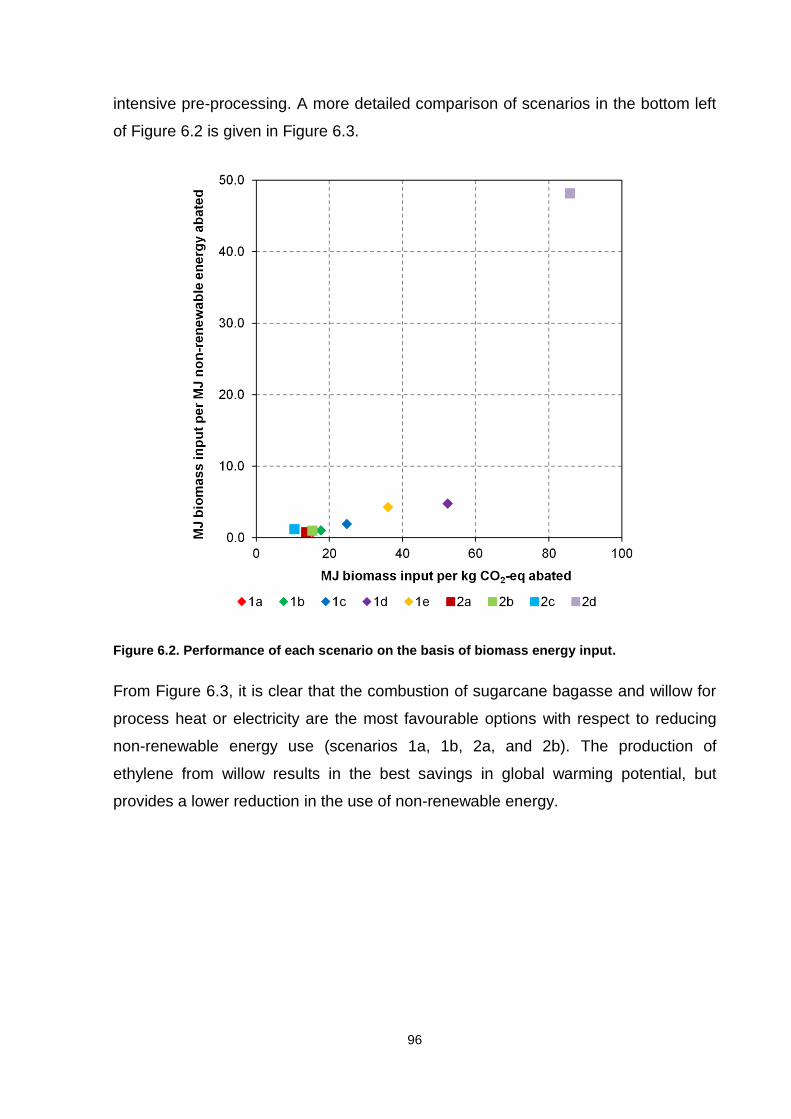
96
intensive pre-processing. A more detailed comparison of scenarios in the bottom left
of Figure 6.2 is given in Figure 6.3.
Figure 6.2. Performance of each scenario on the basis of biomass energy input.
From Figure 6.3, it is clear that the combustion of sugarcane bagasse and willow for
process heat or electricity are the most favourable options with respect to reducing
non-renewable energy use (scenarios 1a, 1b, 2a, and 2b). The production of
ethylene from willow results in the best savings in global warming potential, but
provides a lower reduction in the use of non-renewable energy.
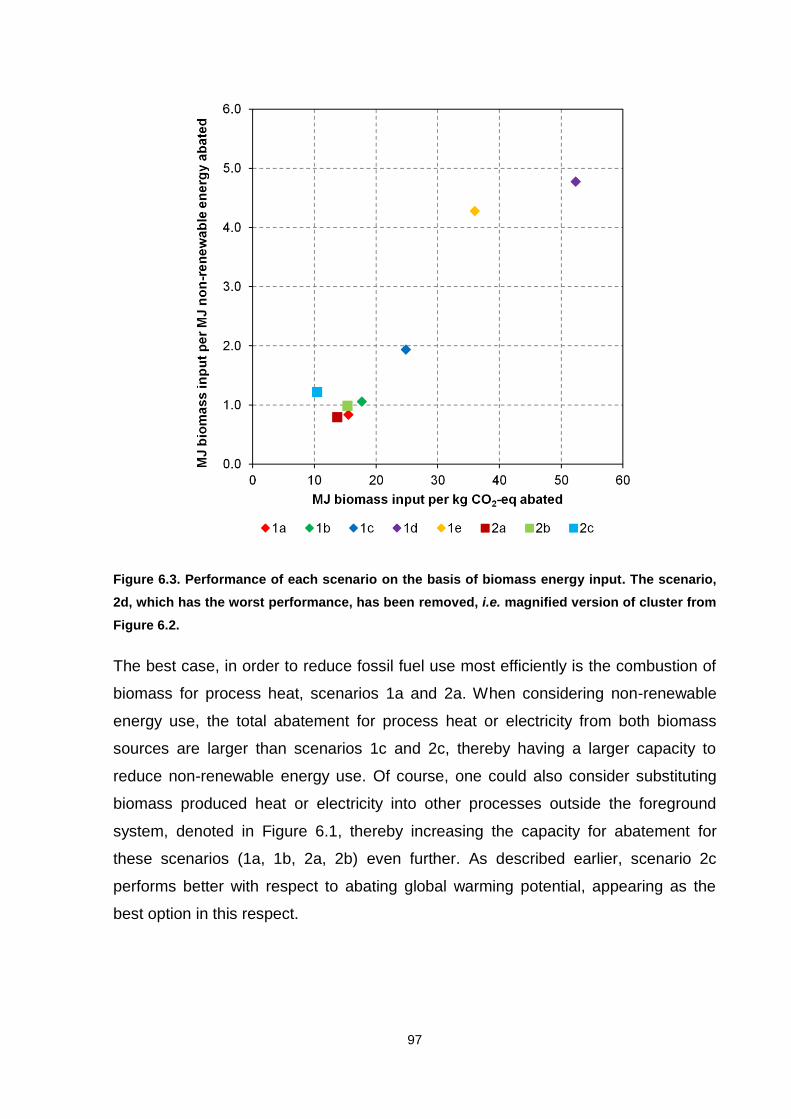
97
Figure 6.3. Performance of each scenario on the basis of biomass energy input. The scenario,
2d, which has the worst performance, has been removed, i.e. magnified version of cluster from
Figure 6.2.
The best case, in order to reduce fossil fuel use most efficiently is the combustion of
biomass for process heat, scenarios 1a and 2a. When considering non-renewable
energy use, the total abatement for process heat or electricity from both biomass
sources are larger than scenarios 1c and 2c, thereby having a larger capacity to
reduce non-renewable energy use. Of course, one could also consider substituting
biomass produced heat or electricity into other processes outside the foreground
system, denoted in Figure 6.1, thereby increasing the capacity for abatement for
these scenarios (1a, 1b, 2a, 2b) even further. As described earlier, scenario 2c
performs better with respect to abating global warming potential, appearing as the
best option in this respect.
98
6.4 Discussion
6.4.1 Interpretation
From the above results, it appears to be preferable to use biomass primarily as a
source of process heating, followed by using it for process electricity, rather than for
making the raw materials. This is largely because to convert the biomass, a
significant amount of additional energy is required, as described in Chapters 4 and 5.
In the case of biomass combustion, no additional processing is required, resulting in
lower energy consumption. While there are still greenhouse gas and fossil fuel
savings to be made by using biomass-derived chemical raw materials when
compared with the conventional base case, biomass could be used most effectively
throughout the value chain to provide process heating or electricity.
Of course, it should be noted that, in all cases, the abatement is dependent on the
counterfactual. If, for example, the generation of heat or power from the conventional
system had much lower greenhouse gas emissions and fossil fuel use, then the
abatement values of using biomass would consequently be lower, and it would
possibly be more favourable to use biomass as a feedstock source for the chemicals
ethylene and p-xylene.
6.4.2 Sensitivity to Conversion Efficiency
In Section 6.2.2, the most significant assumption was thought to be the conversion
efficiencies of the biomass combustion to heat or electricity. The sensitivity of the
results to changes in the assumed efficiency was therefore investigated. Efficiency
and process emissions are related, because a decrease in efficiency means that
more biomass needs to be burnt to produce an equivalent quantity of heat or
electricity. To test the sensitivity, the conversion efficiencies were both lowered by
5%. The effect on the abatement was measured and the sensitivity is shown in Table
6.4.
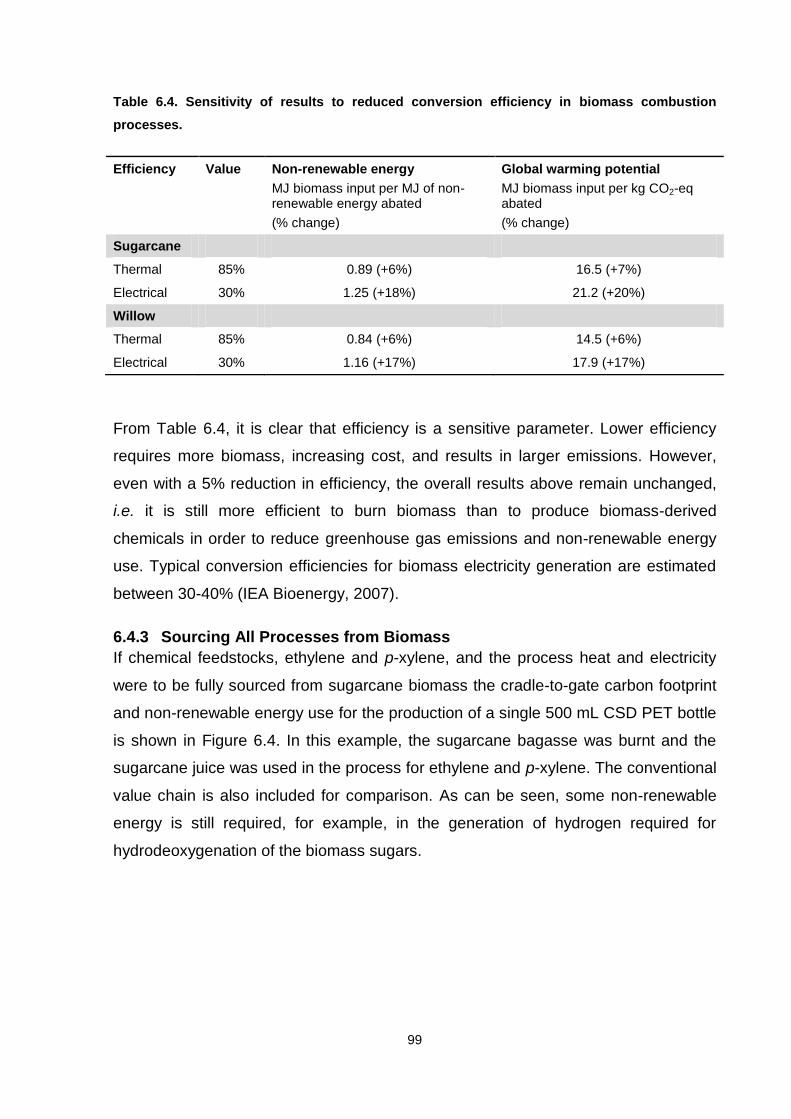
99
Table 6.4. Sensitivity of results to reduced conversion efficiency in biomass combustion
processes.
Efficiency Value Non-renewable energy
MJ biomass input per MJ of non-renewable energy abated
(% change)
Global warming potential
MJ biomass input per kg CO2-eq abated
(% change)
Sugarcane
Thermal 85% 0.89 (+6%) 16.5 (+7%)
Electrical 30% 1.25 (+18%) 21.2 (+20%)
Willow
Thermal 85% 0.84 (+6%) 14.5 (+6%)
Electrical 30% 1.16 (+17%) 17.9 (+17%)
From Table 6.4, it is clear that efficiency is a sensitive parameter. Lower efficiency
requires more biomass, increasing cost, and results in larger emissions. However,
even with a 5% reduction in efficiency, the overall results above remain unchanged,
i.e. it is still more efficient to burn biomass than to produce biomass-derived
chemicals in order to reduce greenhouse gas emissions and non-renewable energy
use. Typical conversion efficiencies for biomass electricity generation are estimated
between 30-40% (IEA Bioenergy, 2007).
6.4.3 Sourcing All Processes from Biomass
If chemical feedstocks, ethylene and p-xylene, and the process heat and electricity
were to be fully sourced from sugarcane biomass the cradle-to-gate carbon footprint
and non-renewable energy use for the production of a single 500 mL CSD PET bottle
is shown in Figure 6.4. In this example, the sugarcane bagasse was burnt and the
sugarcane juice was used in the process for ethylene and p-xylene. The conventional
value chain is also included for comparison. As can be seen, some non-renewable
energy is still required, for example, in the generation of hydrogen required for
hydrodeoxygenation of the biomass sugars.
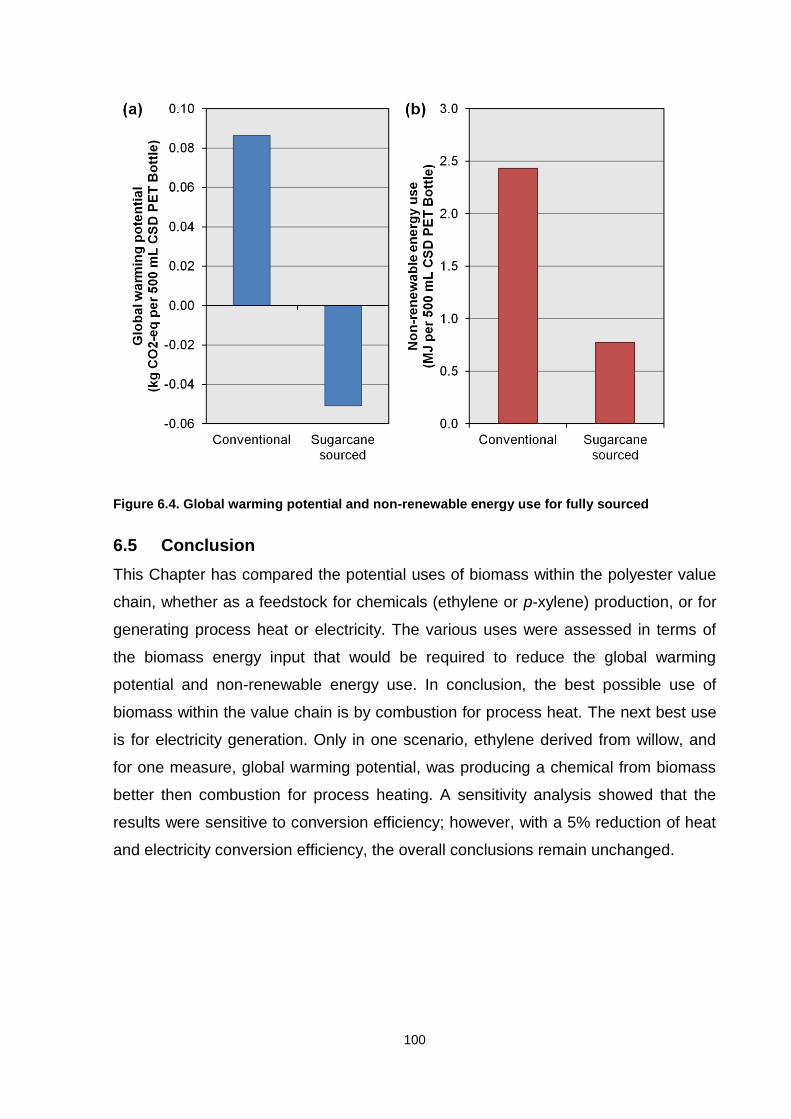
100
Figure 6.4. Global warming potential and non-renewable energy use for fully sourced
6.5 Conclusion
This Chapter has compared the potential uses of biomass within the polyester value
chain, whether as a feedstock for chemicals (ethylene or p-xylene) production, or for
generating process heat or electricity. The various uses were assessed in terms of
the biomass energy input that would be required to reduce the global warming
potential and non-renewable energy use. In conclusion, the best possible use of
biomass within the value chain is by combustion for process heat. The next best use
is for electricity generation. Only in one scenario, ethylene derived from willow, and
for one measure, global warming potential, was producing a chemical from biomass
better then combustion for process heating. A sensitivity analysis showed that the
results were sensitive to conversion efficiency; however, with a 5% reduction of heat
and electricity conversion efficiency, the overall conclusions remain unchanged.
101
Chapter 7 Recycling, Landfill and Incineration
This Chapter focuses on the end-of-life routes of polyester, which includes recycling,
landfill and incineration. Open and closed loop recycling routes have been
investigated, in addition to the international transport of polyester waste for recycling.
7.1 Introduction
So far, in this Dissertation, the environmental impacts associated with various
processing routes to PET have been assessed without considering what happens to
articles made from PET at the end of their life. There are three main routes when
considering the end of life for PET: (i) recycling, (ii) landfill, and (iii) incineration.
The primary objective of this Chapter is to determine, for a variety of cases, the
global warming potential arising from, and energy used in, recycling. It is important to
note that this Dissertation investigates post consumer recycling to generate new
products, i.e. the polymer has two consumer life cycles. This is different from
industrial recycling because in industrial recycling, e.g. cut-offs, waste is recycled
internally within the processes, thereby not generating a second product life for the
consumer. The literature reviewed in Chapter 2 has discussed the advantages of
recycling PET. As outlined in Chapter 1, there are two main options: closed loop
recycling, i.e. bottles used to make new bottles, and open loop recycling, i.e. bottles
used to make fibre. Regarding the actual processing of waste bottles, these can
either be mechanically recycled to flake, or chemically processed to monomer.
Chemical recycling allows greater control of the polymer quality, because the
resulting monomer can be re-polymerised to the desired specifications (Shen et al.,
2010). For chemical recycling, three major routes exist: (i) hydrolysis, (ii)
methanolysis, and (iii) glycolysis (Datye et al., 1984; Lorenzetti et al., 2006; Paszun
and Spychaj, 1997). Hydrolysis of the polyester, either via acid, base or steam, is
slow and energy-intensive and recovery of the monomer is difficult, requiring
numerous purification stages (Bartolome et al., 2012). Methanolysis yields dimethyl
terephthalate, the feedstock used in older batch polymerisation technologies
(Bartolome et al., 2012). Dimethyl terephthalate has been replaced with terephthalic
acid in the continuous polymerisation process (Bartolome et al., 2012). Therefore,
glycolysis is a preferred route, yielding the bis(2-hydroxyethyl) terephthalate
monomer, which can be directly added to the continuous polymerisation process
102
reducing the requirement for both terephthalic acid and ethylene glycol feedstock
(Macdowell, 1961; Ostrowski, 1970). Chemical recycling using glycolysis is
investigated in this Chapter along with mechanical recycling. Chapter 2 also identified
that fibre recycling, other than re-use, is much more challenging, because the PET
fibres are often blended with other textile fibres and the various additives, e.g. dyes
and finishing chemicals are difficult to remove. Therefore, in this Chapter,
consideration will be given only to PET bottles being recycled into new PET bottles
and into new PET fibres.
When considering recycling from an LCA perspective, in order to account for the
environmental impacts associated with the PET waste entering the recycling system,
three techniques are commonly used (Shen et al., 2010):
System expansion. As shown in Figure 7.1, the LCA boundary includes the
production of virgin PET, which is then recycled. This method is by far the
most transparent and accurate approach given that the environmental impacts
of producing virgin PET are included in addition to the impacts from recycling.
Cut-off approach. The production of virgin PET, which is to be recycled, is not
included within the LCA boundary, dashed line in Figure 7.1. For this approach
the PET entering the recycling system is ‘seen’ as a waste product and
therefore all environmental impacts associated with the virgin PET production
are to be allocated to the virgin PET system and not the recycling system. This
method effectively separates both virgin and recycling processes into
individual systems. Results from this method are favourable to recycled PET,
given that the feedstock, i.e. PET waste, has no associated environmental
impacts.
Waste valuation is a weighting method which allocates a fraction of the
environmental impacts from manufacturing virgin PET to the PET waste
entering the recycled system. The allocation factors are typically based on the
economic value of virgin PET and the value of baled bottles, i.e. PET bottles
collected and sorted for recycling. This method is not transparent, because, by
using allocation factors, the causal relationships between processes are not
accurately reflected.
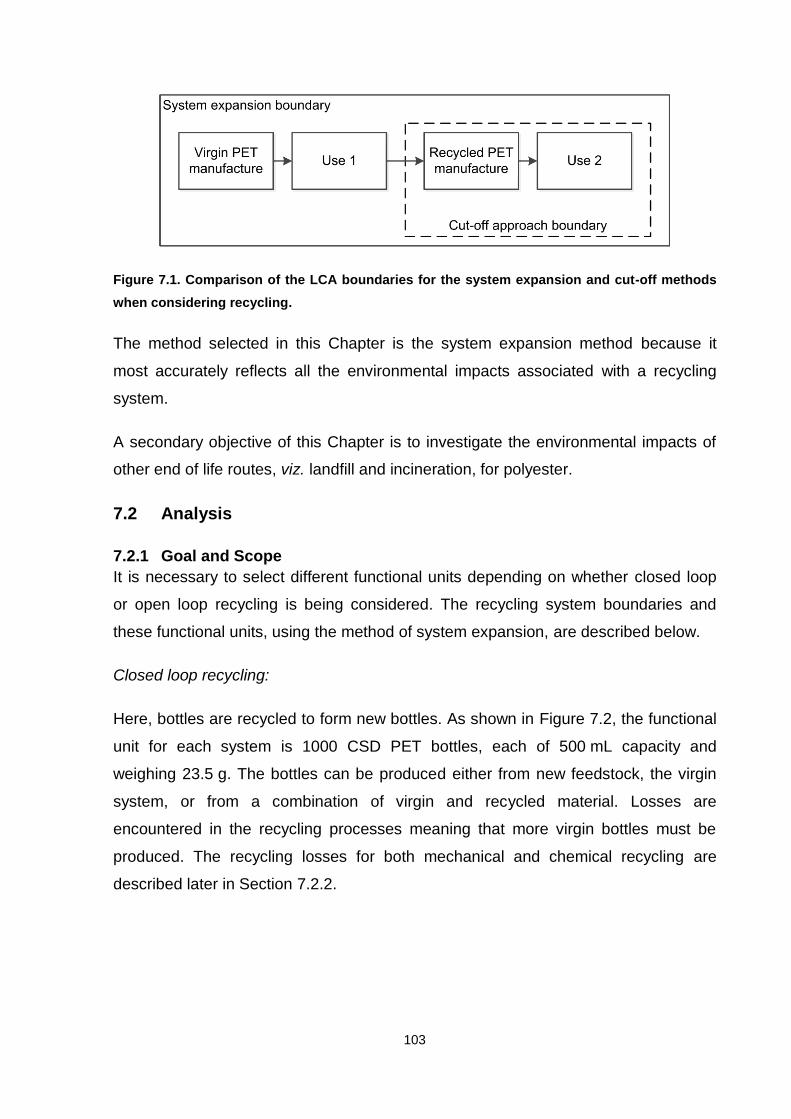
103
Figure 7.1. Comparison of the LCA boundaries for the system expansion and cut-off methods
when considering recycling.
The method selected in this Chapter is the system expansion method because it
most accurately reflects all the environmental impacts associated with a recycling
system.
A secondary objective of this Chapter is to investigate the environmental impacts of
other end of life routes, viz. landfill and incineration, for polyester.
7.2 Analysis
7.2.1 Goal and Scope
It is necessary to select different functional units depending on whether closed loop
or open loop recycling is being considered. The recycling system boundaries and
these functional units, using the method of system expansion, are described below.
Closed loop recycling:
Here, bottles are recycled to form new bottles. As shown in Figure 7.2, the functional
unit for each system is 1000 CSD PET bottles, each of 500 mL capacity and
weighing 23.5 g. The bottles can be produced either from new feedstock, the virgin
system, or from a combination of virgin and recycled material. Losses are
encountered in the recycling processes meaning that more virgin bottles must be
produced. The recycling losses for both mechanical and chemical recycling are
described later in Section 7.2.2.
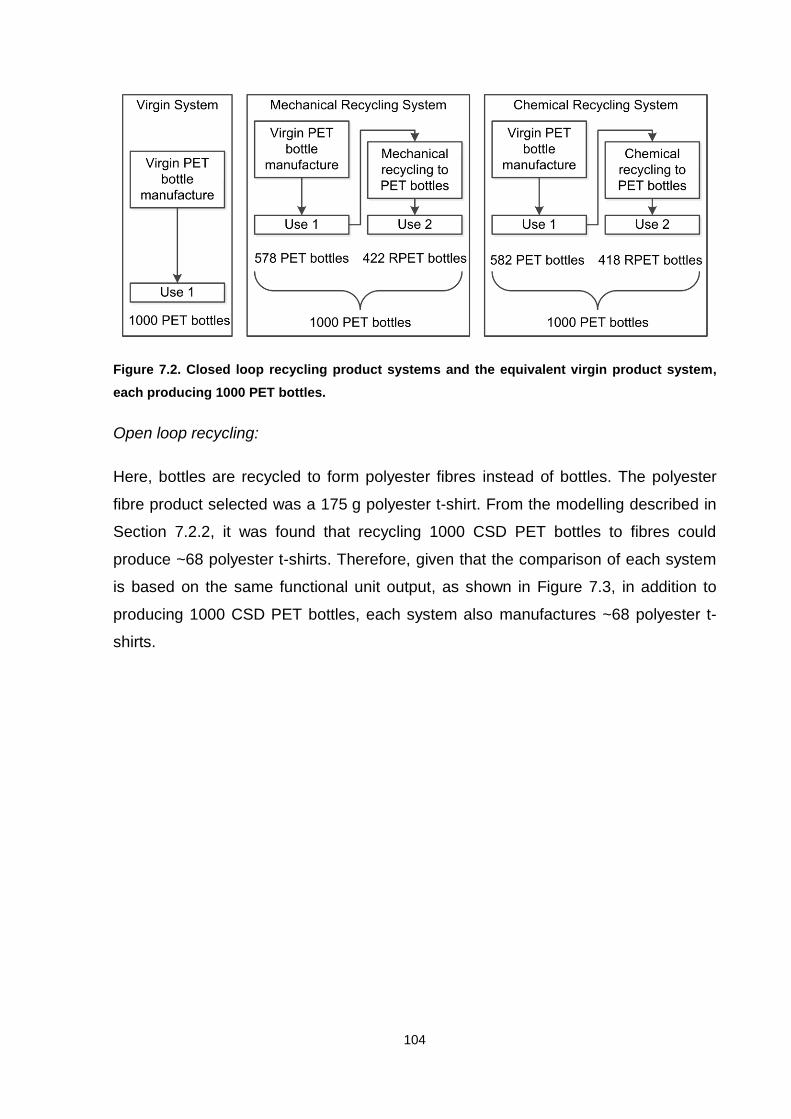
104
Figure 7.2. Closed loop recycling product systems and the equivalent virgin product system,
each producing 1000 PET bottles.
Open loop recycling:
Here, bottles are recycled to form polyester fibres instead of bottles. The polyester
fibre product selected was a 175 g polyester t-shirt. From the modelling described in
Section 7.2.2, it was found that recycling 1000 CSD PET bottles to fibres could
produce ~68 polyester t-shirts. Therefore, given that the comparison of each system
is based on the same functional unit output, as shown in Figure 7.3, in addition to
producing 1000 CSD PET bottles, each system also manufactures ~68 polyester t-
shirts.
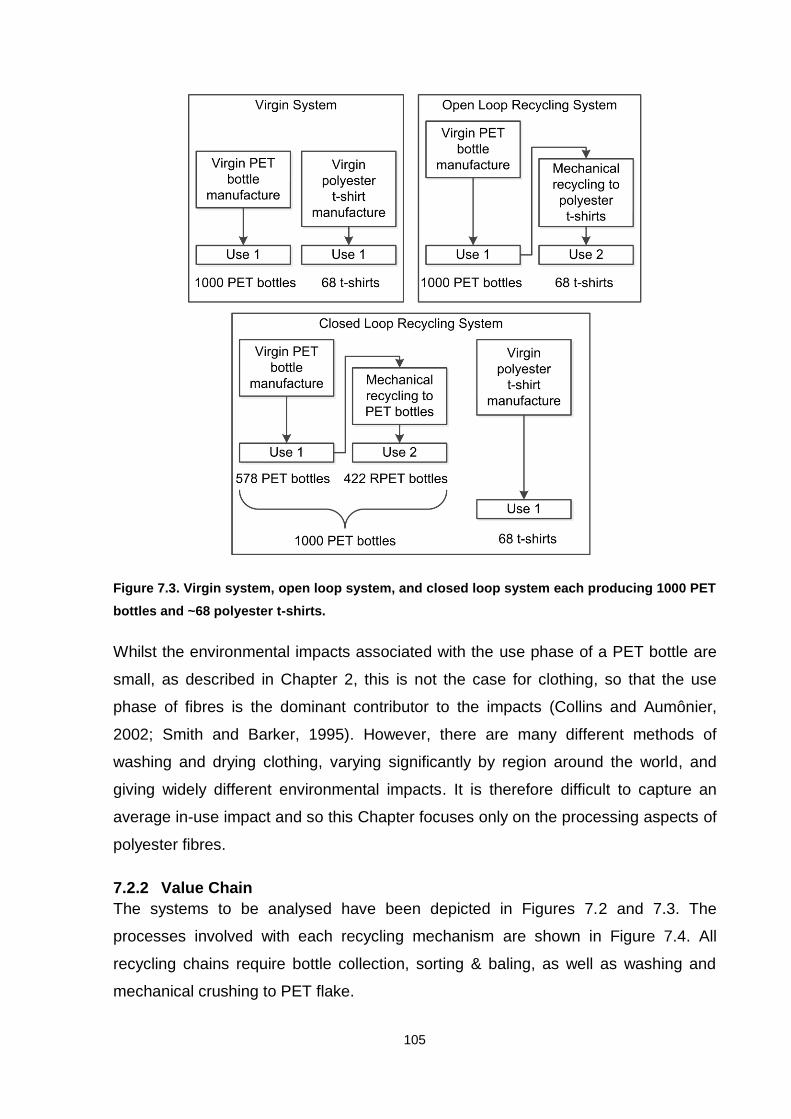
105
Figure 7.3. Virgin system, open loop system, and closed loop system each producing 1000 PET
bottles and ~68 polyester t-shirts.
Whilst the environmental impacts associated with the use phase of a PET bottle are
small, as described in Chapter 2, this is not the case for clothing, so that the use
phase of fibres is the dominant contributor to the impacts (Collins and Aumônier,
2002; Smith and Barker, 1995). However, there are many different methods of
washing and drying clothing, varying significantly by region around the world, and
giving widely different environmental impacts. It is therefore difficult to capture an
average in-use impact and so this Chapter focuses only on the processing aspects of
polyester fibres.
7.2.2 Value Chain
The systems to be analysed have been depicted in Figures 7.2 and 7.3. The
processes involved with each recycling mechanism are shown in Figure 7.4. All
recycling chains require bottle collection, sorting & baling, as well as washing and
mechanical crushing to PET flake.
106
In closed loop, mechanical recycling, PET flake can be used in the bottle
moulding process to create new bottles which can then be filled and
distributed.
In closed loop, chemical recycling, the PET flake is broken down to the
monomer, bis(2-hydroxyethyl) terephthalate, in the glycolysis process. The
monomer is then added to the continuous polymerisation process, followed by
the solid state polymerisation, bottle moulding and finally, filling and
distribution.
In open loop recycling, the PET flake undergoes fibre processing which
involves: preparation, spinning, weaving, dyeing, finishing and make-up into
polyester t-shirts, which are then distributed.
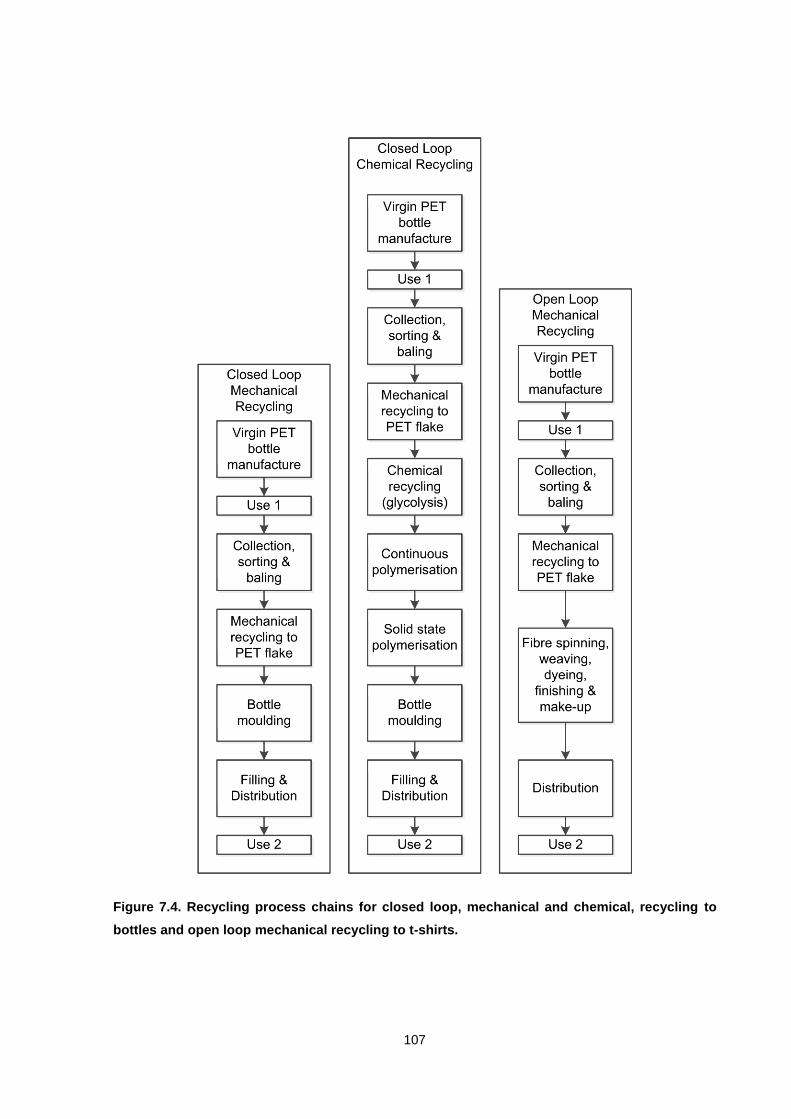
107
Figure 7.4. Recycling process chains for closed loop, mechanical and chemical, recycling to
bottles and open loop mechanical recycling to t-shirts.
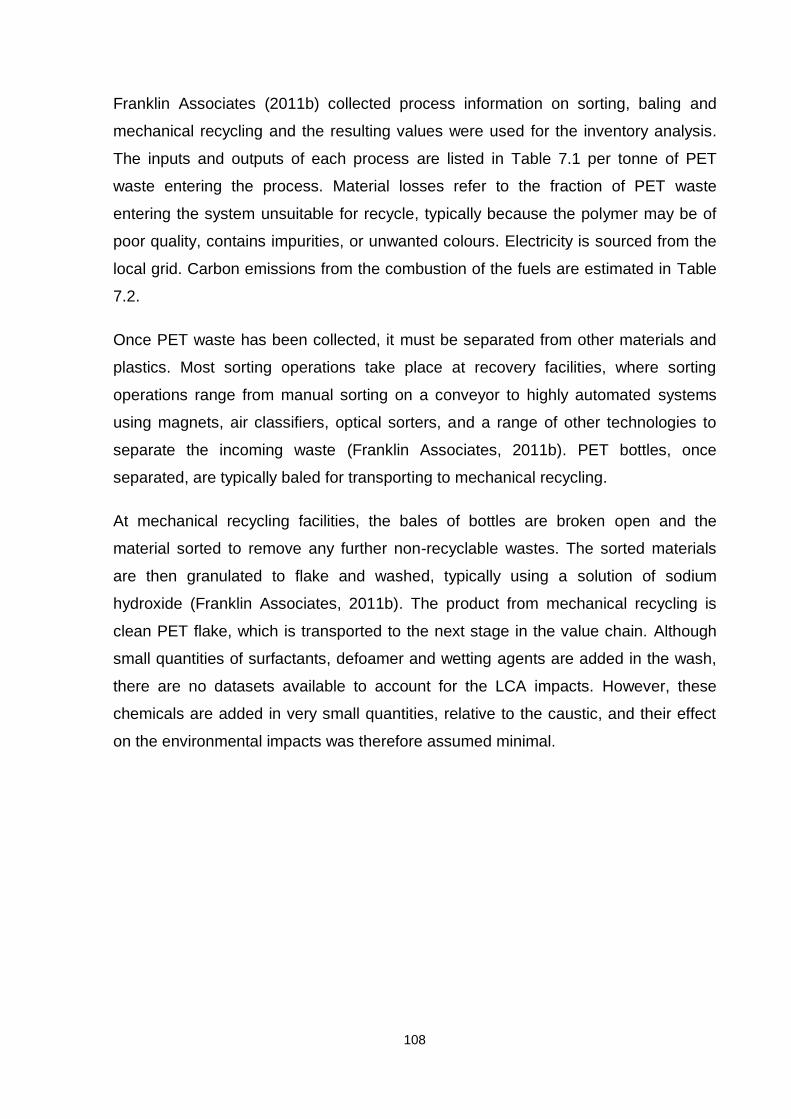
108
Franklin Associates (2011b) collected process information on sorting, baling and
mechanical recycling and the resulting values were used for the inventory analysis.
The inputs and outputs of each process are listed in Table 7.1 per tonne of PET
waste entering the process. Material losses refer to the fraction of PET waste
entering the system unsuitable for recycle, typically because the polymer may be of
poor quality, contains impurities, or unwanted colours. Electricity is sourced from the
local grid. Carbon emissions from the combustion of the fuels are estimated in Table
7.2.
Once PET waste has been collected, it must be separated from other materials and
plastics. Most sorting operations take place at recovery facilities, where sorting
operations range from manual sorting on a conveyor to highly automated systems
using magnets, air classifiers, optical sorters, and a range of other technologies to
separate the incoming waste (Franklin Associates, 2011b). PET bottles, once
separated, are typically baled for transporting to mechanical recycling.
At mechanical recycling facilities, the bales of bottles are broken open and the
material sorted to remove any further non-recyclable wastes. The sorted materials
are then granulated to flake and washed, typically using a solution of sodium
hydroxide (Franklin Associates, 2011b). The product from mechanical recycling is
clean PET flake, which is transported to the next stage in the value chain. Although
small quantities of surfactants, defoamer and wetting agents are added in the wash,
there are no datasets available to account for the LCA impacts. However, these
chemicals are added in very small quantities, relative to the caustic, and their effect
on the environmental impacts was therefore assumed minimal.
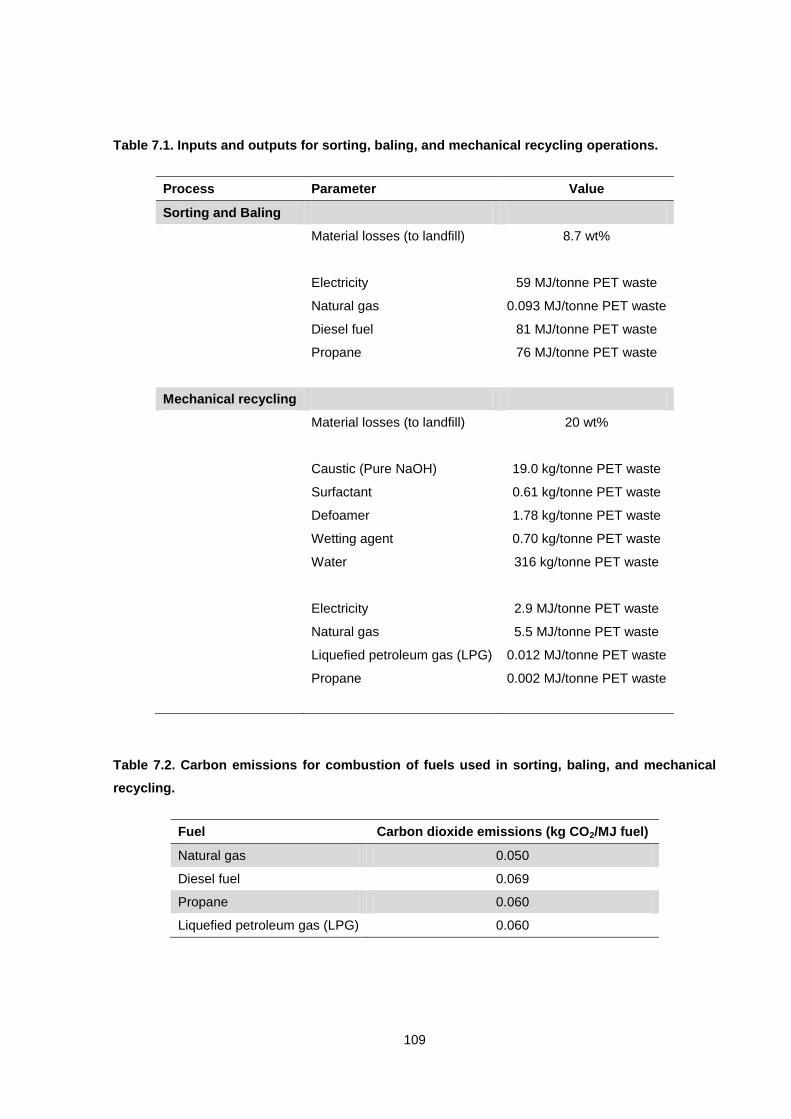
109
Table 7.1. Inputs and outputs for sorting, baling, and mechanical recycling operations.
Process Parameter Value
Sorting and Baling
Material losses (to landfill) 8.7 wt%
Electricity 59 MJ/tonne PET waste
Natural gas 0.093 MJ/tonne PET waste
Diesel fuel 81 MJ/tonne PET waste
Propane 76 MJ/tonne PET waste
Mechanical recycling
Material losses (to landfill) 20 wt%
Caustic (Pure NaOH) 19.0 kg/tonne PET waste
Surfactant 0.61 kg/tonne PET waste
Defoamer 1.78 kg/tonne PET waste
Wetting agent 0.70 kg/tonne PET waste
Water 316 kg/tonne PET waste
Electricity 2.9 MJ/tonne PET waste
Natural gas 5.5 MJ/tonne PET waste
Liquefied petroleum gas (LPG) 0.012 MJ/tonne PET waste
Propane 0.002 MJ/tonne PET waste
Table 7.2. Carbon emissions for combustion of fuels used in sorting, baling, and mechanical
recycling.
Fuel Carbon dioxide emissions (kg CO2/MJ fuel)
Natural gas 0.050
Diesel fuel 0.069
Propane 0.060
Liquefied petroleum gas (LPG) 0.060
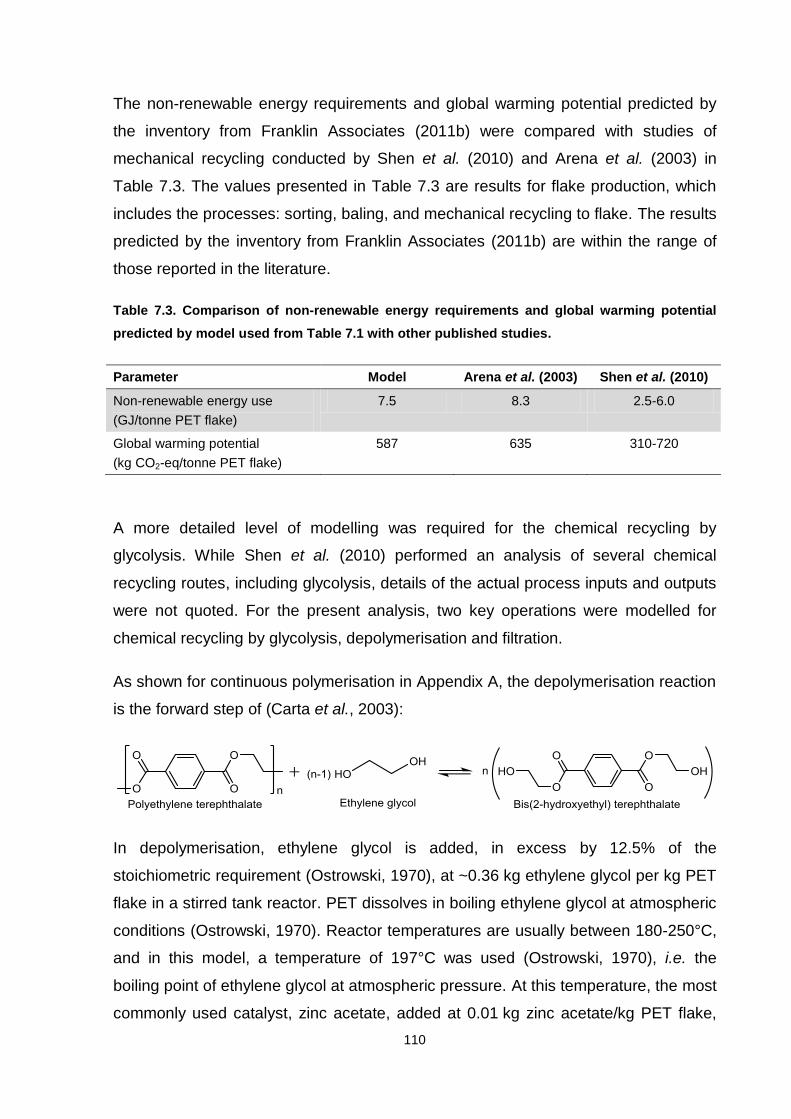
110
The non-renewable energy requirements and global warming potential predicted by
the inventory from Franklin Associates (2011b) were compared with studies of
mechanical recycling conducted by Shen et al. (2010) and Arena et al. (2003) in
Table 7.3. The values presented in Table 7.3 are results for flake production, which
includes the processes: sorting, baling, and mechanical recycling to flake. The results
predicted by the inventory from Franklin Associates (2011b) are within the range of
those reported in the literature.
Table 7.3. Comparison of non-renewable energy requirements and global warming potential
predicted by model used from Table 7.1 with other published studies.
Parameter Model Arena et al. (2003) Shen et al. (2010)
Non-renewable energy use
(GJ/tonne PET flake)
7.5 8.3 2.5-6.0
Global warming potential
(kg CO2-eq/tonne PET flake)
587 635 310-720
A more detailed level of modelling was required for the chemical recycling by
glycolysis. While Shen et al. (2010) performed an analysis of several chemical
recycling routes, including glycolysis, details of the actual process inputs and outputs
were not quoted. For the present analysis, two key operations were modelled for
chemical recycling by glycolysis, depolymerisation and filtration.
As shown for continuous polymerisation in Appendix A, the depolymerisation reaction
is the forward step of (Carta et al., 2003):
In depolymerisation, ethylene glycol is added, in excess by 12.5% of the
stoichiometric requirement (Ostrowski, 1970), at ~0.36 kg ethylene glycol per kg PET
flake in a stirred tank reactor. PET dissolves in boiling ethylene glycol at atmospheric
conditions (Ostrowski, 1970). Reactor temperatures are usually between 180-250°C,
and in this model, a temperature of 197°C was used (Ostrowski, 1970), i.e. the
boiling point of ethylene glycol at atmospheric pressure. At this temperature, the most
commonly used catalyst, zinc acetate, added at 0.01 kg zinc acetate/kg PET flake,
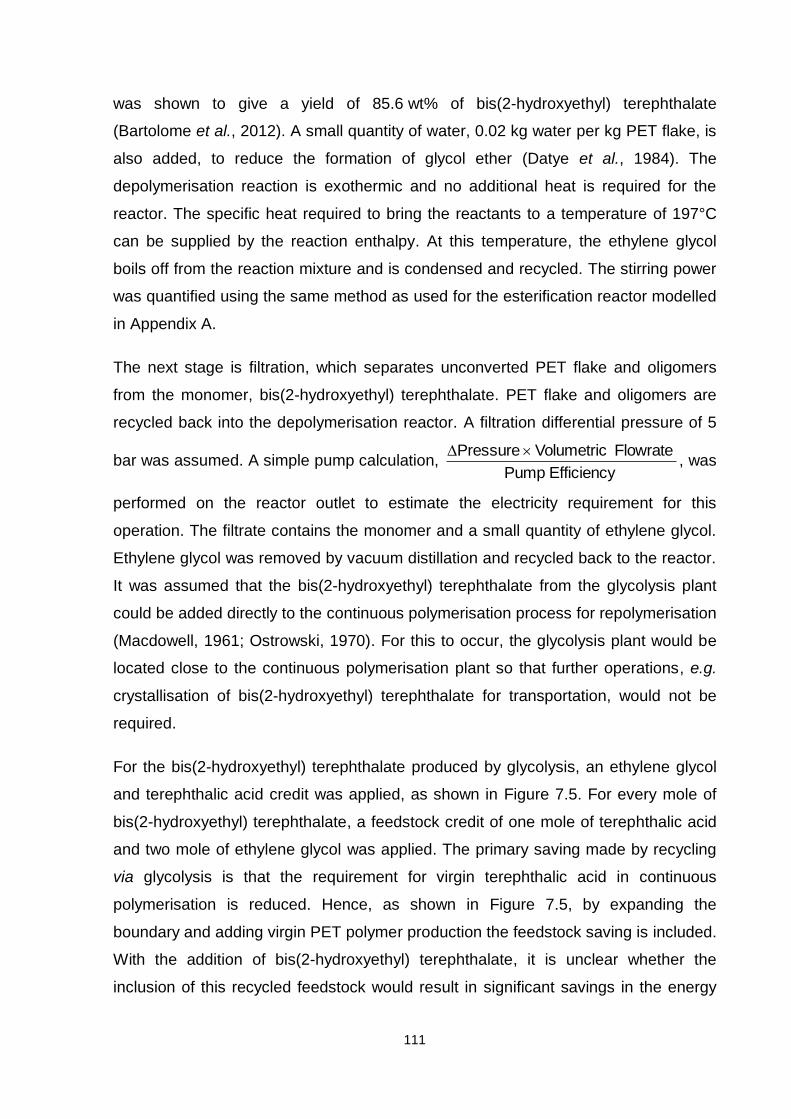
111
was shown to give a yield of 85.6 wt% of bis(2-hydroxyethyl) terephthalate
(Bartolome et al., 2012). A small quantity of water, 0.02 kg water per kg PET flake, is
also added, to reduce the formation of glycol ether (Datye et al., 1984). The
depolymerisation reaction is exothermic and no additional heat is required for the
reactor. The specific heat required to bring the reactants to a temperature of 197°C
can be supplied by the reaction enthalpy. At this temperature, the ethylene glycol
boils off from the reaction mixture and is condensed and recycled. The stirring power
was quantified using the same method as used for the esterification reactor modelled
in Appendix A.
The next stage is filtration, which separates unconverted PET flake and oligomers
from the monomer, bis(2-hydroxyethyl) terephthalate. PET flake and oligomers are
recycled back into the depolymerisation reactor. A filtration differential pressure of 5
bar was assumed. A simple pump calculation, Efficiency Pump
Flowrate VolumetricPressure , was
performed on the reactor outlet to estimate the electricity requirement for this
operation. The filtrate contains the monomer and a small quantity of ethylene glycol.
Ethylene glycol was removed by vacuum distillation and recycled back to the reactor.
It was assumed that the bis(2-hydroxyethyl) terephthalate from the glycolysis plant
could be added directly to the continuous polymerisation process for repolymerisation
(Macdowell, 1961; Ostrowski, 1970). For this to occur, the glycolysis plant would be
located close to the continuous polymerisation plant so that further operations, e.g.
crystallisation of bis(2-hydroxyethyl) terephthalate for transportation, would not be
required.
For the bis(2-hydroxyethyl) terephthalate produced by glycolysis, an ethylene glycol
and terephthalic acid credit was applied, as shown in Figure 7.5. For every mole of
bis(2-hydroxyethyl) terephthalate, a feedstock credit of one mole of terephthalic acid
and two mole of ethylene glycol was applied. The primary saving made by recycling
via glycolysis is that the requirement for virgin terephthalic acid in continuous
polymerisation is reduced. Hence, as shown in Figure 7.5, by expanding the
boundary and adding virgin PET polymer production the feedstock saving is included.
With the addition of bis(2-hydroxyethyl) terephthalate, it is unclear whether the
inclusion of this recycled feedstock would result in significant savings in the energy
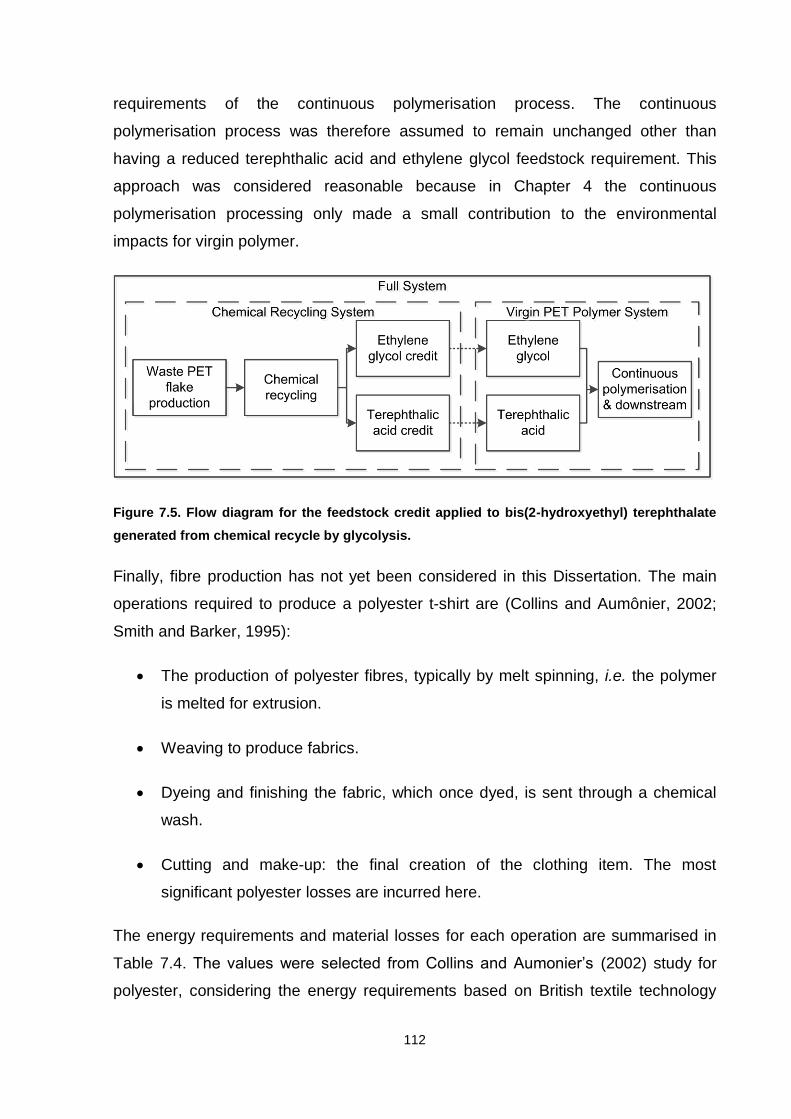
112
requirements of the continuous polymerisation process. The continuous
polymerisation process was therefore assumed to remain unchanged other than
having a reduced terephthalic acid and ethylene glycol feedstock requirement. This
approach was considered reasonable because in Chapter 4 the continuous
polymerisation processing only made a small contribution to the environmental
impacts for virgin polymer.
Figure 7.5. Flow diagram for the feedstock credit applied to bis(2-hydroxyethyl) terephthalate
generated from chemical recycle by glycolysis.
Finally, fibre production has not yet been considered in this Dissertation. The main
operations required to produce a polyester t-shirt are (Collins and Aumônier, 2002;
Smith and Barker, 1995):
The production of polyester fibres, typically by melt spinning, i.e. the polymer
is melted for extrusion.
Weaving to produce fabrics.
Dyeing and finishing the fabric, which once dyed, is sent through a chemical
wash.
Cutting and make-up: the final creation of the clothing item. The most
significant polyester losses are incurred here.
The energy requirements and material losses for each operation are summarised in
Table 7.4. The values were selected from Collins and Aumonier’s (2002) study for
polyester, considering the energy requirements based on British textile technology
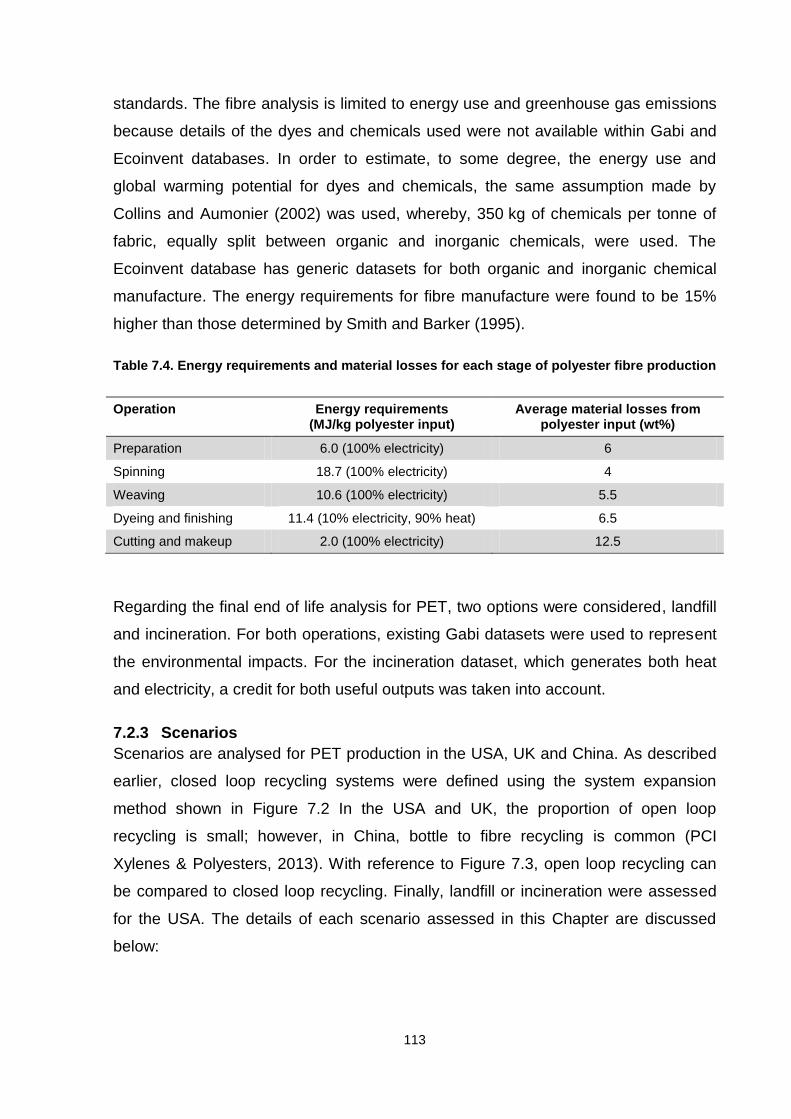
113
standards. The fibre analysis is limited to energy use and greenhouse gas emissions
because details of the dyes and chemicals used were not available within Gabi and
Ecoinvent databases. In order to estimate, to some degree, the energy use and
global warming potential for dyes and chemicals, the same assumption made by
Collins and Aumonier (2002) was used, whereby, 350 kg of chemicals per tonne of
fabric, equally split between organic and inorganic chemicals, were used. The
Ecoinvent database has generic datasets for both organic and inorganic chemical
manufacture. The energy requirements for fibre manufacture were found to be 15%
higher than those determined by Smith and Barker (1995).
Table 7.4. Energy requirements and material losses for each stage of polyester fibre production
Operation Energy requirements (MJ/kg polyester input)
Average material losses from polyester input (wt%)
Preparation 6.0 (100% electricity) 6
Spinning 18.7 (100% electricity) 4
Weaving 10.6 (100% electricity) 5.5
Dyeing and finishing 11.4 (10% electricity, 90% heat) 6.5
Cutting and makeup 2.0 (100% electricity) 12.5
Regarding the final end of life analysis for PET, two options were considered, landfill
and incineration. For both operations, existing Gabi datasets were used to represent
the environmental impacts. For the incineration dataset, which generates both heat
and electricity, a credit for both useful outputs was taken into account.
7.2.3 Scenarios
Scenarios are analysed for PET production in the USA, UK and China. As described
earlier, closed loop recycling systems were defined using the system expansion
method shown in Figure 7.2 In the USA and UK, the proportion of open loop
recycling is small; however, in China, bottle to fibre recycling is common (PCI
Xylenes & Polyesters, 2013). With reference to Figure 7.3, open loop recycling can
be compared to closed loop recycling. Finally, landfill or incineration were assessed
for the USA. The details of each scenario assessed in this Chapter are discussed
below:
114
Case 1, Production of PET in the USA:
Each system for the USA produces 1000 PET bottles.
Scenario 1a, virgin PET bottles
o p-Xylene would be transported by ship for 1000 km from its point of
manufacture in Texas to a plant in Alabama for terephthalic acid
production
o Terephthalic acid would be transported 650 km from Alabama to PET
plants in South Carolina
o Ethylene glycol would be produced in Texas and transported 1500 km
by ship to the PET plants
o Continuous and solid state polymerisation plants were assumed to be
contiguous. PET pellets would be transported on average 1000 km by
road to various bottle moulding and filling facilities, and a further 750 km
by road to distribution centres for supermarkets.
Scenario 1b, closed loop mechanical recycling
o Virgin PET bottles would be produced as described in scenario 1a.
o PET waste bottles would be collected and transported an average of
50 km by truck to sorting stations
o Baled bottles from the sorting stations would then be transported
600 km by rail to a mechanical recycling facility.
o PET flake would be transported a further 1000 km by truck to bottle
moulding facilities. Finally, recycled bottles would be transported
750 km by road to distribution centres.
Scenario 1c, closed loop chemical recycling
o Virgin PET bottles would be produced as described in scenario 1a.
115
o PET waste bottles would be collected and transported an average of
50 km by truck to sorting stations
o Baled bottles from the sorting stations would then be transported
600 km by rail to a mechanical recycling facility.
o PET flake would be transported a further 1000 km by truck to chemical
recycling facilities.
o Bis(2-hydroxyethyl) terephthalate, the monomer produced from
chemical recycling, would be directly added to continuous
polymerisation, i.e. the plants were assumed adjacent. Finally, PET
pellets would be transported on average 1000 km by truck to various
bottle moulding and filling facilities, and a further 750 km by road to
distribution centres for supermarkets.
Case 2, Production of PET in the UK:
Each system for the UK produces 1000 PET bottles.
Scenario 2a, virgin PET bottles
o It was assumed that ethylene glycol would be manufactured from fossil
fuel in The Netherlands and transported 600 km by ship to the UK
polymerisation plant.
o The terephthalic acid, continuous polymerisation and solid state
polymerisation were assumed to be located together in northern
England. PET pellets would be transported on average 300 km by truck
to various bottle moulding and filling facilities, and a further 150 km by
road to distribution centres for supermarkets.
Scenario 2b, closed loop mechanical recycling
o Virgin PET bottles would be produced as described in scenario 2a.
o PET waste bottles would be collected and transported an average of
50 km by truck to sorting stations
116
o Baled bottles from the sorting stations would then be transported
400 km by rail to a mechanical recycling facility.
o PET flake would be transported a further 300 km by truck to bottle
moulding facilities. Finally, recycled bottles would be transported
150 km by road to distribution centres.
Case 3, Production of PET in China:
Scenarios 3a and 3b have the functional unit of 1000 PET bottles
Scenario 3a, virgin PET bottles
o One half of the p-xylene requirements would be imported 10000 km by
ship from the Middle East, the other half produced locally in China.
o Ethylene glycol would be transported 500 km by rail to the PET plants.
o The terephthalic acid, continuous polymerisation and solid state
polymerisation were assumed to be grouped in an industrial cluster, i.e.
no transport of intermediate products would be required. PET pellets
would be transported on average 1000 km by truck to various bottle
moulding and filling facilities, and a further 500 km by road to
distribution centres for supermarkets.
Scenario 3b, closed loop mechanical recycling
o Virgin PET bottles would be produced as described in scenario 3a.
o PET waste bottles would be collected and transported an average of
50 km by road to sorting stations
o Baled bottles from the sorting stations would then be transported
400 km by rail to a mechanical recycling facility.
o PET flake would be transported a further 1000 km by road to bottle
moulding facilities. Finally, recycled bottles would be transported
500 km by road to distribution centres.
117
Scenarios 3c, 3d, and 3e have the functional unit of 1000 PET bottles and 68
polyester t-shirts, see Figure 7.3.
Scenario 3c, virgin PET bottles and virgin polyester t-shirts
o Virgin PET bottles would be produced as described in scenario 3a.
o Virgin PET for polyester t-shirts would also be produced as described in
scenario 3a, with the exception that the solid state polymerisation step
and bottle moulding are not required. Instead, PET from the continuous
polymerisation process would be transported 1000 km by truck to fibre
manufacture. Finally, polyester t-shirts would be distributed an average
of 500 km by road.
Scenario 3d, closed loop mechanical recycling and virgin polyester t-shirts
o Virgin PET bottles and closed loop recycling would be produced as
described in scenario 3b. Virgin polyester t-shirts added to this system
would be produced as described in scenario 3c.
Scenario 3e, open loop mechanical recycling
o Virgin PET bottles would be produced as described in scenario 3a.
o PET waste bottles would be collected and transported an average of
50 km by road to sorting stations
o Baled bottles from the sorting stations would then be transported
400 km by rail to a mechanical recycling facility.
o PET flake would be transported a further 1000 km by truck to fibre
manufacturing facilities. Finally, recycled polyester t-shirts would be
transported 500 km by road.
Case 4, End of life scenarios in the USA:
Collection of PET waste ~50 km by road and landfill or incineration.
Scenario 4a, after collection, all PET waste would be sent to landfill.
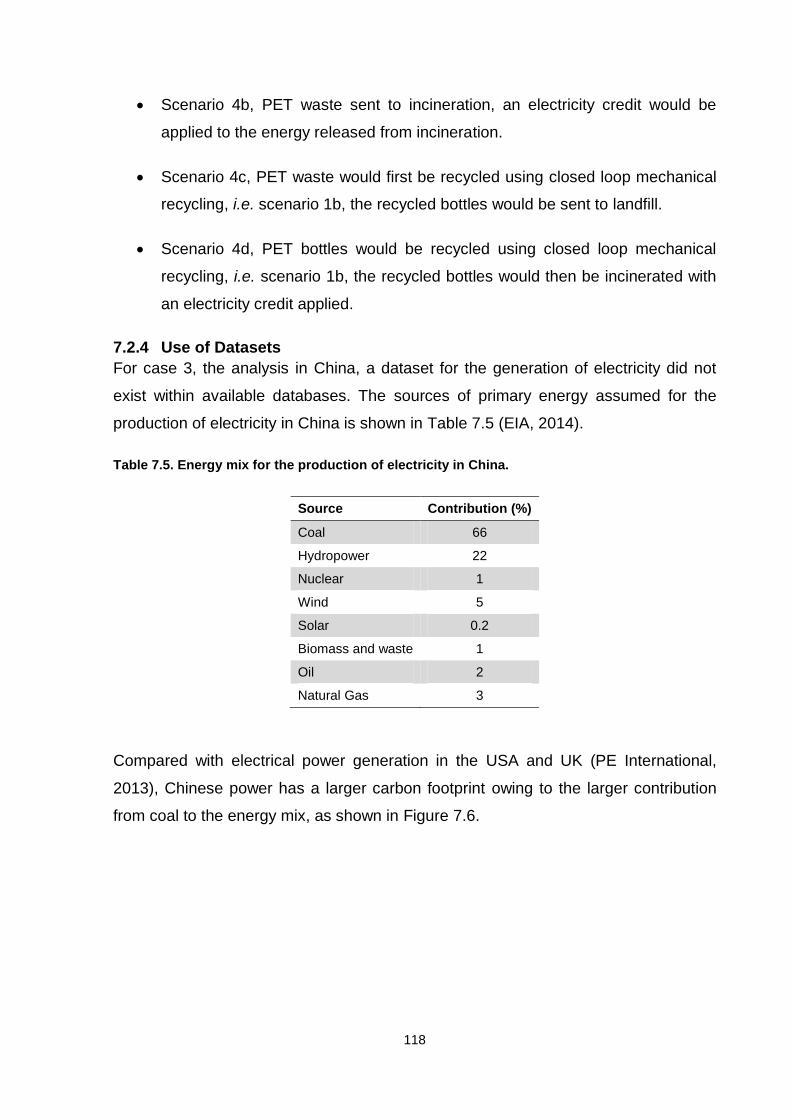
118
Scenario 4b, PET waste sent to incineration, an electricity credit would be
applied to the energy released from incineration.
Scenario 4c, PET waste would first be recycled using closed loop mechanical
recycling, i.e. scenario 1b, the recycled bottles would be sent to landfill.
Scenario 4d, PET bottles would be recycled using closed loop mechanical
recycling, i.e. scenario 1b, the recycled bottles would then be incinerated with
an electricity credit applied.
7.2.4 Use of Datasets
For case 3, the analysis in China, a dataset for the generation of electricity did not
exist within available databases. The sources of primary energy assumed for the
production of electricity in China is shown in Table 7.5 (EIA, 2014).
Table 7.5. Energy mix for the production of electricity in China.
Source Contribution (%)
Coal 66
Hydropower 22
Nuclear 1
Wind 5
Solar 0.2
Biomass and waste 1
Oil 2
Natural Gas 3
Compared with electrical power generation in the USA and UK (PE International,
2013), Chinese power has a larger carbon footprint owing to the larger contribution
from coal to the energy mix, as shown in Figure 7.6.
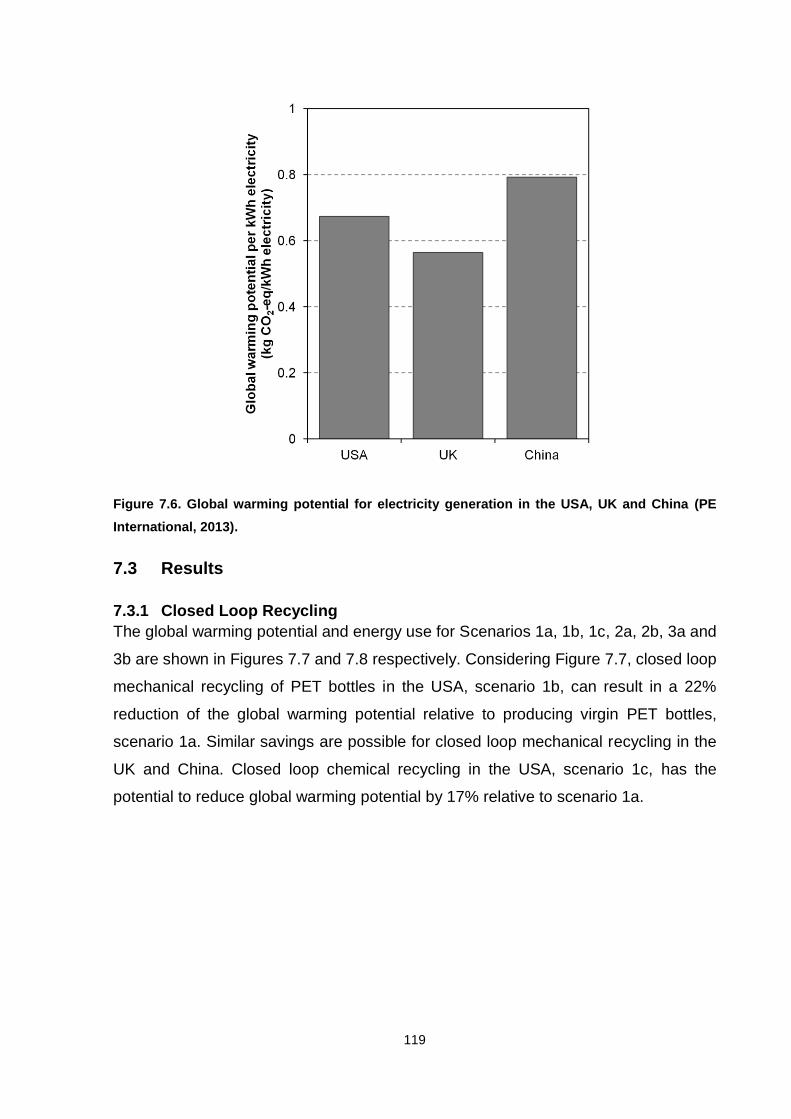
119
Figure 7.6. Global warming potential for electricity generation in the USA, UK and China (PE
International, 2013).
7.3 Results
7.3.1 Closed Loop Recycling
The global warming potential and energy use for Scenarios 1a, 1b, 1c, 2a, 2b, 3a and
3b are shown in Figures 7.7 and 7.8 respectively. Considering Figure 7.7, closed loop
mechanical recycling of PET bottles in the USA, scenario 1b, can result in a 22%
reduction of the global warming potential relative to producing virgin PET bottles,
scenario 1a. Similar savings are possible for closed loop mechanical recycling in the
UK and China. Closed loop chemical recycling in the USA, scenario 1c, has the
potential to reduce global warming potential by 17% relative to scenario 1a.
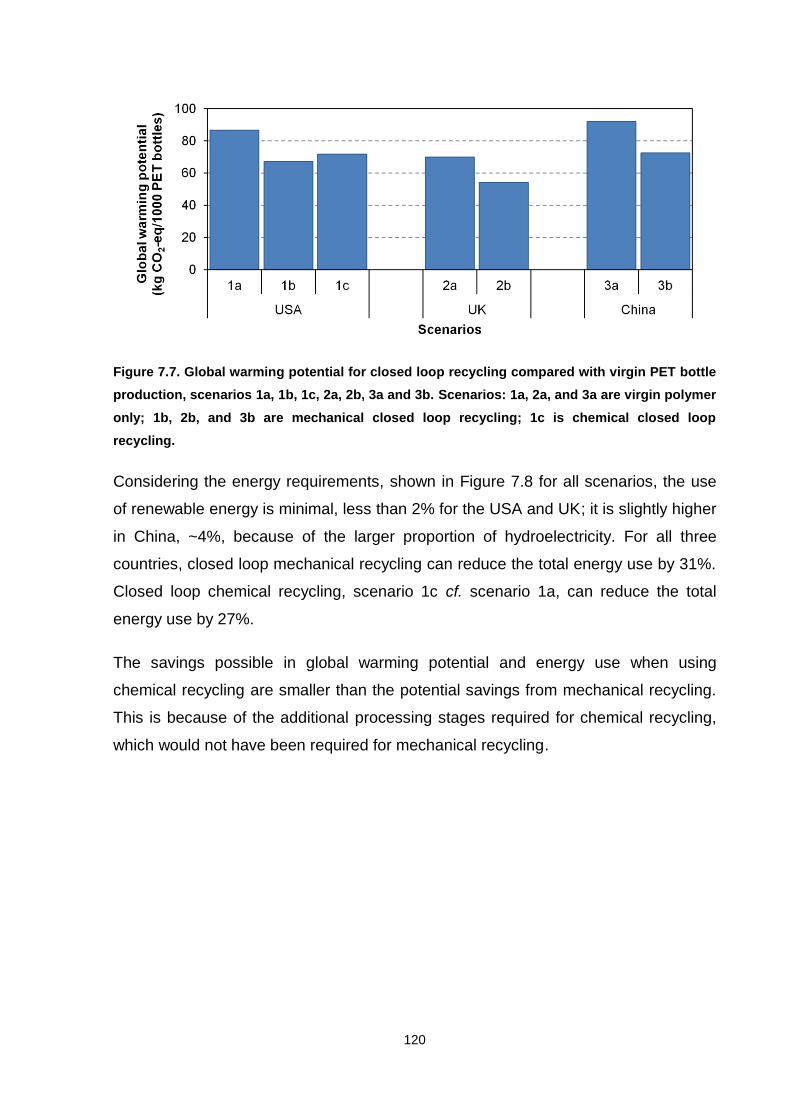
120
Figure 7.7. Global warming potential for closed loop recycling compared with virgin PET bottle
production, scenarios 1a, 1b, 1c, 2a, 2b, 3a and 3b. Scenarios: 1a, 2a, and 3a are virgin polymer
only; 1b, 2b, and 3b are mechanical closed loop recycling; 1c is chemical closed loop
recycling.
Considering the energy requirements, shown in Figure 7.8 for all scenarios, the use
of renewable energy is minimal, less than 2% for the USA and UK; it is slightly higher
in China, ~4%, because of the larger proportion of hydroelectricity. For all three
countries, closed loop mechanical recycling can reduce the total energy use by 31%.
Closed loop chemical recycling, scenario 1c cf. scenario 1a, can reduce the total
energy use by 27%.
The savings possible in global warming potential and energy use when using
chemical recycling are smaller than the potential savings from mechanical recycling.
This is because of the additional processing stages required for chemical recycling,
which would not have been required for mechanical recycling.
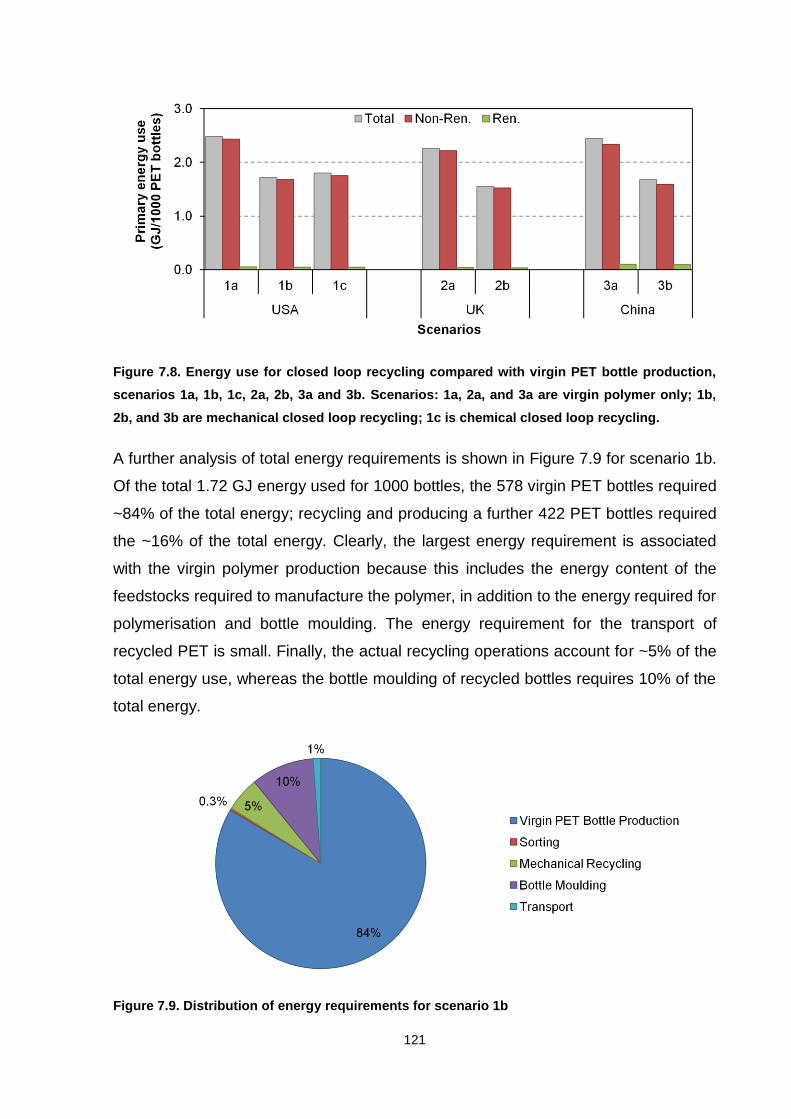
121
Figure 7.8. Energy use for closed loop recycling compared with virgin PET bottle production,
scenarios 1a, 1b, 1c, 2a, 2b, 3a and 3b. Scenarios: 1a, 2a, and 3a are virgin polymer only; 1b,
2b, and 3b are mechanical closed loop recycling; 1c is chemical closed loop recycling.
A further analysis of total energy requirements is shown in Figure 7.9 for scenario 1b.
Of the total 1.72 GJ energy used for 1000 bottles, the 578 virgin PET bottles required
~84% of the total energy; recycling and producing a further 422 PET bottles required
the ~16% of the total energy. Clearly, the largest energy requirement is associated
with the virgin polymer production because this includes the energy content of the
feedstocks required to manufacture the polymer, in addition to the energy required for
polymerisation and bottle moulding. The energy requirement for the transport of
recycled PET is small. Finally, the actual recycling operations account for ~5% of the
total energy use, whereas the bottle moulding of recycled bottles requires 10% of the
total energy.
Figure 7.9. Distribution of energy requirements for scenario 1b
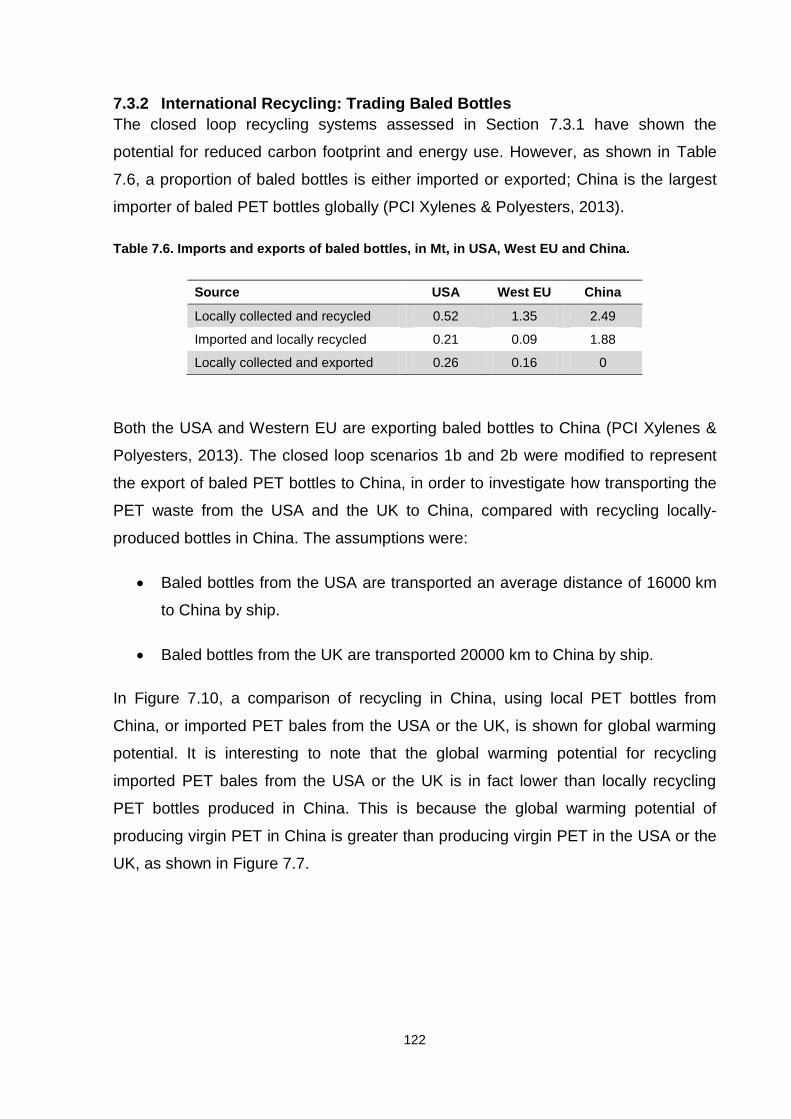
122
7.3.2 International Recycling: Trading Baled Bottles
The closed loop recycling systems assessed in Section 7.3.1 have shown the
potential for reduced carbon footprint and energy use. However, as shown in Table
7.6, a proportion of baled bottles is either imported or exported; China is the largest
importer of baled PET bottles globally (PCI Xylenes & Polyesters, 2013).
Table 7.6. Imports and exports of baled bottles, in Mt, in USA, West EU and China.
Source USA West EU China
Locally collected and recycled 0.52 1.35 2.49
Imported and locally recycled 0.21 0.09 1.88
Locally collected and exported 0.26 0.16 0
Both the USA and Western EU are exporting baled bottles to China (PCI Xylenes &
Polyesters, 2013). The closed loop scenarios 1b and 2b were modified to represent
the export of baled PET bottles to China, in order to investigate how transporting the
PET waste from the USA and the UK to China, compared with recycling locally-
produced bottles in China. The assumptions were:
Baled bottles from the USA are transported an average distance of 16000 km
to China by ship.
Baled bottles from the UK are transported 20000 km to China by ship.
In Figure 7.10, a comparison of recycling in China, using local PET bottles from
China, or imported PET bales from the USA or the UK, is shown for global warming
potential. It is interesting to note that the global warming potential for recycling
imported PET bales from the USA or the UK is in fact lower than locally recycling
PET bottles produced in China. This is because the global warming potential of
producing virgin PET in China is greater than producing virgin PET in the USA or the
UK, as shown in Figure 7.7.

123
Figure 7.10. Comparison of recycling in China, using local PET bottles from China, or imported
PET bales from the USA or the UK.
7.3.3 Multi-Stage Recycling
An interesting analysis can be performed on PET recycling, if hypothetically, the
same polymer was recycled several times over. The system boundaries for repeated
recycling using the method of system expansion are shown in Figure 7.11. The virgin
system is scenario 1a and one cycle of recycling is scenario 1b. For the twice
recycled system, initially 442 virgin PET bottles are made, and after recycling these
bottles once, an additional 323 bottles can be formed. Finally, recycling those 323
bottles for a second time, a further 236 bottles can be made. At each stage of
recycling, there are losses of PET, which means that fewer bottles can be made from
the recycled material each time.
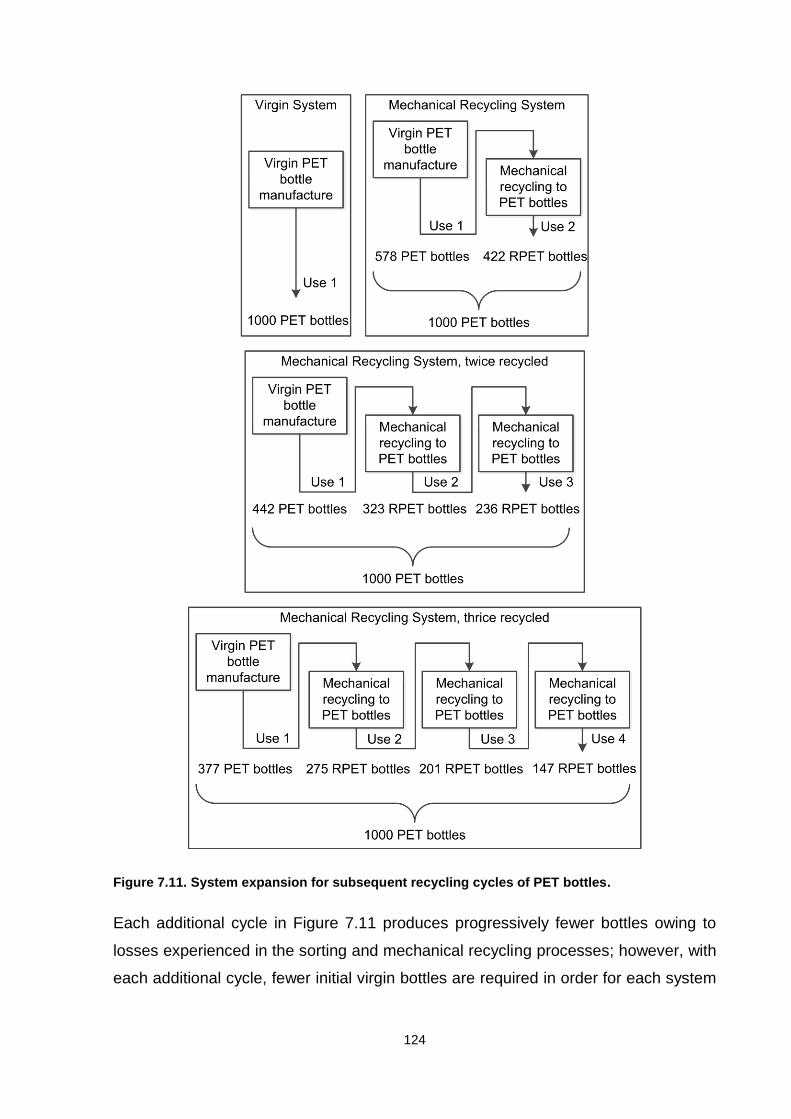
124
Figure 7.11. System expansion for subsequent recycling cycles of PET bottles.
Each additional cycle in Figure 7.11 produces progressively fewer bottles owing to
losses experienced in the sorting and mechanical recycling processes; however, with
each additional cycle, fewer initial virgin bottles are required in order for each system
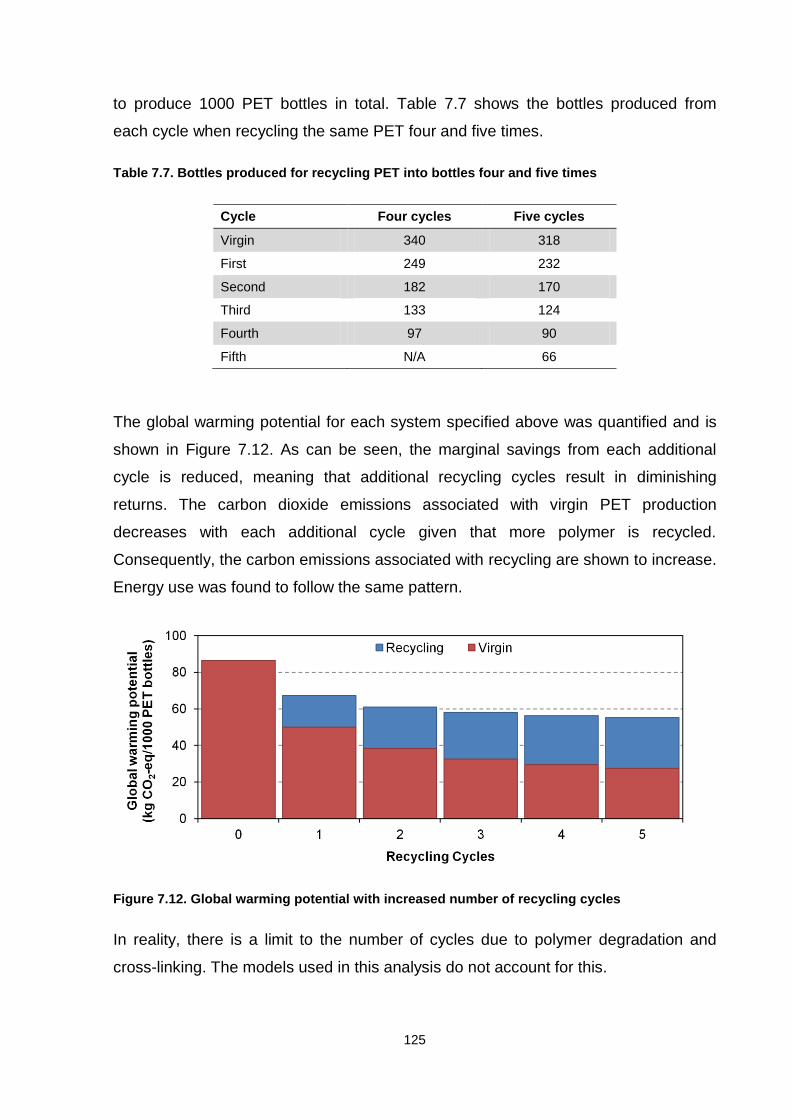
125
to produce 1000 PET bottles in total. Table 7.7 shows the bottles produced from
each cycle when recycling the same PET four and five times.
Table 7.7. Bottles produced for recycling PET into bottles four and five times
Cycle Four cycles Five cycles
Virgin 340 318
First 249 232
Second 182 170
Third 133 124
Fourth 97 90
Fifth N/A 66
The global warming potential for each system specified above was quantified and is
shown in Figure 7.12. As can be seen, the marginal savings from each additional
cycle is reduced, meaning that additional recycling cycles result in diminishing
returns. The carbon dioxide emissions associated with virgin PET production
decreases with each additional cycle given that more polymer is recycled.
Consequently, the carbon emissions associated with recycling are shown to increase.
Energy use was found to follow the same pattern.
Figure 7.12. Global warming potential with increased number of recycling cycles
In reality, there is a limit to the number of cycles due to polymer degradation and
cross-linking. The models used in this analysis do not account for this.
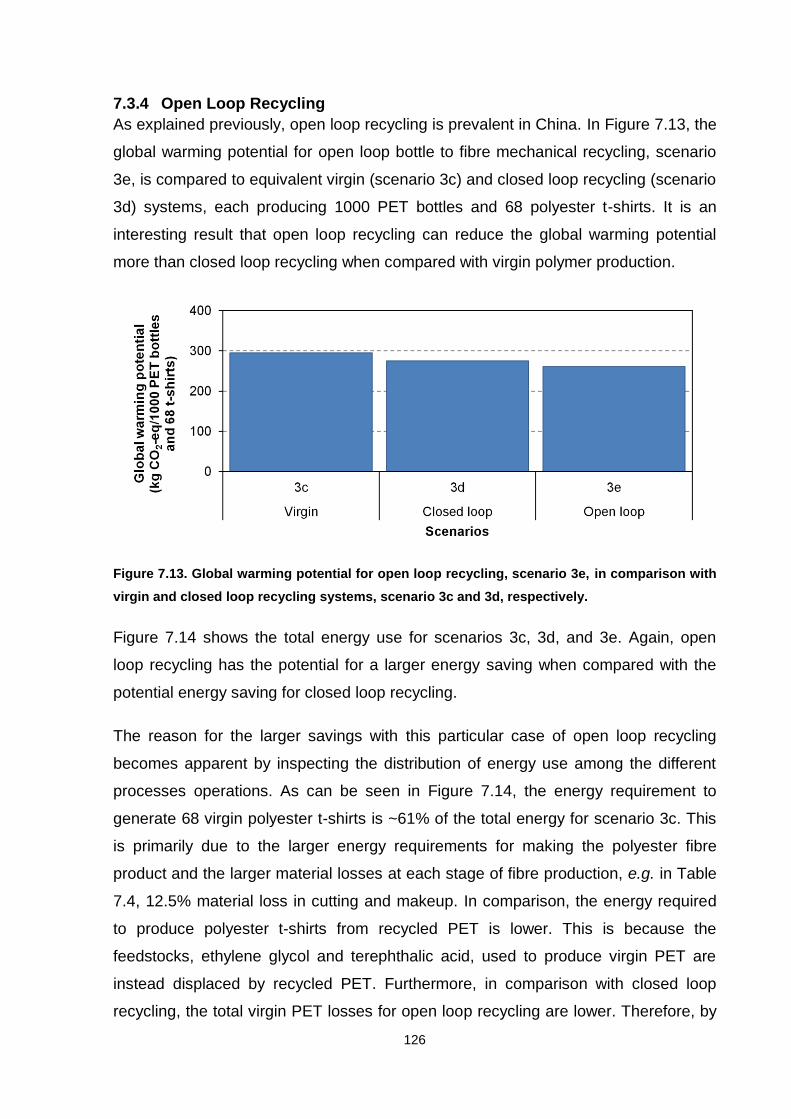
126
7.3.4 Open Loop Recycling
As explained previously, open loop recycling is prevalent in China. In Figure 7.13, the
global warming potential for open loop bottle to fibre mechanical recycling, scenario
3e, is compared to equivalent virgin (scenario 3c) and closed loop recycling (scenario
3d) systems, each producing 1000 PET bottles and 68 polyester t-shirts. It is an
interesting result that open loop recycling can reduce the global warming potential
more than closed loop recycling when compared with virgin polymer production.
Figure 7.13. Global warming potential for open loop recycling, scenario 3e, in comparison with
virgin and closed loop recycling systems, scenario 3c and 3d, respectively.
Figure 7.14 shows the total energy use for scenarios 3c, 3d, and 3e. Again, open
loop recycling has the potential for a larger energy saving when compared with the
potential energy saving for closed loop recycling.
The reason for the larger savings with this particular case of open loop recycling
becomes apparent by inspecting the distribution of energy use among the different
processes operations. As can be seen in Figure 7.14, the energy requirement to
generate 68 virgin polyester t-shirts is ~61% of the total energy for scenario 3c. This
is primarily due to the larger energy requirements for making the polyester fibre
product and the larger material losses at each stage of fibre production, e.g. in Table
7.4, 12.5% material loss in cutting and makeup. In comparison, the energy required
to produce polyester t-shirts from recycled PET is lower. This is because the
feedstocks, ethylene glycol and terephthalic acid, used to produce virgin PET are
instead displaced by recycled PET. Furthermore, in comparison with closed loop
recycling, the total virgin PET losses for open loop recycling are lower. Therefore, by
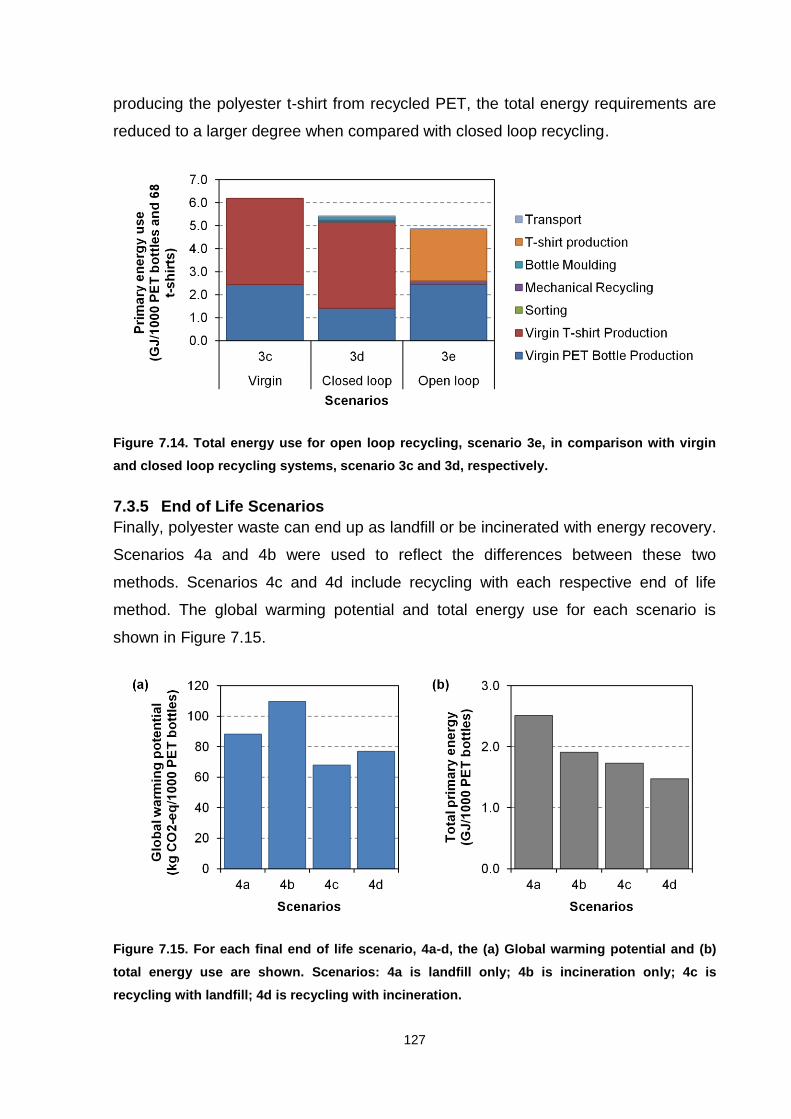
127
producing the polyester t-shirt from recycled PET, the total energy requirements are
reduced to a larger degree when compared with closed loop recycling.
Figure 7.14. Total energy use for open loop recycling, scenario 3e, in comparison with virgin
and closed loop recycling systems, scenario 3c and 3d, respectively.
7.3.5 End of Life Scenarios
Finally, polyester waste can end up as landfill or be incinerated with energy recovery.
Scenarios 4a and 4b were used to reflect the differences between these two
methods. Scenarios 4c and 4d include recycling with each respective end of life
method. The global warming potential and total energy use for each scenario is
shown in Figure 7.15.
Figure 7.15. For each final end of life scenario, 4a-d, the (a) Global warming potential and (b)
total energy use are shown. Scenarios: 4a is landfill only; 4b is incineration only; 4c is
recycling with landfill; 4d is recycling with incineration.
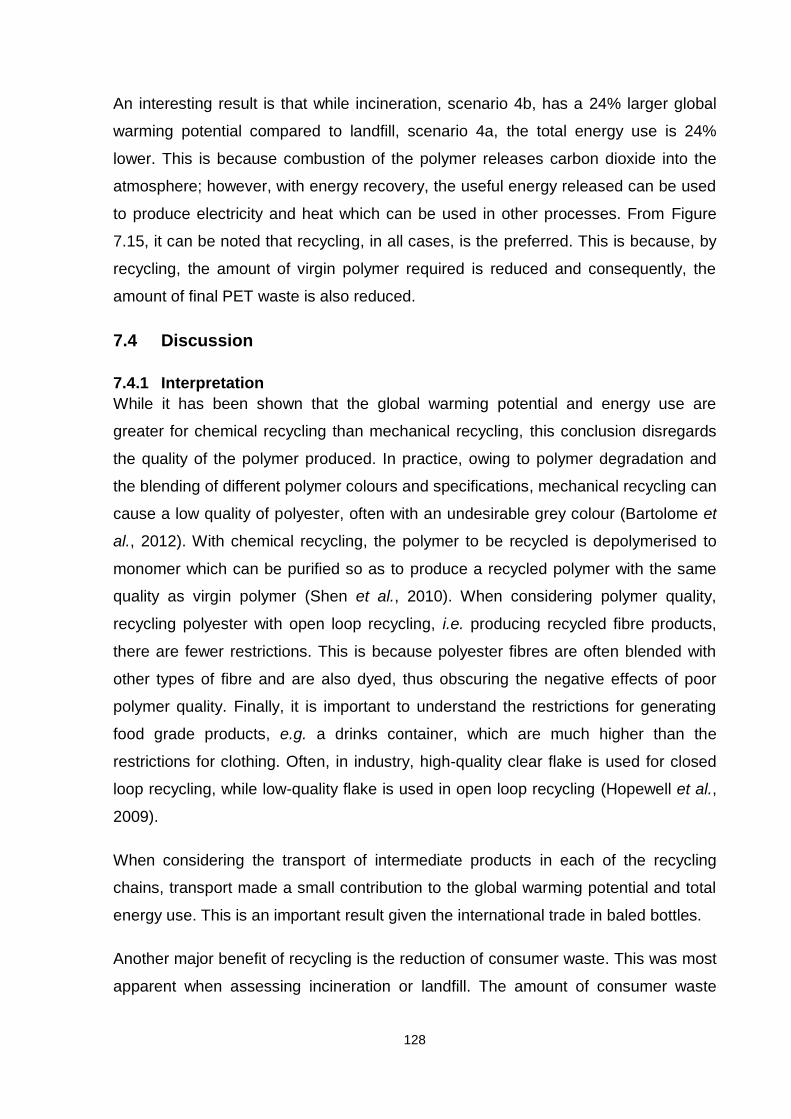
128
An interesting result is that while incineration, scenario 4b, has a 24% larger global
warming potential compared to landfill, scenario 4a, the total energy use is 24%
lower. This is because combustion of the polymer releases carbon dioxide into the
atmosphere; however, with energy recovery, the useful energy released can be used
to produce electricity and heat which can be used in other processes. From Figure
7.15, it can be noted that recycling, in all cases, is the preferred. This is because, by
recycling, the amount of virgin polymer required is reduced and consequently, the
amount of final PET waste is also reduced.
7.4 Discussion
7.4.1 Interpretation
While it has been shown that the global warming potential and energy use are
greater for chemical recycling than mechanical recycling, this conclusion disregards
the quality of the polymer produced. In practice, owing to polymer degradation and
the blending of different polymer colours and specifications, mechanical recycling can
cause a low quality of polyester, often with an undesirable grey colour (Bartolome et
al., 2012). With chemical recycling, the polymer to be recycled is depolymerised to
monomer which can be purified so as to produce a recycled polymer with the same
quality as virgin polymer (Shen et al., 2010). When considering polymer quality,
recycling polyester with open loop recycling, i.e. producing recycled fibre products,
there are fewer restrictions. This is because polyester fibres are often blended with
other types of fibre and are also dyed, thus obscuring the negative effects of poor
polymer quality. Finally, it is important to understand the restrictions for generating
food grade products, e.g. a drinks container, which are much higher than the
restrictions for clothing. Often, in industry, high-quality clear flake is used for closed
loop recycling, while low-quality flake is used in open loop recycling (Hopewell et al.,
2009).
When considering the transport of intermediate products in each of the recycling
chains, transport made a small contribution to the global warming potential and total
energy use. This is an important result given the international trade in baled bottles.
Another major benefit of recycling is the reduction of consumer waste. This was most
apparent when assessing incineration or landfill. The amount of consumer waste
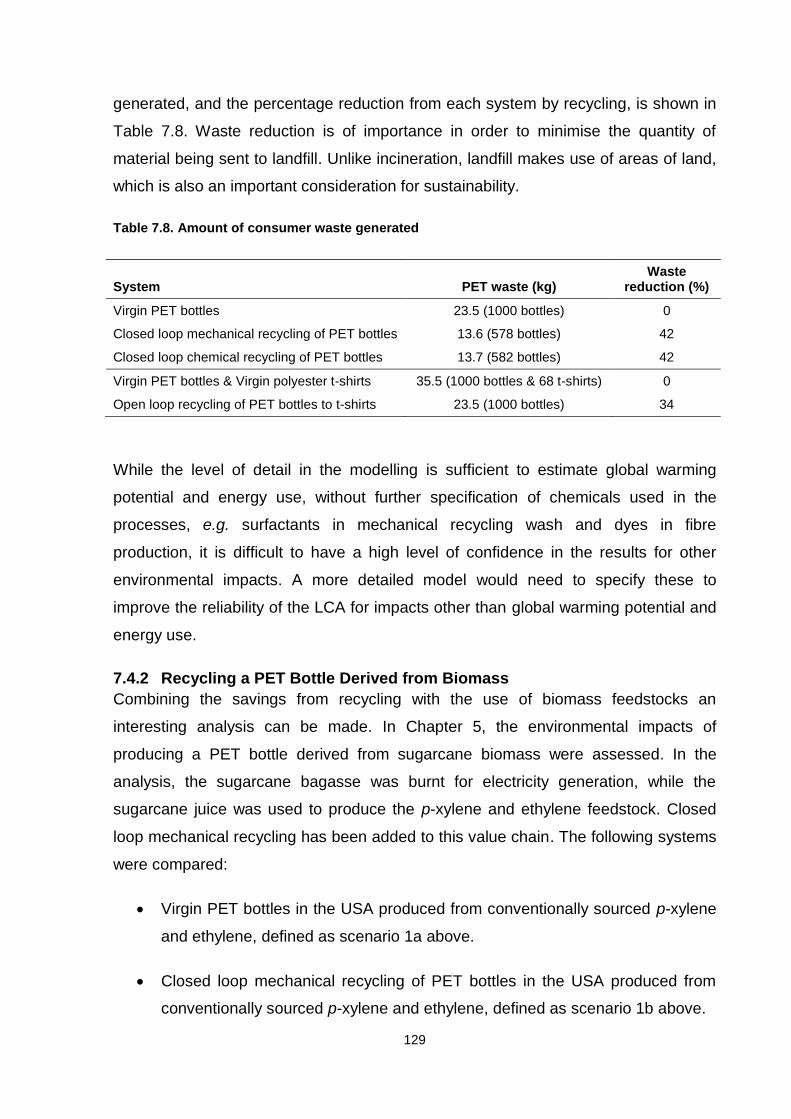
129
generated, and the percentage reduction from each system by recycling, is shown in
Table 7.8. Waste reduction is of importance in order to minimise the quantity of
material being sent to landfill. Unlike incineration, landfill makes use of areas of land,
which is also an important consideration for sustainability.
Table 7.8. Amount of consumer waste generated
System PET waste (kg) Waste
reduction (%)
Virgin PET bottles 23.5 (1000 bottles) 0
Closed loop mechanical recycling of PET bottles 13.6 (578 bottles) 42
Closed loop chemical recycling of PET bottles 13.7 (582 bottles) 42
Virgin PET bottles & Virgin polyester t-shirts 35.5 (1000 bottles & 68 t-shirts) 0
Open loop recycling of PET bottles to t-shirts 23.5 (1000 bottles) 34
While the level of detail in the modelling is sufficient to estimate global warming
potential and energy use, without further specification of chemicals used in the
processes, e.g. surfactants in mechanical recycling wash and dyes in fibre
production, it is difficult to have a high level of confidence in the results for other
environmental impacts. A more detailed model would need to specify these to
improve the reliability of the LCA for impacts other than global warming potential and
energy use.
7.4.2 Recycling a PET Bottle Derived from Biomass
Combining the savings from recycling with the use of biomass feedstocks an
interesting analysis can be made. In Chapter 5, the environmental impacts of
producing a PET bottle derived from sugarcane biomass were assessed. In the
analysis, the sugarcane bagasse was burnt for electricity generation, while the
sugarcane juice was used to produce the p-xylene and ethylene feedstock. Closed
loop mechanical recycling has been added to this value chain. The following systems
were compared:
Virgin PET bottles in the USA produced from conventionally sourced p-xylene
and ethylene, defined as scenario 1a above.
Closed loop mechanical recycling of PET bottles in the USA produced from
conventionally sourced p-xylene and ethylene, defined as scenario 1b above.
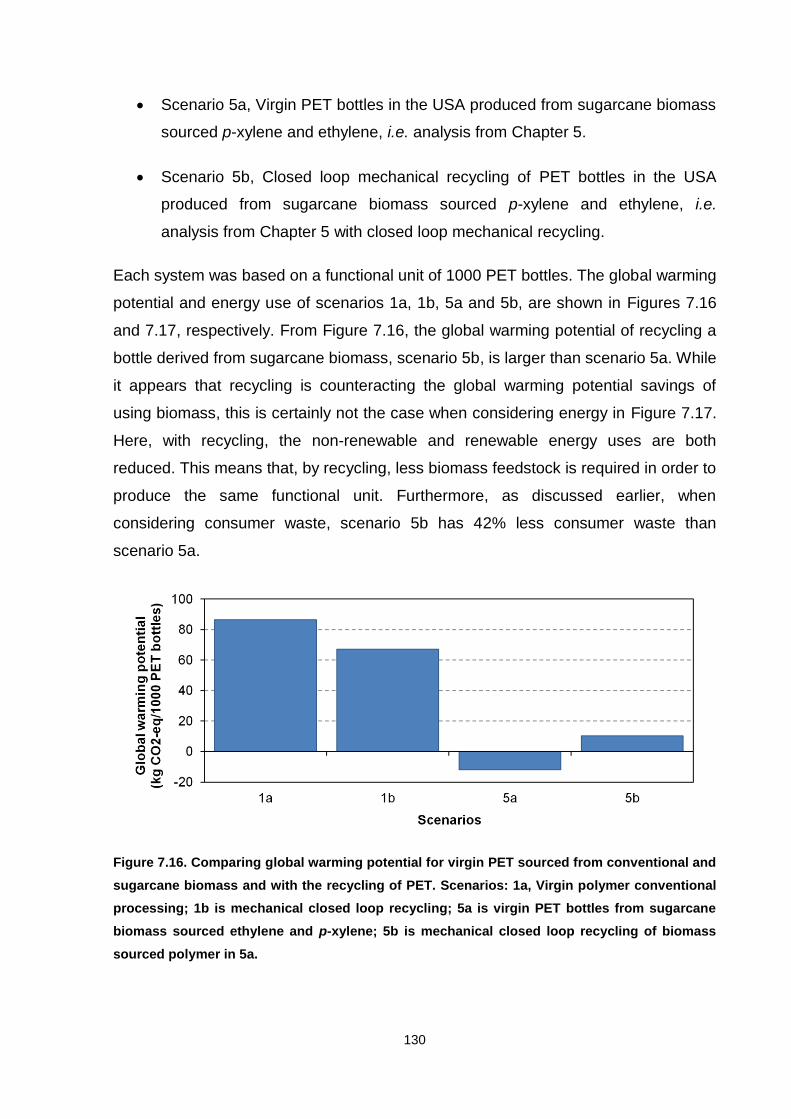
130
Scenario 5a, Virgin PET bottles in the USA produced from sugarcane biomass
sourced p-xylene and ethylene, i.e. analysis from Chapter 5.
Scenario 5b, Closed loop mechanical recycling of PET bottles in the USA
produced from sugarcane biomass sourced p-xylene and ethylene, i.e.
analysis from Chapter 5 with closed loop mechanical recycling.
Each system was based on a functional unit of 1000 PET bottles. The global warming
potential and energy use of scenarios 1a, 1b, 5a and 5b, are shown in Figures 7.16
and 7.17, respectively. From Figure 7.16, the global warming potential of recycling a
bottle derived from sugarcane biomass, scenario 5b, is larger than scenario 5a. While
it appears that recycling is counteracting the global warming potential savings of
using biomass, this is certainly not the case when considering energy in Figure 7.17.
Here, with recycling, the non-renewable and renewable energy uses are both
reduced. This means that, by recycling, less biomass feedstock is required in order to
produce the same functional unit. Furthermore, as discussed earlier, when
considering consumer waste, scenario 5b has 42% less consumer waste than
scenario 5a.
Figure 7.16. Comparing global warming potential for virgin PET sourced from conventional and
sugarcane biomass and with the recycling of PET. Scenarios: 1a, Virgin polymer conventional
processing; 1b is mechanical closed loop recycling; 5a is virgin PET bottles from sugarcane
biomass sourced ethylene and p-xylene; 5b is mechanical closed loop recycling of biomass
sourced polymer in 5a.
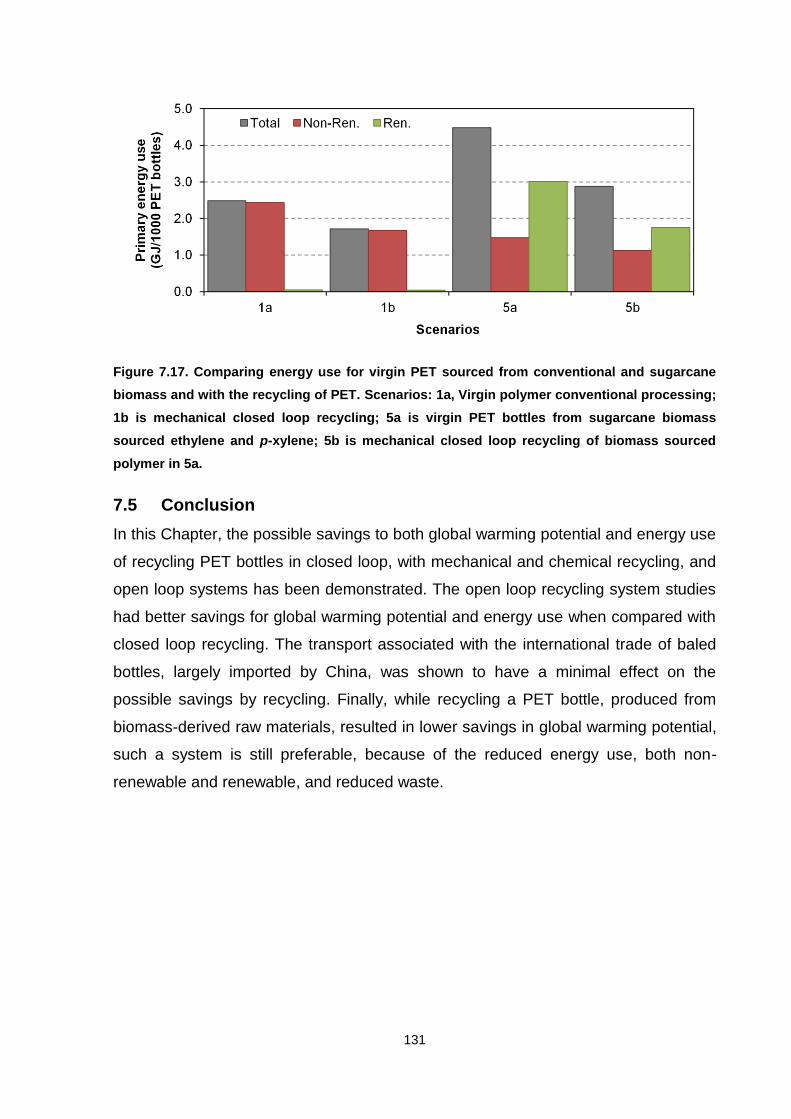
131
Figure 7.17. Comparing energy use for virgin PET sourced from conventional and sugarcane
biomass and with the recycling of PET. Scenarios: 1a, Virgin polymer conventional processing;
1b is mechanical closed loop recycling; 5a is virgin PET bottles from sugarcane biomass
sourced ethylene and p-xylene; 5b is mechanical closed loop recycling of biomass sourced
polymer in 5a.
7.5 Conclusion
In this Chapter, the possible savings to both global warming potential and energy use
of recycling PET bottles in closed loop, with mechanical and chemical recycling, and
open loop systems has been demonstrated. The open loop recycling system studies
had better savings for global warming potential and energy use when compared with
closed loop recycling. The transport associated with the international trade of baled
bottles, largely imported by China, was shown to have a minimal effect on the
possible savings by recycling. Finally, while recycling a PET bottle, produced from
biomass-derived raw materials, resulted in lower savings in global warming potential,
such a system is still preferable, because of the reduced energy use, both non-
renewable and renewable, and reduced waste.
132
Chapter 8 Conclusions and Further Work
8.1 Conclusions
This Dissertation has investigated the environmental impacts associated with various
routes to polyester production and compared them with the environmental impacts of
the existing polyester value chain based on raw materials from fossil fuels. This was
undertaken in order to assess the sustainability of the possible routes using LCA.
The three main conclusions of this research are:
1. It has been shown that the raw material feedstocks, ethylene and p-xylene, for
polyester production can be derived from a range of biomass sources and
result in savings to the global warming potential and non-renewable energy
use.
2. The potential uses of biomass within the polyester value chain, whether as a
feedstock for chemicals (ethylene or p-xylene) production, or for generating
process heat or electricity were compared; the best possible use of biomass
within the value chain is by combustion for process heat to reduce the global
warming potential and non-renewable energy use.
3. Recycling is beneficial in all cases because it reduces the raw material
feedstock requirements and consequently lowers all environmental impacts.
These three conclusions are now discussed in more detail.
In Chapter 4, the environmental impacts of producing a PET bottle using ethylene
glycol derived from biomass, both sugarcane and willow, were investigated, and
compared to conventional production. For sugarcane, the sugars contained in the
juice were fermented to bioethanol and the cellulosic sugarcane bagasse was burnt
for electricity generation. It was found that the global warming potential and non-
renewable resource use could be reduced with respect to conventional production of
PET by 28% and 16% respectively, when bioethanol from the fermentation of
sugarcane is converted to ethylene. The main drawback in using sugarcane as a
feedstock would be an increase in other environmental impacts, such as acidification
and eutrophication potential. This is largely caused by the cultivation of the
133
sugarcane and its requirement for artificial fertilisers. Willow was considered as a
source of lignocellulosic biomass. First, its content of cellulose and hemicellulose
needs to be converted to sugars, which can then be fermented to ethanol. Willow
could also potentially reduce non-renewable resource use by 16%, and did not
increase acidification and eutrophication as significantly as sugarcane. From the
analysis of a putative supply chain, with PET production located in both the UK and
USA, the transport of finished and intermediate products only made a minor
contribution to the environmental impacts.
Chapter 5 focused on an alternative route for producing p-xylene, the precursor for
terephthalic acid. Conventionally p-xylene is derived from naphtha; however, new
technologies indicate that p-xylene could be manufactured from biomass. In the
analysis, the relevant parts of willow, sugarcane bagasse and corn stover, would first
be deconstructed to sugars. Sugarcane juice, mainly a sucrose solution, could avoid
the deconstruction step. The sugar solutions could then be catalytically reformed to
p-xylene. For the various feedstocks assessed, only willow and sugarcane, both juice
and bagasse, could be reliably assessed by avoiding allocation. Producing a PET
bottle using p-xylene derived from willow could reduce the global warming potential
and non-renewable energy use by 32% and 2% respectively. Using sugarcane juice
for p-xylene production and burning the bagasse to generate electricity resulted in
larger savings to global warming potential of 87% and non-renewable energy use of
26%, when compared with conventional bottle production. Again, a disadvantage of
using biomass as a raw material was that all other impact categories, most notably,
those for eutrophication and acidification, were increased over the conventional raw
material.
Chapter 6 compared the potential uses of biomass within the polyester value chain,
whether as a feedstock for chemicals (ethylene or p-xylene) production, or for
generating process heat or electricity. The various cases were assessed in terms of
the biomass energy input that would be required in order to reduce the global
warming potential and non-renewable energy use in the production of 1 tonne of
bottle-grade PET. From the analysis, it was found that the best possible use of
biomass within the value chain would be combustion for process heat. This was
closely followed by burning biomass to generate electricity. Only in one scenario,
134
ethylene made from ethanol produced by the fermentation of sugars from hydrolysed
willow, and for one measure, global warming potential, was producing a chemical
from biomass better then combustion for process heating. A sensitivity analysis
showed that the results were sensitive to conversion efficiency; however, with a 5%
reduction of heat and electricity conversion efficiency, the overall conclusions remain
unchanged. This conclusion is also sensitive to the energy sources from which heat
and grid electricity are produced. The optimal use of biomass as a chemical
feedstock or energy source may therefore shift in the future as conventional energy
sources change.
Finally, in Chapter 7, the possible savings, in both global warming potential and
energy use, when recycling PET bottles has been demonstrated. This applies both to
closed-loop and open-loop systems. The open-loop recycling system had better
savings for global warming potential and energy use when compared with closed-
loop recycling. The transport associated with the international trade of baled bottles,
largely imported by China, was shown to have a minimal effect on the possible
savings by recycling. Finally, recycling PET bottles produced from biomass-derived
feedstocks resulted in lower savings in global warming potential than producing virgin
PET bottles from biomass-derived feedstocks. However, such a recycling system
would still be preferable because of the reduced waste and energy use, both non-
renewable and renewable.
8.2 Further Work
The studies conducted in this research have yielded suggestions to reduce the
environmental impacts of producing polyester; however, an economic feasibility study
would be required before such alternatives routes could be adopted by the industry.
Secondly, while preliminary land calculations for the use of biomass have been
performed in this Dissertation to provide an element of scale to the reader, the
consequential LCA for land use has not been investigated. This is an area for more
detailed analysis in future work.
A suitable solution for the issue of allocation for biomass crops in the routes
investigated was not found. Sensitivity analysis showed that allocation method could
significantly affect the results. Further work developing an understanding of causal
135
relationships between the agricultural inputs and crop outputs would enhance this
research in this area. Alternatively, further work expanding the system boundary for
other uses of the biomass by-products could be done.
While a detailed analysis has been performed on the polyester value chain and its
alternative routes, there are several promising routes still to be investigated, which
were described in Chapter 1. These include:
The catalytic route to glycols from biomass
The fermentation route to isobutanol and the catalytic post-processing to
p-xylene
Another useful area of work not covered in this Dissertation would be to develop a
comparison of the substitutes for, and alternatives to, PET, e.g. glass or aluminium
for packaging, cotton for fibres, and PEF and PLA as alternative polymers. As
described in Chapter 2, while some comparisons have previously been made, studies
have compared different drink container sizes, thereby making unfair comparisons,
while others have not specified the functional unit correctly or make assumptions with
no practical basis. Given the broad range of products, use patterns, and production
requirements, a detailed study on this area would be time consuming, yet valuable to
many different industries by illustrating the strengths and weaknesses of each
product.
Finally, the simplified models used in Chapters 6 and 7 meant that other
environmental impacts beyond global warming potential and non-renewable energy
use could not be reliably investigated. With more detailed study, improvements could
be made to these models, for example, by including the full range of chemicals used
in fibre manufacture or by using a more detailed power plant model.
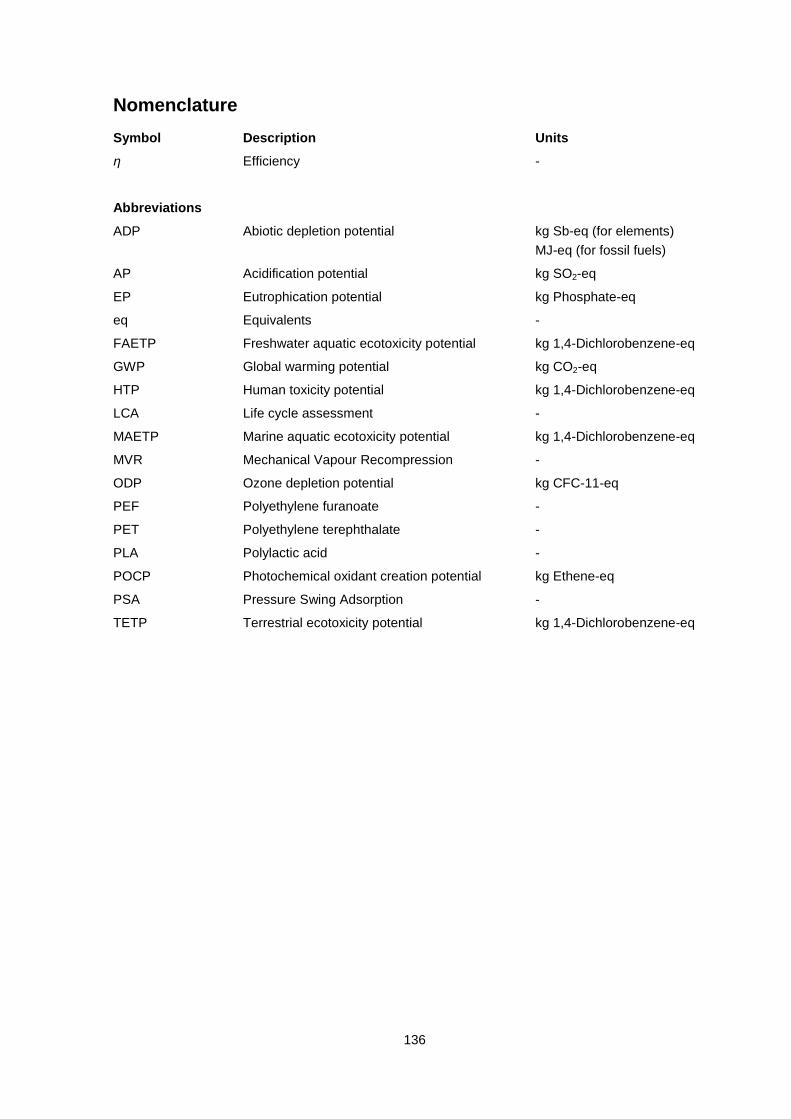
136
Nomenclature
Symbol Description Units
η Efficiency -
Abbreviations
ADP Abiotic depletion potential kg Sb-eq (for elements)
MJ-eq (for fossil fuels)
AP Acidification potential kg SO2-eq
EP Eutrophication potential kg Phosphate-eq
eq Equivalents -
FAETP Freshwater aquatic ecotoxicity potential kg 1,4-Dichlorobenzene-eq
GWP Global warming potential kg CO2-eq
HTP Human toxicity potential kg 1,4-Dichlorobenzene-eq
LCA Life cycle assessment -
MAETP Marine aquatic ecotoxicity potential kg 1,4-Dichlorobenzene-eq
MVR Mechanical Vapour Recompression -
ODP Ozone depletion potential kg CFC-11-eq
PEF Polyethylene furanoate -
PET Polyethylene terephthalate -
PLA Polylactic acid -
POCP Photochemical oxidant creation potential kg Ethene-eq
PSA Pressure Swing Adsorption -
TETP Terrestrial ecotoxicity potential kg 1,4-Dichlorobenzene-eq
137
References
Allwood, J.M., Laursen, S.E., de Rodríguez, C.M., Bocken, N.M.P., 2006. Well Dressed?: The Present and Future Sustainability of Clothing and Textiles in the United Kingdom. University of Cambridge Inst. for Manufacturing, Cambridge.
Amienyo, D., Gujba, H., Stichnothe, H., Azapagic, A., 2012. Life cycle environmental impacts of carbonated soft drinks. Int. J. Life Cycle Assess. 18, 77–92. doi:10.1007/s11367-012-0459-y
Anellotech, 2014. Anellotech Announces Successful Start-Up of Pearl River Pilot Plant with Production of Kilogram-Scale BTX. URL http://www.anellotech.com/downloads/Anellotech-release05-07-2014.pdf
Arena, U., Mastellone, M.L., Perugini, F., 2003. Life Cycle assessment of a plastic packaging recycling system. Int. J. Life Cycle Assess. 8, 92–98. doi:10.1007/BF02978432
Avantium, 2014. YXY Technology. URL http://avantium.com/yxy/YXY-technology.html
Azapagic, A., Clift, R., 1999. Allocation of environmental burdens in co-product systems: product-related burdens (part 1). Int. J. life cycle Assess. 4, 357–369.
Balat, M., 2011. Production of bioethanol from lignocellulosic materials via the biochemical pathway: A review. Energy Convers. Manag. 52, 858–875. doi:http://dx.doi.org/10.1016/j.enconman.2010.08.013
Balat, M., Balat, H., Öz, C., 2008. Progress in bioethanol processing. Prog. Energy Combust. Sci. 34, 551–573. doi:10.1016/j.pecs.2007.11.001
Barrett, J., Peters, G., Wiedmann, T., Scott, K., Lenzen, M., Roelich, K., Le Quéré, C., 2013. Consumption-based GHG emission accounting: a UK case study. Clim. Policy 13, 451–470. doi:10.1080/14693062.2013.788858
Bartolome, L., Imran, M., Cho, B.G., Al-Masry, W.A., Kim, D.H., 2012. Recent Developments in the Chemical Recycling of PET, in: Achilias, D. (Ed.), Material Recycling - Trends and Perspectives. InTech, Rijeka, pp. 65–84.
Biomass Energy Centre, 2014. Emission levels. URL http://www.biomassenergycentre.org.uk/portal/page?_pageid=77,109191&_dad=portal&_schema=PORTAL (accessed 1.5.15).
Blank, B., Cortright, R., Beck, T., Woods, E., Jehring, M., 2014. Catalysts for hydrodeoxygenation of oxygenated hydrocarbons. US20140051872.
Blommel, P.G., Cortright, R.D., 2008. Production of Conventional Liquid Fuels from Sugars. Virent Energy Systems, Inc., Madison.
Boustead, I., 2005. Eco-profiles of the European Plastics Industry: Terephthalic Acid. PlasticsEurope, Brussels.
Braskem, 2014. I’m Green Polyethylene: Where it is produced. URL http://www.braskem.com.br/site.aspx/Where-it-is-produced
Bringezu, S., O’Brien, M., Schütz, H., 2012. Beyond biofuels: Assessing global land use for domestic consumption of biomass. Land use policy 29, 224–232. doi:10.1016/j.landusepol.2011.06.010
138
BSR, 2009. Apparel Industry Life Cycle Carbon Mapping. Business for Social Responsibility.
Cardona, C.A., Quintero, J.A., Paz, I.C., 2010. Production of bioethanol from sugarcane bagasse: Status and perspectives. Bioresour. Technol. 101, 4754–66. doi:10.1016/j.biortech.2009.10.097
Carta, D., Cao, G., D’Angeli, C., 2003. Chemical recycling of poly(ethylene terephthalate) (PET) by hydrolysis and glycolysis. Environ. Sci. Pollut. Res. Int. 10, 390–394. doi:10.1065/espr2001.12.104.8
Chen, G.-Q., Patel, M.K., 2012. Plastics derived from biological sources: present and future: a technical and environmental review. Chem. Rev. 112, 2082–99. doi:10.1021/cr200162d
Clift, R., 1998. Engineering for the Environment. Process Saf. Environ. Prot. 76, 151–160. doi:10.1205/095758298529443
CME Group, 2014. Corn Futures Settlements. URL http://www.cmegroup.com/trading/agricultural/grain-and-oilseed/corn_quotes_settlements_futures.html (accessed 9.1.14).
Coca-Cola Enterprises, 2012. Corporate Responsibility and Sustainability Report 2012/2013.
Cocuzza, G., Montoro, I., Calcagno, B., 1975. Recovery of ethylene glycol by plural stage distillation using vapor compression as an energy source. US3875019.
Collins, M., Aumônier, S., 2002. Streamlined Life Cycle Assessment of Two Marks & Spencer plc Apparel Products. Environmental Resources Management, Oxford.
Cooper, T.A., 2013. Developments in bioplastic materials for packaging food, beverages and other fast-moving consumer goods, in: Farmer, N. (Ed.), Trends in Packaging of Food, Beverages and Other Fast-Moving Consumer Goods (FMCG): Markets, Materials and Technologies, Woodhead Publishing Series in Food Science, Technology and Nutrition. Woodhead Publishing, Cambridge, pp. 108–152.
Cortright, R.D., 2009. BioForming Process: Production of Conventional Liquid Fuels from Sugar. ACS/EPA Green Chemistry Conference.
Cortright, R.D., Blommel, P.G., 2014. Synthesis of Liquid Fuels and Chemicals from Oxygenated Hydrocarbons. EP2698416A2.
Culbert, B., Christel, A., 2003. Continuous Solid-State Polycondensation of Polyesters, in: Scheirs, J., Long, T. (Eds.), Modern Polyesters: Chemistry and Technology of Polyesters and Copolyesters. John Wiley & Sons, Chichester, pp. 143–194.
Cullen, J.M., Allwood, J.M., 2009. The role of washing machines in life cycle assessment studies the dangers of using LCA for prioritization. J. Ind. Ecol. 13, 27–37. doi:10.1111/j.1530-9290.2009.00107.x
Cullen, J.M., Allwood, J.M., 2010. The efficient use of energy: Tracing the global flow of energy from fuel to service. Energy Policy 38, 75–81. doi:10.1016/j.enpol.2009.08.054
Daly, H.E., 2005. Operationalising Sustainable Development by Investing in Natural Capital, in: Sahu, N.C., Choudhury, A.K. (Eds.), Dimensions of Environmental and Ecological Economics. Universities Press, pp. 481–494.
Datye, K. V., Raje, H.M., Sharma, N.D., 1984. Poly(ethylene terephthalate) waste and its utilisation: A review. Resour. Conserv. 11, 117–141. doi:10.1016/0166-3097(84)90015-4
139
Davis, R., Tao, L., Tan, E.C.D., Biddy, M.J., Beckham, G.T., Scarlata, C., Jacobson, J., Cafferty, K., Ross, J., Lukas, J., Knorr, D., Schoen, P., 2013. Process Design and Economics for the Conversion of Lignocellulosic Biomass to Hydrocarbons: Dilute-Acid and Enzymatic Deconstruction of Biomass to Sugars and Biological Conversion of Sugars to Hydrocarbons. National Renewable Energy Laboratory, NREL/TP-5100-60223.
De Miranda, C.A.S., Camara, J.J.D., Monken, O.P., Dos Santos, C.G., 2011. Design Optimization and Weight Reduction of 500 mL CSD PET Bottle through FEM Simulations. J. Mater. Sci. Eng. B 1, 947–959.
DECC, 2014. 2012 UK Greenhouse Gas Emissions, Final Figures. Department of Energy & Climate Change.
Dever, J.P., George, K.F., Hoffman, W.C., Soo, H., Union Carbide Corporation, 1998. Ethylene Oxide, in: Kroschwitz, J., Howe-Grant, M. (Eds.), Kirk-Othmer Encyclopedia of Chemical Technology Volume 9. Wiley, New York, pp. 450–470.
Drexhage, J., Murphy, D., 2012. Sustainable Development: From Brundtland to Rio 2012. United Nations, New York.
Ecoinvent Centre, 2010. Ecoinvent Database v2.2.
EIA, 2014. China Analysis - US Energy Information Administration. URL http://www.eia.gov/countries/cab.cfm?fips=ch (accessed 9.17.14).
Elkington, J., 1998. Cannibals with Forks: The Triple Bottom Line of 21st Century Business, Conscientious commerce. New Society Publishers.
European Commission, 2014. EU Action on Climate. URL http://ec.europa.eu/clima/policies/brief/eu/index_en.htm (accessed 10.30.14).
Fan, D., Dai, D.-J., Wu, H.-S., 2012. Ethylene Formation by Catalytic Dehydration of Ethanol with Industrial Considerations. Materials (Basel). 6, 101–115. doi:10.3390/ma6010101
Finnveden, G., Johansson, J., Lind, P., Moberg, Å., 2005. Life cycle assessment of energy from solid waste—part 1: general methodology and results. J. Clean. Prod. 13, 213–229. doi:10.1016/j.jclepro.2004.02.023
Forkner, M.W., Robson, J.H., Snellings, W.M., Union Carbide Corporation, 1998. Ethylene Glycol and Oligomers, in: Kroschwitz, J., Howe-Grant, M. (Eds.), Kirk-Othmer Encyclopedia of Chemical Technology Volume 12. Wiley, New York, pp. 354–364.
Franklin Associates, 2007. LCI Summary for PLA and PET 12-ounce water bottles. Prairie Village.
Franklin Associates, 2009. Life Cycle Inventory of Three Single-Serving Soft Drink Containers. Franklin Associates, Prairie Village.
Franklin Associates, 2011a. Cradle-to-Gate Life Cycle Inventory of Nine Plastic Resins and Four Polyurethane Precursors. Prairie Village.
Franklin Associates, 2011b. Life Cycle Inventory of 100% Postconsumer HDPE and PET Recycled Resin from Postconsumer Containers and Packaging. Prairie Village.
Friends of the Earth, 2014. Land Grabbing. URL https://www.foeeurope.org/land-grabbing (accessed 1.30.15).
140
Gevo, 2014. Gevo Ships Renewable Para-Xylene to Toray - Toray to Convert Gevo’s Para-Xylene to Bio-Polyester (PET). URL http://ir.gevo.com/phoenix.zhtml?c=238618&p=irol-newsArticle&ID=1935464
Ghanta, M., Fahey, D., Subramaniam, B., 2013. Environmental impacts of ethylene production from diverse feedstocks and energy sources. Appl. Petrochemical Res. doi:10.1007/s13203-013-0029-7
Gironi, F., Piemonte, V., 2011. Life cycle assessment of polylactic acid and polyethylene terephthalate bottles for drinking water. Environ. Prog. Sustain. Energy 30, 459–468. doi:10.1002/ep.10490
Global Footprint Network, 2014. World Footprint. URL http://www.footprintnetwork.org/en/index.php/GFN/page/world_footprint/
Guinée, J.B., Gorrée, M., Heijungs, R., Huppes, G., Kleijn, R., de Koning, A., van Oers, L., Wegener Sleeswijk, A., Suh, S., Udo de Haes, H.A., de Bruijn, H., van Duin, R., Huijbregts, M.A.J., 2002. Handbook on life cycle assessment: Operational guide to the ISO standards. Kluwer Academic Publishers, Dordrecht.
Hardin, G., 1968. The tragedy of the commons. Science (80-. ). 162, 1243–8. doi:10.1126/science.162.3859.1243
Holladay, J.E., White, J.F., Bozell, J.J., Johnson, D., 2007. Top Value-Added Chemicals from Biomass Volume II - Results of Screening for Potential Candidates from Biorefinery Lignin.
Honeywell, 2010. Unisim Design Suite R400.
Hopewell, J., Dvorak, R., Kosior, E., 2009. Plastics recycling: challenges and opportunities. Philos. Trans. R. Soc. Lond. B. Biol. Sci. 364, 2115–2126. doi:10.1098/rstb.2008.0311
Houghton, J., 2009. Global Warming: The Complete Briefing. Cambridge University Press.
Hu, Y., Bakker, M., Chen, G., 2009. Trace Elements Emission from the Incineration of Various Plastics Waste, in: 2009 International Conference on Energy and Environment Technology. IEEE, pp. 668–671. doi:10.1109/ICEET.2009.630
Humbird, D., Davis, R., Tao, L., Kinchin, C., Hsu, D., Aden, A., Schoen, P., Lukas, J., Olthof, B., Worley, M., Sexton, D., Dudgeon, D., 2011. Process Design and Economics for Biochemical Conversion of Lignocellulosic Biomass to Ethanol: Dilute-Acid Pretreatment and Enzymatic Hydrolysis of Corn Stover. National Renewable Energy Laboratory, NREL/TP-5100-47764.
IEA Bioenergy, 2007. Energy Technology Essentials: Biomass for Power Generation and CHP.
ISO, 2006a. ISO 14040:2006(E) Environmental management - Life cycle assessment - Principles and framework. Geneva.
ISO, 2006b. ISO 14044:2006(E) Environmental management - Life cycle assessment - Requirements and guidelines. Geneva.
Ji, N., Zhang, T., Zheng, M., Wang, A., Wang, H., Wang, X., Chen, J.G., 2008. Direct Catalytic Conversion of Cellulose into Ethylene Glycol Using Nickel-Promoted Tungsten Carbide Catalysts. Angew. Chemie 120, 8638–8641. doi:10.1002/ange.200803233
Kalliala, E.M., Nousiainen, P., 1999. Life Cycle Assessment Environmental Profile of Cotton and Polyester-Cotton Fabrics. AUTEX Res. J. 1, 8–20.
141
Ketterer, S.G., Blatchley, C.., 2007. Steam Jet Vacuum Pumps. Tevose.
Kochar, N.K., Merims, R., Padia, A.S., 1981. Gasohol Developments: Ethylene from Ethanol. Chem. Eng. Prog. 77, 66–70.
Kothandaraman, A., 2010. Carbon dioxide capture by chemical absorption: a solvent comparison study. Massachusetts Institute of Technology.
Lapola, D.M., Priess, J.A., Bondeau, A., 2009. Modeling the land requirements and potential productivity of sugarcane and jatropha in Brazil and India using the LPJmL dynamic global vegetation model. Biomass and Bioenergy 33, 1087–1095. doi:http://dx.doi.org/10.1016/j.biombioe.2009.04.005
Larson, E.D., 2006. A review of life-cycle analysis studies on liquid biofuel systems for the transport sector. Energy Sustain. Dev. 10, 109–126. doi:http://dx.doi.org/10.1016/S0973-0826(08)60536-0
Li, M., Ruddy, T., Fahey, D., Busch, D.H., Subramaniam, B., 2014. Terephthalic Acid Production via Greener Spray Process: Comparative Economic and Environmental Impact Assessments with Mid-Century Process. ACS Sustain. Chem. Eng. 2, 823–835. doi:10.1021/sc4004778
Lin, Z., Ierapetritou, M., Nikolakis, V., 2013. Aromatics from Lignocellulosic Biomass: Economic Analysis of the Production of p-Xylene from 5-Hydroxymethylfurfural. AIChE J. 59, 2079–2087. doi:10.1002/aic.13969
Liu, X., Wang, X., Yao, S., Jiang, Y., Guan, J., Mu, X., 2014. Recent advances in the production of polyols from lignocellulosic biomass and biomass-derived compounds. RSC Adv. 4, 49501–49520. doi:10.1039/C4RA06466F
Lorenzetti, C., Manaresi, P., Berti, C., Barbiroli, G., 2006. Chemical recovery of useful chemicals from polyester (PET) waste for resource conservation: A survey of state of the art. J. Polym. Environ. 14, 89–101. doi:10.1007/s10924-005-8711-1
Luo, L., van der Voet, E., Huppes, G., 2009a. Life cycle assessment and life cycle costing of bioethanol from sugarcane in Brazil. Renew. Sustain. Energy Rev. 13, 1613–1619. doi:http://dx.doi.org/10.1016/j.rser.2008.09.024
Luo, L., van der Voet, E., Huppes, G., Udo de Haes, H.A., 2009b. Allocation issues in LCA methodology: a case study of corn stover-based fuel ethanol. Int. J. Life Cycle Assess. 14, 529–539. doi:10.1007/s11367-009-0112-6
Macdowell, J.T., 1961. Process of reclaiming linear terephthalate polyester. US Pat 3222299.
Madival, S., Auras, R., Singh, S.P., Narayan, R., 2009. Assessment of the environmental profile of PLA, PET and PS clamshell containers using LCA methodology. J. Clean. Prod. 17, 1183–1194. doi:10.1016/j.jclepro.2009.03.015
McIntyre, J.E., 2003. The Historical Development of Polyesters, in: Scheirs, J., Long, T.E. (Eds.), Modern Polyesters: Chemistry and Technology of Polyesters and Copolyesters. John Wiley & Sons, Chichester, pp. 3–30.
Meyer, W.B., Turner II, B.L., 1994. Changes in Land Use and Land Cover: A Global Perspective. Cambridge University Press, Cambridge.
Moberg, Å., Finnveden, G., Johansson, J., Lind, P., 2005. Life cycle assessment of energy from solid waste—part 2: landfilling compared to other treatment methods. J. Clean. Prod. 13, 231–240. doi:10.1016/j.jclepro.2004.02.025
142
Morschbacker, A., 2009. Bio-Ethanol Based Ethylene. Polym. Rev. 49, 79–84. doi:10.1080/15583720902834791
Moura Costa, P., Wilson, C., 2000. An equivalence factor between CO2 avoided emissions and sequestration - Description and application in forestry. Mitig. Adapt. Strateg. Glob. Chang. 5, 51–60. doi:10.1023/A:1009697625521
Olivier, J.G.J., Janssens-Maenhout, G., Muntean, M., Peters, J.A.H.W., 2013. Trends in Global CO2 Emissions: 2013 Report. PBL Netherlands Environmental Assessment Agency, The Hague.
Ostrowski, H.S., 1970. Continuous atmospheric depolymerization of polyester. US Pat.3884850.
Paszun, D., Spychaj, T., 1997. Chemical Recycling of Poly(ethylene terephthalate). Ind. Eng. Chem. Res. 36, 1373–1383. doi:10.1021/ie960563c
Patzek, T.W., Anti, S.-M., Campos, R., Ha, K.W., Lee, J., Li, B., Padnick, J., Yee, S. -a., 2005. Ethanol From Corn: Clean Renewable Fuel for the Future, or Drain on Our Resources and Pockets? Environ. Dev. Sustain. 7, 319–336. doi:10.1007/s10668-004-7317-4
PCI Xylenes & Polyesters, 2013. Personal Communication.
PE International, 2013. PE: Gabi 6 Software System and Databases for Life Cycle Engineering.
Pérez, R., 1997. Feeding Pigs in the Tropics: Sugar cane, Feeding pigs in the tropics. Food and Agriculture Organization of the United Nations, Rome.
Perry, R.H., Green, D.W., Maloney, J.O., 2004. Perry’s Chemical Engineers' Handbook, 7th ed. McGraw-Hill, New York.
PlasticsEurope, 2011. Eco-profiles and Environmental Product Declarations of the European Plastics Manufacturers: Polethylene Terephthalate (PET) (Bottle Grade). PlasticsEurope, Brussels.
Platts, 2013. Platts Global Ethylene Price Index. URL http://www.platts.com/news-feature/2013/petrochemicals/pgpi/ethylene
Pordesimo, L.O., Hames, B.R., Sokhansanj, S., Edens, W.C., 2005. Variation in corn stover composition and energy content with crop maturity. Biomass and Bioenergy 28, 366–374. doi:10.1016/j.biombioe.2004.09.003
Quirin, M., Gärtner, S.O., Pehnt, M., Reinhardt, G., 2004. CO2 mitigation through biofuels in the transport sector - Status and Perspectives. Institute for Energy and Environmental Research, Heidelberg.
Rieckmann, T., Völker, S., 2003. Poly(ethylene Terephthalate) Polymerization - Mechanism, Catalysis, Kinetics, Mass Transfer and Reactor Design, in: Scheirs, J., Long, T.E. (Eds.), Modern Polyesters: Chemistry and Technology of Polyesters and Copolyesters. John Wiley & Sons, Chichester, pp. 31–116.
Sarkar, N., Ghosh, S.K., Bannerjee, S., Aikat, K., 2012. Bioethanol production from agricultural wastes: An overview. Renew. Energy 37, 19–27. doi:10.1016/j.renene.2011.06.045
Schell, D.J., Harwood, C., 1994. Milling of Lignocellulosic Biomass: Results of Pilot-Scale Testing. Appl. Biochem. Biotechnol. 45/46, 159–168.
Schill, S.R., 2010. Braskem starts up ethanol-to-ethylene plant. Ethanol Prod. Mag. URL http://www.ethanolproducer.com/articles/7022/braskem-starts-up-ethanol-to-ethylene-plant
143
Schmidt, J.H., 2008. System delimitation in agricultural consequential LCA. Int. J. Life Cycle Assess. 13, 350–364. doi:10.1007/s11367-008-0016-x
Shen, L., Nieuwlaar, E., Worrell, E., Patel, M.K., 2011. Life cycle energy and GHG emissions of PET recycling: change-oriented effects. Int. J. Life Cycle Assess. 16, 522–536. doi:10.1007/s11367-011-0296-4
Shen, L., Worrell, E., Patel, M.K., 2010. Open-loop recycling: A LCA case study of PET bottle-to-fibre recycling. Resour. Conserv. Recycl. 55, 34–52. doi:10.1016/j.resconrec.2010.06.014
Sinnott, R.K., 2005. Coulson & Richardson’s Chemical Engineering Volume 6: Chemical Engineering Design, 4th ed. Elsevier, Oxford.
Smith, G.G., Barker, R.H., 1995. Life cycle analysis of a polyester garment. Resour. Conserv. Recycl. 14, 233–249. doi:10.1016/0921-3449(95)00019-F
Socolow, R., Andrews, C., Berkhout, F., Thomas, V., 1994. Industrial Ecology and Global Change. Cambridge University Press, Cambridge.
Song, H.-S., Hyun, J.C., 1999. A study on the comparison of the various waste management scenarios for PET bottles using the life-cycle assessment (LCA) methodology. Resour. Conserv. Recycl. 27, 267–284. doi:10.1016/S0921-3449(99)00022-1
Spatari, S., Zhang, Y., MacLean, H.L., 2005. Life Cycle Assessment of Switchgrass- and Corn Stover-Derived Ethanol-Fueled Automobiles. Environ. Sci. Technol. 39, 9750–9758. doi:10.1021/es048293+
Steinberger, J.K., Friot, D., Jolliet, O., Erkman, S., 2009. A spatially explicit life cycle inventory of the global textile chain. Int. J. Life Cycle Assess. 14, 443–455. doi:10.1007/s11367-009-0078-4
Stephenson, A., MacKay, D., 2014. Life Cycle Impacts of Biomass Electricity in 2020. Department of Energy & Climate Change, London.
Stephenson, A.L., Dupree, P., Scott, S.A., Dennis, J.S., 2010. The environmental and economic sustainability of potential bioethanol from willow in the UK. Bioresour. Technol. 101, 9612–9623. doi:http://dx.doi.org/10.1016/j.biortech.2010.07.104
Tabone, M.D., Cregg, J.J., Beckman, E.J., Landis, A.E., 2010. Sustainability metrics: life cycle assessment and green design in polymers. Environ. Sci. Technol. 44, 8264–9. doi:10.1021/es101640n
Templeton, D.W., Scarlata, C.J., Sluiter, J.B., Wolfrum, E.J., 2010. Compositional analysis of lignocellulosic feedstocks. 2. Method uncertainties. J. Agric. Food Chem. 58, 9054–62. doi:10.1021/jf100807b
Tuck, C.O., Pérez, E., Horváth, I.T., Sheldon, R.A., Poliakoff, M., 2012. Valorization of biomass: deriving more value from waste. Science 337, 695–9. doi:10.1126/science.1218930
UDOP, 2014. ATR Values Practiced During the 00/01 to 14/15 Harvests. URL http://www.udop.com.br/index.php?item=cana (accessed 9.1.14).
UK Parliament, 2008. Climate Change Act 2008. UK.
UNFCCC, 2014. Kyoto Protocol. URL http://unfccc.int/kyoto_protocol/items/2830.php
Unica, 2013. Unicadata. URL www.unicadata.com.br
144
US Environmental Protection Agency, 2007. Biomass Combined Heat and Power Catalog of Technologies.
Virent, 2014. Virent to expand demo plant capabilities to scale plant-based paraxylene. URL http://www.virent.com/news/virent-to-expand-demo-plant-capabilities-to-scale-plant-based-paraxylene/
Volk, T. a., Abrahamson, L.P., Cameron, K.D., Castellano, P., Corbin, T., Fabio, E., Johnson, G., Kuzovkina-Eischen, Y., Labrecque, M., Miller, R., Sidders, D., Smart, L.B., Staver, K., Stanosz, G.R., Van Rees, K., 2011. Yields of willow biomass crops across a range of sites in North America. Asp. Appl. Biol. 112, 67–74.
Von Blottnitz, H., Curran, M.A., 2007. A review of assessments conducted on bio-ethanol as a transportation fuel from a net energy, greenhouse gas, and environmental life cycle perspective. J. Clean. Prod. 15, 607–619. doi:http://dx.doi.org/10.1016/j.jclepro.2006.03.002
Wackernagel, M., Rees, W., 1998. Our Ecological Footprint: Reducing Human Impact on the Earth, New catalyst bioregional series. New Society Publishers.
Wackernagel, M., Schulz, N.B., Deumling, D., Linares, A.C., Jenkins, M., Kapos, V., Monfreda, C., Loh, J., Myers, N., Norgaard, R., Randers, J., 2002. Tracking the ecological overshoot of the human economy. Proc. Natl. Acad. Sci. U. S. A. 99, 9266–71. doi:10.1073/pnas.142033699
Walford, S., 1996. Composition of Cane Juice, in: South African Sugar Technologists’ Association. Durban, pp. 265–266.
Wang, A., Zhang, T., 2013. One-pot conversion of cellulose to ethylene glycol with multifunctional tungsten-based catalysts. Acc. Chem. Res. 46, 1377–86. doi:10.1021/ar3002156
WCED, 1987. Our Common Future. United Nations.
Weissermel, K., Arpe, H.-J., 2003. Industrial Organic Chemistry. Wiley-VCH, Weinheim.
Werpy, T., Petersen, G., Aden, A., Bozell, J., Holladay, J., White, J., Manheim, A., Eliot, D., Lasure, L., Jones, S., 2004. Top value added chemicals from biomass: Volume I - Results of screening for potential candidates from sugars and synthesis gas.
Woolridge, A.C., Ward, G.D., Phillips, P.S., Collins, M., Gandy, S., 2006. Life cycle assessment for reuse/recycling of donated waste textiles compared to use of virgin material: An UK energy saving perspective. Resour. Conserv. Recycl. 46, 94–103. doi:10.1016/j.resconrec.2005.06.006
World Bank, 2014. Data: GEM Commodities. URL http://data.worldbank.org/data-catalog/commodity-price-data (accessed 9.1.14).
Worldometers, 2014. Current World Population. URL http://www.worldometers.info/world-population (accessed 9.1.14).
WWF, Zoological Society of London, Global Footprint Network, Water Footprint Network, 2014. Living Planet Report 2014.
York, R., Rosa, E.A., Dietz, T., 2003. STIRPAT, IPAT and ImPACT: analytic tools for unpacking the driving forces of environmental impacts. Ecol. Econ. 46, 351–365. doi:10.1016/S0921-8009(03)00188-5
Zhu, J.Y., Pan, X.J., 2010. Woody biomass pretreatment for cellulosic ethanol production: Technology and energy consumption evaluation. Bioresour. Technol. 101, 4992–5002. doi:10.1016/j.biortech.2009.11.007
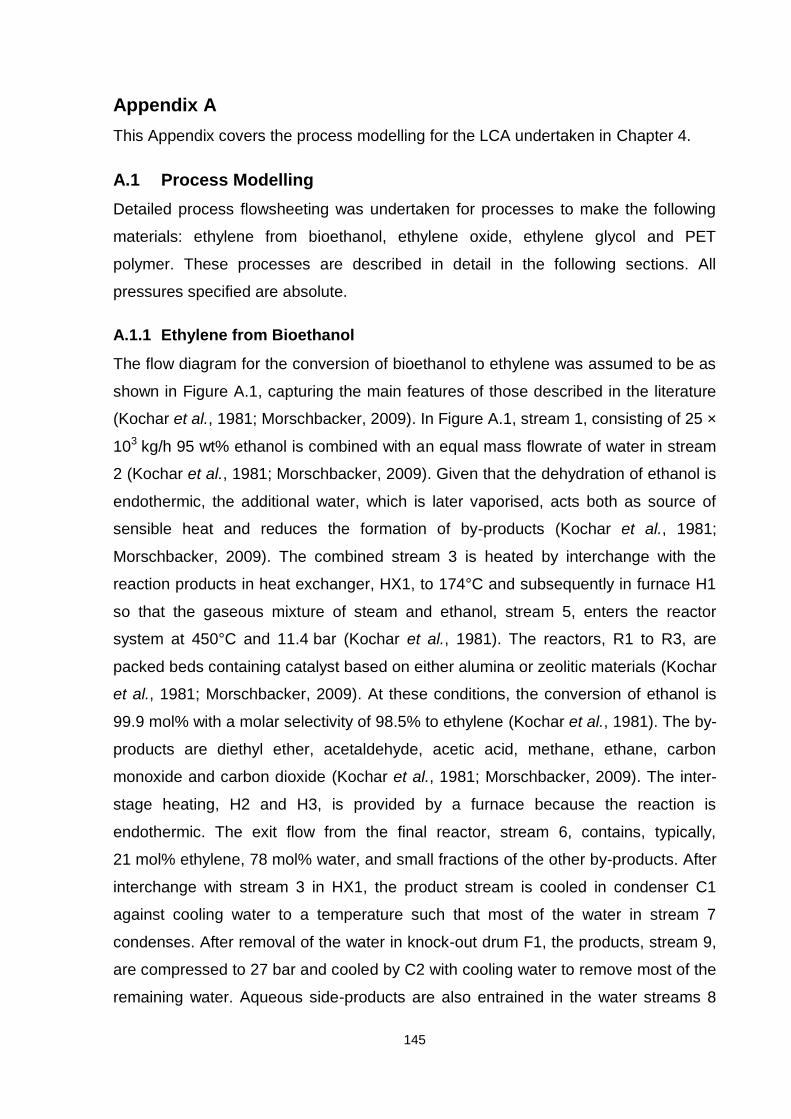
145
Appendix A
This Appendix covers the process modelling for the LCA undertaken in Chapter 4.
A.1 Process Modelling
Detailed process flowsheeting was undertaken for processes to make the following
materials: ethylene from bioethanol, ethylene oxide, ethylene glycol and PET
polymer. These processes are described in detail in the following sections. All
pressures specified are absolute.
A.1.1 Ethylene from Bioethanol
The flow diagram for the conversion of bioethanol to ethylene was assumed to be as
shown in Figure A.1, capturing the main features of those described in the literature
(Kochar et al., 1981; Morschbacker, 2009). In Figure A.1, stream 1, consisting of 25 ×
103 kg/h 95 wt% ethanol is combined with an equal mass flowrate of water in stream
2 (Kochar et al., 1981; Morschbacker, 2009). Given that the dehydration of ethanol is
endothermic, the additional water, which is later vaporised, acts both as source of
sensible heat and reduces the formation of by-products (Kochar et al., 1981;
Morschbacker, 2009). The combined stream 3 is heated by interchange with the
reaction products in heat exchanger, HX1, to 174°C and subsequently in furnace H1
so that the gaseous mixture of steam and ethanol, stream 5, enters the reactor
system at 450°C and 11.4 bar (Kochar et al., 1981). The reactors, R1 to R3, are
packed beds containing catalyst based on either alumina or zeolitic materials (Kochar
et al., 1981; Morschbacker, 2009). At these conditions, the conversion of ethanol is
99.9 mol% with a molar selectivity of 98.5% to ethylene (Kochar et al., 1981). The by-
products are diethyl ether, acetaldehyde, acetic acid, methane, ethane, carbon
monoxide and carbon dioxide (Kochar et al., 1981; Morschbacker, 2009). The inter-
stage heating, H2 and H3, is provided by a furnace because the reaction is
endothermic. The exit flow from the final reactor, stream 6, contains, typically,
21 mol% ethylene, 78 mol% water, and small fractions of the other by-products. After
interchange with stream 3 in HX1, the product stream is cooled in condenser C1
against cooling water to a temperature such that most of the water in stream 7
condenses. After removal of the water in knock-out drum F1, the products, stream 9,
are compressed to 27 bar and cooled by C2 with cooling water to remove most of the
remaining water. Aqueous side-products are also entrained in the water streams 8
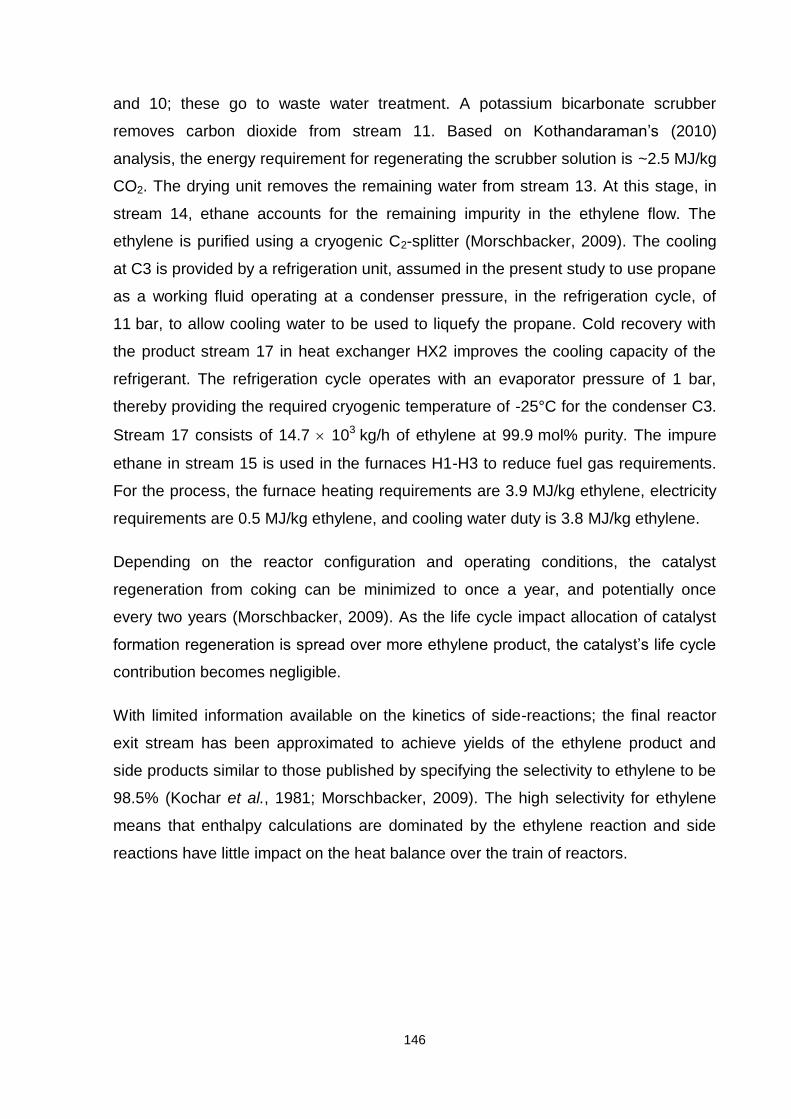
146
and 10; these go to waste water treatment. A potassium bicarbonate scrubber
removes carbon dioxide from stream 11. Based on Kothandaraman’s (2010)
analysis, the energy requirement for regenerating the scrubber solution is ~2.5 MJ/kg
CO2. The drying unit removes the remaining water from stream 13. At this stage, in
stream 14, ethane accounts for the remaining impurity in the ethylene flow. The
ethylene is purified using a cryogenic C2-splitter (Morschbacker, 2009). The cooling
at C3 is provided by a refrigeration unit, assumed in the present study to use propane
as a working fluid operating at a condenser pressure, in the refrigeration cycle, of
11 bar, to allow cooling water to be used to liquefy the propane. Cold recovery with
the product stream 17 in heat exchanger HX2 improves the cooling capacity of the
refrigerant. The refrigeration cycle operates with an evaporator pressure of 1 bar,
thereby providing the required cryogenic temperature of -25°C for the condenser C3.
Stream 17 consists of 14.7 103 kg/h of ethylene at 99.9 mol% purity. The impure
ethane in stream 15 is used in the furnaces H1-H3 to reduce fuel gas requirements.
For the process, the furnace heating requirements are 3.9 MJ/kg ethylene, electricity
requirements are 0.5 MJ/kg ethylene, and cooling water duty is 3.8 MJ/kg ethylene.
Depending on the reactor configuration and operating conditions, the catalyst
regeneration from coking can be minimized to once a year, and potentially once
every two years (Morschbacker, 2009). As the life cycle impact allocation of catalyst
formation regeneration is spread over more ethylene product, the catalyst’s life cycle
contribution becomes negligible.
With limited information available on the kinetics of side-reactions; the final reactor
exit stream has been approximated to achieve yields of the ethylene product and
side products similar to those published by specifying the selectivity to ethylene to be
98.5% (Kochar et al., 1981; Morschbacker, 2009). The high selectivity for ethylene
means that enthalpy calculations are dominated by the ethylene reaction and side
reactions have little impact on the heat balance over the train of reactors.
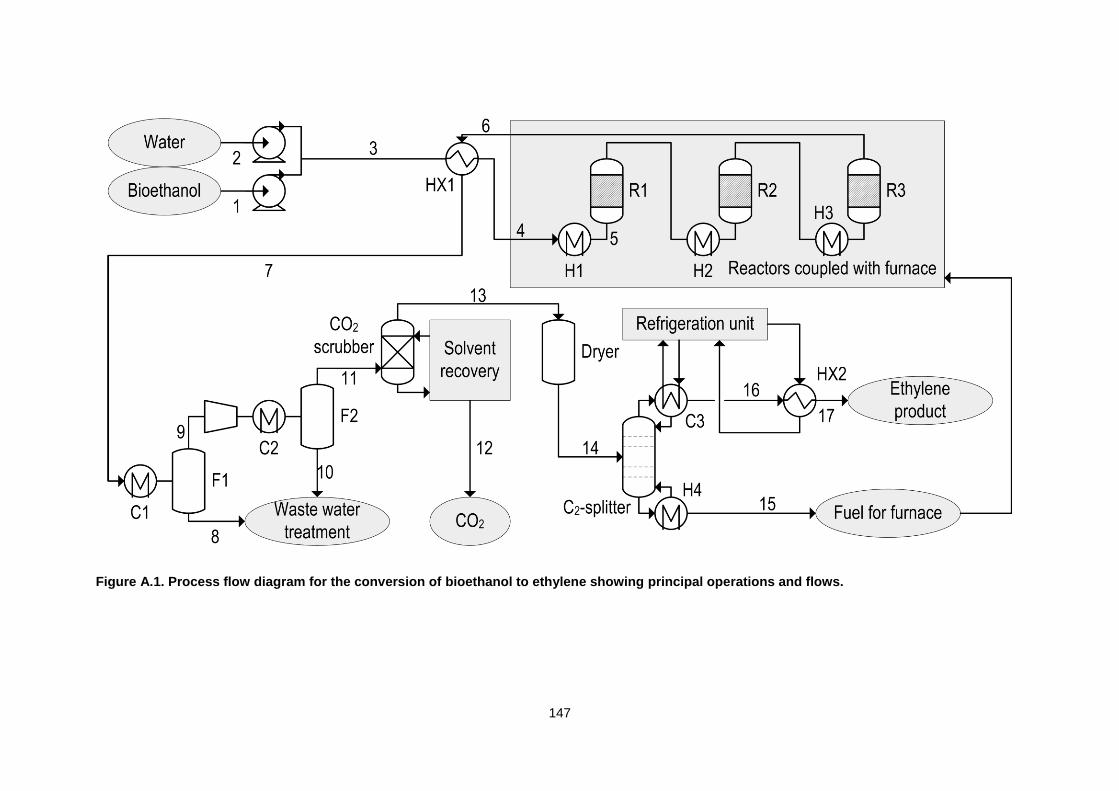
147
Figure A.1. Process flow diagram for the conversion of bioethanol to ethylene showing principal operations and flows.
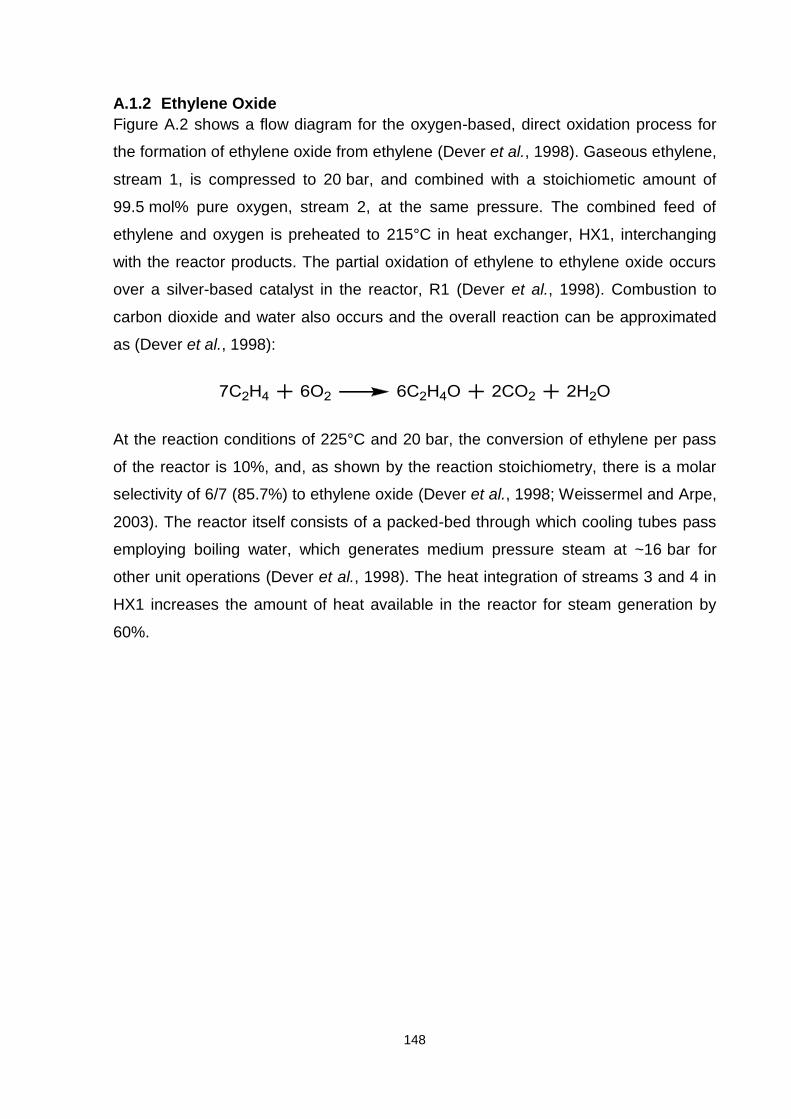
148
A.1.2 Ethylene Oxide
Figure A.2 shows a flow diagram for the oxygen-based, direct oxidation process for
the formation of ethylene oxide from ethylene (Dever et al., 1998). Gaseous ethylene,
stream 1, is compressed to 20 bar, and combined with a stoichiometic amount of
99.5 mol% pure oxygen, stream 2, at the same pressure. The combined feed of
ethylene and oxygen is preheated to 215°C in heat exchanger, HX1, interchanging
with the reactor products. The partial oxidation of ethylene to ethylene oxide occurs
over a silver-based catalyst in the reactor, R1 (Dever et al., 1998). Combustion to
carbon dioxide and water also occurs and the overall reaction can be approximated
as (Dever et al., 1998):
At the reaction conditions of 225°C and 20 bar, the conversion of ethylene per pass
of the reactor is 10%, and, as shown by the reaction stoichiometry, there is a molar
selectivity of 6/7 (85.7%) to ethylene oxide (Dever et al., 1998; Weissermel and Arpe,
2003). The reactor itself consists of a packed-bed through which cooling tubes pass
employing boiling water, which generates medium pressure steam at ~16 bar for
other unit operations (Dever et al., 1998). The heat integration of streams 3 and 4 in
HX1 increases the amount of heat available in the reactor for steam generation by
60%.
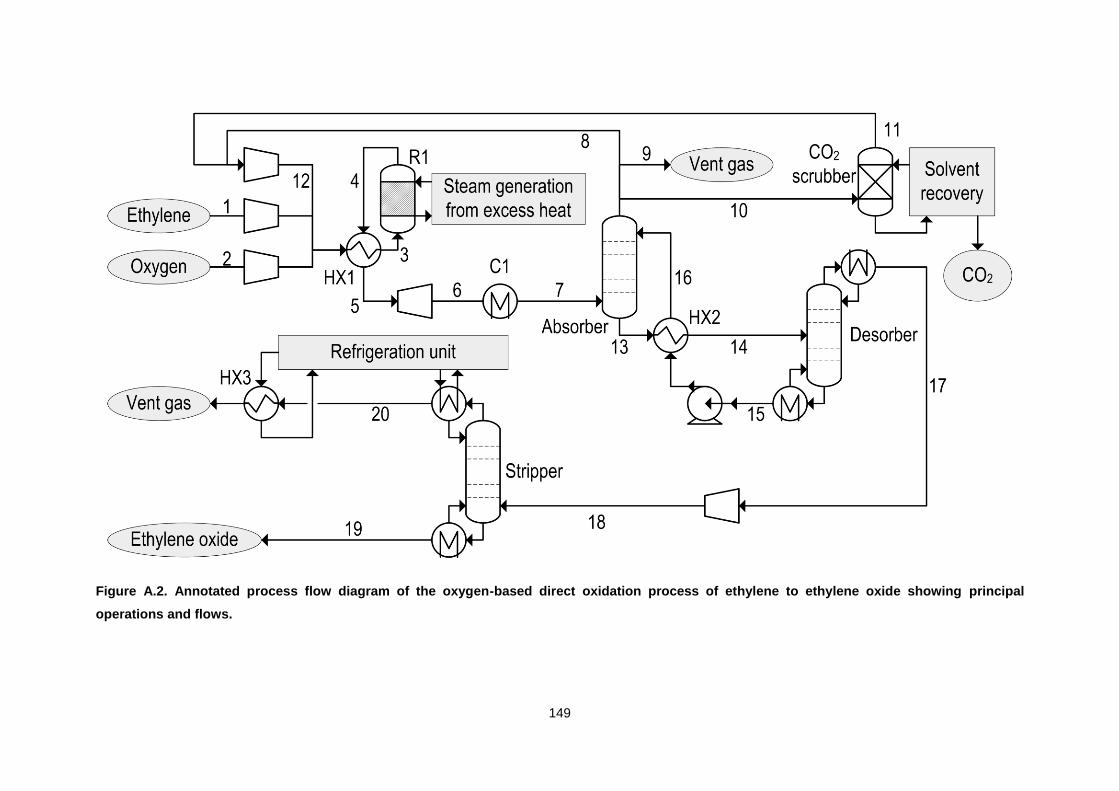
149
Figure A.2. Annotated process flow diagram of the oxygen-based direct oxidation process of ethylene to ethylene oxide showing principal
operations and flows.
150
Owing to the low conversion per pass, the process operates with a recycle, stream 8
(Dever et al., 1998). Thus, the exit gases from R1, stream 5, are expanded through a
turbine to 10 bar to recover energy and cooled to 30°C (stream 7) to ensure that the
absorber gives a high recovery of ethylene oxide. In the absorption column, ethylene
oxide is scrubbed from the entering gases by counter-current contact with water, with
the resulting solution leaving in stream 13. Of the gaseous mixture leaving the top of
the absorber, ~84% of the flow, stream 8, is directly recycled, 14%, stream 10, is
scrubbed of carbon dioxide with bicarbonate solution prior to recycling (stream 11),
and the final 2% is purged to prevent trace argon, present in the oxygen feed, from
accumulating (stream 9). The presence of CO2 in the reactor reduces yields of
ethylene oxide (Dever et al., 1998); the process calculations for the carbon dioxide
scrubber are similar to those undertaken in the conversion of ethanol to ethylene.
Recovered energy from the expansion from 20 bar at the reactor exit to the 10 bar in
the scrubber balances ~29% of the total compressor energy requirements.
The solution of ethylene oxide, stream 13, is heated by interchange with stream 15 in
HX2, and is then sent to a desorption column, operating at atmospheric pressure.
Water, low in ethylene oxide concentration, stream 15, is recycled to the absorber.
The heat integration of streams 13 and 15 reduces the heat requirements of the
desorber’s reboiler by 66%. Stream 17 represents ethylene oxide leaving the
desorber and requires further purification in a stripper to reduce its content of CO2
from 2 mol% to 0.02 mol%. The column is operated at 5 bar and the temperature at
the top of the column, 4.9°C, requires a chilled cooling duty. A refrigeration cycle was
designed using a similar method as previously discussed. The ethylene oxide of
purity 99 mol%, stream 19, can be used directly in the reactors for the production of
ethylene glycol. The hydrocarbons in streams 9 and 20 are combusted to generate
further process steam. The process generates an excess of useful heat at ~200°C,
9.3 MJ/kg ethylene oxide. By extending the boundaries and integrating with the
ethylene glycol process, the issue of allocation for the excess heat is avoided.
Although a more detailed consideration of the reaction mechanisms suggests the
selectivity in R1 ought to be no more than 80% for ethylene oxide, the value,
assumed above, of 85.7% was retained in the modelling, because selectivities
greater than 80% have been exceeded in industrial practice by modifying the catalyst
151
(Dever et al., 1998; Weissermel and Arpe, 2003). The molar yield of ethylene oxide
for the whole process is 72%, which is within the range achieved in industry (Dever et
al., 1998).
A.1.3 Ethylene Glycol
The flow diagram assumed for the hydrolysis of ethylene oxide to ethylene glycol is
shown in Figure A.3. Streams 1 and 2, consisting respectively of ethylene glycol and
water, are brought to 150°C and 35 bar, using pumps and a heater, H1, as shown
(Forkner et al., 1998). The feed to R1, stream 3, composed of the feedstock streams
1 and 2 and the recycle, 17, contains water and ethylene oxide at a molar ratio of
22:1. At this ratio, there is nearly complete conversion of ethylene oxide and the
selectivity for ethylene glycol is high (Forkner et al., 1998). In R1, the water and
ethylene oxide react in the liquid phase, with some higher-order glycols being formed
from the self oligomerisation of ethylene glycol (Forkner et al., 1998). Owing to
differences in processing within the industry, the range of products formed can vary;
here, it was assumed that, typically, the exit from R1 would contain 90 mol% ethylene
glycol, 7 mol% diethylene glycol, 2 mol% triethylene glycol and 1 mol% tetraethylene
glycol (Forkner et al., 1998). The reactor operates isothermally at 200°C; the
enthalpy required to raise the sensible heat of the reactants from 150°C to this
temperature is balanced by the exothermicity of the reaction.
The separation involves first removing water in multiple columns E1-E4 (Cocuzza et
al., 1975; Forkner et al., 1998). In the configuration shown, Stream 4 containing
3.9 mol% ethylene glycol is flashed into the first column, E1, operating at 8 bar. This
tray column is provided with heater H2. The bottoms, stream 5, contain 5.6 mol%
ethylene glycol. The top product, stream 6, is water vapour at 170°C, and is used to
as a heat source for column E2 by integration in heat exchanger, HX1. By dropping
the pressure in column E2 to 5 bar, the reboiler temperature requirement is 156°C,
therefore enabling the heat integration. Similarly the pressures in columns E3 and E4
are 2 bar and 0.1 bar, requiring reboiler temperatures of 139°C and 133°C. This
allows heat from the vapour leaving column E2, at 152°C, to be split into stream 12
and 13 for use in heat exchangers, HX2 and HX3, to drive the respective columns.
The vacuum pressure in column E4 is created by a steam jet ejector on stream 16, to
achieve the separation specification of 0.4 mol% (0.1 wt%) water content in stream
18 (Cocuzza et al., 1975). The jet ejector steam requirements were calculated using
152
literature methods (Ketterer and Blatchley, 2007; Perry et al., 2004). The condensed
water from streams 7, 9, 14 and 15 are combined and recycled to the reactor.
Stream 18 requires further distillation, in D1 operating at atmospheric pressure, to
separate ethylene glycol from diethylene glycol and higher-order glycols. This
operation is designed to produce ethylene glycol as the top-product, stream 19, at
99.5 mol% purity for the polymerisation. Distillation column, D2, has been shown in
Figure A.3, for further purification of higher order glycols; however for the allocation
method chosen, this final separation does not affect the inventory analysis of
ethylene glycol, as discussed later.
As mentioned previously, the process integration of ethylene oxide and ethylene
glycol means the steam generated from the ethylene oxide reactor and waste gas
combustion is sufficient to supply the heating requirements for heaters H1, H2, H3
and the steam jet ejector. Combining both processes, in producing ethylene glycol
from ethylene, 1.6 MJ electricity and 10.6 MJ of cooling water duty were required per
kg ethylene glycol.
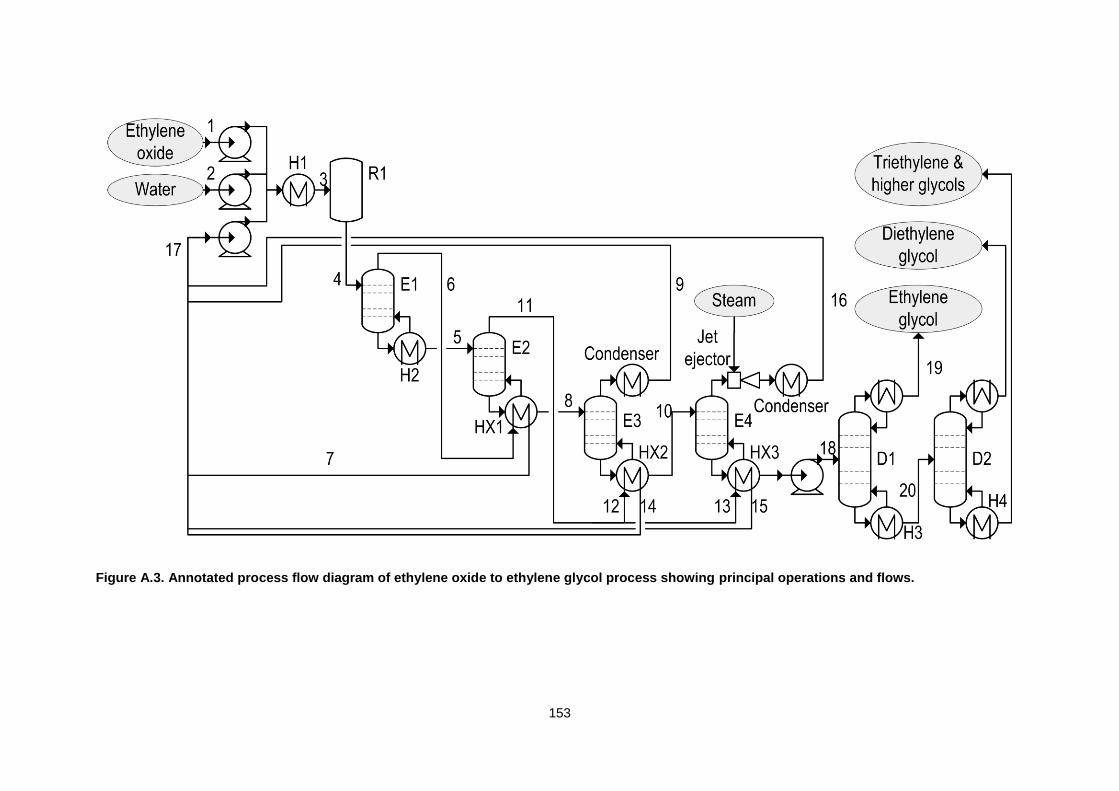
153
Figure A.3. Annotated process flow diagram of ethylene oxide to ethylene glycol process showing principal operations and flows.
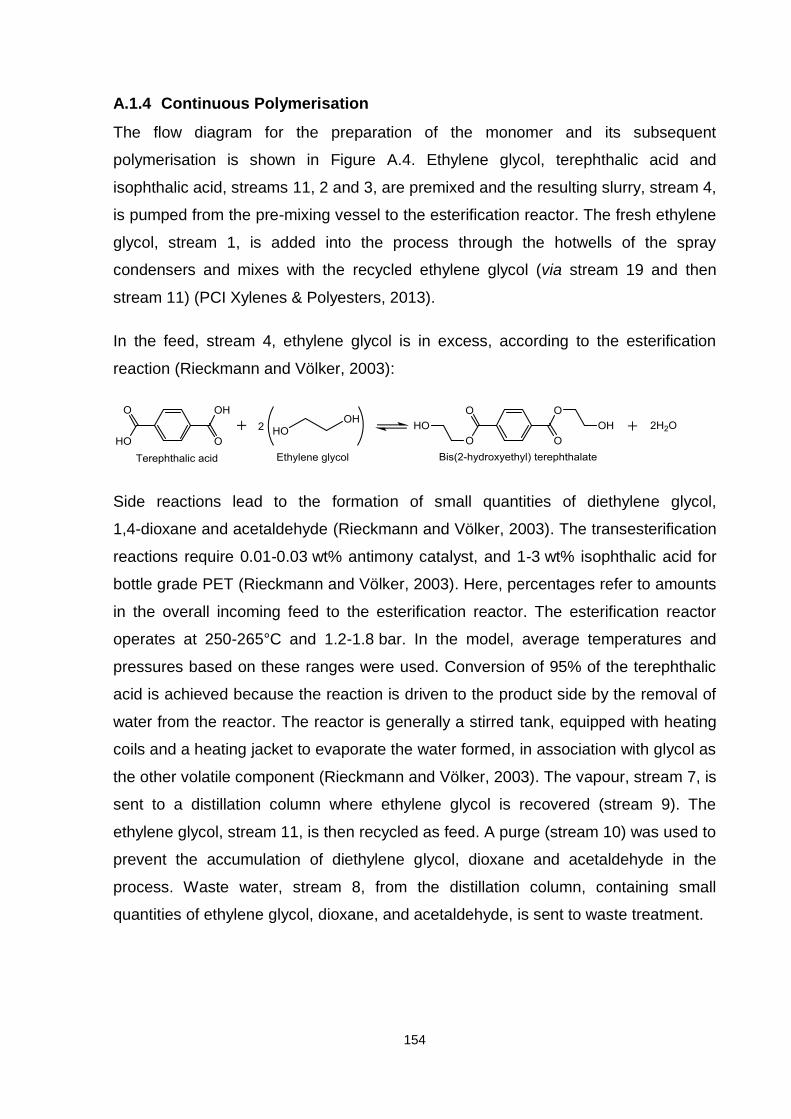
154
A.1.4 Continuous Polymerisation
The flow diagram for the preparation of the monomer and its subsequent
polymerisation is shown in Figure A.4. Ethylene glycol, terephthalic acid and
isophthalic acid, streams 11, 2 and 3, are premixed and the resulting slurry, stream 4,
is pumped from the pre-mixing vessel to the esterification reactor. The fresh ethylene
glycol, stream 1, is added into the process through the hotwells of the spray
condensers and mixes with the recycled ethylene glycol (via stream 19 and then
stream 11) (PCI Xylenes & Polyesters, 2013).
In the feed, stream 4, ethylene glycol is in excess, according to the esterification
reaction (Rieckmann and Völker, 2003):
Side reactions lead to the formation of small quantities of diethylene glycol,
1,4-dioxane and acetaldehyde (Rieckmann and Völker, 2003). The transesterification
reactions require 0.01-0.03 wt% antimony catalyst, and 1-3 wt% isophthalic acid for
bottle grade PET (Rieckmann and Völker, 2003). Here, percentages refer to amounts
in the overall incoming feed to the esterification reactor. The esterification reactor
operates at 250-265°C and 1.2-1.8 bar. In the model, average temperatures and
pressures based on these ranges were used. Conversion of 95% of the terephthalic
acid is achieved because the reaction is driven to the product side by the removal of
water from the reactor. The reactor is generally a stirred tank, equipped with heating
coils and a heating jacket to evaporate the water formed, in association with glycol as
the other volatile component (Rieckmann and Völker, 2003). The vapour, stream 7, is
sent to a distillation column where ethylene glycol is recovered (stream 9). The
ethylene glycol, stream 11, is then recycled as feed. A purge (stream 10) was used to
prevent the accumulation of diethylene glycol, dioxane and acetaldehyde in the
process. Waste water, stream 8, from the distillation column, containing small
quantities of ethylene glycol, dioxane, and acetaldehyde, is sent to waste treatment.
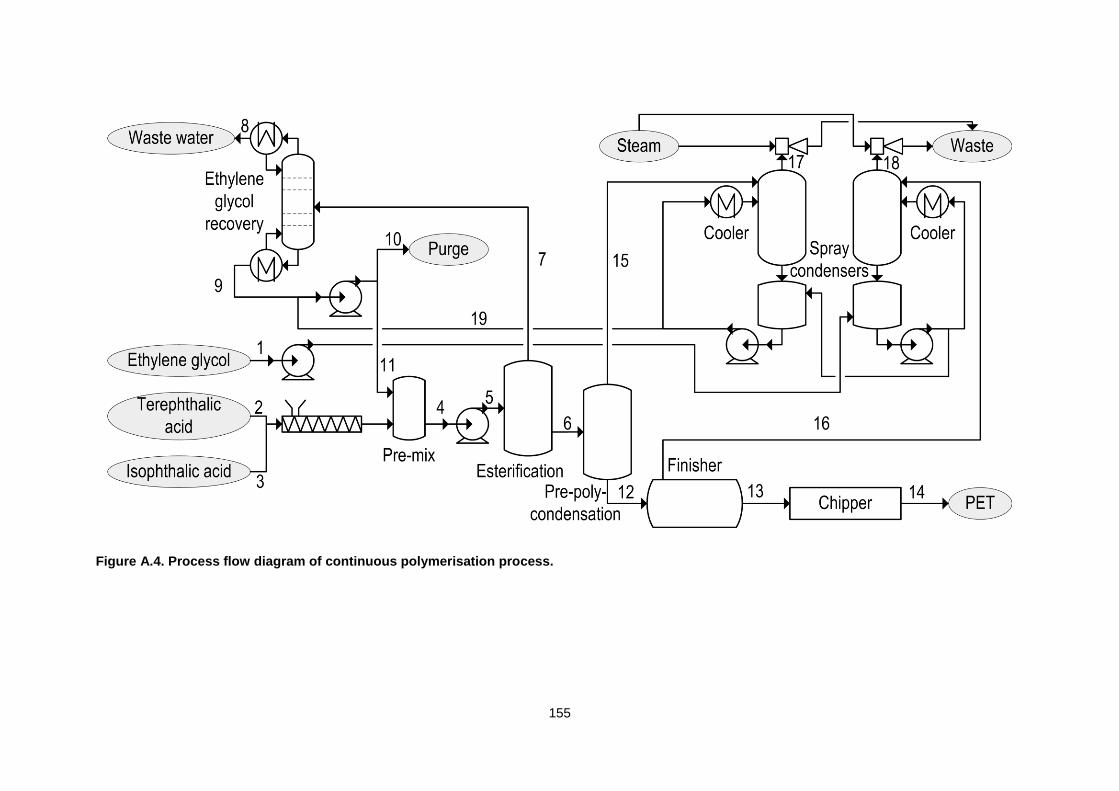
155
Figure A.4. Process flow diagram of continuous polymerisation process.
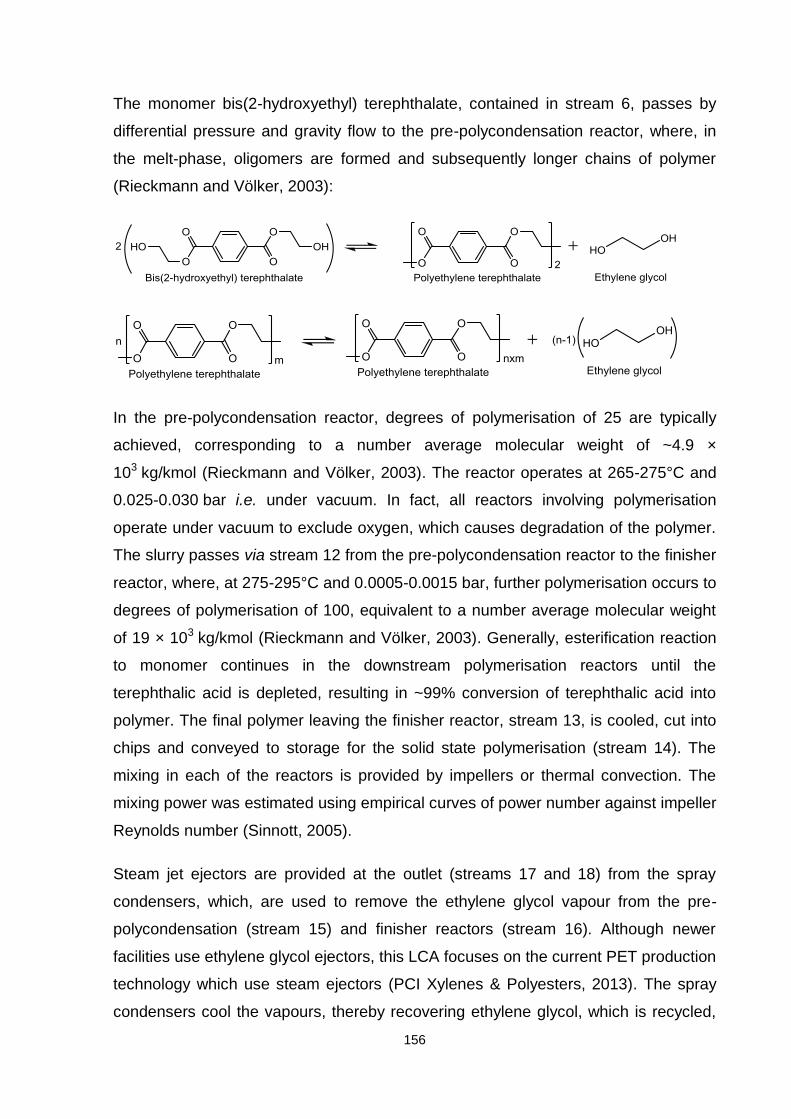
156
The monomer bis(2-hydroxyethyl) terephthalate, contained in stream 6, passes by
differential pressure and gravity flow to the pre-polycondensation reactor, where, in
the melt-phase, oligomers are formed and subsequently longer chains of polymer
(Rieckmann and Völker, 2003):
In the pre-polycondensation reactor, degrees of polymerisation of 25 are typically
achieved, corresponding to a number average molecular weight of ~4.9 ×
103 kg/kmol (Rieckmann and Völker, 2003). The reactor operates at 265-275°C and
0.025-0.030 bar i.e. under vacuum. In fact, all reactors involving polymerisation
operate under vacuum to exclude oxygen, which causes degradation of the polymer.
The slurry passes via stream 12 from the pre-polycondensation reactor to the finisher
reactor, where, at 275-295°C and 0.0005-0.0015 bar, further polymerisation occurs to
degrees of polymerisation of 100, equivalent to a number average molecular weight
of 19 × 103 kg/kmol (Rieckmann and Völker, 2003). Generally, esterification reaction
to monomer continues in the downstream polymerisation reactors until the
terephthalic acid is depleted, resulting in ~99% conversion of terephthalic acid into
polymer. The final polymer leaving the finisher reactor, stream 13, is cooled, cut into
chips and conveyed to storage for the solid state polymerisation (stream 14). The
mixing in each of the reactors is provided by impellers or thermal convection. The
mixing power was estimated using empirical curves of power number against impeller
Reynolds number (Sinnott, 2005).
Steam jet ejectors are provided at the outlet (streams 17 and 18) from the spray
condensers, which, are used to remove the ethylene glycol vapour from the pre-
polycondensation (stream 15) and finisher reactors (stream 16). Although newer
facilities use ethylene glycol ejectors, this LCA focuses on the current PET production
technology which use steam ejectors (PCI Xylenes & Polyesters, 2013). The spray
condensers cool the vapours, thereby recovering ethylene glycol, which is recycled,
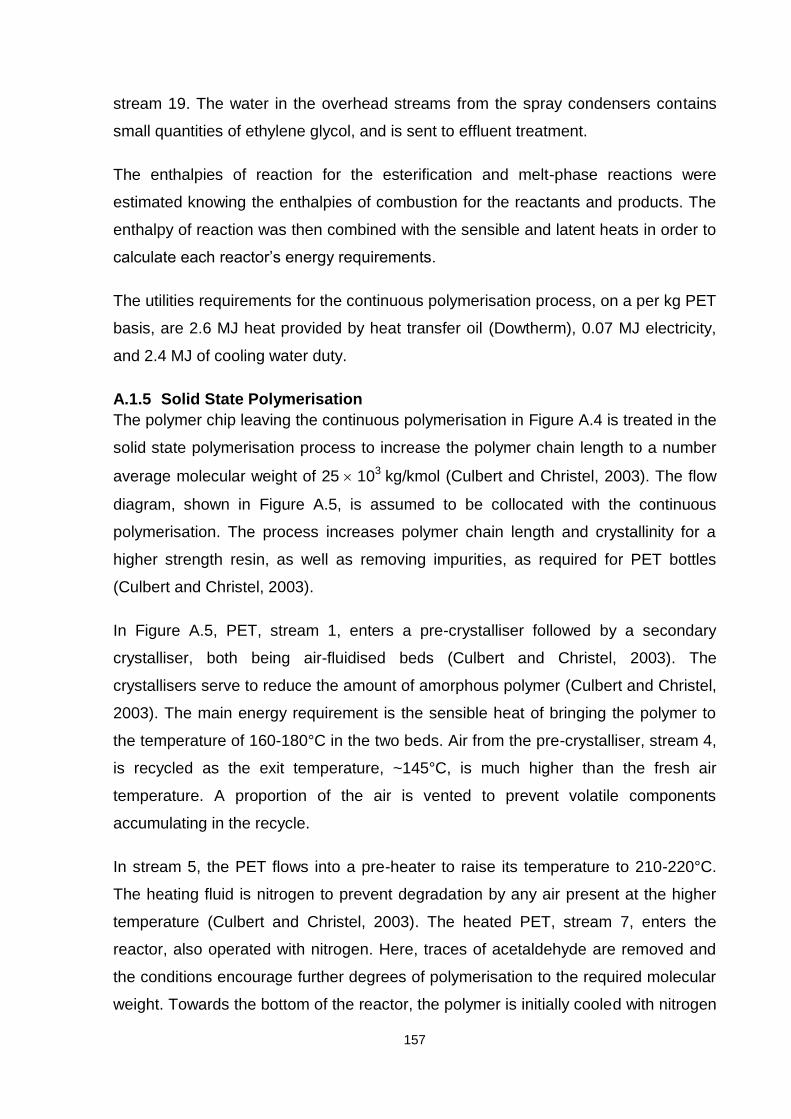
157
stream 19. The water in the overhead streams from the spray condensers contains
small quantities of ethylene glycol, and is sent to effluent treatment.
The enthalpies of reaction for the esterification and melt-phase reactions were
estimated knowing the enthalpies of combustion for the reactants and products. The
enthalpy of reaction was then combined with the sensible and latent heats in order to
calculate each reactor’s energy requirements.
The utilities requirements for the continuous polymerisation process, on a per kg PET
basis, are 2.6 MJ heat provided by heat transfer oil (Dowtherm), 0.07 MJ electricity,
and 2.4 MJ of cooling water duty.
A.1.5 Solid State Polymerisation
The polymer chip leaving the continuous polymerisation in Figure A.4 is treated in the
solid state polymerisation process to increase the polymer chain length to a number
average molecular weight of 25 103 kg/kmol (Culbert and Christel, 2003). The flow
diagram, shown in Figure A.5, is assumed to be collocated with the continuous
polymerisation. The process increases polymer chain length and crystallinity for a
higher strength resin, as well as removing impurities, as required for PET bottles
(Culbert and Christel, 2003).
In Figure A.5, PET, stream 1, enters a pre-crystalliser followed by a secondary
crystalliser, both being air-fluidised beds (Culbert and Christel, 2003). The
crystallisers serve to reduce the amount of amorphous polymer (Culbert and Christel,
2003). The main energy requirement is the sensible heat of bringing the polymer to
the temperature of 160-180°C in the two beds. Air from the pre-crystalliser, stream 4,
is recycled as the exit temperature, ~145°C, is much higher than the fresh air
temperature. A proportion of the air is vented to prevent volatile components
accumulating in the recycle.
In stream 5, the PET flows into a pre-heater to raise its temperature to 210-220°C.
The heating fluid is nitrogen to prevent degradation by any air present at the higher
temperature (Culbert and Christel, 2003). The heated PET, stream 7, enters the
reactor, also operated with nitrogen. Here, traces of acetaldehyde are removed and
the conditions encourage further degrees of polymerisation to the required molecular
weight. Towards the bottom of the reactor, the polymer is initially cooled with nitrogen
158
to 175°C. On leaving the reactor, stream 12, the PET chips are further cooled to
60°C in a fluidised bed by air (stream 13). The hot air used in the cooling is sent via
stream 15 to the pre-crystalliser fluidised bed to reduce the energy requirements.
The nitrogen from the reactor, stream 16, and a fraction of the nitrogen from the pre-
heater, stream 10, is sent to treatment prior to recycling (streams 24 and 25). The
organic impurities are removed from the nitrogen in a platinum catalyst oxidation bed,
only the required amount of oxygen for combustion is added to the system (Culbert
and Christel, 2003). Water is removed by stages of condensation (stream 19) and
drying (stream 21). A purge, stream 22, prevents the small fraction of carbon dioxide
accumulating (Culbert and Christel, 2003).
For the process, heating requirements are 0.039MJ/kg PET, electricity requirements
are 0.030 MJ/kg PET, and the cooling water duty is 0.14 MJ/kg PET.
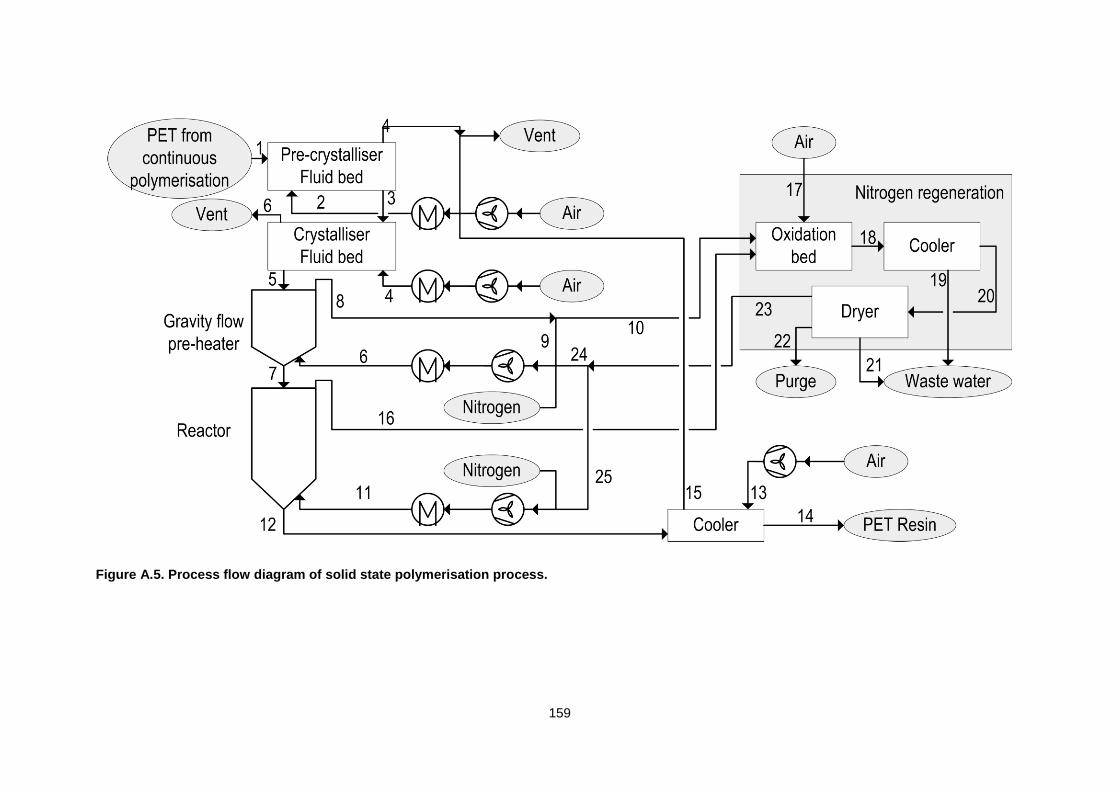
159
Figure A.5. Process flow diagram of solid state polymerisation process.
160
Appendix B
This Appendix covers the process modelling and detailed analyses for the LCA
undertaken in Chapter 5.
B.1 Process Modelling and Allocation
B.1.1 Conventional p-Xylene Processing
Two proprietary designs were analysed for the manufacture of p-xylene from
naphtha; the first design, from 2008, is currently used by many existing
manufacturers in the industry. The second, from 2013, is the most recent including
adjustments to heat integration to improve energy savings (PCI Xylenes &
Polyesters, 2013). A complete set of flowsheets were provided for the 2008 and 2013
designs (PCI Xylenes & Polyesters, 2013). The flowsheets were used to generate an
inventory analysis. Some processes were not included in the flowsheets because
they are typically subcontracted. These additional processing areas, such as,
hydrogen pressure swing adsorption and sour water stripping have been calculated
independently.
A summary of the manufacture of p-xylene from naphtha is shown in Figure B.1. The
primary feed is full range naphtha; in the hydrotreating process, the feedstock is
treated to remove sulphur and olefins to match the specification required by the
catalyst in subsequent processes. The result is two streams, light naphtha and heavy
naphtha. Heavy naphtha is reformed to increase the octane content, generating
reformate, hydrogen and LPG. The reformate is then fractionated: the six processes
in blue are highly integrated for energy recovery and have therefore been assessed
as one block for the inventory analysis. Xylenes fractionation splits the reformate
stream into benzene and toluene, p-xylene and m-xylene, o-xylene, and heavy
aromatics. The Parex unit separates p-xylene and m-xylene, the former is the desired
product while the latter is isomerised in the Isomar unit and fed back to xylenes
fractionation. The Sulfolane unit uses extractive distillation to increase the purity of
benzene and toluene, which are then separated in the benzene-toluene fractionation
unit to produce the benzene product. The Tatoray process disproportionates toluene
and transalkylates toluene with C9/C10+ aromatics to produce benzene and xylenes,
increasing the yield of the desired aromatics.

161
Figure B.1. Block diagram representing principal process areas in p-xylene manufacture.
162
Hydrogen is separated from a mixture of light alkanes produced during reforming
using pressure swing adsorption. The energy requirements for hydrogen pressure
swing adsorption have been calculated by quantifying the compressor and cooling
duties. In this instance, the impure hydrogen stream was assumed to be compressed
to ~69 bara at which ~87% of the hydrogen was recovered. The sour water stripping
unit, which removes H2S, was modelled using a distillation column in Unisim. The
stripper feed was preheated with the stripper water bottoms reducing the stripper
reboiler energy requirements. The stripper column has 8 stages and operates at an
average of 2 bara and reflux ratio of 1, in order to maximise hydrogen sulphide
removal, but minimise the reboiler duty.
Because the overall process produces several products, and because there is a high
level of integration within processes, it is not possible to identify easily the
relationships between products and feeds. It was also not possible to redraw or
expand the system boundaries for this analysis (the preferred method). Allocation
was therefore required. Economic and mass-based allocation methods were used so
that the sensitivity to the method of allocation could be investigated. As shown in
Figure B.1, the processes were categorised as much as possible before allocation
factors were applied to ensure that upstream products (e.g. light naphtha, LPG, and
hydrogen) were not unfairly allocated emissions from the downstream (blue)
processes. While mass allocation is simple, because the mass balances for each
process stage are known, economic allocation is more complicated because product
values vary with market conditions. In order to account for market fluctuations, an
average price for each product over a five year period (2010-2014) was calculated
(PCI Xylenes & Polyesters, 2013). Using these averaged prices, the economic value
of each product (mass×price) was divided by the process’s total value of its J
products, i.e. J
jj pricemass , to determine the economic allocation fractions.
Sample calculation for mass and economic allocation:
For the 2008 design, the continuous catalyst regeneration platforming process
produces 250 t reformate/h, 7.5 t hydrogen/h and 13.6 t LPG/h. Therefore, the mass
allocation fraction for reformate is:
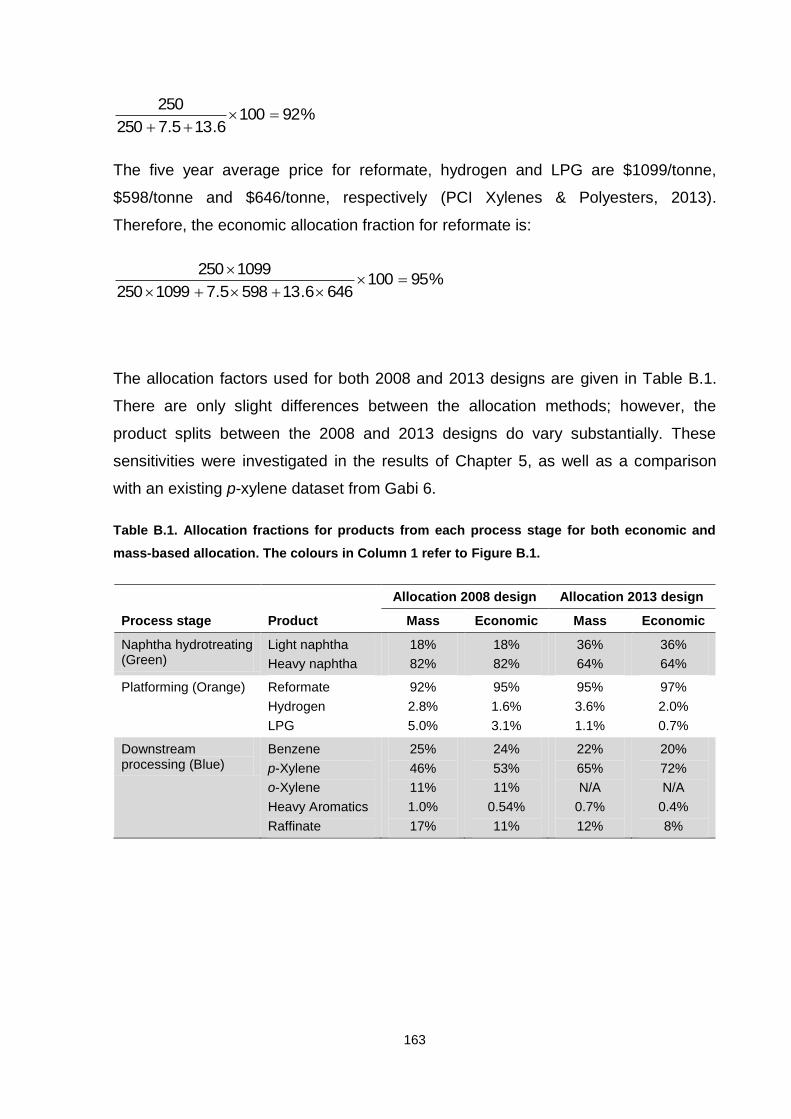
163
%921006.135.7250
250
The five year average price for reformate, hydrogen and LPG are $1099/tonne,
$598/tonne and $646/tonne, respectively (PCI Xylenes & Polyesters, 2013).
Therefore, the economic allocation fraction for reformate is:
%951006466.135985.71099250
1099250
The allocation factors used for both 2008 and 2013 designs are given in Table B.1.
There are only slight differences between the allocation methods; however, the
product splits between the 2008 and 2013 designs do vary substantially. These
sensitivities were investigated in the results of Chapter 5, as well as a comparison
with an existing p-xylene dataset from Gabi 6.
Table B.1. Allocation fractions for products from each process stage for both economic and
mass-based allocation. The colours in Column 1 refer to Figure B.1.
Allocation 2008 design Allocation 2013 design
Process stage Product Mass Economic Mass Economic
Naphtha hydrotreating (Green)
Light naphtha
Heavy naphtha
18%
82%
18%
82%
36%
64%
36%
64%
Platforming (Orange) Reformate
Hydrogen
LPG
92%
2.8%
5.0%
95%
1.6%
3.1%
95%
3.6%
1.1%
97%
2.0%
0.7%
Downstream processing (Blue)
Benzene
p-Xylene
o-Xylene
Heavy Aromatics
Raffinate
25%
46%
11%
1.0%
17%
24%
53%
11%
0.54%
11%
22%
65%
N/A
0.7%
12%
20%
72%
N/A
0.4%
8%
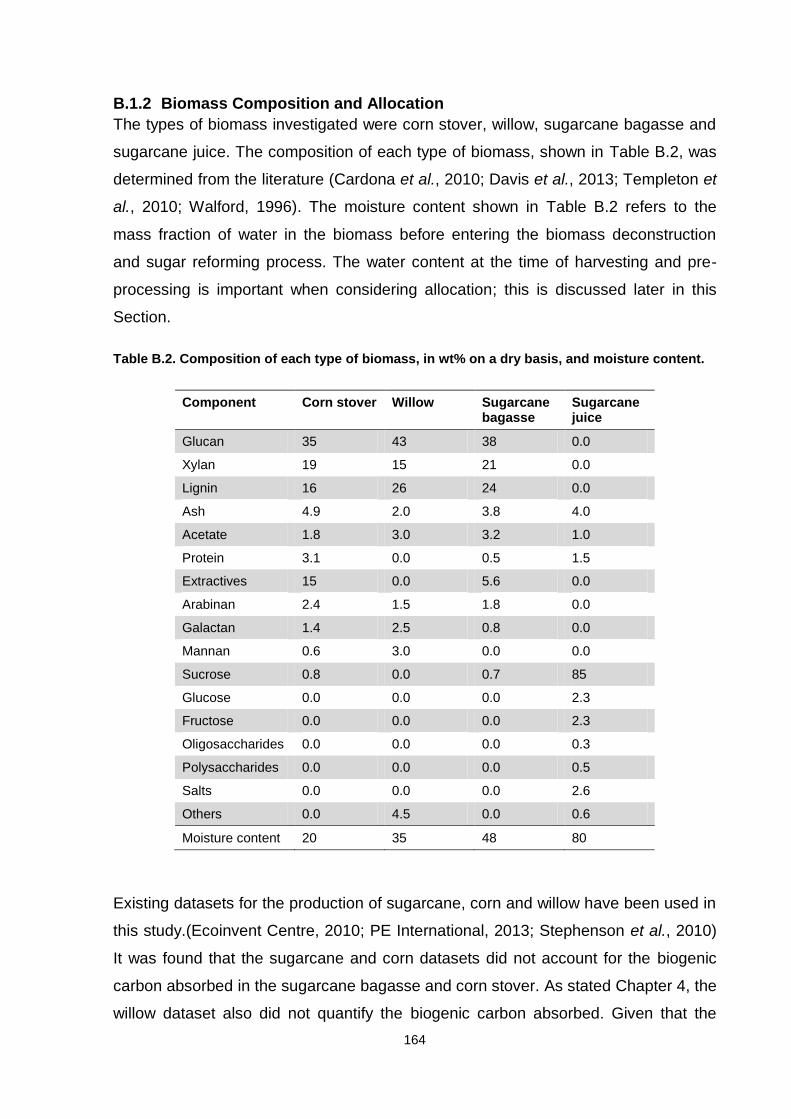
164
B.1.2 Biomass Composition and Allocation
The types of biomass investigated were corn stover, willow, sugarcane bagasse and
sugarcane juice. The composition of each type of biomass, shown in Table B.2, was
determined from the literature (Cardona et al., 2010; Davis et al., 2013; Templeton et
al., 2010; Walford, 1996). The moisture content shown in Table B.2 refers to the
mass fraction of water in the biomass before entering the biomass deconstruction
and sugar reforming process. The water content at the time of harvesting and pre-
processing is important when considering allocation; this is discussed later in this
Section.
Table B.2. Composition of each type of biomass, in wt% on a dry basis, and moisture content.
Component Corn stover Willow Sugarcane bagasse
Sugarcane juice
Glucan 35 43 38 0.0
Xylan 19 15 21 0.0
Lignin 16 26 24 0.0
Ash 4.9 2.0 3.8 4.0
Acetate 1.8 3.0 3.2 1.0
Protein 3.1 0.0 0.5 1.5
Extractives 15 0.0 5.6 0.0
Arabinan 2.4 1.5 1.8 0.0
Galactan 1.4 2.5 0.8 0.0
Mannan 0.6 3.0 0.0 0.0
Sucrose 0.8 0.0 0.7 85
Glucose 0.0 0.0 0.0 2.3
Fructose 0.0 0.0 0.0 2.3
Oligosaccharides 0.0 0.0 0.0 0.3
Polysaccharides 0.0 0.0 0.0 0.5
Salts 0.0 0.0 0.0 2.6
Others 0.0 4.5 0.0 0.6
Moisture content 20 35 48 80
Existing datasets for the production of sugarcane, corn and willow have been used in
this study.(Ecoinvent Centre, 2010; PE International, 2013; Stephenson et al., 2010)
It was found that the sugarcane and corn datasets did not account for the biogenic
carbon absorbed in the sugarcane bagasse and corn stover. As stated Chapter 4, the
willow dataset also did not quantify the biogenic carbon absorbed. Given that the
165
boundary, in this case, has been drawn to produce a PET bottle, not accounting for
the disposal, these datasets were modified to account for the carbon contained in the
biomass. If the bottles were subsequently burnt on disposal, this quantity of carbon
would be re-released to the atmosphere.
The simplest method to determine the CO2 absorbed by biomass is to perform a
carbon balance on the feedstock. Photosynthesis fixes carbon dioxide from the
atmosphere into sugars in plants, e.g.:
Overall, one can assume that every mole of carbon in the plant is derived, originally,
from 1 mole of CO2 from the atmosphere. This method of calculation does not
account for soil carbon changes. The formation of soil carbon is a complex problem
and there is insufficient literature to enable a rigorous calculation of how it changes.
In order to accurately quantify the carbon content in each type of biomass, it is
important to quantify the amount of biomass harvested and the initial moisture
content. In the case of a corn plant, the mass ratio of corn cob to corn stover is
typically 1:1 (Luo et al., 2009b). However, to limit soil erosion and maintain land
fertility, only ~60% of the corn stover should be harvested (Luo et al., 2009b; Spatari
et al., 2005). Thus, per kilogram of corn harvested, only 0.6 kg of stover can be
collected. The 0.6 kg corn stover harvested has an initial moisture content of
~30 wt% and dries in the field to reach the 20 wt% reported in Table B.2 (Davis et al.,
2013; US Environmental Protection Agency, 2007). In the case of willow, the
moisture content was assumed to remain unchanged between the point at which it
was harvested and its receipt at the biomass decomposition facility. In the case of
sugarcane, sugarcane juice is first extracted. Typically, per kilogram of sugarcane,
0.28 kg of sugarcane bagasse with a moisture content 48 wt% is produced at a
manufacturing plant producing sugarcane juice.(Cardona et al., 2010) The moisture
content was assumed to remain unchanged, because juice extraction would take
place immediately before the biomass deconstruction process. The mass of
sugarcane juice is therefore 0.72 kg. The initial content of water in sugarcane juice is
about 77 wt%: additional wash water is added in the extraction to maximise the
sucrose extraction, thus sugarcane juice has a final water content of 80 wt% (Pérez,
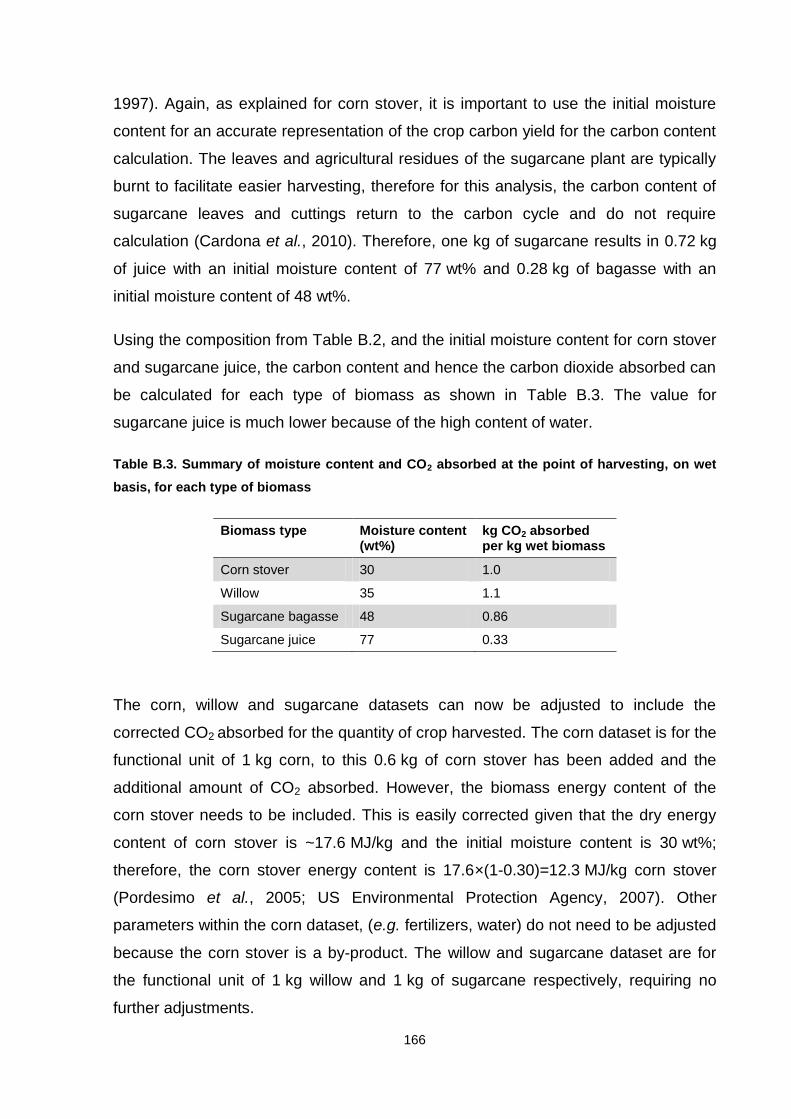
166
1997). Again, as explained for corn stover, it is important to use the initial moisture
content for an accurate representation of the crop carbon yield for the carbon content
calculation. The leaves and agricultural residues of the sugarcane plant are typically
burnt to facilitate easier harvesting, therefore for this analysis, the carbon content of
sugarcane leaves and cuttings return to the carbon cycle and do not require
calculation (Cardona et al., 2010). Therefore, one kg of sugarcane results in 0.72 kg
of juice with an initial moisture content of 77 wt% and 0.28 kg of bagasse with an
initial moisture content of 48 wt%.
Using the composition from Table B.2, and the initial moisture content for corn stover
and sugarcane juice, the carbon content and hence the carbon dioxide absorbed can
be calculated for each type of biomass as shown in Table B.3. The value for
sugarcane juice is much lower because of the high content of water.
Table B.3. Summary of moisture content and CO2 absorbed at the point of harvesting, on wet
basis, for each type of biomass
Biomass type Moisture content (wt%)
kg CO2 absorbed per kg wet biomass
Corn stover 30 1.0
Willow 35 1.1
Sugarcane bagasse 48 0.86
Sugarcane juice 77 0.33
The corn, willow and sugarcane datasets can now be adjusted to include the
corrected CO2 absorbed for the quantity of crop harvested. The corn dataset is for the
functional unit of 1 kg corn, to this 0.6 kg of corn stover has been added and the
additional amount of CO2 absorbed. However, the biomass energy content of the
corn stover needs to be included. This is easily corrected given that the dry energy
content of corn stover is ~17.6 MJ/kg and the initial moisture content is 30 wt%;
therefore, the corn stover energy content is 17.6×(1-0.30)=12.3 MJ/kg corn stover
(Pordesimo et al., 2005; US Environmental Protection Agency, 2007). Other
parameters within the corn dataset, (e.g. fertilizers, water) do not need to be adjusted
because the corn stover is a by-product. The willow and sugarcane dataset are for
the functional unit of 1 kg willow and 1 kg of sugarcane respectively, requiring no
further adjustments.
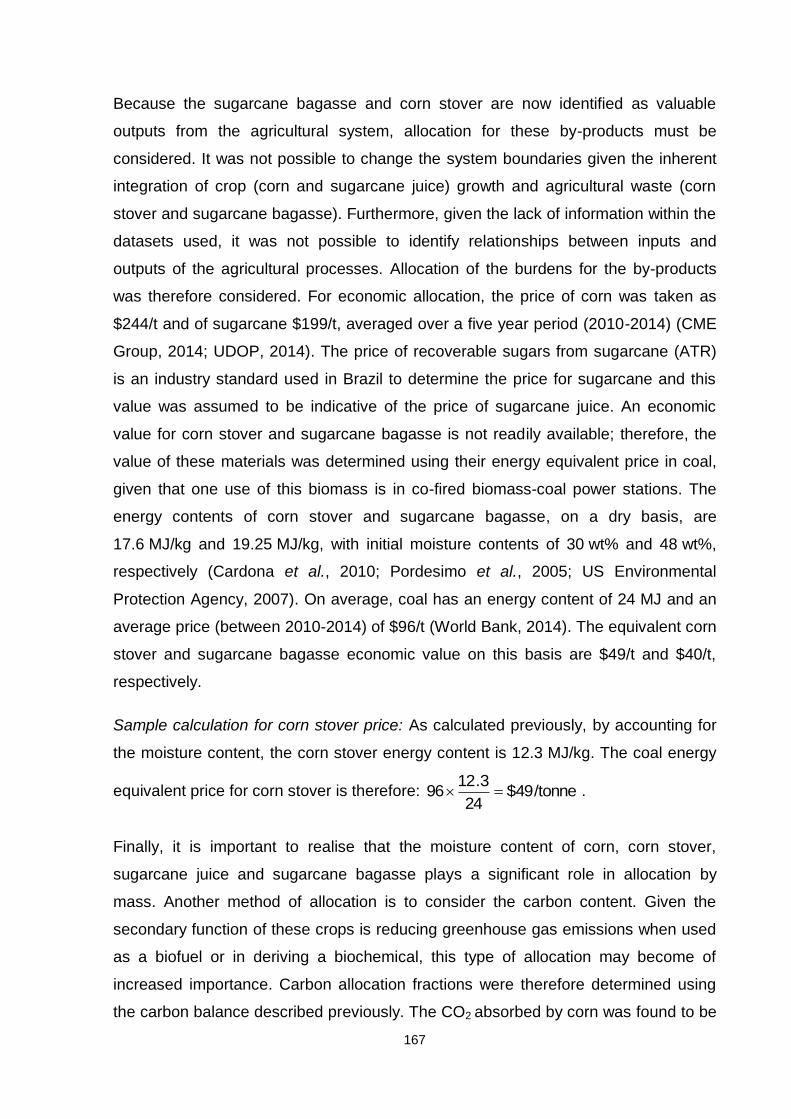
167
Because the sugarcane bagasse and corn stover are now identified as valuable
outputs from the agricultural system, allocation for these by-products must be
considered. It was not possible to change the system boundaries given the inherent
integration of crop (corn and sugarcane juice) growth and agricultural waste (corn
stover and sugarcane bagasse). Furthermore, given the lack of information within the
datasets used, it was not possible to identify relationships between inputs and
outputs of the agricultural processes. Allocation of the burdens for the by-products
was therefore considered. For economic allocation, the price of corn was taken as
$244/t and of sugarcane $199/t, averaged over a five year period (2010-2014) (CME
Group, 2014; UDOP, 2014). The price of recoverable sugars from sugarcane (ATR)
is an industry standard used in Brazil to determine the price for sugarcane and this
value was assumed to be indicative of the price of sugarcane juice. An economic
value for corn stover and sugarcane bagasse is not readily available; therefore, the
value of these materials was determined using their energy equivalent price in coal,
given that one use of this biomass is in co-fired biomass-coal power stations. The
energy contents of corn stover and sugarcane bagasse, on a dry basis, are
17.6 MJ/kg and 19.25 MJ/kg, with initial moisture contents of 30 wt% and 48 wt%,
respectively (Cardona et al., 2010; Pordesimo et al., 2005; US Environmental
Protection Agency, 2007). On average, coal has an energy content of 24 MJ and an
average price (between 2010-2014) of $96/t (World Bank, 2014). The equivalent corn
stover and sugarcane bagasse economic value on this basis are $49/t and $40/t,
respectively.
Sample calculation for corn stover price: As calculated previously, by accounting for
the moisture content, the corn stover energy content is 12.3 MJ/kg. The coal energy
equivalent price for corn stover is therefore: /tonne49$24
3.1296 .
Finally, it is important to realise that the moisture content of corn, corn stover,
sugarcane juice and sugarcane bagasse plays a significant role in allocation by
mass. Another method of allocation is to consider the carbon content. Given the
secondary function of these crops is reducing greenhouse gas emissions when used
as a biofuel or in deriving a biochemical, this type of allocation may become of
increased importance. Carbon allocation fractions were therefore determined using
the carbon balance described previously. The CO2 absorbed by corn was found to be
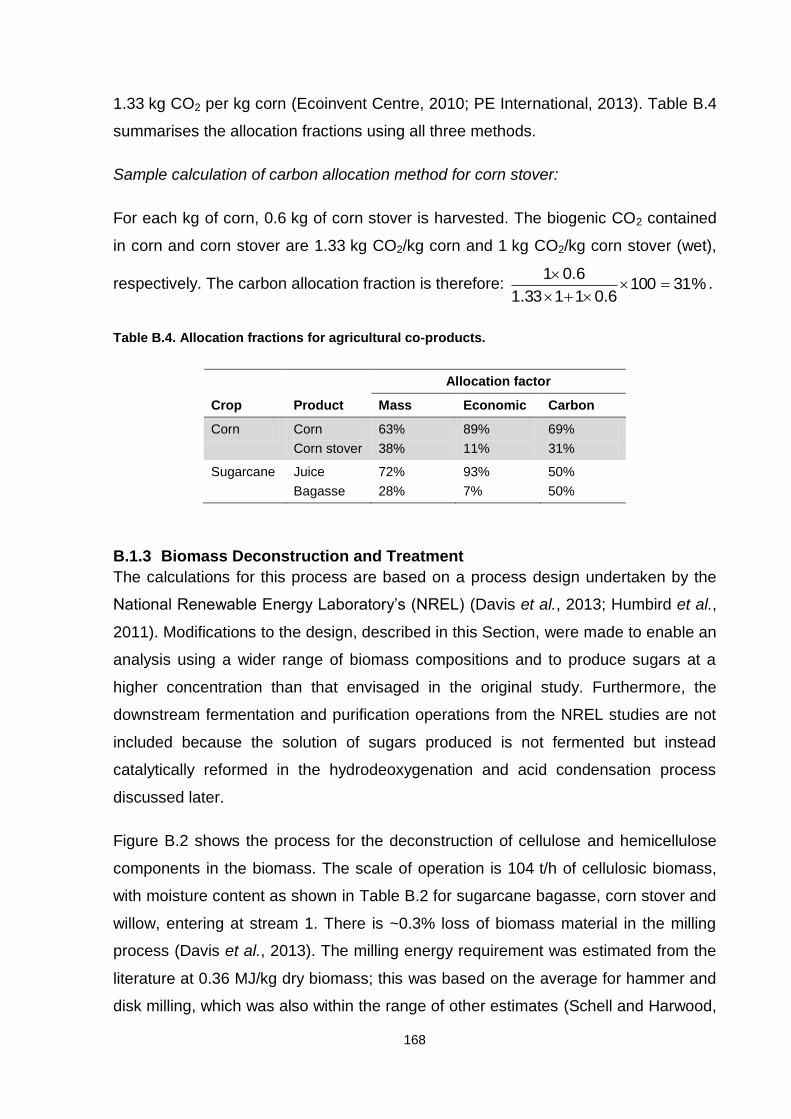
168
1.33 kg CO2 per kg corn (Ecoinvent Centre, 2010; PE International, 2013). Table B.4
summarises the allocation fractions using all three methods.
Sample calculation of carbon allocation method for corn stover:
For each kg of corn, 0.6 kg of corn stover is harvested. The biogenic CO2 contained
in corn and corn stover are 1.33 kg CO2/kg corn and 1 kg CO2/kg corn stover (wet),
respectively. The carbon allocation fraction is therefore: %311006.01133.1
6.01
.
Table B.4. Allocation fractions for agricultural co-products.
Allocation factor
Crop Product Mass Economic Carbon
Corn Corn
Corn stover
63%
38%
89%
11%
69%
31%
Sugarcane Juice
Bagasse
72%
28%
93%
7%
50%
50%
B.1.3 Biomass Deconstruction and Treatment
The calculations for this process are based on a process design undertaken by the
National Renewable Energy Laboratory’s (NREL) (Davis et al., 2013; Humbird et al.,
2011). Modifications to the design, described in this Section, were made to enable an
analysis using a wider range of biomass compositions and to produce sugars at a
higher concentration than that envisaged in the original study. Furthermore, the
downstream fermentation and purification operations from the NREL studies are not
included because the solution of sugars produced is not fermented but instead
catalytically reformed in the hydrodeoxygenation and acid condensation process
discussed later.
Figure B.2 shows the process for the deconstruction of cellulose and hemicellulose
components in the biomass. The scale of operation is 104 t/h of cellulosic biomass,
with moisture content as shown in Table B.2 for sugarcane bagasse, corn stover and
willow, entering at stream 1. There is ~0.3% loss of biomass material in the milling
process (Davis et al., 2013). The milling energy requirement was estimated from the
literature at 0.36 MJ/kg dry biomass; this was based on the average for hammer and
disk milling, which was also within the range of other estimates (Schell and Harwood,
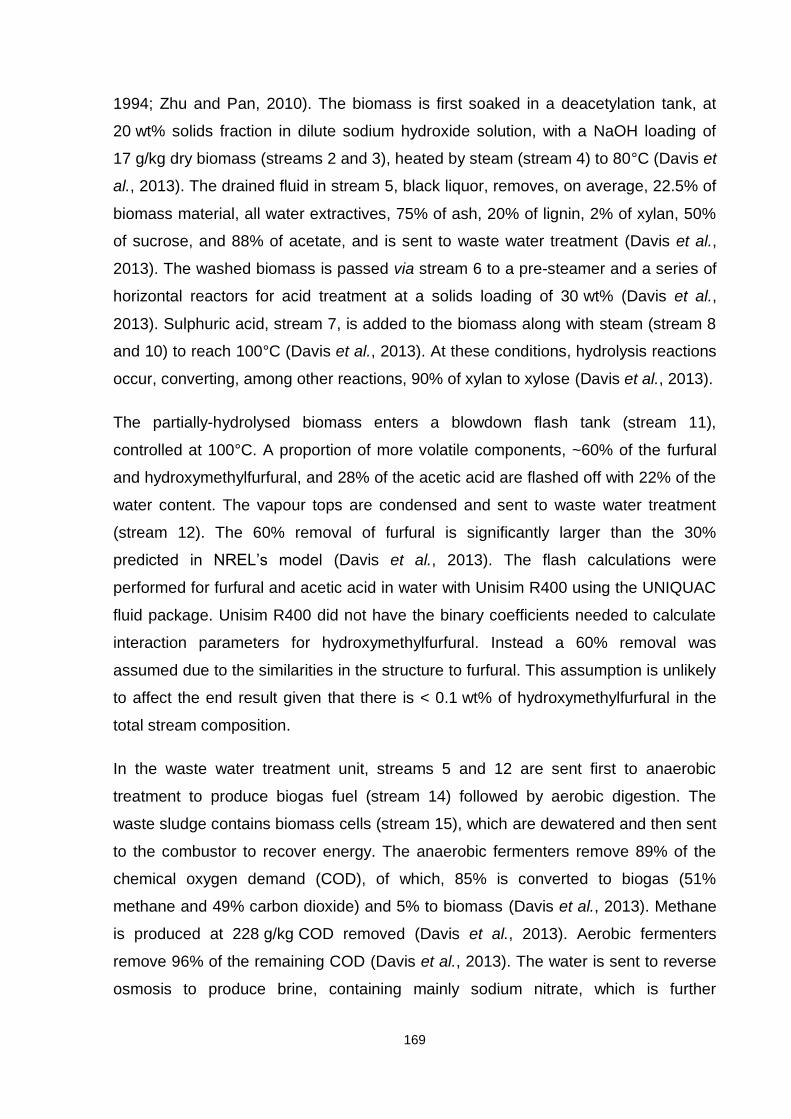
169
1994; Zhu and Pan, 2010). The biomass is first soaked in a deacetylation tank, at
20 wt% solids fraction in dilute sodium hydroxide solution, with a NaOH loading of
17 g/kg dry biomass (streams 2 and 3), heated by steam (stream 4) to 80°C (Davis et
al., 2013). The drained fluid in stream 5, black liquor, removes, on average, 22.5% of
biomass material, all water extractives, 75% of ash, 20% of lignin, 2% of xylan, 50%
of sucrose, and 88% of acetate, and is sent to waste water treatment (Davis et al.,
2013). The washed biomass is passed via stream 6 to a pre-steamer and a series of
horizontal reactors for acid treatment at a solids loading of 30 wt% (Davis et al.,
2013). Sulphuric acid, stream 7, is added to the biomass along with steam (stream 8
and 10) to reach 100°C (Davis et al., 2013). At these conditions, hydrolysis reactions
occur, converting, among other reactions, 90% of xylan to xylose (Davis et al., 2013).
The partially-hydrolysed biomass enters a blowdown flash tank (stream 11),
controlled at 100°C. A proportion of more volatile components, ~60% of the furfural
and hydroxymethylfurfural, and 28% of the acetic acid are flashed off with 22% of the
water content. The vapour tops are condensed and sent to waste water treatment
(stream 12). The 60% removal of furfural is significantly larger than the 30%
predicted in NREL’s model (Davis et al., 2013). The flash calculations were
performed for furfural and acetic acid in water with Unisim R400 using the UNIQUAC
fluid package. Unisim R400 did not have the binary coefficients needed to calculate
interaction parameters for hydroxymethylfurfural. Instead a 60% removal was
assumed due to the similarities in the structure to furfural. This assumption is unlikely
to affect the end result given that there is < 0.1 wt% of hydroxymethylfurfural in the
total stream composition.
In the waste water treatment unit, streams 5 and 12 are sent first to anaerobic
treatment to produce biogas fuel (stream 14) followed by aerobic digestion. The
waste sludge contains biomass cells (stream 15), which are dewatered and then sent
to the combustor to recover energy. The anaerobic fermenters remove 89% of the
chemical oxygen demand (COD), of which, 85% is converted to biogas (51%
methane and 49% carbon dioxide) and 5% to biomass (Davis et al., 2013). Methane
is produced at 228 g/kg COD removed (Davis et al., 2013). Aerobic fermenters
remove 96% of the remaining COD (Davis et al., 2013). The water is sent to reverse
osmosis to produce brine, containing mainly sodium nitrate, which is further
170
concentrated and assumed waste (Davis et al., 2013). The treated water is recycled
to the process.
The partially-hydrolysed biomass (stream 13) enters ammonia conditioning. Sulphuric
and acetic acid are neutralised with ammonia in stoichiometric quantities prior to
enzyme hydrolysis. The slurry is diluted and cooled with water, stream 17, to a solids
loading of 20 wt%. Further cooling is required for stream 18 to reach the desired
temperature of 48°C (Davis et al., 2013). In enzyme hydrolysis, the NREL design
suggested that a loading of 10 g cellulase protein/kg cellulose is possible while
maintaining 90% conversion of glucan to glucose (Davis et al., 2013). To produce the
cellulase enzyme, the calculations from the NREL reports were used and scaled to
the required enzyme loading (Davis et al., 2013; Humbird et al., 2011).
At this point, stream 20a, consists predominantly of sugars, lignin, and water. The
sugars solution requires further purification, by filtration, and concentration, by
evaporation, to be suitable for hydrodeoxygenation and acid condensation. If the
biomass source were sugarcane juice, the hydrolysis could be avoided and so this
feedstock would enter the process at stream 20b. Filtration removes impurities, such
as lignin, ash, enzyme, and cellulose. The filter cake, stream 23, is combusted to
produce energy.
Both types of sugar solutions after filtration, stream 22, typically contain 14-18 wt%
sugars. Mechanical vapour recompression (MVR) evaporation concentrates the
sugars in solution to ~57 wt% since a concentration towards the upper range of 50-
60 wt% is desirable for the hydrodeoxygenation process (Blank et al., 2014). The
MVR evaporator reduces the steam requirements significantly while increasing
electricity usage for the compression requirement. The water removed by the
evaporator, stream 27, is recycled into the process. The evaporator design from the
NREL report was for a sugar concentration of 46 wt% (Davis et al., 2013). In order to
increase the sugar concentration from 46 wt% to 57 wt%, a Unisim model was
created to quantify the energy requirements. The model used both sucrose and
glucose in water solution with the UNIQUAC fluid package. The energy requirements
calculated from the model for a 46 wt% solution agreed within 5% to those from the
NREL report. The model was then optimised for a solution at 57 wt%, stream 26, as
required downstream.
171
The combustor is primarily used to recover energy from unconverted biomass, e.g.
lignin in the filter cake, and from the biogas produced by waste water treatment. The
model for the combustor assumes complete combustion in air. A proportion of the
combustor fuel is wet solids and must first be dried, which reduces the total heat
released from the combustible materials. As with the NREL design, all heat produced
from combustion is used to generate superheated steam at 454°C and 62 bara
(Davis et al., 2013; Humbird et al., 2011). The superheated stream enters a series of
turbines to generate electricity. It was assumed that side streams of steam at 13 bara
for high pressure steam and 4.5 bara for low pressure steam can be bled from
appropriate stages in these turbines.
The biomass deconstruction and the hydrodeoxygenation and acid condensation
processes are integrated for improved energy recovery. Steam, electricity and
combustible waste gases are exchanged between these processes. Owing to the
integration, and to avoid complicated allocation procedures for the inventory analysis,
the system boundary was extended to include the hydrodeoxygenation and acid
condensation processes along with the biomass deconstruction process.

172
Figure B.2. Process flow diagram for the deconstruction of cellulosic biomass followed by the filtration and evaporator stages to produce a
concentrated solution of sugars.
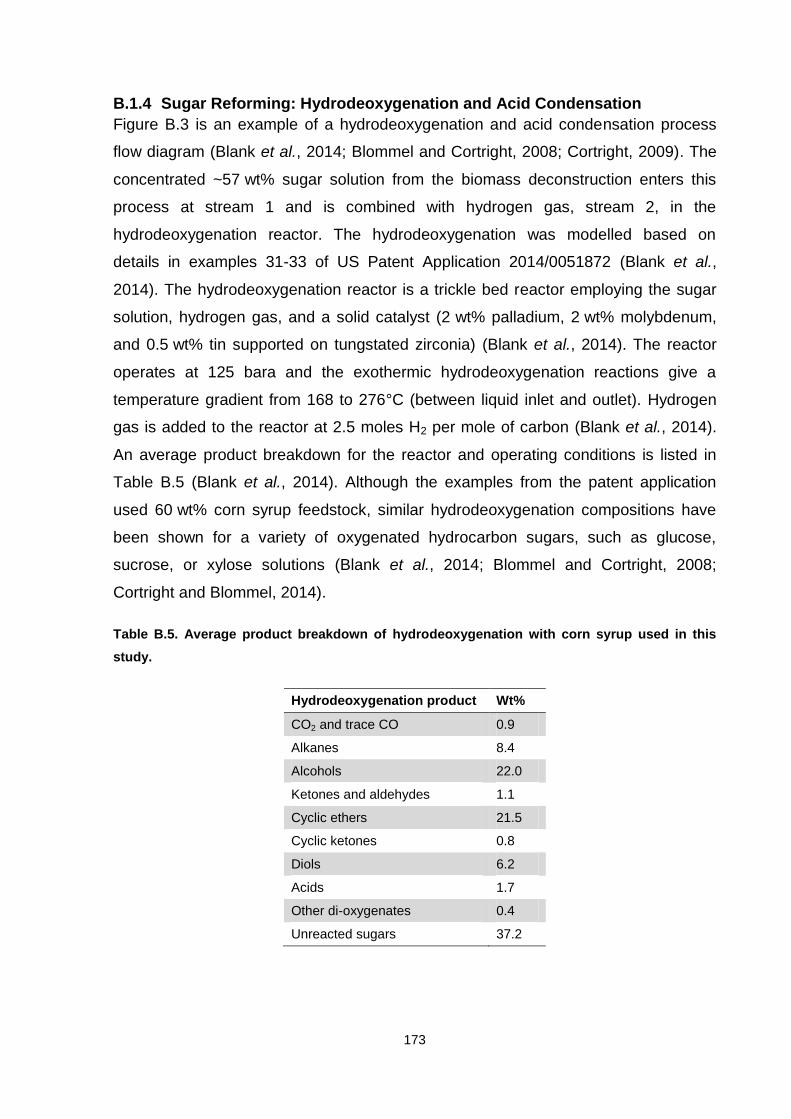
173
B.1.4 Sugar Reforming: Hydrodeoxygenation and Acid Condensation
Figure B.3 is an example of a hydrodeoxygenation and acid condensation process
flow diagram (Blank et al., 2014; Blommel and Cortright, 2008; Cortright, 2009). The
concentrated ~57 wt% sugar solution from the biomass deconstruction enters this
process at stream 1 and is combined with hydrogen gas, stream 2, in the
hydrodeoxygenation reactor. The hydrodeoxygenation was modelled based on
details in examples 31-33 of US Patent Application 2014/0051872 (Blank et al.,
2014). The hydrodeoxygenation reactor is a trickle bed reactor employing the sugar
solution, hydrogen gas, and a solid catalyst (2 wt% palladium, 2 wt% molybdenum,
and 0.5 wt% tin supported on tungstated zirconia) (Blank et al., 2014). The reactor
operates at 125 bara and the exothermic hydrodeoxygenation reactions give a
temperature gradient from 168 to 276°C (between liquid inlet and outlet). Hydrogen
gas is added to the reactor at 2.5 moles H2 per mole of carbon (Blank et al., 2014).
An average product breakdown for the reactor and operating conditions is listed in
Table B.5 (Blank et al., 2014). Although the examples from the patent application
used 60 wt% corn syrup feedstock, similar hydrodeoxygenation compositions have
been shown for a variety of oxygenated hydrocarbon sugars, such as glucose,
sucrose, or xylose solutions (Blank et al., 2014; Blommel and Cortright, 2008;
Cortright and Blommel, 2014).
Table B.5. Average product breakdown of hydrodeoxygenation with corn syrup used in this
study.
Hydrodeoxygenation product Wt%
CO2 and trace CO 0.9
Alkanes 8.4
Alcohols 22.0
Ketones and aldehydes 1.1
Cyclic ethers 21.5
Cyclic ketones 0.8
Diols 6.2
Acids 1.7
Other di-oxygenates 0.4
Unreacted sugars 37.2
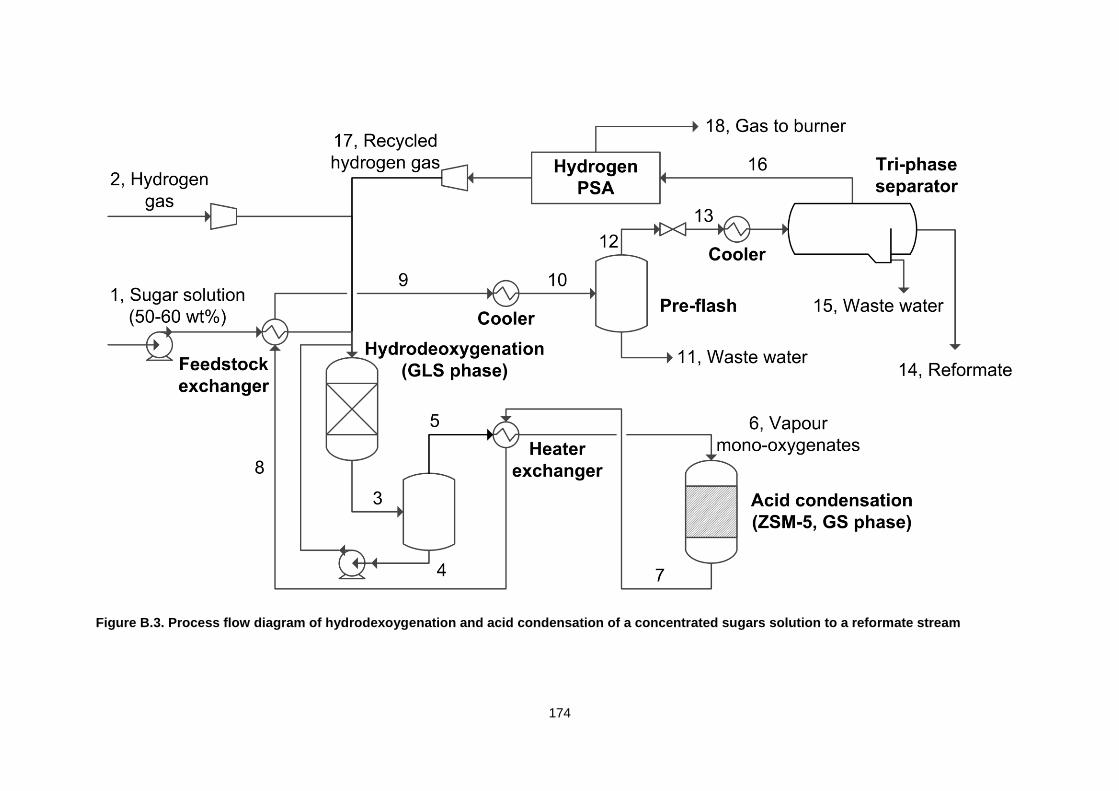
174
Figure B.3. Process flow diagram of hydrodexoygenation and acid condensation of a concentrated sugars solution to a reformate stream
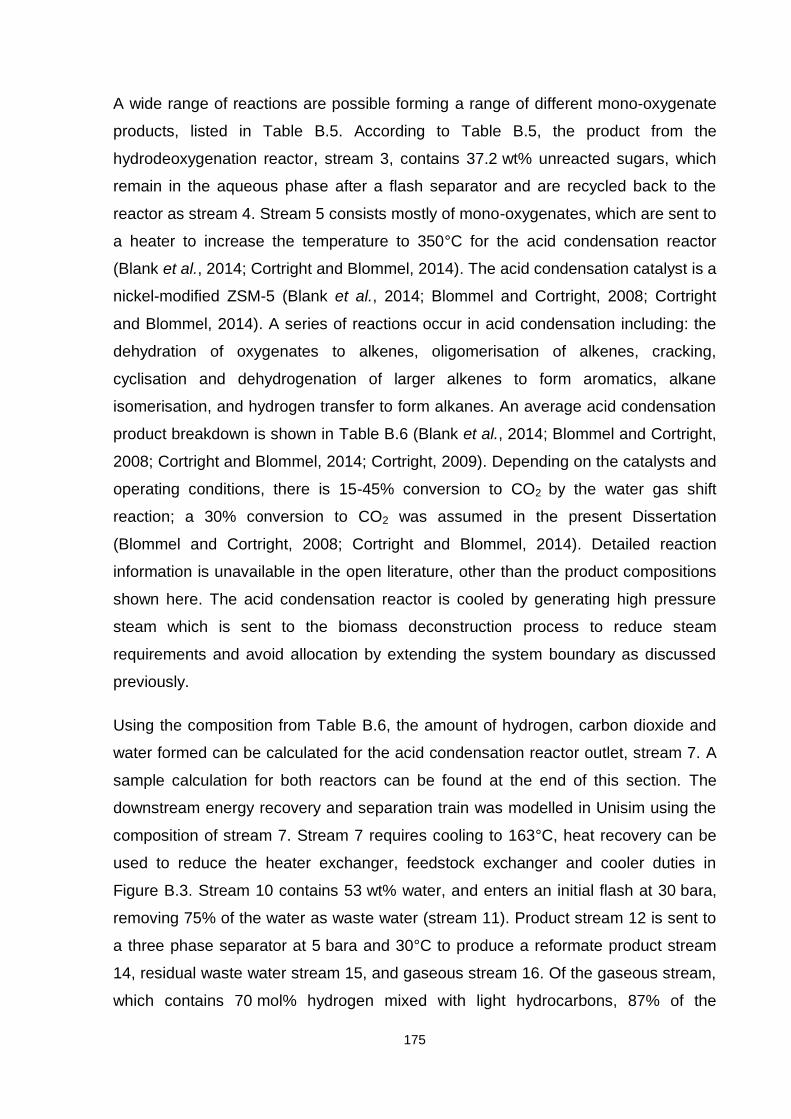
175
A wide range of reactions are possible forming a range of different mono-oxygenate
products, listed in Table B.5. According to Table B.5, the product from the
hydrodeoxygenation reactor, stream 3, contains 37.2 wt% unreacted sugars, which
remain in the aqueous phase after a flash separator and are recycled back to the
reactor as stream 4. Stream 5 consists mostly of mono-oxygenates, which are sent to
a heater to increase the temperature to 350°C for the acid condensation reactor
(Blank et al., 2014; Cortright and Blommel, 2014). The acid condensation catalyst is a
nickel-modified ZSM-5 (Blank et al., 2014; Blommel and Cortright, 2008; Cortright
and Blommel, 2014). A series of reactions occur in acid condensation including: the
dehydration of oxygenates to alkenes, oligomerisation of alkenes, cracking,
cyclisation and dehydrogenation of larger alkenes to form aromatics, alkane
isomerisation, and hydrogen transfer to form alkanes. An average acid condensation
product breakdown is shown in Table B.6 (Blank et al., 2014; Blommel and Cortright,
2008; Cortright and Blommel, 2014; Cortright, 2009). Depending on the catalysts and
operating conditions, there is 15-45% conversion to CO2 by the water gas shift
reaction; a 30% conversion to CO2 was assumed in the present Dissertation
(Blommel and Cortright, 2008; Cortright and Blommel, 2014). Detailed reaction
information is unavailable in the open literature, other than the product compositions
shown here. The acid condensation reactor is cooled by generating high pressure
steam which is sent to the biomass deconstruction process to reduce steam
requirements and avoid allocation by extending the system boundary as discussed
previously.
Using the composition from Table B.6, the amount of hydrogen, carbon dioxide and
water formed can be calculated for the acid condensation reactor outlet, stream 7. A
sample calculation for both reactors can be found at the end of this section. The
downstream energy recovery and separation train was modelled in Unisim using the
composition of stream 7. Stream 7 requires cooling to 163°C, heat recovery can be
used to reduce the heater exchanger, feedstock exchanger and cooler duties in
Figure B.3. Stream 10 contains 53 wt% water, and enters an initial flash at 30 bara,
removing 75% of the water as waste water (stream 11). Product stream 12 is sent to
a three phase separator at 5 bara and 30°C to produce a reformate product stream
14, residual waste water stream 15, and gaseous stream 16. Of the gaseous stream,
which contains 70 mol% hydrogen mixed with light hydrocarbons, 87% of the
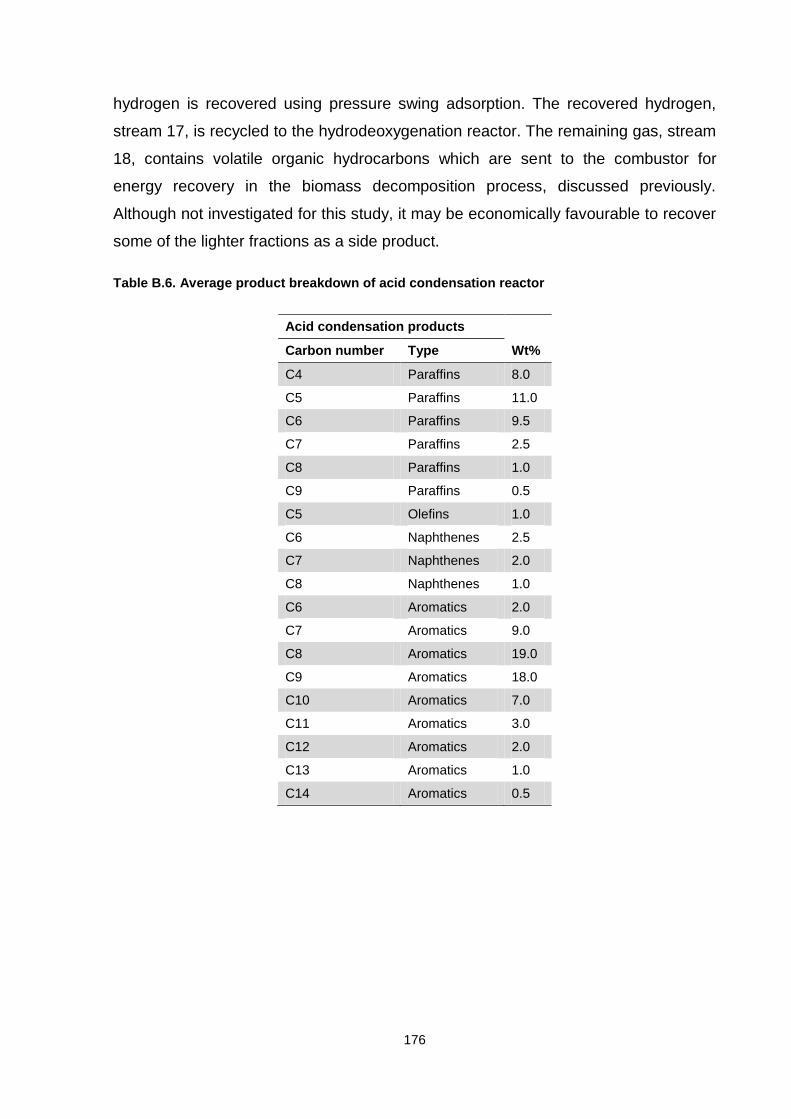
176
hydrogen is recovered using pressure swing adsorption. The recovered hydrogen,
stream 17, is recycled to the hydrodeoxygenation reactor. The remaining gas, stream
18, contains volatile organic hydrocarbons which are sent to the combustor for
energy recovery in the biomass decomposition process, discussed previously.
Although not investigated for this study, it may be economically favourable to recover
some of the lighter fractions as a side product.
Table B.6. Average product breakdown of acid condensation reactor
Acid condensation products
Carbon number Type Wt%
C4 Paraffins 8.0
C5 Paraffins 11.0
C6 Paraffins 9.5
C7 Paraffins 2.5
C8 Paraffins 1.0
C9 Paraffins 0.5
C5 Olefins 1.0
C6 Naphthenes 2.5
C7 Naphthenes 2.0
C8 Naphthenes 1.0
C6 Aromatics 2.0
C7 Aromatics 9.0
C8 Aromatics 19.0
C9 Aromatics 18.0
C10 Aromatics 7.0
C11 Aromatics 3.0
C12 Aromatics 2.0
C13 Aromatics 1.0
C14 Aromatics 0.5
177
Sample calculation for reactors:
This sample calculation uses a concentrated sugars solution produced from
sugarcane bagasse. The sugars solution, 52117 kg/h, contains 31 wt% glucose,
22 wt% xylose, 4 wt% other sugars, 40 wt% water, and 3 wt% other impurities. The
molar mass of glucose is 180 kg/kmol and xylose is 150 kg/kmol. The number of
moles of carbon in the solution are:
kmol/h 999180
604.0
150
522.0
180
631.052117
A simple conversion model was used in order to model both reactors. Firstly, as
described earlier, 30% of the moles of carbon entering the reactor system is
converted to CO2. The water gas shift reaction for the formation of CO2 is:
2222 H2COOHOCH
The remaining 70% of the carbon is converted to the range of hydrocarbon products
shown in Table B.6. The generic reaction for production of hydrocarbons is:
OHCHHOCH 2222
Based on the stoichiometry and the conversions above, the balances for the overall
reaction can be done:
Amount of carbon dioxide produced kmol/h 3003.0999
Net consumption of hydrogen kmol/h 10023.09997.0999
Net production of water kmol/h 4003.09997.0999
For the products shown in Table B.6, a sample calculation for the amount of butane
(C4) and pentane (C5) is shown:
Amount of butane (C4), 8% yield, produced kmol/h 144
08.07.0999
Amount of pentane (C5), 11% yield, produced kmol/h 155
11.07.0999
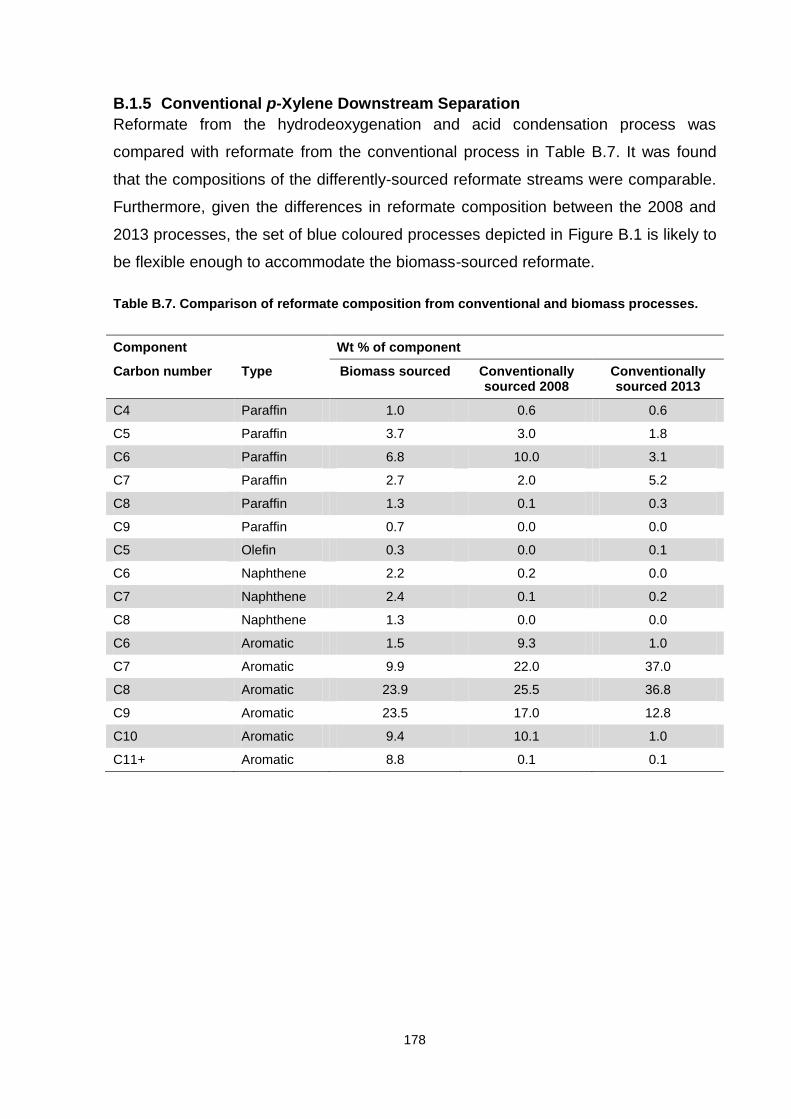
178
B.1.5 Conventional p-Xylene Downstream Separation
Reformate from the hydrodeoxygenation and acid condensation process was
compared with reformate from the conventional process in Table B.7. It was found
that the compositions of the differently-sourced reformate streams were comparable.
Furthermore, given the differences in reformate composition between the 2008 and
2013 processes, the set of blue coloured processes depicted in Figure B.1 is likely to
be flexible enough to accommodate the biomass-sourced reformate.
Table B.7. Comparison of reformate composition from conventional and biomass processes.
Component Wt % of component
Carbon number Type Biomass sourced Conventionally sourced 2008
Conventionally sourced 2013
C4 Paraffin 1.0 0.6 0.6
C5 Paraffin 3.7 3.0 1.8
C6 Paraffin 6.8 10.0 3.1
C7 Paraffin 2.7 2.0 5.2
C8 Paraffin 1.3 0.1 0.3
C9 Paraffin 0.7 0.0 0.0
C5 Olefin 0.3 0.0 0.1
C6 Naphthene 2.2 0.2 0.0
C7 Naphthene 2.4 0.1 0.2
C8 Naphthene 1.3 0.0 0.0
C6 Aromatic 1.5 9.3 1.0
C7 Aromatic 9.9 22.0 37.0
C8 Aromatic 23.9 25.5 36.8
C9 Aromatic 23.5 17.0 12.8
C10 Aromatic 9.4 10.1 1.0
C11+ Aromatic 8.8 0.1 0.1
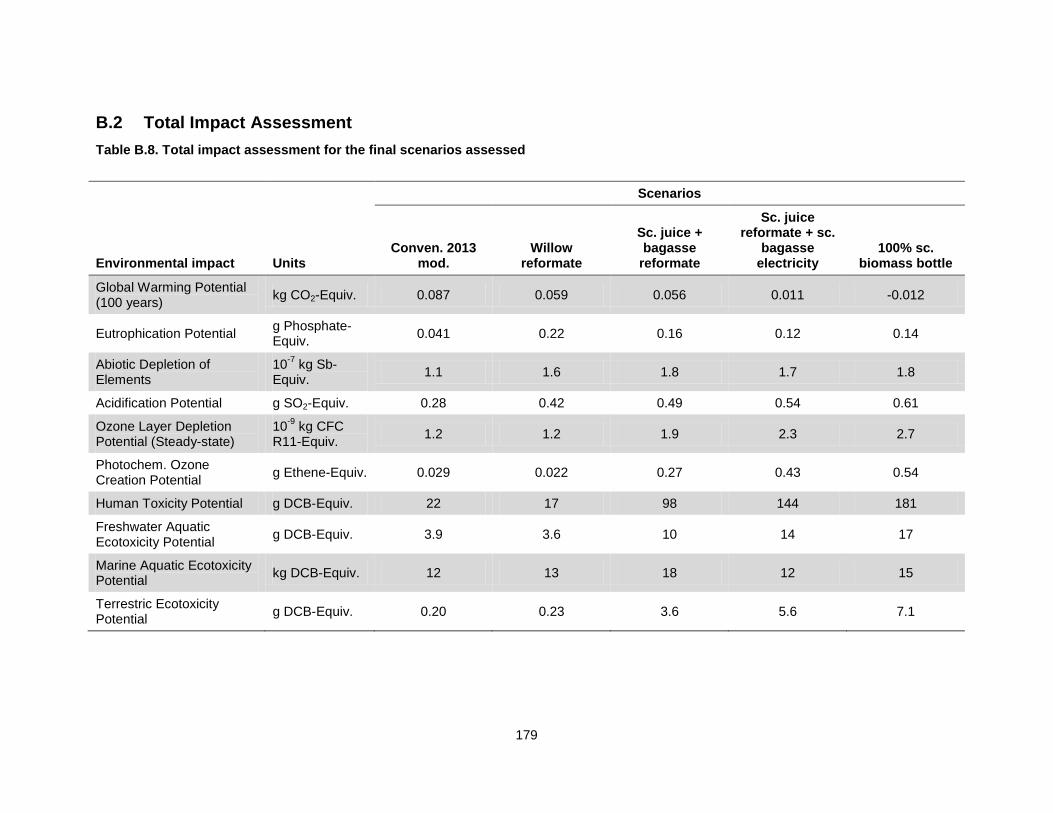
179
B.2 Total Impact Assessment
Table B.8. Total impact assessment for the final scenarios assessed
Scenarios
Environmental impact Units Conven. 2013
mod. Willow
reformate
Sc. juice + bagasse
reformate
Sc. juice reformate + sc.
bagasse electricity
100% sc. biomass bottle
Global Warming Potential (100 years)
kg CO2-Equiv. 0.087 0.059 0.056 0.011 -0.012
Eutrophication Potential g Phosphate-Equiv.
0.041 0.22 0.16 0.12 0.14
Abiotic Depletion of Elements
10-7
kg Sb-Equiv.
1.1 1.6 1.8 1.7 1.8
Acidification Potential g SO2-Equiv. 0.28 0.42 0.49 0.54 0.61
Ozone Layer Depletion Potential (Steady-state)
10-9
kg CFC R11-Equiv.
1.2 1.2 1.9 2.3 2.7
Photochem. Ozone Creation Potential
g Ethene-Equiv. 0.029 0.022 0.27 0.43 0.54
Human Toxicity Potential g DCB-Equiv. 22 17 98 144 181
Freshwater Aquatic Ecotoxicity Potential
g DCB-Equiv. 3.9 3.6 10 14 17
Marine Aquatic Ecotoxicity Potential
kg DCB-Equiv. 12 13 18 12 15
Terrestric Ecotoxicity Potential
g DCB-Equiv. 0.20 0.23 3.6 5.6 7.1

180