sustainability report 2012- hpcl - hindustan...
TRANSCRIPT
SUSTAINABILITY for a secure future.
Overview
01 Vision and Mission
03 Sustainabile Development Policy
04 About The Report
06 Composition of Board of Directors
07 Organisation Structure for Sustainability reporting
08 Chairman’s Message
10 ���������� �
12 Corporate Governance
Our Sustainability Context
17 Stakeholder Engagement
20 Materiality Analysis
22 Key Impacts, Risks & Opportunities
Our Economic Performance
25 Economic Performance
����������� ������������������������Hindustan Petroleum Corporation LimitedPetroleum House17, Jamshedji Tata RoadMumbai 400020Maharastra, Indiae-mail: ������������������
��������������������Hindustan Petroleum Corporation LimitedHindustan Bhawan8, Shoorji Vallabhdas Marg, Ballard EstateMumbai 400001Maharastra, Indiae-mail: ������������������
Our Environmental Performance
29 Environmental Performance
30 Resource Management
36 ���������� �����������
Our Social Performance
43 Human Rights
44 Labor Practices & Decent Work
50 Society
54 Product Responsibility
56 Sustainability Roadmap
57 Assurance Statements
60 GRI Index
1Sustainability Report 2011-12
Vision & Mission Statement of the Corporation
VisionTo be a World Class Energy Company known for caring and delighting the customers with high quality products and innovative services across domestic and international markets ������������������������� ���������������������� performance. The Company will be a model of excellence in meeting social commitment, environment, health and safety norms and in employee welfare and relations.
Mission
HPCL, along with its joint ventures, will be a fully integrated company in the hydrocarbons sector of exploration and �������������������������������focusing on enhancement of ���������������� ������������!� ���������������������������� ������caring for environment protection and cultural heritage.
It will also attain scale dimensions by diversifying into other energy related �� �����!��������������������� operations.
"����#�� ��$����%��!��'������
3Sustainability Report 2011-12
Sustainable Development Policy of the Corporation
We, at HPCL, are committed to achieve the economic, ecological and social responsibility objectives of sustainable development consistently through our varied operations and activities.
We will strive to contribute to sustained overall economic growth by continually improving ���������������productivity of our operations. We will execute our business activities in such a way that the ecological balance is not impacted. We will develop and conduct programs for the community, suitably designed towards building their individual capabilities.
We will Promote sustainable development concepts amongst our employees, customers, stakeholders and others.
Integrate the sustainable development objectives and considerations in all our business plans.
(�� �������������� ��������� �����towards realising minimal impact on environment.
Develop and implement good practices for optimal usage of natural resources.
Continuously monitor and control our activities to minimise carbon footprint.
Endeavour to provide a clean, healthy and safe working environment to our employees, neighbours, customers, consumers and stakeholders.
Sustain appropriate development programs for our employees, customers and neighbouring communities.
Incorporate customized management systems to monitor and control progress of Sustainability Development objectives.
Remain committed to disseminate information on our sustainability performance.
Report PeriodThis Report covers the Corporation’s Sustainability Performance over Fiscal Year 2011-12.
Aboutthe report
Report BoundaryThe Report highlights the progress we made in the last year on our commitment to social, economic and environmental responsibility. The Report covers HPCL’s fully-owned Indian operations as well ���������������marketing operations.
Retail outlets, joint ventures, subsidiaries, international operations and administrative ������������included in this Report. The Report discloses HPCL’s performance during Fiscal Year 2011-12 on environmental, social and economic �����������������not include data for indicators ��������������documentation was not available across all locations.
Reporting ProcessThe Report discloses aspects related to HPCL’s environmental, social and economic performance. In addition to seeking data-based inputs of the GRI indicators, it also contains viewpoints of the company’s internal stakeholders, such as the employees.Based on viewpoints, relevant sustainability issues (material issues) faced by the organization have !������������+Discussions with the senior management on these were helpful in prioritizing the issues and in demonstrating the management’s approach towards key environmental, social and economic parameters.
External stakeholders were selected based on regular interaction HPCL had with them. Inputs were sought from each of HPCL’s locations to determine their level of engagement with the Corporation.
Topics were prioritized based on guidelines laid out by the Global Reporting Initiative 3.0 (GRI).
Data Measurement TechniquesData for the Report was collected by forwarding data collection templates to all SBU locations. Quantities for each of the indicators were collected on a month-wise basis. While actual numbers have been presented in most cases, there are some indicators for which estimated numbers have been collected.
Mundra Terminal.
6
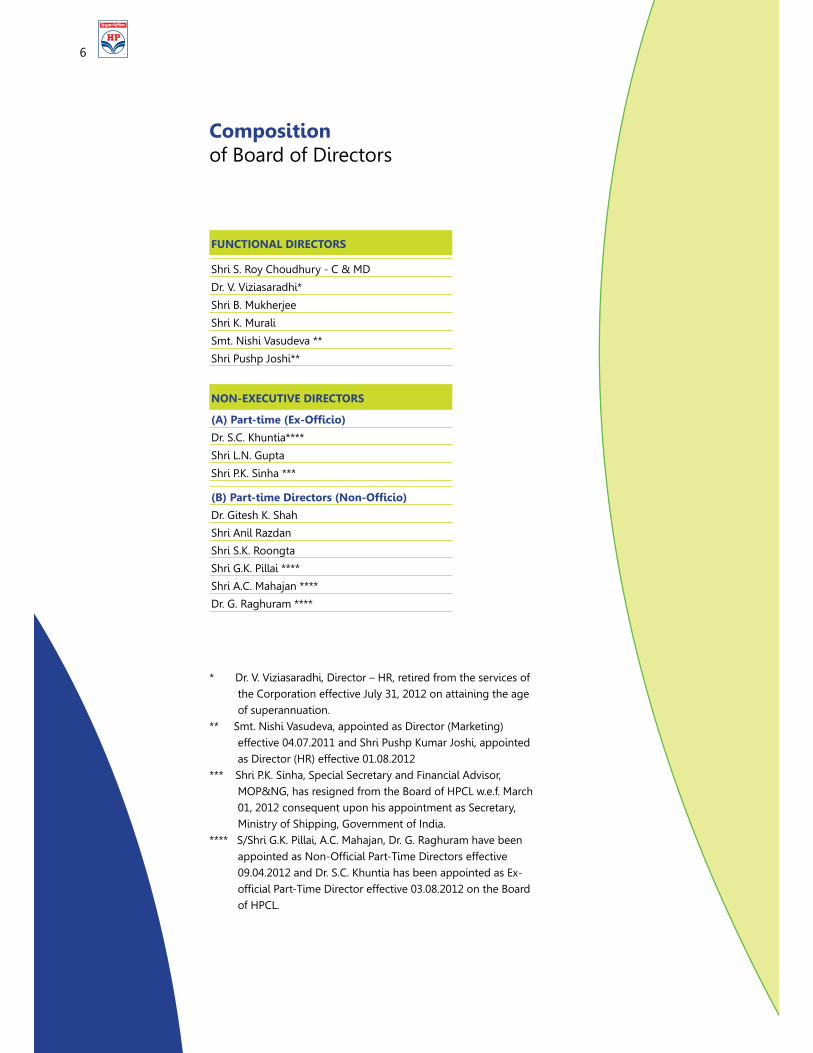
* Dr. V. Viziasaradhi, Director – HR, retired from the services of the Corporation effective July 31, 2012 on attaining the age of superannuation.
** Smt. Nishi Vasudeva, appointed as Director (Marketing) effective 04.07.2011 and Shri Pushp Kumar Joshi, appointed as Director (HR) effective 01.08.2012
*** Shri P.K. Sinha, Special Secretary and Financial Advisor, MOP&NG, has resigned from the Board of HPCL w.e.f. March 01, 2012 consequent upon his appointment as Secretary, Ministry of Shipping, Government of India.
**** S/Shri G.K. Pillai, A.C. Mahajan, Dr. G. Raghuram have been �����������<��=������ ���=>���(�����������������09.04.2012 and Dr. S.C. Khuntia has been appointed as Ex-������ ���=>���(����������������?@+?X+Z?[Z�����\����of HPCL.
FUNCTIONAL DIRECTORS
Shri S. Roy Choudhury - C & MD
Dr. V. Viziasaradhi*
Shri B. Mukherjee
Shri K. Murali
Smt. Nishi Vasudeva **
Shri Pushp Joshi**
NON-EXECUTIVE DIRECTORS
��!"���#�����$%#�� ���!
Dr. S.C. Khuntia****
Shri L.N. Gupta
Shri P.K. Sinha ***
�'!"���#����(���������)��#�� ���!
Dr. Gitesh K. Shah
Shri Anil Razdan
Shri S.K. Roongta
Shri G.K. Pillai ****
Shri A.C. Mahajan ****
Dr. G. Raghuram ****
Compositionof Board of Directors
7Sustainability Report 2011-12
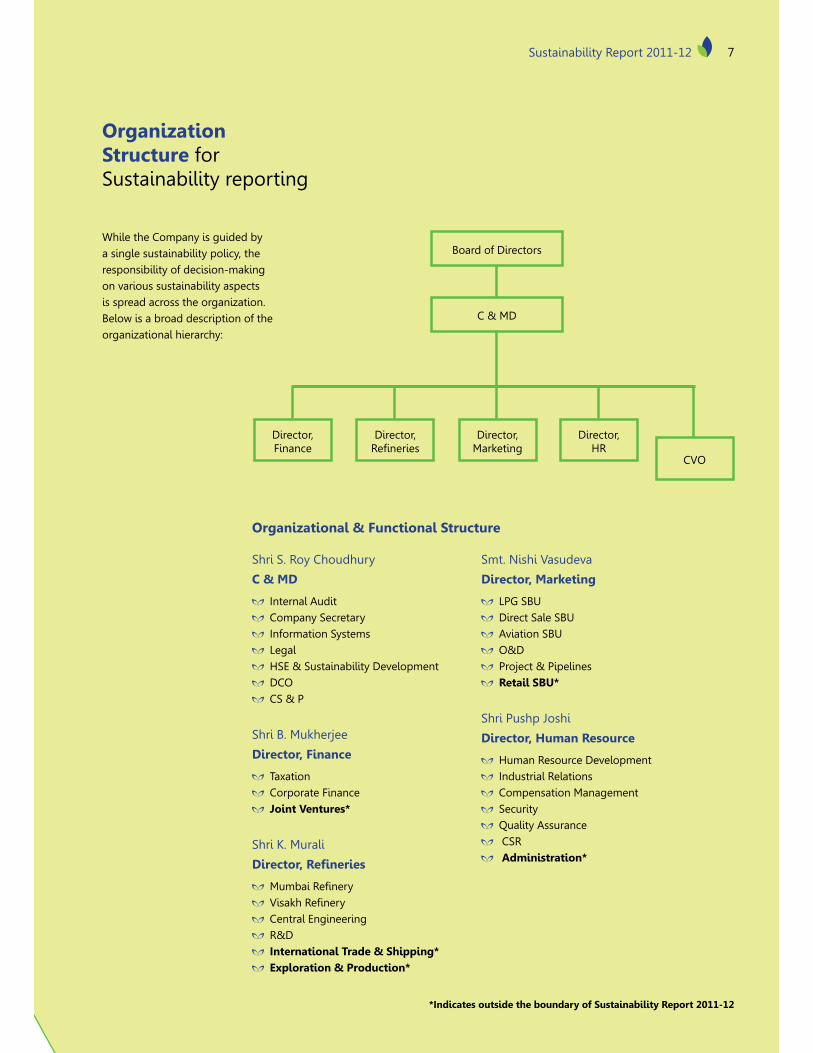
While the Company is guided by a single sustainability policy, the responsibility of decision-making on various sustainability aspects is spread across the organization. Below is a broad description of the organizational hierarchy:
Organization Structure for Sustainability reporting
*Indicates outside the boundary of Sustainability Report 2011-12
7Sustainability Report 2011-12
Board of Directors
C & MD
Director, Marketing
Director, '��������
Director, Finance
Director, HR
CVO
Shri S. Roy Choudhury
C & MD
Internal Audit Company Secretary Information Systems Legal HSE & Sustainability Development DCO CS & P
Shri B. Mukherjee
Director, Finance
Taxation Corporate Finance Joint Ventures*
Shri K. Murali
(�������+�� ������
%��!��'������ ]�����'������ Central Engineering R&D International Trade & Shipping* Exploration & Production*
Organizational & Functional Structure
Smt. Nishi Vasudeva
Director, Marketing
LPG SBU Direct Sale SBU Aviation SBU O&D Project & Pipelines Retail SBU*
Shri Pushp Joshi
Director, Human Resource
Human Resource Development Industrial Relations Compensation Management Security Quality Assurance CSR Administration*
8
Chairman’s Message
Dear StakeholdersIt gives me pleasure to present the maiden Sustainability Report of Hindustan Petroleum Corporation Limited (HPCL). Through this Report for Fiscal Year 2011-12, we endeavour to enhance the quality of our sustainability reporting, highlighting the progress made in the last year towards our commitment to social, economic and environmental responsibility.
We aim to share with you our initiatives, efforts and performance towards Sustainable Development, which is no longer an option, but a necessity. Our commitment to sustainability has been strong and enduring. There is commitment embedded in everything we do and our ability to evolve and grow has strengthened the Corporation over time, �����������^�_�������+
Year 2011-12 was quite challenging for the Oil Industry, but we continued to strengthen our position as a sustainability leader with our operations. Economic liberalization ����������������� ���������������`������������� ��������������������������competition on the marketing front. Additional infrastructural facilities to meet the growing demand, technological upgradation for value-added products and environmental management are some additional challenges the petroleum sector faced during the year. In today’s environment of constant change and increasing competition, a long-term plan is imperative. Towards this goal, the Corporation has implemented ‘Target Shikhar’ – a growth
�����������'���������%��������������market demand.
{����������������� ��������������������Human Resource development as a major force in achieving targets. HPCL is a company that cares for and invests in its people. Our excellent results and sustainability progress would not have been possible without our employees and we continue our focus on employee development.
To align our human resources towards our goal, the Corporation rolled out another leadership development initiative – ‘Project Akshay’. Over the course of the year, programs were introduced to promote diversity in our workforce and develop the next generation of our leaders and talent.
The essence of Sustainable Development is being practised in your Corporation to meet the needs of today, without compromising the requirements of tomorrow. Your Corporation has been engaged with water and energy conservation and also with local communities since a long time. The activities have been designed with the aim of ensuring good environment management. We have constantly endeavoured to upgrade the environmental performance of our operations by adopting new state-of-the-art technologies and incorporating world class practices. We have created systems that constantly strive to upgrade the health and safety of our workforce. We have engaged with local communities in a constructive manner to ����������� !������+
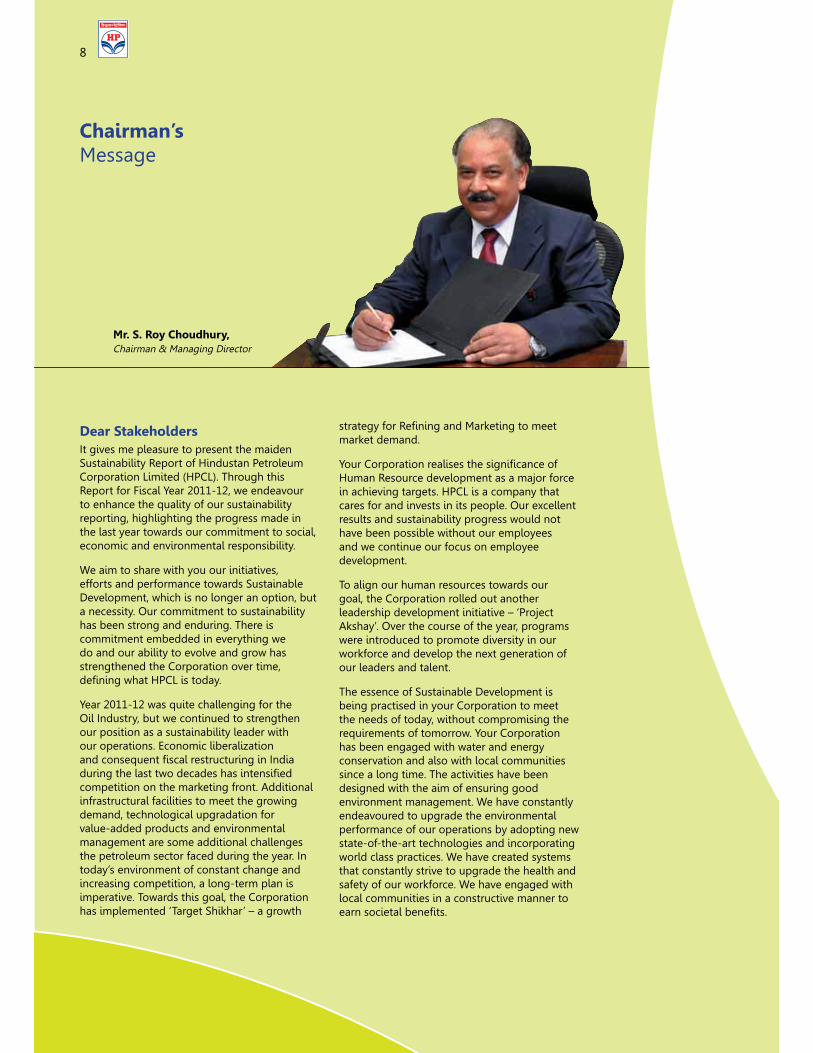
Mr. S. Roy Choudhury, Chairman & Managing Director
8
9Sustainability Report 2011-12
India continues to see a phenomenal increase in demand for fuels. This demand has emerged not just from the urban consumers, but also the rural community. We realize how rising fossil fuel consumption is the prime source for an increase in global greenhouse gases and the root cause behind human-induced climate change. Our Corporation, is producing ���=������ ��������� ���������������� �contribute towards reduced gas emissions and also produce environmentally-superior �!���������������������������������vehicles and their performance, thus lowering the demand for oil/fuels.
At HPCL, we have taken several initiatives towards production of green Bio-fuels. We have also incorporated joint ventures aiming towards production of ethanol from sugarcane/molasses and bio-diesel from Jatropha. Through our joint ventures, we have started an initiative to develop City Gas Distribution (CGD) networks to distribute eco-friendly fuels to domestic, industrial and automobile sectors.
We remain conscious towards the importance of bio-diversity and have undertaken initiatives towards protection of the same in our area of operations and projects. This validates our integration of sustainability in our core business strategy and the culture of the Corporation.
We have attached an unrelenting importance and an uncompromising approach towards safety in our operations with on-going programmes on employee training and safe practices at all locations. We strive to develop a good safety culture amongst our workforce to achieve our target of ‘Zero Incidents’. Your Corporation has put in place a robust programme to monitor occupational health related issues among our employees and provide counselling to improve their health standards. We conduct health camps for the local communities living nearby and provide them with information on preventive health measures.
Your Corporation has its operations spread across the length and breadth of the country. We are aware that the variable availability of fresh water will severely impact our operations, with resources becoming scarce. We have constituted programs and management systems to reduce the overall consumption of water. At several of our locations, we have instituted programs on rainwater harvesting and adopted various conservation measures. Recycling of treated ��}����������������������������������������������������� ������������� water intake.
HPCL has constituted a Board-level Sub-Committee to review and monitor the Sustainable Development initiatives being undertaken by the Corporation. During Fiscal Year 2012-13, your Corporation focussed on Sustainable Development projects aimed towards energy conservation, renewable energy, water harvesting and carbon footprint.
The Principle of Sustainability is becoming a way of life in the Corporation. Our policy on Sustainable Development has been communicated to all the employees. As we progress, we are sure the Corporation will set ���~��� ��������� ������ �� ������������sustainability performance over the coming years. Our approach as a Corporate Citizen is a full-time commitment with the same goals, strategies and accountabilities that drive our business.
Moving into 2012, we have an unprecedented momentum. Our corporate strategy, based on ������������� �~�� ������������ ��������and disciplined approach, provides the foundation on which our success is built and a basis for continuous improvement.
As the business and societal landscape evolves, we will too. We look forward to continue working with our customers, industry partners, employees and shareholders and empower their lives. Consistent with our standing as an energy company, we will continue to innovate to create sustainable solutions to meet the challenges ahead.
We strive to develop a good safety culture amongst our workforce to achieve our target of ‘Zero Incidents’.
9Sustainability Report 2011-12
10
Company ��� �
HPCL is a mega Public Sector Undertaking (PSU) with a Navratna status. It is a Fortune 500 and Forbes 2000 listed Company which recorded an annual Gross Sale of INR 1,881,310 million during FY 2011-12. Our crude throughput and market sales (including exports) stood at 16.19 Million Metric Tonnes (MMT) and 29.40 MMT, respectively. HPCL commands a 19.96% market share among oil PSUs with a strong market infrastructure spread across the country.
^�_������������������������������variety of petroleum products – fuels, lubricants ��������� ����������+������������!����in Mumbai (West Coast) with a capacity of 6.5 MMTPA, while the other is in Visakhapatnam (East Coast) with a capacity of 8.3 MMTPA. HPCL also holds an equity stake of 16.95% in %���� ���'������������������ �_�������%'_��������=��=���=������������%���� ���with 9 MMTPA capacity. Besides, in collaboration with Mittal Energy Investments Pte. Ltd., HPCL has set up a state-of-the-art 9 MT capacity "������ �'��������\�����������$�!+
HPCL also owns and operates India’s largest _�!�'���������������_�!�\����� ����������������@@��???%>+>��'��������������lube base oils and specialties, which account for over 40% of India’s total Lube Base Oil production.
HPCL’s marketing network consists of 13 Zonal ����������$�����������[?['������ ������+These are facilitated by a Supply & Distribution infrastructure comprising Terminals, Pipeline Networks, Aviation Service Stations, LPG Bottling Plants, Inland Relay Depots & Retail Outlets and Lube and LPG Distributorships.
%��!��'������
HPCL’s Marketing Infrastructure
Marketing Infrastructure
Terminals 33
Depots(POL & Lubes) 90
LPG Bottling Plants 45
Lube Blending Plants 7
ASFs 34
Retail Outlets 11,253
SKO/ LDO Dealers 1,638
LPG Distributors 2,897
LPG Customers (in millions) 36.2
Major Product Pipelines 3
10
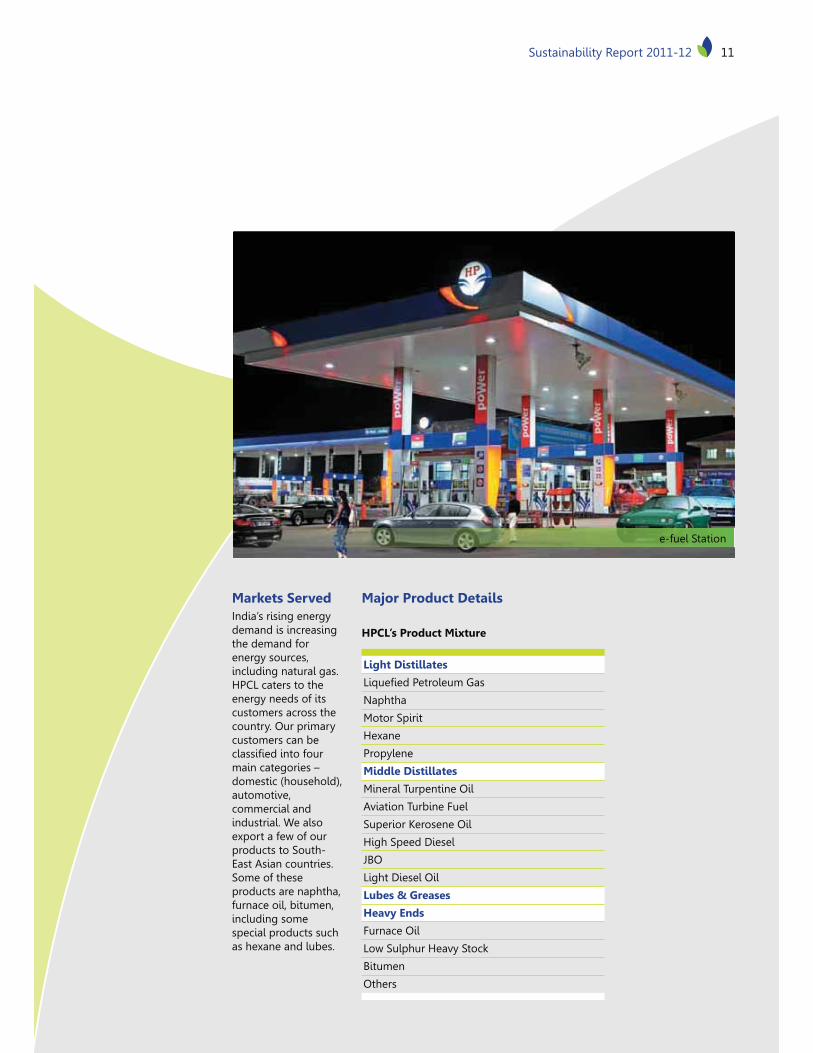
11Sustainability Report 2011-12
e-fuel Station
Major Product Details
HPCL’s Product Mixture
Light Distillates
_����������� ���"��
Naphtha
Motor Spirit
Hexane
Propylene
Middle Distillates
Mineral Turpentine Oil
Aviation Turbine Fuel
Superior Kerosene Oil
High Speed Diesel
JBO
Light Diesel Oil
Lubes & Greases
Heavy Ends
Furnace Oil
Low Sulphur Heavy Stock
Bitumen
Others
Markets ServedIndia’s rising energy demand is increasing the demand for energy sources, including natural gas. HPCL caters to the energy needs of its customers across the country. Our primary customers can be � ���������������main categories – domestic (household), automotive, commercial and industrial. We also export a few of our products to South-East Asian countries. Some of these products are naphtha, furnace oil, bitumen, including some special products such as hexane and lubes.
12
HPCL lays a special and sustained emphasis on conducting its affairs within the policy framework of the Government of India, statutory regulations and the internal procedures in a transparent manner. Being an Undertaking of the Government of India, we are periodically reviewed by several external authorities such as the Comptroller & Auditor General of India (CAG), the Central Vigilance Commission (CVC) and the Parliamentary Committees. HPCL also has an independent mechanism of monitoring and auditing its processes through various internal departments such as the Internal Audit and Vigilance Departments.
In addition to meeting the compliance requirements, our governance structure ensures:
We are running our operations safely – both for the workforce and local communities living around us
We compensate our workforce fairly and follow relevant labour laws and regulations
We proportionately meet the national energy demand
We comply with all statutory laws and regulations
We engage responsibly with the local ���������������
We protect the best interests of our shareholders and investors
Governance Structure of the Organization
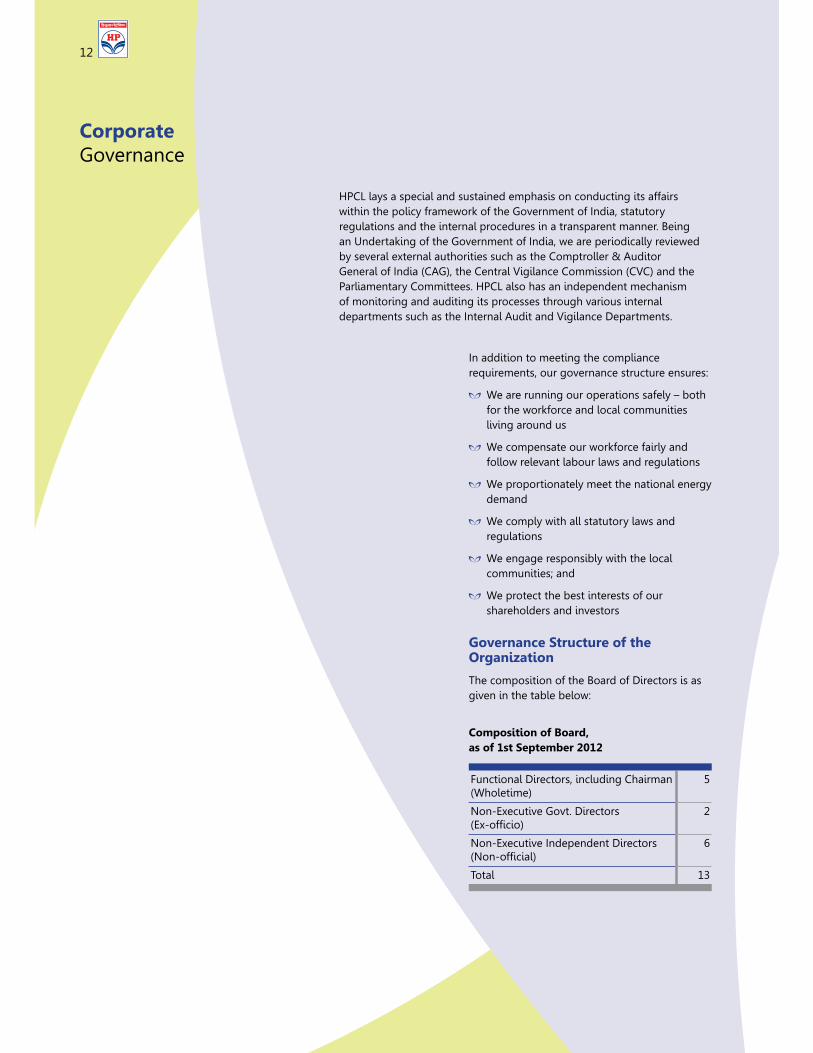
The composition of the Board of Directors is as given in the table below:
Composition of Board, as of 1st September 2012
Functional Directors, including Chairman (Wholetime)
5
Non-Executive Govt. Directors��~=�������
2
Non-Executive Independent Directors �<��=������ �
6
Total 13
Corporate Governance
12
13Sustainability Report 2011-12
Independent Directors are those who are not current employees of HPCL
Board members are appointed by the Government of India
HPCL has 5 oversight committees of the Board, details of which are given in the below table:
HPCL Board Sub-Committees
Committee Name Oversight Responsibility Chairman*
Audit '������������ ������� statements
Review of adequacy of internal control systems
Review of adequacy of internal audit function
Discussion with internal auditors
'���������������� ������internal fraud and irregularities
'�������������� �������management policies
Gitesh K Shah
HR Policies / Remuneration
Aspects related to remuneration, ���������������!���������employees
S.K. Roongta
Investment Review of investment proposals sent to Board for investments about INR 100 Cr
Anil Razdan
Investor Grievance Review of investor grievance status and other matters of investor interest
Gitesh K Shah
CSR Review, discussion and guidance on various CSR initiatives
Anil Razdan
*Non Executive Directors on the board
HPCL has 5 oversight committees of the Board
13Sustainability Report 2011-12
14
The Board sub-committee on Sustainability
The Board of Directors of HPCL constituted a Sub-Committee on Sustainability on 12th March, 2012. The Sub-Committee comprises 5 members and is chaired by an Independent Director. The mandate of this Committee is to monitor the implementation of the Sustainable Development initiatives of the Company.
SD Policy
An SD policy has been formulated for the Company and disseminated to all the employees through circulars and web-based portals.
Seeking Shareholder and Employee Feedback
Shareholder Feedback
In the event that shareholders have any grievances or need to provide recommendations to the Board, HPCL has constituted an Investor Grievance Committee to review the status of shareholder grievances and accommodate their recommendations. The Company also interacts with its shareholders through letters and circulars, at the Annual General Meeting and at Investor Meets.
Employee Feedback
HPCL pays utmost attention to the feedback of its employees and encourages them to openly share their views with the Management. Such interaction is facilitated through discussions with the representatives of the employee unions and also via direct communication with the employees.
Compensation for the Board of Directors, Executives and Senior Managers
The compensation of the Whole-time Board of Directors and Senior Managers in the Company is partly dependant on the performance of the organization as a whole. Each year, HPCL signs a MoU with the Ministry of Petroleum & Natural Gas. Performance in comparison with targets laid out in the MoU determines the employees’ overall variable performance-linked compensation.
���/������3�������
During 2011-12, there were no material transactions with Directors or their relatives ��������������� ���}�������������������of the Company at large. The organization has ��� =�������_������������������������management role that seeks to eliminate the self interests of individuals that may cause ���}��������������+
Evaluating Performance
The performance of the Ministry of Petroleum & Natural Gas is reviewed each year, based on the MoU targets agreed earlier. These targets help rate different departments of the Company based on their performance in categories ranging from Excellent, Very Good, Good, Average and Poor. The variable components ��������� ��������������������������� incentives are based on the rating received. HPCL has successfully achieved a rating of ‘Excellent’ over the last three years.
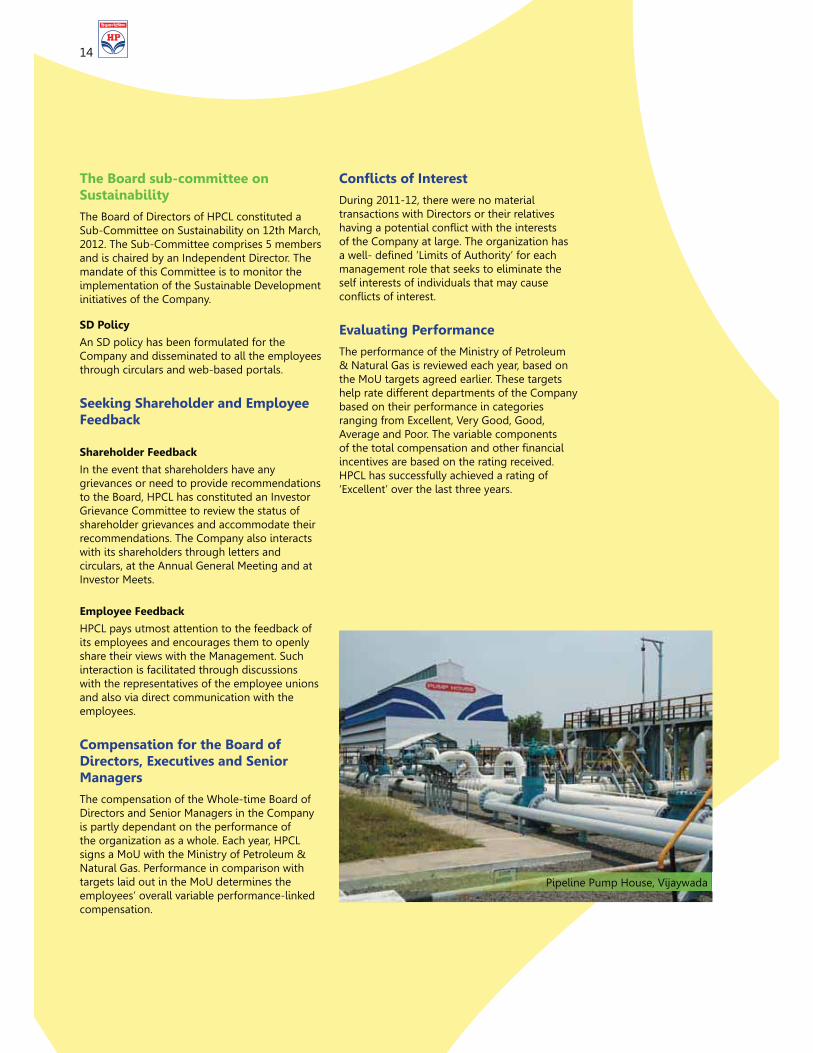
Pipeline Pump House, Vijaywada
15Sustainability Report 2011-12
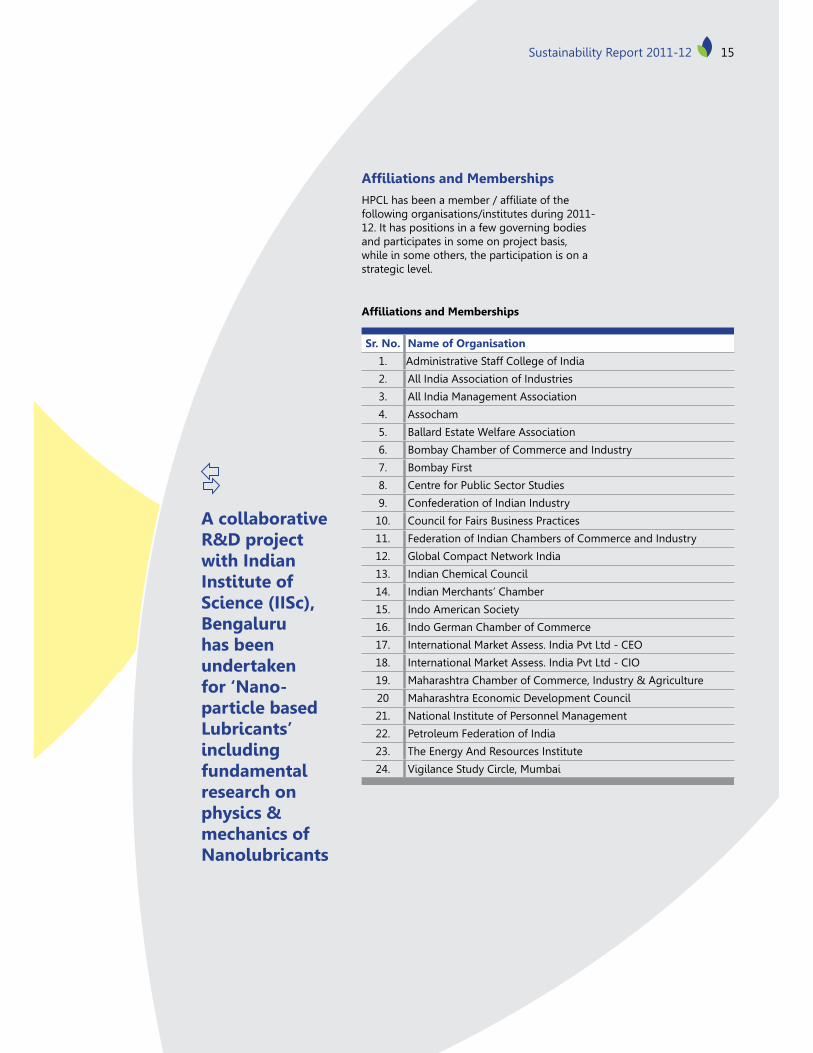
�� �������������4�������
Sr. No. Name of Organisation
1. Administrative Staff College of India
2. All India Association of Industries
3. All India Management Association
4. Assocham
5. Ballard Estate Welfare Association
6. Bombay Chamber of Commerce and Industry
7. Bombay First
8. Centre for Public Sector Studies
9. Confederation of Indian Industry
10. Council for Fairs Business Practices
11. Federation of Indian Chambers of Commerce and Industry
12. Global Compact Network India
13. Indian Chemical Council
14. Indian Merchants’ Chamber
15. Indo American Society
16. Indo German Chamber of Commerce
17. International Market Assess. India Pvt Ltd - CEO
18. International Market Assess. India Pvt Ltd - CIO
19. Maharashtra Chamber of Commerce, Industry & Agriculture
20 Maharashtra Economic Development Council
21. National Institute of Personnel Management
22. Petroleum Federation of India
23. The Energy And Resources Institute
24. Vigilance Study Circle, Mumbai
�� �������������4�������
^�_���!�������!������ ���������following organisations/institutes during 2011-12. It has positions in a few governing bodies and participates in some on project basis, while in some others, the participation is on a strategic level.
A collaborative R&D project with Indian Institute of Science (IISc), Bengaluru has been undertaken for ‘Nano-particle based Lubricants’ including fundamental research on physics & mechanics of Nanolubricants
15Sustainability Report 2011-12
16
Our Sustainability ContextStakeholder Engagement, Materiality and Sustainability Risk
%��!��'������
17Sustainability Report 2011-12
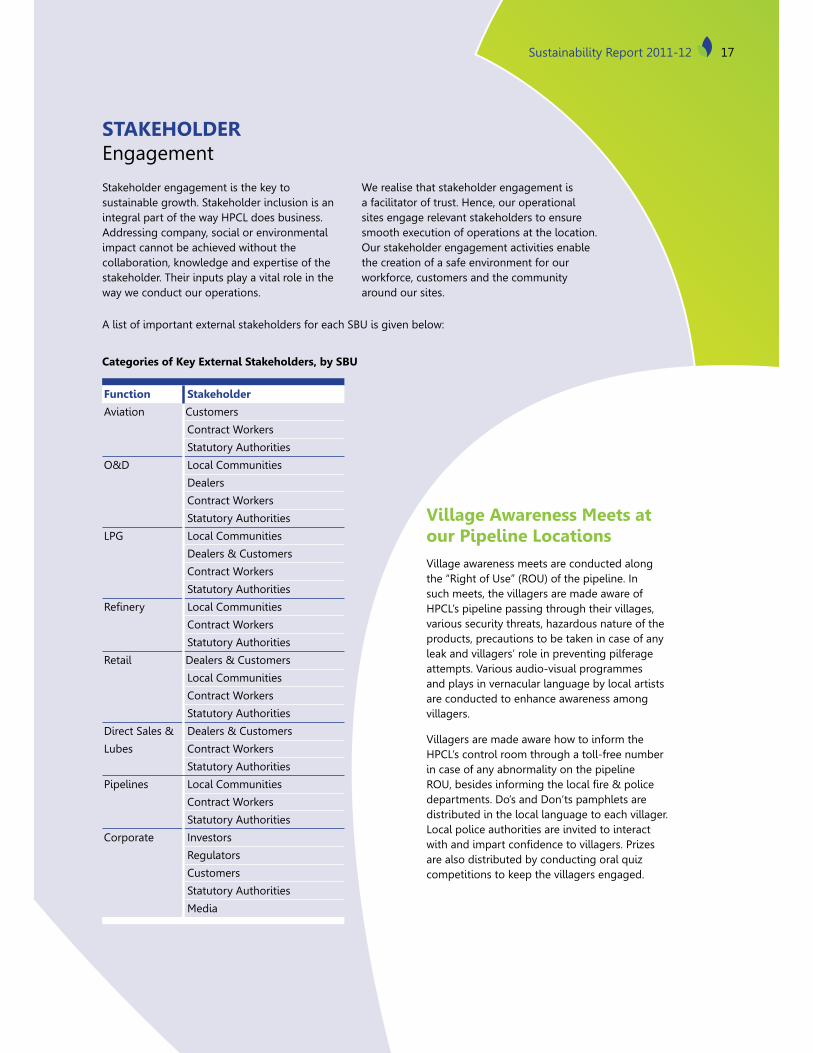
Stakeholder engagement is the key to sustainable growth. Stakeholder inclusion is an integral part of the way HPCL does business. Addressing company, social or environmental impact cannot be achieved without the collaboration, knowledge and expertise of the stakeholder. Their inputs play a vital role in the way we conduct our operations.
We realise that stakeholder engagement is a facilitator of trust. Hence, our operational sites engage relevant stakeholders to ensure smooth execution of operations at the location. Our stakeholder engagement activities enable the creation of a safe environment for our workforce, customers and the community around our sites.
STAKEHOLDER Engagement
Function Stakeholder
Aviation Customers
Contract Workers
Statutory Authorities
O&D Local Communities
Dealers
Contract Workers
Statutory Authorities
LPG Local Communities
Dealers & Customers
Contract Workers
Statutory Authorities
'������ Local Communities
Contract Workers
Statutory Authorities
Retail Dealers & Customers
Local Communities
Contract Workers
Statutory Authorities
Direct Sales & Dealers & Customers
Lubes Contract Workers
Statutory Authorities
Pipelines Local Communities
Contract Workers
Statutory Authorities
Corporate Investors
Regulators
Customers
Statutory Authorities
Media
A list of important external stakeholders for each SBU is given below:
Categories of Key External Stakeholders, by SBU
Village Awareness Meets at our Pipeline Locations
Village awareness meets are conducted along the “Right of Use” (ROU) of the pipeline. In such meets, the villagers are made aware of HPCL’s pipeline passing through their villages, various security threats, hazardous nature of the products, precautions to be taken in case of any leak and villagers’ role in preventing pilferage attempts. Various audio-visual programmes and plays in vernacular language by local artists are conducted to enhance awareness among villagers.
Villagers are made aware how to inform the HPCL’s control room through a toll-free number in case of any abnormality on the pipeline '���!������������������ ��� ������ ���departments. Do’s and Don’ts pamphlets are distributed in the local language to each villager. Local police authorities are invited to interact �������������������������� �����+�����are also distributed by conducting oral quiz competitions to keep the villagers engaged.
17Sustainability Report 2011-12
18 Hindustan Petroleum Corporation Limited18
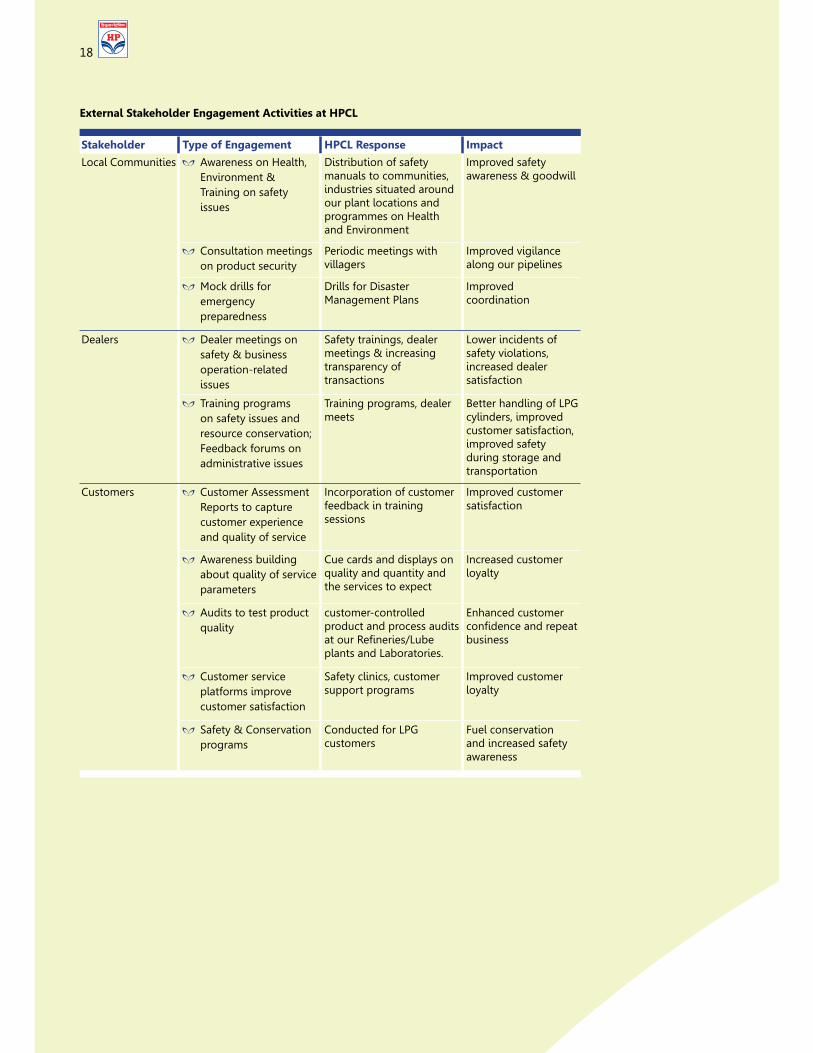
External Stakeholder Engagement Activities at HPCL
Stakeholder Type of Engagement HPCL Response Impact
Local Communities Awareness on Health, Environment & Training on safety issues
Distribution of safety manuals to communities, industries situated around our plant locations and programmes on Health and Environment
Improved safety awareness & goodwill
Consultation meetings on product security
Periodic meetings with villagers
Improved vigilance along our pipelines
Mock drills for emergency preparedness
Drills for Disaster Management Plans
Improved coordination
Dealers Dealer meetings on safety & business operation-related issues
Safety trainings, dealer meetings & increasing transparency of transactions
Lower incidents of safety violations, increased dealer satisfaction
Training programs on safety issues and ���������������������Feedback forums on administrative issues
Training programs, dealer meets
Better handling of LPG cylinders, improved customer satisfaction, improved safety during storage and transportation
Customers Customer Assessment Reports to capture customer experience and quality of service
Incorporation of customer feedback in training sessions
Improved customer satisfaction
Awareness building about quality of service parameters
Cue cards and displays on quality and quantity and the services to expect
Increased customer loyalty
Audits to test product quality
customer-controlled product and process audits �����'���������_�!�plants and Laboratories.
Enhanced customer ������������������business
Customer service platforms improve customer satisfaction
Safety clinics, customer support programs
Improved customer loyalty
Safety & Conservation programs
Conducted for LPG customers
Fuel conservation and increased safety awareness
18
19Sustainability Report 2011-12 19Sustainability Report
External Stakeholder Engagement Activities at HPCL
Stakeholder Type of Engagement HPCL Response Impact
Contract Workers Training Programs on HSE issues and customer interaction
HSE meetings, safety talks & training sessions with contract workers
Decline in accident rates and ‘near miss’ cases
Training sessions on customer care and safe handling of products
Improved customer satisfaction
Rewards & Recognition to improve contract worker performance
Best contractor awards Increased safety at operational sites
Health camps Enhanced morale and workers’ health
Regulators & Statutory Bodies
Disaster management plant to test preparedness and coordination with authorities during emergencies
Participation of local authorities in mock safety drills
Enhanced coordination for disaster management
%�������������� �to improve overall coordination
� ������������������raised
Meeting the expectations and resolving the issues
Besides external stakeholders, our employees constitute our most important internal stakeholders. Periodic interactions with them are scheduled to ensure employee satisfaction.
Interactions with employees are enabled through: Employee Satisfaction Surveys, Awareness Weeks with Quiz Competitions, Slogan and Essay Writing Contests, Health Monitoring, Schemes for Recognizing Outstanding Performance (HP GAURAV, HP ACHIEVERS, HP ICON) and Training Programs. For this reporting cycle, we have also sought their inputs in helping us understand some important sustainability aspects the organization needs to address.
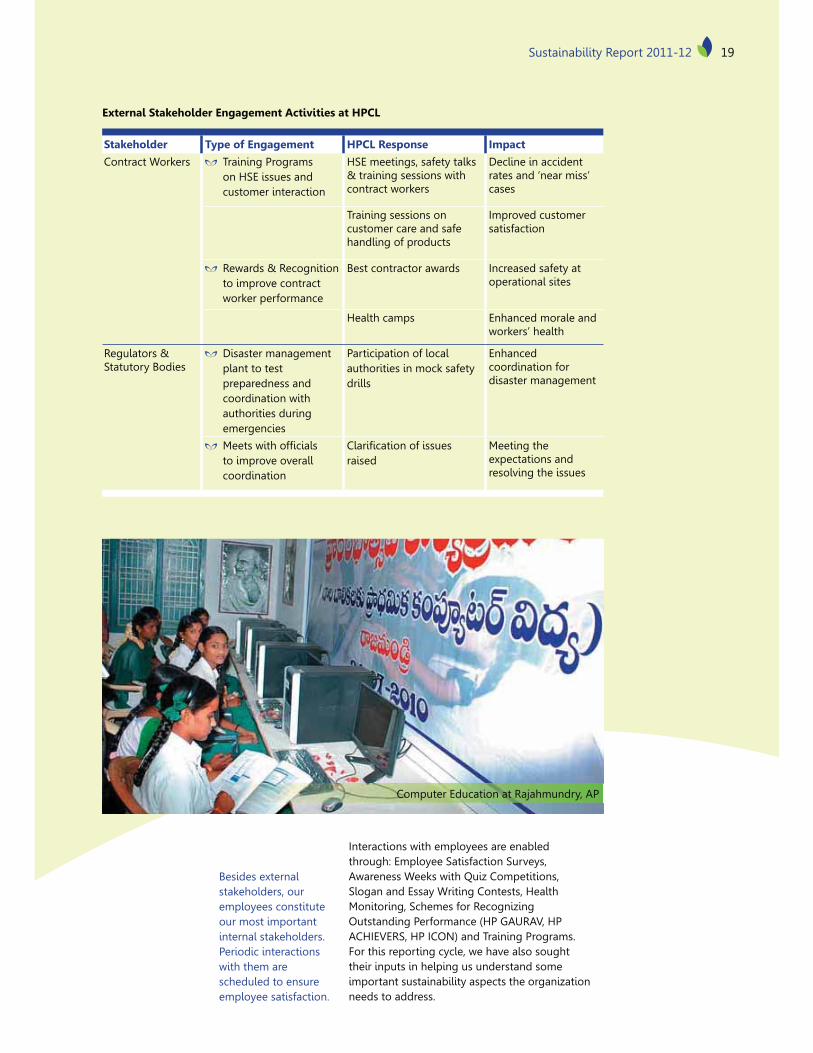
Computer Education at Rajahmundry, AP
19Sustainability Report 2011-12
20 Hindustan Petroleum Corporation Limited20
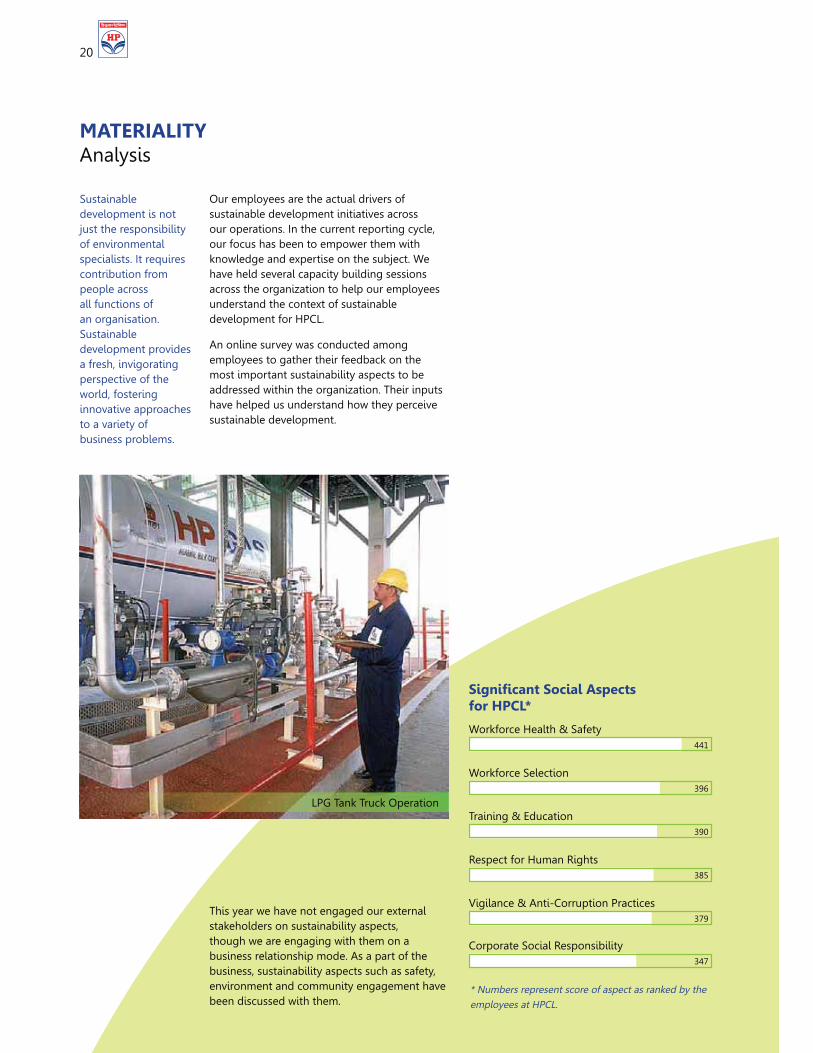
MATERIALITY Analysis
* Numbers represent score of aspect as ranked by the
employees at HPCL.
Workforce Health & Safety441
396
Workforce Selection
390
Training & Education
385
Respect for Human Rights
379
Vigilance & Anti-Corruption Practices
347
Corporate Social Responsibility
8���� ����8������������for HPCL*
Sustainable development is not just the responsibility of environmental specialists. It requires contribution from people across all functions of an organisation. Sustainable development provides a fresh, invigorating perspective of the world, fostering innovative approaches to a variety of business problems.
This year we have not engaged our external stakeholders on sustainability aspects, though we are engaging with them on a business relationship mode. As a part of the business, sustainability aspects such as safety, environment and community engagement have been discussed with them.
Our employees are the actual drivers of sustainable development initiatives across our operations. In the current reporting cycle, our focus has been to empower them with knowledge and expertise on the subject. We have held several capacity building sessions across the organization to help our employees understand the context of sustainable development for HPCL.
An online survey was conducted among employees to gather their feedback on the most important sustainability aspects to be addressed within the organization. Their inputs have helped us understand how they perceive sustainable development.
LPG Tank Truck Operation
20
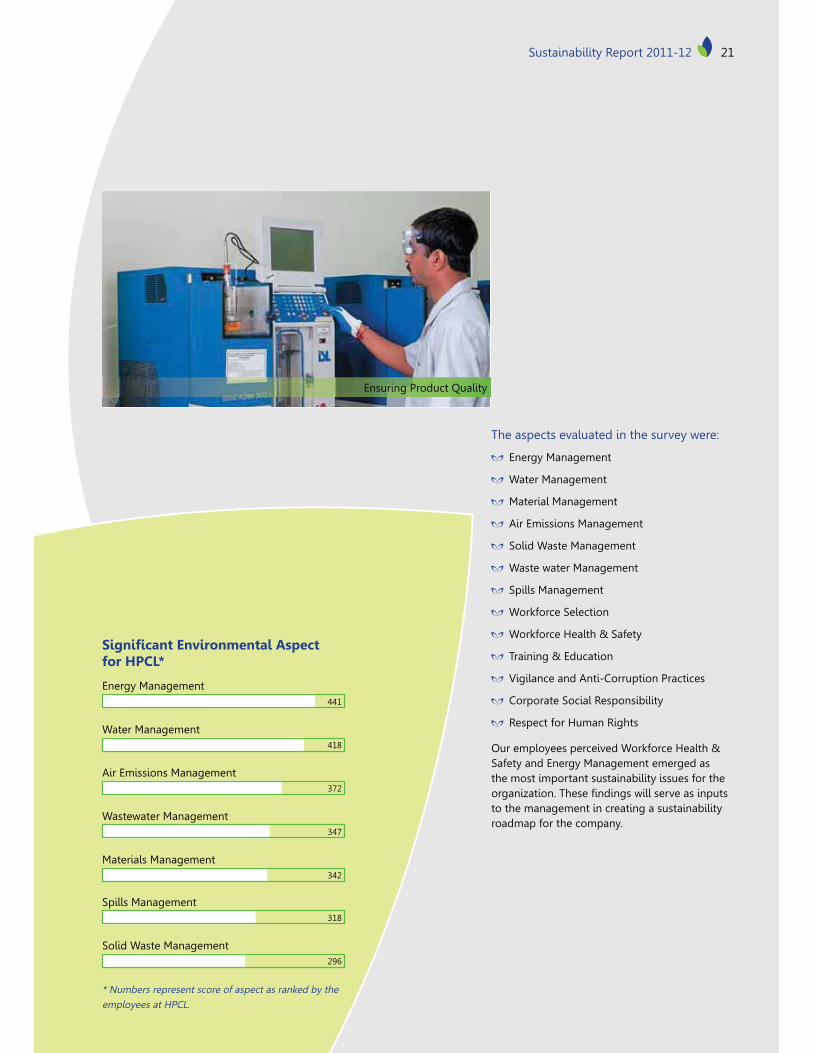
21Sustainability Report 2011-12 21Sustainability Report
* Numbers represent score of aspect as ranked by the
employees at HPCL.
Energy Management441
418
Water Management
372
Air Emissions Management
347
Wastewater Management
342
Materials Management
318
Spills Management
296
Solid Waste Management
8���� ����$�9����������������for HPCL*
The aspects evaluated in the survey were:
Energy Management
Water Management
Material Management
Air Emissions Management
Solid Waste Management
Waste water Management
Spills Management
Workforce Selection
Workforce Health & Safety
Training & Education
Vigilance and Anti-Corruption Practices
Corporate Social Responsibility
Respect for Human Rights
Our employees perceived Workforce Health & Safety and Energy Management emerged as the most important sustainability issues for the ������������+>������������� �������������to the management in creating a sustainability roadmap for the company.
Ensuring Product Quality
21Sustainability Report 2011-12
22
KEY IMPACTS, RISKS & Opportunities
Water
India has been increasingly experiencing variable rainfall. The last few years have seen an appreciable shift in rainfall patterns and the demand for water has also increased considerably, adding tremendous stress on water resources.
Anticipating that India’s water situation will further intensify, HPCL has begun taking concerted efforts to optimize its dependence on external water resources. Various measures such as conservation and optimization of usage, increase in water recycling and reuse have been taken up across our locations. Rainwater harvesting is also considered as a viable alternative.
Energy Security
All development needs energy. As economic growth sustains itself and consumption rises, India’s energy requirements are bound to stagger. Most of our energy requirements are being met through non-grid sources. However, as we implement various technologies to diversify our product line and meet stringent ��� ����������������������������������requirements will also increase.
^�_������������ ��������������������� energy requirements owing to the unreliable grid supply. Another area of concern is that our operations need to resort to captive power generation, requiring the need for costlier fuels. This can have a direct economic impact on us and our environmental performance as well.
Naturally, we are already in the process of taking several steps to counter the growing demand and improve our energy consumption. This is being done by adapting energy conservation measures and focussing on optimization as highlighted in the report.
No formal engagement has been conducted with external stakeholders on sustainability to assess the sustainability risks. But we do recognize that our business faces several risks which are a result of the changing social and environmental context. We understand these risks and periodically evaluate them to ensure we stay ahead of issues that might jeopardize our operations in the short or long run.
The risks and challenges highlighted below serve as the context for our sustainable development plans.
22
23Sustainability Report 2011-12
RESPONDING TO OUR sustainability challenges
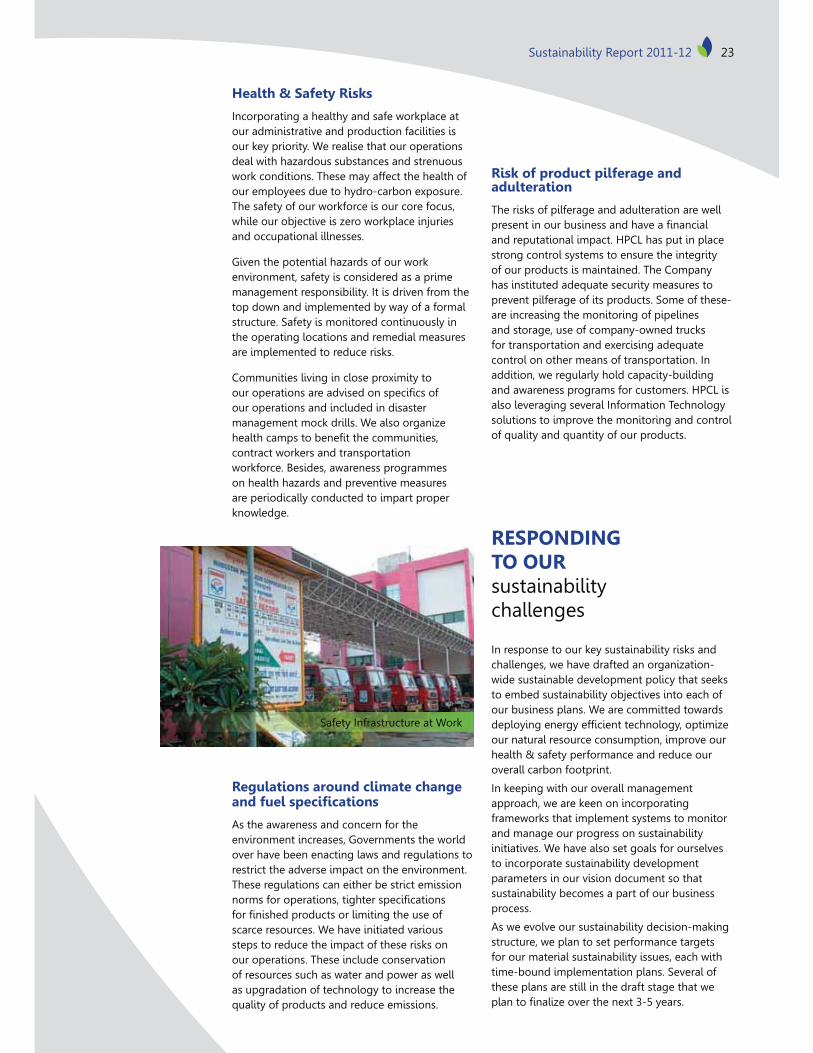
Safety Infrastructure at Work
Health & Safety Risks
Incorporating a healthy and safe workplace at our administrative and production facilities is our key priority. We realise that our operations deal with hazardous substances and strenuous work conditions. These may affect the health of our employees due to hydro-carbon exposure. The safety of our workforce is our core focus, while our objective is zero workplace injuries and occupational illnesses.
Given the potential hazards of our work environment, safety is considered as a prime management responsibility. It is driven from the top down and implemented by way of a formal structure. Safety is monitored continuously in the operating locations and remedial measures are implemented to reduce risks.
Communities living in close proximity to �����������������������������������our operations and included in disaster management mock drills. We also organize ��� ���������!��������������������contract workers and transportation workforce. Besides, awareness programmes on health hazards and preventive measures are periodically conducted to impart proper knowledge.
Regulations around climate change ����������� �������
As the awareness and concern for the environment increases, Governments the world over have been enacting laws and regulations to restrict the adverse impact on the environment. These regulations can either be strict emission ����������������������������������������������������������� ���������������scarce resources. We have initiated various steps to reduce the impact of these risks on our operations. These include conservation of resources such as water and power as well as upgradation of technology to increase the quality of products and reduce emissions.
Risk of product pilferage and adulteration
The risks of pilferage and adulteration are well ������������!���������������������� and reputational impact. HPCL has put in place strong control systems to ensure the integrity of our products is maintained. The Company has instituted adequate security measures to prevent pilferage of its products. Some of these- are increasing the monitoring of pipelines and storage, use of company-owned trucks for transportation and exercising adequate control on other means of transportation. In addition, we regularly hold capacity-building and awareness programs for customers. HPCL is also leveraging several Information Technology solutions to improve the monitoring and control of quality and quantity of our products.
In response to our key sustainability risks and challenges, we have drafted an organization-wide sustainable development policy that seeks to embed sustainability objectives into each of our business plans. We are committed towards ��� ������������������������� ������������our natural resource consumption, improve our health & safety performance and reduce our overall carbon footprint.
In keeping with our overall management approach, we are keen on incorporating frameworks that implement systems to monitor and manage our progress on sustainability initiatives. We have also set goals for ourselves to incorporate sustainability development parameters in our vision document so that sustainability becomes a part of our business process.
As we evolve our sustainability decision-making structure, we plan to set performance targets for our material sustainability issues, each with time-bound implementation plans. Several of these plans are still in the draft stage that we � ������� ������������~�@=������+
23Sustainability Report 2011-12
24
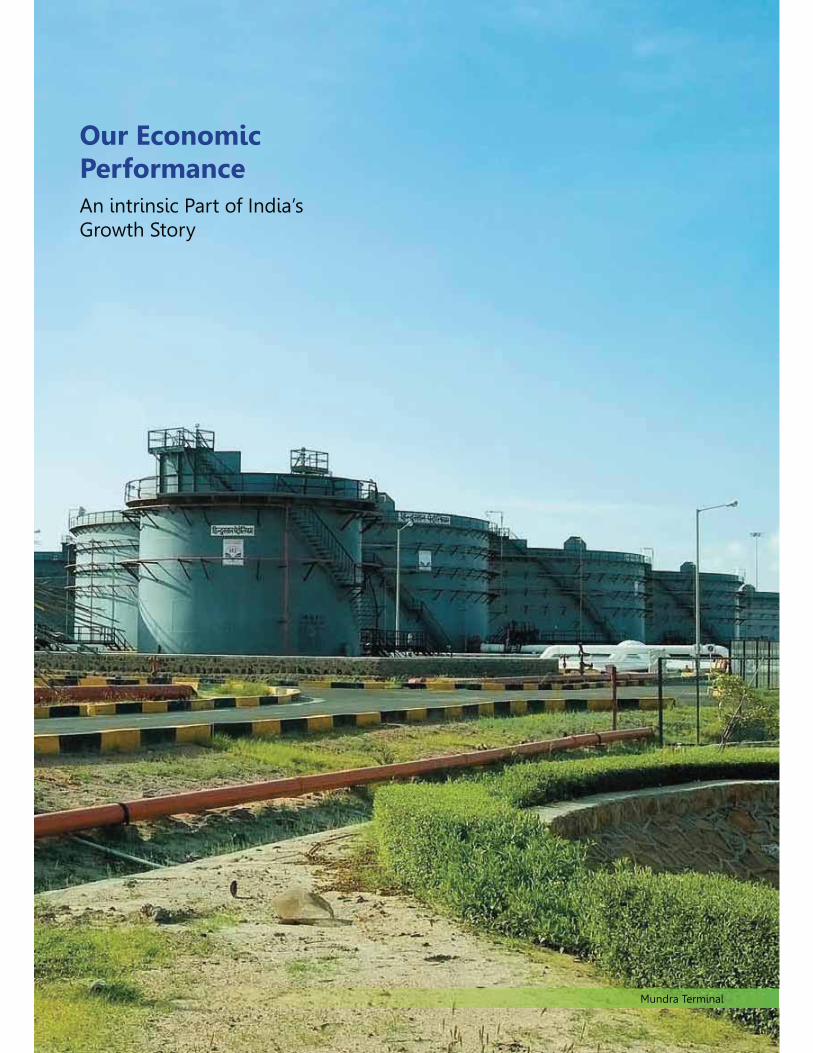
Our Economic PerformanceAn intrinsic Part of India’s Growth Story
Mundra Terminal
25Sustainability Report 2011-12
ECONOMIC Performance
India’s economy has registered a sustained growth, despite the Eurozone debt crisis. The global economy, too, is slowly limping back to a sustainable growth trajectory. Correspondingly, the demand for fossil fuels has also grown steadily.
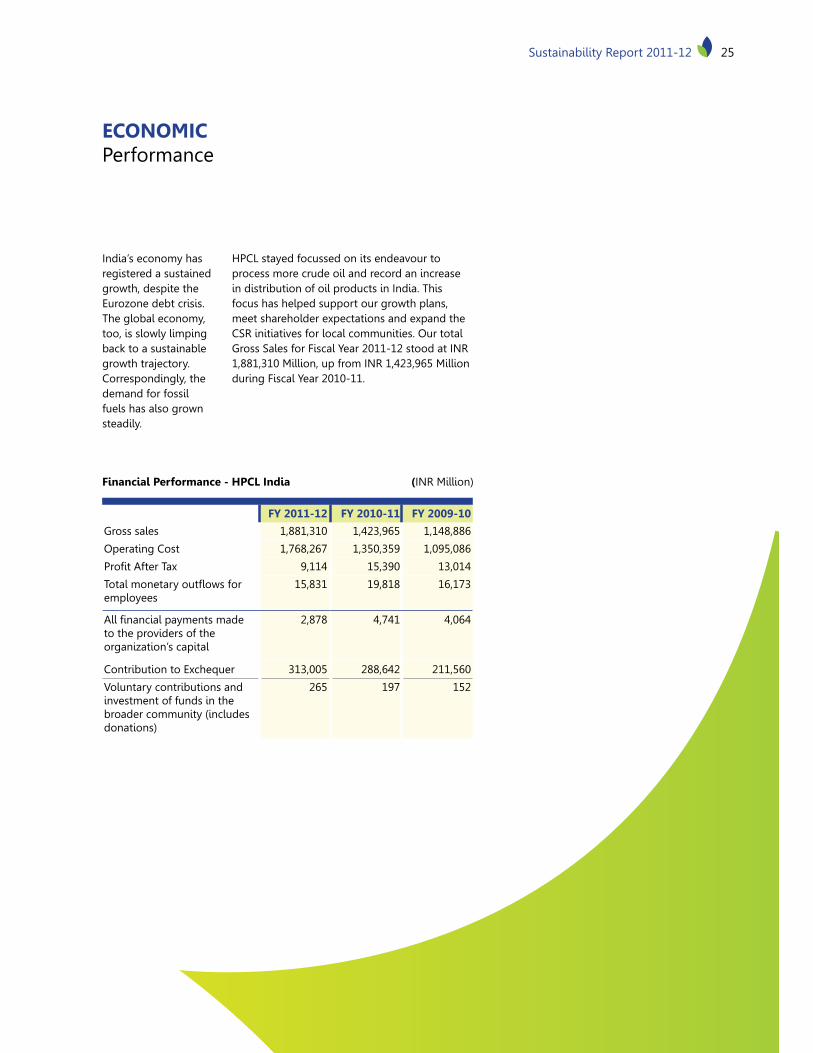
HPCL stayed focussed on its endeavour to process more crude oil and record an increase in distribution of oil products in India. This focus has helped support our growth plans, meet shareholder expectations and expand the CSR initiatives for local communities. Our total Gross Sales for Fiscal Year 2011-12 stood at INR 1,881,310 Million, up from INR 1,423,965 Million during Fiscal Year 2010-11.
Financial Performance - HPCL India (INR Million)
FY 2011-12 FY 2010-11 FY 2009-10
Gross sales 1,881,310 1,423,965 1,148,886
Operating Cost 1,768,267 1,350,359 1,095,086
���������>�~ 9,114 15,390 13,014
>��� �����������}������employees
15,831 19,818 16,173
� ������� ������������to the providers of the organization’s capital
2,878 4,741 4,064
Contribution to Exchequer 313,005 288,642 211,560
Voluntary contributions and investment of funds in the broader community (includes donations)
265 197 152

26
Gross Sales (INR Million)
2009-101,148,886
1,423,965
2010-11
1,881,310
2011-12
$����;��<������'��� �� (INR Million)
2009-1016,173
20,172
2010-11
15,831
2011-12
Number of Employees
2009-1011,291
11,250
2010-11
11,226
2011-12
PAT (INR Million)
2009-109,114
15,390
2010-11
13,014
2011-12
Operating Costs (INR Million)
2009-101,095,086
1,350,359
2010-11
1,768,267
2011-12
Crude Throughput
2009-10
2010-11
8,682 7,506
2011-12
VR (‘000 tonnes) MR (‘000 tonnes)
8,199 6,650
8,796 6,965
$����;��'��� ��HPCL takes immense pride in providing a positive work environment to facilitate a feeling of co-�������������������������� �����+����������������������������� ����\����� ����the way we compensate our workforce. During FY 2011-12, HPCL spent a total of INR 15,831 million ����� ������������!������+
26
27Sustainability Report 2011-12
Our average salary per employee is ���������� �������than the minimum wage requirement mandated by the Government of India. �������������!������ �����employees, which are paid out of the Company’s general resources.
Our Hiring Process
Being a Government of India organization, we follow the statutory regulations governing employment practices giving equal opportunity to all the eligible candidates across the country.
Financial Assistant from Government of India
^�_������������������������ ����������from government of India during the reporting period.
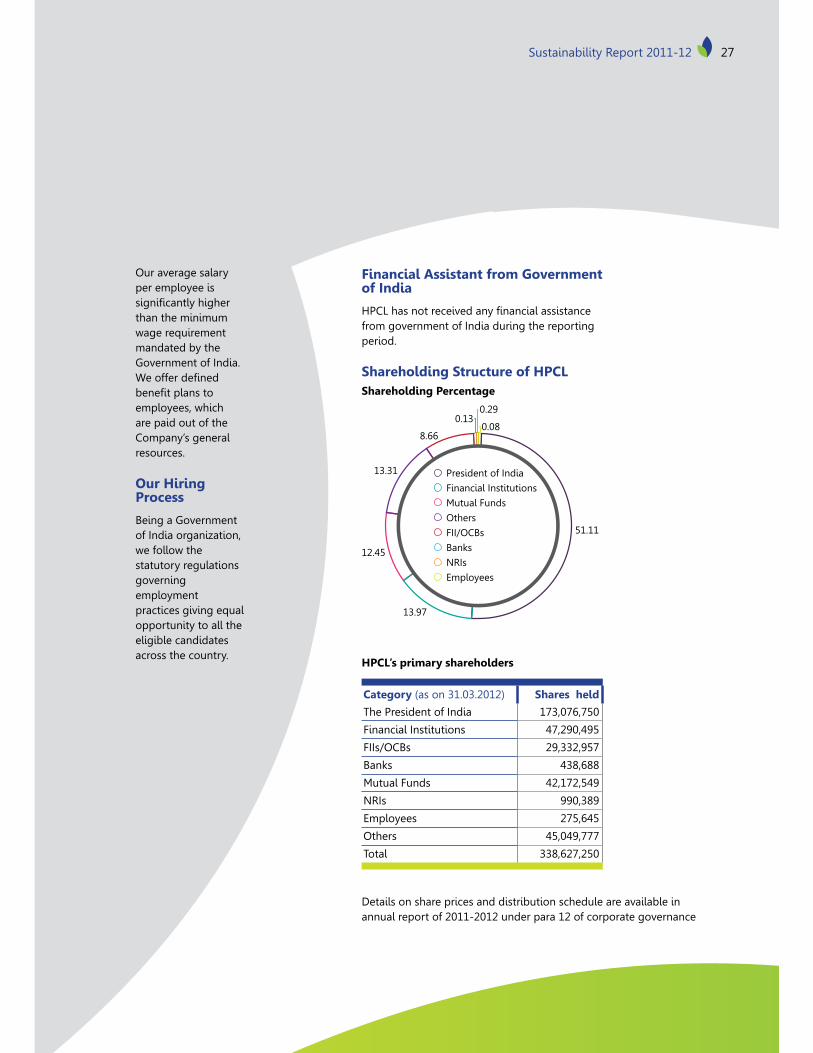
Shareholding Structure of HPCLShareholding Percentage
HPCL’s primary shareholders
Category (as on 31.03.2012) Shares held
The President of India 173,076,750
Financial Institutions 47,290,495
FIIs/OCBs 29,332,957
Banks 438,688
Mutual Funds 42,172,549
NRIs 990,389
Employees 275,645
Others 45,049,777
Total 338,627,250
0.08
0.290.13
8.66
13.31
51.11
12.45
13.97
Details on share prices and distribution schedule are available in annual report of 2011-2012 under para 12 of corporate governance
27Sustainability Report 2011-12
President of India
Financial Institutions
Mutual Funds
Others
FII/OCBs
Banks
NRIs
Employees
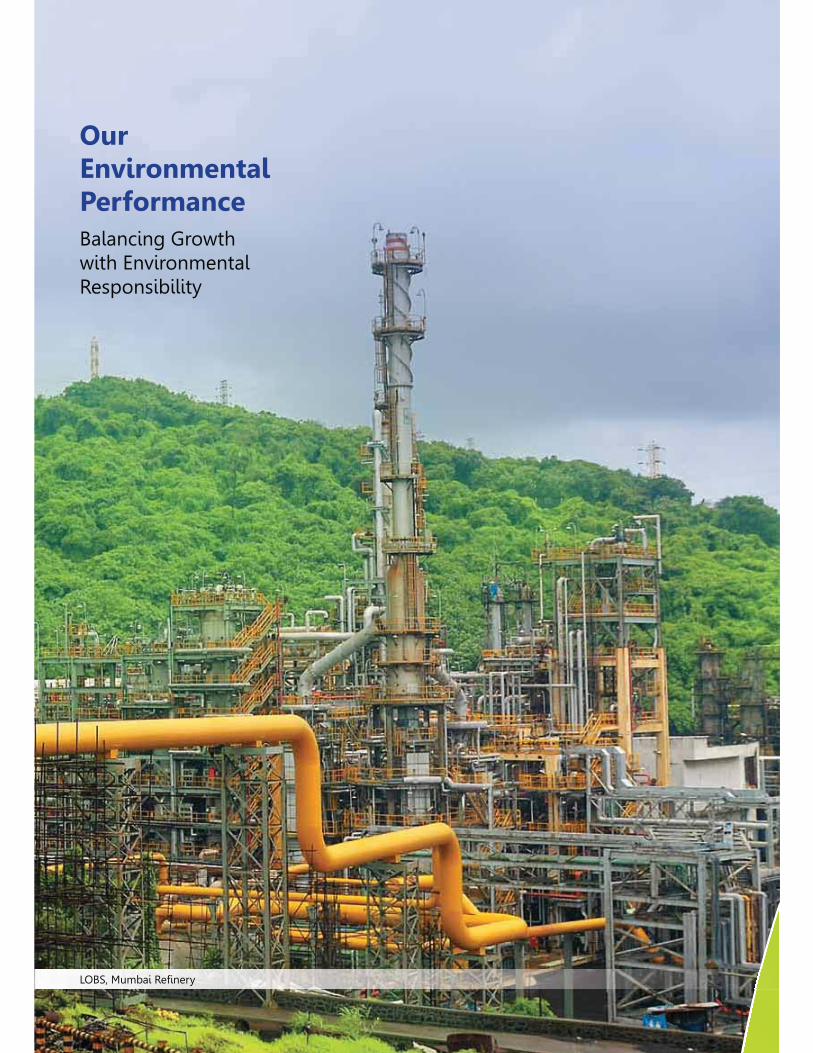
Our Environmental PerformanceBalancing Growth with Environmental Responsibility
_�\��%��!��'������
29Sustainability Report 2011-12
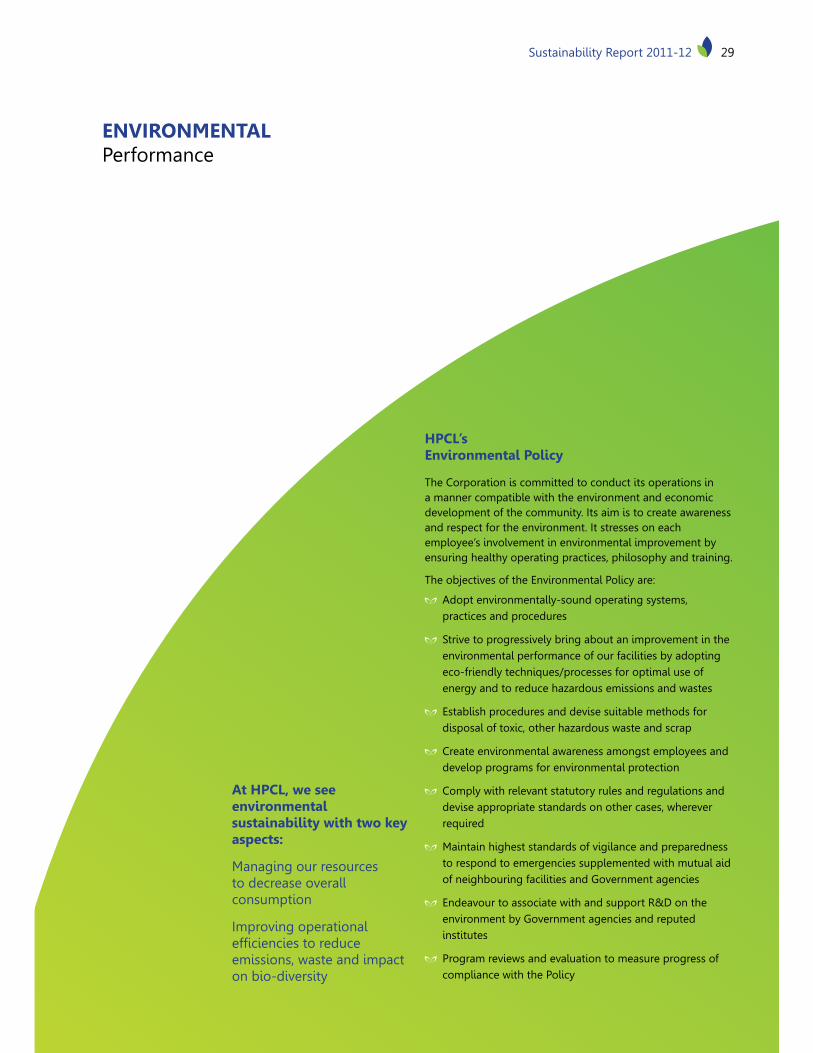
ENVIRONMENTAL Performance
HPCL’s Environmental Policy
The Corporation is committed to conduct its operations in a manner compatible with the environment and economic development of the community. Its aim is to create awareness and respect for the environment. It stresses on each employee’s involvement in environmental improvement by ensuring healthy operating practices, philosophy and training.
The objectives of the Environmental Policy are:
Adopt environmentally-sound operating systems, practices and procedures
Strive to progressively bring about an improvement in the environmental performance of our facilities by adopting eco-friendly techniques/processes for optimal use of energy and to reduce hazardous emissions and wastes
Establish procedures and devise suitable methods for disposal of toxic, other hazardous waste and scrap
Create environmental awareness amongst employees and develop programs for environmental protection
Comply with relevant statutory rules and regulations and devise appropriate standards on other cases, wherever required
Maintain highest standards of vigilance and preparedness to respond to emergencies supplemented with mutual aid of neighbouring facilities and Government agencies
Endeavour to associate with and support R&D on the environment by Government agencies and reputed institutes
Program reviews and evaluation to measure progress of compliance with the Policy
At HPCL, we see environmental sustainability with two key aspects:
Managing our resources to decrease overall consumption
Improving operational �������������������emissions, waste and impact on bio-diversity
30
RESOURCE Management
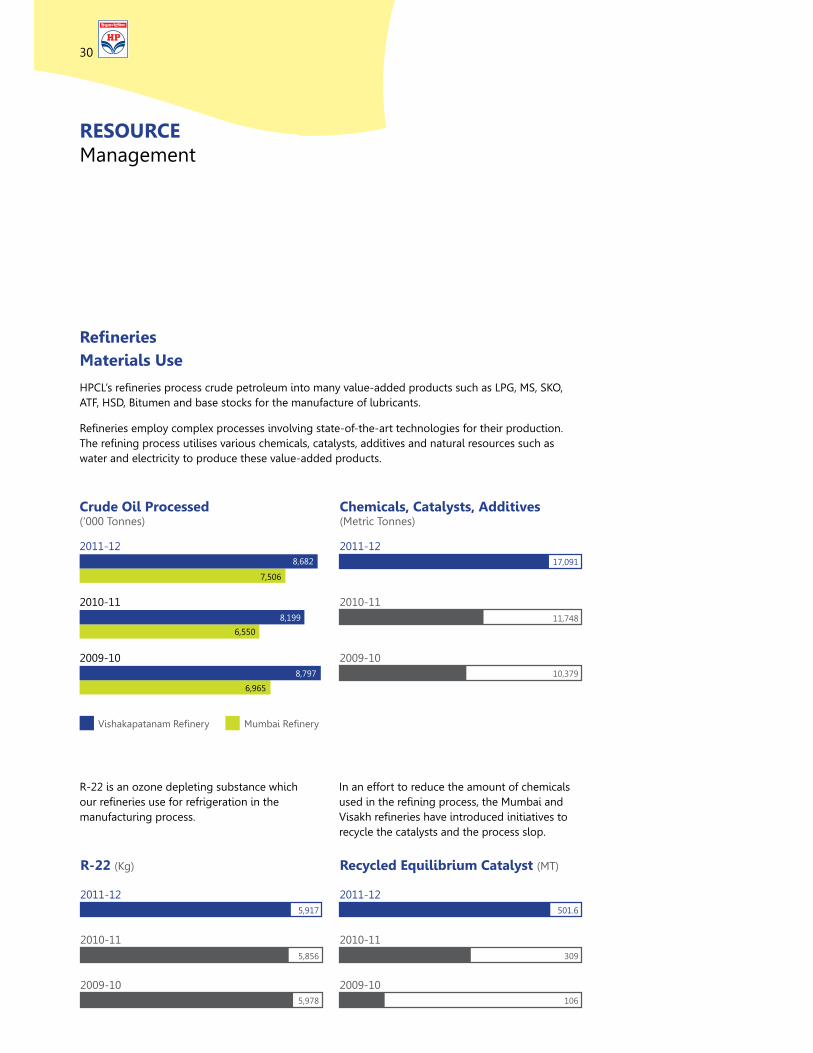
�� ������Materials Use
^�_���������������������������� ������������� ��=�������������������_"�%������ATF, HSD, Bitumen and base stocks for the manufacture of lubricants.
'����������� ������ �~������������� ���������=��=���=��������� �����������������������+>������������������� ������������������ ������ ����������������������� ���������������water and electricity to produce these value-added products.
R-22 is an ozone depleting substance which ������������������������������������manufacturing process.
In an effort to reduce the amount of chemicals ���������������������������%��!�����]�����������������������������������������recycle the catalysts and the process slop.
Crude Oil Processed (‘000 Tonnes)
]�������������'������ %��!��'������
2009-10
6,965
8,797
2010-11
6,550
8,199
2011-12
7,506
8,682
Chemicals, Catalysts, Additives (Metric Tonnes)
2009-1010,379
2010-1111,748
2011-1217,091
R-22 (Kg)
2009-105,978
2010-115,856
2011-125,917
Recycled Equilibrium Catalyst (MT)
2009-10106
2010-11309
2011-12501.6
30
31Sustainability Report 2011-12
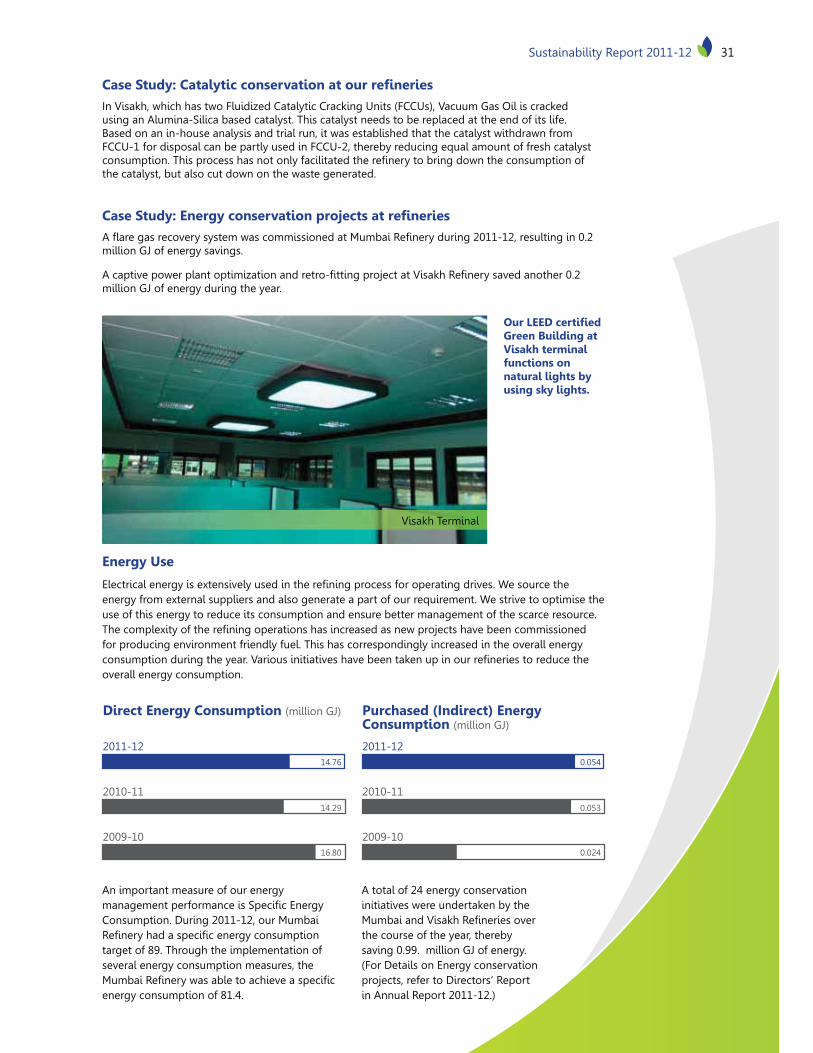
Direct Energy Consumption (million GJ)
2009-1016.80
2010-1114.29
2011-1214.76
Purchased (Indirect) Energy Consumption (million GJ)
2009-100.024
2010-110.053
2011-120.054
����8��;>�����;���������9������������ ������
In Visakh, which has two Fluidized Catalytic Cracking Units (FCCUs), Vacuum Gas Oil is cracked using an Alumina-Silica based catalyst. This catalyst needs to be replaced at the end of its life. Based on an in-house analysis and trial run, it was established that the catalyst withdrawn from FCCU-1 for disposal can be partly used in FCCU-2, thereby reducing equal amount of fresh catalyst �����������+>������������������ ����� ������������������!������������������������the catalyst, but also cut down on the waste generated.
����8��;>$����;������9��������?�������� ������
�}�������������������������������������%��!��'������������Z?[[=[Z����� ������?+Zmillion GJ of energy savings.
�������������� �����������������������=���������$�����]�����'������������������?+Zmillion GJ of energy during the year.
Energy Use
� ������� ���������~������� ������������������������������������������+�����������energy from external suppliers and also generate a part of our requirement. We strive to optimise the use of this energy to reduce its consumption and ensure better management of the scarce resource. >������ �~���������������������������������������������$��������!���������������for producing environment friendly fuel. This has correspondingly increased in the overall energy ������������������������+]���������������������!�����������������������������������overall energy consumption.
An important measure of our energy ������������������������������������Consumption. During 2011-12, our Mumbai '����������������������������������target of 89. Through the implementation of several energy consumption measures, the %��!��'����������! ������������������energy consumption of 81.4.
A total of 24 energy conservation initiatives were undertaken by the %��!�����]�����'������������the course of the year, thereby saving 0.99. million GJ of energy. (For Details on Energy conservation projects, refer to Directors’ Report in Annual Report 2011-12.)
���@$$(����� �Green Building at Visakh terminal functions on natural lights by using sky lights.
Visakh Terminal
31Sustainability Report 2011-12
32
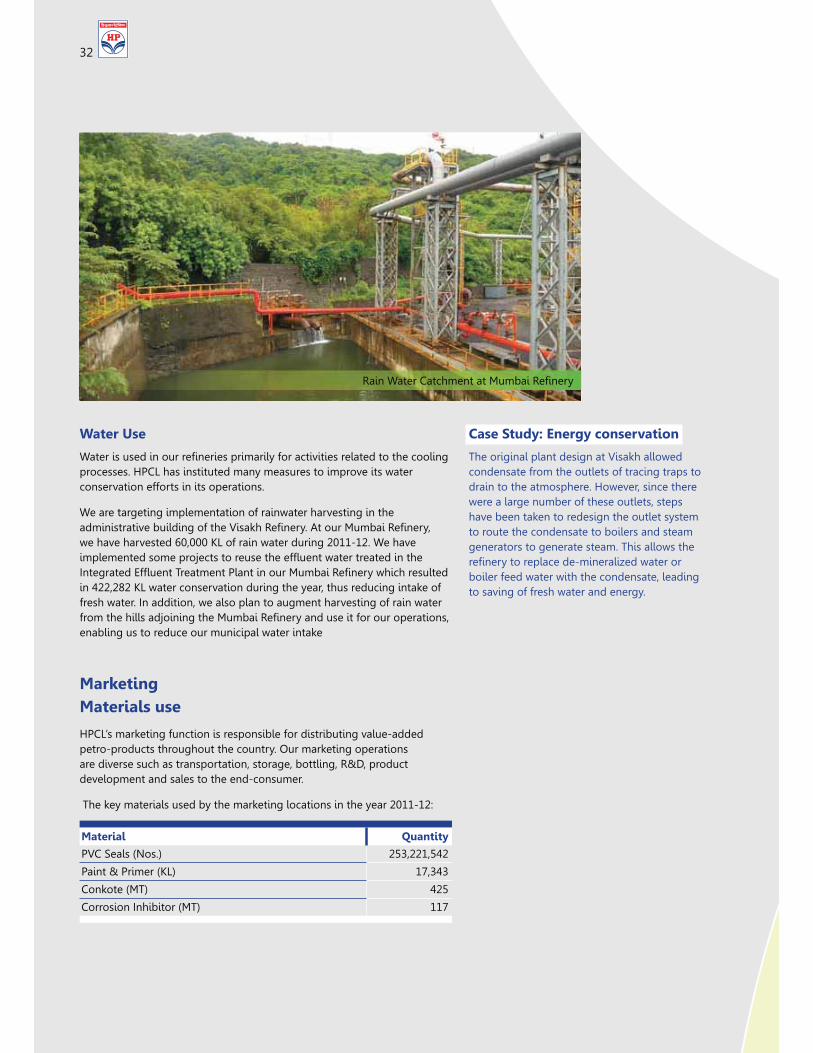
Water Use
�������������������������������� ���������������� ������������ ���processes. HPCL has instituted many measures to improve its water conservation efforts in its operations.
We are targeting implementation of rainwater harvesting in the ��������������!�� ���������]�����'������+�����%��!��'�������we have harvested 60,000 KL of rain water during 2011-12. We have ��� ��������������$����������������}���������������������`�����������}����>�������� ��������%��!��'��������������� ���in 422,282 KL water conservation during the year, thus reducing intake of fresh water. In addition, we also plan to augment harvesting of rain water ��������� ���$���������%��!��'�������������������������������enabling us to reduce our municipal water intake
'�������������������%��!��'������
Case Study: Energy conservation
The original plant design at Visakh allowed condensate from the outlets of tracing traps to drain to the atmosphere. However, since there were a large number of these outlets, steps have been taken to redesign the outlet system to route the condensate to boilers and steam generators to generate steam. This allows the ������������ �����=������ �����������boiler feed water with the condensate, leading to saving of fresh water and energy.
MarketingMaterials use
HPCL’s marketing function is responsible for distributing value-added petro-products throughout the country. Our marketing operations are diverse such as transportation, storage, bottling, R&D, product development and sales to the end-consumer.
The key materials used by the marketing locations in the year 2011-12:
Material Quantity
PVC Seals (Nos.) 253,221,542
Paint & Primer (KL) 17,343
Conkote (MT) 425
Corrosion Inhibitor (MT) 117
32
33Sustainability Report 2011-12
GENERATING CLEAN ENERGY
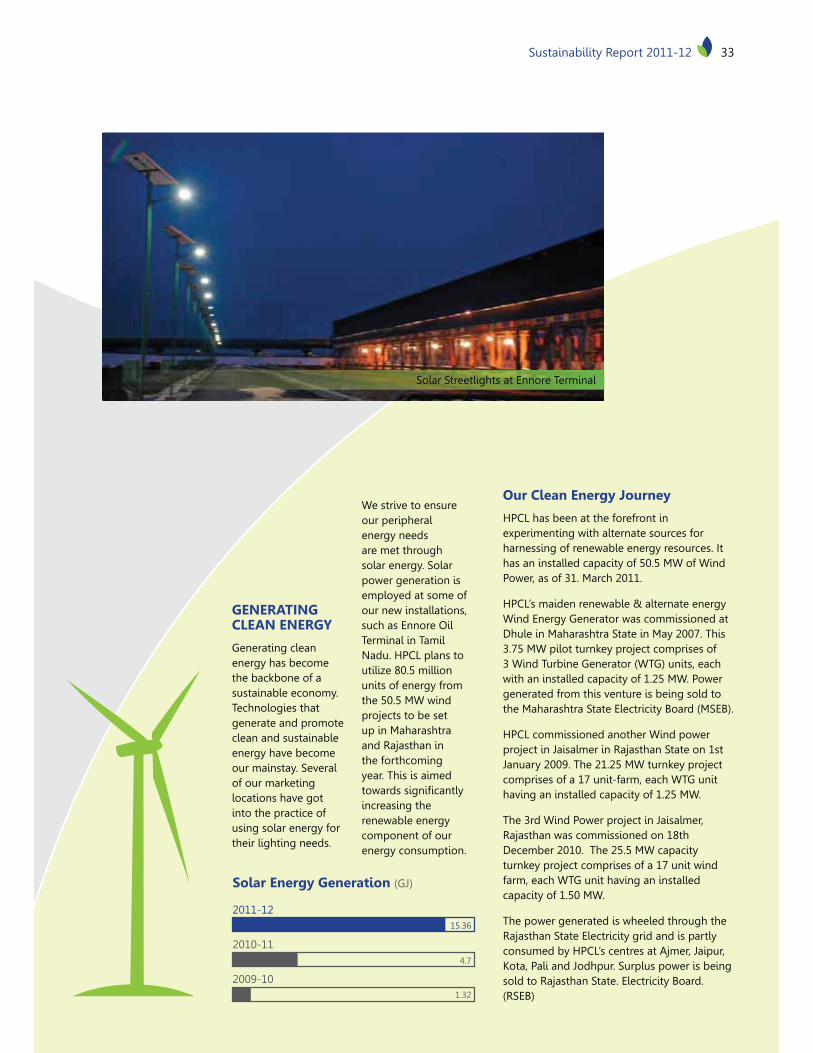
Generating clean energy has become the backbone of a sustainable economy. Technologies that generate and promote clean and sustainable energy have become our mainstay. Several of our marketing locations have got into the practice of using solar energy for their lighting needs.
We strive to ensure our peripheral energy needs are met through solar energy. Solar power generation is employed at some of our new installations, such as Ennore Oil Terminal in Tamil Nadu. HPCL plans to utilize 80.5 million units of energy from the 50.5 MW wind projects to be set up in Maharashtra and Rajasthan in the forthcoming year. This is aimed ����������������� �increasing the renewable energy component of our energy consumption.
Solar Streetlights at Ennore Terminal
Solar Energy Generation (GJ)
2009-101.32
2010-114.7
2011-1215.36
Our Clean Energy Journey
HPCL has been at the forefront in experimenting with alternate sources for harnessing of renewable energy resources. It has an installed capacity of 50.5 MW of Wind Power, as of 31. March 2011.
HPCL’s maiden renewable & alternate energy Wind Energy Generator was commissioned at Dhule in Maharashtra State in May 2007. This 3.75 MW pilot turnkey project comprises of 3 Wind Turbine Generator (WTG) units, each with an installed capacity of 1.25 MW. Power generated from this venture is being sold to the Maharashtra State Electricity Board (MSEB).
HPCL commissioned another Wind power project in Jaisalmer in Rajasthan State on 1st January 2009. The 21.25 MW turnkey project comprises of a 17 unit-farm, each WTG unit having an installed capacity of 1.25 MW.
The 3rd Wind Power project in Jaisalmer, Rajasthan was commissioned on 18th December 2010. The 25.5 MW capacity turnkey project comprises of a 17 unit wind farm, each WTG unit having an installed capacity of 1.50 MW.
The power generated is wheeled through the Rajasthan State Electricity grid and is partly consumed by HPCL’s centres at Ajmer, Jaipur, Kota, Pali and Jodhpur. Surplus power is being sold to Rajasthan State. Electricity Board. (RSEB)
34
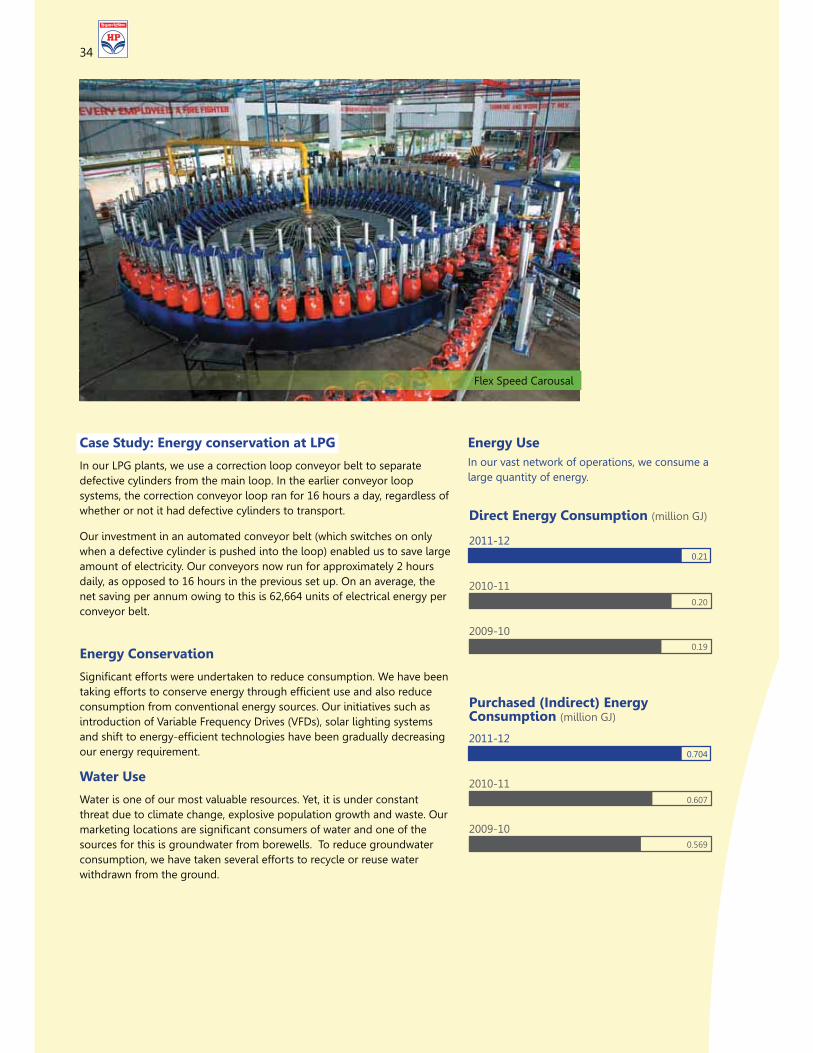
Case Study: Energy conservation at LPG
In our LPG plants, we use a correction loop conveyor belt to separate defective cylinders from the main loop. In the earlier conveyor loop systems, the correction conveyor loop ran for 16 hours a day, regardless of whether or not it had defective cylinders to transport.
Our investment in an automated conveyor belt (which switches on only when a defective cylinder is pushed into the loop) enabled us to save large amount of electricity. Our conveyors now run for approximately 2 hours daily, as opposed to 16 hours in the previous set up. On an average, the net saving per annum owing to this is 62,664 units of electrical energy per conveyor belt.
Energy Conservation
��������������������������������������������������+������!������������������������������������������������������ ��������consumption from conventional energy sources. Our initiatives such as introduction of Variable Frequency Drives (VFDs), solar lighting systems ����������������=�������������� ���������!��������� �����������our energy requirement.
Water Use
Water is one of our most valuable resources. Yet, it is under constant threat due to climate change, explosive population growth and waste. Our ��������� ������������������������������������������������sources for this is groundwater from borewells. To reduce groundwater consumption, we have taken several efforts to recycle or reuse water withdrawn from the ground.
Energy UseIn our vast network of operations, we consume a large quantity of energy.
Direct Energy Consumption (million GJ)
2009-100.19
2010-110.20
2011-120.21
Purchased (Indirect) Energy Consumption (million GJ)
2009-100.569
2010-110.607
2011-120.704
Flex Speed Carousal
34
35Sustainability Report 2011-12
We realise that a ������������������!�undertaken to stem global water crisis is reclamation and reuse of industrial and municipal water. Our efforts to recycle and reuse water have yielded positive results. Efforts of rainwater harvesting are taken up at our locations to help conserve water.
By the next year, we plan to implement rainwater harvesting in 22 of our POL installations. Reclaiming of water through sewage/��}�������������is also being implemented at some locations, making ���������������savings. Recycling of �����������}����and sewage treatment plants has been incorporated at the design stage at our new terminals at Ennore in Tamil Nadu and Vishakhapatnam in Andhra Pradesh.
Water Consumption (million KL)
2009-101.06
2010-111.11
2011-121.35
Water recycled or reused (million KL)
2009-100.30
2010-110.33
2011-120.55
Water Consumed Intensity (‘000 KL/’000 MT)
2009-100.04
2010-110.041
2011-120.046
Sources of water for Marketing Locations (2011-12)
47
39
14
21
6
Ground Water
% Of Water Source
Reservoir / Lakes
Municipal Water
Tanker Water
Other Sources
River/Sea/Canal Water
Case Study
Several of our locations practice ������������������+
LPG: Water is used for hydro-testing and cleaning the �� ������+\�� ������and reusing this water, LPG sites are able to �������������������savings.
O&D: Many of our O&D locations have created infrastructure for rainwater harvesting. This has resulted in �����������������the amount of water sourced from the municipality or the ground. Several O&D locations also reuse the water used for calibrating trucks.
35Sustainability Report 2011-12
36
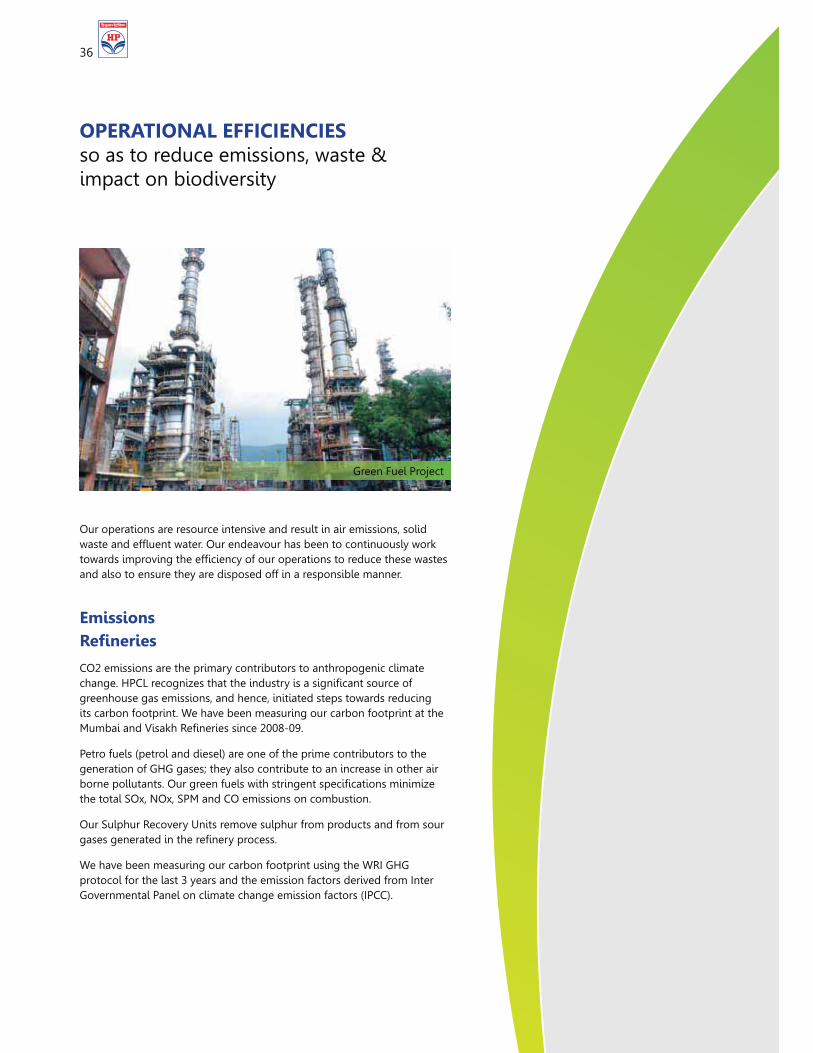
OPERATIONAL EFFICIENCIES so as to reduce emissions, waste & impact on biodiversity
Our operations are resource intensive and result in air emissions, solid ����������}���������+���������������!��������������� �������������������������������������������������������������������and also to ensure they are disposed off in a responsible manner.
Emissions�� ������
CO2 emissions are the primary contributors to anthropogenic climate ������+^�_����������������������������������������������greenhouse gas emissions, and hence, initiated steps towards reducing its carbon footprint. We have been measuring our carbon footprint at the %��!�����]�����'�������������Z??X=?�+
Petro fuels (petrol and diesel) are one of the prime contributors to the ������������"^"����������� ��������!�������������������������!������ ������+����������� �����������������������������������the total SOx, NOx, SPM and CO emissions on combustion.
Our Sulphur Recovery Units remove sulphur from products and from sour ���������������������������������+
We have been measuring our carbon footprint using the WRI GHG protocol for the last 3 years and the emission factors derived from Inter Governmental Panel on climate change emission factors (IPCC).
Green Fuel Project
37Sustainability Report 2011-12
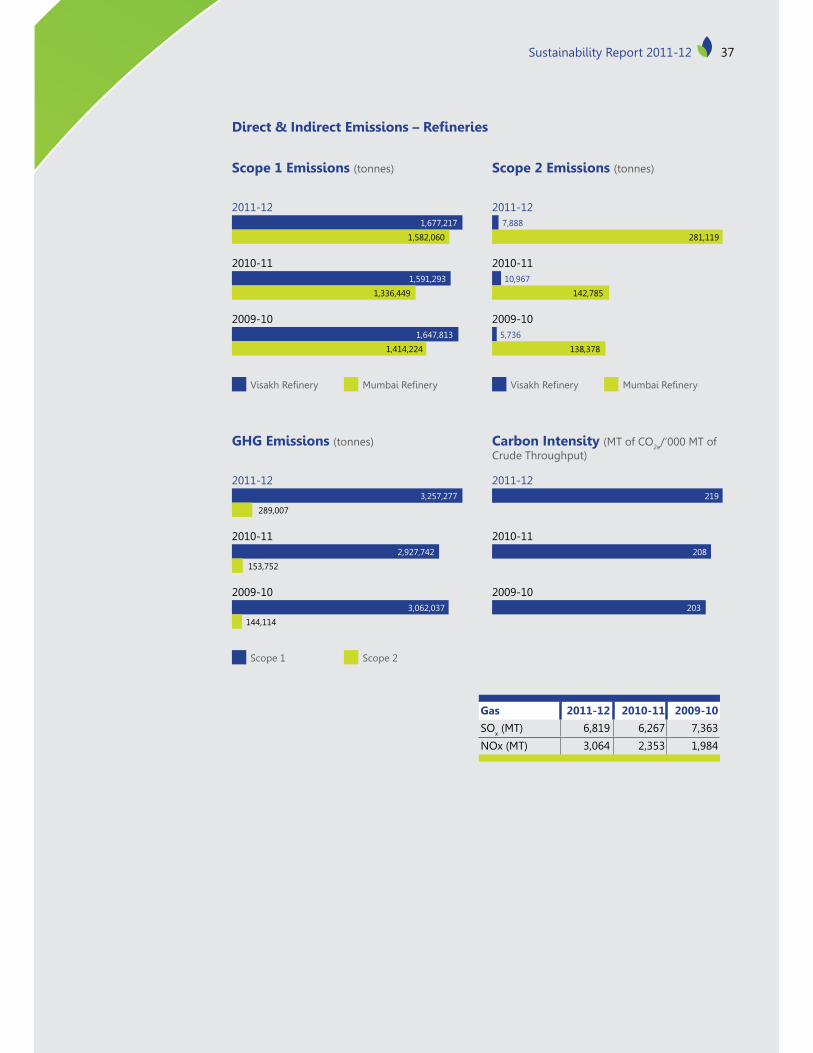
(�����\3������$��������]�� ������
Scope 1 Emissions (tonnes)
]�����'������ %��!��'������
2009-10
1,677,217
1,582,060
2010-111,591,293
1,336,449
2011-12
1,647,813
1,414,224
GHG Emissions (tonnes)
Scope 1 Scope 2
2009-10
3,257,277
289,007
2010-112,927,742
153,752
2011-12
3,062,037
144,114
Scope 2 Emissions (tonnes)
]�����'������ %��!��'������
2009-10
7,888
281,119
2010-1110,967
142,785
2011-12
5,736
138,378
Carbon Intensity (MT of CO2e/’000 MT of Crude Throughput)
2009-10
219
2010-11208
2011-12
203
Gas 2011-12 2010-11 2009-10
SOx (MT) 6,819 6,267 7,363
NOx (MT) 3,064 2,353 1,984
37Sustainability Report 2011-12
38
Marketing
Our individual marketing locations might not have the quantum of carbon ������������������������� ��������+^������������������!���� �������������������������������������������������������������day-to-day operations.
To combat the rising emissions, energy audit of at least 10 POL installations and a carbon foot-printing of at least 25 POL installations have been planned during 2012-13. SBUs are also planning to carry out carbon foot-printing and GHG management exercise during the year. The emission numbers presented are derived from fuel quantities consumed by our marketing locations.
Direct & Indirect Emissions - Marketing
SBU Scope 1 Emissions (Tonnes) Scope 2 Emissions (Tonnes) Total (Tonnes)
2011-12 2010-11 2009-10 2011-12 2010-11 2009-10 2011-12 2010-11 2009-10
O&D 5,337 4,538 4,831 26,509 22,263 22,175 31,845 26,801 27,005
Pipeline 397 392 354 118,247 101,756 94,819 118,644 102,148 95,172
Aviation 572 711 895 891 847 863 1,463 1,558 1,757
Direct Sales 2,572 2,534 2,149 2,722 2,686 1,873 5,294 5,220 4,022
LPG 6,644 6,373 5,849 25,523 22,651 21,256 32,168 29,024 27,140
Total 15,522 14,548 14,078 173,892 150,203 140,986 189,414 164,751 155,064
GHG Emissions (tonnes)
Scope 1 (tonnes CO2e) Scope 2 (tonnes CO2e)
2009-10
173,893
14,077
2010-11150.204
14,548
2011-12
140,985
15,521
Carbon Intensity (Tons CO2e/’000 MT of Sales Volumes)
2009-100.029
2010-110.03
2011-120.031
38
39Sustainability Report 2011-12
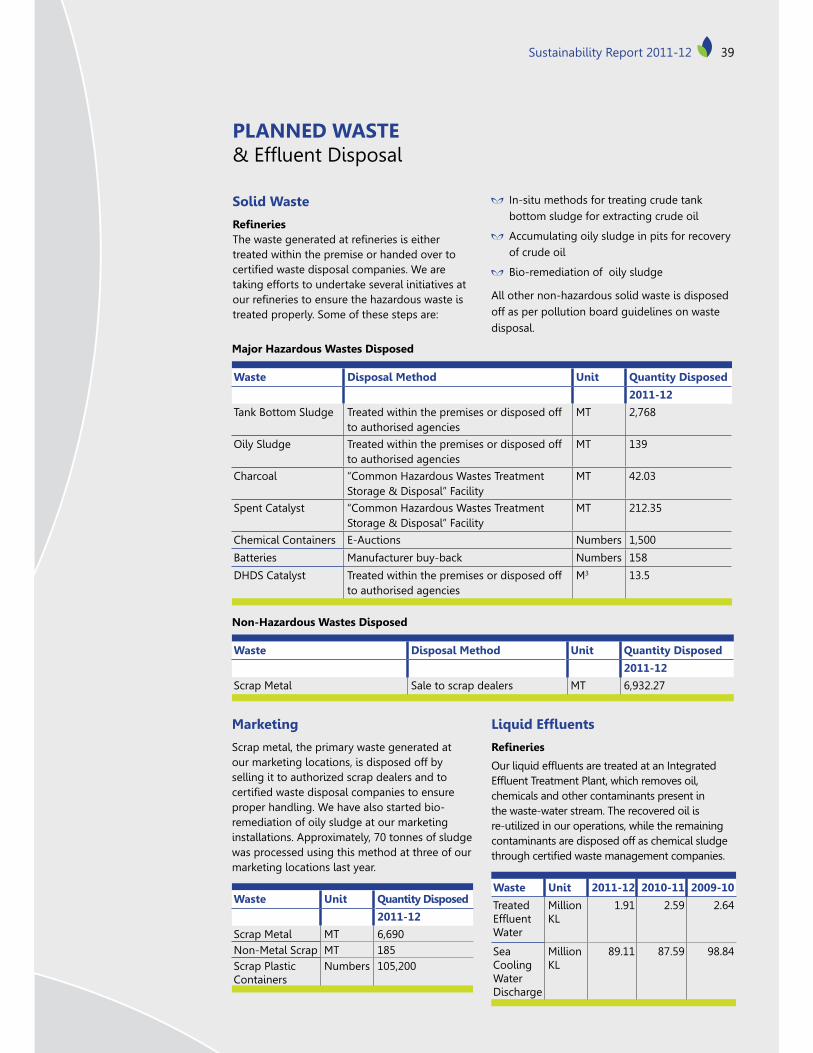
Solid Waste
�� ������>�����������������������������������treated within the premise or handed over to �������������������� ���������+�����taking efforts to undertake several initiatives at ���������������������������������������treated properly. Some of these steps are:
In-situ methods for treating crude tank bottom sludge for extracting crude oil
Accumulating oily sludge in pits for recovery of crude oil
Bio-remediation of oily sludge
All other non-hazardous solid waste is disposed off as per pollution board guidelines on waste disposal.
Major Hazardous Wastes Disposed
Waste Disposal Method Unit Quantity Disposed
2011-12
Tank Bottom Sludge Treated within the premises or disposed off to authorised agencies
MT 2,768
Oily Sludge Treated within the premises or disposed off to authorised agencies
MT 139
Charcoal “Common Hazardous Wastes Treatment Storage & Disposal” Facility
MT 42.03
Spent Catalyst “Common Hazardous Wastes Treatment Storage & Disposal” Facility
MT 212.35
Chemical Containers E-Auctions Numbers 1,500
Batteries Manufacturer buy-back Numbers 158
DHDS Catalyst Treated within the premises or disposed off to authorised agencies
M3 13.5
Non-Hazardous Wastes Disposed
Waste Disposal Method Unit Quantity Disposed
2011-12
Scrap Metal Sale to scrap dealers MT 6,932.27
PLANNED WASTE ���}����(������
Marketing
Scrap metal, the primary waste generated at our marketing locations, is disposed off by selling it to authorized scrap dealers and to �������������������� �����������������proper handling. We have also started bio-remediation of oily sludge at our marketing installations. Approximately, 70 tonnes of sludge was processed using this method at three of our marketing locations last year.
Waste Unit Quantity Disposed
2011-12
Scrap Metal MT 6,690Non-Metal Scrap MT 185Scrap Plastic Containers
Numbers 105,200
@����$�/�����
�� ������
��� �������}�������������������`�����������}����>�������� ������������������ �chemicals and other contaminants present in the waste-water stream. The recovered oil is re-utilized in our operations, while the remaining contaminants are disposed off as chemical sludge ���������������������������������������+
Waste Unit 2011-12 2010-11 2009-10
Treated ��}����Water
Million KL
1.91 2.59 2.64
Sea Cooling Water Discharge
Million KL
89.11 87.59 98.84
39Sustainability Report 2011-12
40
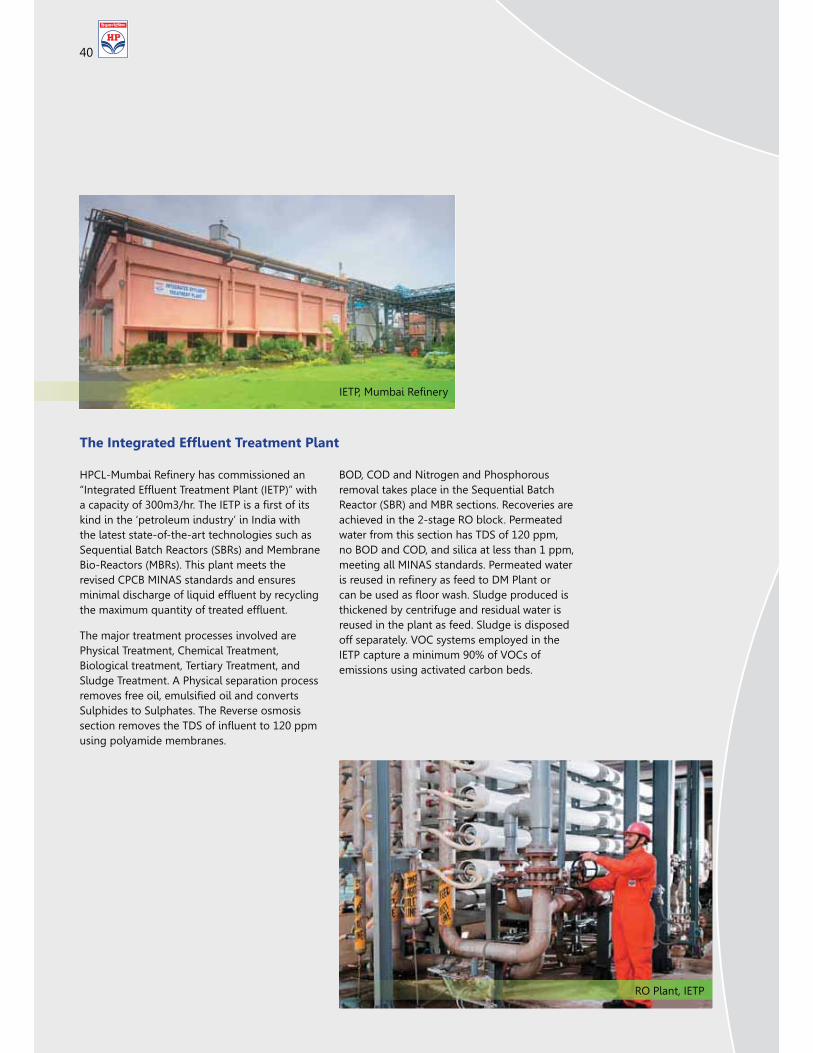
^�_=%��!��'������������������������`�����������}����>�������� ����`�>�����������������@??�@���+>��`�>������������kind in the ‘petroleum industry’ in India with the latest state-of-the-art technologies such as Sequential Batch Reactors (SBRs) and Membrane Bio-Reactors (MBRs). This plant meets the revised CPCB MINAS standards and ensures ������ ����������� �������}����!������ ��������~�����������������������}����+
The major treatment processes involved are Physical Treatment, Chemical Treatment, Biological treatment, Tertiary Treatment, and Sludge Treatment. A Physical separation process ������������� ���� ������� �����������Sulphides to Sulphates. The Reverse osmosis �����������������>(�����}������[Z?���using polyamide membranes.
BOD, COD and Nitrogen and Phosphorous removal takes place in the Sequential Batch Reactor (SBR) and MBR sections. Recoveries are achieved in the 2-stage RO block. Permeated water from this section has TDS of 120 ppm, no BOD and COD, and silica at less than 1 ppm, meeting all MINAS standards. Permeated water �������������������������(% ��������!�������}�������+� ��������������thickened by centrifuge and residual water is reused in the plant as feed. Sludge is disposed off separately. VOC systems employed in the IETP capture a minimum 90% of VOCs of emissions using activated carbon beds.
}��3��������$�/����}��������"����
`�>�%��!��'������
RO Plant, IETP
40
41Sustainability Report 2011-12
UNPLANNED WASTE ���}����(������
We conduct several stakeholder engagement exercises along with villagers residing along our pipelines. These are aimed towards building their awareness and knowledge levels on the operational safety of our pipelines running through their villages. This regular interaction with them has enabled us to solicit their help in keeping vigilance on the pipelines. This also helps us in remaining updated on any pilferage or accident at the pipeline location. In addition, we also have line walkers who walk the entire section of the pipeline checking for any sign of leakage.
Automated detection systems along the pipelines help us monitor the condition on a round-the-clock basis. For instance, in case if a leak is detected, specialized trucks are used to remove the spilled oil from the ground surface using high vacuum.
For oil products transported via road transport, several measures are taken to ensure safe and incident-free delivery. We are taking the necessary steps to ensure safe transportation of the product with zero spillage. Some of these are regular check-up and maintenance of vehicles to provide ��������������� ��=�����=�������������� ������������ ��+
We have also set up an Oil Spill Response facilities at coastal locations, along with port authorities and coast guard, to minimize and contain environmental damages resulting due to any oil spill-out at the sea.
Total Volume of Spills of >=159 litres (in KL)
SBU 2011-12 2010-11
Direct Sales 11.56 0.32O&D 2.96 Nil
Environmental ExpensesDuring 2011-12, HPCL has incurred a sum of INR 408 million towards environmental management, including expenses incurred towards ���������������� ����������� �������������������+>��������������������������������������=���� ������������������� ������regulations.
List of Awards - Environment
Date Award Organization
2012 “CII Environmental Best Practices Award 2012” for Vapour Recovery System commissioned at Loni Terminal
Confederation of Indian Industry (CII)
October 20th, 2011
Ajmer LPG Plant was declared the Silver Award winner for outstanding achievement in Environment Management for the 3rd year in a row
12th annual Greentech Environment Award in Petroleum Sector
41Sustainability Report 2011-12
42
Our Social PerformanceHuman Rights, Workforce Conditions, CSR and Product Responsibility
��� ��������� ��'������
43Sustainability Report 2011-12
HUMAN Rights
Upholding Human Dignity
Human resources form the core of our business. Without their hardwork, support and loyalty, our business operations may not sustain. At HPCL, we ensure all aspects related to human rights and dignities are upheld by the organization. At the heart of our human rights policy is our strong belief that everybody should be treated with equal dignity.
As a signatory to the UN Global Compact, we are committed to upholding all the facets of human dignity and human rights. Our business decision-making process ensures the basic aspects of human rights are upheld during the course of our business.
We have a provision for the incorporation of human rights clauses in our contractual agreements. These clauses require our business partnerships to be free of child
labour, respect labour work hours and support fair compensation, irrespective of gender. However, as of this writing, HPCL is yet to create a formal system of screening its suppliers and contractors to ensure they do not violate human rights clauses in the agreements.
Supporting and respecting the protection of internationally proclaimed human rights
HPCL supports and respects the fact that internationally-proclaimed human rights are never violated during the course of business operations. We pay particular emphasis to ensure safe working conditions for our employees and contractors and believe in investing in state-of-the-art technologies that improve safety. Regular maintenance of equipment is carried out to ensure safety of our workforce and the surrounding communities. We conduct regular training programs for our workforce to inculcate in them safe work practices.
Ensuring the organization is not complicit in human rights abuses
Our company has approved and put in place a policy for handling grievances of employees, shareholders, customers, dealers, vendors, local communities and the general public. The Conduct, Discipline and Appeal Rules for management and standing orders applicable for non-management employees are designed in a manner that they take care of human rights compliance across the organization.
Upholding the freedom of association and effective recognition of the right to collective bargaining
The company has formulated policies and practices that allow employees to exercise the freedom of collective bargaining on issues of common interest. All the issues raised by our Union (who represent non-management employees) are resolved through bi-lateral discussions and Long Term Settlements for salaries, wages, perks and settlements for career progression of employees.
During 2011-12, around 53% of our employees were covered by such collective bargaining agreements.
44
Supporting the elimination of all forms of compulsory and forced labour
HPCL does not support forced or compulsory labour of any form and well adheres to all labour laws of the country. Proper systems and procedures have been put in place to ensure �����������������������������!������are provided under various laws to the Contract Labor.
In addition, the ‘Public Grievance Redressal Mechanism’ necessitates designated Senior Management Members to be present at their ������!�������+??%���+??%��� working Fridays and attend to any complaints from the public.
During the year, no incidents of forced or compulsory labour have come to light.
Supporting effective abolition of child labor
Child labour is a practice where children are engaged in any kind of economic activity, part or full time, that deprives of their childhood. ^�_������!� ������������ �������� �labour abolition. To adhere to the Government
of India law on Child Labour (Prohibition and Regulation) Act 1986, HPCL requires all workers – permanent employees and contract workers – to be of minimum 18 years age.
>������������������� ������������������������of those working at our plant locations. Additionally, our security personnel have also been instructed that no person under the age of 18 should be allowed inside the plant for any employment-related purpose.
Eliminating discrimination at the time of employment
HPCL is an equal opportunity employer and its policies are aimed towards ensuring equal opportunities being provided to all citizens with no discrimination whatsoever. We follow Presidential Directives and Government of India instructions to ensure our recruitment policies accommodate Scheduled Castes/Scheduled Tribes/Other Backward Classes and the physically handicapped.
During 2011-12, there were no incidents of discrimination.
LABOR PRACTICES & Decent Work
Health Policy
To provide a structured program to look after and promote the health of vital “Human Resource”, essential for productivity and effectiveness of the Corporation.
Objectives of this policy are to:
Assess potential health risks arising from operations likely to affect its employees and contractors or the public. Institute measures to control and eliminate such risks and monitor the health of employees.
Establish and maintain the highest possible degree of physical and mental well-being of the employees.
Provide timely and adequate medical facilities for treatment of employees, in case of medical emergencies.
Comply with relevant statutory Rules & Regulations and devise appropriate standards in other cases, wherever required.
����! ������=��� ������������ ������and subsequent periodic medical check-ups to determine employees’ ability to carry out their functions without any risk to themselves and to others.
Bring about awareness amongst employees and community about the harmful effects of substance abuse through counselling and periodic programmes.
Ensure availability and use of personal protective equipment, while handling toxic and other hazardous chemicals.
Program reviews and evaluation to measure progress of compliance with the policy
45Sustainability Report 2011-12
Our Workforce
HPCL derives strength from its loyal, pragmatic and result-oriented workforce. Our employees – their experiences, ideas and perspectives ������������+���������������������� �������$����� � ����dynamic and safe worklife. We endeavour to achieve this objective ������������ =��������� ����!�������������������� ����training and development programs and a disciplined approach and focus towards enhancing workforce health and safety. Our agreements with employee unions cover safety and health procedures and practices.
Our Employee Strength
Our employee headcount numbers for the last three years are:
Workforce Type 2011-12 2010-11 2009-10
Management 5,132 4,940 4,779Non-Management 6,094 6,310 6,512Total 11,226 11,250 11,291Contract Workers 23,083 23,435 16,839
Employee Diversity 2011-12
Female 841Male 10,385Total 11,226< 30 years 1,60830-50 years 5,900> 50 years 3,718
Our employee turnover numbers are:
Employee Turnover by Gender
2011-12 2010-11 2009-10
Female Employees 16 15 9Male Employees 236 238 227Total 252 253 236
Employee Turnover by Age-Group
Turnover by Age-Group 2011-12 2010-11 2009-10
< 30 years 58 58 3430-50 years 57 51 84> 50 years 137 144 118
Most of our turnover is primarily due to employees reaching the retirement age.
HPCL is an equal opportunity employer and its policies are aimed towards ensuring equal opportunities being provided to all citizens with no discrimination whatsoever.
46
$����;��'��� �"����
HPCL believes in an employer-sponsored �� =������!������ ������������!����factors important to employees. It offers a �������!�������������� �����+������a comprehensive medical insurance program covering an array of medical expenses. Our educational refund plan offers support to employees in pursuing the course of their interest. Our study leave policy enables ‘time-off’ to pursue higher studies related to the employee’s profession.
Our responsibility towards employees doesn’t stop at compensation alone. It includes !������������ ������ �����������������������������������������������!������such as Provident Fund and Gratuity. This year we contributed INR 15831 million towards ��� ������������!������+
HPCL does not have any part-time employees.
Our employees are also fairly compensated. All employees of the same grade are paid similar salaries, irrespective of their gender, race and caste.
Ensuring Employee Safety
HPCL believes in ensuring safety and security of its employees to ensure a smooth functioning. Health and safety form an integral part of our work environment. Our operations are designed to handle hazardous substances and their complexity warrants that we should pay special attention to safety aspects. Our Health & Safety Policy seeks to bring in awareness among the employees and local communities and create a healthy surrounding and safe working conditions.
��������� ��������������������������������������������������practices. Periodic reviews and assessments are also conducted by the Corporate HSE team to ensure all requirements are being at the workplace. All our employees are represented in formal joint management-worker safety committees.
��� ��������� �������� ������(�������%��������� ��+����location conducts mock drills with external stakeholders, such as the local �� ��������������������������������������������������� �����+Additionally, we also have in place a minimum 3-week notice period to ��� �������������������������������������������������������+>���enables our locations to prepare in advance and prevent any accidents occurring due to the changes.
Our locations also have ����� ��(�������Management Plan.
Fire Safety Drill
46
47Sustainability Report 2011-12
Lost Days Per Million Man �����#�� ������
Permanent Employees Contract Workers
2009-1019.52
206.6
2010-111,030
28.6
2011-123.76
404
Injury Rate (including fatalities) per ���������������#�� ������
Permanent Employees Contract Workers
2009-100.17
0.32
2010-110.34
0.14
2011-120.17
0.13
Injury Rate (including fatalities) per million man hours - Marketing
Permanent Employees Contract Workers
2009-10
2010-110.16
0.43
2011-120.32
0.24
0.17
0.13
2 We follow Indian legislative practices for measuring and reporting the incidents.
Lost Days Per Million Man Hours - Marketing
Permanent Employees Contract Workers
2009-10
2010-11
2011-12
1284
789
0.64
0.64
17.47
1458
��������������������������2
Workforce Safety Incidents in �� ������
2011-12 2010-11 2009-10
Permanent Employees
Reportable Accidents 1 1 1Fatalities 0 1 0Occupational Diseases 0 0 0
Contractor Workers
Reportable Accidents 3 3 5
Fatalities 1 0 1
Occupational Diseases 0 0 0
Safety incidents in marketing locations
Workforce Safety Incidents in �� ������
2011-12 2010-11 2009-10
Permanent Employees
Reportable Accidents 4 2 0Fatalities 0 0 2Occupational Diseases 0 0 0
Contractor Workers
Reportable Accidents 1 4 4
Fatalities 6 5 0
Occupational Diseases 0 0 0
47Sustainability Report 2011-12
48
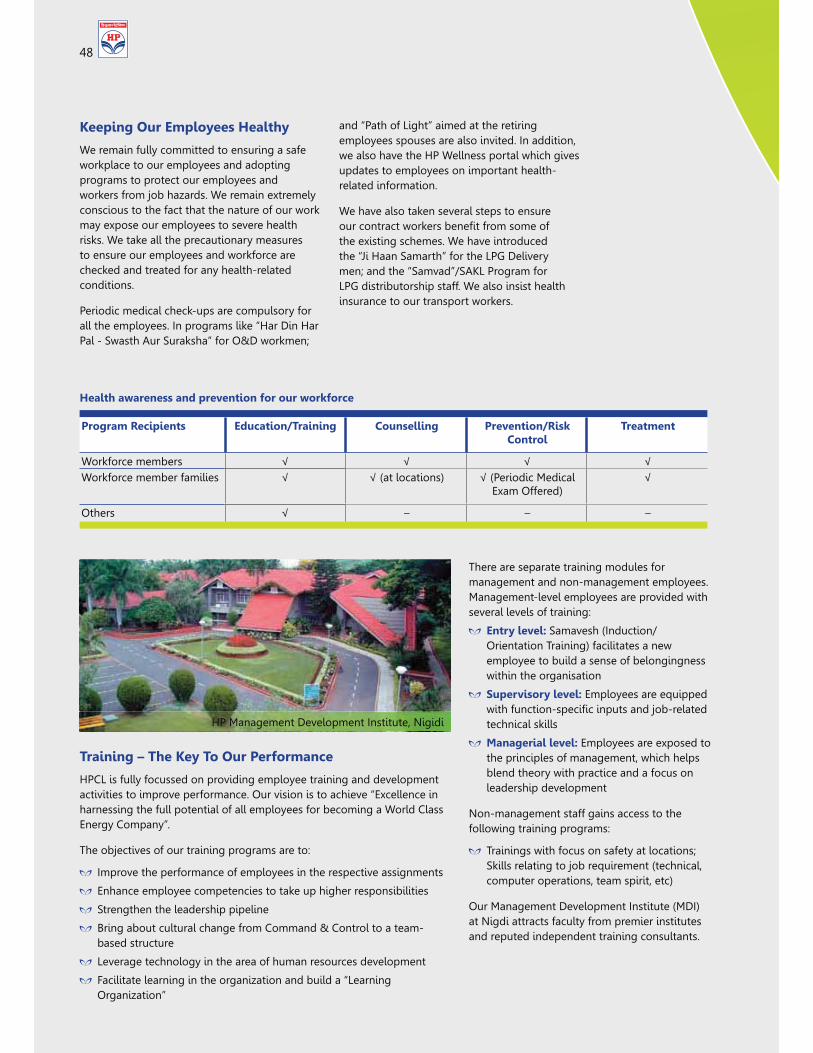
Keeping Our Employees Healthy
We remain fully committed to ensuring a safe workplace to our employees and adopting programs to protect our employees and workers from job hazards. We remain extremely conscious to the fact that the nature of our work may expose our employees to severe health risks. We take all the precautionary measures to ensure our employees and workforce are checked and treated for any health-related conditions.
Periodic medical check-ups are compulsory for all the employees. In programs like “Har Din Har � =�����������������������(��������
and “Path of Light” aimed at the retiring employees spouses are also invited. In addition, we also have the HP Wellness portal which gives updates to employees on important health-related information.
We have also taken several steps to ensure ������������������!���������������the existing schemes. We have introduced the “Ji Haan Samarth” for the LPG Delivery ����������������������_���������LPG distributorship staff. We also insist health insurance to our transport workers.
Training – The Key To Our Performance
HPCL is fully focussed on providing employee training and development activities to improve performance. Our vision is to achieve “Excellence in harnessing the full potential of all employees for becoming a World Class Energy Company”.
The objectives of our training programs are to:
Improve the performance of employees in the respective assignments
Enhance employee competencies to take up higher responsibilities
Strengthen the leadership pipeline
Bring about cultural change from Command & Control to a team-based structure
Leverage technology in the area of human resources development
Facilitate learning in the organization and build a “Learning Organization”
There are separate training modules for management and non-management employees. Management-level employees are provided with several levels of training:
Entry level: Samavesh (Induction/ Orientation Training) facilitates a new employee to build a sense of belongingness within the organisation
Supervisory level: Employees are equipped ������������=����������������$�!=�� ����technical skills
Managerial level: Employees are exposed to the principles of management, which helps blend theory with practice and a focus on leadership development
Non-management staff gains access to the following training programs:
>��������������������������� ���������Skills relating to job requirement (technical, computer operations, team spirit, etc)
Our Management Development Institute (MDI) at Nigdi attracts faculty from premier institutes and reputed independent training consultants.
Health awareness and prevention for our workforce
Program Recipients Education/Training Counselling Prevention/Risk Control
Treatment
Workforce members � � � �Workforce member families � ���� ��������� ���������%�����
Exam Offered)�
Others � – – –
HP Management Development Institute, Nigidi
48
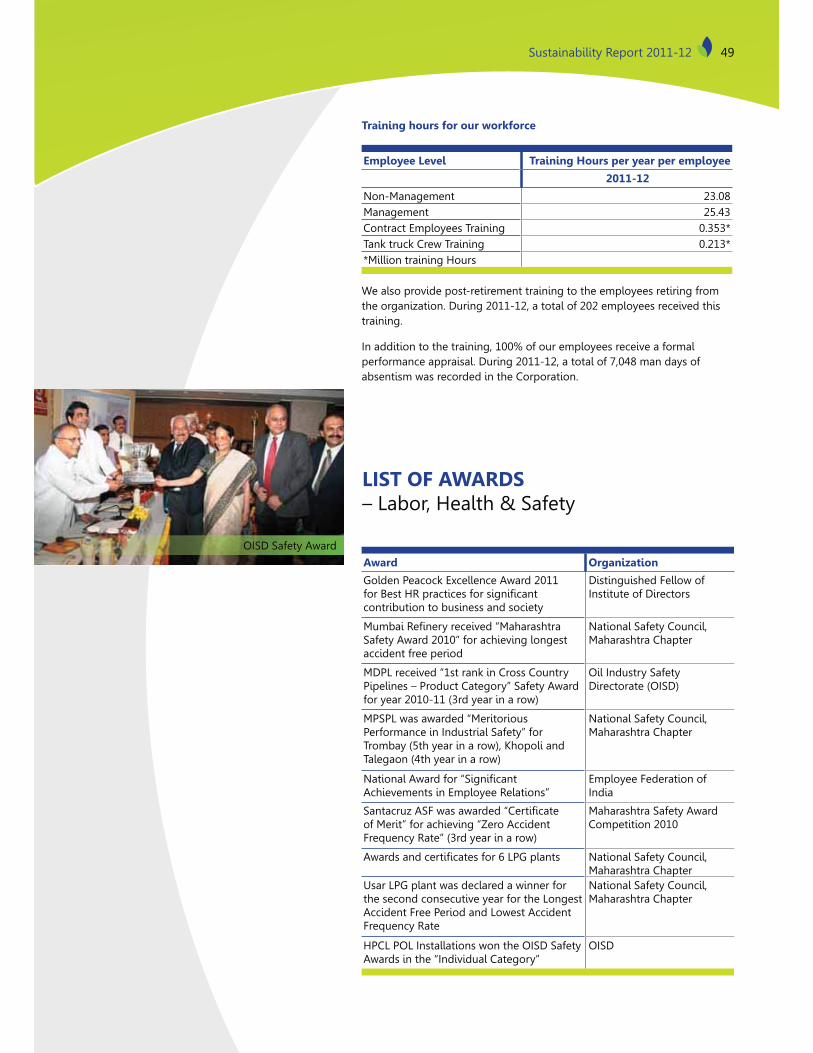
49Sustainability Report 2011-12
OISD Safety Award
Training hours for our workforce
Employee Level Training Hours per year per employee
2011-12
Non-Management 23.08Management 25.43Contract Employees Training 0.353*Tank truck Crew Training 0.213**Million training Hours
We also provide post-retirement training to the employees retiring from the organization. During 2011-12, a total of 202 employees received this training.
In addition to the training, 100% of our employees receive a formal performance appraisal. During 2011-12, a total of 7,048 man days of absentism was recorded in the Corporation.
Award Organization
Golden Peacock Excellence Award 2011 ���\���^'����������������������contribution to business and society
Distinguished Fellow of Institute of Directors
%��!��'���������������%����������Safety Award 2010” for achieving longest accident free period
National Safety Council, Maharashtra Chapter
MDPL received “1st rank in Cross Country Pipelines – Product Category” Safety Award for year 2010-11 (3rd year in a row)
Oil Industry Safety Directorate (OISD)
MPSPL was awarded “Meritorious Performance in Industrial Safety” for Trombay (5th year in a row), Khopoli and Talegaon (4th year in a row)
National Safety Council, Maharashtra Chapter
<������ �������������������Achievements in Employee Relations”
Employee Federation of India
�����������#���������������������of Merit” for achieving “Zero Accident Frequency Rate” (3rd year in a row)
Maharashtra Safety Award Competition 2010
������������������������_"� ���� National Safety Council, Maharashtra Chapter
Usar LPG plant was declared a winner for the second consecutive year for the Longest Accident Free Period and Lowest Accident Frequency Rate
National Safety Council, Maharashtra Chapter
HPCL POL Installations won the OISD Safety Awards in the “Individual Category”
OISD
LIST OF AWARDS – Labor, Health & Safety
49Sustainability Report 2011-12
50
SOCIETY
CSR Purpose Statement
Our purpose statement is:
Serving the community is the purpose of our business
����������������! �!������������������������ �������������� ��������� �������������
Using core competence, expertise and technology of our business, to reach the common people, especially the underprivileged is our aim
Developing capacity in the community is our strategy
Enhancing human excellence and improving quality of life is our endeavour
OUR Social Impact
AT HPCL, we draw strength from our vision and mission to make a positive impact on the communities we operate in. We take our responsibilities towards the society seriously and convert them into our CSR policy and Purpose Statements. They can also be found in the manner in which we do business – whether it is instituting systems to address corruption or ensuring we are pro-active about meeting requirements laid down by the Government.
Managing our Impact on Communities
We endeavour to work with our customers, industry partners, employees and shareholders. We also aim to innovate and create sustainable solutions to meet the challenges ahead of us. The Organisation undertakes risk assessment studies each time it sets up new operations or production facilities at any location. The said facility / operation gets commissioned only when the recommendations of the study are implemented.
Besides assessing the risks of operations at the time of entry, the company also conducts periodic Disaster Management Programs at relevant sites. These are aimed towards ensuring that the impact of any accident within the plants on the surrounding communities is minimized. Risks from our operations are monitored continuously based on the OISD safety guidelines of the Oil & Gas industry.
The CSR function at HPCL
HPCL endeavours to have a positive impact on communities through its Corporate Social Responsibility (CSR) program. In order to help the company in implementing these projects, we have created a CSR policy designed to aid in decision-making on community investments at the Board level. The policy is also aimed to select projects based on need assessment, implement partnerships with specialized NGOs, create monitoring mechanism and conduct impact assessments for all our projects.
�����'������ �������� ����������������������������$����������+We fund projects in the area of childcare, healthcare, education and livelihood. All the organizations supported by CSR team have a:
Strategic approach to an issue
Input-output-outcome balance
Ownership of the problem
Result-focused drive
Advanced planning
Evaluation of performance
Operationalizing CSR
�����'�����������!�!���������������������������� ������������and (ii) permanent projects. Welfare schemes are driven by the immediate needs of the local communities in the areas we operate. In this case, programs are usually handled by site-level employees and serve as a method of employee engagement for the company. The permanent ���$���������������!����<"����$����������������������� �expertise, with HPCL’s Senior Managers as the project heads.
The implementation process for all these projects is:
Need Assessment/ Base Line Study is taken up before project start
MOUs are signed with the Implementation Partners, including deliverables
Annual plan is drawn up with milestones
%���������������������������������� ������������� �������
Periodic reviews are done at the Director’s level
50
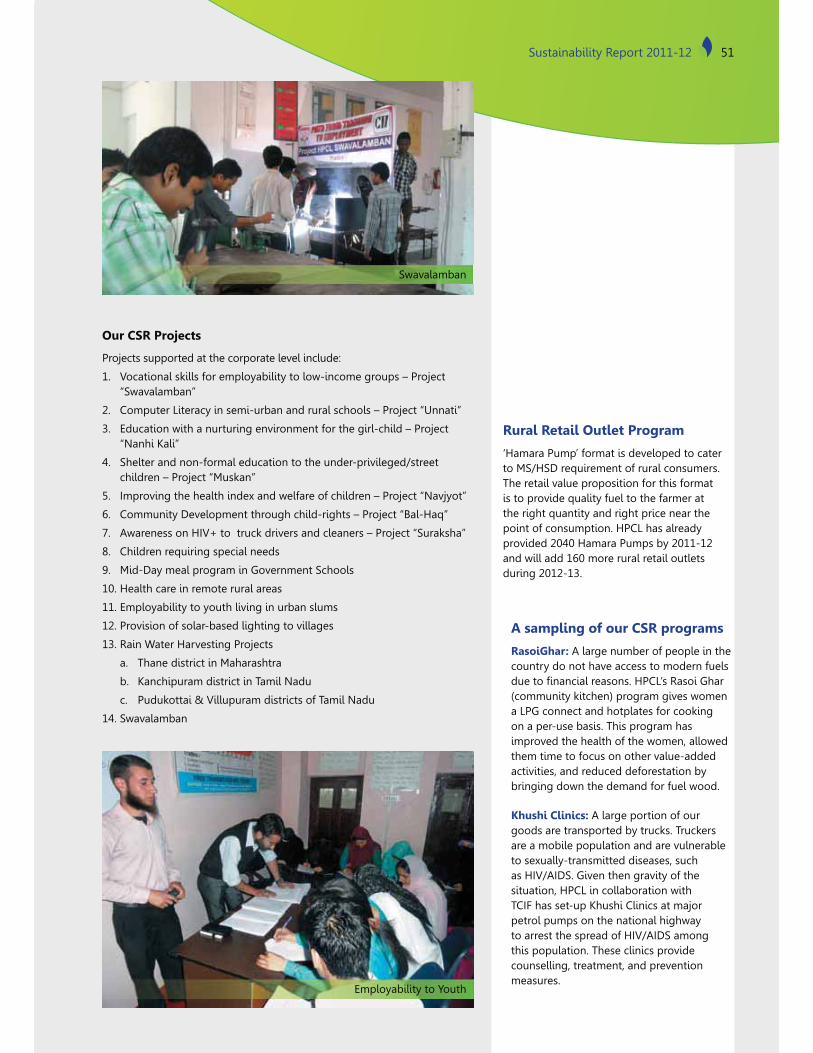
51Sustainability Report 2011-12
Our CSR Projects
Projects supported at the corporate level include:
1. Vocational skills for employability to low-income groups – Project “Swavalamban”
2. Computer Literacy in semi-urban and rural schools – Project “Unnati”
3. Education with a nurturing environment for the girl-child – Project “Nanhi Kali”
4. Shelter and non-formal education to the under-privileged/street children – Project “Muskan”
5. Improving the health index and welfare of children – Project “Navjyot”
6. Community Development through child-rights – Project “Bal-Haq”
7. Awareness on HIV+ to truck drivers and cleaners – Project “Suraksha”
8. Children requiring special needs
9. Mid-Day meal program in Government Schools
10. Health care in remote rural areas
11. Employability to youth living in urban slums
12. Provision of solar-based lighting to villages
13. Rain Water Harvesting Projects
a. Thane district in Maharashtra
b. Kanchipuram district in Tamil Nadu
c. Pudukottai & Villupuram districts of Tamil Nadu
14. Swavalamban
Rural Retail Outlet Program
‘Hamara Pump’ format is developed to cater to MS/HSD requirement of rural consumers. The retail value proposition for this format is to provide quality fuel to the farmer at the right quantity and right price near the point of consumption. HPCL has already provided 2040 Hamara Pumps by 2011-12 and will add 160 more rural retail outlets during 2012-13.
A sampling of our CSR programs
RasoiGhar: A large number of people in the country do not have access to modern fuels ������������ �������+^�_��'����"���(community kitchen) program gives women a LPG connect and hotplates for cooking on a per-use basis. This program has improved the health of the women, allowed them time to focus on other value-added activities, and reduced deforestation by bringing down the demand for fuel wood.
Khushi Clinics: A large portion of our goods are transported by trucks. Truckers are a mobile population and are vulnerable to sexually-transmitted diseases, such as HIV/AIDS. Given then gravity of the situation, HPCL in collaboration with TCIF has set-up Khushi Clinics at major petrol pumps on the national highway to arrest the spread of HIV/AIDS among this population. These clinics provide counselling, treatment, and prevention measures.
Swavalamban
Employability to Youth
51Sustainability Report 2011-12
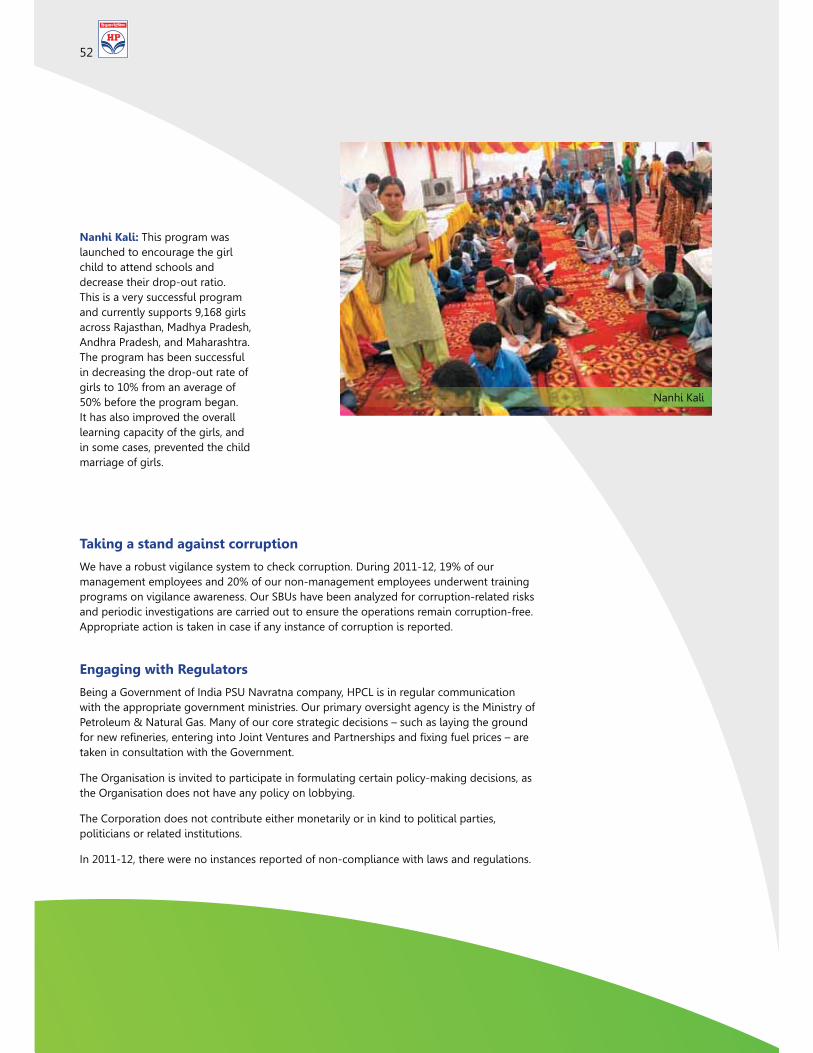
52
Taking a stand against corruption
We have a robust vigilance system to check corruption. During 2011-12, 19% of our management employees and 20% of our non-management employees underwent training programs on vigilance awareness. Our SBUs have been analyzed for corruption-related risks and periodic investigations are carried out to ensure the operations remain corruption-free. Appropriate action is taken in case if any instance of corruption is reported.
Engaging with Regulators
Being a Government of India PSU Navratna company, HPCL is in regular communication with the appropriate government ministries. Our primary oversight agency is the Ministry of Petroleum & Natural Gas. Many of our core strategic decisions – such as laying the ground ���������������������������������]�������������������������~������ ����������taken in consultation with the Government.
The Organisation is invited to participate in formulating certain policy-making decisions, as the Organisation does not have any policy on lobbying.
The Corporation does not contribute either monetarily or in kind to political parties, politicians or related institutions.
In 2011-12, there were no instances reported of non-compliance with laws and regulations.
Nanhi Kali: This program was launched to encourage the girl child to attend schools and decrease their drop-out ratio. This is a very successful program and currently supports 9,168 girls across Rajasthan, Madhya Pradesh, Andhra Pradesh, and Maharashtra. The program has been successful in decreasing the drop-out rate of girls to 10% from an average of 50% before the program began. It has also improved the overall learning capacity of the girls, and in some cases, prevented the child marriage of girls.
Nanhi Kali
52
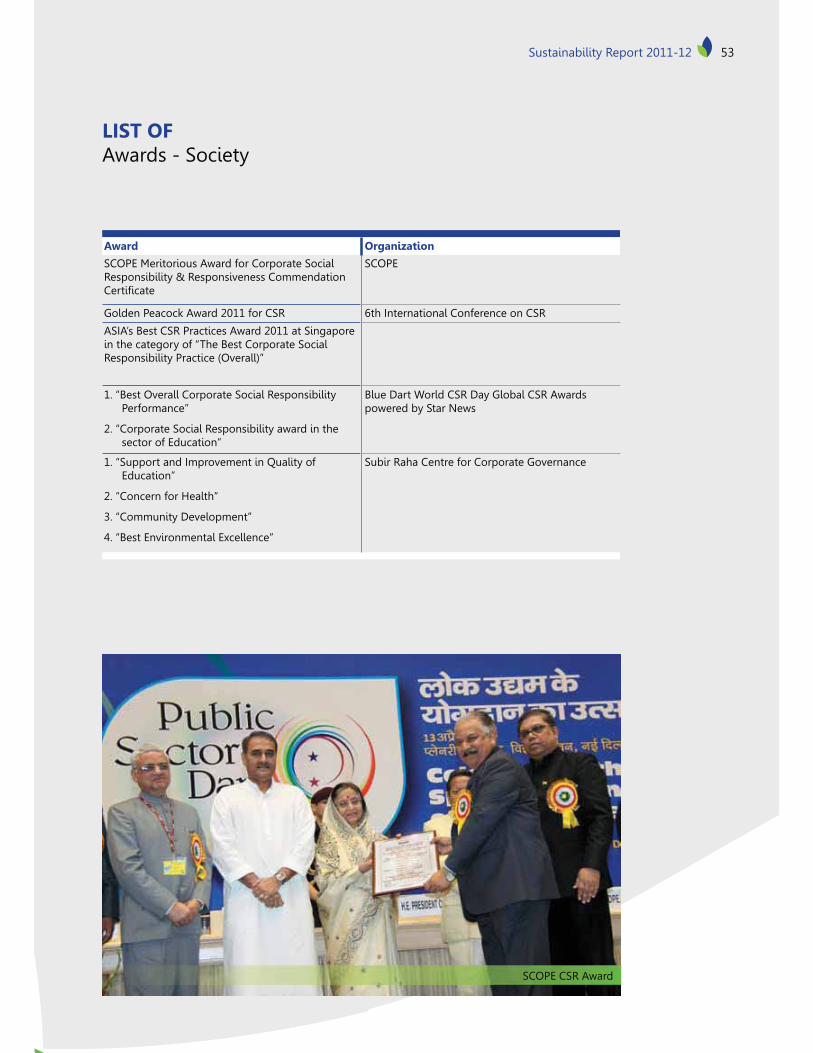
53Sustainability Report 2011-12
LIST OF Awards - Society
Award Organization
SCOPE Meritorious Award for Corporate Social Responsibility & Responsiveness Commendation ����������
SCOPE
Golden Peacock Award 2011 for CSR 6th International Conference on CSR
ASIA’s Best CSR Practices Award 2011 at Singapore in the category of “The Best Corporate Social Responsibility Practice (Overall)”
1. “Best Overall Corporate Social Responsibility Performance”
2. “Corporate Social Responsibility award in the sector of Education”
Blue Dart World CSR Day Global CSR Awards powered by Star News
1. “Support and Improvement in Quality of Education”
2. “Concern for Health”
3. “Community Development”
4. “Best Environmental Excellence”
Subir Raha Centre for Corporate Governance
SCOPE CSR Award
53Sustainability Report 2011-12
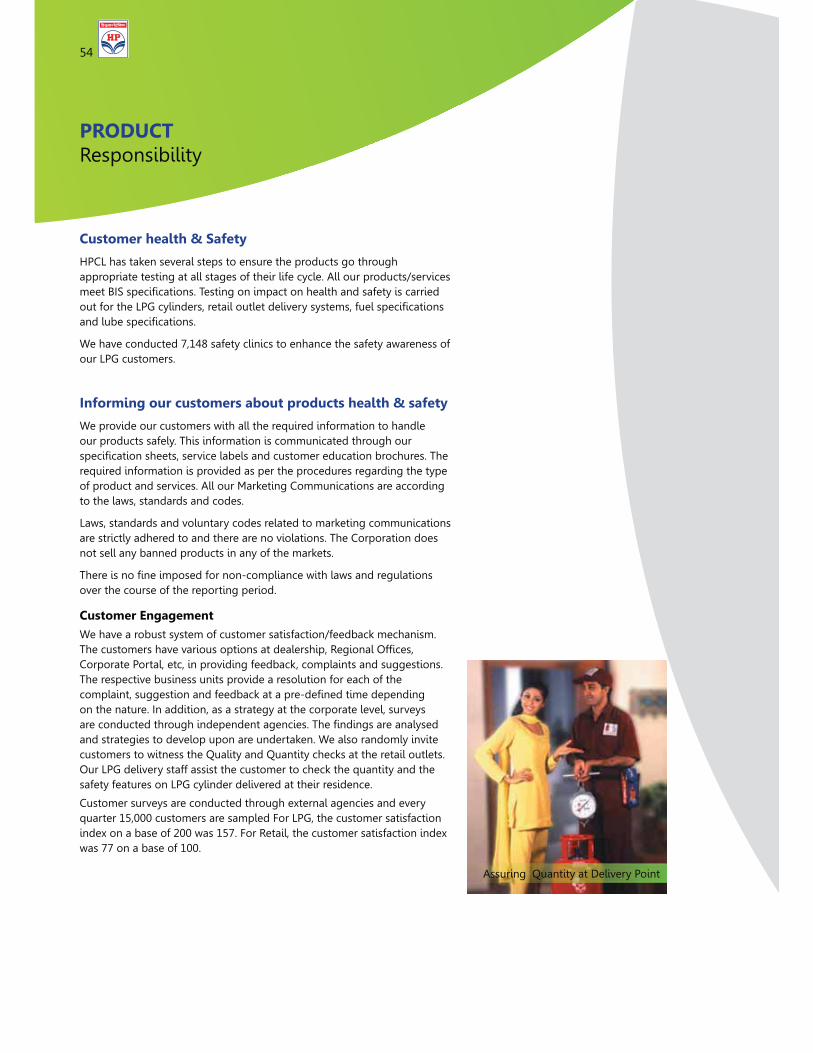
54
PRODUCT Responsibility
Customer health & Safety
HPCL has taken several steps to ensure the products go through appropriate testing at all stages of their life cycle. All our products/services ����\`��������������+>������������������� �����������������������������_"�� ������������ ��� ���� ���������������� ���������������� �!��������������+
We have conducted 7,148 safety clinics to enhance the safety awareness of our LPG customers.
Informing our customers about products health & safety
We provide our customers with all the required information to handle our products safely. This information is communicated through our �������������������������� �!� ���������������������!��������+>��required information is provided as per the procedures regarding the type of product and services. All our Marketing Communications are according to the laws, standards and codes.
Laws, standards and voluntary codes related to marketing communications are strictly adhered to and there are no violations. The Corporation does not sell any banned products in any of the markets.
>������������������������=���� ��������� ���������� ������over the course of the reporting period.
Customer Engagement
We have a robust system of customer satisfaction/feedback mechanism. >���������������������������������� �������'������ �������Corporate Portal, etc, in providing feedback, complaints and suggestions. The respective business units provide a resolution for each of the ���� ����������������������!���������=�������������������on the nature. In addition, as a strategy at the corporate level, surveys ��������������������������������������+>��������������� ����and strategies to develop upon are undertaken. We also randomly invite customers to witness the Quality and Quantity checks at the retail outlets. Our LPG delivery staff assist the customer to check the quantity and the safety features on LPG cylinder delivered at their residence.
Customer surveys are conducted through external agencies and every quarter 15,000 customers are sampled For LPG, the customer satisfaction index on a base of 200 was 157. For Retail, the customer satisfaction index was 77 on a base of 100.
Assuring Quantity at Delivery Point
54
55Sustainability Report 2011-12
LIST OF AWARDS – Brand & Customer Satisfaction
Award Organization
“Best Retail Marketing Campaign” – HP Bhar-Bhar ke Jeeto!
“Best Retail Customer Loyalty Program”
“Retailer of the Year” – HPCL Forecourt Retailing
“Retail Leadership Award”
Asia Retail Congress
“Best Loyalty Program”
“Brand Excellence in Service/Hospitality”
“Best Marketing Campaign of the Year”
“Brand Leadership Award”
“Marketing Professional of the Year”
CMO Asia Awards, Singapore
Awarded World Star 2011 for 1 litre size Metalized Rolla-pack introduced for LG
World Star
IFCA Star Award 2011 for introducing IML (In-mould Labelling) technology in Lube Industry for HP Milcy Turbo ����������������^>_�^���>�������_�!� ������� ��������the Lube Oil Industry
IFCA
Brand Leadership Award 2011 in Service/Hospitality Industry World Brand Congress
“Forecourt Retailer of the Year” (6th year in a row) Star Retailer Awards
Reader’s Digest Trusted Brand Gold Award (6th year in a row) Reader’s Digest
“Best Customer Service Professional of the Year” – ED Retail National Quality Excellence Awards
HP Gas selected as “Superbrand – India” Superbrands
MDPL received the ‘Golden Peacock Innovation Management Award’
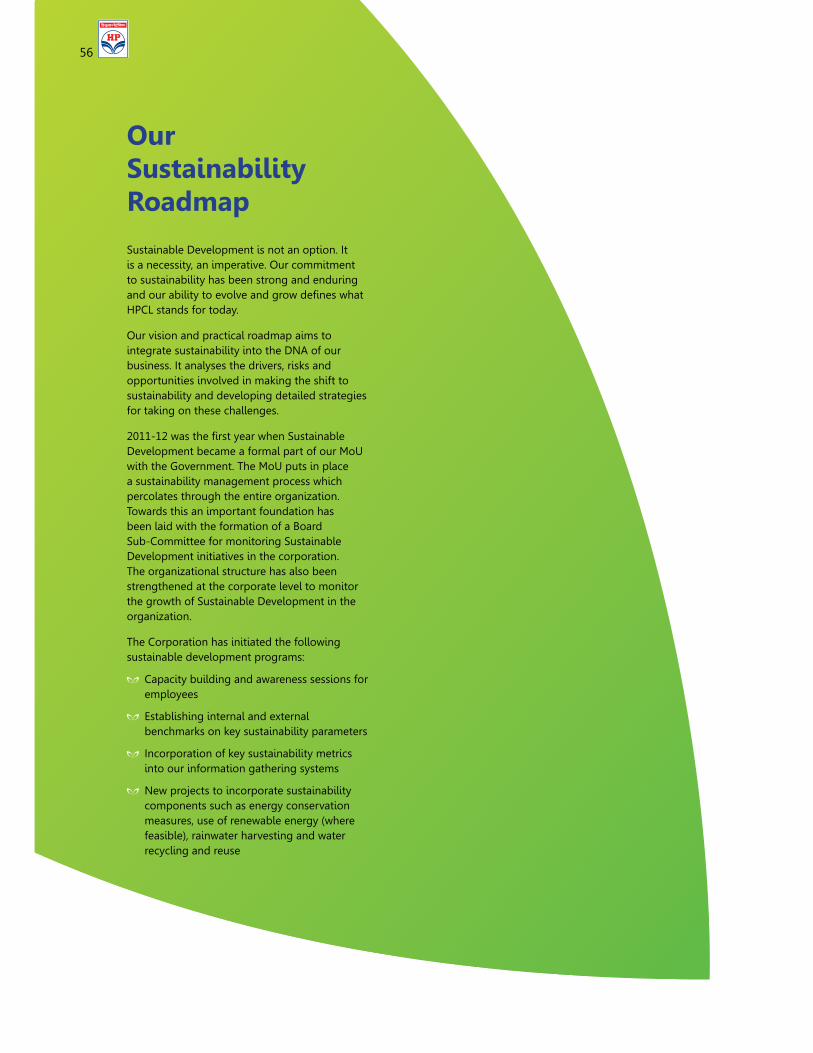
56
Our Sustainability Roadmap
Sustainable Development is not an option. It is a necessity, an imperative. Our commitment to sustainability has been strong and enduring �������!� �������� �������������������HPCL stands for today.
Our vision and practical roadmap aims to integrate sustainability into the DNA of our business. It analyses the drivers, risks and opportunities involved in making the shift to sustainability and developing detailed strategies for taking on these challenges.
Z?[[=[Z��������������������������! �Development became a formal part of our MoU with the Government. The MoU puts in place a sustainability management process which percolates through the entire organization. Towards this an important foundation has been laid with the formation of a Board Sub-Committee for monitoring Sustainable Development initiatives in the corporation. The organizational structure has also been strengthened at the corporate level to monitor the growth of Sustainable Development in the organization.
The Corporation has initiated the following sustainable development programs:
Capacity building and awareness sessions for employees
Establishing internal and external benchmarks on key sustainability parameters
Incorporation of key sustainability metrics into our information gathering systems
New projects to incorporate sustainability components such as energy conservation measures, use of renewable energy (where feasible), rainwater harvesting and water recycling and reuse
56
57Sustainability Report 2011-12
5858
Sustainability Report 2011-12 59
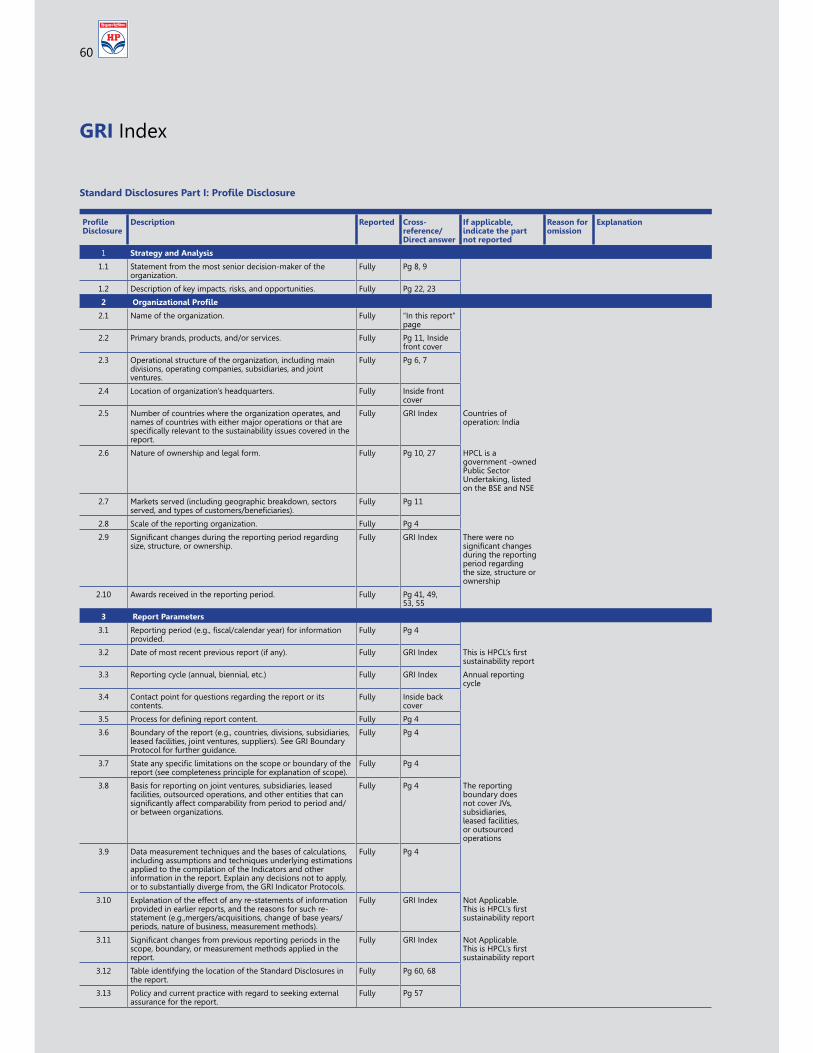
60
GRI Index
60
"�� ��Disclosure
Description Reported Cross-reference/Direct answer
If applicable, indicate the part not reported
Reason for omission
Explanation
1 Strategy and Analysis
1.1 Statement from the most senior decision-maker of the organization.
Fully Pg 8, 9
1.2 Description of key impacts, risks, and opportunities. Fully Pg 22, 23
2 ��������������"�� ��
2.1 Name of the organization. Fully “In this report” page
2.2 Primary brands, products, and/or services. Fully Pg 11, Inside front cover
2.3 Operational structure of the organization, including main divisions, operating companies, subsidiaries, and joint ventures.
Fully Pg 6, 7
2.4 Location of organization’s headquarters. Fully Inside front cover
2.5 Number of countries where the organization operates, and names of countries with either major operations or that are �������� ��� ������������������!� ���������������������report.
Fully GRI Index Countries of operation: India
2.6 Nature of ownership and legal form. Fully Pg 10, 27 HPCL is a government -owned Public Sector Undertaking, listed on the BSE and NSE
2.7 Markets served (including geographic breakdown, sectors ���������������������������!������������+
Fully Pg 11
2.8 Scale of the reporting organization. Fully Pg 4
2.9 ��������������������������������������������������size, structure, or ownership.
Fully GRI Index There were no �����������������during the reporting period regarding the size, structure or ownership
2.10 Awards received in the reporting period. Fully Pg 41, 49, 53, 55
3 Report Parameters
3.1 '����������������+�+����� ��� ������������������������provided.
Fully Pg 4
3.2 Date of most recent previous report (if any). Fully GRI Index >�����^�_������sustainability report
3.3 Reporting cycle (annual, biennial, etc.) Fully GRI Index Annual reporting cycle
3.4 Contact point for questions regarding the report or its contents.
Fully Inside back cover
3.5 �����������������������������+ Fully Pg 4
3.6 Boundary of the report (e.g., countries, divisions, subsidiaries, leased facilities, joint ventures, suppliers). See GRI Boundary Protocol for further guidance.
Fully Pg 4
3.7 ��������������� ����������������������!������������report (see completeness principle for explanation of scope).
Fully Pg 4
3.8 Basis for reporting on joint ventures, subsidiaries, leased facilities, outsourced operations, and other entities that can ���������� ��������������!� �������������������������or between organizations.
Fully Pg 4 The reporting boundary does not cover JVs, subsidiaries, leased facilities, or outsourced operations
3.9 Data measurement techniques and the bases of calculations, including assumptions and techniques underlying estimations applied to the compilation of the Indicators and other information in the report. Explain any decisions not to apply, or to substantially diverge from, the GRI Indicator Protocols.
Fully Pg 4
3.10 Explanation of the effect of any re-statements of information provided in earlier reports, and the reasons for such re-statement (e.g.,mergers/acquisitions, change of base years/periods, nature of business, measurement methods).
Fully GRI Index Not Applicable. >�����^�_������sustainability report
3.11 ��������������������������������������������������scope, boundary, or measurement methods applied in the report.
Fully GRI Index Not Applicable. >�����^�_������sustainability report
3.12 Table identifying the location of the Standard Disclosures in the report.
Fully Pg 60, 68
3.13 Policy and current practice with regard to seeking external assurance for the report.
Fully Pg 57
8�����(����������"���3>"�� ��(���������
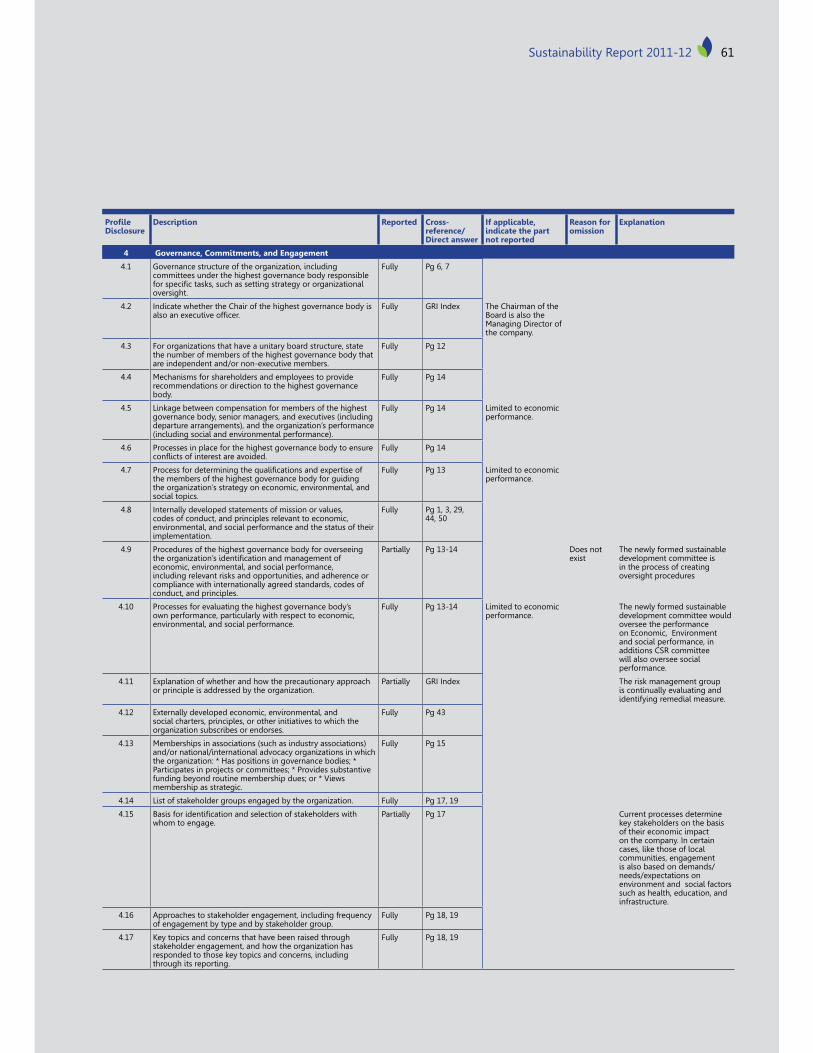
61Sustainability Report 2011-12 61Sustainability Report 2011-12
"�� ��Disclosure
Description Reported Cross-reference/Direct answer
If applicable, indicate the part not reported
Reason for omission
Explanation
4 Governance, Commitments, and Engagement
4.1 Governance structure of the organization, including committees under the highest governance body responsible ���������������������������������������������������� oversight.
Fully Pg 6, 7
4.2 Indicate whether the Chair of the highest governance body is � �����~�������������+
Fully GRI Index The Chairman of the Board is also the Managing Director of the company.
4.3 For organizations that have a unitary board structure, state the number of members of the highest governance body that are independent and/or non-executive members.
Fully Pg 12
4.4 Mechanisms for shareholders and employees to provide recommendations or direction to the highest governance body.
Fully Pg 14
4.5 Linkage between compensation for members of the highest governance body, senior managers, and executives (including departure arrangements), and the organization’s performance (including social and environmental performance).
Fully Pg 14 Limited to economic performance.
4.6 Processes in place for the highest governance body to ensure ���}������������������������+
Fully Pg 14
4.7 �������������������������� �������������~���������the members of the highest governance body for guiding the organization’s strategy on economic, environmental, and social topics.
Fully Pg 13 Limited to economic performance.
4.8 Internally developed statements of mission or values, codes of conduct, and principles relevant to economic, environmental, and social performance and the status of their implementation.
Fully Pg 1, 3, 29, 44, 50
4.9 Procedures of the highest governance body for overseeing ���������������������������������������������economic, environmental, and social performance, including relevant risks and opportunities, and adherence or compliance with internationally agreed standards, codes of conduct, and principles.
Partially Pg 13-14 Does not exist
The newly formed sustainable development committee is in the process of creating oversight procedures
4.10 Processes for evaluating the highest governance body’s own performance, particularly with respect to economic, environmental, and social performance.
Fully Pg 13-14 Limited to economic performance.
The newly formed sustainable development committee would oversee the performance on Economic, Environment and social performance, in additions CSR committee will also oversee social performance.
4.11 Explanation of whether and how the precautionary approach or principle is addressed by the organization.
Partially GRI Index The risk management group is continually evaluating and identifying remedial measure.
4.12 Externally developed economic, environmental, and social charters, principles, or other initiatives to which the organization subscribes or endorses.
Fully Pg 43
4.13 Memberships in associations (such as industry associations) and/or national/international advocacy organizations in which ���������������� ^�����������������������!������ ����������������$����������������� ���������!���������������!���������������!������������� ]����membership as strategic.
Fully Pg 15
4.14 List of stakeholder groups engaged by the organization. Fully Pg 17, 19
4.15 \������������������������� ��������������� ��������whom to engage.
Partially Pg 17 Current processes determine key stakeholders on the basis of their economic impact on the company. In certain cases, like those of local communities, engagement is also based on demands/needs/expectations on environment and social factors such as health, education, and infrastructure.
4.16 Approaches to stakeholder engagement, including frequency of engagement by type and by stakeholder group.
Fully Pg 18, 19
4.17 Key topics and concerns that have been raised through stakeholder engagement, and how the organization has responded to those key topics and concerns, including through its reporting.
Fully Pg 18, 19
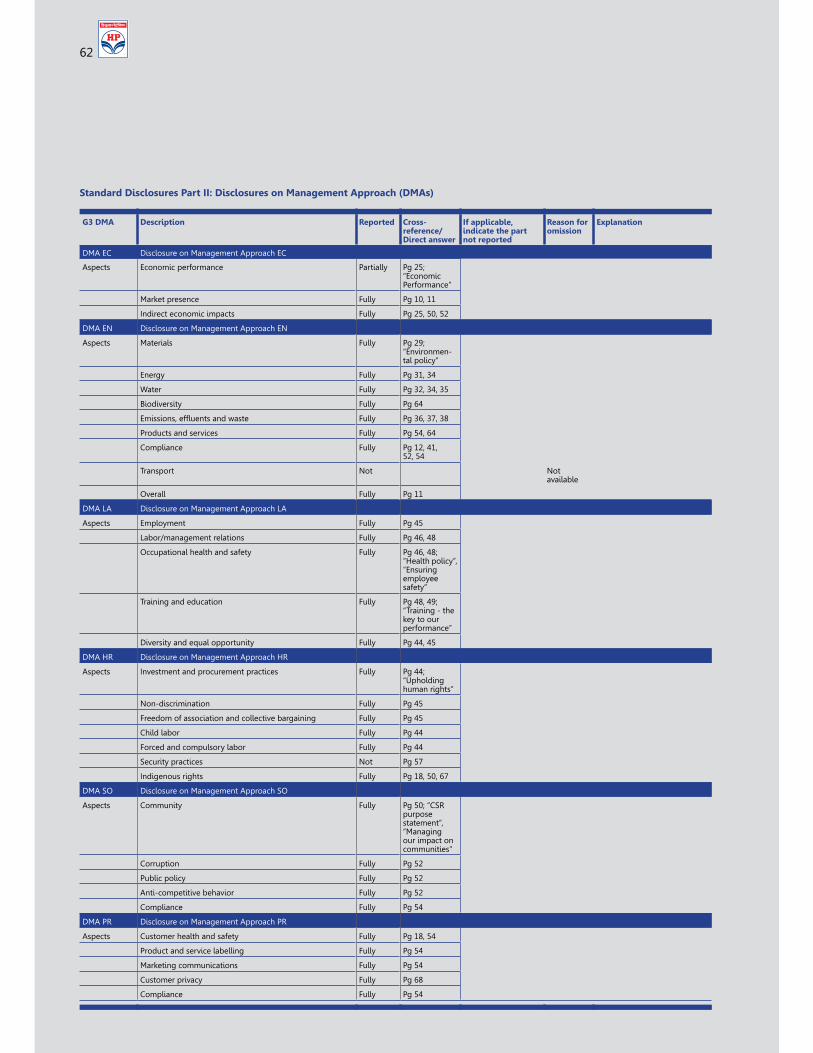
6262
Standard Disclosures Part II: Disclosures on Management Approach (DMAs)
G3 DMA Description Reported Cross-reference/Direct answer
If applicable, indicate the part not reported
Reason for omission
Explanation
DMA EC Disclosure on Management Approach EC
Aspects Economic performance Partially �Z��“Economic Performance”
Market presence Fully Pg 10, 11
Indirect economic impacts Fully Pg 25, 50, 52
DMA EN Disclosure on Management Approach EN
Aspects Materials Fully �Z�� “Environmen-tal policy”
Energy Fully Pg 31, 34
Water Fully Pg 32, 34, 35
Biodiversity Fully Pg 64
������������}������������� Fully Pg 36, 37, 38
Products and services Fully Pg 54, 64
Compliance Fully Pg 12, 41, 52, 54
Transport Not Not available
Overall Fully Pg 11
DMA LA Disclosure on Management Approach LA
Aspects Employment Fully Pg 45
Labor/management relations Fully Pg 46, 48
Occupational health and safety Fully �����X�“Health policy”, “Ensuring employee safety”
Training and education Fully ��X����“Training - the key to our performance”
Diversity and equal opportunity Fully Pg 44, 45
DMA HR Disclosure on Management Approach HR
Aspects Investment and procurement practices Fully ����“Upholding human rights”
Non-discrimination Fully Pg 45
Freedom of association and collective bargaining Fully Pg 45
Child labor Fully Pg 44
Forced and compulsory labor Fully Pg 44
Security practices Not Pg 57
Indigenous rights Fully Pg 18, 50, 67
DMA SO Disclosure on Management Approach SO
Aspects Community Fully ��?����'purpose statement”, “Managing our impact on communities”
Corruption Fully Pg 52
Public policy Fully Pg 52
Anti-competitive behavior Fully Pg 52
Compliance Fully Pg 54
DMA PR Disclosure on Management Approach PR
Aspects Customer health and safety Fully Pg 18, 54
Product and service labelling Fully Pg 54
Marketing communications Fully Pg 54
Customer privacy Fully Pg 68
Compliance Fully Pg 54
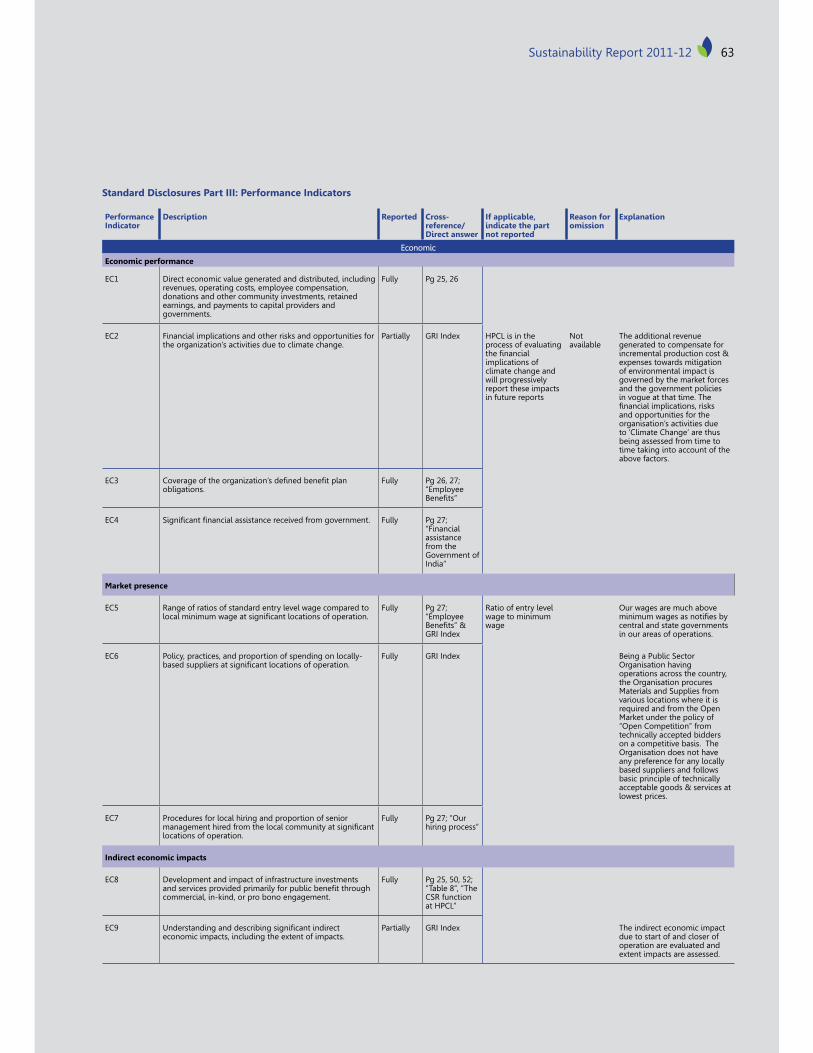
63Sustainability Report 2011-12 63Sustainability Report 2011-12
Standard Disclosures Part III: Performance Indicators
Performance Indicator
Description Reported Cross-reference/Direct answer
If applicable, indicate the part not reported
Reason for omission
Explanation
Economic
Economic performance
EC1 Direct economic value generated and distributed, including revenues, operating costs, employee compensation, donations and other community investments, retained earnings, and payments to capital providers and governments.
Fully Pg 25, 26
EC2 Financial implications and other risks and opportunities for the organization’s activities due to climate change.
Partially GRI Index HPCL is in the process of evaluating ���������� implications of climate change and will progressively report these impacts in future reports
Not available
The additional revenue generated to compensate for incremental production cost & expenses towards mitigation of environmental impact is governed by the market forces and the government policies in vogue at that time. The ������� ��� ��������������and opportunities for the organisation’s activities due to ‘Climate Change’ are thus being assessed from time to time taking into account of the above factors.
EC3 ���������������������������������!������ ��obligations.
Fully �Z��Z¡�“Employee \�������
EC4 ����������������� ��������������������������������+ Fully �Z¡�“Financial assistance from the Government of India”
Market presence
EC5 Range of ratios of standard entry level wage compared to ��� ����������������������� �������������������+
Fully �Z¡�“Employee \��������GRI Index
Ratio of entry level wage to minimum wage
Our wages are much above ���������������������!�central and state governments in our areas of operations.
EC6 Policy, practices, and proportion of spending on locally-!�������� ���������������� �������������������+
Fully GRI Index Being a Public Sector Organisation having operations across the country, the Organisation procures Materials and Supplies from various locations where it is required and from the Open Market under the policy of “Open Competition” from technically accepted bidders on a competitive basis. The Organisation does not have any preference for any locally based suppliers and follows basic principle of technically acceptable goods & services at lowest prices.
EC7 Procedures for local hiring and proportion of senior ���������������������� ��� ���������������������locations of operation.
Fully �Z¡�����hiring process”
Indirect economic impacts
EC8 Development and impact of infrastructure investments �������������������������� ������! ��!������������commercial, in-kind, or pro bono engagement.
Fully �Z���?��Z�“Table 8”, “The CSR function at HPCL”
EC9 ����������������������!���������������������economic impacts, including the extent of impacts.
Partially GRI Index The indirect economic impact due to start of and closer of operation are evaluated and extent impacts are assessed.
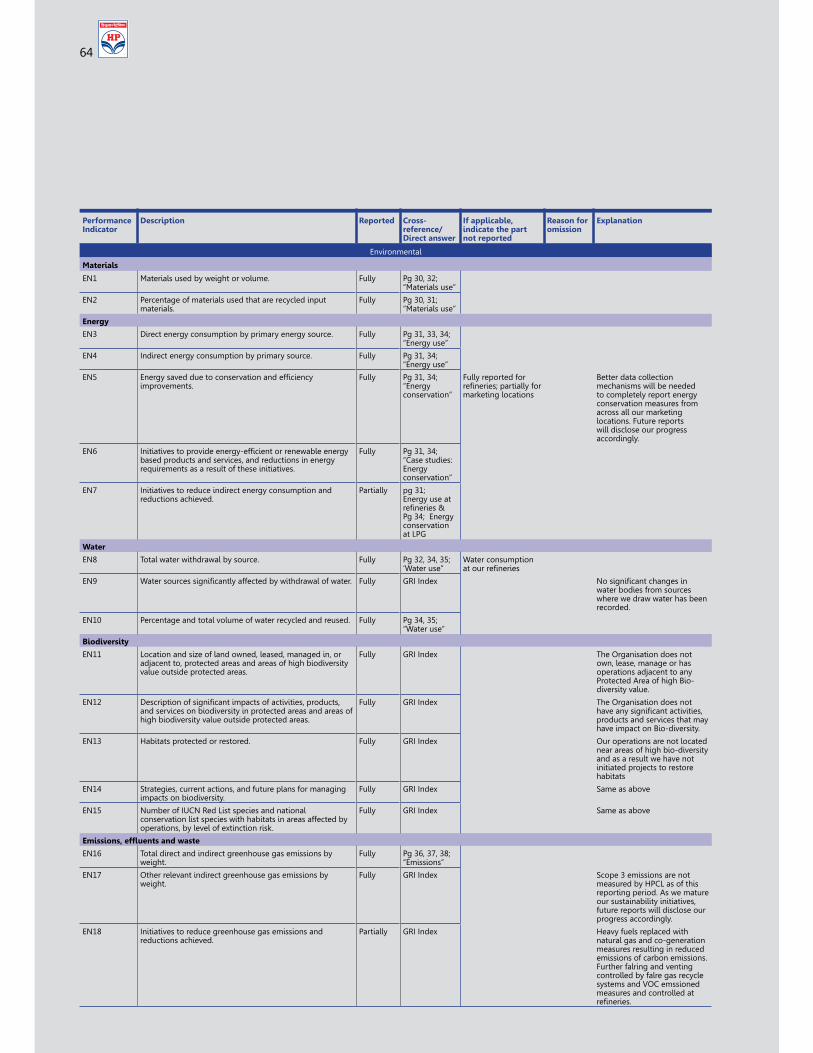
64
Environmental
Materials
EN1 Materials used by weight or volume. Fully �@?�@Z�“Materials use”
EN2 Percentage of materials used that are recycled input materials.
Fully �@?�@[�“Materials use”
Energy
EN3 Direct energy consumption by primary energy source. Fully �@[�@@�@��“Energy use”
EN4 Indirect energy consumption by primary source. Fully �@[�@��“Energy use”
EN5 ����������������������������������������improvements.
Fully �@[�@��“Energy conservation”
Fully reported for ���������������� ����marketing locations
Better data collection mechanisms will be needed to completely report energy conservation measures from across all our marketing locations. Future reports will disclose our progress accordingly.
EN6 `�������������������������=����������������! �������based products and services, and reductions in energy requirements as a result of these initiatives.
Fully �@[�@��“Case studies: Energy conservation”
EN7 Initiatives to reduce indirect energy consumption and reductions achieved.
Partially ��@[�Energy use at �����������@��������conservation at LPG
Water
EN8 Total water withdrawal by source. Fully �@Z�@��@��‘Water use”
Water consumption ��������������
EN9 ���������������������� ���������!���������� �������+ Fully GRI Index <��������������������water bodies from sources where we draw water has been recorded.
EN10 Percentage and total volume of water recycled and reused. Fully �@��@��“Water use”
Biodiversity
EN11 Location and size of land owned, leased, managed in, or adjacent to, protected areas and areas of high biodiversity value outside protected areas.
Fully GRI Index The Organisation does not own, lease, manage or has operations adjacent to any Protected Area of high Bio-diversity value.
EN12 (���������������������������������������������������and services on biodiversity in protected areas and areas of high biodiversity value outside protected areas.
Fully GRI Index The Organisation does not ����������������������������products and services that may have impact on Bio-diversity.
EN13 Habitats protected or restored. Fully GRI Index Our operations are not located near areas of high bio-diversity and as a result we have not initiated projects to restore habitats
EN14 Strategies, current actions, and future plans for managing impacts on biodiversity.
Fully GRI Index Same as above
EN15 Number of IUCN Red List species and national conservation list species with habitats in areas affected by operations, by level of extinction risk.
Fully GRI Index Same as above
$��������+��/������������
EN16 Total direct and indirect greenhouse gas emissions by weight.
Fully �@��@¡�@X�“Emissions”
EN17 Other relevant indirect greenhouse gas emissions by weight.
Fully GRI Index Scope 3 emissions are not measured by HPCL as of this reporting period. As we mature our sustainability initiatives, future reports will disclose our progress accordingly.
EN18 Initiatives to reduce greenhouse gas emissions and reductions achieved.
Partially GRI Index Heavy fuels replaced with natural gas and co-generation measures resulting in reduced emissions of carbon emissions. Further falring and venting controlled by falre gas recycle systems and VOC emssioned measures and controlled at ���������+
Performance Indicator
Description Reported Cross-reference/Direct answer
If applicable, indicate the part not reported
Reason for omission
Explanation
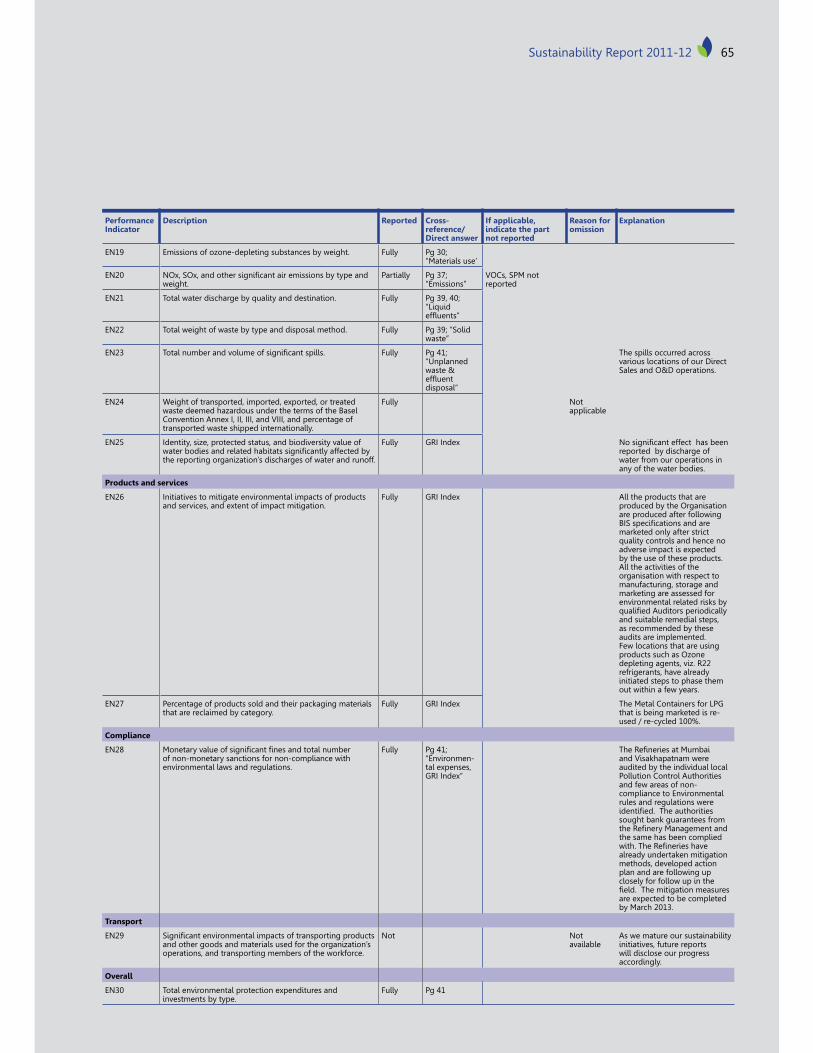
65Sustainability Report 2011-12 65Sustainability Report 2011-12
Performance Indicator
Description Reported Cross-reference/Direct answer
If applicable, indicate the part not reported
Reason for omission
Explanation
EN19 Emissions of ozone-depleting substances by weight. Fully �@?�“Materials use’
EN20 <�~���~�������������������������������!��������weight.
Partially �@¡�“Emissions”
VOCs, SPM not reported
EN21 Total water discharge by quality and destination. Fully �@���?�“Liquid ��}������
EN22 Total weight of waste by type and disposal method. Fully �@����� ��waste”
EN23 >��� ���!������� ������������������ �+ Fully ��[�“Unplanned waste & ��}����disposal”
The spills occurred across various locations of our Direct Sales and O&D operations.
EN24 Weight of transported, imported, exported, or treated waste deemed hazardous under the terms of the Basel Convention Annex I, II, III, and VIII, and percentage of transported waste shipped internationally.
Fully Not applicable
EN25 Identity, size, protected status, and biodiversity value of �����!���������� ������!��������������� ���������!�the reporting organization’s discharges of water and runoff.
Fully GRI Index <��������������������!���reported by discharge of water from our operations in any of the water bodies.
Products and services
EN26 Initiatives to mitigate environmental impacts of products and services, and extent of impact mitigation.
Fully GRI Index All the products that are produced by the Organisation are produced after following \`��������������������marketed only after strict quality controls and hence no adverse impact is expected by the use of these products. All the activities of the organisation with respect to manufacturing, storage and marketing are assessed for environmental related risks by ��� ��������������������� �and suitable remedial steps, as recommended by these audits are implemented. Few locations that are using products such as Ozone depleting agents, viz. R22 refrigerants, have already initiated steps to phase them out within a few years.
EN27 Percentage of products sold and their packaging materials that are reclaimed by category.
Fully GRI Index The Metal Containers for LPG that is being marketed is re-used / re-cycled 100%.
Compliance
EN28 %��������� ������������������������� ���!��of non-monetary sanctions for non-compliance with environmental laws and regulations.
Fully ��[� “Environmen-tal expenses, GRI Index”
>��'����������%��!��and Visakhapatnam were audited by the individual local Pollution Control Authorities and few areas of non-compliance to Environmental rules and regulations were ���������+>�������������sought bank guarantees from ���'������%������������the same has been complied ����+>��'������������already undertaken mitigation methods, developed action plan and are following up closely for follow up in the �� �+>��������������������are expected to be completed by March 2013.
Transport
EN29 ���������������������� �����������������������������and other goods and materials used for the organization’s operations, and transporting members of the workforce.
Not Not available
As we mature our sustainability initiatives, future reports will disclose our progress accordingly.
Overall
EN30 Total environmental protection expenditures and investments by type.
Fully Pg 41
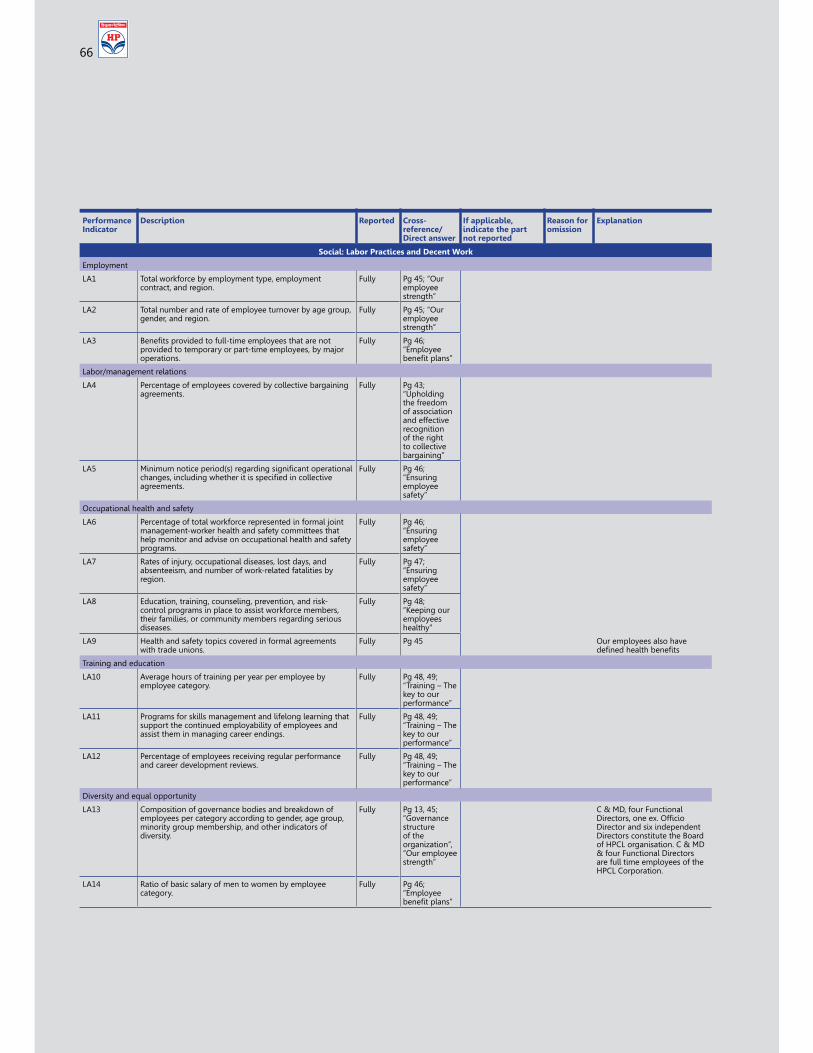
6666
Social: Labor Practices and Decent Work
Employment
LA1 Total workforce by employment type, employment contract, and region.
Fully ��������employee strength”
LA2 Total number and rate of employee turnover by age group, gender, and region.
Fully ��������employee strength”
LA3 \������������������ =������� ���������������provided to temporary or part-time employees, by major operations.
Fully ����“Employee !������ ����
Labor/management relations
LA4 Percentage of employees covered by collective bargaining agreements.
Fully ��@�“Upholding the freedom of association and effective recognition of the right to collective bargaining”
LA5 %�������������������������������������������������� ����������� ���������������������������� ������agreements.
Fully ����“Ensuring employee safety”
Occupational health and safety
LA6 Percentage of total workforce represented in formal joint management-worker health and safety committees that help monitor and advise on occupational health and safety programs.
Fully ����“Ensuring employee safety”
LA7 Rates of injury, occupational diseases, lost days, and absenteeism, and number of work-related fatalities by region.
Fully ��¡�“Ensuring employee safety”
LA8 Education, training, counseling, prevention, and risk-control programs in place to assist workforce members, their families, or community members regarding serious diseases.
Fully ��X�“Keeping our employees healthy”
LA9 Health and safety topics covered in formal agreements with trade unions.
Fully Pg 45 Our employees also have ��������� ��!������
Training and education
LA10 Average hours of training per year per employee by employee category.
Fully ��X����“Training – The key to our performance”
LA11 Programs for skills management and lifelong learning that support the continued employability of employees and assist them in managing career endings.
Fully ��X����“Training – The key to our performance”
LA12 Percentage of employees receiving regular performance and career development reviews.
Fully ��X����“Training – The key to our performance”
Diversity and equal opportunity
LA13 Composition of governance bodies and breakdown of employees per category according to gender, age group, minority group membership, and other indicators of diversity.
Fully �[@����“Governance structure of the organization”, “Our employee strength”
C & MD, four Functional (�������������~+������Director and six independent Directors constitute the Board of HPCL organisation. C & MD & four Functional Directors are full time employees of the HPCL Corporation.
LA14 Ratio of basic salary of men to women by employee category.
Fully ����“Employee !������ ����
Performance Indicator
Description Reported Cross-reference/Direct answer
If applicable, indicate the part not reported
Reason for omission
Explanation
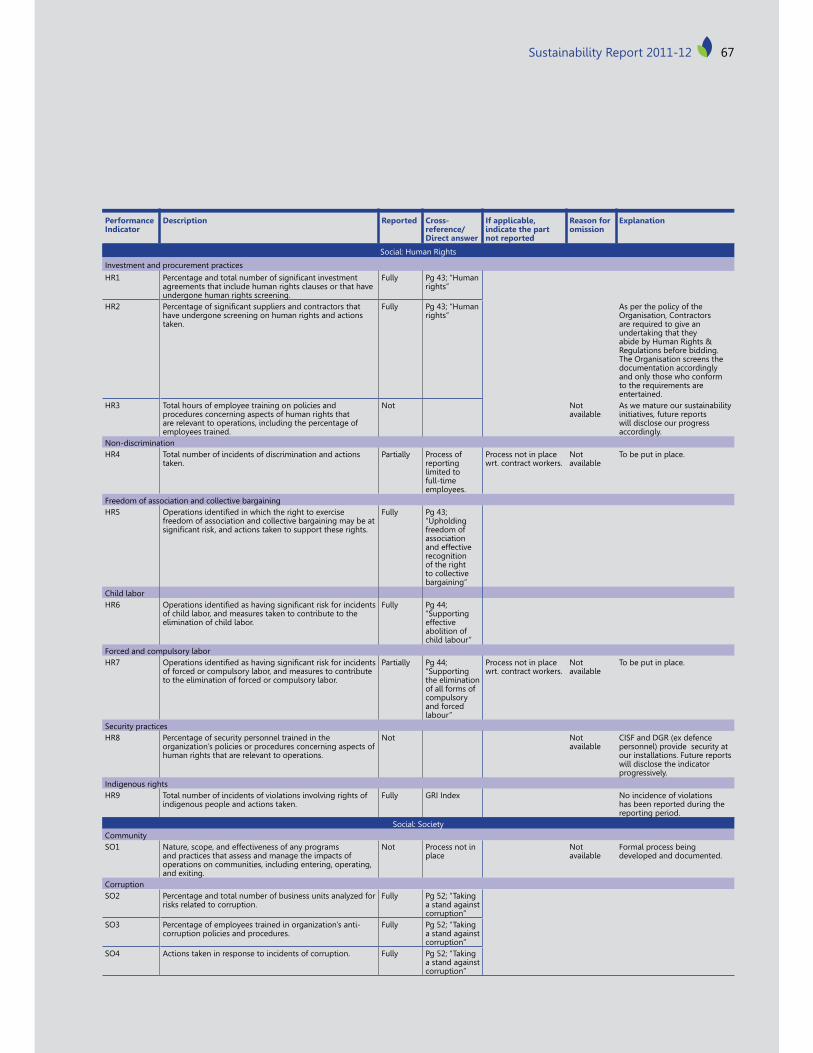
67Sustainability Report 2011-12 67Sustainability Report 2011-12
Performance Indicator
Description Reported Cross-reference/Direct answer
If applicable, indicate the part not reported
Reason for omission
Explanation
Social: Human Rights
Investment and procurement practices
HR1 ���������������� ���!������������������������agreements that include human rights clauses or that have undergone human rights screening.
Fully ��@��^����rights”
HR2 ������������������������� ����������������������have undergone screening on human rights and actions taken.
Fully ��@��^����rights”
As per the policy of the Organisation, Contractors are required to give an undertaking that they abide by Human Rights & Regulations before bidding. The Organisation screens the documentation accordingly and only those who conform to the requirements are entertained.
HR3 Total hours of employee training on policies and procedures concerning aspects of human rights that are relevant to operations, including the percentage of employees trained.
Not Not available
As we mature our sustainability initiatives, future reports will disclose our progress accordingly.
Non-discriminationHR4 Total number of incidents of discrimination and actions
taken.Partially Process of
reporting limited to full-time employees.
Process not in place wrt. contract workers.
Not available
To be put in place.
Freedom of association and collective bargainingHR5 �������������������������������������~������
freedom of association and collective bargaining may be at ��������������������������������������������������+
Fully ��@�“Upholding freedom of association and effective recognition of the right to collective bargaining”
Child laborHR6 �����������������������������������������������������
of child labor, and measures taken to contribute to the elimination of child labor.
Fully ����“Supporting effective abolition of child labour”
Forced and compulsory laborHR7 �����������������������������������������������������
of forced or compulsory labor, and measures to contribute to the elimination of forced or compulsory labor.
Partially ����“Supporting the elimination of all forms of compulsory and forced labour”
Process not in place wrt. contract workers.
Not available
To be put in place.
Security practicesHR8 Percentage of security personnel trained in the
organization’s policies or procedures concerning aspects of human rights that are relevant to operations.
Not Not available
CISF and DGR (ex defence personnel) provide security at our installations. Future reports will disclose the indicator progressively.
Indigenous rightsHR9 Total number of incidents of violations involving rights of
indigenous people and actions taken.Fully GRI Index No incidence of violations
has been reported during the reporting period.
Social: SocietyCommunitySO1 Nature, scope, and effectiveness of any programs
and practices that assess and manage the impacts of operations on communities, including entering, operating, and exiting.
Not Process not in place
Not available
Formal process being developed and documented.
CorruptionSO2 Percentage and total number of business units analyzed for
risks related to corruption. Fully ��Z��>�����
a stand against corruption”
SO3 Percentage of employees trained in organization’s anti-corruption policies and procedures.
Fully ��Z��>�����a stand against corruption”
SO4 Actions taken in response to incidents of corruption. Fully ��Z��>�����a stand against corruption”
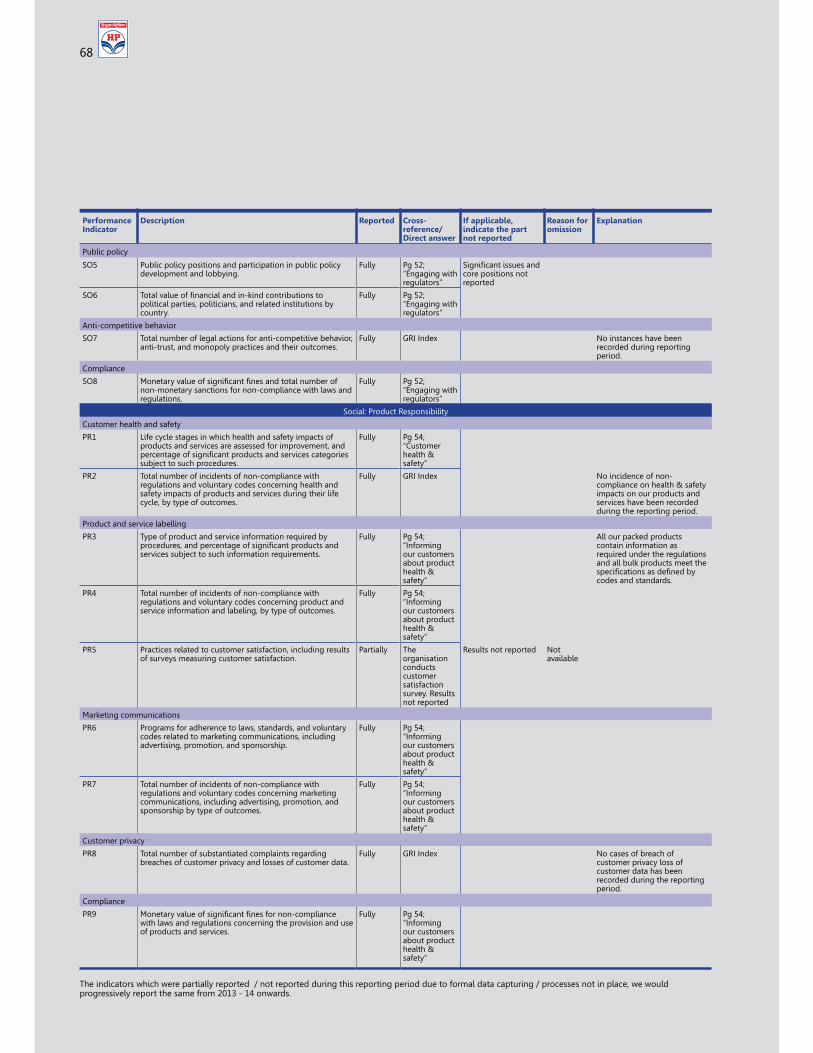
6868
Public policy
SO5 Public policy positions and participation in public policy development and lobbying.
Fully ��Z�“Engaging with regulators”
�������������������core positions not reported
SO6 >��� �� ����������� �����=����������!��������political parties, politicians, and related institutions by country.
Fully ��Z�“Engaging with regulators”
Anti-competitive behavior
SO7 Total number of legal actions for anti-competitive behavior, anti-trust, and monopoly practices and their outcomes.
Fully GRI Index No instances have been recorded during reporting period.
Compliance
SO8 %��������� ������������������������� ���!����non-monetary sanctions for non-compliance with laws and regulations.
Fully ��Z�“Engaging with regulators”
Social: Product Responsibility
Customer health and safety
PR1 Life cycle stages in which health and safety impacts of products and services are assessed for improvement, and ���������������������������������������������������subject to such procedures.
Fully ����“Customer health & safety”
PR2 Total number of incidents of non-compliance with regulations and voluntary codes concerning health and safety impacts of products and services during their life cycle, by type of outcomes.
Fully GRI Index No incidence of non-compliance on health & safety impacts on our products and services have been recorded during the reporting period.
Product and service labelling
PR3 Type of product and service information required by �����������������������������������������������services subject to such information requirements.
Fully ����“Informing our customers about product health & safety”
All our packed products contain information as required under the regulations and all bulk products meet the ���������������������!�codes and standards.
PR4 Total number of incidents of non-compliance with regulations and voluntary codes concerning product and service information and labeling, by type of outcomes.
Fully ����“Informing our customers about product health & safety”
PR5 Practices related to customer satisfaction, including results of surveys measuring customer satisfaction.
Partially The organisation conducts customer satisfaction survey. Results not reported
Results not reported Not available
Marketing communications
PR6 Programs for adherence to laws, standards, and voluntary codes related to marketing communications, including advertising, promotion, and sponsorship.
Fully ����“Informing our customers about product health & safety”
PR7 Total number of incidents of non-compliance with regulations and voluntary codes concerning marketing communications, including advertising, promotion, and sponsorship by type of outcomes.
Fully ����“Informing our customers about product health & safety”
Customer privacy
PR8 Total number of substantiated complaints regarding breaches of customer privacy and losses of customer data.
Fully GRI Index No cases of breach of customer privacy loss of customer data has been recorded during the reporting period.
Compliance
PR9 %��������� ������������������������=���� �����with laws and regulations concerning the provision and use of products and services.
Fully ����“Informing our customers about product health & safety”
Performance Indicator
Description Reported Cross-reference/Direct answer
If applicable, indicate the part not reported
Reason for omission
Explanation
The indicators which were partially reported / not reported during this reporting period due to formal data capturing / processes not in place, we would progressively report the same from 2013 - 14 onwards.
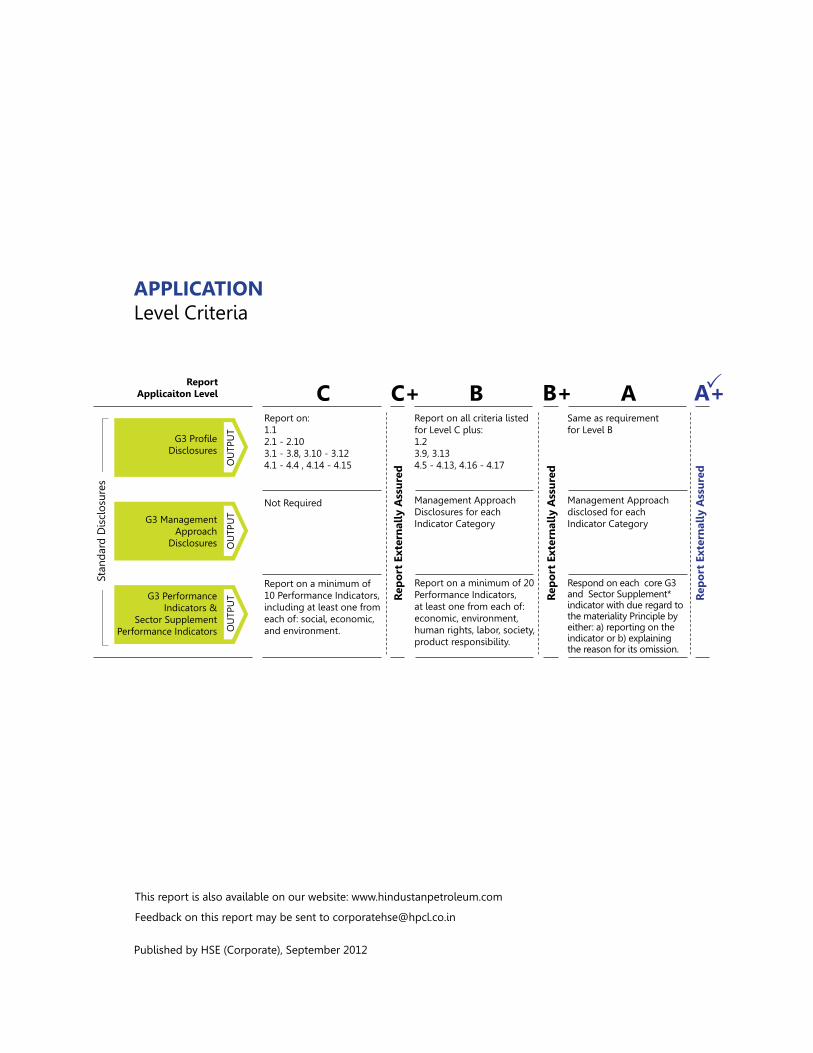
APPLICATION Level Criteria
�����������������@�9�� C B AC+ B+ A+
Report on:1.12.1 - 2.103.1 - 3.8, 3.10 - 3.124.1 - 4.4 , 4.14 - 4.15
Report on all criteria listed for Level C plus:1.23.9, 3.134.5 - 4.13, 4.16 - 4.17
Same as requirement for Level B
Management Approach Disclosures for each Indicator Category
Management Approach disclosed for each Indicator Category
Report on a minimum of 20Performance Indicators, at least one from each of: economic, environment, human rights, labor, society, product responsibility.
Respond on each core G3 and Sector Supplement* indicator with due regard to the materiality Principle by either: a) reporting on the indicator or b) explaining the reason for its omission.
Not Required
Published by HSE (Corporate), September 2012
Report on a minimum of 10 Performance Indicators, including at least one from each of: social, economic, and environment.
���
���
$%�
���
���;
���
���
���
���
$%�
���
���;
���
���
���
���
$%�
���
���;
���
���
OU
TPU
TO
UTP
UT
"@��� �Disclosures
G3 Management Approach
Disclosures
G3 PerformanceIndicators &
Sector Supplement Performance Indicators
Stan
dar
d D
iscl
osu
res
OU
TPU
T
This report is also available on our website: www.hindustanpetroleum.com
Feedback on this report may be sent to [email protected]

Hindustan Petroleum Corporation Limited (A Government of India Enterprises)
Petroleum House, 17, Jamshedji Tata Road, Churchgate, Mumbai- 400020