sustainability of renewable gasesmembers.igu.org/old/igu events/wgc/wgc-2015... · global...
TRANSCRIPT

Sustainability of renewable gases
Natural gas and renewable gas
E.L. Huijzer, R. Aissaoui, S.Siitonen, M.Zdravkovic
June 2015


3
2012-2015 Triennium Work Report June 2015
Sustainability of renewable gases
Natural gas and renewable gas
Executive Summary:
Increasing use of renewable gas reduces emissions and prepares for a decentralized and more sustainable future. Introducing renewable gas has a large and positive impact on the gas industry. The possibility to operate on a bigger scale increases the attractiveness of biogas as a
product for energy companies and private investors.
Produced by: International Gas Union
This publication is produced under the auspices of the International Gas Union (IGU) which holds the copyright. This publication may not be reproduced in whole or in part without the written permission of the IGU. However, irrespective of the above, established journals or periodicals shall be permitted to reproduce this publication, or part of it, abbreviated or edited form, provided that credit is given to IGU. This document contains strictly technical information to be distributed during the 26th World Gas Conference in Paris, France, and has no commercial intent.
www.igu.org

5
Table of Contents
Authors ............................................................................................................................................................ 7
Summary ........................................................................................................................................................ 8
Part A: Sustainability of renewable gases
Introduction ............................................................................................................................................... 12
Justification of renewable gases .................................................................................................... 12
The attractiveness of renewable gases for the natural gas industry .............................. 13
Vision towards 2050 .......................................................................................................................... 15
Developments around the world ....................................................................................................... 18
Renewable gas resources and biogas production .................................................................. 18
Upgrading of biogas to biomethane ............................................................................................. 24
Biomethane use ................................................................................................................................... 25
Global differences between countries ........................................................................................ 27
Sustainability: Economy, environment and society ................................................................... 30
Can biomass for energy be sustainable? .................................................................................... 30
Economic aspects ................................................................................................................................ 31
Environmental aspects ..................................................................................................................... 34
Social aspects ........................................................................................................................................ 38
How renewable gas is incorporated in the energy system ...................................................... 41
Technical issues on upgrading ....................................................................................................... 41
Best practices ....................................................................................................................................... 46
Governmental support ...................................................................................................................... 48
Establishing green certificates ....................................................................................................... 49
Mobility ................................................................................................................................................... 50
Conclusions and recommendations .................................................................................................. 52
References Part A ..................................................................................................................................... 54
Part B: Country reports
Introduction ............................................................................................................................................... 57
EUROPE ........................................................................................................................................................ 58
Austria ..................................................................................................................................................... 58
Finland .................................................................................................................................................... 62
Sweden .................................................................................................................................................... 71
6
Denmark ................................................................................................................................................. 76
Netherlands ........................................................................................................................................... 82
Germany ................................................................................................................................................. 87
France ...................................................................................................................................................... 93
Spain.......................................................................................................................................................100
Switzerland .........................................................................................................................................104
United Kingdom .................................................................................................................................108
Poland ....................................................................................................................................................113
Croatia ...................................................................................................................................................116
Serbia .....................................................................................................................................................118
Russia.....................................................................................................................................................123
ASIA .............................................................................................................................................................126
South Korea .........................................................................................................................................126
Japan ......................................................................................................................................................130
Malaysia ................................................................................................................................................132
China ......................................................................................................................................................134
Thailand ................................................................................................................................................135
India .......................................................................................................................................................136
Bangladesh ..........................................................................................................................................137
AMERICA ...................................................................................................................................................138
Brazil ......................................................................................................................................................138
AFRICA .......................................................................................................................................................141
Algeria ...................................................................................................................................................141
Other Maghreb and Arab countries ...........................................................................................146
East Africa, Tanzania and Kenya .................................................................................................149
Abbreviations ..........................................................................................................................................151
7
Authors
This report has been written by the members of Study Group 2 “Natural gas and renewable gases” from IGU Programming Committee A “Sustainability”, with the help of several people who gave specific technical or country information.
The study group members are:
Radia Aissaoui, Sonelgaz, Algeria.
Elbert Huijzer, Liander, the Netherlands.
Sari Siitonen, Gasum, Finland.
Milan Zdravkovic, Srbijagaz, Serbia.
The co-authors are:
Vladislav Karasevich, Gubkin Russian state university of oil and gas, Russia.
Tuomas Niskanen, Gasum, Finland.
Naiara Ortiz de Mendíbil Romo, Sedigas, Spain.
Puttaporn Pravalpruk, PTT, Thailand.
Søren Sørensen, HMN Naturgas, Denmark.

8
Summary
Justification Although natural gas is the cleanest of all fossil fuels, increasing use of renewable gas is necessary to reduce the overall emissions and to prepare for a decentralized and more sustainable future. Introducing renewable gas in the supply stream has a large and positive impact on the gas industry. The possibility to operate on a bigger scale increases the attractiveness of biogas as a product for energy companies and private investors. The existing and expected demand for renewables, extra margins and the opportunity to trade large volumes on one hand, and the positive impact on the current problems of the energy markets growth associated with a public awareness towards the global environmental threats, make renewable gas an attractive energy source.
The energy mix in 2050 is expected to be a mix of fossil fuels and renewable energy. The total amount of energy needed will be increased because of growing world population and increasing development. All forms of sustainable, renewable energy will therefore be needed to energize the world. But this will not be enough in 2050 and fossil fuels will have their place.
The interaction between the various energy sources, energy carriers and energy users will be increased enormously. On the one hand this is because of the decoupling of energy production and energy demand, which is inherent to many renewable energy sources. On the other hand, it is because of the high potential of information and communication technologies that will alter the way people and systems interact.
The natural gas industry will therefore have to transform itself from a top-down industry to a customer-oriented industry.
Sustainable development is based upon the three pillars economy, environment and society. To assess the production of biogas and biomethane one can use the Cramer-criteria, the indicators of the Global Bioenergy Partnership or the ISO 13065 (expected in 2015).
Economy One of the great advantages of producing biogas is that it is a way of turning waste into money. Waste in the sense of municipal waste or sewage, leftovers from agriculture or forestry, manure, residual products from the food industry and so on. Waste that had to be disposed of, is becoming feedstock for energy. The residual products from the digestion or gasification processes, can often be used in other processes again, creating added value.
Many studies performed on the introduction of biogas in developing countries show that it results in a new local economy. It creates opportunities for new entrepreneurs, money is circulating locally from end-user to distributor and to producer, leading to local investments and jobs.
Introducing biogas or biomethane has impact on the energy market. Because of the wider mix of energy sources available, it leads to an increase in the security of supply.
Biogas can be sold to different customer segments and sometimes it might be difficult to decide what customer segment would be the most profitable. Often this is based upon subsidy or tax schemes, whereby the outlook of these instruments is too short for the long payback times of the investments. In different segments biogas is competing with

9
different fuels, which affect the competitive advantage of biogas. Biomethane often has the highest value when sold in the automotive market as biofuel.
Environmental One of the most obvious reasons to use bio-energy is the decreasing effect on greenhouse gas emissions compared to fossil fuels. A second reason is that renewable gases fit into the concept of a circular economy, whereby materials and products are re-used, repaired, refurbished and recycled.
Energy crops are plants grown to produce biofuels or to be combusted or digested for its energy content. Woody crops such as willow or poplar as well as grasses such as Miscanthus are widely used to produce heat and/or power. To produce biogas, one often sees the use of maize or Sorghum. Nowadays, more and more research is being done in third generation energy crops, which are specially grown crops that do not compete with food production, like algae.
Social In many industrialized countries we see that people are willing to spend time in making small-scale circular economies possible. This all leads to a trend of small, local and self-supporting. In this trend, the use of local energy made from biomass, is a good fit. It bridges the gap between the traditional world of the gas industry and the needs for sustainable living.
Globally over 1.3 billion people are without access to electricity and 2.7 billion people are without clean cooking facilities. More than 95% of these people are either in sub-Saharan Africa or developing Asia and 84% are in rural areas. By introducing renewable gas, the gas industry will be able to help local communities. One of the advantages is that investments are relatively small and lead-times for development can be short. The availability of (electrical) energy makes an enormous difference in the development of the region. Local biogas production gives opportunities for employability. The use of biogas instead of using firewood or kerosene without good ventilation can make a huge difference in indoor air quality.
Technical issues Biogas can be cleaned and upgraded to match the quality requirements for being injected into the existing natural gas infrastructure or used as vehicle fuel. Several (European) standards for grid injection and for the automotive sector are on their way and expected by the end of 2015. Technologies for biogas upgrading have been on the market for many years and are commercially available.
Domestic biogas plants are a proven and established technology in many parts of the world. Economics calculations show that the upgrading of biogas to biomethane can be profitable when at least 500 Nm³ raw gas per hour can be used.
Many LCA studies have been done on the use of renewable gases for the automotive sector. Based on the LCA studies referred here the greenhouse gas emission reduction of biomethane in transportation use varies between 42 and 180 per cent and in the most cases between 80 and 90 per cent.
Government support Government support is common for promoting the production of renewable energy. The most common and direct strategy is to provide subsidy which may attract a lot of investors to produce biogas in the country. Tax incentives are also provided for investors in many countries.
10
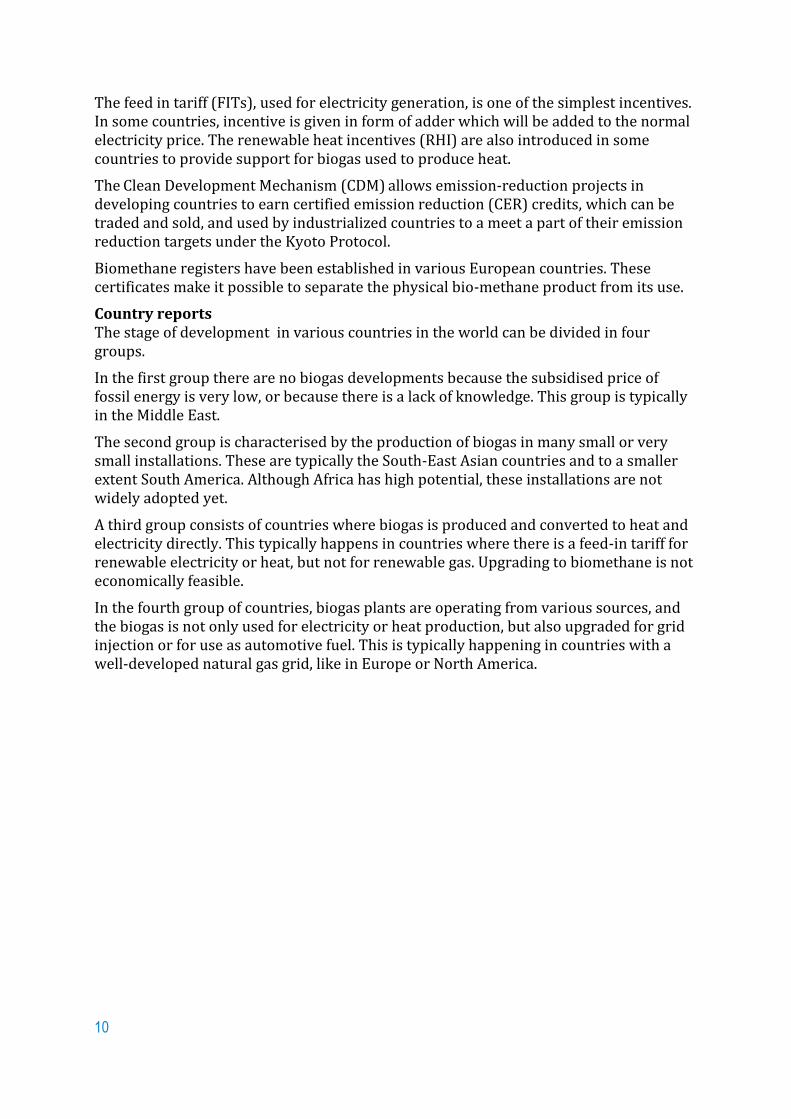
The feed in tariff (FITs), used for electricity generation, is one of the simplest incentives. In some countries, incentive is given in form of adder which will be added to the normal electricity price. The renewable heat incentives (RHI) are also introduced in some countries to provide support for biogas used to produce heat.
The Clean Development Mechanism (CDM) allows emission-reduction projects in developing countries to earn certified emission reduction (CER) credits, which can be traded and sold, and used by industrialized countries to a meet a part of their emission reduction targets under the Kyoto Protocol.
Biomethane registers have been established in various European countries. These certificates make it possible to separate the physical bio-methane product from its use.
Country reports The stage of development in various countries in the world can be divided in four groups.
In the first group there are no biogas developments because the subsidised price of fossil energy is very low, or because there is a lack of knowledge. This group is typically in the Middle East.
The second group is characterised by the production of biogas in many small or very small installations. These are typically the South-East Asian countries and to a smaller extent South America. Although Africa has high potential, these installations are not widely adopted yet.
A third group consists of countries where biogas is produced and converted to heat and electricity directly. This typically happens in countries where there is a feed-in tariff for renewable electricity or heat, but not for renewable gas. Upgrading to biomethane is not economically feasible.
In the fourth group of countries, biogas plants are operating from various sources, and the biogas is not only used for electricity or heat production, but also upgraded for grid injection or for use as automotive fuel. This is typically happening in countries with a well-developed natural gas grid, like in Europe or North America.

11
Part A

12
Introduction
Justification of renewable gases This report is about the sustainability of renewable gases. Sustainable development is made up of the well-known triangle “Economy, environment and society”, also known in the short version “People, planet, profit”.
The report is addressed to those people who are interested in the renewable gases, and want to know more than what was written in the report of the previous triennium (IGU_PGC_A, 2012). The main message is that renewable gases will be, and have to be, part of the future energy mix and that the natural gas industry is in the position to help this development.
Although natural gas is the cleanest of all fossil fuels, increasing use of renewable gas is necessary to reduce the overall emissions and to prepare for a decentralized and more sustainable future. Introducing renewable gas in the supply stream has a large and positive impact on the gas industry.
An important part of this report consists of identifying the developments in various countries across the world. They showcase developments, successes and barriers, financing issues, regulations and local effects on economy or ecology. Based upon these insights, the economic, environmental and social issues are described, to help the reader understand the potential and the difficulties of producing and distributing renewable gases, so that he can apply this to his own situation.
Renewable gas is defined in many ways around the world. In some cases these definitions are not even consistent within countries. Producers, consumers and politicians may speak a different language to technicians. Some definitions are general, others are detailed. “Renewable gases” is the overall name for biogas, bio synthetic gas and biomethane. In order to be called renewable gas, the biomass should be renewable. In IGU the following scheme of definitions was decided upon (see Figure 1).
Figure 1: From biomass to renewable gas
Biomass or biodegradable fraction of waste
Gasification
Anaerobic digestion
Bio syngas
Bio-Hydrogen
Biogas(raw gas) Upgrading
Reforming, upgrading
Methanation,upgrading
Biomethane
Biomethane(Bio-SNG)
Direct use in
Energy production
Direct use in
Industry / filling stations
Renewable
gas to
the natural gas
network

13
When processing biomass, there are two main routes to follow. One is anaerobic digestion, normally used for wet biomass, and one is gasification, normally used for dry biomass. The result of digestion is called biogas; the result of gasification is called bio synthetic gas. The product is often used on site, to produce electricity and, where possible, heat. But if more energy is produced then can be used on site, one would like to distribute it to other users.
In order to transport the product of digestion (or gasification) some basic processing steps need to be carried out, like dehydration and desulphurization. When cleaned, the biogas or bio synthetic gas can be distributed in a dedicated grid to one, or a few, end users.
But to use the full potential of the existing natural gas grid, the biogas or bio synthetic gas is upgraded to a composition that is comparable to the natural gas. It is then called biomethane. In this IGU scheme, biomethane is a definition which is used for gas from both the digestion and the gasification route. The logic is that it does not differ in its composition, since by definition it should be comparable to the natural gas composition of the grid to which it is connected. As natural gas is distributed in a variety of qualities, biomethane can also be produced in a variety of qualities. For instance, in Europe one can imagine a difference between low and high-calorific biomethane. The overall name for all these gases from biomass is renewable gas.
And there is even another alternative. This is to directly feed in biogas into the natural gas grid without upgrading it to the local natural gas condition. It saves you this upgrading step and is therefore much cheaper for the producer. But this is only possible if the appliances on the natural gas grid can handle the varying composition. In existing grids, this is usually not the case. But, if one is in the position to develop the energy system, this option should be considered for its flexibility.
The attractiveness of renewable gases for the natural gas industry Renewable gas, produced mainly via anaerobic digestion or thermal gasification, has the potential to make a significant contribution to the reduction of greenhouse gas (GHG) emissions enhancing security of supply.
With the goal of developing a sustainable energy system, governments around the world have focused their energy policies towards the promotion of renewable energies. Spurred on by the legally binding renewable energy targets, renewable energy grew strongly. The introduction of green gas could provide the salvation to some of the future energy solutions. The possibility to operate on a bigger scale increases the attractiveness of biogas as a product for energy companies and private investors.
Due to a number of political, technical and market related reasons, the expected period over which a full transition to renewable energy will occur is long. The changed economic climate has also clearly had an impact on the development of new renewable energy projects.
14
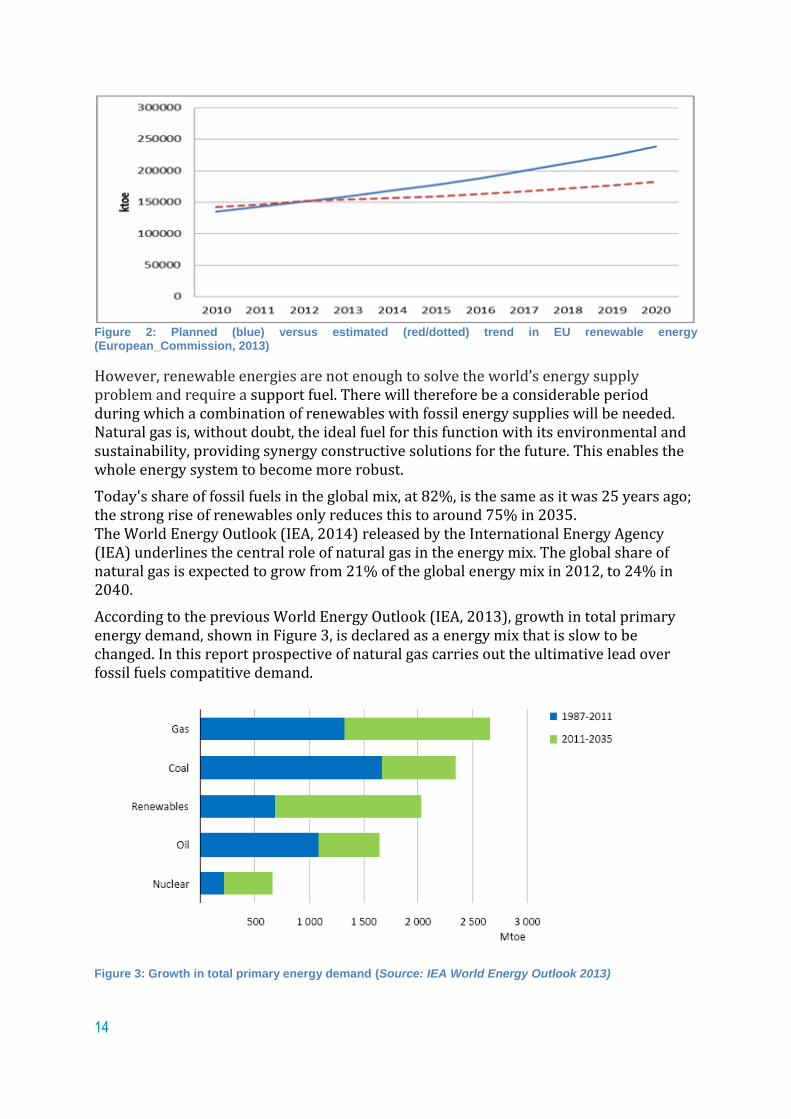
Figure 2: Planned (blue) versus estimated (red/dotted) trend in EU renewable energy (European_Commission, 2013)
However, renewable energies are not enough to solve the world’s energy supply problem and require a support fuel. There will therefore be a considerable period during which a combination of renewables with fossil energy supplies will be needed. Natural gas is, without doubt, the ideal fuel for this function with its environmental and sustainability, providing synergy constructive solutions for the future. This enables the whole energy system to become more robust.
Today's share of fossil fuels in the global mix, at 82%, is the same as it was 25 years ago; the strong rise of renewables only reduces this to around 75% in 2035. The World Energy Outlook (IEA, 2014) released by the International Energy Agency (IEA) underlines the central role of natural gas in the energy mix. The global share of natural gas is expected to grow from 21% of the global energy mix in 2012, to 24% in 2040.
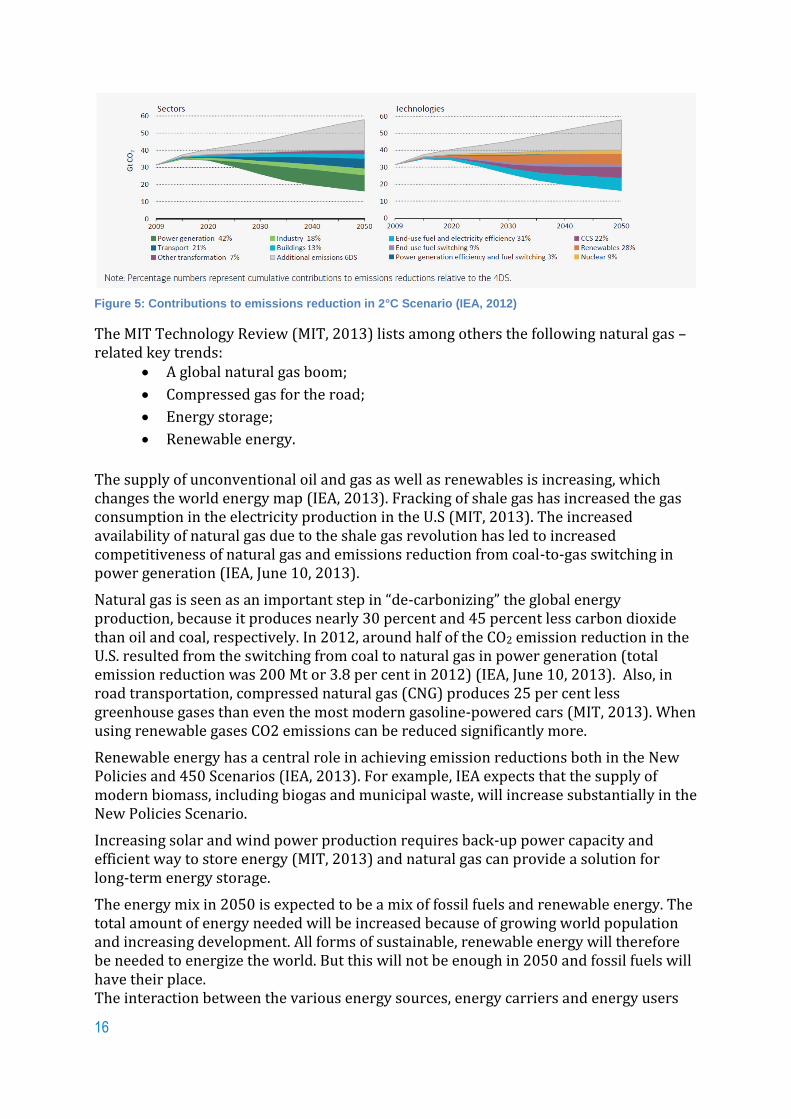
According to the previous World Energy Outlook (IEA, 2013), growth in total primary energy demand, shown in Figure 3, is declared as a energy mix that is slow to be changed. In this report prospective of natural gas carries out the ultimative lead over fossil fuels compatitive demand.
Figure 3: Growth in total primary energy demand (Source: IEA World Energy Outlook 2013)

15
According to the report, the two largest growing energy resources are both natural gas and renewables. Therefore, synergy between the two is preferable to develop the full potential.
The existing and expected demand for renewables, extra margins and the opportunity to trade large volumes on one hand, and the positive impact on the current problems of the energy markets growth associated with a public awareness towards the global environmental threats, make renewable gas an attractive energy source. Therefore it is expected that present obstacles, preventing renewable gas sources being intensively integrated into the existing energy network, will soon be reduced, resulting in the enlargement and improvement of existing gas infrastructure, as a strategic interest of the Natural Gas Transmission System Operators to integrate renewable gas into their portfolios.
Vision towards 2050 Climate change is a major challenge of our time. The primary energy demand is expected to increase by 2035, which affects carbon dioxide emissions. IEA studied three different scenarios (IEA, 2013). Only in the 450 scenario there is a 50 per cent chance of keeping to 2°C long-term increase in average global temperature (Figure 4) because CO2 emissions will decrease. In the other scenarios the CO2 emissions will increase.
Figure 4: World primary energy demand and related CO2 emissions by scenario (IEA, WEO 2013)
Many different technologies, such as energy efficiency improvement, renewable energy, fuel switching and carbon capture and storage (CCS) are needed to reduce CO2 emissions. Figure 5 shows the contributions of different technologies in the scenario with an 80% chance of limiting long-term global temperature increase to 2°C (IEA, 2012).
16
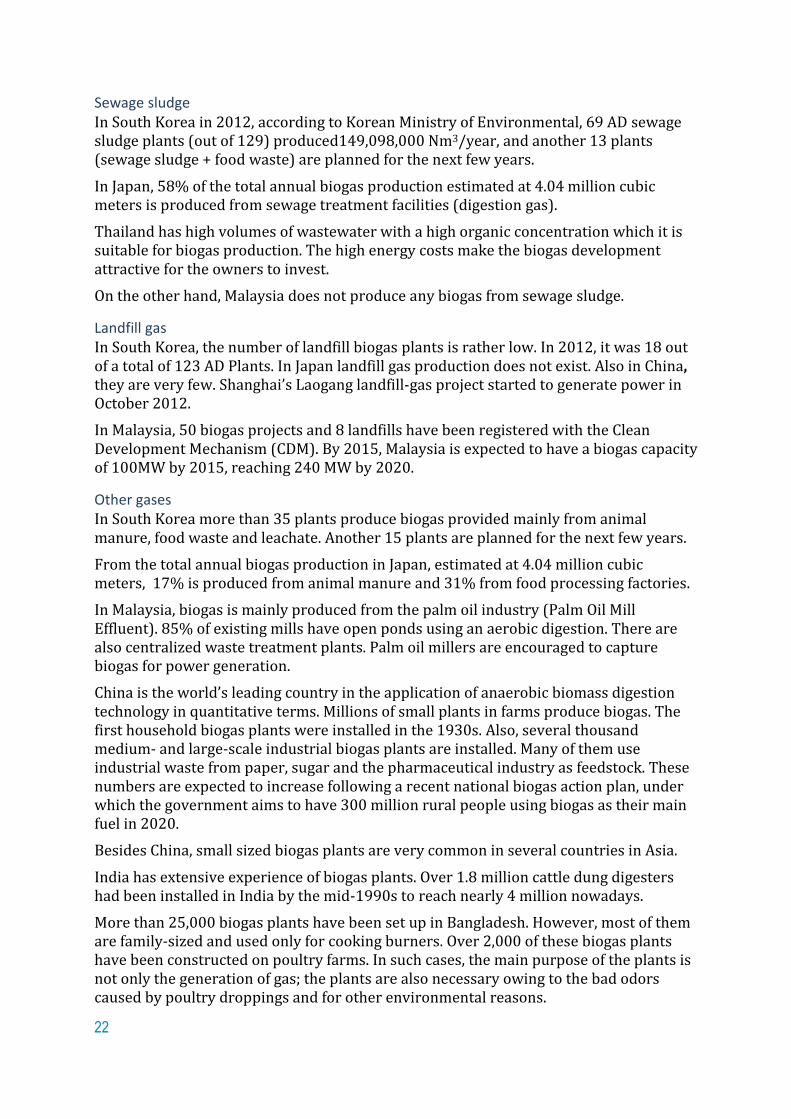
Figure 5: Contributions to emissions reduction in 2°C Scenario (IEA, 2012)
The MIT Technology Review (MIT, 2013) lists among others the following natural gas –related key trends:
A global natural gas boom;
Compressed gas for the road;
Energy storage;
Renewable energy.
The supply of unconventional oil and gas as well as renewables is increasing, which changes the world energy map (IEA, 2013). Fracking of shale gas has increased the gas consumption in the electricity production in the U.S (MIT, 2013). The increased availability of natural gas due to the shale gas revolution has led to increased competitiveness of natural gas and emissions reduction from coal-to-gas switching in power generation (IEA, June 10, 2013).
Natural gas is seen as an important step in “de-carbonizing” the global energy production, because it produces nearly 30 percent and 45 percent less carbon dioxide than oil and coal, respectively. In 2012, around half of the CO2 emission reduction in the U.S. resulted from the switching from coal to natural gas in power generation (total emission reduction was 200 Mt or 3.8 per cent in 2012) (IEA, June 10, 2013). Also, in road transportation, compressed natural gas (CNG) produces 25 per cent less greenhouse gases than even the most modern gasoline-powered cars (MIT, 2013). When using renewable gases CO2 emissions can be reduced significantly more.
Renewable energy has a central role in achieving emission reductions both in the New Policies and 450 Scenarios (IEA, 2013). For example, IEA expects that the supply of modern biomass, including biogas and municipal waste, will increase substantially in the New Policies Scenario.
Increasing solar and wind power production requires back-up power capacity and efficient way to store energy (MIT, 2013) and natural gas can provide a solution for long-term energy storage.
The energy mix in 2050 is expected to be a mix of fossil fuels and renewable energy. The total amount of energy needed will be increased because of growing world population and increasing development. All forms of sustainable, renewable energy will therefore be needed to energize the world. But this will not be enough in 2050 and fossil fuels will have their place. The interaction between the various energy sources, energy carriers and energy users

17
will be increased enormously. On the one hand this is because of the decoupling of energy production and energy demand, which is inherent to many renewable energy sources. On the other hand, it is because of the high potential of information and communication technologies that will alter the way people and systems interact. The natural gas industry will therefore have to transform itself from a top-down industry to a customer-oriented industry.

18
Developments around the world
Renewable gas is used nearly all over the world and can be adapted to any area. Almost a century ago, the first household biogas plants were already installed in China. Biogas was primarily used by farmers in rural areas and has become increasingly popular in higher populated areas.
The biogas sector is gradually deserting its core activities of waste clean-up and treatment and getting involved in energy production, with so much enthusiasm that in some countries its scope of action has extended to using energy crops.
Depending on various factors such as national resources and level of technology, the production and the use of renewable gas vary widely across the world.
Renewable gas resources and biogas production
Europe
Biogas Biogas is produced mainly from:
landfill sites;
sewage sludge;
others, which means: decentralised agricultural plant, municipal solid waste
methanisation plant, centralised co-digestion plant.
Biogas plants come in different types and sizes ranging from small anaerobic digesters on farms, larger co-digestion (or multi-product) plants and household waste methane production plants.
EurObserv’ER (Eurobserv'er, November 2014) provides an overview of biogas production in European countries in 2012 and 2013* (in ktoe) as stated in Table 1.
2012 2013*
Country Landfill gas
Sewage sludge gas (1)
Others biogas (2)
Total Landfill gas
Sewage sludge gas (1)
Others Biogas (2)
Total
Germany 123.7 372.1 5 920.4 6 416.2 108.8 392.8 6 215.3 6 716.8
United Kingdom** 1 533.9 269.7 0.0 1 803.6 1 538.2 286.2 0.0 1 824.4
Italy 370.6 42.0 766.1 1 178.8 410.8 48.5 1 356.1 1 815.4
Czech Republic 31.7 39.4 303.8 374.9 28.9 39.6 502.5 571.1
France** 279.1 79.6 53.3 412.0 280.0 80.0 105.0 465.0
Netherlands 29.9 53.1 214.5 297.5 24.6 57.8 220.3 302.8
Spain** 140.8 33.8 116.2 290.8 124.0 29.8 102.4 256.1
Poland 53.7 79.3 60.8 193.8 61.8 91.2 98.2 251.2
Austria 3.8 18.2 184.3 206.4 3.7 18.4 174.6 196.8
Belgium** 32.4 17.2 108.0 157.7 29.2 15.5 97.2 141.9

19
Sweden** 12.6 73.6 40.6 126.8 13.6 79.3 43.7 136.6
Denmark** 5.6 21.2 77.9 104.7 5.3 20.3 74.4 100.0
Greece 69.4 15.8 3.4 88.6 67.5 16.1 4.8 88.4
Hungary 14.3 18.7 46.8 79.8 14.3 20.1 47.8 82.2
Slovakia 3.1 13.8 45.1 62.0 3.4 14.8 48.5 66.6
Portugal 54.0 1.7 0.7 56.4 61.8 2.7 0.8 65.3
Finland 31.6 13.9 12.4 57.9 31.7 14.6 13.2 59.5
Ireland** 43.0 7.5 5.4 55.9 43.1 7.5 5.4 56.0
Latvia** 18.4 5.7 27.8 51.9 18.4 5.7 27.9 52.0
Slovenia 6.9 3.1 28.2 38.1 7.1 2.8 24.8 34.7
Romania** 1.4 0.1 25.9 27.3 1.5 0.1 28.4 30.0
Croatia 2.0 3.1 11.4 16.6 2.1 3.2 12.8 18.0
Lithuania 6.1 3.1 2.3 11.6 7.1 3.6 4.8 15.5
Luxembourg 0.1 1.3 12.0 13.4 0.1 1.3 11.4 12.8
Cyprus 0.0 0.0 11.4 11.4 0.0 0.0 12.0 12.0
Estonia** 2.2 0.7 0.0 2.9 5.4 1.8 0.0 7.2
Bulgaria 0.0 0.0 0.1 0.1 0.0 0.0 0.1 0.1
Malta 0.0 0.0 0.0 0.0 0.0 0.0 0.0 0.0
EU 2 870 1 188 8 079 12 137 2 892 1 254 9 233 13 379
(1) Urban and industrial.
(2) Decentralised agricultural plant, municipal solid waste methanisation plant, centralised co-digestion plant.
*First estimations.
**Whenever the information was not available, the breakdown between the different types of biogas was estimated by EurObserv’ER for the year 2013 on the basis of the breakdown observed in 2012. Source: EurObserv’ER 2014.
Table 1: Primary energy of biogas in the EU
In the European Union, ‘Other biogas’ dominates the other sources with more than 66,5% in 2012, followed by landfill gas 23,6% then sewage sludge biogas with 9,7%.
Each country applies its own biogas development policy, so : Sewage sludge prevails in Sweden. In order to reduce the sludge volume, Sweden
has produced biogas at waste water treatment plants for decades.
Landfill gas is the main player in UK, France, Spain, Portugal and Ireland.
Other gases are dominant in Germany, Italy, Czech Republic, and Netherlands.
There is an impressive growth of agricultural biogas methanisation plants whose production increasingly relies on energy crops (primarily maize). The main example is Germany. That enables farm holdings to reduce their energy dependency and diversify their incomes in the event of falling cereal, milk or meat prices. For instance the largest biogas plant in Sweden is under construction 11,7 M Nm3/year biomethane, using energy crops as substrate. If 10 % of the agricultural land in Sweden is used, approximately 7 TWh of biogas could be produced annually. Furthermore, the French parliament adopted an amendment in the bill on energy transition that prohibits dedicated energy crops for methanisation but the use of intermediate crops remains allowed. The bill will be submitted to the Senate in early 2015 (Eurobserv'er, November 2014).

20
Bio-synthetic natural gas Efforts are made to establish production and utilization technology for wood gas in Denmark, France, Sweden, Austria and Finland. The target in Finland is to replace around 10 per cent of natural gas with synthetic natural gas made from domestic wood (bio-SNG) by 2025.
The R&D and demonstration project active in France for the BioSNG is the GAYA Project. This project is addressing the whole chain from feedstock to BioSNG injection. It aims to develop the BioSNG technology by 2017 through reducing production cost while keeping high standards of energy efficiency, environmental impact and social acceptability.
Industrial biogas plants Biogas is a renewable energy that can be recovered in different ways, most commonly as electricity and heat through cogeneration.
2012 2013*
Country Heat only plant
CHP plant Total Heat only plant
CHP plant Total
Italy 0.3 138.5 138.8 0.3 200.8 201.1
Germany 33.2 47.8 81.0 33.5 70.5 104.0
Denmark 5.9 29.5 35.5 4.2 20.7 24.8
France 2.8 10.6 13.4 2.8 10.6 13.4
CzechRepublic 0.0 8.7 8.7 0.0 11.6 11.6
Sweden 5.4 5.7 11.2 5.4 5.7 11.2
Latvia 0.0 10.9 10.9 0.0 10.9 10.9
Slovenia 0.0 9.3 9.3 0.0 8.8 8.8
Finland 6.2 1.6 7.8 6.2 1.6 7.8
Poland 0.3 4.8 5.1 0.0 7.2 7.2
Belgium 0.0 6.6 6.6 0.0 6.6 6.6
Austria 1.9 5.2 7.1 1.9 4.4 6.3
Netherlands 0.0 4.4 4.4 0.0 3.7 3.7
Romania 0.9 2.4 3.3 0.9 2.4 3.3
Croatia 0.0 2.7 2.7 0.0 3.0 3.0
Slovakia 0.0 2.7 2.7 0.0 2.9 2.9
Lithuania 0.0 1.2 1.2 0.0 2.3 2.3
Hungary 0.4 0.9 1.3 0.4 0.9 1.3
Luxembourg 0.0 1.0 1.0 0.0 1.1 1.1
Cyprus 0.0 1.0 1.0 0.0 1.0 1.0
Estonia 0.0 0.1 0.1 0.0 0.1 0.1
EU 57.4 295.8 353.2 55.6 376.8 432.4
*Estimate. **Heat sold to the district heating network or to the industrial units. Source: EurObserv’ER 2014.
Table 2: Gross heat production from biogas in the European Union in 2012 and in 2013* (in ktoe) in the transformation sector**
21
2012 2013*
Country Electricity
only plants
CHP plants Total
electricity
Electricity
only plants
CHP plants Total electricity
Germany 5 916.0 21 322.0 27 238.0 6 338.0 22 662.0 29 000.0
Italy 2 160.0 2 458.0 4 618.0 3 435.0 4 013.0 7 448.0
United Kingdom 5 249.2 625.0 5 874.2 5 265.7 665.0 5 930.7
Czech Republic 55.0 1 412.0 1 467.0 55.0 2 239.0 2 294.0
France 754.9 530.0 1 284.9 893.6 627.4 1521.0
Netherlands 68.0 940.0 1 008.0 60.0 906.0 966.0
Spain 765.0 101.0 866.0 802.1 105.9 908.0
Poland 0.0 565.4 565.4 0.0 882.5 882.5
Austria 592.0 46.0 638.0 574.0 41.0 615.0
Belgium 90.4 573.1 663,5 81.5 516.5 598.0
Denmark 2.5 375.7 378.2 1.7 255.3 257.0
Portugal 199.0 10.0 209.0 238.0 10.0 248.0
Hungary 153.4 81.3 234.7 100.3 142.5 242.8
Latvia 0.0 223.0 223.0 0.0 223.0 223.0
Greece 40.0 164.3 204.3 39.2 177.2 216.4
Slovakia 88.0 102.0 190.0 94.0 110.0 204.0
Ireland 175.0 24.0 199.0 175.9 24.1 200.0
Slovenia 4.9 148.2 153.0 4.2 136.8 141.0
Finland 57.0 82.0 139.0 57.4 82.6 140.0
Croatia 0.0 56.8 56.8 0.0 63.2 63.2
Lithuania 0.0 42.0 42.0 0.0 59.0 59.0
Luxembourg 0.0 57.9 57.9 0.0 55.3 55.3
Cyprus 0.0 50.0 50.0 0.0 52.0 52.0
Romania 0.0 19.0 19.0 0.0 25.8 25.8
Estonia 0.0 15.8 15.8 0.0 21.0 21.0
Sweden 0.0 22.0 22.0 0.0 12.0 12.0
Malta 0.0 2.0 2.0 0.0 3.0 3.0
Bulgaria 0.0 0.3 0.3 0.0 0.5 0.5
EU 16370.4 30048.8 46419.1 18 215.6 34 111.6 52 327.2
*Estimate. Source: EurObserv’ER 2014.
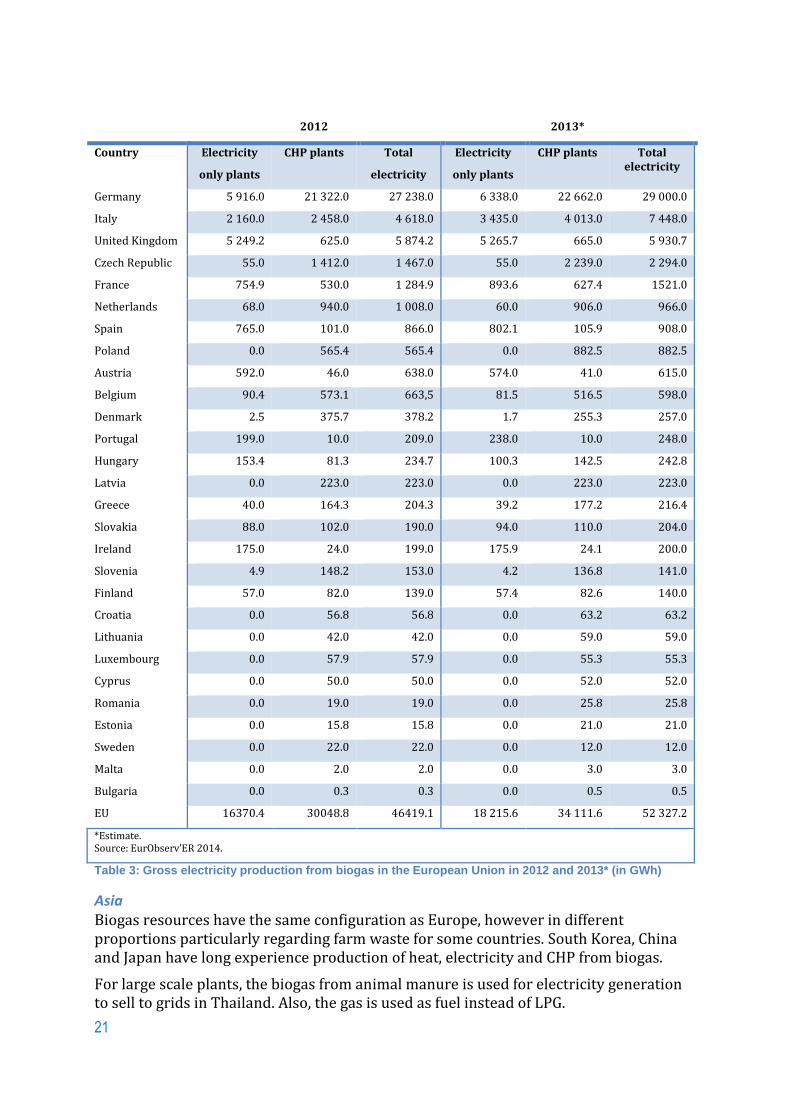
Table 3: Gross electricity production from biogas in the European Union in 2012 and 2013* (in GWh)
Asia Biogas resources have the same configuration as Europe, however in different proportions particularly regarding farm waste for some countries. South Korea, China and Japan have long experience production of heat, electricity and CHP from biogas.
For large scale plants, the biogas from animal manure is used for electricity generation to sell to grids in Thailand. Also, the gas is used as fuel instead of LPG.
22
Sewage sludge In South Korea in 2012, according to Korean Ministry of Environmental, 69 AD sewage sludge plants (out of 129) produced149,098,000 Nm3/year, and another 13 plants (sewage sludge + food waste) are planned for the next few years.
In Japan, 58% of the total annual biogas production estimated at 4.04 million cubic meters is produced from sewage treatment facilities (digestion gas).
Thailand has high volumes of wastewater with a high organic concentration which it is suitable for biogas production. The high energy costs make the biogas development attractive for the owners to invest.
On the other hand, Malaysia does not produce any biogas from sewage sludge.
Landfill gas In South Korea, the number of landfill biogas plants is rather low. In 2012, it was 18 out of a total of 123 AD Plants. In Japan landfill gas production does not exist. Also in China, they are very few. Shanghai’s Laogang landfill-gas project started to generate power in October 2012.
In Malaysia, 50 biogas projects and 8 landfills have been registered with the Clean Development Mechanism (CDM). By 2015, Malaysia is expected to have a biogas capacity of 100MW by 2015, reaching 240 MW by 2020.
Other gases In South Korea more than 35 plants produce biogas provided mainly from animal manure, food waste and leachate. Another 15 plants are planned for the next few years.
From the total annual biogas production in Japan, estimated at 4.04 million cubic meters, 17% is produced from animal manure and 31% from food processing factories.
In Malaysia, biogas is mainly produced from the palm oil industry (Palm Oil Mill Effluent). 85% of existing mills have open ponds using an aerobic digestion. There are also centralized waste treatment plants. Palm oil millers are encouraged to capture biogas for power generation.
China is the world’s leading country in the application of anaerobic biomass digestion technology in quantitative terms. Millions of small plants in farms produce biogas. The first household biogas plants were installed in the 1930s. Also, several thousand medium- and large-scale industrial biogas plants are installed. Many of them use industrial waste from paper, sugar and the pharmaceutical industry as feedstock. These numbers are expected to increase following a recent national biogas action plan, under which the government aims to have 300 million rural people using biogas as their main fuel in 2020.
Besides China, small sized biogas plants are very common in several countries in Asia.
India has extensive experience of biogas plants. Over 1.8 million cattle dung digesters had been installed in India by the mid-1990s to reach nearly 4 million nowadays.
More than 25,000 biogas plants have been set up in Bangladesh. However, most of them are family-sized and used only for cooking burners. Over 2,000 of these biogas plants have been constructed on poultry farms. In such cases, the main purpose of the plants is not only the generation of gas; the plants are also necessary owing to the bad odors caused by poultry droppings and for other environmental reasons.
23
Household biogas plants are furthermore widespread in Asian countries such as India, Bangladesh, Nepal, Pakistan, Vietnam, Cambodia and Laos. In these countries millions of rural people use biogas as their main fuel.
America
Sewage sludge In North America, there are more than 2200 biogas producing sites, of which approximately 1500 are anaerobic digesters at wastewater treatment plants (IGU_WOC_5_TT_1, SEPTEMBER 5, 2103).
In Brazil around 20% of AD plants use sewage sludge (5 out of 24) and in Chile one plant, the La Farfana WWT Plant in Santiago produces 65,700 m³/d of biogas.
Landfill gas Landfill gas in Brazil is produced on 6 sites. Some biogas from landfills, for carbon credit revenue, is produced in Argentina, Colombia, Bolivia and Ecuador.
Other gases In North America, there are more than 700 biogas AD producing sites.
In Brazil, one plant is known to operate from biowaste (poultry slaughterhouse). Furthermore, there are 8 agricultural and 4 industrial production sites. The main purpose of these plants (using the waste of a slaughterhouse or animal production facility) is sanitation and environmental protection. The second important benefit is gas and electricity production for in-house use in the companies. The remaining sugar cane bagasse is commonly used as fuel to power hundreds of plants. Most of these plants use direct combustion and have capacities far over 1 MW.
In Argentina, Colombia, Bolivia and Ecuador biogas is being produced in small villages for their own consumption.
Africa and Middle East
Sewage sludge In Algeria, biogas is generated from sludge by anaerobic digestion in 3 out of 76 waste water treatment plant (wwtp) under operation in the country. The only use is heat for methanisation and flaring.
Landfill gas Morocco and Jordan are among the first Arab countries to collect landfill biogas. In Morocco, methane recovery is on the Rabat Akreuch landfill. In Jordan the first commercial-scale project converting landfill gas to energy was coupled with recovery from a purpose built biogas digester operating on waste from slaughter houses.
Algeria has vast landfills biogas resources, but they are not yet exploited.
Other gases Some farmer families biogas plants started more than 30 years ago in Morocco and Tunisia. They aim to produce energy from agriculture and livestock waste. Tunisia and Morocco are still trying to install them at large scale.
Also in Tunisia, energy production from Jatropha (or Pourghère) seems interesting for the Environment Ministry, regarding the strategic requirement that this plantation will

24
not compete with food and forest and that treated waste water will be used for irrigation. The plantation area is approximately 13.000 ha and the energy potential is considered to be approximately 300 ktep.
In the Middle East, Jordan is the pioneer in producing electricity form biogas. In Lebanon there may be some potential related to residues from the crops. The target is 15-25 MW from waste by 2020.
In East Africa, Tanzania and Kenya, biogas is traditionally used in small and very small installations for providing household energy and for supplying social institutions with gas as fuel for cooking, heating and lighting. In Kenya exist a bigger biogas plant in Kelifi with a digestion of 4T substrate a day (dung from 200 cattle (40%), sisal waste (60%)).
Following RCREEE1 and paving the way for Mediterranean solar plan, in strategic objectives there are no renewable gas projects for none of the four countries Egypt, Libya, Yemen and Syria.
Upgrading of biogas to biomethane For the last 10 - 20 years a number of upgrading technologies has been commercially available. Throughout Europe there are in total more than 200 biomethane plants in operation (Table 4), which clearly shows that gas upgrading technology is mature and proven.
Countries like Sweden, the Netherlands, Germany and Switzerland are considered as the forerunners countries. According to the DENA biomethane sector barometer, Germany already had 151 biomethane plants at the end of June 2014 (146 at the end of 2013) with a production capacity of around 93 650 Nm3/h.
Table 4: Number of upgrading plants in Europe by 2013
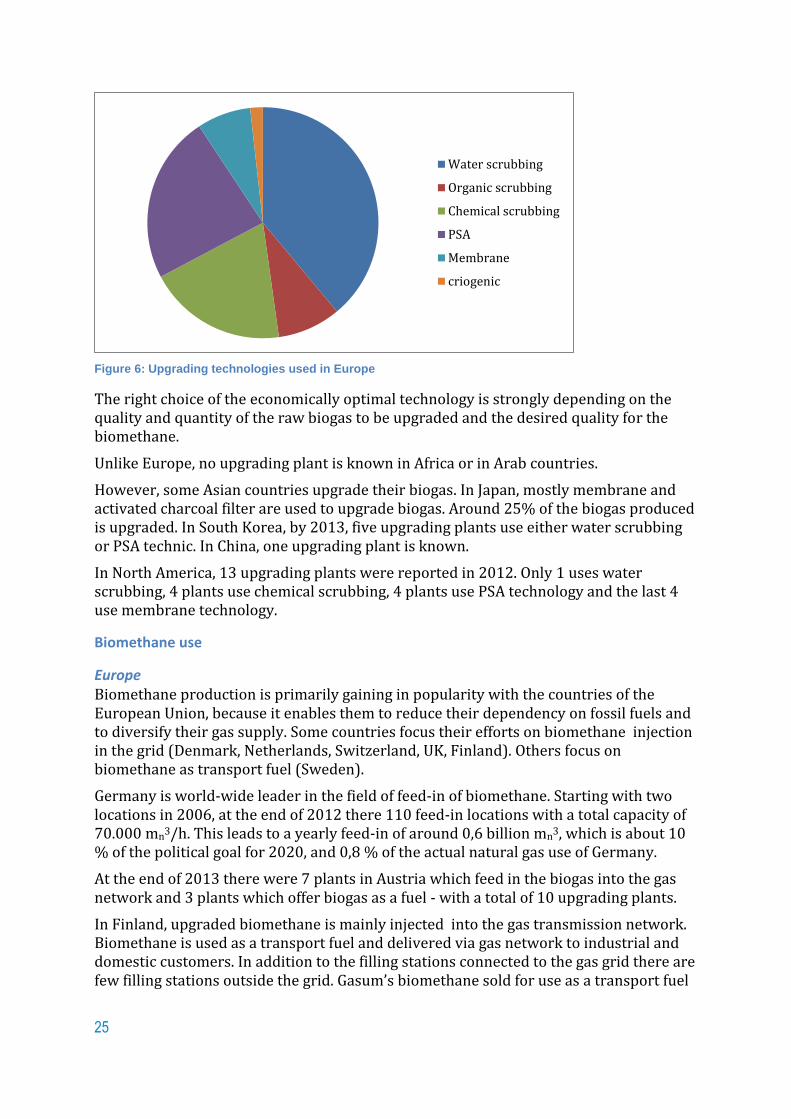
In Europe the dominating upgrading technologies are water scrubbing followed by PSA and chemical scrubbing(amine), broken down as shown in Figure 6.
1 The Regional Center for Renewable Energy and Energy Efficiency (RCREEE) is an independent not-for-profit
regional organization which aims to enable and increase the adoption of renewable energy and energy efficiency practices in the Arab region.
0
20
40
60
80
100
120
140
160
25
Figure 6: Upgrading technologies used in Europe
The right choice of the economically optimal technology is strongly depending on the quality and quantity of the raw biogas to be upgraded and the desired quality for the biomethane.
Unlike Europe, no upgrading plant is known in Africa or in Arab countries.
However, some Asian countries upgrade their biogas. In Japan, mostly membrane and activated charcoal filter are used to upgrade biogas. Around 25% of the biogas produced is upgraded. In South Korea, by 2013, five upgrading plants use either water scrubbing or PSA technic. In China, one upgrading plant is known.
In North America, 13 upgrading plants were reported in 2012. Only 1 uses water scrubbing, 4 plants use chemical scrubbing, 4 plants use PSA technology and the last 4 use membrane technology.
Biomethane use
Europe Biomethane production is primarily gaining in popularity with the countries of the European Union, because it enables them to reduce their dependency on fossil fuels and to diversify their gas supply. Some countries focus their efforts on biomethane injection in the grid (Denmark, Netherlands, Switzerland, UK, Finland). Others focus on biomethane as transport fuel (Sweden).
Germany is world-wide leader in the field of feed-in of biomethane. Starting with two locations in 2006, at the end of 2012 there 110 feed-in locations with a total capacity of 70.000 mn3/h. This leads to a yearly feed-in of around 0,6 billion mn3, which is about 10 % of the political goal for 2020, and 0,8 % of the actual natural gas use of Germany.
At the end of 2013 there were 7 plants in Austria which feed in the biogas into the gas network and 3 plants which offer biogas as a fuel - with a total of 10 upgrading plants.
In Finland, upgraded biomethane is mainly injected into the gas transmission network. Biomethane is used as a transport fuel and delivered via gas network to industrial and domestic customers. In addition to the filling stations connected to the gas grid there are few filling stations outside the grid. Gasum’s biomethane sold for use as a transport fuel
Water scrubbing
Organic scrubbing
Chemical scrubbing
PSA
Membrane
criogenic

26
has been awarded the Nordic Ecolabel. Biomethane consumption in transport is increasing.
In Sweden, among the 54 upgrading plants, only 11 are injecting in the grid. Due to the dependency of fossils fuels in the Swedish transport sector, utilisation of biogas as vehicle fuel has gained large interest during the last few years There were nearly 200 filling station in 2012.
By October 2014, five upgrading plants for biogas are in operation in Denmark. The biomethane from these five plants is injected into the natural gas grid. The upgrading capacity for the plants corresponds to 22 Mm3/year or 0.8 PJ/year. An additional five larger biogas plants are under construction. As the financial support to biomethane injected into the gas grid was approved by the EU as late as December 2013, most of the upgrading capacity was installed in 2014.
In the Netherlands, the 21 upgrading plants in operation are injecting into the grid.
At the beginning of 2013, the only plant in France injecting biomethane into the grid was in Lille. About 350 projects are under study for injection into the natural gas grids.
Since 2011 Spain has a specific standard allowing biomethane injection into the NG grid. One upgrading plant injects biomethane in the natural gas grid. One plant produces vehicle fuel and one plant is fit for both injection in the natural gas grid and producing vehicle fuel.
The first biomethane injection into the grid in Switzerland was in 2006. In 2013, 17 upgrading plants were injecting on the grid, nearly half of them use sewage sludge as a substrate. At the end of 2012, there were 135 filling stations supplied by 2 biomethane plants using bio-waste as a substrate.
In 2010, biogas was injected into the UK gas grid for the first time. Now 5 biogas plants are injecting into the grid. The first and only refueling station uses a mix of biomethane (20%) and LNG (80%) and was opened in 2008. The market for CNG as a vehicle fuel in the UK is in its infancy although biomethane as a vehicle fuel is beginning to increase.
In Croatia, one biomethane plant is known. In Poland and Serbia no upgrading plants are in operation or under construction. Any biogas power plants convert biogas directly to electricity.
Asia Only three countries are known to have an active production of biomethane; Japan, South-Korea and China.
In Japan, the use of biogas on-site for heating and power generation to avoid upgrading cost is preferred. Nevertheless, the first biomethane injection into the grid started in 2010 representing around 0.002% of whole gas sales in Japan.
In South Korea the 4 upgrading plants produce CNG to fuel buses and garbage trucks. The fifth upgrading plant, the only one using landfill gas, produce also electricity in addition to CNG. No biomethane injection into the grid is known.
In China, the first upgrading plant started operating in 2012.
America In Canada, some attention is given to biomethane. In 2012, the leading province Ontario, had approximately 40 plants and 16 MW biogas power installed.

27
Africa and Middle East In Africa and the Middle East, no biomethane production and use is known.
Global differences between countries Across the world, the market of biogas varies widely. According biogas recovery, countries can be classified in 4 major groups.
The first group: No biogas plant In this group are countries where biogas is:
either not yet an issue, like Egypt, Libya, Yemen and Syria;
or it is on the strategic plan but remains in the stage of prefeasibility studies like
in Algeria (biogas from landfill and wastewater treatment) or Lebanon (crops
residues).
The main reasons of not using biogas are essentially the energy low cost (energy subsidies), the lack of know how technology and limited technical capabilities.
The second group: small and very small installations Biogas is traditionally used in small and very small installations. China is the world’s leading country in this group, where the first household biogas plants were installed in the 1930s.
Biogas is providing household energy as fuel for cooking, heating and lighting. It plays a key role in poverty alleviation. It’s also considered as a means for improving hygiene conditions and avoids forest depletion.
Due to proven and mastered technology, these installations are widely spread in:
Asian countries having large rural areas like China and India or a high level of
rural population such as Nepal, Pakistan, Vietnam, Cambodia, Laos and
Bangladesh;
Latin America. Biogas production in little villages for their own consumption
exist in Brazil, Argentina, Colombia, Bolivia and Ecuador.
Compared to mostly Asian countries who are biogas technology provider, the use of household biogas is still struggling in most African countries as the technology is often not adapted to the environment and has to be mastered. This is the case for countries like Morocco, Tunisia, East Africa, Tanzania and Kenya.
The third group: Industrial biogas power plants Countries are characterized by industrial biogas power plants that convert biogas directly to heat or electricity, with no upgrading plants in operation or under construction yet.
Few EU countries, especially from former Eastern Europe are involved in this category, like Poland, Serbia and Slovakia. Usually in that case, there are no feed-in tariffs for production of biomethane, but there is a feed-in tariff scheme for electricity and heat produced from biogas. Biogas upgrading is not considered to be an economically feasible alternative due to the lack of financial incentives.
For Russia, the scheme is significantly different. The contracted biogas price for CHP is significantly lower than the natural gas. The reason for this is that there were no

28
investments in the digestion facilities, which already existed. For biogas from landfills however, the situation is more problematic because biogas production from landfills is considered as mineral production (like a natural gas field) and requires corresponding licensing.
Others countries like Malaysia, Kenya, and Jordan are just starting with pilot sites. Morocco collects biogas from one landfill site and will produce electricity in the next stage.
The fourth group: Forerunners countries Forerunners countries come under this group with a dynamic increasing of biogas production. Biogas plants come in different types and sizes ranging from household waste methane production plants, small anaerobic digesters on farms and industrial plants. Besides the important production of electricity and heat from biogas, biomethane is booming in a number of countries.
The countries most involved in biomethane production are mainly from Europe with Germany (151 plants) well ahead from Sweden (54 plants), the Netherlands (21 plants), Austria (10 plants), Finland (7 plants) and Luxembourg (3 plants). More recently the Denmark (5 plant), UK (4 plants), France and Spain (3 plants), Italy (2 plants), Hungary and Croatia (1 plant each) have become involved and offer considerable development potential.
In the other side of the world, South Korea (5 plants), Japan (2 plants) Thailand (1 plant) and USA (13 plants by 2012). Recently, Brazil has its first plant. Some attention is given to biomethane in Canada with 40 plants (in 2012) for the province of Ontario only.
Biomethane grid injection Most of the output from the plants mentioned above is intended for grid injection but could also be used on site when required. We note some interesting specific cases:
Most upgrading capacity in Denmark injecting into the gas grid was installed in 2014 as the financial support to biomethane was approved by the EU as late as December 2013. An additional five larger biogas plants are under construction.
In Spain, two plants are injection biomethane in the natural gas grid..
Biomethane injected into the natural gas grid represent only 0.002% of whole gas sales in Japan. The basic idea of biomethane usage is to use it on-site for heating and power generation to avoid upgrading cost. In 2012, feed in tariff of renewable electricity (FIT) started, so more projects are underway to use digested gas to generate power and fed into the power grid.
Moreover, no biomethane injection into the grid is known South Korea.
Landfill gas is sometimes rejected from public grid. That is the case for France and Austria due to concerns about harmful gas components and the limited availability of appropriate measurement equipment for all the impurities. For Germany, the DVGW standard G-262 prohibits the injection of landfill gas into the NG grids due to the presence of halogens.
However, in Sweden landfill gas is not really forbidden, but due to the high requirements of the methane content, the processing of landfill gas to the required quality would be difficult.

29
Switzerland is the only country where is it possible to inject biogas, which is not conform the specifications for the calorific value. However, this is only applicable to the transport network and under the condition that there is sufficient mixing with the fossil natural gas (Perspectives for biogas in Europe; ng 70, December 2012).
Biomethane as vehicle fuel For some countries, any or only a minor part of upgraded biogas is used as vehicle fuel. For others the most common utilisation pathway for biomethane is the use in the transport sector.
Sweden leads the way, as the main driver for biomethane production is the renewable target in the transport sector. The ambition is to have a fossil fuel free vehicle fleet in 2030.
European countries that have rather important part of biomethane as fuel transport are Finland, Italy and Spain. In other parts of the world, South Korea, Japan and Thailand are rather active in this field.
Energy crops and synthetic natural gas production Besides biogas production from landfill biogas, waste water treatment or all kind of waste, some forerunner countries are aiming to use energy crops and wood based SNG.
European agricultural biogases are spurred by energy crops. That enables farm holdings to reduce their energy dependency and diversify their incomes in the event of falling cereal, milk or meat prices.
On 28 July 2014, the European Commission published a working document on the sustainability of solid and gaseous biomass used for electricity, heating and cooling (European_Commission, 28 July 2014). In the section on biogas, the report highlighted the environmental issues stemming from the use of energy crops and encouraged the use of a higher percentage of manure, slurry and other organic waste to improve the greenhouse gas emission performance of biogas installations. Bio-SNG made from wood start gaining some importance in Western Europe. Some development initiatives in this sector are taking place.
Tunisia is also interested on energy crops (Jatropha or Pourghère), as this plantation will not compete with food and forest, and the treated waste water will be used for irrigation.

30
Sustainability: Economy, environment and society
Can biomass for energy be sustainable? For every product it is important to minimize any negative environmental and social aspect. Renewable gas is no exception to that rule. Aspects that should be addressed are land usage, water usage, fertilizer usage, energy usage, carbon footprint and employability. In the process of renewable gas production, each step should be considered.
Local conditions for growing biomass differ. Therefore, the results of the discussion about these sustainability aspects of the production, distribution and use of renewable gas may differ because of local conditions.
In the International Standardisation Organisation (ISO) work is being carried out to standardize these kind of international criteria for bioenergy. This work is being carried out in ISO/PC248 and will result in standard ISO 13065. The purpose of this standard is to explain and calculate criteria and indicators, without being normative in themselves. This standard is expected in 2015.
The so-called “Cramer criteria” are general guidelines that form a framework for the discussion on the production of biomass for energy.
The greenhouse gas balance of the production chain and application of the biomass must be positive;
Biomass production must not be at the expense of important carbon sinks in the vegetation and in the soil;
The production of biomass for energy must not endanger the food supply and local biomass applications (energy supply, medicines and building materials);
Biomass production must not affect protected or vulnerable biodiversity and will, where possible, have to strengthen biodiversity;
In the production and processing of biomass the soil and the soil quality are retained or improved;
In the production and processing of biomass ground and surface water must not be depleted and the water quality must be maintained or improved;
In the production and processing of biomass the air quality must be maintained or improved;
The production of biomass must contribute towards local prosperity; The production of biomass must contribute towards the social well-being of the
employees and the local population.
An alternative approach is to use the set of twenty-four sustainability indicators for bioenergy, as drafted by the Global Bioenergy Partnership (GBEP) and given in Table 5.

31
THEMES
Environmental Social Economic
INDICATORS
Lifecycle GHG emissions Allocation and tenure of land for new bioenergy production
Productivity
Soil quality Price and supply of a national food basket
Net energy balance
Harvest levels of wood resources
Change in income Gross value added
Emissions of non-GHG air pollutants, including air toxics
Jobs in the bioenergy sector Change in consumption of fossil fuels and traditional use of biomass
Water use and efficiency Change in unpaid time spent by women and children collecting biomass
Training and requalification of the workforce
Water quality Bioenergy used to expand access to modern energy services
Energy diversity
Biological diversity in the landscape
Change in mortality and burden of disease attributable to indoor smoke
Infrastructure and logistics for distribution of bioenergy
Land use and land use change related to bioenergy feedstock production
Incidence of occupational injury, illness and fatalities
Capacity and flexibility of use of bioenergy
Table 5: Sustainability indicators drafted by the Global Bioenergy Partnership
Economic aspects
The economic value of biogas and biomethane The value of biogas and biomethane is determined by the application. If all the power and heat can be used on the production location itself, then direct use of the biogas is most likely the best value for money. In other circumstances, the location of the biogas production in relation to the possible ways of use determines the optimal solution. Because of the large differences around the world in costs for infrastructure and value of energy, it is impossible to give a general “best” solution. But some general rules can be used.
Most production facilities are located in areas without local gas demand. In those cases, generating power is the usual solution, although it results in the lowest energetic value if the heat cannot be used as well.
When there is use for the heat (or cold, by applying trigeneration) on a location that can economically be reached by a pipeline, it is worth considering piping the biogas to that location and produce the power and heat/cold there. In a situation with only one producer and one user, there is no need for upgrading the biogas other than making it transportable (by drying and filtering out hazardous or corrosive components). When there are more users, or even more producers, it is worthwhile to consider a biogas grid. The composition of the biogas should be better defined and agreed upon by more parties, and it gives more flexibility in the system (see also p. 38 on Rural areas and renewable gas). A natural gas grid could be the back-up for providing security of supply.

32
If there is a natural gas grid available, by which many users can be reached, upgrading the biogas to biomethane and feeding it into the natural gas grid is a useful option.
In some countries, transport fuel is the most valuable form of energy. Compressing or cooling biogas to CBG or LBG opens this high-end market of mobility. Although the investments are higher, the product value might be worth the effort.
Carbon trading can bring money for projects that reduce emissions. In all cases, one should investigate the taxes and subsidies that are in place for renewable energy. These political financial instruments most likely determine the most profitable solution. However, subsidies and taxation exceptions are not sustainable in the long run. They might be valid for the specific project, but in the end the production of renewable energy should be a self-sustaining sector of industry.
Turning waste into money One of the great advantages of producing biogas is that it is a way of turning waste into money. Waste in the sense of municipal waste or sewage, leftovers from agriculture or forestry, manure, residual products from the food industry and so on. Waste that had to be disposed of, is becoming feedstock for energy.
The costs involved in handling the waste, are not needed anymore and can be added to the business case of the renewable gas.
The residual products from the digestion or gasification processes, can often be used in other processes again, creating added value. For example, if local regulations allow, the digestate can be used as fertilizer. As additional advantage, this reduces the amount of pesticides needed.
With valuable partnerships waste handling, energy production and utilization of fertilizers can bring valuable business. This idea is called circular economy and it can be used for branding biogas in a new and interesting way.
Stimulating local economy Many studies performed on the introduction of biogas in developing countries show that it results in a new local economy. It creates opportunities for new entrepreneurs, money is circulating locally from end-user to distributor and to producer, leading to local investments and jobs. Jobs can be created in harvesting energy crops, in building and operating production facilities and infrastructure, in selling and maintaining biogas appliances or in providing additional services.
And this is not only valid for developing countries. The examples of Denmark and Germany, who invested hugely in decentralized renewable energy, show that biogas is a multifunctional technology, providing quantifiable benefits for agriculture, food industry, energy production and the overall society and is a very competitive tool in GHG reduction. In 2011, in Germany, were over 7.000 operational biogas projects with a total installed capacity of around 3.000 MWel. More than 60.000 people were working in the biogas industry. In Denmark, in 2010, almost 106.000 people were employed in green production. The turnover was more than 45 billion US dollar.

33
Non-financial credits Some economic potentials are harder to value. For instance, when a landfill is turned into a source for landfill gas, the area around is gaining worth because of the decrease of smell and hinder. The landfill itself might even become a recreational area. On a smaller scale this is true also for the processing of manure or agricultural waste. Instead of open digestion or composting with all its emissions, the manure or waste is processed in a closed environment.
The costs All these aspects of the value of biogas and biomethane should cover the costs. Most of these costs vary hugely over the world, making it difficult to give general statements. Costs are country specific, and in many cases even project specific. On a generic scale, costs can be divided in four main parts.
The first part of the cost is in growing biomass. This includes land prices and land use, the labour costs and necessary agricultural equipment. When waste is used, one should be aware that when waste becomes a feedstock, it will have a value when it has to be purchased.
The second part is in the transport of biomass to the production location of the biogas. Because of the costs of transport, most biogas production locations are built on the biomass production site.
The third part is about the biogas or biomethane production itself. The production units range from robust rural digesters costing several thousands of dollars to industrial installations, looking like small chemical plants, costing over a million dollars.
The fourth part of the costs is about bringing the biogas to the customers. Usually this is done by a single pipe line or distribution grid, in costs comparable to natural gas pipelines. In case of upgrading to biomethane, these upgrading costs should be added to the total costs.
The optimisation of the total cost of transporting biomass, producing renewable gas and bringing the renewable gas to the end users lead to a large variety of configurations.
Changing the energy markets Introducing biogas or biomethane has impact on the energy market. Because of the wider mix of energy sources available, it leads to an increase in the security of supply. Especially countries that are now dependent upon import of energy can become less dependent. Even if renewable gas can not fulfil the total demand, it brings price flexibility because it is an alternative to imported energy.
The other effect of having more choice is that customers will be more in the lead. No more supplier push from the large fossil energy oriented gas producers, but customer influence on the energy mix.
Barriers for commercialization The are many barriers for commercialization of biogas – especially in the small scale production. At least the following barriers can be listed:
Difficulties related to startup operations and business development ;
Lack of market knowledge;
Lack of financing;

34
Lack of capable human resources (e.g. marketing and sales);
Non-consistent subsidies.
Biogas can be sold to different customer segments and sometimes it might be difficult to decide what customer segment would be the most profitable. Often this is based upon subsidy or tax schemes, whereby the outlook of these instruments is too short for the long payback times of the investments. In different segments biogas is competing with different fuels, which affect the competitive advantage of biogas.
Environmental aspects
Greenhouse gas emissions
One of the most obvious reasons to use bio-energy is the decreasing effect on greenhouse gas emissions compared to fossil fuels. However, quantifying that effect is rather complex. In the IPCC Special Report on Renewable Energy Sources and Climate Change Mitigation (Chum_H._et_al, 2011) it is described as follows: “As part of cascading cycles, many processes create multiple products; for example, biomass is used to produce biomaterials while co-products and the biomaterial itself are used for energy after their useful life. Such cascading results in significant data and methodological challenges because environmental effects can be distributed over several decades and in different geographical locations.” Key issues for bioenergy LCA are therefore the system definition and the methods for considering energy and material flows across system boundaries.
Having said this, the IPCC Special Report comes up with the following graph (Figure 7):
Figure 7: Ranges of GHG emissions per unit energy output (MJ) from major modern bioenergy chains
It is clear that all bioenergy sources emit less GHG than the fossil alternatives.

35
Existing LCA studies
Life cycle assessment (LCA) is one of the methodologies than can be used to evaluate ecological sustainability of the product. There are numerous LCA studies made for different biogas and biomethane production technologies. In life cycle assessment (LCA) and environmental/carbon footprint analysis raw materials, energy consumption, CO2 emissions and other environmental burdens have to be allocated to different products. Gonzalez et al. (Application of thermoeconomics to the allocation of environmental loads in the life cycle assessment of cogeneration plants, 2003) stated that the allocation of environmental loads in processes with several useful products (co-products) is one of the most important and frequent methodological problems to be tackled when carrying out the life cycle inventory. This is one main reason why different LCAs give different results.
Some of the LCA studies are referred below:
According to German Energy Agency, dena (dena, 2010) the well-to-wheel (WTW) study prepared by the CONCAWE (CONCAWE_et_al., 2007) shows that manure-based biomethane can achieve a greenhouse gas emission reduction up to 97 percent in comparison with gasoline engine (Figure 8). This reduction is at the same level with the electric vehicle using wind power.
Figure 8: WTW greenhouse gas emissions for different fuels (dena, 2010 & CONCAWE, 2007)
Börjesson & Mattiasson (Biogas as a resource-efficient vehicle fuel, 2007) concluded that biogas often has several environmental and resource-efficiency-related advantages compared with other biomass-based vehicle fuels available so far. The study shows that liquid manure-based biogas has dual greenhouse gas benefit: the reduction of spontaneous methane emissions from the storage of liquid manure and the reduction of CO2 emissions when replacing fossil fuels. In theory, the total reduction of greenhouse gases could amount to 180 per cent.

36
Bordelanne et al. (Biomethane CNG hybrid: A reduction by more than 80% of the greenhouse gases emissions compared to gasoline, 2011) shows that the vehicle using waste-based biomethane can reduce greenhouse gas, over the course of the life cycle, emission reduction by more than 80 per cent compared to a gasoline vehicle. In the case of the Toyota Prius CNG Hybrid prototype fuelled by biomethane the emission reduction was 87 per cent.
Uusitalo et al. (Carbon footprint of selected biomass to biogas production chains and GHG reduction potential in transportation use) studied the carbon footprint of selected biomass to biogas production chains and GHG reduction potential in transportation use based on the LCA methodology. Three different raw materials of biogas production were studied: biowaste, waste water treatment plant (WWTP) sludge and agricultural biomass. The greenhouse gas emission reductions compared to fossil fuel varied from 49 percent to 84 percent (biowaste 71-83 per cent; WWTP 49-84 per cent; agricultural biomass 65-72 per cent). The highest emission reductions can be achieved if part of the greenhouse gas emissions can be allocated for digestive.
Manninen et al. (The applicability of the renewable energy directive calculation to assess the sustainability of biogas production)used LCA to determine the climate change impacts of biogas production systems. The studied system includes the biogas reactor producing raw biogas, upgrading to biomethane, reject water refinement and waste water treatment. Biomethane is distributed to the refuelling station and used as a vehicle fuel. In this study, climate change impacts of biogas production were calculated by using two different methodologies e.g. allocation of emissions based on a product’s and co-product’s energy content according to the Renewable Energy Directive (RED), or substitution by system expansion without allocation according to the ISO14040 standard. The substitution approach takes into account the avoided emissions of the production of chemical fertilizers when the solid fraction and reject water generated in the biogas production is used as fertilizers. The study shows that RED allocation approach and substitution approach produce different emission estimates. In addition the calculation rules, whether the solid fraction and reject water are classified as co-product or processing residue and whether interlink exists between the reject water refining process and the biogas production or not, affect the achieved emission savings. In the case where solid fraction and reject water are classified as processing residue, all the emissions are allocated to biogas. In that case, the emissions are not differing much from those based on the substitution approach, and the emission reduction is 42 per cent compared to fossil petrol and diesel used as a traffic fuel. In other cases based on RED approach, the emission reduction varies between 66 and 80 per cent. The current emission saving target (35 per cent) is attained in all cases but the emission reduction of 42 per cent is below the target for the year 2018 (60 per cent).
Niskanen (Niskanen, 2012) studied the energy efficiency and greenhouse gas emissions emitted during the wood based biomethane (bio-SNG) production chain. The studied production chain consisted of harvesting, transporting and preparing forest biomass, bio-SNG production in a biorefinery, transportation of bio-SNG via a pipeline and end use. Greenhouse gas emissions over the bio-SNG production chain were calculated according to the principles presented by the EU in the Renewable Energy Sources Directive. The reduction in greenhouse gas emissions was compared with the fossil reference fuel in transport use (diesel) and with natural gas. The results show that as a transport biofuel, the greenhouse gas reduction is 93 % compared with diesel and 91 % compared with natural gas. Bio-SNG therefore clearly fulfils the sustainability criteria of
37
greenhouse gas reductions set by the EU, i.e. at least a 60 % emission reduction for biofuel and bioliquid production that starts on or after 1 January 2017.
Based on the LCA studies referred here the greenhouse gas emission reduction of biomethane in transportation use varies between 42 and 180 per cent and in the most cases between 80 and 90 per cent.
Circular economy
Since the industrial revolution, the amount of waste has constantly grown. This is because our economies have used a “take-make-consume and dispose” pattern of growth – a linear model which assumes that resources are abundant, available and cheap to dispose of. The World Economic Forum estimates that 80 per cent of the US$ 3.2 trillion value of the global consumer goods sector is lost irrecoverably each year due to this wasteful model.
What is needed is a more circular economy. This means re-using, repairing, refurbishing and recycling existing materials and products. What used to be regarded as ‘waste’ can be turned into a resource. All resources need to be managed more efficiently throughout their life cycle.
Turning into a more circular economy means:
boosting recycling and preventing the loss of valuable materials;
creating jobs and economic growth;
showing how new business models, eco-design and industrial symbiosis can
move us towards zero-waste;
reducing greenhouse emissions and environmental impacts.
The global middle class is projected to grow to nearly 5 billion people by 2030 and almost two thirds of this new middle class will be in Asia. Therefore Peter Lacy, managing director of Accenture’s Asia Pacific Strategy and Sustainability Services, believes that the circular economy will not only help manage the challenges of rapidly growing Asia, but also holds trillions of dollars of opportunities for companies (Eco-Business, 2015).
The European Union adopted the communication “Towards a circular economy: A zero waste programme for Europe” (THE COMMISSION, 2014). The EU expects net savings up to EUR 600 billion, while also reducing total annual greenhouse gas emissions. Additional measures to increase resource productivity by 30% by 2030 could boost GDP by nearly 1%, while creating 2 million additional jobs.
Energy crops
Energy crops are plants grown to produce biofuels or to be combusted or digested for its energy content. Woody crops such as willow or poplar as well as grasses such as Miscanthus are widely used to produce heat and/or power. To produce biogas, one often sees the use of maize or Sorghum.
The first generation of energy crops was directly competing with food production. It gave the highest amount of energy per area, but was often also correlated to improper land use. The so-called second generation are crops where the energy is produced from the residual products of the agricultural process. It is therefore not competing with food production, but gives extra value to the crops. Nowadays, more and more research is

38
being done in third generation energy crops, which are specially grown crops that do not compete with food production, like algae.
Deforestation
In many developing countries, heating and cooking are dependent upon the use of firewood. As a result, deforestation is a problem, leading to worse soil quality and long distances to be walked to find firewood at all. Using biogas for heating and cooking helps to make good use of the soil and stop deforestation.
The main residual component of anaerobic digestion, the so-called digestate, is actually a high-quality organic fertilizer with higher nitrogen content then composted manure.
Social aspects
Glocalization Is sustainable thinking the new standard for living? In many industrialized countries we see that the younger generation thinks differently about money, income and ownership than the older generation. The focus is not so much on ‘having’ goods, as it is on ‘using’ goods. As an example, transport is not about owning a car, but about going to interesting places. A house is not necessarily a place you want to own, but a place to live and where you feel comfortable. A temporary place to stay which suits your needs and feelings of that period of your life. We see new social networks coming up in neighbourhoods where (mainly the young people) share goods that they use only a few times a year, and where they use communal space together for growing vegetables or building and maintaining their self-build playground. This leads to changing requirements about these houses and apartments.
There is higher need for energy-neutral or low-energy houses. People want solar panels on their roofs, well isolated walls and windows, and minimal use of energy, which should be as green as possible. People are willing to spend time in making small-scale circular economies possible. This all leads to a trend of small, local and self-supporting. A kind of counter movement against globalization. This form of glocalization is a way to connect the global issues of welfare, peace or climate to local actions with direct influence on your personal life.
In this trend, the use of local energy made from biomass, is a good fit. It bridges the gap between the traditional world of the gas industry and the needs for sustainable living.
Rural areas and renewable gas Traditional sources of fuel are used to meet the daily energy needs of many people. The use of charcoal and fuel wood is exhausting natural resources and degrading productive land, while their availability is declining against the demand of growing world population.
Nowadays, energy development is largely focusing on large-scale infrastructure and the urban population. As a result, domestic small-scale renewable energy supply for cooking, heating and enterprises, especially targeting rural areas, has received little attention and support.
Yet globally over 1.3 billion people are without access to electricity and 2.7 billion people are without clean cooking facilities. More than 95% of these people are either in sub-Saharan Africa or developing Asia and 84% are in rural areas.

39
By introducing renewable gas, the gas industry will be able to help local communities. The availability of (electrical) energy makes an enormous difference in the development of the region.
Investments in domestic biogas plants can be lower than thousand euro, based upon around 20 kg of manure a day. Rough estimates are that there are more than 10 million of these small scale plants installed globally and growth rates are high. Especially in China and India this is a fully developed industry.
A typical local lay-out could be such that the local renewable gases are the main input for the energy demand of the community, backed up by natural gas from the transport grid. On a local scale, electricity, heat and cold are produced. This deems it unnecessary to build long, expensive, high voltage lines through the landscape.
Figure 9: Local energy grid based upon renewable sources, with natural gas as back-up fuel
One of the advantages is that investments are relatively small and lead-times for development can be short. Building a basic local energy grid can be performed without having to wait for connection to the transport grid of gas or electricity.
Employment and knowledge transfer Growing biomass, transporting biomass to the biogas production location, operating the digester, building and operating the biogas or biomethane pipelines and installing and maintaining industrial and residential appliances, all give local opportunities for employability. The necessary skills are either agricultural, technical or financial, giving diverse opportunities for both basic-skilled and highly educated people.

40
The knowledge obtained can be used in relation to other activities. For example the improved agricultural knowledge helps producing food while maintaining good soil and water quality, technical knowledge helps other industrial developments, financial skills can be used in any business.
Improved indoor air quality when replacing firewood or kerosene One of the largest health issues in the developing countries is caused by bad indoor air quality because of using firewood or kerosene without good ventilation. Estimations are that about 3,5 million people a year die because of this, and that many more suffer from respiratory illness, eye infection, asthma and lung problems.
The use of biogas (or biomethane or natural gas) can make a huge difference in indoor air quality. An additional advantage is the reduced time necessary for gathering firewood.
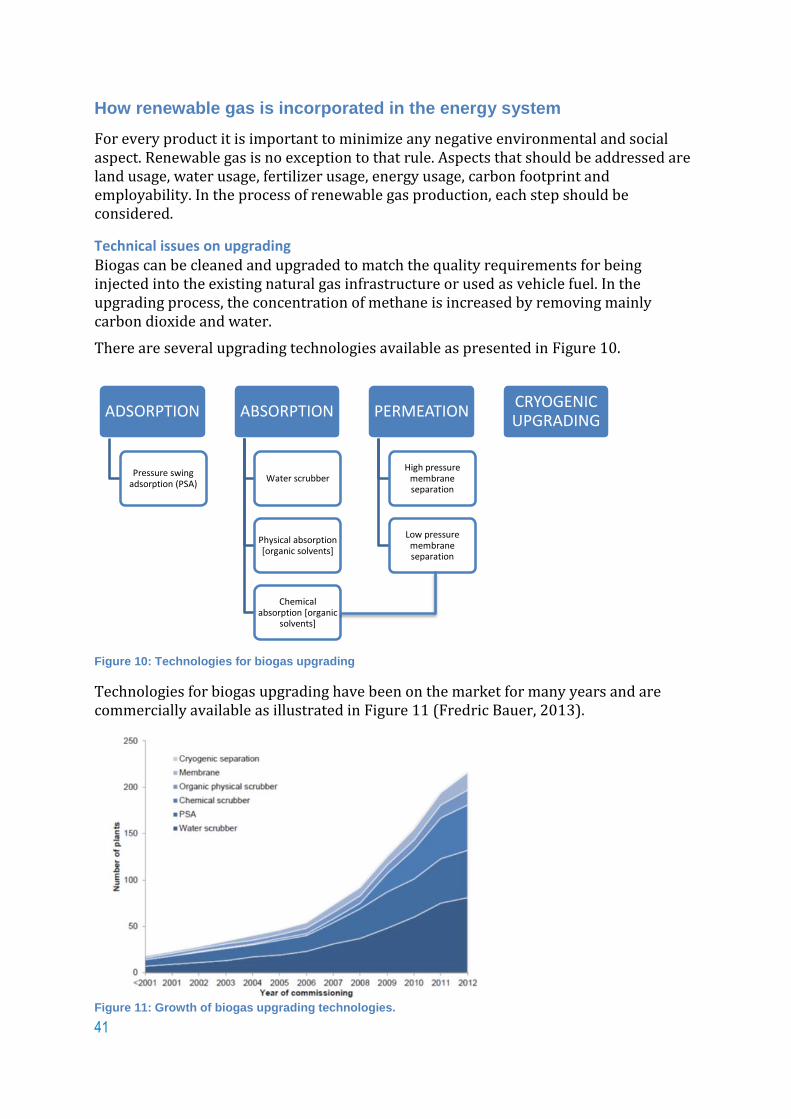
41
How renewable gas is incorporated in the energy system
For every product it is important to minimize any negative environmental and social aspect. Renewable gas is no exception to that rule. Aspects that should be addressed are land usage, water usage, fertilizer usage, energy usage, carbon footprint and employability. In the process of renewable gas production, each step should be considered.
Technical issues on upgrading Biogas can be cleaned and upgraded to match the quality requirements for being injected into the existing natural gas infrastructure or used as vehicle fuel. In the upgrading process, the concentration of methane is increased by removing mainly carbon dioxide and water.
There are several upgrading technologies available as presented in Figure 10.
Figure 10: Technologies for biogas upgrading
Technologies for biogas upgrading have been on the market for many years and are commercially available as illustrated in Figure 11 (Fredric Bauer, 2013).
Figure 11: Growth of biogas upgrading technologies.
ADSORPTION
Pressure swing adsorption (PSA)
ABSORPTION
Water scrubber
Physical absorption [organic solvents]
Chemical absorption [organic
solvents]
PERMEATION
High pressure membrane separation
Low pressure membrane separation
CRYOGENIC UPGRADING

42
The upgrading process is not the only process biogas must undergo in order to obtain the required gas quality. Sulphur, siloxanes and other undesired trace components in the biogas must be removed before the gas can be injected into the gas grid or be used as vehicle fuel. Furthermore, the gas must be dried, odorized and compressed to the desired pressured level.
The different upgrading technologies are shortly explained in the following paragraphs.
PSA – Pressure Swing Adsorption PSA is short for Pressure Swing Adsorption. A PSA plant removes CO2 from methane by adsorption on solid materials such as zeolites or active carbon at elevated pressure.
A PSA plant consists of typically 4-6 vessels in parallel containing adsorbent material. Each vessel operates in four different phases: adsorption, pressure reduction, regeneration and pressure build-up. During the adsorption phase the compressed biogas enters at the bottom of the vessel. While the gas flows up through the vessel CO2 is absorbed, and O2 and N2 are to a minor extent adsorbed on the surface of the adsorbent material. The gas passing by the adsorbent material contains around 95-98 % methane. Just before the adsorbent material is saturated with CO2 the non-upgraded biogas is lead to a vessel with regenerated adsorbent material. The vessel with the saturated adsorbent material is subsequently regenerated. This is achieved by stepwise depressurisation of the vessel. The gas released from the first pressure reduction contains some methane and is therefore returned to incoming flow of raw biogas. The gas released from the last pressure reduction contains primarily CO2, but still some methane, which is the cause of the methane losses from PSA upgrading plants.
Figure 12: Process diagram for a PSA unit
Not only CO2 but also H2S is adsorbed in PSA plants. As opposed to CO2 the H2S is not released again during regeneration. Therefore, H2S must be removed from the raw biogas before it is led to the PSA plant. The biogas must be dried before upgrading by PSA.
The 2-step PSA-process is able to remove nitrogen. Thus it can be used for upgrading landfill gas.
Pressurised water scrubbing (PWS) The upgrading by means of pressurised water scrubbing is based on the difference in solubility of CH4 and CO2 in water, and that the solubility improves at increasing
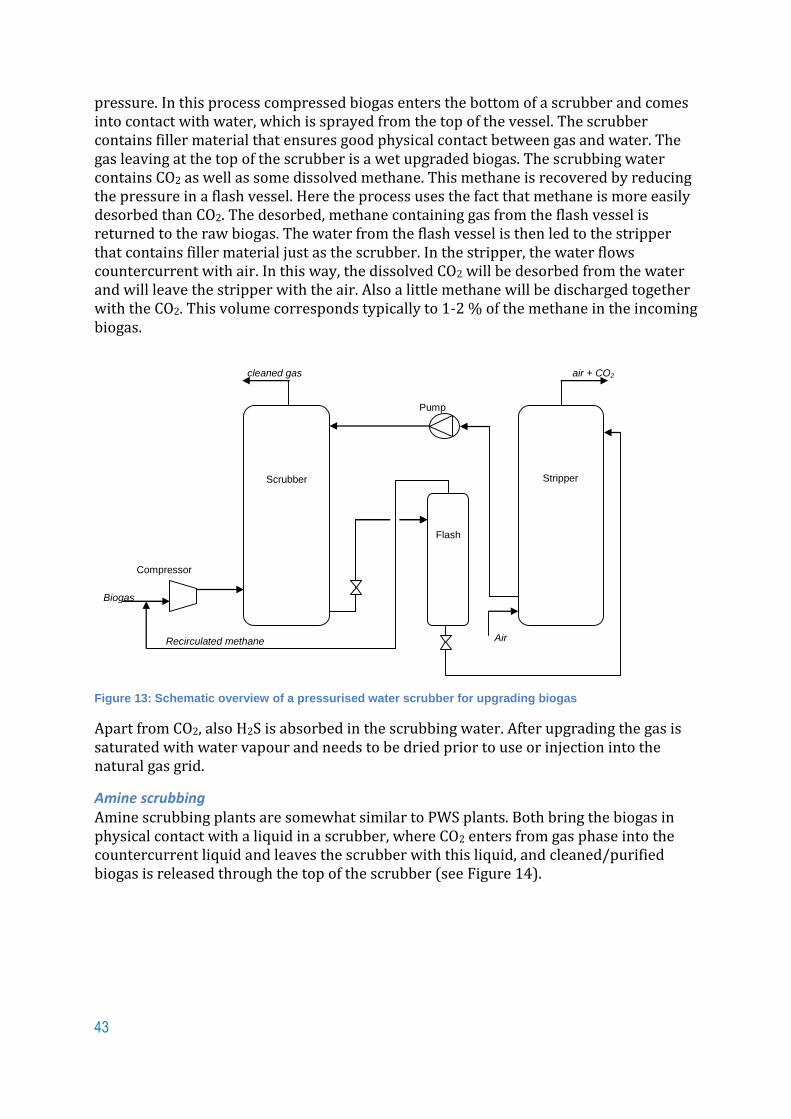
43
pressure. In this process compressed biogas enters the bottom of a scrubber and comes into contact with water, which is sprayed from the top of the vessel. The scrubber contains filler material that ensures good physical contact between gas and water. The gas leaving at the top of the scrubber is a wet upgraded biogas. The scrubbing water contains CO2 as well as some dissolved methane. This methane is recovered by reducing the pressure in a flash vessel. Here the process uses the fact that methane is more easily desorbed than CO2. The desorbed, methane containing gas from the flash vessel is returned to the raw biogas. The water from the flash vessel is then led to the stripper that contains filler material just as the scrubber. In the stripper, the water flows countercurrent with air. In this way, the dissolved CO2 will be desorbed from the water and will leave the stripper with the air. Also a little methane will be discharged together with the CO2. This volume corresponds typically to 1-2 % of the methane in the incoming biogas.
Figure 13: Schematic overview of a pressurised water scrubber for upgrading biogas
Apart from CO2, also H2S is absorbed in the scrubbing water. After upgrading the gas is saturated with water vapour and needs to be dried prior to use or injection into the natural gas grid.
Amine scrubbing Amine scrubbing plants are somewhat similar to PWS plants. Both bring the biogas in physical contact with a liquid in a scrubber, where CO2 enters from gas phase into the countercurrent liquid and leaves the scrubber with this liquid, and cleaned/purified biogas is released through the top of the scrubber (see Figure 14).
Scrubber
(Absorption)
Compressor
Biogas
Stripper
(Desorption)
Flash
Air Recirculated methane
cleaned gas air + CO2
Pump

44
Figure 14: Schematic overview of an amine scrubbing plant
As opposed to PWS plants, where CO2 is dissolved in water, the amine scrubbing process includes an actual chemical reaction between the circulating liquid and the present CO2. The stripper increases the temperature of the circulating liquid, resulting in the discharge of the captured CO2.
This technology not only removes CO2, but also other acidic components like H2S and COS.
Amine scrubber plants are normally running at atmospheric pressure. This means that compression, and thus electricity consumption, is low compared to PSA and PWS plants. Methane loss is very low for this technology (DGC).
Membranes Membrane separation is based on the difference in the rates of permeation for different compounds through a thin membrane barrier. By means of semi-permeable membranes methane can be separated from carbon dioxide. The driving force can be a pressure difference, a concentration gradient or an electrical potential difference. Dry membranes, typically used, are permeable for to carbon dioxide, water and ammonia.
Figure 15: Typical design for a biogas upgrading based on membrane separation (Fredric Bauer, 2013)
Cryogenic separation Cryogenic upgrading technologies use the distinct boiling points of the different gases to separate them from methane. By cooling down the gas, trace gases and carbon dioxide are removed in various temperature steps. The remaining methane can be cooled down to liquid biogas (LBG).
Blower
Scrubber
Biogas
Cleaned gas
Køler
Stripper
Heat
CO2
Cooler
Heat exchanger
Cooler
Pumps

45
Organic physical scrubber Organic physical scrubbers use a process very similar to pressurized water scrubbing. The solubility of carbon dioxide is much higher in the organic solvent than in water. This decreases the amount of solvent that has to be circulated in the system. Diameters of the columns are smaller than in the water scrubber.
Figure 16: A simplified flow diagram of an organic physical scrubber unit (Fredric Bauer, 2013)
Comparison of different upgrading technologies. Energy demand of different upgrading technologies varies (see Figure 17). Every process requires electric power. Amine scrubber uses the least amount of power, but it has significant heat demand which is illustrated by the grey bar (Fredric Bauer, 2013).
Figure 17: Energy demand of different upgrading technologies
Specific investment cost for upgrading units declines rapidly as the capacity increases (see Figure 18).

46
Figure 18: Specific investment cost as a function of the capacity
Best practices
Technology
Biogas and biomethane production and use vary widely across the world, according to each country needs and specificity.
Small scale biogas plants
Domestic biogas plants are a proven and established technology in many parts of the world, especially Asian countries that are often taken as reference cases for biogas development in other countries.
The dissemination of the digesters was made possible in Asia by the development of a tried and tested technology combined with a successful implementation strategy involving households, government services, non-governmental organisations, the private sector and external financing.
Some key factors which led to the success of this technology:
Good technical knowledge;
After sale service;
A designed ownership of the project;
Responsibilities clearly defined;
The technology sized and compatible with organic materials on site.;
Subsidies for biogas digesters.
The perfect example in Africa is the prebuilt biogas system which is manufactured and sold in South Africa. Its success is due to the adaptation to local population with low skills and requiring quick installation.
Centralised upgrading of biogas from small scale plants
The cost of upgrading biogas to biomethane basically depends on the size of the plant. Economics calculations show that the upgrading of biogas to biomethane can be profitable when at least 500 Nm³ raw gas per hour can be used
47
(IEA_Bioenergy_40_and_task_37, September 2014). However, from the economic point of view, even larger plants are of more interest because scale effects can be achieved by central upgrading and linking different biogas producers to one upgrading installation. Projects can be directed at sites where there is insufficient waste heat utilisation. This is a perspective for France but other countries have already started using this technique.
In Panama in Brazil, 33 small scale family farms inject raw biogas into a 22 km long pipeline to a central location to produce either electricity and heat or to be upgraded to biomethane.
Landwärme GmbH in Germany has already 7 plants with on-site biogas utilisation modified to upgrading plants and about 15 biogas plants are currently in planning.
In Biogas Bralanda in Sweden, 4 farms inject raw biogas in pipelines to an upgrading unit. From there, the biomethane fuel gas is distributed through a pipeline to the fuelling station in Bralanda. Here vehicle gas is put into larger tanks for distribution to a public filling station nearby or to other parts of the country.
Biomethane transportation outside the grid – the Swedish case
Sweden is today world-leading in both using biomethane as automotive fuel and in transporting it outside the gas grid. The gas grid coverage is limited and restricted to only one part of the country and grid expansion is limited by the low population density. For the use of biomethane as automotive fuel, biomethane is mainly transported in compressed state in mobile storage units but also in liquefied state and in local gas grids.
Upgrading technology
The Netherlands gained considerable experience with biogas upgrading from different sources such as landfill gas, sewage gas, gas derived from biowaste and industrial waste and from agriculture biomass. All these biomethane plants are injecting into natural gas grid. Unlike other countries, the Netherlands has extensive experience with upgrading landfill gas to natural gas quality.
During the last decades, Dutch companies have made their contribution to improving upgrading technologies and today are important players and technology suppliers throughout the European biomethane market (Green_Gas_Grids, March 2012).
Standardization
To set up common standards and strengthen the European statutory framework to set up biomethane market, several actions are under way.
Six national biomethane registers (in Austria, Denmark, France, Germany, Switzerland and the UK), are cooperating to set up common standards and strengthen the European statutory framework to set up this market. The aim is compatibility between national registers and mutual acceptance and recognition of biomethane guarantees of origin (see also p. 49 on Establishing green certificates).
South-Eastern Europe, a coordination committee South Eastern Europe, Bosnia and Herzegovina, Croatia, Serbia, Montenegro and the FYR of Macedonia, is thoroughly preparing and adapting the DVGW Codes of Practice to regional requirements in the area of biogas production and injection into gas grids.

48
Currently, two standards for grid injection and automotive specification are under development at European level and might be passed by the end of 2015 (prEN 16723-1 and -2).
In regard to the integration of biogas in the transport sector, the Swedish example is the most successful. Sweden is one of the few countries in the world with a national standard for biogas as vehicle fuel. The standard Swedish Standard (SS) 155438 “Motor Fuels – Biogas as fuel for high-speed Otto engines” was established in 1999, and used ad hoc for grid injection cases.
Another alternative outside the EU can be found in South Korea with similar conditions as in Sweden (IEA_Bioenergy_40_and_task_37, September 2014).
Regulatory aspect
The German legislation has simplified the overall procedure for small to large scale plants. This includes the involvement on one or only few authorities, in contrast to other countries in which the investor has to contact many different authorities. Furthermore, the duration of the permitting process is short.
The prioritization of (small to medium) biogas plants in rural areas (Federal Building Code - BauGB), as well as the procedure under the BimSchG (Federal Immission Control Act) for larger plants, acting as an umbrella law, has contributed to the success of the German biogas market (IEEE_WP_3.1.1_EBA, December 2010).
Governmental support Government support is common for promoting the production of renewable energy. They are common in many countries and allow the producers to compete with the fossil fuel production which is normally cheaper. In areas which have a high price of LPG and where biogas can be used for cooking gas biogas can compete.
The government economic policy has to be established in order to promote biogas usage in most countries. The most common and direct strategy is to provide subsidy which may attract a lot of investors to produce biogas in the country. Some countries also provide financial supports such as grants or loans for the investors to invest in a new biogas facility. Tax incentives are also provided for investors in many countries. Other than the financial support, many countries also introduce implementation programs such as feasibility study, technical information and loan arrangements.
The feed in tariff (FITs), used for electricity generation, is one of the simplest incentives. In some countries, incentive is given in form of adder which will be added to the normal electricity price. FITs and adders rates depend on the type of renewable energy sources used to produce electricity. The renewable heat incentives (RHI) are also introduced in some countries such as the UK to provide support for biogas used to produce heat. Normal period for FITs or RHI are 20 years.
Some incentive scheme examples are given in Table 6.

49
Country Output Feed in Tariff Adder
England (p/KWh)
Up to 250 kW 12.46
250 - 500 kW 11.52
500 kW-5000 kW 9.49
Ontario : on farm only (ct/kWh)
Up to 100 kW 19.5
100 - 250 kW 18.5
250 - 500 kW 16.0
500 kW - 10MW 14.7
>10 MW 10.4
Thailand (euro/kWh)
< 1kW 0.75
>= 1kW 1.25
Germany Landfill gas (€ct/kWh) Sewage gas (€ct/kWh)
up to 500 kW 8.47
up to 5 MW 5.8
up to 500 kW 6.69
up to 5 MW 5.8
Kenya (US cent /kWh)
8
Japan (Yen/kWh)
40.95
Table 6: Examples of incentive schemes
In Italy, there has been a huge expansion in biogas operations in the recent years caused by encouraging feed-in tariffs for electricity generated from biogas.
In Finland, there is a feed-in-tariff system that promotes the production of electricity from renewable sources of energy, including biogas. Alternatively, energy subsidies for biogas plant investments can be applied. In 2014, the investment support for biogas and biomethane projects is indicatively 20–30 per cent. Biogas and biomethane are exempted from the duty.
A recent trend has been for countries to provide subsidies to promote biogas upgrading for NG pipeline injection in cases where heat recovered after electricity generation is wasted due to lack of available market. The most telling example is Denmark, where most of the upgrading capacity was installed in 2014, as soon as the financial support to biomethane injected into the gas grid was approved by the EU in late December 2013, an additional five larger biogas plants are under construction.
Establishing green certificates
Clean Development Mechanism
The central feature of the Kyoto Protocol is its requirement that countries limit or reduce their greenhouse gas emissions. By setting such targets, emission reductions took on economic value. To help countries meet their emission targets, and to encourage the private sector and developing countries to contribute to emission reduction efforts, negotiators of the Protocol included three market-based mechanisms:

50
Emissions trading;
the Clean Development Mechanism (CDM);
Joint Implementation (JI).
The Clean Development Mechanism (CDM) allows emission-reduction projects in developing countries to earn certified emission reduction (CER) credits, each equivalent to one ton of CO2. These CERs can be traded and sold, and used by industrialized countries to a meet a part of their emission reduction targets under the Kyoto Protocol.
The mechanism stimulates sustainable development and emission reductions, while giving industrialized countries some flexibility in how they meet their emission reduction limitation targets (UNFCCC).
Guarantees of origin in Europe
Bio-methane certificates make it possible to separate the physical bio-methane product from its use. It offers consumers the opportunity to ‘green’ their activities by purchasing bio-methane without being physically connected to a bio-methane producer. The systems differ in the way they deal with sustainability.
Biomethane registers have been established in Austria (Biomethan Register), Denmark (Energinet), Germany (Biogasregister), Netherlands (Vertogas), Switzerland (VSG) and United Kingdom (Green Gas Certification Scheme). In addition, Gasum has developed a voluntary biogas certificate system and register in Finland that is used for a balance settlement of biogas in the natural gas transmission network.
The general idea behind these registers is that any producer of biomethane books his production in the register. The origin of the bio-methane and the quantity are verified by the registering organisation. When a consumer extracts gas from the grid that is labelled as biomethane, the quantities are subtracted from the register. This way, the biomethane can only be sold once. Germany and the Netherlands are discussing coupling of the systems, allowing cross-border trade.
So far, only the UK has developed a system whereby trading of these certificates is possible. In the UK, the Biomethane Certification Scheme (BMCS) has been set up. The trading platform is being developed by Green Gas Trading Limited to create a central marketplace, where buyers and sellers of BMCs can come together to transact. The platform is a trading exchange where buyers will post bids for BMCs which they wish to buy, and sellers will post offers for BMCs that they wish to offer for sale (Green Gas Trading).
Mobility The traditional use of natural gas is to provide power and heat. Next to that, there has always been a relatively small market for the use of natural gas in vehicles. Nowadays, the mobility market is in huge transformation whereby gasoline and diesel are losing market share to natural gas, biofuels and electricity. ‘Biofuels’ are defined as liquid or gaseous fuels for transport produced from biomass. According NGV Global, in 2013 there were more than 17 million vehicles running on natural gas worldwide (NGV_Global).
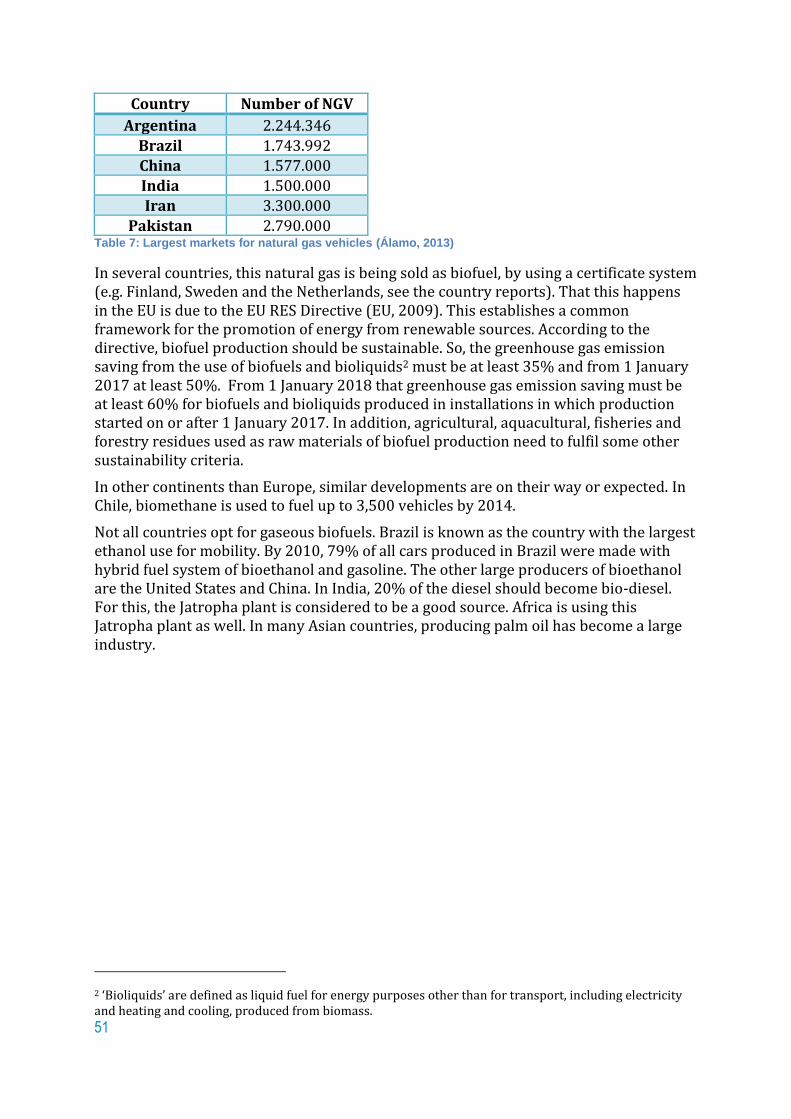
51
Country Number of NGV
Argentina 2.244.346
Brazil 1.743.992 China 1.577.000
India 1.500.000 Iran 3.300.000
Pakistan 2.790.000 Table 7: Largest markets for natural gas vehicles (Álamo, 2013)
In several countries, this natural gas is being sold as biofuel, by using a certificate system (e.g. Finland, Sweden and the Netherlands, see the country reports). That this happens in the EU is due to the EU RES Directive (EU, 2009). This establishes a common framework for the promotion of energy from renewable sources. According to the directive, biofuel production should be sustainable. So, the greenhouse gas emission saving from the use of biofuels and bioliquids2 must be at least 35% and from 1 January 2017 at least 50%. From 1 January 2018 that greenhouse gas emission saving must be at least 60% for biofuels and bioliquids produced in installations in which production started on or after 1 January 2017. In addition, agricultural, aquacultural, fisheries and forestry residues used as raw materials of biofuel production need to fulfil some other sustainability criteria.
In other continents than Europe, similar developments are on their way or expected. In Chile, biomethane is used to fuel up to 3,500 vehicles by 2014.
Not all countries opt for gaseous biofuels. Brazil is known as the country with the largest ethanol use for mobility. By 2010, 79% of all cars produced in Brazil were made with hybrid fuel system of bioethanol and gasoline. The other large producers of bioethanol are the United States and China. In India, 20% of the diesel should become bio-diesel. For this, the Jatropha plant is considered to be a good source. Africa is using this Jatropha plant as well. In many Asian countries, producing palm oil has become a large industry.
2 ‘Bioliquids’ are defined as liquid fuel for energy purposes other than for transport, including electricity and heating and cooling, produced from biomass.

52
Conclusions and recommendations
The energy mix during the 21st century is expected to be a mix of fossil fuels and renewable energy. The total amount of energy needed is growing and all forms of renewable energy are necessary to energize the world population. Nevertheless, during a very long period, fossil fuels and renewable energies will exist together. There will be an increase in interaction between the various energy sources, energy carriers and energy users. Natural gas is the ideal fuel to bring synergy in the system. Not only for renewable gases, but also for the additional back-up and storage facilities that are needed for solar and wind power.
Renewable gases will be, and have to be, part of het future energy mix and the natural gas industry is in the position to help this development. Renewable gas has the potential to make a significant contribution to the reduction of greenhouse gas emissions. It also helps to ensure security of supply by diversifying energy sources. For this, the gas industry will have to transform itself from a top-down industry to a customer-oriented industry.
Biogas is typically the solution for solitary energy production in countries without a developed natural gas grid and a high potential for growing biomass (like in SE Asia). Biomethane is typically developed in countries with a well-developed gas grid, like in Europe and N-America. In countries that are subsidizing the use of fossil fuels on a high scale (like many Arab Countries) there is no market for renewable gases, although the wish to diminish the quantities of waste and the environmental smell make some countries think about biogas use in their action plans.
To grow biomass and produce renewable gases in a sustainable way, the ‘Cramer-criteria’ or the sustainability indicators of the Global Bioenergy Partnership should be taken into account. In future, the ISO 13065 might be useful, but this has not been published yet. These criteria cover both the environmental, the economical and the social aspects of growing biomass and producing renewable gases. International cooperating to set up common standards for registering biomethane guarantees of origin is encouraged and deserve the support of the gas industry. The main residual component of anaerobic digestion, digestate, is a high-quality organic fertilizer and should be recognized as such.
The role of the gas industry should be to make feed-in of biomethane easier, instead of drafting difficult to reach quality standards that increase the price of upgrading to levels where projects are not feasible any more. Technological improvements to bring down the price of equipment are necessary, although anaerobic digestion is a well develop technology. Gasification needs further development to become market ready in most applications.
In all three fields of use: electricity production, heat production and transportation, the use of biomass as energy source decreases the greenhouse gases in comparison with the use of fossil fuels with 60 % to 80 %. The highest market value in many countries now is vehicle fuel.
To key to further improving the economic situation for biogas and biomethane is in the hands of the governments. The financial framework in which has to be operated should be stable and preferably internationally harmonized to prevent conflicting systems with

53
unwanted effects. Financing and market knowledge should be improved, both with the producers as with the governments.
Producing and distributing biogas and biomethane has become a new branch of employability. Knowledge transfer, both technically and financially, should be supported by the gas industry.

54
References Part A
Álamo, Jaime del. 2013. Worldwide NGVs & Refuelling Stations. [Online] 23 09 2013.
www.ngvaeurope.eu/worldwide-ngv-statistics.
Application of thermoeconomics to the allocation of environmental loads in the life cycle
assessment of cogeneration plants. González, A., Sala, J.M., Flores, I. and López, L.M.
2003. Energy 2003; 28: 557–574., 2003.
Biogas as a resource-efficient vehicle fuel. Börjesson P., Mattiasson B. 2007. sl : Trends in
Biotechnology. Vol. 26 No.1, 2007.
Biomethane CNG hybrid: A reduction by more than 80% of the greenhouse gases emissions
compared to gasoline. Bordelanne O., Montero M., Bravin F., Prieur-Vernat A., Oliveti-
Selmi O., Pierre H., Papadopoulo M., Muller T. 2011. sl : Journal of Natural Gas Science
and Engineering 3 (2011) 617-624, 2011.
Carbon footprint of selected biomass to biogas production chains and GHG reduction
potential in transportation use. Uusitalo V., Havukainen J., Manninen K., Höhn J.,
Lehtonen E., Rasi S. 2014 : Journal of Renewable Energy: 66 (2014) 90-98.
Chum_H._et_al. 2011. IPCC Special Report on Renewable Energy Sources and Climate
Change Mitigation; Bioenergy. Cambridge and New York : IPCC, 2011.
CONCAWE_et_al. 2007. Well-to-wheel analysis of future automotive fuels and powertrains
in the European context. sl :
http://ies.jrc.ec.europa.eu/uploads/media/WTW_Report_010307.pdf, 2007.
dena. 2010. The role of natural gas and biomethane in the fuel mix of the future in Germany.
Required action and potential solutions to accelerate adoption in transport applications.
Abridged version. sl : http://www.xebecinc.com/pdf/studie-the-role-of-natural-gas-and-
biomethane-in-the-fuel-mix-of-the-future-in-Germany.pdf, 2010.
DGC. Biogas tilnettet (Biogas for the grid). report R0904.
Eco-Business. 2015. circular-economys-trillion-dollar-opportunity. [http://www.eco-
business.com/news/circular-economys-trillion-dollar-opportunity/] sl : eco-business.com,
2015.
EU. 2009. Directive 2009/28/EC on the promotion of the use of energy from renewable
sources and amending and subsequently repealing Directives 2001/77/EC and 2003/30/EC.
2009.
Eurobserv'er. November 2014. Biogas barometer. November 2014.
European_Commission. 2013. EU renewable energy progress report 2013. sl : EU, 2013.
—. 28 July 2014. State of play on the sustainability of solid and gaseous biomass used for
electricity, heating and cooling in the EU. 28 July 2014. SWD(2014) 259 final.
Fredric Bauer, Christian Hulteberg, Tobias Persson, Daniel Tamm. 2013. Biogas
upgrading – Review of commercial technologies. sl : SGC Rapport 2013:270, 2013.

55
Green Gas Trading. Green Gas Trading. [Online] greengastrading.co.uk.
Green_Gas_Grids. March 2012. Overview of biomethane markets and regulations in
partner countries. March 2012.
IEA. 2012. Energy Technology Perspectives 2012, How to secure a clean energy future.
2012.
—. June 10, 2013. Redrawing the energy-climate map, WEO Special Report. June 10, 2013.
—. 2014. World Energy Outlook. 2014.
—. 2013. World Energy Outlook. 2013.
IEA_Bioenergy_40_and_task_37. September 2014. Biomethane status and factors
affecting market development and trade. September 2014.
IEEE_WP_3.1.1_EBA. December 2010. IEE project „BIOGASIN‟ permitting procedures for
biogas projects in Austria, Germany, Denmark, the Netherlands and Italy. December 2010.
IGU_PGC_A. 2012. Renewable gas: the sustainable energy solution. Kuala Lumpur :
International Gas Union, 2012.
IGU_WOC_5_TT_1. SEPTEMBER 5, 2103. Global satus for upgrading of biogas – 2013,
IGU TT1 FINAL REPORT. SEPTEMBER 5, 2103.
MIT. 2013. MIT Technology Review, 2013 Emerging trends report, special issue. 2013.
NGV_Global. http://www.iangv.org/. [Online]
Niskanen, T. 2012. Energy efficiency of Bio-SNG production chain. sl : Master’s thesis, Aalto
University. 81 + 2 pp. (in Finnish), 2012.
Perspectives for biogas in Europe; ng 70. Foreest, Floris van. December 2012. December
2012.
The applicability of the renewable energy directive calculation to assess the sustainability of
biogas production. Manninen, K., Koskela, S., Nuppunen, A. , Sorvari, J., Nevalainen, O.
and Siitonen, S. 2013 : Energy Policy 56 (2013) 549–557.
THE COMMISSION, TO THE EUROPEAN PARLIAMENT, THE COUNCIL, THE
EUROPEAN ECONOMIC AND SOCIAL COMMITTEE AND THE COMMITTEE OF THE
REGIONS. 2014. Towards a circular economy: A zero waste programme for Europe. sl :
COMMUNICATION FROM THE COMMISSION TO THE EUROPEAN PARLIAMENT, THE
COUNCIL, THE EUROPEAN ECONOMIC AND SOCIAL COMMITTEE AND THE
COMMITTEE OF THE REGIONS, 2014. /* COM/2014/0398 final/2 */.
UNFCCC. United Nations Framework Convention on Climate Change. [Online]
cdm.unfccc.int.

56
Part B
Country reports
57
Introduction
Global gas demand was estimated at 3 427 billion cubic metres (bcm) in 2012, up 2% from 2011 levels. Gas demand has increased by around 800 bcm over the last decade, or 2.8% per year. Gas has a 21% share in the global primary energy mix, behind oil and coal.
The United States, Russia, Iran and China are the world’s largest consumers of gas. The largest producers are Russia, the United States, Canada and Iran. It is important to note that Chinese gas consumption almost doubled over 2007-2012 to reach around 150 bcm, while US gas production gained 25% over the same period to reach 681 bcm.
The challenge is how to replace natural gas by renewable gases. Each country has its own strategy and adopted a different approach to tackle the challenges. In this report, the situation in many countries is described. We have tried to highlight what we found the relevant information, realising that we can never be complete in describing all the developments going on. So use this information as a starting point to find out where the interesting developments are that one might use, and investigate further if you need more details.

58
EUROPE
Austria
Specific situation and expectation
Present state of gas consumption
Austria has flexible generation mix, dominated by hydropower with 63% share in 2012, followed by gas (14%) and coal (9%). Austria covers approximately 21% of its gas demand with national reserves. The remaining requirement is imported from Russian Federation, Norway and Germany.
Total gas consumption dropped to about 9.0 Bcm (billion cubic meter) in 2012 which was about 4.3% below its 2008 (9.4 Bcm) pre-crisis level. The consumption estimated in 2013 is around 8.5 Bcm. Only the power sector has increased from pre-crisis levels (+9% compared to 2008) (Oxford, 2014).
Current and expected biogas an syngas production
The first agricultural biogas plants using liquid and solid animal manure emerged more than 20 years ago. In recent years, the biogas sector in Austria has increased slightly. Small agricultural plants are very common. Biomethane plants exist occasionally (Green Gas Grids, 2012).
Anaerobic Digestion Plants in Austria are distributed as follows:
Agriculture ~350
Industrial ~ 25
Sewage sludge 134
Municipal (biowaste) ~ 30
Landfill 62
Due to the economic situation, the amount of biogas plants is expected to reduce. New substrate run on easy available waste is expected to produce biogas with specific conditions during 2020 – 2030 (IEA Bioenergy Task 37, 2014).
Upgrading plants
Various technologies are used in Austria for upgrading biogas:
Membrane Separation;
Amine wash;
Water wash;
Pressure swing adsorption.
In 2005, the first biomethane project plan, at a pilot size, was implemented.
Region Technology Year Substrate Utilisation
Pucking PSA 2005 Manure Gas grid
Bruckan der Leitha Membrane 2007 Biowaste Gas grid
Eugendorf PSA 2008 Energy crops Gas grid, vehicle fuel

59
Margarethen Membrane 2008 Energy crops & manure
Vehicle fuel
Asten Linz Water scrubber 2010 Sewage Gas grid
Engerwitzdorf Amine scrubber 2010 Energy crops Gas grid
Rechnitz PSA 2010 Vehicle fuel
Leoben Amine scrubber 2010 Sewage sludge & biowaste
Gas grid
Wiener Neustadt Membrane 2011 Sewage sludge Gas grid
Steindorf PSA 2012 Gas grid
Schlitters PSA 2012
Häusle 2013
Table 8: Biomethane plants in Austria
Biogas and syngas use
Heat and electricity production
Plant type Number of plants (approved)
Sewage sludge and landfills 45 (71)
AD plants 291 (368)
Total 336 (439)
Table 9: Number of Anaerobic Digestion Plants by 2013
Most of the biogas plants produce mainly electricity.
Biomethane
Injection in the natural gas network In Austria 7 biogas plants are injecting into the gas grid. The total capacity of the plants add up to around 9 million m3 biomethane per year.
As vehicle fuel Three biogas plants are not connected to the natural gas grid. They only serve as fuel stations. Actual output is about 260.000 m3/year.
Vision and perspectives
Several research activities are going on. International projects where Austria participates are:
TherChem (Thermochemical pre-treatment of brewers spent grain);
FAB;
Green Gas Grid.
60
National projects are:
3 competence centres are dealing with the topic of biogas;
Bioenergy 2020+ (pre-treatment, algae, abattoirs, viscosity);
ACIB (immobilisation of hydrolytic organisms);
AlpS (pre-treatment);
Klimoneff (New measuring system for emissions at biogas plants).
Regulation and standards
The quality requirements for biogas, if it is injected to natural gas grids, are specified in the General Distribution System Conditions and are provided for in Chapter 6 of the Technical Code of Other Market Rules. A list of ÖVGW Directive, which must be fully respected if biogas should access the grid, follows below:
ÖVGW Directive G31 “Natural gas in Austria - gas composition”, 2001.05
This directive should ensure safe transport within the Austrian gas network;
ÖVGW Directive G33 “Regenerative Gase - Biogas” , 2006.06
In this directive the additional, specific requirements for biomethane, e.g. gas
quality measurement, are listed. In 2011 it was replaced by the following
directive G B220;
ÖVGW Directive G B220 “Regenerative Gase - Biogas”, 2011.11
This directive replaces the ÖVGW Directive G33. It allowes to inject also
upgraded sewage gas into public gas grids for the first time and the max and
the Si content of biomethane has been lowered;
ÖVGW Directive G79. G79 sets the requirements on odorisation. If fed into a
grid containing odorized gas, biomethane has to be odorized as well. The grid
operator determines the kind of odorant and the minimum requirements for
safe operation.
For documentation of the amount of biomethane fed into the grid, a measurement of the gas quantities must be provided for. The selection of measurement methods and installations is up to the grid operator. An excess of the allowable pressure in the gas distribution network must be prevented by appropriate measures. Appropriate installations (see ÖVGW Directives G73/1, G73/2, G73/3, G73/4) have to be implemented.
Lower methane contents than 96 % are permitted if the gas quality specification rules according to ÖVGW Directive G31 and a upper calorific value of at least 10.7 is adhered to, therefor augmentation with LPG or propane is possible in order to adjust biomethane to become on-spec. Also blending of "off-spec" biogas with natural gas in the grid is only possible with augmentation with LPG and propane.
The gas quality monitoring of parameters such as methane and H2S content and water dew point is regulated through ÖVGW Directive G B220 and has to be measured continously. Quality parameters of production conditions in digester have to be determined continously. Frequency of measuring according G 31 and B 220 has to be agreed on in reconciliation with the grid operator.

61
Feed-in tariffs Austria biogas is mainly supported via electricity production (Green electricity law “Ökostromgesetz“):
19,50 Euro cent / kWh up to 250 kWe;
16,93 Euro cent / kWh from 250 - 500 kWe;
13.34 Euro cent / kWh from 500 - 750 kWe;
12.93 Euro cent / kWh for higher than 750 kWe;
+ 2 Euro cent / kWh if biogas is upgraded;
+ 2 Euro cent / kWh if heat is used efficiently.
It is required that a minimum of 30% manure is used as a substrate to get the feed-in tariff. If organic wastes are used, the feed-in tariff is reduced by 20%. Older biogas plant, where subsidies are running out, can apply for a longer subsidizing period, in total 20 years. Furthermore, a supportive measure for existing plants (built before 2009), up to 4 €cent/kWhel can be granted for securing substrate provision, in 2013 it is 3 €cent/kWhel.
References GREEN GAS GRIDS. (2012). Overview of biomethane markets and regulations in partner countries.
IEA Bioenergy Task 37; Country report Austria; BiogasScience 2014 Vienna/Austria International Conference on Anaerobic Digestion (26th – 30th October 2014).
The Oxford Institute For Energy Studies. The outlook for Natural Gas Demand in Europe. NG-87 (June 2014).
http://www.greengasgrids.eu/market-platform/austria/status-quo/existing-biomethane-plants.html
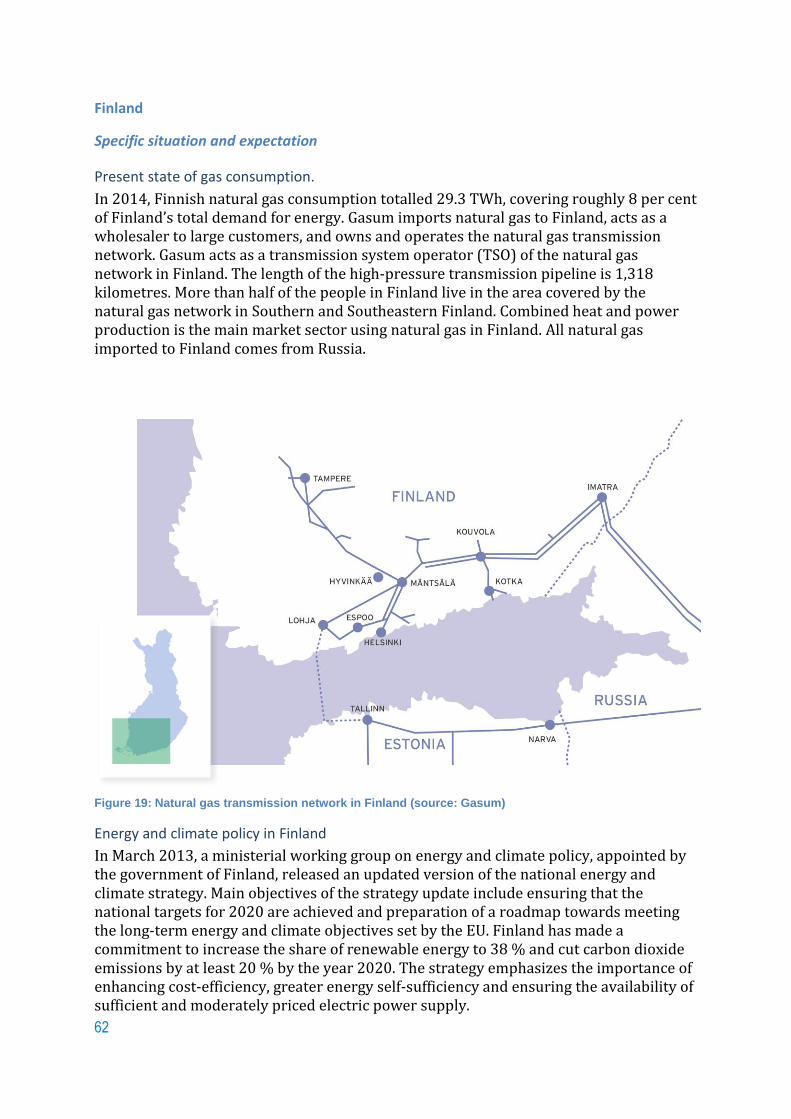
62
Finland
Specific situation and expectation
Present state of gas consumption.
In 2014, Finnish natural gas consumption totalled 29.3 TWh, covering roughly 8 per cent of Finland’s total demand for energy. Gasum imports natural gas to Finland, acts as a wholesaler to large customers, and owns and operates the natural gas transmission network. Gasum acts as a transmission system operator (TSO) of the natural gas network in Finland. The length of the high-pressure transmission pipeline is 1,318 kilometres. More than half of the people in Finland live in the area covered by the natural gas network in Southern and Southeastern Finland. Combined heat and power production is the main market sector using natural gas in Finland. All natural gas imported to Finland comes from Russia.
Figure 19: Natural gas transmission network in Finland (source: Gasum)
Energy and climate policy in Finland
In March 2013, a ministerial working group on energy and climate policy, appointed by the government of Finland, released an updated version of the national energy and climate strategy. Main objectives of the strategy update include ensuring that the national targets for 2020 are achieved and preparation of a roadmap towards meeting the long-term energy and climate objectives set by the EU. Finland has made a commitment to increase the share of renewable energy to 38 % and cut carbon dioxide emissions by at least 20 % by the year 2020. The strategy emphasizes the importance of enhancing cost-efficiency, greater energy self-sufficiency and ensuring the availability of sufficient and moderately priced electric power supply.
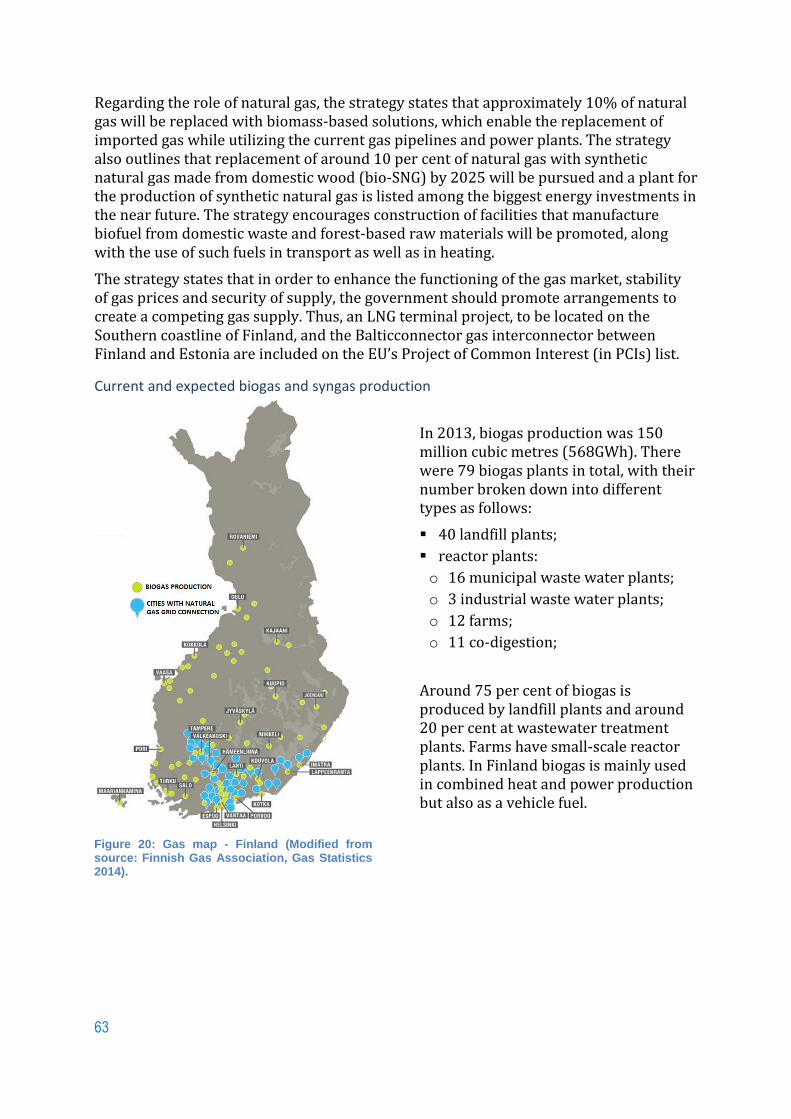
63
Regarding the role of natural gas, the strategy states that approximately 10% of natural gas will be replaced with biomass-based solutions, which enable the replacement of imported gas while utilizing the current gas pipelines and power plants. The strategy also outlines that replacement of around 10 per cent of natural gas with synthetic natural gas made from domestic wood (bio-SNG) by 2025 will be pursued and a plant for the production of synthetic natural gas is listed among the biggest energy investments in the near future. The strategy encourages construction of facilities that manufacture biofuel from domestic waste and forest-based raw materials will be promoted, along with the use of such fuels in transport as well as in heating.
The strategy states that in order to enhance the functioning of the gas market, stability of gas prices and security of supply, the government should promote arrangements to create a competing gas supply. Thus, an LNG terminal project, to be located on the Southern coastline of Finland, and the Balticconnector gas interconnector between Finland and Estonia are included on the EU’s Project of Common Interest (in PCIs) list.
Current and expected biogas and syngas production
Figure 20: Gas map - Finland (Modified from source: Finnish Gas Association, Gas Statistics 2014).
In 2013, biogas production was 150 million cubic metres (568GWh). There were 79 biogas plants in total, with their number broken down into different types as follows:
40 landfill plants;
reactor plants:
o 16 municipal waste water plants;
o 3 industrial waste water plants;
o 12 farms;
o 11 co-digestion;
Around 75 per cent of biogas is produced by landfill plants and around 20 per cent at wastewater treatment plants. Farms have small-scale reactor plants. In Finland biogas is mainly used in combined heat and power production but also as a vehicle fuel.

64
In Finland, the target is to replace around 10 per cent of natural gas with synthetic natural gas made from domestic wood (bio-SNG) by 2025.
Finland has significant potential for producing renewable gases. According to expert assessments, the combined potential for renewable gases in Finland is around 17 TWh or more than 50 per cent of current natural gas consumption:
Food processing industry and municipalities (biowaste and sludge) 2 TWh/a
Agriculture (energy crops and manure) 7 TWh/a
Forest industry (bio-SNG) 8 TWh/a
Wood-based bio-SNG (bio-synthetic natural gas) is an interesting option to increase the share of renewable energy in the Finnish energy system. Bio-SNG is an indigenous, renewable and carbon neutral fuel. Helen, Metsä Fibre and Gasum are studying the possibility of constructing a biorefinery producing biogas in Joutseno. The production capacity of the planned biorefinery in Joutseno would be as high as 200 MW. The biorefinery would gasify wood chips and refine them into at least 95 per cent methane. The composition of the end product would therefore correspond to that of natural gas, whereby it could be injected into the natural gas network and transmitted to usage sites such as Helen’s Vuosaari power plant.
Upgrading plants
Site Waste Upgrading technique
Annual capacity
(GWh)
Use Year
Mäkikylä Kouvola
Municipal waste, sewage sludge, grass silage
Water scrubber
15 8GWh injected into NG grid (Could cover annual fuel for 22 buses or 720 cars)
Oct. 2011
Suomenoja Espoo
Wastewater Water scrubber
24 Gas grid
Annual fuel for 67 buses or 2160 cars
Dec. 2012
Forssa Biodegradable waste, sludge
Membrane <0,5 Dec. 2013
Lahti Biodegradable waste, sludge
Water scrubber
50 Gas grid
Annual fuel for 4500 cars
Nov. 2014
Joutsa Biodegradable waste, sludge
Water scrubber
2 Vehicle fuel Mar. 2014
Jepua Manure, biodegradable waste, grass silage
Water scrubber
20 Vehicle fuel, industrial applications
Jul. 2014
Laukaa cow manure, confectionary by-products, fat
2 Vehicle fuel 2002, replacement 2014
Table 10: Upgrading plants in operation in Finland

65
Biogas and syngas use
Biomethane produced from waste-based raw materials is sold by Gasum for use as a transport fuel. For example, the Helsinki Regional Transport Authority can use locally produced biomethane as a public transport fuel. Biomethane produced at the Suomenoja plant would cover the annual fuel consumption of almost 65 buses (roughly 3 to 4 percent of the total bus fleet). The idea of circular economy is presented in Figure 21.
Figure 21: The idea of circular economy
Heat and electricity
In 2013, 151 GWh electricity and 404 GWh heating was produced from biogas.
Figure 22: Biogas utilization in Finland 1994 – 2013, Reference: Huttunen & Kuittinen 2013 - Finnish Biogas Association

66
Biomethane
Injection in the natural gas network
Figure 23: Biogas facility in Mäkikylä, Kouvola
The biogas facility at Mäkikylä wastewater plant in Kouvola uses municipal biowaste, sewage sludge and grass silage as feedstock. Biogas is produced in a two-stage thermophilic digester and upgraded in a Greenlane water scrubber, after which biomethane is injected into the natural gas grid. The total annual capacity of the plant is 15 GWh, of which the majority is injected into the grid. The digester is owned and operated by Kouvolan Vesi (municipal water supply and sewerage company), upgrading unit is owned and operated by the local energy company KSS Energia, and upgraded biogas is injected into the natural gas grid by Gasum.
Figure 24: Biogas facility in Suomenoja, Espoo.
In December 2012, Gasum started to inject biomethane into the grid from the Suomenoja wastewater treatment facility. The Helsinki Region Environmental Services Authority (HSY) is responsible for digestion and Gasum for upgrading and grid injection. The Suomenoja wastewater treatment plant processes the wastewater of 310,000 people originating from the municipalities of Espoo, Kauniainen, Kirkkonummi and the Western parts of Vantaa, all located in the Helsinki Metropolitan Area. Biogas is produced in a wet digestion mesophilic process and upgraded in a Malmberg water scrubber. Following treatment, clean biomethane is injected into the natural gas grid. The plant’s annual capacity is 24 GWh.

67
Figure 25: Biogas upgrading facility in Kujala, Lahti.
Gasum and Labio Oy started biomethane production in a co-digestion plant in Lahti in November, 2014.The biogas, which is in a further process upgraded into biomethane and injected into natural gas grid, is produced by digesting municipal, commercial and industrial biowastes together with sewage sludge. Dry thermophilic digesters are owned and operated by Labio Oy. The total biomethane production capacity of the plant will be 50 GWh a year, which is equivalent to yearly fuel consumption of 140 buses, 4500 cars or 2000 households.
As vehicle fuel
Gasum’s biomethane sold for use as a transport fuel has been awarded the Nordic Ecolabel. The criteria and requirements set for the label as regards the product’s environmental friendliness in comparison with other corresponding products are reviewed every year. Gasum’s biomethane has also been granted the right to use the Key Flag Symbol denoting Finnish origin.
Gasum joined the Climate Partners network of the City of Helsinki and local businesses in 2012. The Climate Partners make a commitment to reduce their greenhouse gas emissions by increasing their operational efficiency and offering better products and services to curb climate change. Gasum made a commitment to use biogas as the fuel for its service vehicles and company cars used by Gasum personnel, promote opportunities to utilise biogas and LNG in the Helsinki region in cooperation with its partners as well as to maintain and develop the gas distribution network within the City of Helsinki.
In the beginning of 2015, Finland has 24 public biogas filling stations, of which Gasum owns 18. Upgraded biogas is available from every station.
Biomethane as vehicle fuel outside the natural gas grid:
One of the world’s first small-scale biogas upgrading systems was introduced in
2002 in Laukaa, Finland. The new refuelling station was opened in March 2011 →
60-70 biogas vehicles fuelling, ~1000 MWh sold on 2011. Upgrading capacity was
increased in 2014;
Haapajärvi: biogas upgrading to vehicle fuel was started in April 2012. Currently
only for use of Haapajärvi vocational college;
Nivala: biogas upgrading and private slow filling station on a farm scale;
Kitee: plans to start biogas upgrading to vehicle fuel;
Liminka: plans to start biogas upgrading to vehicle fuel 2015;
Joutsa: Upgraded biogas for vehicle use since march 2014;
Jepua: Upgraded biogas for vehicle use since july 2014;
68
Vaasa: Upgraded biogas for vehicle use. Estimated opening time September 2015;
Valtra biogas tractor production continues with three models (2014).
Vision and perspectives
Several research activities on biogas have been initiated.
The Technical Research Center of Finland (VTT) studies gasification of biomass for second generation biofuels such as bio-SNG and hydrogen. Research activities include gasification, filtration, catalytic reforming and synthesis.
The BEST-program has subtasks for regional small-scale solutions for waste water treatment and bio waste.
He METLI-program studied possibilities on utilizing side streams such as waste water from pulp & paper industry.
The Neocarbon-program studies possibilities to produce biomethane and hydrogen from renewable electricity. There are various activities on biogas production from algal biomass.
Regulation
Regulation and quality requirements for biomethane injection into the natural gas grid standards
The Energy Authority (EV) is the national regulatory authority regulating natural gas markets in Finland.
Finland is an isolated gas market, and therefore it has been granted derogation from the obligations under Directive 2009/73/EC to liberalise its natural gas markets.
The natural gas market has been under sector-specific regulatory supervision since the assertion of the Natural Gas Market Act (508/2000) in August 2000. The Natural Gas Market Act was revised in September 2013 in order to include the rules for providing access for gas from renewable energy sources to the natural gas system. The revision stated that producers of biomethane have to be granted non-discriminatory access to the grid, provided that the relevant technical rules and safety standards are met, and there is an obligation to transport biomethane through the natural gas system from the production plant to the gas consumers. At the moment, the Natural Gas Market Act is under another revision that should be finalized by the end of 2015. The revised act is likely to implement the Gas Directives of the Third Energy Package for the internal EU gas and electricity market, including opening of the Finnish gas market and unbundling of the gas transmission and gas trading services.
The quality of biomethane injected into the natural gas transmission system must meet the quality requirements set for natural gas where no separate requirements have been determined for biomethane. In addition, biomethane must meet the other quality requirements set for biomethane.
The following quality requirements for biomethane injection into the natural gas grid are based on the EASEE-gas report Common Business Practice, Harmonisation of Natural Gas Quality 2005 – 001/01.
Wobbe index: 13.76...15.81 kWh/m3n
Relative density: 0.555… 0.700 m3n/m3n
Minimum methane content: 95 mol%
Maximum oxygen content 0.5 mol%
Maximum CO2 content 2.5 mol%

69
Maximum H2S content 15 mg/m3n
Maximum mercaptan sulphur content 25 mg/m3n
Maximum total sulphur content 100 mg/m3n
Maximum siloxanes content 2 mg Si/Nm3n
Dew point at the pressure of 40 bar: -5 °C in the winter and + 0 °C in the summer.
If a biomethane production facility planned for connection to the natural gas transmission system is based on a technology other than an anaerobic digestion process, this must be agreed upon with the TSO to verify the network injectability of the biomethane to be injected and agree upon the limit values and analyses for the gas.
The TSO reserves the right to use the standard for biomethane for injection in natural gas pipelines developed by the European Committee for Standardization (CEN) in the quality requirements set for biomethane injected into the transmission system following the completion of the standard.
Biomethane used as a transport fuel has to meet the sustainability criteria, such as at least the greenhouse gas emission reduction of a minimum of 35 per cent, set in the Act on Biofuels and Bioliquids (393/2013).
Taxation and subsidies
In Finland, energy taxes are levied on electricity, coal, natural gas, fuel peat, tall oil and liquid fuels. The excise duty includes an energy content tax, carbon dioxide tax and strategic stockpile fee. The strategic stockpile fee is levied on liquid fuels, electricity, coal and natural gas. Biogas and biomethane are exempted from the excise duty.
There is a feed-in-tariff system that promotes the production of electricity from renewable sources of energy, including biogas. In the feed-in tariff scheme an electric producer whose biogas power plant has been accepted into the scheme receives a subsidy based on the market price for electricity (feed-in-tariff). The target price for electricity from a biogas power plant accepted into the feed-in tariff scheme is € 83.50/MWh. In efficient combined heat and power production the feed-in-tariff is increased by a heat premium of € 50/MWh for electricity from a biogas power plant. The electricity producer may receive a feed-in tariff for a maximum of twelve years. There are several prerequisites for acceptance of biogas power plants into the system. For example, a biogas power plant may only be accepted into the feed-in tariff scheme if it has not received government aid.
Alternatively, energy subsidies for biogas plant investments can be applied. Investment support for investments related to renewable energy and energy efficiency can be 10–40 per cent of eligible costs. In 2014, the investment support for biogas and biomethane projects is indicatively 20–30 per cent. Biomethane plants in Kouvola and Espoo as well as a new project in Lahti have also been granted investment support.
Voluntary biogas certificate system
Gasum has developed a voluntary biogas certificate system in Finland. In the biogas certificate system the physical delivery and the environmental property of biogas are separated. Biogas certificates can freely be purchased and sold in the markets having common rules, and certificates enable production and demand to meet in a flexible way. The certificate is granted to biogas, which fulfills the quality requirements of natural gas entered into the network or to LBG of same quality. The biogas certificate system is used for a balance settlement of biogas in the natural gas transmission network.
70
The Issuing Body is responsible of the system and it makes the rules for the activity, accepts the production plants and actors, allows the certificates and keeps up the biogas certificate register. Independent verifier inspects the production plant and raw materials used, and verifies the gas quality.
Certificates are created according to the measurement data sent to the Issuing Body, and certificates are registered automatically to producer’s certificate account, where they can be transferred to the accounts of brokers or consumers. One certificate is equal to the production of 1 MWh biogas and is valid for 18 months after the production month of biogas.
References
Directive 2009/73/EC of the European Parliament and of the Council of 13 July 2009 concerning common rules for the internal market in natural gas and repealing Directive 2003/55/EC
http://eur-lex.europa.eu/LexUriServ/LexUriServ.do?uri=OJ:L:2009:211:0094:0136:en:PDF
EASEE-gas, Common Business Practice, Harmonisation of Natural Gas Quality 2005 – 001/01
http://easee-gas.eu/docs/cbp/approved/easeeWG8_050203_CBP2005_001_01_000.pdf
Finnish Gas Association, Gas Statistics 2014 http://maakaasu.fi/sisalto/statistics
Gasum, Corporate Responsibility Report; 2013 http://www.gasum.fi/globalassets/gasum_yritysvastuu2013_fin.pdf
Kuittinen, V. & Huttunen, M, 2014, Finnish Biogas Register no 17, data from 2013. Reports and Studies in Forestry and Natural Sciences (PDF), no 13 (in Finnish)
http://www.biokaasuyhdistys.net/media/Biokaasulaitosrekisteri2013.pdf
National Energy and Climate Strategy, Government Report to Parliament on 20 March 2013 http://www.tem.fi/files/36292/Energia-_ja_ilmastostrategia_nettijulkaisu_ENGLANNINKIELINEN.pdf
Statistics Finland, Energy supply and consumption 2013, 4th quarter http://www.stat.fi/til/ehk/2013/04/index_en.html
The Key Flag Symbol: http://www.avainlippu.fi/en/symbols/key-flag-symbol
The Nordic Ecolabel: http://www.nordic-ecolabel.org/about/
Finnish CustomsCustomer Bulletin No. 21, March 2013,Energy Taxation: http://www.tulli.fi/en/finnish_customs/publications/excise_tax/excise_taxation/021.pdf

71
Sweden
Specific situation and expectation
Present state of gas consumption
The national Total Primary Energy Supply (TEPS) is composed mainly by nuclear (34%), followed by oil (26%) and hydropower (14%). In 2012, gas consumption was only 2% of Sweden TEPS; the total natural gas consumed is imported from Denmark. Power supply was fueled by hydropower (47%), followed by nuclear (38%) then gas (1%) and coal (1%) (Oxford NG-87; 2014).
Renewable gases such as biogas and biomethane are considered as key energy carrier when the society is replacing fossil fuels with renewable alternatives. In Sweden, almost 80 % of the fossil fuels are used in the transport sector. Therefore, the focus in Sweden has been to use the produced biogas in this sector as vehicle gas.
Among the long term priorities of 2030 is the independency of vehicle stock from fossil fuels. Efforts are made for several year now and following EU directive (2009/28/EG) on the promotion of renewable energy ‘RnE’, the transport sector will reach 10% RnE by 2020.
Current and expected biogas and syngas production
In 2013, the 264 biogas plants produced a total of 1686 GWh. Biogas production increased by 97 GWh in 2013 compared to 2012, which represents an increase of 6%.
The 137 waste water treatment plants that produce biogas contribute with around half of the production. In order to reduce the sludge volume, biogas has been produced at wastewater treatment plants for decades. New biogas plants are mainly co-digestion plants and farm plants. The landfilling of organic waste has been banned since 2005, thus the biogas produced in landfills will decrease.
Biogas plants
Number
Energy in biogas
[GWh/year]
Wastewater treatment plants 137 672
Co-digeston plants 23 580
Farm plants 39 77
Industrial wastewater 5 117
Landfills 60 240
Sum 264 1 686
Table 11: Energy production from biogas plants in Sweden (Paulsson, 2014)
There is a large potential to increase the Swedish biogas production as biogas can be produced from various types of substrates that are currently treated as residues or waste. Agricultural residues represent the greatest potential resource. The theoretical potential biogas production in Sweden has been estimated to be more than 15 TWh/year, which is around ten times more than the current production.

72
Substrate Potential biogas production with limitations* [TWh]
Total biogas potential [TWh]
Food wastes 0.76 1.35
Wastes from parks and gardens 0 0.40
Industrial waste and residues (including food industry)
1.06 1.96
Sludge from wastewater treatment plants 0.70 0.73
Agricultural residues and manure ** 8.10 10.78
Total 10.62 15.22
* Taking into account limitations in today’s technical and economic situation.
** 5.8 TWh of this potential origins from straw which requires pretreatment before digestion.
Table 12: Biogas potential in Sweden (Lund, 2008)
Biogas can also be produced from crops. This potential is difficult to estimate and depends entirely on which assumptions are made regarding land use, crop and yield. If 10 % of the agricultural land in Sweden is used, approximately 7 TWh of biogas could be produced annually (Lund, 1998)
Upgrading plants
There are 54 biogas upgrading plants of biogas to biomethane. Of these, 11 inject the biomethane into the grid. The raw gas capacity is 28 000 Nm3/h (Paulsson, 2014).
Most of the installations use water scrubber technology. The first membrane unit is being built.
Figure 26: Upgrading processes in use in Sweden
Biogas and syngas use
In Sweden, around 92% of biogas is valorised (see Figure 27). More than half of the biogas produced, 907 GWh (54%), was upgraded. The heat production was 521 GWh (31%), it includes also heat loss. 46 GWh (3%) of electricity was generated and 186 GWh (11%) was flared (Paulsson, 2014).

73
Figure 27: Utilisation of biogas in 2013 (Paulsson, 2014)
Heating
The heat production in 2013 from biogas was 521 GWh. However, it is based on collected data whereby is not possible to determine how much of the heat was actually used and how much resigns as heat loss. At CHP is the electrical efficiency about 30-35% (up to 40%), implying that some one third of the energy is converted to electricity, while two thirds of the energy converted to heat resigns as heat loss (Paulsson, 2014).
Electricity production
Around 3% (46 GWh) of biogas is used to produce electricity. Electricity is produced from biogas through combustion in a gas engine or in a turbine. Both Otto and diesel engines are used. About a third of the energy in the fuel is used to produce electricity and two-thirds becomes heat. The producers of the renewable electricity also receive electricity certificates to improve their profitability.
Biomethane
Injection in the natural gas network
Region Municipality Year of commissioning
Halland Falkenberg 2008
Halland Laholm 2000
Skåne Bjuv 2007
Skåne Helsingborg (NSR) 2002
Skåne Helsingborg (Öresund) 2008
Skåne Lund 2010
Skåne Malmö 2008
Stockholm Stockholm (Henriksdal) 2011
Stockholm Stockholm (Högdalen) 2012
Stockholm Lidingö 2012
Västra Götaland Göteborg 2007
Table 13: Biomethane injection plants (Paulsson, 2014)

74
In 2013, 11 biomethane plants are injecting into the grid (Table 13).
As vehicle fuel
Due to the independency of fossils fuels; in the Swedish transport sector, utilisation of biogas as vehicle fuel has gained large interest during the last few years. Today, it is a mixture of natural gas and biogas that is sold as vehicle fuel of which biogas comprised 62% by volume in 2011. Both the biogas volume used for vehicle fuel as well as the number of vehicles that are able to use biogas as a vehicle fuel has increased during the last few years.
Except for in the Otto engines, biogas can also be used in Dual-Fuel engines.
In Dual-Fuel engines, the biogas can be used in combination with diesel as a vehicle fuel and maintain the high efficiency of the diesel engine. The percentage of biogas can be as high as 90%.
Figure 28: Sold volume of natural gas and biogas as vehicle fuel , 1995–2011 (Source: http://www.gasbilen.se, http://www.scb.se, 2012-03-12)
Of the biogas produced, 53% is upgraded to vehicle fuel. There are 138 public and 57 non-public biogas filling stations while few LBG/LNG filling stations exist.
Vision and perspectives
There is a very ambitious target for the transport sector (no fossil emissions by 2030), but very little means implemented so far to reach it. The so called biogas strategy written by the Swedish Energy Agency (2011) did not include the potential of thermal gasification, and expressed that biomethane from urban waste is not a fuel suitable for the LDV market (too small potential and too expensive to build up the infrastructure), but rather suitable for local and regional markets of buses and other HDV’s. Recent (2013) announcements on prolonging existing policies have made the market players somewhat more optimistic. However, the independent state investigation on how to reach the goal of 2030 that is under way will be the real deciding point when it comes to the targets of biomethane for transport.
Regulation, Financial support
Regulation, standards
In 2003, a support system based on electricity certificates was introduced in order to stimulate the production of renewable electricity. With this system, the producers are given one certificate for every MWh electricity produced from renewable resources. Obligatory quotas have been introduced, which means that the electricity consumers must buy certificates in

75
relation to their total use although, in practice, each supplier is responsible for the quota requirements being fulfilled. For every year until 2035, the quota is determined.
Figure 29: Average price for electricity certificates (1MWH) (Elcertifikat.svk.se, 2012-03-22).
Financial support systems
The support system in Sweden is mainly focused on increasing the usage of biomethane as vehicle fuel. The exiting support systems are:
No carbon dioxide or energy tax on biogas. Today this corresponds to a value of 68 €/MWh compared to petrol and 52 €/MWh compared to diesel of which 26 €/MWh is from the carbon dioxide relief and the remaining part is from the energy tax relief;
40% reduction of income tax for use of company NGVs until 2017; Investment grants for marketing of new technologies and new solutions for biogas
during 2013-2016. Maximum 45% or 25 MSEK (~3 M€) of investment cost; A joint electricity certificate market between Norway and Sweden. The producers get
one certificate for every MWh electricity produced from renewable resources and electricity. Consumers must buy certificates in relation to their total use. Average price 2012 is around 17-22€/MWh;
0,2 SEK/kWh (~€ 0,02/kWh) for manure based biogas production to reduce methane emissions from manure. Total budget 240 MSEK (10 years).
References
NG-87 The Oxford Institute for Energy Studies – The outlook for natural gas demand in Europe; June 2014
Overview of biomethane markets and regulations in partner countries; Green Gas Grids (2012)
Basic data on biogas; Swedish Gas Technology Centre; 2012
Swedish Energy Agency, Produktion och användning av biogas och rötrester år 2013; ES 2014:xx; ISSN 1654-7543; Energimyndigheten; J. Paulsson & H. van Bahr
Den svenska biogaspotentialen från inhemska restprodukter, Lund 2008, Marita Linné et al.
Biogaspotential och framtida anläggningar i Sverige, 1998; JTI-rapport, Kretslopp & Avfall, nr.17, Åke Nordberg et al.; Jordbrukstekniska institutet.
IEA Sweden country report Séoul, 11-2013
Greengasgrids.eu; Political targets for biogas and biomethane production
Elcertifikat.svk.se

76
Denmark
Specific situation and expectation
Present state of gas consumption.
The main sources in the Danish energy system are coal, oil, natural gas, biomass and wind. Denmark is self-sufficient in oil and natural gas and is expected to stay self-sufficient in the near future (see Figure 30). Coal is imported and used in power plants for combined heat and power (CHP) production. There are no nuclear power plants in the country, but instead, Denmark is focusing on using and developing more green energy solutions in the future to reduce climate gas emissions.
Natural gas consumption represented 19 % of the total energy supply in 2012. For comparison coal, oil and renewables represented 38, 14 and 24 %, respectively.
Figure 30: Production and consumption of natural gas in Denmark (Larsen 2013)
The natural gas consumption was 3.1 billion m3 in 2012. The distribution of the gas consumption in the different sectors is:
Residential 23 % (~380,000 gas boiler installations)
Industry: 25 %
CHP and district heating: 46 %
Service sector: 6 %
Transport sector: < 0.01 %.
Current and expected biogas and syngas production
In the mid-1990s, approximately 20 joint biogas plants (annual production typically 2-4 million m3/year) were established, and since then there has been no construction activity until around 2008 where a few new plants were established. At the same time, about 60 farm based biogas plants have been established. Farm based biogas plants typically receive manure and

77
residual products from one or two farms, whereas the joint plants receive manure from multiple farms and residual organic products from the industry.
Biogas plants are mainly established in the northern and western part of Denmark where there is a significant animal production. As illustrated in Figure 31Fout! Verwijzingsbron niet gevonden.Fout! Verwijzingsbron niet gevonden., most biogas is produced on manure based plants and sewage sludge based plants. Landfill gas and industrial biogas only contribute with a minor part of the total biogas production.
Figure 31: The development of biogas production in different sectors. (Source: The Danish Energy Agency)
It is a national target that 50 % of all manure should be applied for biogas production by 2020, which will result in a biogas production of around 16 PJ. The current (2012) biogas production is 4.3 PJ. The Danish Energy Agency has assessed the biogas production in 2020 based on biogas projects at different development stages. Some projects are very likely to be implemented, as only minor details are missing before a contract can be signed. Other projects are pretty uncertain projects, as major unsolved issues are still to be handled. Different possible developments are shown in Figure 32. The figure shows that it is doubtful whether the objective can be achieved with the current conditions.

78
Figure 32: The biogas production in 2012 and in 2020 with different possible development. Based on data from the Danish Energy Agency.
In order to expand the biogas production, the subsidy scheme for biogas was changed in 2012. Previously, there was no support for biogas used for biomethane injected into the natural gas grid. The new framework for subsidies equalizes subsidies to biogas used for combined heat and power production and gas used for grid injection. Furthermore, the subsidies were increased by around 40 %. However, the new subsidy scheme was not approved by the EU Commission until December 2013. Figure 32 is based on the revised subsidies.
Upgrading plants
Location Substrate Upgrading Technique
Capacity million
m3(n)/year
Utilization of Biogas
Fredericia Sewage sludge Water scrubber
3 Injection
Hjørring 1 Agriculture + organic waste
Water scrubber
6 Injection
Hjørring 2 Agriculture + organic waste
Water scrubber
2 Injection
Balling Agriculture + organic waste
Chemical scrubber
4 Injection
Horsens Agriculture + slaughterhouse
waste
Water scrubber
7 Injection
Table 14: List of upgrading plants up to October 2014
Biogas and syngas use
Presently, biogas is mainly used for CHP production. However, for new projects upgrading and injection into the natural gas grid seems to be the preferred utilization. It is local conditions such as possible use of the heat from CHP production, distance to the natural gas grid etc. which determine whether the best business case is obtained by upgrading the biogas or by using it for CHP production.
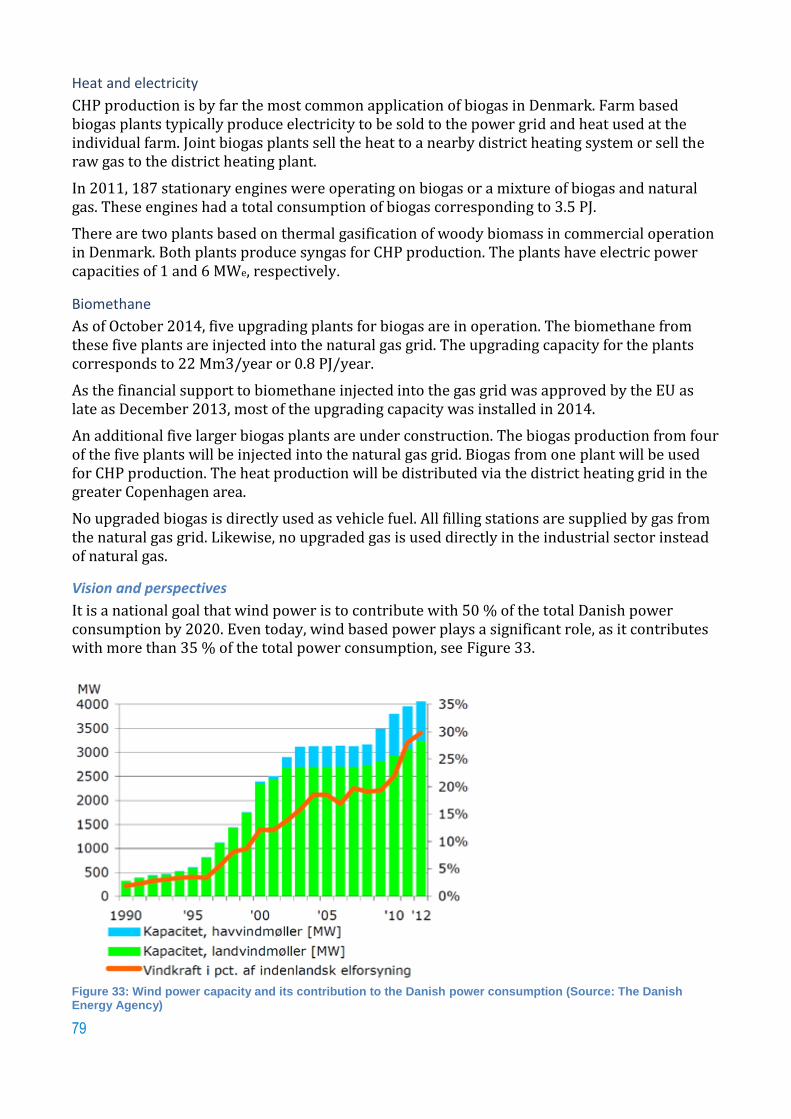
79
Heat and electricity
CHP production is by far the most common application of biogas in Denmark. Farm based biogas plants typically produce electricity to be sold to the power grid and heat used at the individual farm. Joint biogas plants sell the heat to a nearby district heating system or sell the raw gas to the district heating plant.
In 2011, 187 stationary engines were operating on biogas or a mixture of biogas and natural gas. These engines had a total consumption of biogas corresponding to 3.5 PJ.
There are two plants based on thermal gasification of woody biomass in commercial operation in Denmark. Both plants produce syngas for CHP production. The plants have electric power capacities of 1 and 6 MWe, respectively.
Biomethane
As of October 2014, five upgrading plants for biogas are in operation. The biomethane from these five plants are injected into the natural gas grid. The upgrading capacity for the plants corresponds to 22 Mm3/year or 0.8 PJ/year.
As the financial support to biomethane injected into the gas grid was approved by the EU as late as December 2013, most of the upgrading capacity was installed in 2014.
An additional five larger biogas plants are under construction. The biogas production from four of the five plants will be injected into the natural gas grid. Biogas from one plant will be used for CHP production. The heat production will be distributed via the district heating grid in the greater Copenhagen area.
No upgraded biogas is directly used as vehicle fuel. All filling stations are supplied by gas from the natural gas grid. Likewise, no upgraded gas is used directly in the industrial sector instead of natural gas.
Vision and perspectives
It is a national goal that wind power is to contribute with 50 % of the total Danish power consumption by 2020. Even today, wind based power plays a significant role, as it contributes with more than 35 % of the total power consumption, see Figure 33.
Figure 33: Wind power capacity and its contribution to the Danish power consumption (Source: The Danish Energy Agency)

80
By 2035, the goal is that 100 % of heat and power is to be based on renewable energy sources. It means that after 2035 natural gas is no longer an option as fuel for backup for wind based power production. Instead, other renewable gas sources will play an increasing role.
The existing gas system provides a huge storage capacity, which plays an important role in the foreseen future energy system. This is illustrated in Figure 34 that shows the vision of Energinet.dk, which is the operator for both the Danish power and gas transmission systems.
Figure 34: Perspectives where gas from renewable energy sources is integrated with electricity, district heating and vehicle fuels (Source: Energinet.dk)
Gas vehicles running on natural gas quality fuel are relatively new in Denmark. There are only 7 refueling stations and there will be 10 at the end of 2014.
Identification of the most relevant driving forces and barriers in producing and using biogas and
bio syngas
Regulation and standards
There are well-defined rules for the gas quality required in order to inject the biogas into the gas grid. The requirement to methane concentration is defined by a wobbe index that must be between 50.8 and 55.8 MJ/m3(n) ( ref. conditions 25/0 °C). This corresponds to at least 97.3 % methane, if the rest is CO2.
All costs related to injection of biomethane into the gas grid must be covered by the owner of the upgrading unit, including additional costs related to billing of the gas costumer where the heating value of biogas is different from the actual heating value of the natural gas in the grid. Costs related to any required compression of the biomethane are also covered by the owner of the upgrading unit.
Driving forces
As mentioned above, a new financial support system for the biogas sector was approved by the EU at the end of 2013. The main elements of the financial support system are:
15.3 €/GJ (0.056 €/kWh) for biogas used for CHP production or injection into the grid;

81
10 €/GJ (or 0.037 €/kWh) for direct usage for transport or industrial purposes (this is,
however, not yet approved by the EU).
These tariffs include a natural gas price compensation as well as a temporary subsidy of 1.3 €/GJ of 0.005 €/kWh) (10 DKK/GJ). The temporary subsidy expires in 2016.
It has also been possible to apply for investment grants for plants digesting mainly manure. Nineteen biogas projects received governmental grants in 2013 with a total value of 36 M€. There are presently no plans for subsidising investments in new biogas plants. It was possible to obtain both investment grants and subsidies to the biogas production.
Biogas can only be subsidised if it is considered “sustainable”. In this context, “sustainable” is defined as biogas produced on up to 25 % (by mass) energy crops. From 2018, the substrate used for subsidised biogas production can only contain up to 12 % energy crops.
Like biogas, syngas is subsidised by 15.3 €/GJ if the gas is used for CHP production. There are, however, no subsidies for syngas, which is methanised and injected into the natural gas grid.
Furthermore, there is a national green certificate system for biomethane injected into the gas grid. The value of the certificates is given by the value of CO2 allowances in the EU emission trading system or by the CSR value of green certificates for companies, which have targets for e.g. emission of greenhouse gases.
References
Danmarks olie- og gasproduktion 2012, Energi Styrelsen, Ib Larsen, Juni 2013
Danish Energy Agency (http://www.ens.dk/en)
Energinet.dk

82
Netherlands
Specific situation and expectation
Present state of gas consumption.
In 2012, TEPS was dominated by gas (42%), oil (39%) and coal (10%). The country is a net gas exporter (Oxford, 2012)
In the Netherlands, almost al 7,3 million households are connected to the gas distribution grid. Gas is used for heating, tap water and cooking. The gas that is being is used is low-calorific gas, based upon the gas quality found in the north of the Netherlands. With this quality, the Netherlands differs from the rest of Europe, where high calorific gas is used. This might make a difference when producing and using biomethane.
The operation of the grids is completely independent from supply and trading. Interference between the two is strictly forbidden. Biomethane (in Dutch called “groen gas”) is being injected in the natural gas grid, which is regulated business of the grid operators. Biogas has a much wider range of compositions, is distributed through separate piping systems, and is considered commercial business.
Current and expected biogas and syngas production
With about 130 biogas plants and more than 20 biomethane plants in operation, the Netherlands is one of the forerunner countries in the market of biogas and biomethane (Strauch 2012).
The current situation can be found on the website www.b-i-o.nl. Maps can be found with all biogas and biomethane projects in the Netherlands. By clicking on each marker, further details are given about the production facility (see Figure 35).
Figure 35: Screenshot of ww.b-i-o-.nl showing biogas and biomethane projects

83
The amount of renewable gas (including biomethane) that is injected in the grid is decreasing for years (see Figure 36).
Figure 36: Volumes of biomethane injection (based upon CBS data)
But the total production is increasing (source E-kwadraat) when the biogas used on the farm itself is taken into account:
Figure 37: Volumes of biogas production (source: CBS)
Biogas, Various Biogas from farms Biogas from sewage treatment Biogas from landfills
New projects commissioned in 2013 are:
21 new biomethane projects commissioned (with 51 million Nm3/y production
capacity3). Ultimate realisation deadline 3 years after commissioning;
16 manure co-digestion plants;
2 waste digesters;
2 mono-manure digesters;
1 gasifier plant.
Upgrading plants
In Table 15 the existing upgrading plants as of 2012 are given.
3 Nm3/y – based on 89% methane gas

84
Location
Type of biogas Upgrade process
Start date
Plant capacity
[Nm³/h raw gas]
Utilisation
Beverwijk Sewage gas Membrane 2007 350 Gas grid
Mijdrecht Sewage gas Chemical scrubber
2009 70 Gas grid
Collendoorn Landfill gas Membrane technology
1991 50 Gas grid
Nuenen Landfill gas PSA 1990 1500 Gas grid
Tilburg Landfill gas Water scrubber
1987 600 Gas grid
Wjister Landfill gas PSA 1989 1000 Gas grid
Groningen Biowaste Chemical scrubber
2010 1200 Gas grid
Zwolle Biowaste Water scrubber
2010 700 Gas grid
Witteveen Agriculture biogas/ cofermentation
Membrane 2010 300 Gas grid
Bunschoten-Spakenburg
Industrial waste Water scrubber
2010 1200 Gas grid
Well Industrial waste Membrane 2011 600 Gas grid
Dinteloord Organic waste Water scrubber
2011 2000 Gas grid
Rijsenhout Biowaste Chemical scrubber
2011 700 Gas grid
Tims Co-digestion Membrane 2011 400 Gas grid
Amsterdam-West Landfill gas Membrane 2012 150 Gas grid
Biddinghuizen Membrane 2012 400 Gas grid
Middenmeer Biowaste Organic physical scrubber
2012 1200 Gas grid
Spaarnwoude Criogenic separation
2012 200 Gas grid, LBG
Weurt Membrane 2012 700 Gas grid
Vierverlaten Water scrubber
2012 2200 Gas grid
Wijster Biowaste Chemical scrubber
2012 1200 Gas grid
Table 15: Existing upgrading plants (2012)
Biogas and syngas use
Electricity production
Since 2010, the share of biogas in electricity production is about 0,86 % of the total electricity use in the Netherlands (Compendium voor de leefomgeving, 2014).
Source 2010 2011 2012 2013
Landfill 0,09 0,08 0,07 0,06
Sewage Sludge 0,14 0,14 0,15 0,16
Agricultural 0,48 0,46 0,46 0,44
Other 0,16 0,19 0,19 0,20
Table 16: Renewable electricityfrom biogas (% of the total gross electricity use)
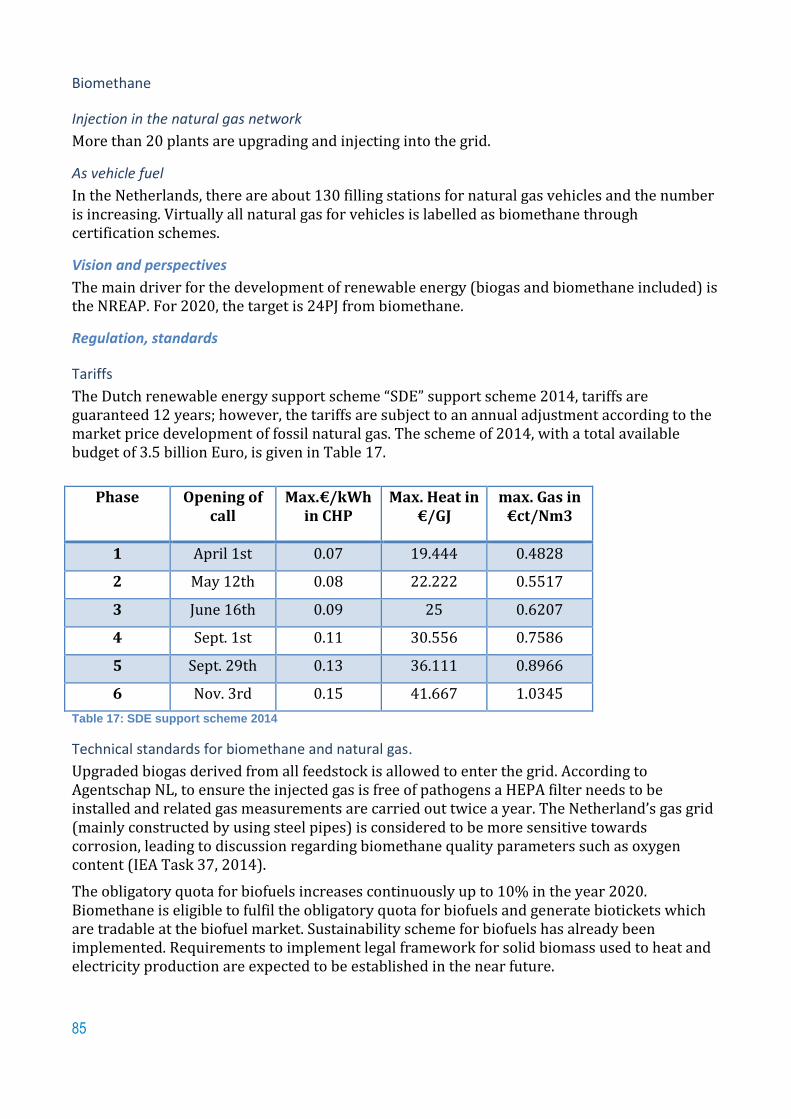
85
Biomethane
Injection in the natural gas network
More than 20 plants are upgrading and injecting into the grid.
As vehicle fuel
In the Netherlands, there are about 130 filling stations for natural gas vehicles and the number is increasing. Virtually all natural gas for vehicles is labelled as biomethane through certification schemes.
Vision and perspectives
The main driver for the development of renewable energy (biogas and biomethane included) is the NREAP. For 2020, the target is 24PJ from biomethane.
Regulation, standards
Tariffs
The Dutch renewable energy support scheme “SDE” support scheme 2014, tariffs are guaranteed 12 years; however, the tariffs are subject to an annual adjustment according to the market price development of fossil natural gas. The scheme of 2014, with a total available budget of 3.5 billion Euro, is given in Table 17.
Phase
Opening of call
Max.€/kWh in CHP
Max. Heat in €/GJ
max. Gas in €ct/Nm3
1 April 1st 0.07 19.444 0.4828
2 May 12th 0.08 22.222 0.5517
3 June 16th 0.09 25 0.6207
4 Sept. 1st 0.11 30.556 0.7586
5 Sept. 29th 0.13 36.111 0.8966
6 Nov. 3rd 0.15 41.667 1.0345
Table 17: SDE support scheme 2014
Technical standards for biomethane and natural gas.
Upgraded biogas derived from all feedstock is allowed to enter the grid. According to Agentschap NL, to ensure the injected gas is free of pathogens a HEPA filter needs to be installed and related gas measurements are carried out twice a year. The Netherland’s gas grid (mainly constructed by using steel pipes) is considered to be more sensitive towards corrosion, leading to discussion regarding biomethane quality parameters such as oxygen content (IEA Task 37, 2014).
The obligatory quota for biofuels increases continuously up to 10% in the year 2020. Biomethane is eligible to fulfil the obligatory quota for biofuels and generate biotickets which are tradable at the biofuel market. Sustainability scheme for biofuels has already been implemented. Requirements to implement legal framework for solid biomass used to heat and electricity production are expected to be established in the near future.

86
Certification
A certification scheme for biomethane was implemented on 1st of July 2009 and tracks and ensure the balance between biomethane input and output as well as the feedstock utilised for gas production. Annual audits are validated biomethane plants data.
References
The Oxford Institute For Energy Studies. The outlook for Natural Gas Demand in Europe. NG-87 (June 2014).
Overview of biomethane markets and regulations in partner countries; Sabine Strauch et al.; Green Gas Grids; March 2012.
IEA Bioenergy Task 37; Biogas upgrading plants in IEA Bioenergy Task 37 - member countries; Overview of biomethane markets and regulations in partner countries (2014).
A list of the EU-wide existing best practices for the biogas transport in the natural gas grids; Redubar, WP06 D19/M; Hungarian Scientific Society of Energy Economics ETE, Hungary; 2009.
www.compendiumvoordeleefomgeving.nl, Indicator 0517, 17-06-2014

87
Germany
Specific situation and expectation
Present state of gas consumption.
Germany is the largest gas consumer among all EU countries with only 13% of total gas demand is covered by the declining national reserves. Gas is imported from The Netherlands (20%), Norway (29%) and Russia (32%), a little amounts come from Denmark and UK. The total gas consumption was just above 87 Bcm in 2012 (IEA Bioenergy Task 37).
Around 0,2% of the cars in Germany are powered by natural gas.
Current and expected biogas and syngas production
At the end of 2013, there were over 9,800 biogas plants functioning, with a total of over 40,000 GWh/year production (table below). Most of these biogas plants produce electricity at the production location itself. Germany is world-wide leader in the field of feed-in of biomethane.
Figure 38: Production of biogas and number of plants (Source : Fed. ministry, 10.04.2014)
The technical potential for biogas production in Germany, until 2020 amounts to 500 PJ/a, broken down as follows:
335 PJ/a energy crops (1.6 Mio ha crop land),
105 PJ/a crop residues and animal manure
60 PJ/a municipal and industrial organic wastes
Of this potential, 40% is used presently.
The German government wants to substitute 10 % of natural gas with biogas for 2030. In 2009 1 % of objective was achieved (Graf 2012). The “Renewable Energy Sources Act“ (EEG) regulates granting of biogas injection. Legal and financial aspects are regulated within “Gas Network Access Ordinance” (GasNZV). Technical requirements are defined by DVGW standards.
Upgrading plants
For the upgrading of biogas to methane, a variety of technical methods is in use (see Figure 38). Because of the need of upstream feed-in from the distribution grids back to the transport grids, because of the low use of gas in summer, questions about the removal of oxygen and of de-odorizing are upcoming themes.

88
Figure 39: Upgrading technologies in use in Germany
The German definition of biogas is comparable to the IGU definition of renewable gases. It includes not only gases made from biomass, but also gas from mining (“Klär- und Grubengas”), hydrogen made by electrolysis (e.g. power to gas) and several types of bio syngas.
Biogas and syngas use
Heating
The contribution of biogas to heat supply, status of December 2013, is shown in Table 18:
Substrate plants Heat (GWh/year) (% of total consumption in Germany)
Biogas 1) 10,684 0.8 Sewagegas 1,735 0.1 Landfillgas 94 0.01 Total 12,513 0.91 1)
This includes: farmyard manure, energy crops, bio,- food,- and industrial waste. Table 18: The contribution of biogas to heat (IEA Task 37)
Electricity production
About 7900 biogas plants are expected to produce electricity in 2014, with around 3.7 GW installed electric power as represented in Figure 40.

89
Figure 40: Development of biogas production
The contribution of biogas from sewage wastewater and landfill to the electricity supply represents a minor part of the total used as shown in Table 19 the table below status December, 2013.
Substrate plants Electricity (GWh/year) (% of total consumption in Germany)
Biogas 1) 25,390 4.2 Sewagegas 1,314 0.2 Landfillgas 538 0.1 Total 27,242 4.5 1)
This includes: farmyard manure, energy crops, bio,- food,- and industrial waste. Table 19: Contribution of biogas to the electricity supply
Biomethane
Injection in the natural gas network
Germany is world-wide leader in the field of feed-in of biomethane. Starting with two locations in 2006, at the end of 2012 there 110 feed-in locations with a total capacity of 70.000 mn3/h. This leads to a yearly feed-in of around 0,6 billion mn3, which is about 10 % of the political goal for 2020, and 0,8 % of the actual natural gas use of Germany. The growth is insufficient to reach the goals of 6 billion mn3 in 2020 and 10 billion mn3 in 2030.
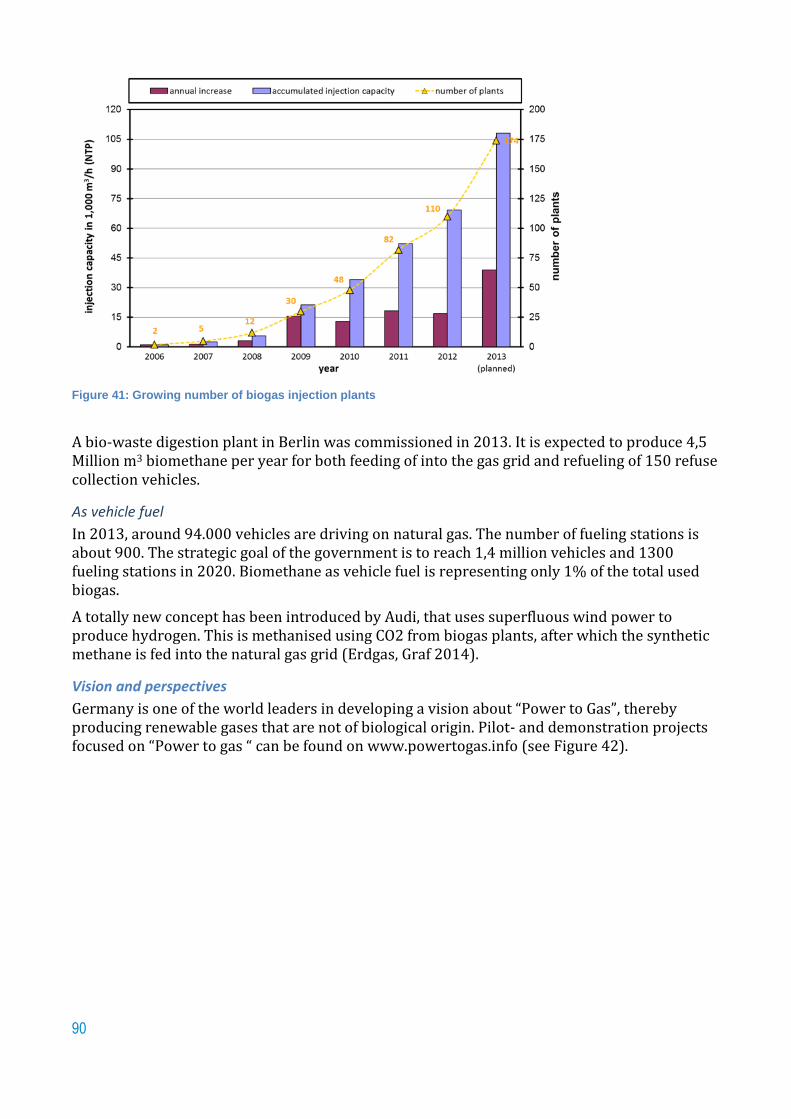
90
Figure 41: Growing number of biogas injection plants
A bio-waste digestion plant in Berlin was commissioned in 2013. It is expected to produce 4,5 Million m3 biomethane per year for both feeding of into the gas grid and refueling of 150 refuse collection vehicles.
As vehicle fuel
In 2013, around 94.000 vehicles are driving on natural gas. The number of fueling stations is about 900. The strategic goal of the government is to reach 1,4 million vehicles and 1300 fueling stations in 2020. Biomethane as vehicle fuel is representing only 1% of the total used biogas.
A totally new concept has been introduced by Audi, that uses superfluous wind power to produce hydrogen. This is methanised using CO2 from biogas plants, after which the synthetic methane is fed into the natural gas grid (Erdgas, Graf 2014).
Vision and perspectives
Germany is one of the world leaders in developing a vision about “Power to Gas”, thereby producing renewable gases that are not of biological origin. Pilot- and demonstration projects focused on “Power to gas “ can be found on www.powertogas.info (see Figure 42).

91
Figure 42: Screenshot of www.powertogas.info (23-02-2015)
Identification of the most relevant driving forces and barriers in producing and using biogas and
bio syngas
Financial support
Financial support systems according to the EEG 2012 depend on the size of the plant.
Plant Size
Basic Bonus
(€ ct/kWh)
Substrate category I1) (€ ct/kWh)
Substrate category II2) (€ ct/kWh)
Bonus for OFMSW4)
(€ ct/kWh)
Upgrading bonus (€ ct/kWh)
< 75 kWel 25 3) 3,0 up to 700 Nm3 /h;
2,0 up to 1000 Nm 3/h;
1,0 up to 1400 Nm3/h
< 150 kWel 14.3 6.0 8.0 16.0
< 500 kWel 12.3 6.0 8.0 16.0
< 750 kWel 11.0 5.0 8.0 14.0
< 5 MWel 11.0 4.0 8.0 14.0
< 20 MWel 6.0 0.0 0.0 14.0 1) Biogas crops, e.g. maize, beets, whole plant silage, > 60 % (w/w) animal slurry 2) Plants from landscape conservation, clover, > 60 % (w/w) animal waste, 3) > 80% (w/w) animal slurry, 4) Organic fraction of municipal solid waste
Table 20: Financial support scheme according EEG 2012
Regulation
Elements of a revised Renewable Energy Sources Act, Status March, 4, 2014 (IEA Task 37):
Share of renewables in electricity supply to 40-45 % by 2025 and to 55-60 % by 2035;

92
Bioenergy and biogas focus on waste and residual materials, annually added capacity of
100 megawatts;
Elimination of bonuses for biogas crops and biogas upgrading;
Reimbursement rates biomass, plant size up to 75 kWel, 150 kWel, 500 kWel, 5 MWel,
and 20 MWel; 23.73, 13.66, 11.78, 10.55 and 5.85 € cent / kWhel, respectively;
Reimbursement rates, biodegradable organic- and municipal waste up to 500 kWel, and
20 MWel; 15.26 and 13.38 € cent / kWhel, respectively 80% w/w animal slurry.
References
IEA Bioenergy Task 37; Biogas upgrading plants in IEA Bioenergy Task 37 - member countries; Overview of biomethane markets and regulations in partner countries (2014).
IEA Bioenergy Task 37; Country report Germany; Brazil; april 2-4, 2014; Bernd Linke, Leibniz-Institute for Agricultural Engineering Potsdam-Bornim, www.atb-potsdam.de
Federal ministry for the environment, nature conservation, building and nucleair safety
Injection of gases from renewable sources into the gas grid in Germany – potentials and limits; Frank Graf, Thomas Kolb; WGC 2012, Kuala Lumpur
Erdgas: BWK Bd. 65 (2013) nr.4; p94-105; F.Graf et al.
Netzeinspeisung regenerativ erzeugter Gase; ENERGIE|WASSER-PRAXIS; 6/2013; p.38-42; F. Hupka und M. Titz
http://www.powertogas.info/power-to-gas/interaktive-projektkarte.html
http://www.bmu.de/en/service/publications/downloads/details/artikel/renewable-energy-sources-act-eeg-2012/

93
France
Specific situation and expectation
Present state of gas consumption.
France imports gas from Norway (about 35%), Netherland (15,8%), Russia (15%) and Algeria (14,5%), it has less than 2% domestic natural gas production. In 2010, the total gas consumption was 567 TWh (Green gas grids, 2012).
Total gas consumption was just over 44 Bcm in 2012 (Oxford, 2014)
More than 13 000 vehicle in public and transport service run on natural gas. Most of them are busses and garbage trucks. About 140 filling stations are offering natural gas, but only 32 of them are public access sites.
Current and expected biogas and syngas production
Methanization in France is growing slowly, mainly in the agriculture field.
Status 2011
The biogas production is about 1300 millions of m3 representing a potential of 7 TWh of primary energy.
75% of the biogas is produced in landfill. The other 25% is produced in methanization plants.
Only 60% of all biogas produced is valorized.
197 methanisation installations :
80 industrial plants; 41 farm plants; 7 centralized plants (treating a
mix of waste from different origins);
60 sewage plants.
Figure 43: Methanization plants in France
Upgrading plants
There are four upgrading plants being build. At the beginning of 2013, the only plant injecting biomethane into the grid was in Lille, north of France (IEA, Ademe, 2013).
Plant Substrate Upgrading Technique
Capacity Nm3/h
Utilization of Biogas
Lille biowaste, Water scrubber 700 injection
Claye-Souilly household waste, landfill
PSA + membrane
100 vehicle fuel
Forbach Biowaste Membrane 50 (to 100) injection
Bioénergie de la Brie
on-farm Membrane (Air Liquide)
100 Injection
Table 21: Upgrading plants in France

94
Biogas and syngas use
Electricity production
The main use of biogas in France at the moment is cogeneration, using both the electricity and heat.
Biomethane to NG network
There is only one plant injecting biomethane into the grid (in Lille) in France at the moment. In 2013, about 350 projects are under study for injection into the natural gas grids. GrDF studies 300 of those projects. About 3 projects will be commissioned in 2013, 10 to 12 in 2014 and about 15 to 20 per year in the years after.
The average injection flow rate of the projects is 250 Nm3/h. This is the effect of waster owners/producers grouping together in order to mutualize the investment and reach a profitable size. That kind of installation is called centralized methanization.
Vision and perspectives
Perspectives for first generation biomethane
Encouraged by the elevation of energy price and their new responsibilities to organize ecological and energetic transition local authorities are triggered by the idea that the waste of their territory can be transformed in energy and fuel for public transport for their territory. This leads to the idea of a larger independency and a circular economy.
Another positive effect of biomethane development is NGV emergence. The first signal has come from the European commission with its plan to diversify the energy mix in transport.
BioNGV is also systematically studied in projects lead by local authorities based on municipal waste. In a way the experience of SYDEME in Moselle department is certainly a reference.
In 2012, ADEME has published a report on a prospective work realized and estimates that 17% of the gas consumption in France in 2030 would be biomethane and that 45% of natural gas (not necessarily biomethane) in transport in 2050.
Second and third generation biomethane
Context
The French Government has launched in 2008 a Call for Proposals for Demonstration Projects in the field of 2nd Generation Biofuels. Two projects have been selected, one for Biodiesel 2G (BioTFuel) and one for Biomethane 2g (GAYA). An agro-industry player, SOFIPROTEOL is the coordinator and the BioTfuel project and GDF SUEZ is the coordinator and main contributor of the GAYA Project.
Although the main driver for investing in R&D and demonstration of 2G biomethane (bioSNG) was biofuels for transportation application, it was already foreseen as grid energy through injection. Then all the applications of natural gas are of concerns for such biomethane.
A strong competition is then already in place between 2G liquid biofuels and 2G gaseous biofuels (biomethane). In energy players’ landscape, GDF SUEZ is the only player in France for 2G biomethane.

95
GDF SUEZ Vision
BioSNG is complementary of biomethane from anaerobic digestion or from the micro-algae as there not addressing the same feedstock. Their productions are not in competition and will add each other.
For 2G biomethane production, 2 main schemes could be imagined:
A centralized scheme, where biomethane plants (100-500 MW or 10 000-50 000 m3/h)
are far from feedstock and located near large cities or industrial complex using grid gas.
A decentralized scheme where biomethane plants (20-50 MW) are located as close as
possible to the feedstock.
GDF SUEZ has chosen the decentralized scheme to enhance the carbon balance (minimum biomass transportation) and maximize the global energy efficiency (extra heat valorization).
This scheme is well adapted to countries like France, or Germany where the woody biomass feedstock is well distributed among the country and where the natural gas grids (distribution and transmission) are dense (GrDF, February 2013).
As a complement to biomethane from Anaerobic Digestion and Gasification, micro-algoes can be harvested to produce chemical products and biomethane through photosynthesis and waste treatment.
Figure 44: Decentralized vision for 2G biomethane (BioSNG)

96
Figure 45: Third generation biomethane scheme
Potential
On behalf of GrDF, the main gas grid distribution company in France, the CRIGEN Research Center of GDF SUEZ has made a study in 2012 on feedstock potential for bio-SNG in France. This study was made under supervision of a Steering Committee gathering representatives and experts from the main Government Organizations in charge of Sustainable Development and Renewable Energies in France.
The results of this study are now public (Biomethane de gazeification; January 2013).
The biomass in the scope of that study was the one not presently valorized in the following categories:
Forest biomass;
By-products from saw mills, end-of-life wood and paper sludge;
Agricultural by-products (straw,…);
Energy crops;
By-products from agro-industries.
Three different prospective scenarios have been tested. The results have shown a very significant technical potential of around 150 TWh for 2050 when present consumption of NG in France is around 500 TWh (see Figure 46).

97
Figure 46: BioSNG Production Potential in France (TWh/year)
Figure 47: Different types of Biomethane and their production potential in France
Research & Development
The only R&D and demonstration project active in France for the BioSNG is the GAYA Project. This project is addressing the whole chain from feedstock to BioSNG injection. It aims by 2017 to develop the BioSNG technology by reducing production cost while keeping high standards of energy efficiency, environmental impact and social acceptability. The construction R&D and demo platform of the project has started in 2013 in Saint-Fons near the city of Lyon for a commissioning beginning of 2014. This platform will be able to run tests and make demonstration on the whole chain, from biomass handling to BioSNG output.

98
Regulation
Context
Electricity from biogas feed-in tariffs exists since 2006. Those tariffs have been modified in 2012 soon after the regulation concerning injection into the gas grids has been published.
Both feed-in tariffs have been determined by the environment and energy ministry with the objective that for one plant the business case would be equivalent of one or the other valorization of biogas and the project manager more inclined to take the local needs of energy into account instead of pure economical interest.
Experience will tell whether the effort was in vain or not.
Regulation related to injection of biomethane in the gas grids
The regulation has been published in 2011. It states that :
Biomethane :
o Only biomethane made organic waste from agriculture, from collectivities and
from industry can be injected into natural gas grids. Sewage sludge are not
allowed at the moment but the sanitary study and decision is under process.
o Energetic cultures are not encouraged.
o Biomethane quality must meet natural gas specifications.
Production :
o The production has to be adapted to the natural gas consumption on the grid
downstream. A dedicated storage tank is thus required.
Trading of biomethane :
o Only authorized gas suppliers can buy biomethane in case of injection into the
grid.
o Suppliers and producers are linked by contract for 15 years.
o The price of biomethane is fixed by regulation and varies with the type of
production (landfill/methanization), the production flow rate and – in case of
methanization- the origin of waste (industry/agriculture or municipal waste) :
between 45 and 125 €/MWh
o For each MWh of biomethane injected into the grid, the supplier which has
bought the biomethane can claim the emission of one guaranty of origin. This
traceability system will allow natural gas suppliers to offer green gas to
costumers sensitive to environment arguments.
o The cost differential between natural gas and biomethane is mutualized and re-
affected to all suppliers depending on their respective market share on the
natural gas market
The grid operator is in charge of :
Controlling biomethane quality and conformity to natural gas specifications; Odorizing (facultative, can be transferred to the producer); Regulating the pressure in order to facilitate biomethane admission into the grid; Metering.
99
An evaluation of this regulation is coming soon which will allow to combine both cogeneration and injection on the same plant and be eligible to both feed-in tariffs.
This complete regulation frame is the result of a consultation work started in 2010 between the gas grids operators, the biogas field professionals and the representatives of public authorities. This working group has published an on-line guide about injection : www.injectionbiomethane.com.
References
Rapport de Mission - « Les usages non alimentaires de la biomasse » - Septembre 2012 – (www.cgedd.developpement-durable.gouv.fr/les-usages-non-alimentaires-de-la-a1385.html)
Biomethane de gazeification – Evaluation du potentiel de production en France aux horizons 2020 et 2050 – Rapport final GrDF – Janvier 2013
Etude du potentiel de biométhane 3G à l'horizon 2020 – 2050 – Rapport final GrDF – Janvier 2013
Müller-Langer, F., A. Perimenis, et al. (2009). "Economic and environmental aspects of BioSNG compared with other biofuels." Communication, BioSNG Congress, Zurich.
Identifying environmentally and economically optimal bioenergy plant sizes and locations: A spatial model of wood-based SNG value chains - Bernhard Steubing and al. - Renewable Energy – 2012 - www.sciencedirect.com/science/article/pii/S0960148112004880
GREEN GAS GRIDS. (2012). Overview of biomethane markets and regulations in partner countries.
NG-87 The Oxford Institute for Energy Studies – The outlook for natural gas demand in Europe; June 2014
IEA Country report France; Ademe; April 2013
Current situation and perspectives of biomethane in France in 2013; GrDF; February 2013

100
Spain
Specific situation and expectation
Present state of gas consumption
Spain imports the vast majority of its gas volumes from Algeria, Nigeria and Qatar. Due to its high dependency on imports, Spain has a total underground storage capacity of 4,668 mcm, which is more than 18% of its total gas annual consumption. The sharing-out of natural gas consumption by end-use sectors in 2014 was as follows:
Figure 48: Use of gas in Spain in 2014 (SEDIGAS, 2014)
The evolution of this segmentation over time shows a very remarkable decrease in the share of gas dedicated to electricity generation, reaching a percentage of 17% in 2014 from a 40% in year 2009. In the last four years there has been a significant decrease in the use of gas for electricity generation due to the reduction in consumption because of the economic recession and the increase of production with renewable energies and with coal.

101
Figure 49: Changes in the use of gas in Spain (Sedigas)
Current and expected biogas and syngas production
The biogas potential varies depending on the origin:
Biogas source Total potential (ktoe)
Accessible potential (ktoe)
Available potential (ktoe)
Agro-industrial 3 467,5 1 887,4 1 425,1
Organic fraction of municipal solid wastes
778,1 311,2 124,5
Sludges from waste water treatment plant
164,4 123,3 123,3
Landfill 957,9 208,8 145,6
Total 4 589,8 2 321,9 1 818,5 Table 22: Biogas potential
Upgrading plants
Upgrading plants in operation are shown in Table 23.
Location Substrate End use CH4 (%)
Technology Plant Capacity (Nm3/h
Raw gas)
Start of operation
Vacarisses (Barcelona)
Landfill gas Vehicle fuel >85 Chemical scrubber
100 2005
Madrid Biowaste Injection into natural gas
network
98 Water scrubber & stripping &
dryer
2400-4000 2012 (first injection)
Almazán (Soria)
Pig manure Vehicle fuel and grid injection
>92 Cryogenic + Algae
10 LIFE project: June-December
2013 Table 23: Upgrading plants in operation
102
Biogas and syngas use
Electricity production
In 2012, 866 GWh (EurObserv’ER; 2014) electricity was produced from biogas. A part of the upgraded biogas is used for the generation of electricity by combustion in existing internal combustion engines.
Heat and electricity
In 2010, the thermal use from biogas was 34 Ktoe.
Biomethane
Injection in the natural gas network
The injection into the natural gas network requires the implementation of the necessary
infrastructure, as well as efficiency improvement of technological and logistic issues regarding
purification and upgrading of biogas.
Since 2011, the Spanish gas quality specifications for biomethane injection into the high pressure Natural Gas grid are described in the Protocol Detail PD-01 of the Technical Management of the Gas System Regulations.
As vehicle fuel
The upgraded gas is to be used as fuel for vehicles and other uses.
Vision and perspectives
Various entities work on biogas such as:
The Biogas Spanish Association “AEBIG”, with 28 members and partner of the European
Biogas Association “EBA” which work on the developing of agro-industrial biogas;
Various R&D centres (AINA and GIRO), institutions (CEBAS-CSIC- CIEMAT). One of the
most innovative activities is developed in the framework of a singular project named
PROBIOGAS.
The Renewable Energy Plan 2011 – 2020 estimates a total installed power in 2020 of 400 MW for biogas. Regarding thermal uses, the Plan estimates 100 ktoe for biogas in 2020.
The technology for biogas with a higher development potential will be anaerobic digesters used in food waste, agro-industrial and farming waste.
Small cogeneration units as well as plants over 10 MW will play a significant role in the development of the sector.
Regulation, standards
Royal Decree 413/2014, and Order IET/1045/2014 by which it was established, introduce a feed-in tariff regime for the electricity production for each type of process. So, electricity production can be sold according to the tariff from the special regime.
Protocol Detail PD-01 establishes the gas quality standard specifications required for biomethane injection into the high pressure national natural gas grid. Certain parameters contained in biomethane and other non-conventional gas sources are more restrictive for its injection into the high pressure natural grid. This is due to the existence of underground storages that could be affected by high concentration of oxygen, content of water, CO2 and sulfur compounds. On the other hand, at high pressure, the risk of corrosion is significantly increased in the presence of the mentioned components.

103
References
www.energydelta.org/mainmenu/energy-knowledge/country-gas-profiles/country-profile-spain
Spanish Energy Regulator’s National Report To The European Commission 2014 (CNMC - Comisión Nacional de los Mercados y la Competencia) - 31th July 2014; www.cnmc.es/Portals/0/Ficheros/Energia/Publicaciones_Anuales/140731_NR_CNMC_final.pdf
Global status for upgrading of biogas; IEA
Spain's national renewable energy action plan 2011-2020; 30 June 2010; Ministry of Industry, Tourism and Commerce
The State of Renewable Energies in Europe Edition 2014; 14th EurObserv’ER Report

104
Switzerland
Specific situation and expectation
Present state of gas consumption.
The total gas consumption was about 3.6Bcm in 2012 (Oxford, 2014).
Natural gas consumption represent about 12% of the Swiss final energy consumption, which is low comparing to the other European countries. This is the result of little inland resources and the dependence on gas imports. Of the natural gas consumed, 41% comes from the European Union, while major other suppliers are Norway (23%) and Russia (24%) (Green Gas Grids, 2012).
The distribution gas network is well established in the North, development has started in the South, whereas the expansion is very limited in the mountainous areas.
Switzerland appears among leading countries in the CNG utilisation within the transport sector because the government is aware of the environmental benefits. According to Gasmobil AG, in 2012 there were around 130 public stations and 10,000 CNG cars such as passengers cars, commercial and light duty vehicles.
Current and expected biogas and syngas production
At the end of 2013, biogas plants were divided as follows (IEA Bachmann, 2014) :
Agriculture: 96 plants
Biowaste: 29 plants
Industrial waste water: 22 plants
Waste water treatment plants: ~ 465 plants (282 with CHP)
Figure 50: Gross gas production (IEA, Bachmann)

105
Figure 51: Gross gas production from waste water treatment plants( IEA, Bachmann)
Upgrading plants
The existing upgrading plants at the end of 2013 are:
Plant Substrate Upgrading Technique
Capacity Nm3/h
Utilization of Biogas
Operation start
Volketswil biowaste, Chemical scrubber 100 Gas grid 2010
Lavigny biowaste, PSA 100 Gas grid 2009
Utzensdorf Biowaste PSA 100 Gas grid 2009
Pratteln Biowaste Organic physical scrubber
100 Gas grid 2006
Otelfingen Biowaste PSA 50 Vehicle fuel 1998
Rümlang Biowaste PSA 30 Vehicle fuel 1995
Samstagern Biowaste PSA 50 Gas grid 1995
Widnau Agr., co-digestion PSA 100 Gas grid 2008
Inwil Agr., co-digestion Amine scrubber 300 Gas grid 2008
Geneva Sewage sludge PSA 350 Gas grid 2013
Zurich Sewage sludge Chemical scrubber 1400 Gas grid 2013
Fribourg Sewage sludge PSA 250 Gas grid 2012
Roche Sewage sludge PSA 250 Gas grid 2009
Obermeilen Sewage sludge Chemical scrubber 60 Gas grid 2008
Berne Sewage sludge Chemical scrubber 1500 Gas grid 2007
Romanshorn Sewage sludge Organic physical scrubber
20 Gas grid 2007
Emmenbrücke Sewage sludge PSA 90 Gas grid 2006
Münchwilen Animal by-products Chemical scrubber 650 Gas grid 2011
Aarberg PSA 500 Gas grid 2013 Table 24: Upgrading plants (IEA, Bachmann)
Biogas and syngas use
Electricity production
The total electricity production was 281 GWh/year in 2013.

106
Heat and electricity
By the end of 2014, 6 new CHP agriculture biogas plants will start operating.
Biomethane
The total biomethane production was 128 GWh/year in 2013.
Injection in the natural gas network
The commissioning of the two first upgrading plants was on 2006. In 2013, 17 upgrading plants were injecting on the grid, nearly half of them use the sewage sludge as a substrate.
As vehicle fuel
At the end of 2013, there were 140 filling stations supplied by 2 biomethane plants using biowaste as a substrate. The first biomethane plants started in 1995 the second one in 1998.
Vision and perspectives
Several Studies and Research Projects are underway :
Determination of methane production in laboratory:
Comparision of laboratory BMP test results and real methane production in full-scale
plants (2012 – 2014).C. Holliger, EPFL (http://lbe.epfl.ch/page-83701.html);
ORION – Organic waste management by automated small-scale AD:
Development of an on-site organic waste treatment for SME (www.project-orion.eu).EU
7th framework program;
Agricultural dry batch digestion:
Pilot plant of a dry batch digester, fed with dry manure (2012 – 2014). C. Morrier;
Hygiene of digestate:
Tracking of pathogens in substrates from digester feeding until digestate spreading on
agricultural fields (2012 – 2014). J. Fuchs / FIBL;
Membrane separation:
Establishment of a pilot plant for small-scale biogas upgrading (2012 – 2014). U. Oester
/ Apex AG. Pilot small scale biogas upgrading plant to demonstrate the economic
faisability and reliability of plants smaller than 50 Nm3/h of upgraded gas.
Published reports 2013/2014 are related to (www.bfe.admin.ch):
Post-treatment of digestate. H. Engeli et al.;
Mini-biogas. Identification and evaluation of technologies forsmall-scale digestion. Y.
Membrez et al.;
Measurement of odour emissions and development of an odouremission-model for
biogas plants. Holger F. et al.;
Digestion of manure and Co-Substrates in a Membrane Bioreactor. Meier U. et al.
Financial support
Feed in tariff for electricity from biogas are as indicated in Table 25:

107
Power class ≤ 50 kW ≤ 100 kW
≤ 500 kW
≤ 5 Mw >5 MW
Basic tariff [CHF/kWh] 0.28 0.25 0.22 0.185 0.175
Agricultural bonus [CHF/kWh] 0.18 0.16 0.13 0.045 0
Heat bonus [CHF/kWh] 0.025 0.025 0.025 0.025 0.025
Maximum [CHF/kWh] 0.485 0.435 0.375 0.255 0.20 Table 25: Feed-in tariff for electricity
A voluntary support program for biomethane injection by the Swiss Gas Association aims at the injection of 300 GWh biomethane within 6 years. This biogas fund has a yearly budget of 3 million CHF.
Projects reducing GHG emissions can receive financial support.
References
NG-87 The Oxford Institute for Energy Studies – The outlook for natural gas demand in Europe; June 2014
GREEN GAS GRIDS. (2012). Overview of biomethane markets and regulations in partner countries.
www.erdgasfahren.ch (Erdgasmobil AG)
IEA Bioenergy Task 37 - Swiss Country Report; Natalie Bachmann; Angers, October 2014;
www.bfe.admin.ch/forschungbiomasse/02390/02720/03176/index.html?lang=de
www.erdgas.ch/biogas/foerderung-der-biogas-einspeisung/
http://www.bafu.admin.ch/publikationen/publikation/00101/index.html?lang=de
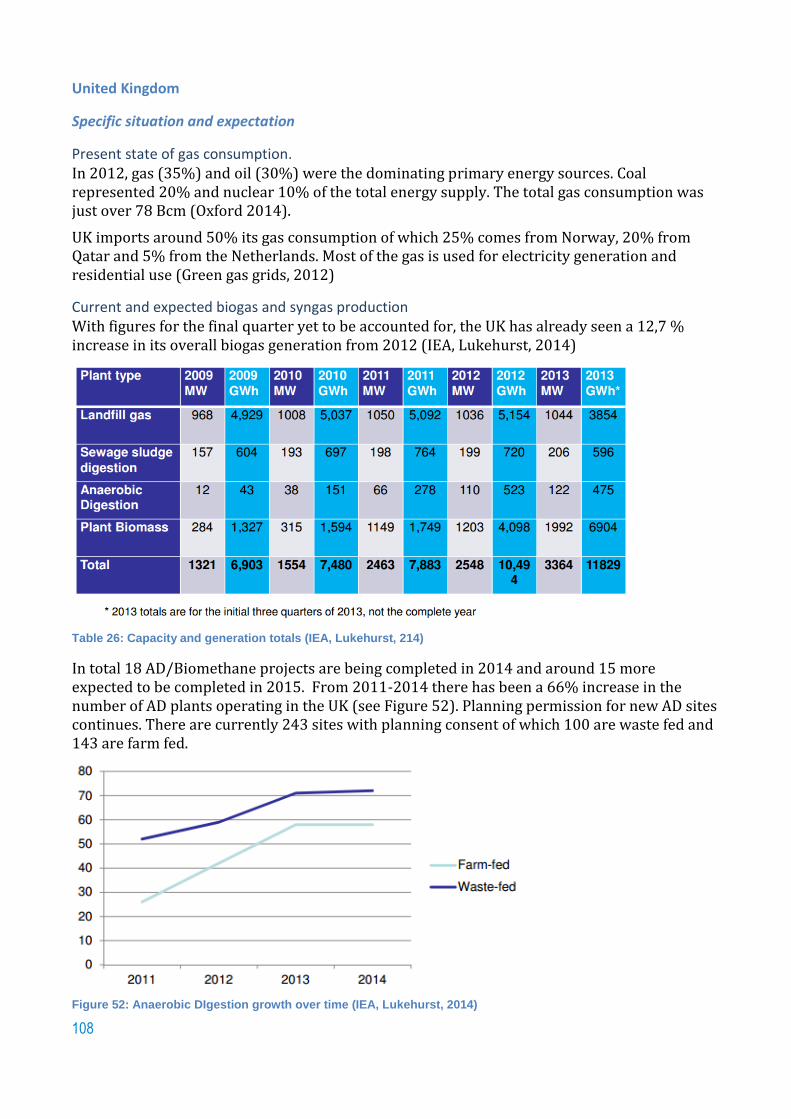
108
United Kingdom
Specific situation and expectation
Present state of gas consumption. In 2012, gas (35%) and oil (30%) were the dominating primary energy sources. Coal represented 20% and nuclear 10% of the total energy supply. The total gas consumption was just over 78 Bcm (Oxford 2014).
UK imports around 50% its gas consumption of which 25% comes from Norway, 20% from Qatar and 5% from the Netherlands. Most of the gas is used for electricity generation and residential use (Green gas grids, 2012)
Current and expected biogas and syngas production With figures for the final quarter yet to be accounted for, the UK has already seen a 12,7 % increase in its overall biogas generation from 2012 (IEA, Lukehurst, 2014)
Table 26: Capacity and generation totals (IEA, Lukehurst, 214)
In total 18 AD/Biomethane projects are being completed in 2014 and around 15 more expected to be completed in 2015. From 2011-2014 there has been a 66% increase in the number of AD plants operating in the UK (see Figure 52). Planning permission for new AD sites continues. There are currently 243 sites with planning consent of which 100 are waste fed and 143 are farm fed.
Figure 52: Anaerobic DIgestion growth over time (IEA, Lukehurst, 2014)
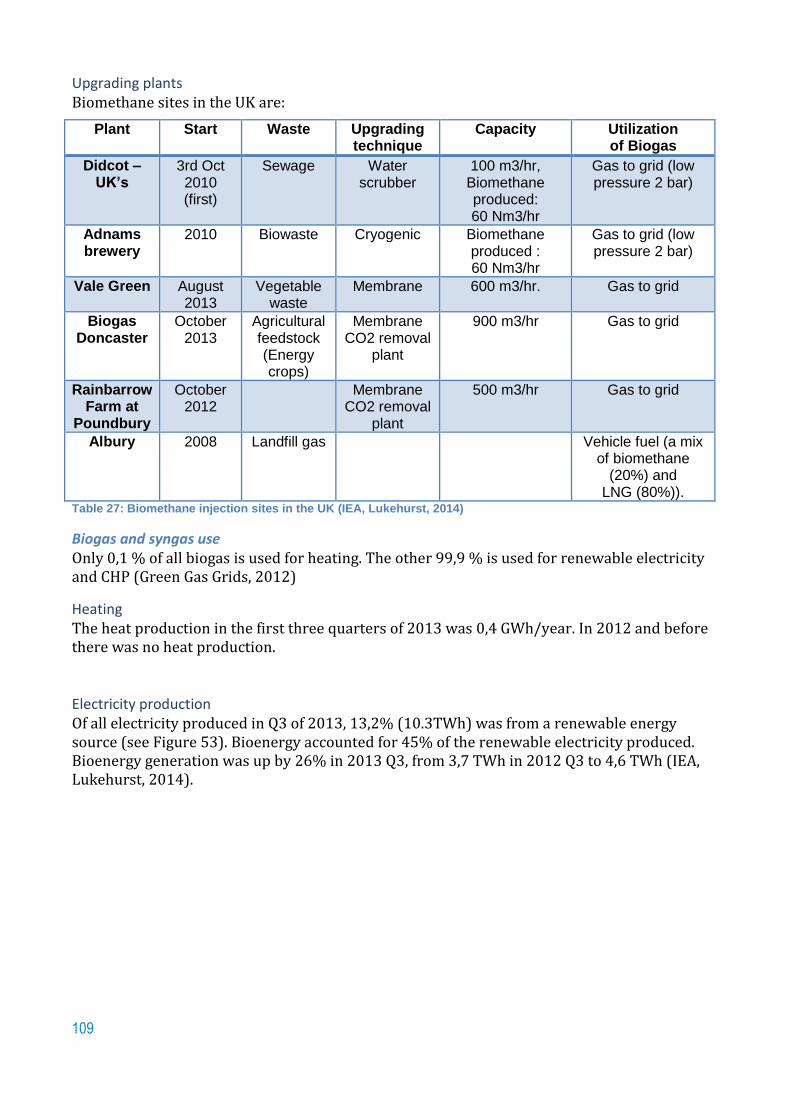
109
Upgrading plants
Biomethane sites in the UK are:
Plant Start Waste Upgrading technique
Capacity Utilization of Biogas
Didcot –UK’s
3rd Oct 2010 (first)
Sewage Water scrubber
100 m3/hr, Biomethane produced: 60 Nm3/hr
Gas to grid (low pressure 2 bar)
Adnams brewery
2010 Biowaste Cryogenic Biomethane produced : 60 Nm3/hr
Gas to grid (low pressure 2 bar)
Vale Green August 2013
Vegetable waste
Membrane 600 m3/hr. Gas to grid
Biogas Doncaster
October 2013
Agricultural feedstock (Energy crops)
Membrane CO2 removal
plant
900 m3/hr Gas to grid
Rainbarrow Farm at
Poundbury
October 2012
Membrane CO2 removal
plant
500 m3/hr Gas to grid
Albury 2008 Landfill gas Vehicle fuel (a mix of biomethane
(20%) and LNG (80%)).
Table 27: Biomethane injection sites in the UK (IEA, Lukehurst, 2014)
Biogas and syngas use Only 0,1 % of all biogas is used for heating. The other 99,9 % is used for renewable electricity and CHP (Green Gas Grids, 2012)
Heating The heat production in the first three quarters of 2013 was 0,4 GWh/year. In 2012 and before there was no heat production.
Electricity production Of all electricity produced in Q3 of 2013, 13,2% (10.3TWh) was from a renewable energy source (see Figure 53). Bioenergy accounted for 45% of the renewable electricity produced. Bioenergy generation was up by 26% in 2013 Q3, from 3,7 TWh in 2012 Q3 to 4,6 TWh (IEA, Lukehurst, 2014).

110
Figure 53: Share of renewables in the electricity generation (IEA, Lukehurst, 2014)
Utilisation of biogas expressed in GWh/year for electricity production is given in the following table:
Year Electricity production (GWh/year)
2013 does not include the last quarter
11,829
2012 10,494
2011 7,883 Table 28: Electricity production from biogas
Landfill gas is already extracted and used in the generation of electricity at over 35 sites in the UK.
Biomethane
Injection in the natural gas network On 3 October 2010, biogas was injected into the UK gas grid for the first time. Sewage from over 30,000 Oxfordshire homes is sent to Didcot sewage treatment works, where it is treated in an anaerobic digestor to produce biogas, which is then cleaned to provide gas for approximately 200 homes. In total 5 biogas plants are injecting into the grid (Table 27).
As vehicle fuel The first liquid biomethane (LBM) plant was opened in 2008 at SITA UK’s landfill site in Albury, Surrey. The refuelling station use a mix of biomethane (20%) and LNG (80%).
The market for CNG as a vehicle fuel in the UK is in its infancy although biomethane as a vehicle fuel is beginning to increase.

111
Year Vehicle fuel (million litres)
2013 does not include the last quarter
1,08
2012 1,2
2011 0,7 Table 29: Vehicle fuel from biogas
Vision and perspectives Under the EU Renewable Energy Directive, UK aims to replace 15% of fossil fuel with renewable energy by 2020. Biogas, and specifically biomethane injection, is seen as a technology that has significant potential in contributing to this target. The UK Government has proposed 7 TWh of biomethane injection by 2015 as a possible scenario, but no specific target has been set.
Regulation and economic support WRAP is a charity fund aiming for a world in which resources are used sustainably (www.wrap.org.uk). WRAP works with UK Governments, the EU and other funders to help deliver their policies on waste prevention and resource efficiency. Three of their funds are of specific interest for biogas production:
On-Farm AD
The On-Farm Anaerobic Digestion Fund has been developed to help farmers in England get financial support to build small-scale AD plants on their farms. Launched in October 2013 to help support the development of new farm based AD in England. The fund will be applicable to sub 250kW plants which have access to slurry and/or manure.
AD Loan Fund The Anaerobic Digestion Loan Fund is a ₤10M fund offering direct financial support to organisations building new AD capacity in England. It aims to ensure that food waste is diverted from landfill or from other, less environmentally sustainable operations, up the waste hierarchy. The purpose of the loan fund is to leverage or top up private sector funding (not to replace it) or to materially accelerate the projects. It is launched in 2011 to help support the construction of food waste digesters. The scheme offers loans of between £50k and£1M.
Rural Communities Renewable Energy Fund The Rural Community Energy Fund (RCEF) is a £15 million programme, jointly funded by the Department for Environment, Food and Rural Affairs (Defra) and the Department of Energy & Climate Change (DECC). It supports rural communities in England to develop renewable energy projects which provide economic and social benefits to the community. It provides up to £150k of funding for feasibility and pre-planning development work to help community renewable energy projects become investment ready.
The Renewable Heat Incentive (RHI) was introduced in 2011 with a total budget of 860 million GBP in order to promote the delivery of renewable heat at all scales and to stimulate this new market. Biogenic gases from AD, sewage (but not from landfill) and gasification/bio-SNG are supported under the RHI regime with biomethane facilities commissioned on or after 15th of April 2009 enjoying a premium of about 7.3 pence per injected kilowatt hour which is paid on top of the gas price. The tariffs are fixed for a total of 20 years and increases with inflation.
Since April 2010 Feed-in Tariffs (FITs) have provided financial support for small scale low carbon electricity installations of up to 5 MW. FITs for electricity generated from biogas receive

112
from 9 to 13 pence per kilowatt hour (depends on plant size) are paid on top of the average electricity price. The tariffs are grandfathered for 15 years and increase with inflation.
Table 30: Feed-in tariffs (IEA, Lukehurst, 2014)
For Transport, Renewable Transport Fuel Certificates (RTFC) are received from biomethane (only if directly used in a vehicle , eg as Compressed Biomethane). These are worth around 20 p/kg which equates to around 1.4 p/kWh and hence this option not attractive compared to grid injection. If the feedstock is waste then each kg of biomethane earns 2 x RTFCs. The RTFCS are priced according to supply/demand for such certificates as the diesel/petrol suppliers have to use a certain proportion of bio-ethanol/biodiesel/biomethane
There is no biomethane from AD in the UK that earns RTFCs. (Green Gas Grids, 2012)
References NG-87 The Oxford Institute for Energy Studies – The outlook for natural gas demand in Europe; June 2014
GREEN GAS GRIDS. (2012). Overview of biomethane markets and regulations in partner countries.
IEA Task 37 – Biogas; UK Country report; March 2014; Clare Lukehurst
www.wrap.org.uk

113
Poland
Specific situation and expectation
Present state of gas consumption
Gas represent 14% of the Total Primary Energy Supply. Poland produces about 30% of the country demand. The major quantity of the demand is imported from Russia and very little from Germany and Ukraine (Oxford, 2014).
The infrastructure of LPG refueling cars is well developed. By 2011, there were around 6,000 RPG refueling stops. However, only 30 CNG filling stations serve around 2,000 cars (Green Gas Grids, 2012).
Current and expected biogas and syngas production
By 2010, landfill and sewage gas facilities fuelled more than 200 power plants; only 19 plants were running on agriculture biomass or bio waste (Green Gas Grids, 2012).
Upgrading plants
There is no upgrading plants in operation or under construction. The biogas power plants convert biogas directly to electricity (Green Gas Grids, 2012).
Biogas and syngas use
Heating
The Polish energy policy aims at 503 ktoe (5.8TWh) in 2020 and 800 ktoe (9.3TWh) in 2030. Starting from approximately 74 MW generation capacity of gross electricity on biogas CHP 2010, this figure is planned to rise up to 802 MW by 2020 and 1,379 MW by 2030, a market share of biogas CHP of 2.7 % of in 2030 (Green Gas Grids, 2012).
Electricity production
The main biogas electricity production is fuelled by landfill and sewage gas facilities. The 19 plants running on agricultural biomass or bio waste are listed in Table 31.
Location Year of
commissioning Installed electrical
capacity (MW) Feedstock
Pawlowko 2005 0.95 Organic mix
Plaszczyca 2008 0.63 Pig manure, silage, oil-derived wastes
Kujanki 2008 n.a. Pig manure
Koczala 2009 2.13 Pig manure, silage, food industry derived wastes
Liszowo 2009 2.13 Food industry derived wastes
Niedoradz 2009 0.25 Pig manure, chicken wastes
Studzionka 2009 0.03 Pig manure, chicken wastes
Naclaw 2010 0.63 Manure, maize silage
Swielino 2010 0.63 Pig manure with supplementary components: corne silage, glycerine and products and semi-products of crop and feed production.
Kalsk 2010 1.0 Maize silage, sorgo, manure
Kostkowice 2010 0.6 Manure, organic wastes
Gizyn 2011 1.063 Pig manure with supplementary components: corn silage, glycerine and products and semi-products of crop and

114
feed production.
Uhnin 2011 1.27 Maize: silage, rye and grass, organic wastes
Uniechowek 2011 1.063 Pig manure with supplementary components: corn silage, glycerine and products and semi-products of crop and feed production.
Swidnica 2011 0.9 Silage and grass maize
Skrzatusz 2011 0.5 Waste processing industry: distillers grains, potato pulp, waste from carrots
LanyWielkie 2011 0.5 Manure, distillers’gGrains
Piaski 2011 0.99 Liquid waste from diary
Grzmiaca 2011 1.6 Maize silage Table 31: Polish agricultural or bio waste biogas projects in operation (Green Gas Grids, 2012)
Electricity production from biogas is estimated to reach 344 ktoe (4TWh) in 2020 and 592 ktoe (6.9TWh) in 2030.
Heat and electricity
Gross electricity on biogas CHP could reach 802 MW by 2020 and 1,379 MW by 2030 capacity generation.
Biomethane
Upgrading plants that produce biomethane have not been in operation or under construction.
Regulation, standards
The operator of the gas is obliged to accept agricultural biogas when conforming with the gas quality parameters. Landfill gas and sewage gas are restricted from the grid.
The requirements for gas quality in the grid are laid down in Polish Standards PN-C- 04752:2011 and PN-C-04753:2011. There are two gas qualities in Poland, high-methane gas – with a minimal required calorific value of 34.0MJ/m3 and nitrogen-rich gas with a minimal required calorific value of 18.0MJ/m3 (Green Gas Grids, 2012).
Compared to the extensive agricultural land and the numerous livestock farms, the deployment of biogas technology remains limited. The main reasons are the low financial incentives paid for renewable electricity from biogas and the absence of a supportive legal framework that was under revision in 2012.
Financial support
The Polish governmental supports renewable energies through the following measures:
Tradable Certificates of Origin introduced by April 2005 with the amended Law on Energy;
Obligation for Power Purchase from Renewable Sources (2000, amended in 2003); Levy exemption from consumption tax for electricity introduced in 2002.
Suppliers of electricity are required to source a certain percentage of renewable energy. This percentage is fixed to 8.76% for the year 2012 and shall increase to 15 % in 2020. Trading green certificates derived from the generation of renewable electricity can fulfill the obligation. The scheme is administered by Energy Regulatory Office and does not include a technology specific rating, all types of RES are traded at the same certificate price, which is an advantage for established technologies with low electricity production costs.

115
Moreover, energy companies producing biomethane from agricultural substrates are eligible to obtain certificates of origin for this agricultural gas, so called "brown certificates". A register for producers of agricultural biogas governed by the Agricultural Market Agency has been already established.
The revenues of a biogas project result from the electricity and heat sale plus a green certificate bonus. Assuming the relevant conditions are fulfilled, a yellow certificate bonus (CHP with less than 1 MWel installed, based on gas including biogas) or a red certificate bonus (high efficiency CHP with 1 MWel installed) can be obtained (Green Gas Grids, 2012).
References
NG-87 The Oxford Institute for Energy Studies – The outlook for natural gas demand in Europe; June 2014
Green gas grids. (2012). Overview of biomethane markets and regulations in partner countries.

116
Croatia
Specific situation and expectation
Present state of gas consumption Of the total TEPS, 30% is gas. The main source is oil (43%). Three quarters of the gas needs are covered by national production (Oxford, 2014).
Cars fuelled by natural gas represent only 0,01% (200) of the total cars and trucks. Two filling stations offer CNG in Croatia. One in Zagreb, the other in IvanicGrad.
Current and expected biogas and syngas production At the end of 2011, 6 biogas plants were operating, using biogas from landfill, waste water treatment and agriculture, while 30 were with application pending for a permit (Green gas grids, 2012).
Upgrading plants There are no biogas upgrading plants for biomethane production.
Biogas and syngas use
Electricity production All existing biogas plant focus on electricity generation.
Location Year of commissioning
Type of biogas Electrical capacity installed
Landfill Jakuševac / Zagreb 2003 LFG 2 MW
Waste water treatment plant close to Zagreb
2007 Sewage gas 2 x 1.5 MW
Ivanckovo I and II (Vukovarskosrijemska county)
2009 Agricultural biogas (manure, maize silage etc)
2 x 1 MW
Tomašanci I and II, Osječko-baranjska county
2011 Agricultural biogas (manure, maize silage etc)
2 x 1 MW
Table 32: Biogas projects in Croatia (Green Gas Grids, 2012)
Regulation, standards A feed-in tariff system entered into force in January 2013 for electricity generated from renewable energy plants. Depending on the size of the plant these feed-in tariffs for biogas generated from agricultural substrates and biowaste range from 1.04 to 1.2 HRK per kWhel (around 14 to 16 €cent/kWhel). For landfill and sewage gas the remuneration is at a lower rate and is fixed at 0.36 HRK / kWhel (about 5 €cent/kWhel). The feed-in tariffs are adjusted annually, in line with the inflation index.
There are no feed-in tariffs for the utilization of biomethane.
When biogas fulfils the same technical and safety standards as NG, it can be injected into natural gas grid and can be utilized in transportation sector.

117
References NG-87 The Oxford Institute for Energy Studies – The outlook for natural gas demand in Europe; June 2014
GREEN GAS GRIDS. (2012). Overview of biomethane markets and regulations in partner countries.

118
Serbia At the beginning of the second decade of the XXI century, the economy and society of the Republic of Serbia are in very deep crisis in terms of development. At the time of long economic recession, the Republic of Serbia is challenged to make a path to the desired long-term energy development and to define strategic preferences. Priority of strategic positioning of national energy sector is to enable the energy sector and economy of the country to overcome the current crisis with lower costs as well as to take a better start position for future, more dynamic and sustainable, development.
Strategic engagement in the energy sector implies that processes in the economy and country, as well as in the life of citizens, are performed with lower economic costs, and with higher level of social and environmental sustainability.
Specific situation and expectation
Energy resources and potentials of the Republic of Serbia include fossil, conventional (coal, oil and natural gas) and unconventional fuels (oil shell) as well the renewable energy sources. Reserves of oil and gas are symbolic and make less than 1% of geological reserves, while the remaining 99% of energy reserves include various types of coals. Unlike coal, about 70% of crude oil and 80% of natural gas are secured from import.
The renewable energy sources sector, except hydro energy, is in its early phase of development. Estimated total renewable energy sources potential is estimated to 5.65 million toe per year, from which 1054 toe of biomass is already in use.
The consumption structure divided according to sectors and energy products are given in Figure 54 and Figure 55:
Figure 54: Consumption of energy according to sector

119
Figure 55: Consumption of energy according to energy source
With a share of 13.3% in the consumption of primary energy, the Republic of Serbia has a significant role at the regional energy market (Figure 56) and it is slightly above the average world consumption, but two times less than the average consumption of OECD developing countries.
Figure 56: Regional energy market of South East Europe
Present state of gas consumption
The transport system of natural gas in the Republic of Serbia is a line system with a single route of supply, which is unfavourable both from the point of view of security of supply and market development. The domestic natural gas market is in its scope small and loaded with different infrastructural and financial issues (nonexistence of gas line network in all parts of the country, extreme seasonal disparity in consumption, high costs of transit on import route). This is why sector development primarily requires the provision of gas line infrastructure in all parts of the country and interconnection with neighbouring countries.
Present and projected natural gas consumption till 2030 is shown in Figure 57.

120
Figure 57: Present and projected natural gas consumption
Current and expected biogas and syngas production
The structure of the planned domestic primary energy production in 2014, renewable energy accounted for 1,819 Mtoe which is 17% of domestic primary energy production. In this structure, the highest share is of solid biomass with 58%, followed by hydropower with 41%, while biogas, wind, solar and geothermal energy accounted for less than 1%.
Scenario with energy efficiency measures applications by 2020 foresee the lower use of coal and petroleum products as well as the electricity for heating needs and increase of consumption of renewable energy sources and natural gas.
Biogas and syngas use
The present status of biogas production and use in Serbia solely refers to a few local, small scale isolated CHP facilities, using biogas for their own thermal and electricity needs. Some of them, as privileged electricity producers according to the Energy Law, deliver electricity to national electricity grid.
The mentioned facilities are:
Farm in South East Serbia, Lazar Dairy, Blace - installed capacity: 1MWel.
Notice: There is no constructed high or low pressure natural gas distribution network in
this region.
Farm in North Serbia, Mirotin-Energo doo, Vrbas - installed capacity: 1.5 MWel +
910 kWth.
Notice: There is a low pressure natural gas distribution network in this region.
Farm in North Serbia , Global Seed doo, Curug - installed capacity: 0.6 MWel
Notice: There is no low pressure natural gas distribution network in this region.
Vision and perspectives
According to the National Action Plan for the use of renewable energy sources (Fig. Gazette RS 53/2013), the planned use of biogas in 2020 to produce electricity (Table 33) or to produce heating and cooling (Table 34) is as follows:

121
Type of RES (MW) Assumed number of working hours (h)
(GWh) (ktoe) Share (%)
Biogas (manure ) – CHP plants 30 7500 225 19 6.2
Table 33: Production of energy from RES from new plants in 2020 (NREAP, 2013)
Type of RES (ktoe) Share in additionally planned production of heat until 2020 (with respect to the base 2009 year)
Biomass – CHP plants 49 33%
Biomass (DHS) 25 16%
Biogas (manure ) – CHP plants 10 7 %
Geothermal energy 10 7 %
Solar energy 5 3%
Biomass in individual households
50 34 %
Table 34: Energy production in the heating and cooling sector from new facilities that use RES (NREAP; 2013)
Identification of the most relevant driving forces and barriers in producing and using biogas and
syngas
Legal framework and technical requirements
The Energy Law of the Republic of Serbia, incorporated with the National Renewable Energy Action Plan (according to the EU DIRECTIVE 2008/29/EC) completely defines and covers legal aspects of biogas projects implacability in Serbia.
As for the technical standards, within the framework of the project for the harmonization of technical standards in gas supplies in South-Eastern Europe (coordination committee South Eastern Europe, Bosnia and Herzegovina, Croatia, Serbia, Montenegro and the FYR of Macedonia), the DVGW Codes of Practice for gas, in the area of biogas production and injection into gas grids have now been thoroughly prepared and adapted to regional requirements (DVGW Codes: VP 265-1, G415, G440, G493-1, G291, G292).
SWOT analyses of the producing and using biogas
ADVANTAGES (existing)
- Renewable sources potential - Significant level of development of
transmission and distribution natural gas pipeline system
WEAKNESSES (internal)
- Non economic prices of energy and disparity of prices of energy and energy products
- Low level of electricity and natural gas collection receivables
- Low quality and unfavourable consumption of traffic in energy sense
- Low level of investments in the researches of energy potentials resulting with insufficient use of renewable energy sources

122
- Low share of RES in consumption - Limited funds for the investments in
energy capacities
OPPORTUNITIES
- Integration of Serbia into EU – fulfilment of obligations undertaken by the accession the Energy Community Treaty regarding higher use of RES
- Development of electricity and natural gas market
- Introduction of the principals of cleaner generation in energy sector – construction of natural gas or biogas fired facilities for combined generation of electricity and heat
THREATS (external)
- Deeping of social and economic crisis, poverty increase, indebtedness and slow economy development of the country
- Retention of principals of ‘social prices’ of energy.
- Insufficient investments in energy facilities and infrastructure
References
National renewable energy action plan of the republic of Serbia (NREAP); Ministry of Energy, Development and Environmental Protection; 2013.

123
Russia
Current and expected biogas or syngas production
Even though Russia is not among the major biogas countries in the world it has some biogas projects. A number of farms are starting to use the alternative fuels for their needs. The regions of Vladimir, Kaluga, St. Petersburg, Nizhniy Novgorod, Lipetsk, Vologda, Murmansk, Dagestan, Tatarstan, Mariy-El, Udmurty and Krasnodar have examples of biogas plants implementation. Most of them produce biogas from farming waste.
The situation with waste water processing is less positive. The most problematic are landfills. Their owners are very conservative and less inclined to innovations. Furthermore, landfill gas production is considered currently as mineral production and requires corresponding licensing.
The best known example of biogas production on waste water treatment plants (WWTP) in Russia is the aeration plants of JSC Mosvodokanal (Moscow). In the 1980s, the plants used the anaerobic digestion to process the waste water. In 2009, Mosvodokanal launched a mini-CHP plant made by “EVN” on Kuryanovo WWTP. In 2012, a similar plant started operation on the Lyubertsy plant. The contracted biogas price for the CHP is significantly lower than the natural gas price. The reason for this is that there were no investments in the digestion facilities, which already existed.
The Belgorod region is the pioneer in building the biogas plant with manure feedstock in Russia. The region had in 2009 – 2012 a government Strategy on biogas development, which included the following:
Environmental safety for the territories of the region;
Innovative biomass processing technologies implementation;
Creation of a local market of organic fertilizers.
The Strategy resulted in construction of two biogas plants with a total capacity of 500 kW and 2,5 MW. The latter was qualified as an electricity producer by analogy with the EU procedures; it has a feed-in-tariff on electricity and sells it to local grids for electricity losses compensation. In spite of huge administrative support, this procedure took more than two years and the total tariffs is significantly higher than the average in the region.
Biogas and syngas use
Today biogas is used to produce heat and electricity in cogeneration units.
Current and expected biogas and syngas production
The Energy Strategy of Russia (until 2030) targets the renewable energy produce of 80-100 bln kWh per year.
According to the Russian Academy of Sciences, there are 3 bln tons of renewable non-food biomass in Russia. This includes wood production, agriculture, peatery and cellulose waste. It is reasonable to expect that in the near future bioenergy will develop, what the Complex Biotechnology Development Program of Russia (until 2020) confirms.
It is also adjacent with the fact the large-scale pig-breeding complexes are put in commission as well as poultry. The agro industrial complex of Russia now faces the waste management issues of huge waste amounts – presently most of them are just in land storage. The amount of this waste in Russia currently reaches 600 mln tons per year, most of which is not utilized

124
correctly. The alienation of land is thus a huge problem (more than 2 mln hectares of agricultural land is used to store manure). Only 37% of large- and medium-scale agricultural farms have access to gas distribution networks and only 20% have access to heat supply systems.
According to the Russian Energy Agency, the current waste potential is enough to produce 60-70 bln m3 of biogas per year. This is enough to satisfy the needs of the internal market as well as the EU.
Table 35 demonstrates the biogas production potential, based on the data of the Institute of Energy Strategy of The Ministry of Energy.
Organics mln tons*
Biogas bln cm
Total GW
Crop production 147 94,8 84,4
Agro industrial complex (processing)
14 12,8 11,4
Wastewater 4,9 2,6 2,3
Household waste 16 20,8 18,5
Total 131,0 117,7 Table 35: Biogas production potential in Russia
Among the regions, the biggest resource base is located in three Federal Districts: South, Volga and Central. Figure 58 demonstrates the biogas potential breakdown.
Figure 58: Biogas potential breakdown (other than wood processing and peat)
Regulation and standards.
Today Russia does not have any special regulation for biogas plants constructions, its drying, purification and upgrading. All construction is done by using more general technical norms and regulation.

125
Financially biogas projects can indirectly benefit from Russian energy saving law, the Russian Tax Code that allows some investments tax holiday for renewable energy projects, some laws and programs that provide state support for agriculture and water treatment plants projects.
For landfill gas the main problem is that these fields can be considered by our government as a traditional gas fields so companies may require licenses to develop them.
Vision and perspectives
There is a number of reasons, why biogas production and utilization are poorly developed:
Highly competitive fossil fuels.
Imperfection and poor control of environmental legislation;
Lack of regulation for biogas production and energy service contracts implementation;
Lack of financing schemes for biogas projects;
Lack of reasonably priced equipment for biogas plants on the market;
Ossification of owners of works, where biogas production is possible;
Low level of government support of renewables in total and biogas in particular.
Nevertheless, the situation is getting better for biogas plants due to the following factors:
Stable cost rise for natural gas, heat and electricity;
Remote territories;
High connection costs to existing natural gas and electric grids;
Unstable and unreliable energy supply from energy retailers;
Government promotion of biogas;
Growth of fines for environmental impact;
Demand for biogas from EU and Asia-Pacific Region.
There are no any reasons to be optimistic about biomethane in Russia in mid-term prospects. However, in long-term future such projects are possible.

126
ASIA
South Korea
Specific situation and expectation
Present state of gas consumption.
South Korea is highly dependent on foreign supplies for its natural gas use. The country produced about 37 Bcf of natural gas (about 2% of consumption) in 2012 from the domestic gas field Donghae-1 in the Ulleung Basin. Gas represents approximately 17% of total primary energy consumption as it’s shown in Figure 59.
Figure 59: Total primary energy consumption 2010 (EIA)
The Korea Gas Corporation (KOGAS) is a state-owned monopoly that dominates the gas sector. It owns and operates some 2,213 mile national pipeline network as of 2013. South Korea is not connected to other countries through pipeline and for its imports it is completely dependent on LNG trade.
KOGAS supplies power generation companies and the gas distribution companies with natural gas. In South Korea there exist 33 distribution companies and 14 power plants that demand gas. The distribution companies all have an exclusive right to supply gas to consumers in specific regions. This is further regulated by local governments.
Current and expected biogas and syngas production
A total of 82 biogas plants are now in operation to produce 2,578 GWh per year. Landfill biogas contributes 52.4% (1,350GWh/yr), biogas from sewage sludge 37.6%, biowaste 9.6% etc. Especially biowaste mainly consists of food waste, food waste leachate and digestible co-substrates (IEA; Kang, 2014).
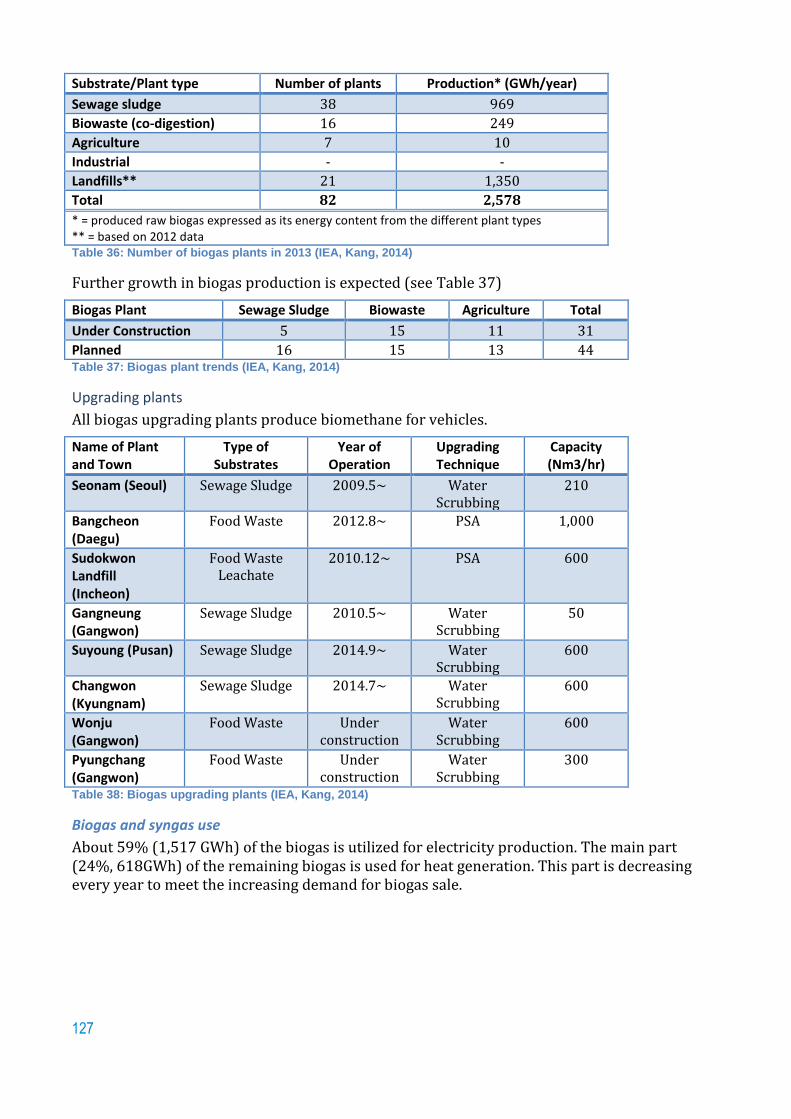
127
Substrate/Plant type Number of plants Production* (GWh/year)
Sewage sludge 38 969
Biowaste (co-digestion) 16 249
Agriculture 7 10
Industrial - -
Landfills** 21 1,350
Total 82 2,578
* = produced raw biogas expressed as its energy content from the different plant types ** = based on 2012 data Table 36: Number of biogas plants in 2013 (IEA, Kang, 2014)
Further growth in biogas production is expected (see Table 37)
Biogas Plant Sewage Sludge Biowaste Agriculture Total
Under Construction 5 15 11 31
Planned 16 15 13 44 Table 37: Biogas plant trends (IEA, Kang, 2014)
Upgrading plants
All biogas upgrading plants produce biomethane for vehicles.
Name of Plant and Town
Type of Substrates
Year of Operation
Upgrading Technique
Capacity (Nm3/hr)
Seonam (Seoul) Sewage Sludge 2009.5~ Water Scrubbing
210
Bangcheon (Daegu)
Food Waste 2012.8~ PSA 1,000
Sudokwon Landfill (Incheon)
Food Waste Leachate
2010.12~ PSA 600
Gangneung (Gangwon)
Sewage Sludge 2010.5~ Water Scrubbing
50
Suyoung (Pusan) Sewage Sludge 2014.9~ Water Scrubbing
600
Changwon (Kyungnam)
Sewage Sludge 2014.7~ Water Scrubbing
600
Wonju (Gangwon)
Food Waste Under construction
Water Scrubbing
600
Pyungchang (Gangwon)
Food Waste Under construction
Water Scrubbing
300
Table 38: Biogas upgrading plants (IEA, Kang, 2014)
Biogas and syngas use
About 59% (1,517 GWh) of the biogas is utilized for electricity production. The main part (24%, 618GWh) of the remaining biogas is used for heat generation. This part is decreasing every year to meet the increasing demand for biogas sale.

128
Utilization GWh %
Electricity 1,517 58.8
Heat 618 24.0
Vehicle fuel 26 1.0
Flare 280 10.9
Biogas sale 137 5.3
Total 2,578 100
Table 39: Biogas utilization (IEA, Kang, 2014)
Flaring biogas is still significant (11%). The utilization of biogas as vehicle fuel is only 1.0% of the total biogas production.
Vision and perspectives
The Renewable Portfolio Standard (RPS) system has been implemented since 2012. As “Mandatory Supply Quantity(MSQ)”, a minimum percentage of the total power generation should be supplied using the appropriate kind of renewable energy. There is a governmental target to increase MSQ up to 8% of the total power generation in 2020 (see Figure 60).
Figure 60: RPS requirements (Jinwon Park, 2012)
A Renewable Fuel Standard (RFS) system for biogas is expected to be started in 2017.
Financial support
There exist three types of financial support systems for biogas (IEA, KANG, 2014).
Feed-in tariffs
o FIT system had been implemented until 2011.
o RPS (Renewable Portfolio Standard) system has been enforced since 2012.
Investment grants

129
o When the private sector builds AD plants (with raw materials from agriculture),
the Government supports 60-80% of the total investment cost.
o All biowaste AD plants have been built and operated by the Government
Taxes
o There is no tariffs or subsidies on biogas. However, 10% VAT (Value Added Tax)
and 2% tariffs will be charged when a mixture of CNG and biogas is sold.
References
US Energy Information Administration; www.eia.gov/countries/cab.cfm?fips=ks; last updated April 1, 2014
IEA Bioenergy Task 37; Korea Country Report; Ho Kang; October 2014
Situation & strategy of biomass electricity energy in Asia; Jinwon Park; Ketep Bio/waste energy PD; 12 december 2013

130
Japan
Specific situation and expectation
Present state of gas consumption. Japan’s natural gas consumption was 105.5 billion cubic meter in 2011, 3% of world natural gas consumption.
Japan is the largest LNG importer in the world importing 87.3 million tons in 2012 up 23% from 2010 before Fukushima. While import cost increased by 23% in 2 years, import cost increased from USD 40 billion in 2010 to USD 49.2 billion in 2012 by 90%.
Approx. 70% of the natural gas is used for power generation and 30% is for city gas. City gas market is in the process of liberalization. By 2007 market over annual consumption of 100 thousand cubic meters was liberalized. Gas market is expected to be fully liberalized in 2017. There are more than 200 gas utilities in Japan.
Current and expected biogas and syngas production Major city gas utilities have guidelines for injecting biomethane into their natural gas pipeline networks. In 2010, Tokyo Gas and Osaka Gas began injecting biomethane derived from food waste and sewage sludge, respectively, into city gas pipelines.
The total biomethane injected into the natural gas grid is limited to around one million m3/year (0.002% of whole gas sales in Japan). This is due to the high cost of biomethane production and upgrading treatment process.
The majority of the biogas production is from methanation of sewage and solid waste from food processing factories and livestock excreta (animal manure).
The estimated total annual biogas production is 4.04 million cubic meters of which 17% from animal manure methanation, 31% from food processing factories and 58% from sewage treatment facilities (digestion gas). Of the biomethane from food processing, 26% is from beer brewery factories.
Upgrading plants Mostly membrane and activated charcoal filter are used to upgrade biogas.
Biogas and syngas use
Heat and electricity production The preferred use of biogas is to use it on-site for heating and power generation to avoid upgrading cost to be injected into the grid.
Biomethane Biogas (digestion gas) consists of approx. 60% methane and 40% carbon dioxide. To be injected into the natural gas grid, the biogas is upgraded. In the upgrading process, sulphur and silica are separated along with carbon dioxide. Sewage treatment plant in Kobe city adopts high pressure water interaction technology to upgrade digestion gas. In this process biogas is upgraded to 97% methane.
Injection in the natural gas network In 2010, Tokyo Gas and Osaka Gas began injecting biomethane derived from food waste and sewage sludge, respectively, into city gas pipelines.

131
As vehicle fuel Higashi-nada city sewage produces upgraded biogas which is used as fuel for natural gas vehicles and with further treatment, gas odorant is added to be injected into the grid.
Vision and perspectives In 2012, feed in tariff of renewable electricity (FIT) started. After the FIT was introduced, more projects are underway to use digested gas to generate power and feed into the power grid.
Table 40: Feed-in tariff for electricity from biomass (METI, 2012)
Now, the Japanese government is discussing a new Energy Basic Plan which provides an energy policy after the Fukushima disaster.
Identification of the most relevant driving forces and barriers in producing and using biogas and bio syngas
Regulation, standards Tokyo Gas Company and Osaka Gas Company announced a “Biogas procurement guideline” which stipulates the quality of gas to be injected into the grid in 2008 and started purchasing biogas.
Driving forces FIT is a good driving force to invest in biogas power generation and the number of projects is increasing.
Barriers There are only 2 biogas upgrading facilities (city gas quality) in Japan, one in Tokyo and the other Osaka. The foremost barrier is the expensive production cost and upgrading cost.
References
http://www.meti.go.jp/english/policy/energy_environment/renewable/
Feed-in tariff scheme in Japan; METI, Agency for natural resources and energy; July 17, 2012

132
Malaysia
Specific situation and expectation
Present state of gas consumption
In 2012 natural Gas covered 39.4 percent of the final energy consumption just after coal with 48.3 percent. Renewable energy (without 7.3% of hydro) participates with 0.2 percent.
693,871 MMSCF (million standard cubic feet) of natural gas have been consumed in 2012, with more than 63% to produce electricity, 24% for use in the industry and 1.6% for the transport (National energy balance 2012).
Current and expected biogas and syngas production
In Malaysia, biogas can be mainly produced from:
The POME (Palm Oil Mill Effluent) produced from Palm Oil Industry. About 85% of
existing mills have open ponds using anaerobic digestion;
Landfills;
Centralized waste treatment plants.
By 2015, Malaysia is expected to have a biogas capacity of 100MW by 2015, reaching 240 MW by 2020 (IMPAK 2011).
Within the Clean Development Mechanism “CDM”, 50 biogas projects and 8 landfills have been registered with CDM EB(Executive Board) (Zakaria, 2013).
Biogas and syngas use
Electricity production
In 2012, a capacity of 3.20 MW using landfill biogas produced 16,552 MWh and 3.25 MW generated 8,749 MWh from Palm Oil Mill Effluent “POME” digestion (National energy balance 2012).
Vision and perspectives
In 2009, oil palm plantations covered approximately 4.69 million hectares. Palm oil millers are encouraged to capture biogas for power generation (IMPAK 2011).
Regulation
Under the SREP “Small Renewable Energy Power” Program, the utilization of all types of RE sources, including biogas, for power generation is encouraged. Maximum capacity of small Renewable Energy plant designed for sale of power to the grid must not exceed 10 MW (Inpak 2011).
The cornerstone of the Renewable Energy Policy and Action Plan is the implementation of a Feed-in Tariff Mechanism which will spur the development of RE in Malaysia.

133
Description of Qualifying Renewable Energy Installation FiT Rates
(RM per kWh)
(as per 1 Jan 2015)
(a) Basic FiT rates having installed capacity of :
(i) up to and including 4MW 0.3184
(ii) above 4MW and up to and including 10MW 0.2985
(iii) above 10MW and up to and including 30MW 0.2786
(b) Bonus FiT rates having the following criteria (one or more) :
(i) use of gas engine technology with electrical efficiency of above 40% +0.0199
(ii) use of locally manufactured or assembled gas engine technology +0.0500
(iii) use of landfill, sewage gas or agricultural waste including animal waste as fuel source
+0.0786
Table 41: FIT rates for biogas (www.seda.gov.my)
References
National energy balance 2012; Suruhanjaya Tenaga (Energy Commission); 01-03-2014
Malaysia’s second national communication to the UNFCC; IMPAK Issue 4/2011
Clean Development Mechanism: Malaysia’s effort on biogas; Sazalina Zakaria; Malaysian Greent Technology Corporation; Presentation for IGU PGC A; 5 September 2013.
www.seda.gov.my (Feed-in tariff)
www.gtfs.my (Green Technology Financing Scheme)

134
China
Gas consumption Natural gas forms a major part of China's strategy to ease its dependence on heavily-polluting coal. Consumption is estimated to reach 193 bcm in 2014, according to government estimates released in earlier 2014. In 2011 around 20% of NG consumption was imported (Economic Times, 2014).
Biogas China is the world’s leading country in the application of anaerobic biomass digestion technology in quantitative terms. The first household biogas plants were installed in the 1930s. Besides millions of small biogas plants in farms, there are over one thousand bigger plants, many of which use industrial waste from paper, sugar and the pharmaceutical industry as feedstock. The main purpose of these plants is to reduce waste and slurry problems (energypedia.info). By 2008, about 28 million household digesters were in operation. The gas is used directly for cooking, lighting or heating purposes and only few of the plants installed in China are destined for electricity production - in general big plants - as only those with capacities higher than 0.5 MW are allowed to connect to the grid. However, power generation from biogas has become the focus of support programs in recent years. A tenfold increase in electricity generation from biogas happened between 2005 and 2013.
Shanghai’s Laogang landfill-gas project started to generate power in Oct 2012, contributing to the city's power grid. It is providing nearly 110 million kilowatt-hours of electricity every year, which should cover about 100,000 households' annual power consumption, according to the Laogang renewable sources company (IEA, 2014). In 2012 one upgrading plant was in operation.
Regulation and subsidies As part of its renewable energy targets, established in 2006, the Chinese government is providing more support to biogas projects. This includes the farmers household biogas project, to the value of 40 million RMB, which is helping certain eligible farming families to have biogas digesters (www.iea.org, 2014).
In 2007, the National Development and Reform Commission published the “Medium and Long-Term Development Plan for Renewable Energy”. The plan sets the government subsidy at 1,000 Yuan (about 110 Euro) per household biogas digester. This covers about one-third of the total costs of a biogas system.
Since 2009, substantial progress has been made in the development of rural biogas CDM projects. A CDM methodology was developped : “Methane recovery methodology in agriculture activities of peasant households/small scale farms” and has been recognised by CDM executive Council (energypedia.info).
References The Economic Times; 24 April 2014; http://articles.economictimes.indiatimes.com/2014-04-24/news/49378338_1_ndrc-natural-gas-supply-national-bureau
Electricity generation from biogas – energypedia.info
Energypedia.info/wiki/biogas_technology_in_china
IEA Biomethane Status, 2014
www.iea.org/countries/non-membercountries/chinapeoplesrepublicof/; February 2014

135
Thailand
Biogas production
Biogas production in Thailand can be categorized into 2 groups:
1. Biogas from livestock
The biogas is produced from animal manure and the gas is used instead of LPG. For larger scale plants, the biogas also use for electricity generation to sell to grids.
2. Biogas from wastewater
Generally, the starch production produces high volume of wastewater with a high organic concentration which is suitable for biogas production. The high energy costs and large amounts of waste make the biogas development attractive for the owners to invest.
Biogas production in Thailand is listed in Table 42.
Year Biogas production (GWh)
2004 0 2005 2
2006 10
2007 14 2008 39
2009 83 2010 214
2011 302 2012 114
Table 42: Biogas production Thailand (IEA.org)
Biogas policies and regulations
In 1992, Thailand started to promote the use of renewable energy and energy efficiency program with the ENCON programm. The funding support for biogas was introduced in the form of funding such as subsidy program, energy efficiency revolving fund, ESCO venture capital fund and tax incentives.
In 2004, a strategic plan for renewable energy development was introduced, with the aim to increase the share of renewable energies, including biogas, to 8 %.
In 2011, the Ministry of Energy has announced the 10-Year Alternative Energy Development Plan (AEDP 2012-2021). The new plan set target to have 25% renewable energy consumption by 2021. The AEDP set the biogas target at 600 MW by 2012. A subsidy called an adder was introduced for electricity sells to grids. Adder is paid additional to the base tariff for a period of seven years. Biogas projects below 1 MW receive an adder of 0.50 Baht/KWh (or around 0.12 Euro) and projects above 1MW get 0.30 Baht/KWh (around 0.07 Euro).
References
www.iea.org/countries/non-membercountries/thailand/
www.dede.gov.th

136
India
Specific situation and expectation
Present state of gas consumption The total natural gas use in India in 2012 was 2,276 766 TJ, of which 1,551 303 TJ (68%) was from own production. Electricity production counts for 36% of the total natural gas use. About 5% is for residential use. A share of 3,3% of the natural gas is used in transport (IEA.org).
Current and expected biogas and syngas production Biogas production in India started in 2007, and is steadily growing since then (see Table 43).
Year Biogas production (GWh)
2006 0
2007 544
2008 622
2009 700
2010 765
2011 836
2012 881 Table 43: Biogas production India (IEA.org)
Biogas and syngas use India has extensive experience of biogas plants. Over 1.8 million cattle dung digesters had been installed in India by the mid 1990s. However, around one third of these were inoperative by early 2000 (ESMAP, 2005) and there is little experience of commercial electricity generation at small and medium level (energypedia.info).
The gross electricity production of biogas in 2012 was 881 GWh, and the gross heat production was 15,858 TJ (IEA.org).
Vision and perspectives The twelfth Five Year Plan (2012–2017) ”Faster, More Inclusive and Sustainable Growth” recognises a need for adopting a low carbon strategy for inclusive growth. It has twelve focus areas, but biogas is not one of them. However, the CFA program (see below) is being continued.
Regulation and financial support In 2004, the program Central Financial Assistance (CFA) for biogas plants has come in force. The main purpose is to finance training for people working with biogas plants (Ministry of New and Renewable Energy). Furthermore the National Biogas and Manure Management Programme is effective (mnre.gov.in). This is a Central Sector Scheme, which provides for setting up of family type biogas plants mainly for rural and semi-urban/households. During the year 2014-15, a target of setting up 1,10,000 biogas plants has been set. The actual subsidy is dependent upon the region and the size.
References Electricity generation from biogas - energypedia.info
http://www.iea.org/countries/non-membercountries/india/
http://mnre.gov.in/ schemes/decentralized-systems/schems-2/ (Ministry of New and Renewable Energy)

137
Bangladesh
Specific situation and expectation
Present state of gas consumption
The total natural gas use in Bangladesh in 2012 was 853 337 TJ, which was all domestic production. Electricity production counts for 56% of the total natural gas use. About 11% is for residential use. A relatively high share of 5,0% of the natural gas is used in transport (IEA.org).
Current and expected biogas and syngas production
The objectives of the Renewable Energy Policy for Bangladesh are to:
Harness the potential of renewable energy resources and dissemination of renewable
energy technologies in rural, peri-urban and urban areas;
Enable, encourage and facilitate both public and private sector investment in renewable
energy projects;
Develop sustainable energy supplies to substitute indigenous non-renewable energy
supplies;
Scale up contributions of renewable energy to electricity production;
Scale up contributions of renewable energy both to electricity and to heat energy.
The main goal is develop renewable energy sources to meet 5% of total power demand by 2015 and 10% by 2020.
Biogas and syngas use
More than 25,000 biogas plants have been set up in Bangladesh. However, most of them are family-sized and used only for cooking burners. Over 2,000 of these biogas plants have been constructed on poultry farms. In such cases, the main purpose of the plants is not only the generation of gas; the plants are also necessary owing to the bad odors caused by poultry droppings and for other environmental reasons (energypedia.info).
Vision and perspectives
Biogas mainly from animal and municipal wastes may be one of the promising renewable energy resources for Bangladesh. Presently there are tens of thousands of households and village-level biogas plants in place throughout the country. It is a potential source to harness basic biogas technology for cooking, and rural and peri-urban electrification to provide electricity during periods of power shortfalls (REP, 2008).
Regulation and financial support
The Sustainable & Renewable Energy Development Agency (SREDA), shall provide fund for the development of standardized renewable energy configurations to meet common energy and power applications, such as a.o. biogas by using grant, subsidy and/or carbon/CDM fund. It shall also stimulate market development for sustainable energy technologies, such as improved cook stoves and household biogas digesters.
References
Electricity Generation from Biogas - energypedia.info
Renewable energy policy of Bangladesh; Ministry of power, energy and mineral resources; 18 December 2008
http://www.sreda.gov.bd/

138
AMERICA
Brazil
Specific situation and expectation
Present state of gas consumption Natural gas consumption is a small part of the country's overall energy mix, constituting less than 10% of total energy consumption in 2012.
The total natural gas use in Brazil in 2012 was 1 267 013 TJ, of which 60 % was domestic production. Electricity production counts for 23% of the total natural gas use and CHP for 8 %. Only 1% is for residential use. A relatively high share of 7,5% of the natural gas is used in transport (IEA.org).
Current and expected biogas and syngas production In 2012, 3754 TJ Biogas was produced, which is all used for electricity production (2953 TJ) and for CHP (801TJ) (IEA.org).
Year Biogas production (GWh)
2007 0
2008 312
2009 165
2010 138
2011 439
2012 340
Table 44: Biogas production in Brazil (IEA.org)
The current number of plants, and the amount of biogas produced is given in Table 45.
Plant type Number of plants Production (GWH/year)
Sewage sludge 5 42,25
Biowaste 1 1,40
Agriculture 8 8,97
Industrial 4 23,75
Landfills 6 636,83
Total 24 713,2
Table 45: Number of plants and production of biogas (IEA country report Brazil, 2014)
There are currently three biogas upgrading plants. They all use water scrubbing + PSA. The total annual production of biomethane is 27,94 GWh/year.

139
Name Capacity (Nm3/h)
Marechal Candido Rondon/PR (Ajuricaba) 50
Monte Negro/RS 500
Pomerode/SC 125
Table 46: Biomethane upgrading plants (IEA country report Brazil, 2014)
According a biomethane inventory in 2008-2009, the potential for biomethane is much higher (Table 47).
Biogas Source Potential (m3CH4/d)
Livestock 2,500,000
Domestic sewage 65,000
Municipal solid waste 300,000
Industrial efluent 75,500
Total 2,940,500
Table 47: Biomethane potential of Brazil
Biogas and syngas use Brazil is one of the countries whose biomass energy market is the most advanced. Biofuels are produced from sugar cane and hundreds of power plants use the remaining sugar cane bagasse as fuel. Most of these plants use direct combustion and have capacities far over 1 MW. However, a number of small and medium sized biogas power plants also exist, mostly in-stalled in agro-industrial settings. The main purpose of these plants (using the waste of a slaughterhouse or animal production facility) is sanitation and environmental protection. The second important benefit is gas and electricity production for in-house use in the companies.
There are probably large numbers of biogas plants in farms or small industries using the gas for individual power generation, as suggested by the provision of a specific biogas motor programme by the Brazilian company Branco. It provides small motors, motor pumps and a generator set of 3.6 kW, especially for Biogas use.
In Rio de Janeiro, at the Gramacho Landfill, 200,000 m³/d of “green gas” is used in a nearby oil refinery.
In the state Paraná on the Ajuricaba hydro basin in Brazil, 33 small scale family farms are producing biogas through anaerobic digestion of manure and other residues. Each of the 33 family farms injects raw biogas into a 22 km-long pipeline to a central position to produce either electricity and heat or to be upgraded to biomethane and used locally as a vehicle fuel. Through the anaerobic digestion process, the farmers also produce digestate that is used as a biofertilizer on their farms. (IEA Bio-Energy in family farming)
Vision and perspective Brazil has achieved greater energy security thanks to its focused commitment to developing a competitive sugarcane industry and making ethanol a key part of its energy mix. By 2010, 79% of all cars produced in Brazil were made with hybrid fuel system of bioethanol and gasoline.
The national policy on climate change is to reduce emissions of greenhouse gases from 36,1 % to 38,9 % by 2020. The allocated budget is R$ 6 billion. One of the goals is to use anaerobic

140
digestion to treat 4.4 million m³ of agricultural residues, providing a saving of 6,9 million tonnes of CO2 (IEA Country report Brazil)
Regulation and financial support Hardly any electricity provision from biogas for basic public energy needs has so far been realised. A program for the support of alternative energy resources (PROINFA), designed to feed-in more biomass energy into the national grid, was already approved in Brazil back in 2002. However, implementation met with delays, and only big power plants with direct combustion of the biomass were able to benefit from the program.
The Low Carbon Agriculture Program, or ABC offers credit to producers to develop technologies to reduce the carbon dioxide emissions. The target group is farmers and their cooperatives
PRONAF ECO gives credit to projects with renewable energy technology in waste treatment and effluent stations. The target group is family farmers under PRONAF.
Recently, the state government of Sao Paulo issued a decree to remove the collection of taxes for property and equipment for renewable generation with biogas (IEA Country report Brazil).
References http://www.iea.org/countries/non-membercountries/brazil/
https://energypedia.info/wiki/Biogas_in_Brazil
IEA bioenergy task 37; country report Brazil; version 03-2014
Electricity Generation from Biogas; energypedia.info
www.branco.com
IEA; Bio-Energy in family farming – a new sustainable perspective for the rural sector in Brazil. IEA Bioenergy Task 37; C. Bley & D. Amon; September 2013.

141
AFRICA
Algeria
Introduction
Renewable gas is still not well known and not completely brought under control. An old application was made before gas discovery, from then until now renewable gas plays a very limited role as an energy source.
After a brief history of biogas application, we will find out about renewable gas in Algeria. Even if there is no experience, potentials, advantages and the barriers are given below.
Biogas produced by third generation such as algal biomass, has not been carried out for now.
Biogas history in Algeria
In the 50s, some scientists worked on biogas agricultural vehicle (Figure 61), and after that, studies have been made, especially on small scale units for biogas production by the research center on Renewable Energy “CDER”.
Two kind of biogas production have been experimented at Agronomy National Institute of Algiers.
1. Biogas from cattle waste
The oldest experience is a biogas agricultural vehicle (Figure 61). It was conceived in the 50s at the agronomy national institute. The biogas used by the vehicle came from anaerobic digestion of cattle waste.
Figure 61: Agricultural vehicle on biogas
2. Biogas from straw
To make an energetic food for cattle, products are breathed on straw in an enclosed space (Figure 62). This technique produces biogas. Regarding the low cost of local feeding (fourage), this treatment has been abandoned.

142
Figure 62: Straw treatment
Renewable gas production
Renewable gas can be produced either automatically, what is basically happening in landfills, or after some techniques of transformation of waste etcetera.
In this part, we will find out some Algerian cases, where renewable gas is produced, how we use it and finally the existing biomass potential which could be used to produce it.
Biogas from digestion
In Algeria, biogas is either produced naturally in landfills, or obtained by digestion from waste water treatment plant.
Landfill Biogas
Although recycling municipal waste is not common, it is shown that organic waste is important for Algiers, that make landfills to produce important quantity of biogas (Münikh, 2002; Les déchets solides urbains, 2003).
Some full landfills are being closed like OuedSmar (Figure 64) and OuledFayet (Figure 63), located at Algiers suburbs. The Biogas production in OuledFayet is estimated around 1000m3 /hour. OuedSmar is rehabilitated to become a big garden and for the security, several wells are dug to evacuate biogas to be flared. The hourly biogas production is estimated at around 3000m3 /h (Credeg, Adafer).
Figure 63: One cell of the OuledFayet landfill

143
Figure 64: Rehabilitation of OuedSmar landfill
It has not been decided yet to install experimental or a demonstration plant to produce electricity from biogas, the investment mechanism has not been decided yet. Following feasibility study from a foreign company, the power capacity of 2MW can be generated.
The environment ministry tries to eradicate all wild landfills to be replaced by waste disposal divided into cells with biogas collection. So landfill biogas might be promising.
Biogas from waste water treatment plant
Biogas is generated from sludge anaerobic digestion in 3 out of 76 waste water treatment plants under operation in the country. This biogas is used to heat the digester, the remaining is flared. In the waste water treatment plant of Baraki, located in the eastern suburb of Algiers (Figure 65), only water is removed from the biogas, which is why often problems happen to the heater.
Figure 65: Waste water treatment plant Baraki with the digester
In 2010, 60% of waste water is treated in Algiers. The objective is to achieve 80% in 2013 (le Soir, May 2010). The government imposes water treatment [4], which is why biogas production from waste water treatment plants could be sufficiently attractive (executive decree #92-100; 1992).
Biogas production in agriculture sector
No project is known to produce biogas in agriculture sector.Some residues from crops are either used for animal feed, or discarded. Animal waste is usually used as compost for the soil.
Raising energy crops is not interesting, due to their competition with food crops, because the country is not food self-sufficient.
144
Biogas production in industrial sector
Nowadays, residues from olive oil production, tinned tomatoes or industry of juice are discarded.
Syngas
There is no experience on gasification.The existing dried biomass in the country that can be used for gasification are coppice forest wood, cut city plants and trees, waste of industrial wood. As it will be shown below, all this waste is not converted into energy, but used for something else.
Waste cut plants and trees
Compared with other cities with poor plantation, Algiers is rather green. During 90s, all coppice city wood and cut plants were put into landfills. Nowadays, this waste is crushed, and after an aerobiose degradation, they are used as compost to enrich plants. Palm trees are common in the south of the country. The waste produced is already used for many other things (not for producing biogas).
Coppice forest wood
In broad terms Algeria is divided into two parts; the wooded areas cover about 250 million hectares or a little more than 10% of the total area of the country. Usually coppice wood is consumed directly by households.
Waste wood industry
Wood industry is not important; the waste is either recycled to make different kind of material or given to households.
Renewable gas strategy
An ambitious renewable energy program 2011 – 2030 has been launched by the energy ministry. The Algerian company of electricity and gas “SONELGAZ” is responsible for the implementation of this program, which began in 2011. It focuses mainly on wind, solar PV and Concentrated Solar Power. Production and use of renewable gas is not a priority under this program.
However, several laws and regulations govern the development of renewable energy which includes renewable gas and set out incentives to support this field.
Law 99-09,of July 28, 1999, JO n°51
The law on the Management of Energy defines the conditions, framework and application processes of Algeria's national policy to manage energy. The law establishes a general framework for the developments of renewable energy and summarizes the tax benefits granted (article 33).
Law 02-01 of February 5, 2002 related to Electricity and Gas Distribution by pipes.
This law provides preferential tariffs for electricity produced by renewable energy. The executive decree n° 04-92 du 25-3-2004 allows grant of 200% of conventional electricity price for electricity production from waste. Power generation must not be greater than 50 MW per project.

145
Law 04-09 of August 14, 2004, related to renewable energy in sustainable development
This law takes into account renewable gas issued from digestion and gasification. It specifies the promotion of renewable energy through a national plan, it elaborates incentives for their development and it foresees the creation of a National Renewable Energy Observatory.
Conclusion
Dried biomass is already used, so the priority goes to the biogas from digestion more than from gasification. Due mainly to its competitiveness with food crops, biofuel from energy crops has not been taken into account.
Due to the environment ministry decisions and even if it is not included in Algerian renewable energy program, biogas can be regarded as a promising field. According to the actual state, the most interesting renewable gas fields remain from landfills and waste water treatment plants.
References
Étude sur l'utilisation de la biomasse pour la production d'électricité et de chaleur en Algérie.RAPPORT TECHNIQUE Stage de deuxième année. Ecole des Mines d’Albi (France) - CREDEG de Samy ADAFER
K. MÜNIKH- G.ZIEHMANN- K. FRICKE- Biological Pre-treatment of Municipal Solid Waste in LowIncome Countries ; International Symposium on Environmental Pollution Control and Waste Management (EPCOWM’2002) ; Tunisie ; Janvier 2002.
Les Déchets Solides Urbains, Dépliant du Ministère de l’Aménagement du Territoire et de l’Environnement, Algérie, 2003 ;
Executive decree # 92-100 of 3 March 1992 concerning the transformation of the legal incorporation of companies dealing with production, supply and management of water and determining the terms of their organization and functioning.
Newspaper Le soir d’Algérie 28-29 mai 2010
Statistics DGF « Direction générale des forets »
http://www.mem-algeria.org/actu/comn/pubt/explo-news_special-b.pdf; Mr TAKHERIST Exploration Manager Division - SONATRACH.
Office National de l’Assainissement “ONA” ; Situation des stations d’épuration en Algérie

146
Other Maghreb and Arab countries
Morocco
First biogas installations
The first activities concerning biogas date back to 1983. Within an agreement between the CDER (Centre de Développement des Energies Renouvellables) and the ORMVA (Office régionale de mise en Valeur Agricole) of Haouz, Morocco experts took part in a training course for biogas technology in China. Between 1983 and 1990, 60 biogas plants alone of the Chinese “fixed-dome plant type” were built by ORMVA Haouz.
With the intention of protecting the forests and improving the general living conditions of farmer families, the Ministry of Agriculture provided approx. 600,000 DH for biogas technology lasting from 1984 - 1991. The aim of these efforts was to embed biogas technology in all the country by means of intensive training programmes and the establishing of a national dissemination structure. According to records held by the CDER, in 1992 there were 255 biogas plants in Morocco mostly with digester volumes of 10 m3.
In addition, other individual biogas activities were carried out within the scope of various agreements, for example the 150 m3 “batch plant” built by CDER for research purposes. In 1989-1990 a Chinese team constructed a 150 m3 community plant in Marrakesh.
The results of these efforts are disillusioning. The ORMVA Haouz stated that nearly half of the plants they had built were completely incapable of functioning in the 90s. A systematic analysis of the causes taking a differentiation between technical reliability and problems originating in social acceptance into consideration, is not available.
Industrial installation
Moroccan most advanced methane recovery is Rabat Akreuch landfill biogas collection and flaring. At the initial stage, no electricity will be generated from the collected biogas. This is due to the high investment cost for the municipality. Another reason is the relatively low estimate of power capacity (2 to 3 MW) that can be generated. At such low capacity, it will be difficult to sell the electricity produced within the framework of the current legislation where the market is characterized by a monopoly of ONE (OfficeNational d’Electricité). The feasibility of electricity generation will be revisited once the project is operational.
Also, Morocco has subsequently been successful in its attempts to attract investments using the Clean Development Mechanism “CDM”. “Collection and flaring of biogas in the landfill at Oulja” project has been registered (RCREEE4 Morocco, 2010). On the other hand, the promotion of biofuel production, in order to enhance the contribution of Renewable Energy, has been recommended by the National Energy Debate (Berdai, 2007).
Biomass power electricity generation planned to be installed by 2020 is 950MW (RCREEE Morocco, 2010).
4 RCREEE: Regional Center for Renewable Energy and Energy Efficiency is an independent not-for-profit regional organization which aims to enable and increase the adoption of renewable energy and energy efficiency practices in the Arab region.
147
Tunisia
Biogas
In a cooperation project between the National Agency of the Renewable Energies (ANER) and the German GTZ, the first introduction of biogas was made in 1982. It were17 scattered family scale projects to substitute the lamp petroleum, the liquefied petroleum gas and the wood (Unido, 2002).
In 1999, in cooperation with China, ANER realized the first industrial biogas and electricity production from animal waste. In 2010, 50 households in the North-West of Tunisia were equipped with small scale units for biogas production (RCREEE Tunisia, 2010).
Energy crops - biofuel
The Environment Ministry studied energy production from Jatropha (or Pourghère), and its potential of plantation (IMME, 2010). Regarding the strategic requirement that this plantation will not compete with food and forest and the irrigation by waste water treated, the plantation area is approximately 13.000 ha and the energy potential is considered to be approximately 300 ktep.
Incentives
The decree 2009-262 dated 9 February 2009, offers incentives to a variety of options for introducing renewable energy into rural and agricultural settings. The grants are paid to the supplier of the equipment after it has been installed (RCREEE Tunisia, 2010). Financial support to biogas is offered through:
A grant of 40% of the investment cost with a ceiling of 20,000 TD for the production of
biogas in farms;
A grant of 20% of the investment cost with a ceiling of 100,000 TD for the cogeneration
of heat and power from industrial biogas units.
A considerable effort is foreseen to develop applications of renewable energy in agriculture and in rural areas. In the biogas field, within 2014, the following specific targets have been set (RCREEE Tunisia, 2010):
Equipment of 200 farms with biogas units for domestic use;
Installation of two industrial grid-connected units for the cogeneration of heat and
power from biogas.
Jordan
Presently, Jordan has a 1MW biogas plant that utilizes methane from biochemical decomposition of organic waste for electricity production. Expansions are underway to increase the total capacity to 5 MW (cleantechloops).
In collaboration between the Greater Amman Municipality (GAM) and the World Bank, the implementation of the first commercial-scale project converting landfill gas to energy, is located at 40 kilometres east of the centre of Amman. The electricity is delivered to the grid and replaces electricity produced from power plant using heavy fuel oil (cleantechloops).
The recovery from landfill was coupled with recovery from a purpose built biogas digester operating on waste from slaughter houses. The gas engines were fed from both sources. The plant provides between 2.5 and 2.8 MW of power and generates about 26 GWh per year. Power is bought by the Central Electricity Generating Company (CEGCO) (RCREEE Jordan, 2010).

148
In Jordan, wind and biomass are the most promising renewable technologies for generation (RCREEE Jordan, 2010).
Lebanon
The “Country Energy efficiency and Renewable Energy Demonstration projects for the recovery of Lebanon” CEDRO is currently undertaking studies to identify the potentials of biomass (RCREEE Lebanon, 2010).
Nowadays, some of the residues from the crops are used for animal feed, but the majority is discarded. There may be some potential for energy related products, but other applications, such as composting are more likely to be cost-effective. By 2020, the target is 15-25 MW from waste (Paving the way, 2012).
Egypt, Libya, Yemen and Syria
Following RCREEE and “Paving the way for the Mediterranean solar plan”, in strategic objectives there are no renewable gas projects for these four countries.
Conclusion
On the basis of the above, the most common field for the mentioned countries is biogas from anaerobic digestion.
Jordan has made the most progress in terms of electricity production from biogas. Tunisia and Morocco seem to be interested in biofuel. Following the studies mentioned in the references, it appears that Egypt, Lybia, Yemen and Syria, do not have any project on renewable gas.
References
Energypedia.info/wiki/biogas_technology_in_morocco_(region_of_souss-massa)
Country report Morocco; RCREEE (January 2010)
MED-CSP Concentrating Solar Powerfor the Mediterranean Region by German Aerospace Center (DLR); Institute of Technical Thermodynamics ; Section Systems Analysis and Technology Assessment; April 2005
Project design document for the AKREUCH landfill gas project; prepared for the community of Rabat by EcoSecutities in collaboration with clean Tech; February 2004
Stratégies Méditerranéennes et Nationales de Développement Durable ; Efficacité Énergétique et Énergie Renouvelable Maroc – Résumé de l’étude nationale by M. Mohamed Berdai, Centre de Développement des Energies Renouvelables ; Plan bleu; Mars 2007.
Country report Jordan; RCREEE (January 2010)
www.cleantechloops.com/jordan-clean-energy-potential-progress//
Country report Tunisia; RCREEE (May 2010)
UNIDO ; Unité pour la promotion des investissements, le secteur des Energies renouvelables en Tunisie, Avril 2002
IMME action 15c vol2.pdf Juin 2010. «IMME» : Intégration progressive des marchés d'électricité de l'Algérie, du Maroc et de la Tunisie dans le marché intérieur de l'électricité de l'Union Européenne. Programme MEDA de l’Union Européenne.
Country report Lebanon; RCREEE (May 2010)
Paving the Way for the Mediterranean Solar Plan – Power System 2020: Lebanon; ENPI 2010/248-486

149
East Africa, Tanzania and Kenya In Kenya, Tanzania and neighbouring countries, biogas is traditionally used in small and very small installations for providing household energy and for supplying social institutions with gas as fuel for cooking, heating and lighting. With GTZ support, over 1,000 small and medium-size plants and one bigger digester of over 100m³ have been installed by CAMARTEC5 in Tanzania from 1983 on. However, potentials for industrial biogas and electricity generation in East Africa remain largely untapped.
Kenya
Kenya does not produce or import natural gas. The domestic production is from hydro, geothermal, solar, biofuels and waste, a total of 16,894 ktoe in 2012. This is 82% of the total primary energy supply. The remaining part is imported in the form of oil (products) and coal (IEA.org).
Regulation and financial support
The government of Kenya recognises that renewable energy sources (RES) which include wind, biomass, small hydros, geothermal, biogas, solar and municipal waste energy, have potential to generate income and employment, over and above contributing to the electricity supply and diversification of generation sources. The National Energy Policy as enunciated in Sessional Paper No.4 of 2004 and operationalized by the Energy Act No. 12 of 2006, encourages implementation of these indigenous renewable energy sources to enhance the country’s electricity supply capacity. The Sessional Paper incorporates strategies to promote the contribution of the renewable energy sources in generation of electricity. Recent studies estimate the potential for immediate development of about 130 MW from the use of municipal waste, sisal and coffee production among others (Feed-in tariffs; 2012).
In December 2012 the feed-in tariffs for renewable electricity were revised. This includes guidelines for connecting small scale renewables to the grid. The feed-in tariff for electricity from biogas is:
Duration Installed capacity (MW)
Standard FIT (US$/kWh)
Percentage escalable portion of the tariff
20 years 0,2-10 0,10 15 %
Table 48: Feed-in tariff for renewable electricity from biogas (Feed-in tariffs, 2012)
Sisal-cum-cattle farm in Kenya
The biogas plant with electricity generation on a sisal-cum-cattle farm in Kilifi, Kenya is usually referred to as a positive example. It converts agricultural waste such as cow manure and sisal into biogas and produces electricity and heat as end products. It is a 750 cbm digester, capable of producing up to 150 kWel. The technology is practically the same as that used in Germany. The plant design seems to be well-adapted to farm operations and has been operational since September 2007. The biogas plant in Kilifi, was established through a tripartite Public Private Partnership (PPP) with GTZ (now the German Association for International Collaboration, GIZ).
Earlier key support to the development of the Kenyan biogas sector was provided through GTZ’s bilateral Programme for Private Sector Development in Agriculture (PSDA). GTZ has
5 CAMARTEC is the Centre for Agricultural Mechanisation and Rural Technology and is the national implementation agency for the domestic biogas program of Tanzania.

150
recently been commissioned to implement the “Project Development Programme – East Africa” (PDP) on behalf of the German Ministry of Economics and Technology under the “Renewables Made in Germany”-initiative. The programme aims at building partnerships between German and East African companies in the field of renewable energy. Biogas has been identified as one of the priority areas. The PPP-lessons are now integrated into the various follow-up activities of this programme, and the information presented below has been compiled in the context of the PDP.
Tanzania
Tanzania produced in 2012 37,799 TJ of natural gas. This is mainly used for electricity production. About 19 % was used in the industry while there is no residential use of natural gas. In the IEA database, no renewable energy policies are listed.
Hale Sisal Farm in Tanzania
The Hale Sisal Farm in Tanzania a pilot project managed and partly financed by the United Nations Industrial Development Organisation (UNIDO) entitled 'Cleaner Integral Utilisation of Sisal Waste for Biogas and Biofertilisers' involved a biogas pilot plant with a capacity of 150 kWel at the Hale Sisal Estate in the Korogwe District of Tanga region.
According to UNIDO statements, the project showed that sisal residues constitute an efficient substrate for anaerobic digestion, generating gas, electricity, and bio-fertiliser. In 2007, UNIDO announced that the results will be transferred to other interested sisal growing nations for replication.
However, the originally planned second and third phases, which consists of a storage system, a distribution grid and optimization of the technical and economic assessment, were never realised. This can be seen as an indicator of the plant’s potential lack of profitability and confirms the views of experts based in the region that the plant’s design seemed ill-adapted to the required sisal operations, and that its substantial operating problems were due to low quality technical components (Electricity generation; Energypedia).
References
Electricity Generation from Biogas - energypedia.info
Energypedia.info/wiki/Biogas_Plant_-_Sisal_cum_Cattle_Farm_in_Kilifi,_Kenya
www.iea.org
Feed-in-tariffs policy on wind, biomass, small-hydro, geothermal, biogas and solar resource generated electricity; Ministry of Energy, Kenya; 2nd rev. December 2012

151
Abbreviations
AD: Anaerobic Digestion
Bcm: Billion cm
CHP: Combined Heat and Power (cogeneration)
cm : Cubic meter – m3
CBG: compressed biogas
CNG: Compressed Natural Gas
LFG: Landfill Gas
LNG: Liquefied Natural Gas
LPG: Liquefied Petroleum Gas
Mcm : Thousand cm
MMcm : Million cm
MSW: Municipal Solid Waste
Nm3 : Normal cubic meter. Volume at normal conditions, 273,15K (°C) and 1.013bar (atmospheric pressure)
TEPS : Total Primary Energy Supply
WWTP : Waste Water Treatment Plant

152
