sustainability keeps us moving sustainability report 2017
TRANSCRIPT
Sustainability keeps us moving
Sustainability Report 2017
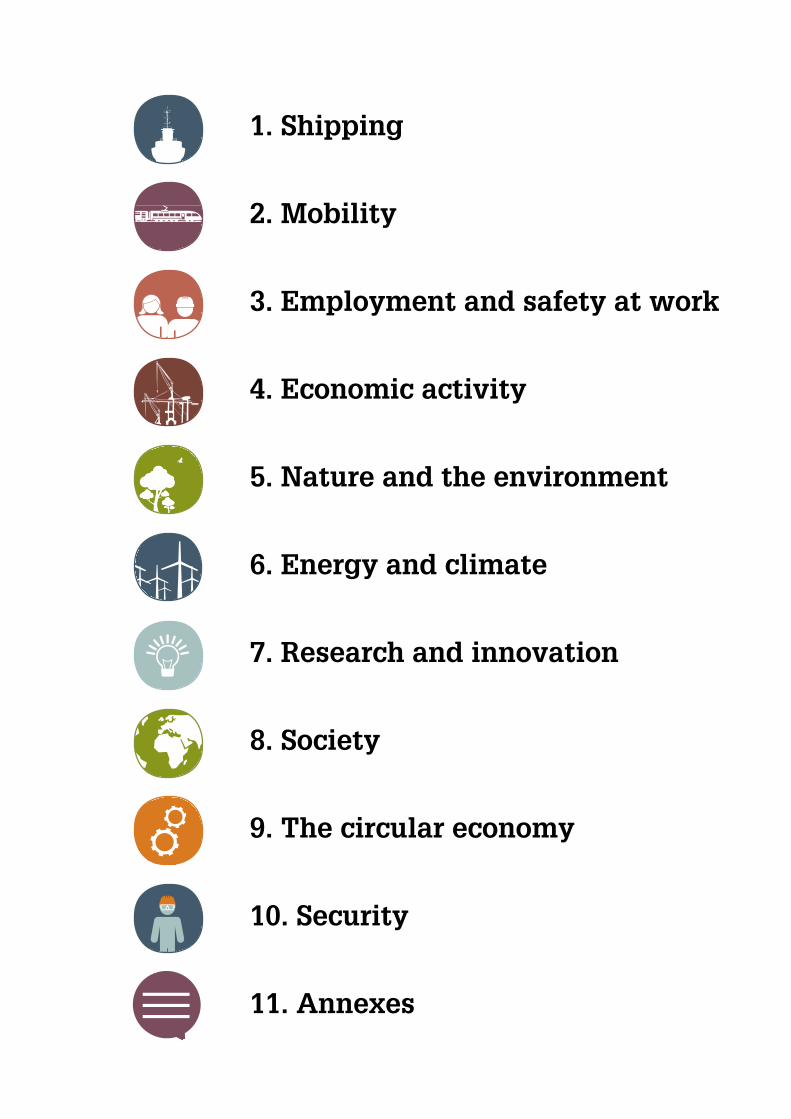
1. Shipping
2. Mobility
3. Employment and safety at work
4. Economic activity
5. Nature and the environment
6. Energy and climate
7. Research and innovation
8. Society
9. The circular economy
10. Security
11. Annexes
4 - Sustainability Report 2017
Foreword
This is the fourth Sustainability Report for the port of Antwerp published by Antwerp Port Authority, the Left Bank Development Corporation and Alfaport-Voka Chamber of Commerce Antwerp-Waasland. This biannual Sustainability Report has become a tou-chstone for the port’s ambition to remain a leader in creation of sustainable added value. The publication is still unique in terms of sustainability reporting, because the reporting is done by the port community as a whole, produced in close collaboration with the many stakeholders. Furthermore, the report is not a standalone production but instead forms part of a transition process. It is a tool for reacting in a sustainable, proactive way to the great worldwide, regional and local challenges that are now making themselves felt, such as climate change, mobility, digitisation, and migration and social integration. Against this background, in consultation with the stakeholders it has been decided to take the UN Sustainable Development Goals as the main guidelines for this process of transitio-ning to a more sustainable port.
The Sustainable Development Goals also form the guiding principles behind the Vision 2030-2050 for the port of Antwerp that was launched in 2016. In its vision the port com-munity sees the SDGs as one and indivisible, and thus as pointing the way for a sustai-nable port that aims to remain the leader in creation of sustainable added value. In line with this philosophy, the traditional “3 Ps” of People, Planet and Prosperity have been extended in the vision to include Peace and Partnership. In this Sustainability Report the Peace aspect is dealt with under the three headings of dialogue, transparency and inno-vation, while our traditional slogan “Strong through collaboration” forms the basis of the Partnership section.
This Sustainability Report has been drawn up according to the latest GRI reporting standards. Furthermore we have opted once again to have the report audited externally. The number of indicators examined in the report has once more been extended since the previous occasion. The external auditing has clearly helped to improve the quality pro-cess, while positively inspiring all those involved and yielding a new understanding of the methods used.
The fourth Sustainability Report builds further on the previous versions, while at the same time anticipating the reactions of stakeholders. This time we have included two new subjects, namely shipping and the circular economy. In the case of shipping a num-ber of specific indicators have been developed, including the extent to which the incre-asing number of ships calling at Antwerp comply with international maritime law, and the amount of use that is made of emission-reducing technology. The indicators for the cir-cular economy will be further refined in future, but we can already see a rise in employ-ment and in the added value created by this sector. These trends will certainly continue in future, thanks to the efforts of the port community.
The volume of freight handled by the port of Antwerp is increasing overall year after year. In 2015 the volume passed the 200 million tonne mark for the first time ever. Thus the port of Antwerp is maintaining its position as the engine of the Flemish economy, creating employment and prosperity for the local population. However, this positive trend also brings challenges with it, such as the increasing pressure on mobility and the implementation of the transition to a circular, low-carbon technology. The port commu-nity has an important innovative role to play here. As regards mobility we see greater provision of more sustainable modes of transport for travel between home and work, and also more use being made of these sustainable modes. However, when it comes to freight transport the modal shift is still not going in the right direction. Turning to climate and energy, there has been a further decrease in energy consumption and CO2 emissi-ons, despite the general rise in industrial output. At the same time the renewable energy production capacity continues to rise. Further transition is needed to continue this trend in future.
The third Sustainability Report also garnered various prizes: in 2016 we carried off the award for the Best Belgian Sustainability Report for the second time (in the category “other organisations”). The award recognises the combined efforts of the Antwerp port community to define sustainability and thus to create a lever for the process of transition

Sustainability Report 2017 - 5
towards a sustainable port. We hope that this trend will continue with our fourth report! At the same time we understand that a bi-annual report can only be a snapshot of the state of affairs at a certain moment. Accordingly, this report does not stand alone. The website www.duurzamehavenvanantwerpen.be, which used to be a complete online version of the report, has now been given a complete makeover. It has been made more dynamic, tailored to suit our various target groups. The website offers a place where all players in the port can share their ideas, projects, experience and progress. In fact it is the ideal place to find the most recent information on the transition process towards a more sustainable report. In this respect the website and this report complement each other.
This Sustainability Report can only be a part of the wider ambition for us a port commu-nity to work together towards a more sustainable port. Ultimately the necessary efforts must come from all players active in the port. It was also for this reason that the Port of Antwerp Sustainability Award was introduced in 2016. This first edition of the award can be considered as a great success. No fewer than 20 companies entered for this pres-tigious competition, with ECLUSE finally emerging as the overall winner. ECLUSE is a collaborative project in which steam from various incineration plants is delivered to six industrial companies via a high-pressure network. The number of entries for the compe-tition is a clear signal that the companies in the port give high priority to sustainability, with numerous projects being set up. In this report you will find some excellent examples of promising projects and initiatives.
Finally, we would like to thank the various workgroups and external data suppliers and stakeholders. We look forward to collaborating further with you in future, making a signi-ficant contribution towards a more sustainable port and society.
Have a good read!
Boudewijn Vlegels (chairman, Left Bank Development Corporation)
Peter Van de Putte (director, Left Bank Development Corporation)
Walter Van Mechelen (chairman, Alfaport-Voka)
Stephan Vanfraechem (director, Alfaport-Voka)
Marc Van Peel (chairman, Antwerp Port Authority)
Jacques Vandermeiren (CEO, Antwerp Port Authority)

6 - Sustainability Report 2017
Mission
The port of Antwerp aims to remain the leader in creating sustainable added value for the region and for Flanders.
Vision
The port’s activities are played out in a VUCA world (volatile, uncertain, complex and am-biguous) in which demographic, geopolitical, technological, industrial, energy, sociological and economic changes come along and reinforce each other at an ever-increasing pace. Sustainability is not just about maintaining and strengthening the competitive position of the port, but also about developing a vital, crisis-resistant economic tissue and further building up a diversified port, in balance with people and the environment. This promotes stability and creates various synergies that reinforce the economic structure of the port.
The main task of the port community in creating sustainable added value therefore inclu-des effectively attracting and dealing with diverse, constantly expanding freight flows, and creating a sufficient number of high-quality jobs. The synergy between maritime tranship-ment, logistics and industry is central to this task.
At the same time it is important to generate enough local support for all these varied port activities, and to involve all the regional stakeholders in this.
Since sustainability also presupposes a vision of the future, the port community has deve-loped its Vision 2030-2050. This is not so much a forecast as a list of current trends that can provide inspiration for a shared long-term orientation and guidelines.
What trends does the future hold in store for us? Energy transitions, the circular economy, exponential development of technological possibilities, a rapidly expanding, global middle class that forms the basis for the growth in world trade, more competition between ports, new business models that take full advantage of technological innovation ... All of these will lead to radical changes in the supply chains and in the corresponding role played by the different parties in these chains.
But there are certainties as well. The conventional hinterland remains as important as ever. In addition to its advantageous geographical location deep inland, the port has a number of other future-oriented advantages: a unique cluster with extensive trimodal connection possibilities for hinterland transport, sufficient size and scale, the ability to team up with educational and research institutes in the region, a renowned “can-do” mentality, a wide range of talent ...
But success in the core activities of the port will not necessarily translate into added value on a one-to-one basis. Success also depends on the productivity and speed with which technological possibilities can be put into practice. The high level of productivity for which our port is famous can only be maintained by recruiting the right people in the right pla-ces. Matching supply and demand in the labour market will continue to be a challenge in future.
The port platform occupies a unique position in Flanders, far beyond its role as simply a “port.” In 2014 it attracted 5.6% of all investment in Flanders, and in 2015 it generated 8.6% of total added value and 6.4% of employment in Flanders.
In defining the long-term orientations, maintaining the balance between prosperity, wel-fare and the environment proved to be a difficult challenge. Remaining “the place to be” for integrated logistical and industrial services itself demands a radical transformation, in order to become a smart hub. At the same time the platform must remain attractive for customers, talent, the local population and higher politics, in order to retain lasting value. The long-term orientation therefore rests on three main foundations:
1. A smart hub, offering the highest possible efficiency and the best possible product for smart, worldwide supply chains. One possible consequence of this is a reduction in the amount of employment and added value created by the core activities.
Sustainability Report 2017 - 7
2. Expanding and enriching the port platform by creating as much synergy as possible between the existing activities and by developing new ones (in the fields of energy, the circular economy, ICT etc.) which in turn can further reinforce the cluster. This will create added value and jobs for the region.
3. In addition to prosperity, just as much attention must be paid to wellbeing and the environment. This means maintaining local support, as well as obtaining the necessary political support.
Giving concrete shape to these three main foundations will also make an important con-tribution towards local implementation of the UN Sustainable Development Goals. These objectives have been included in the Vision 2030-2050 as a single, indivisible framework for the private and public players.
Strategy
In the Vision 2030-2050 drawn up jointly in 2016 by the public and private players in the port of Antwerp, the 17 UN Sustainable Development Goals have been included as guiding principles. This in turn has led to a sustainability strategy aimed at People, Planet, Prospe-rity, Peace and Partnership.
PeopleAgainst the background of a dynamic, vital port, the members of personnel interact with each other and their environment in such a way as to create added value for their port. Sustainable initiatives are introduced, promoted and followed up with a view to deve-loping the skills and qualifications of personnel, to meet the needs of tomorrow. The ulti-mate aim is to provide sustainable careers for all target groups and to create an attractive, innovative organisation with a strong employer brand.
PlanetThe environmental policy was first drawn up in 2007 and then updated in 2013 following consultation with all those involved. This environmental policy seeks to assure the “licence to operate” and the “unique selling proposition” of the port, based on the following prin-ciples:
• Compliance with local, national and international environmental legislation, while avoiding distortion of competition with neighbouring European ports
• Application of Best Available Techniques, as the basis for all activities in the port• The principle of “The polluter pays”• The principle of proportionality, i.e. focusing on initiatives with maximum environ-
mental cost efficiency
In pursuit of these principles the port of Antwerp seeks to deal with environmental chal-lenges in a proactive, responsible and critical way, without passing environmental pro-blems on to other sections of society: it’s our problem, not someone else’s problem. Initia-tives for improving the environment therefore receive full support, so as to guarantee their implementation on the ground. For this purpose a system of port-wide consultation has been set up, in which representatives of the Port Authority, private companies and local authorities jointly give form to the chosen environmental policy and make it operational.
ProsperityIt is essential not only for port activities to generate freight volume but also for synergies between the existing activities to be further developed. Attracting new activities in the fields of e.g. energy, the circular economy, ICT etc. enriches and broadens the platform. These activities further strengthen the port and create more added value and jobs for the region.
Trends such as mechanisation and automation are putting the existing added value under pressure. To create more added value it is necessary to reinforce the links between indus-

8 - Sustainability Report 2017
try, logistics activities and transhipment and to ensure diversification and opportunities for collaboration, so that all components can become stronger and grow. In the meantime there are a number of sectors in which additional activities can be attracted. These new activities benefit from the advantages of our port: our proximity to centres of production and consumption, our very large chemical cluster, our central position within the logistics networks, our cargo-generating capacity and the synergies between maritime tranship-ment, logistics and industry.
In future the port platform must be made even more attractive for the present companies and new ones that come along, together with investors, qualified people and researchers from all over the world. Opportunities are also afforded by start-ups: the port can act as a test bed, offering room to experiment for young entrepreneurs in non-conventional acti-vities with maritime connections or cluster-developing activities.
PeaceThe port of Antwerp attaches great importance to transparency and dialogue. Good, open dialogue with all stakeholders has made it possible to identify the relevant aspects for a sustainable transition. The current situation is clearly outlined in this Sustainability Report, which also forms a judgement on whether the developments are in line with expectations. These developments are also discussed with the stakeholders and can form the basis for initiatives by one or more of the players involved, in order to adapt the policy and fine tune it. A redesigned website should make greater use of transparent communication concern-ing existing and new initiatives.
In addition to stakeholder dialogue on the subject of the Sustainability Report, there are various other stakeholder discussion platforms and neighbourhood councils that afford opportunities for dialogue and participation. For instance, the advisory council for che-mical companies on the Right bank, the BASF neighbour consultation, the Indaver neigh-bourhood councils on the Left and Right banks, and the local consultation board for Doel nuclear power station. These consultative bodies are organised by the companies concer-ned as a matter of corporate social responsibility, to create wider support for their local activities, anticipate particular problems and head off collisions or complaints with local residents and/or neighbouring companies. The Vision 2030-2050 for the port of Antwerp, introduced in 2016, was similarly drawn up in collaboration with the stakeholders.
Antwerp Port Authority’s Corporate Governance Charter provides for setting up “Stake-holder Consultation for Port, Industry and Logistics.” This consultation began at the start of 2017 and includes representatives of interest groups in the private port community as well as representatives of individual port companies in the three main sectors of tranship-ment, industry and logistics. Consultation meetings will discuss subjects that concern the port as a whole, ultimately leading to formal opinions or recommendations that can be submitted to the Port Authority board of directors.
PartnershipAbove and beyond all these efforts, everyone understands that a well-founded Sustaina-bility Report demands a coherent vision and strategy, shared by the various partners and embracing the entire port. The environmental policy vision for the port of Antwerp – dra-wn up in 2007 by Antwerp Port Authority in consultation with the Left Bank Development Corporation, Alfaport-Voka and Voka Chamber of Commerce for Antwerp-Waasland – was a first step towards sustainable collaboration, and still forms an important part of it.
The Total Plan for the Port of Antwerp – drawn up jointly by the port community in response to the worldwide financial crisis of 2008/2009 – was an important factor in jump-starting the sustainability debate at port level, and also formed the basis for closer collaboration between Antwerp Port Authority, the Left Bank Development Corporation (LBDC) and Alfaport-Voka. The publication of the first Sustainability Report for the port of Antwerp at the beginning of 2012 was the direct result of the Sustainability workgroup that arose from the Total Plan. The Vision 2030-2050 presented in 2016 was also a follow-up to the Total Plan. Based on the worldwide, regional and local trends that could be expected, a vision was worked out, supported by all those involved, in which sustainability in the form of the 17 Sustainable Development Goals was included.

Sustainability Report 2017 - 9
Through this partnership, Antwerp Port Authority, LBDC and Alfaport-Voka seek to create support among the various stakeholders and among the wider population. Open dialogue with stakeholders regarding the sustainability efforts and reporting helps to ensure that their concerns are taken into account as far as possible. In this way the partners hope to make a contribution towards the general striving for a sustainable society, with particular attention to local residents, employees and stakeholders in Belgium and abroad.

10 - Sustainability Report 2017
SDGs: stimulus for sustainable transition
As an important hub in the global supply chain and a leader in creating sustainable added value, the port of Antwerp also has a role to play in realising the Sustainable Development Goals introduced on 25 September 2015 by the United Nations. In the first instance the port’s core activities were examined and five goals were chosen in areas where the port community could make a contribution in the form of initiatives and possi-ble objectives. These were:
At the stakeholder dialogue held on 18 May 2016 the various workgroups involved in the Sustainability Report were asked to think about how they could contribute to the diffe-rent SDGs. Specifically they were asked to consider possible objectives at the local level of the port, as objectives that could be linked to the 169 sub-goals. They were also asked to consider which actions could be linked to these. A detailed description of the dialogue within the different workgroups can be found in the report “Stakeholderdialoog op weg naar DHV4.”
Fig.: Diagram used for a brainstorming session on possible objectives and actions (source: CIFAL-Flanders)

Sustainability Report 2017 - 11
Fig.: An example of how the different goals are linked to one another. This example focuses on sustainable modes of transport for travel between home and work, an aspect which is directly related to SDG11 but also indirectly to SDGs 3, 8, 13, 15 and 17 (source: Antwerp Port Authority)
From the stakeholder dialogue it quickly became apparent that Antwerp could not limit itself to the five goals previously chosen. It was found that there are many sub-goals in which the port with its more than 900 companies and 142,000 employees has a role to play. Furthermore it also became clear that there are frequent links between the different SDGs, as shown in the above figure. These findings led to the conclusion that the SDGs are one and indivisible for the Antwerp port community. Based on this realisation they were therefore incorporated in the Vision 2030-2050.
The SDGs that are relevant to the individual subjects in the Sustainability Report and to which a contribution is made are listed in the table below. The only SDG not included is SDG 2 (Zero hunger), but this is indirectly related to the subjects that contribute to SDGs 1, 3 and/or 8. More information on the practical initiatives by the port community that make a contribution to attaining the goals at local level can be found in the indivi-dual chapters of this report, on the websites www.duurzamehavenvanantwerpen.be and www.sdgs.be, and in the document “Stakeholderdialoog op weg naar DHV4.”

Titel hoofdstuk
12 - Sustainability Report 2017
Subject Contribution to Sustainable Development Goals
1. Shipping
2. Mobility
3. Employment & safety at work
4. Economic activity
5. Nature & environment
6. Energy & climate
7. Research & innovation
8. Society
9. Circular economy
10. Safety & security
To raise the level of consciousness concerning the SDGs within the port community, and also to encourage companies to contribute towards them through their own operations, the degree to which projects contribute towards the SDGs was included as an important criterion for the Port of Antwerp Sustainability Award. The success of the 2016 competiti-on and the interest shown in the 2018 edition shows that companies are keen to make an active contribution towards the SDGs.
Table: List of the different Sustainable Development Goals to which a contribution is made by the different subjects adopted by the Antwerp port community (source: Ant-werp Port Authority)

Sustainability Report 2017 - 13
Titel hoofdstuk
Getting a handle on sustainability
The growth in the shipping freight volume and the increased size of ships are indicative of the strong growth of the port. This naturally has both positive and negative impacts on a whole series of aspects. The aspects that have been singled out as relevant by the stake-holders in the past years are further examined in this report on the basis of the selected indicators. These include aspects that cover the entire port area (from the point of view of the tasks and responsibilities of Antwerp Port Authority and the Left Bank Development Corporation) as well as the activities of the port community. However, the report looks further than just the port area. A port not only plays an important role in the worldwide supply chain, but is also closely bound up with the communities surrounding the port, where people live and work. In the chapters on shipping, mobility and society in particular, we look beyond the boundaries of the port area and take close account of the possible impact of the port activities on these surrounding communities.
The stakeholder process and the ways in which the indicators are calculated are dealt with in separate documents.

1. Shipping
14 - Sustainability Report 201714 - Duurzaamheidsverslag 2017
SHIPPING

D Sustainability Report 2017- 15
1. Shipping
1. Shipping
Since 2012 there has been a clear upward trend in the volume of shipping freight handled in the port of Antwerp, following on from a marked recovery in the years fol-lowing the worldwide recession of 2009. In 2015 the freight volume passed the 200 million tonne mark for the first time ever. This record figure is accompanied by an increase in the size of ships. Some 14,500 seagoing ships call at the port of Antwerp every year, including 500 with a capacity of more than 10,000 TEU.
Fig. 1.1: Volume of shipping freight handled in the port of Antwerp (source: Antwerp Port Authority)
Fig. 1.2: Total N° of calls and calls by seagoing ships > 10,000 TEU per year in the port of Antwerp
The growth in the shipping freight volume and the increased size of ships are indicative of the strong growth of the port.
In the past, the sustainability aspects of seagoing ships have been reported on the basis of two indicators, namely the amount of ship’s waste offered for collection, and the number of calls by vessels with an ESI score of more than 31. A brainstorming session with stake-holders to determine the possible role that shipping can play in attaining the Sustainability Development Goals (SDGs) yielded 77 possible indicators (see separate text). A number of these were chosen on the basis of measurability, relevance and amount of influence that the port community has over these indicators. The most relevant indicator appeared to be atmospheric emissions: this is covered in the Nature & Environment chapter. In ad-dition the following new indicators were included:
• � Compliance with international environmental legislation• � Emission-reducing technology• � Access to clean energy sources
For the sake of continuity the indicators from the previous Sustainability Report have also been included, namely:
• � Amount of ship’s waste• � Ships with an ESI score
1.1 Compliance with international maritime regulations
1. Shipping
16 - Sustainability Report 2017
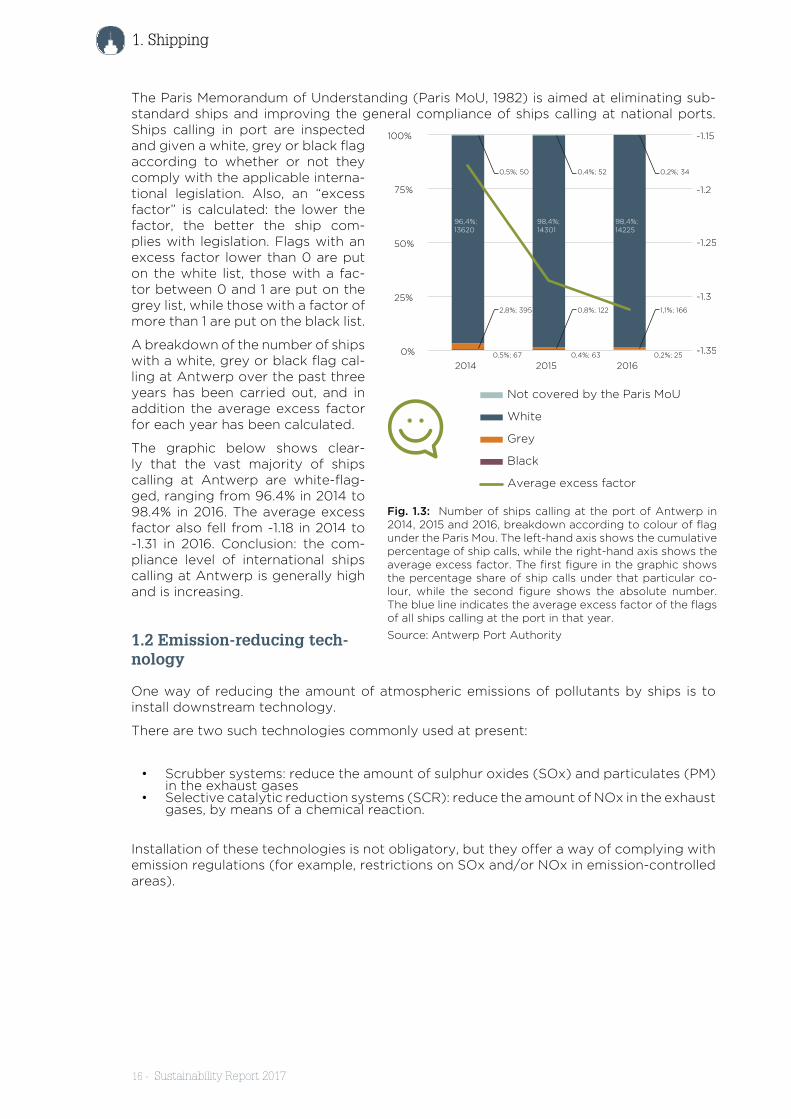
The Paris Memorandum of Understanding (Paris MoU, 1982) is aimed at eliminating sub-standard ships and improving the general compliance of ships calling at national ports. Ships calling in port are inspected and given a white, grey or black flag according to whether or not they comply with the applicable interna-tional legislation. Also, an “excess factor” is calculated: the lower the factor, the better the ship com-plies with legislation. Flags with an excess factor lower than 0 are put on the white list, those with a fac-tor between 0 and 1 are put on the grey list, while those with a factor of more than 1 are put on the black list.
A breakdown of the number of ships with a white, grey or black flag cal-ling at Antwerp over the past three years has been carried out, and in addition the average excess factor for each year has been calculated.
The graphic below shows clear-ly that the vast majority of ships calling at Antwerp are white-flag-ged, ranging from 96.4% in 2014 to 98.4% in 2016. The average excess factor also fell from -1.18 in 2014 to -1.31 in 2016. Conclusion: the com-pliance level of international ships calling at Antwerp is generally high and is increasing.
1.2 Emission-reducing tech-nology
One way of reducing the amount of atmospheric emissions of pollutants by ships is to install downstream technology.
There are two such technologies commonly used at present:
• Scrubber systems: reduce the amount of sulphur oxides (SOx) and particulates (PM) in the exhaust gases
• Selective catalytic reduction systems (SCR): reduce the amount of NOx in the exhaust gases, by means of a chemical reaction.
Installation of these technologies is not obligatory, but they offer a way of complying with emission regulations (for example, restrictions on SOx and/or NOx in emission-controlled areas).
Fig. 1.3: Number of ships calling at the port of Antwerp in 2014, 2015 and 2016, breakdown according to colour of flag under the Paris Mou. The left-hand axis shows the cumulative percentage of ship calls, while the right-hand axis shows the average excess factor. The first figure in the graphic shows the percentage share of ship calls under that particular co-lour, while the second figure shows the absolute number. The blue line indicates the average excess factor of the flags of all ships calling at the port in that year.
Source: Antwerp Port Authority
D Sustainability Report 2017- 17
1. Shipping
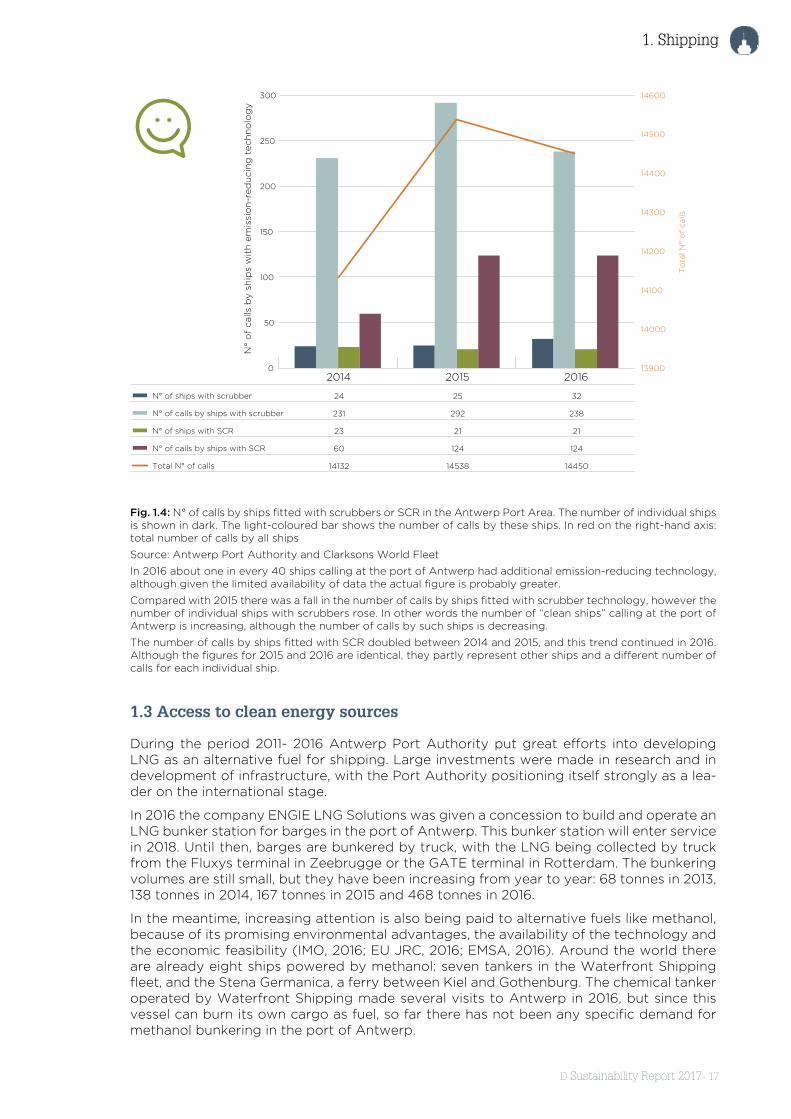
Fig. 1.4: N° of calls by ships fitted with scrubbers or SCR in the Antwerp Port Area. The number of individual ships is shown in dark. The light-coloured bar shows the number of calls by these ships. In red on the right-hand axis: total number of calls by all ships
Source: Antwerp Port Authority and Clarksons World Fleet
In 2016 about one in every 40 ships calling at the port of Antwerp had additional emission-reducing technology, although given the limited availability of data the actual figure is probably greater.
Compared with 2015 there was a fall in the number of calls by ships fitted with scrubber technology, however the number of individual ships with scrubbers rose. In other words the number of “clean ships” calling at the port of Antwerp is increasing, although the number of calls by such ships is decreasing.
The number of calls by ships fitted with SCR doubled between 2014 and 2015, and this trend continued in 2016. Although the figures for 2015 and 2016 are identical, they partly represent other ships and a different number of calls for each individual ship.
1.3 Access to clean energy sources
During the period 2011- 2016 Antwerp Port Authority put great efforts into developing LNG as an alternative fuel for shipping. Large investments were made in research and in development of infrastructure, with the Port Authority positioning itself strongly as a lea-der on the international stage.
In 2016 the company ENGIE LNG Solutions was given a concession to build and operate an LNG bunker station for barges in the port of Antwerp. This bunker station will enter service in 2018. Until then, barges are bunkered by truck, with the LNG being collected by truck from the Fluxys terminal in Zeebrugge or the GATE terminal in Rotterdam. The bunkering volumes are still small, but they have been increasing from year to year: 68 tonnes in 2013, 138 tonnes in 2014, 167 tonnes in 2015 and 468 tonnes in 2016.
In the meantime, increasing attention is also being paid to alternative fuels like methanol, because of its promising environmental advantages, the availability of the technology and the economic feasibility (IMO, 2016; EU JRC, 2016; EMSA, 2016). Around the world there are already eight ships powered by methanol: seven tankers in the Waterfront Shipping fleet, and the Stena Germanica, a ferry between Kiel and Gothenburg. The chemical tanker operated by Waterfront Shipping made several visits to Antwerp in 2016, but since this vessel can burn its own cargo as fuel, so far there has not been any specific demand for methanol bunkering in the port of Antwerp.

1. Shipping
18 - Sustainability Report 2017
1.4 Environmental Ship Index
The Environmental Ship Index (ESI) maintained by the International Association of Ports and Harbours (IAPH) identifies seagoing ships that perform better than the atmospheric emission standards laid down by the International Maritime Organization (IMO). Based on the engine characteristics and the fuel used, the ESI evaluates the amounts of NOx, SOx and CO2 emitted by the ships, with a bonus for particularly efficient ships or those with onshore power connectors.
The port of Antwerp has been an “incentive provider” since the index was first introduced in 2012: ships with a good environmental score are granted a discount on port dues. Bet-ween 2012 and 2016 ships with a score of 31 or more were given a 10% discount. As of 2017 a graduated system is followed, in which ships with a score between 31 and 50 are given a discount of 5%, those with a score between 50 and 70 a discount of 10%, and those with a score of 70 or more a discount of 15. In other words, the greenest ships are given the greatest incentive.
Number of calls for which a discount has been granted since 2012:
• 2012 462 calls • 2015 903 calls• 2013 344 calls • 2016 1.137 calls• 2014 501 calls
Fig . 1.5: N° of ESI discounts granted by Antwerp Port Authority since the introduction of the ESI in 2012. In red on the right-hand axis: total number of calls by seagoing ships.
Source: Antwerp Port Authority
The total number of calls by ESI-registered ships with a score of 31 or more is increasing from year to year. In
2016, ESI discounts were granted for about one in 13 calls.
1.5 Shipping waste
The collection of waste from vessels is governed by international agreements within the framework of the MARPOL treaty and EU directives on port facilities for ship’s waste and cargo residues. In the port of Antwerp is a sufficient number of recognised port recepti-on facilities for the different types of ship’s waste. These facilities are part of the Waste Management Plan that was introduced in 2013, subsequently updated in 2015 and due for update again in 2017. Within the port, to honor the ‘pollutor pays’-principle, a financial contribution system is in place. Every vesel calling the port contributes by paying a waste fee. Upon delivery of waste to a port reception facility, these fees are used to finance a retribution.

D Sustainability Report 2017- 19
1. Shipping
0
2000
4000
6000
8000
10000
12000
14000
16000
0
20000
40000
60000
80000
100000
120000
140000
160000
180000
200000
2010 2 011 2012 2 013 2014 2 015 2016
N°
of
po
rt c
alls
Astitel
Ship's garbage (MARPOL Annex V) Chemicals (MARPOL Annex II)
Ship's sewage (MARPOL Annex IV) Oil and oily water (MARPOL Annex I)
Total N° of port calls with MARPOL declaration N° of port calls for which a waste contribution was paid
Fig. 1.6: Annual quantities of ship’s waste and cargo residues delivered in the port of Antwerp by seagoing vessels. The columns represent the different types of waste as laid down in the MARPOL treaty. Right-hand axis: number of port calls for which a waste contribution was paid, and the number of calls for which waste was offered for collection.
Types of MARPOL waste in the port of Antwerp
• Oil and oily water (Annex 1) are mainly slops and sludges. The volume of this category has decreased significantly since 2015, probably for two main reasons:• On 1 January 2015, the North Sea area became an Emission Controlled Area
(ECA) under the terms of MARPOL. Vessels operating in this area, are obliged to use fuel with a maximum sulphur content of 0.1%. In practice the great majo-rity of ships use low-sulphur marine diesel or gasoil in order to comply with this requirement. This has led to a large decrease in the amount of sludge produced on board.
• Due to the fall in oil prices the value of oily waste has declined, making it relati-vely more expensive waste stream to dispose of.
• Chemical waste (Annex II) in Antwerp mainly comprises washing waters containing cargo residues from tank cleanings. Since the amount of such waste varies greatly according to the route sailed, the type of cargo and the type of ship (most origins from the cargo tanks of chemical tankers), the figures tend to fluctuate strongly.
• Ship’s sewage (Annex IV) comprises grey and black water. Under the terms of the MARPOL convention this water can be discharged at sea, subject to certain conditi-ons. The volume of declarations in the port of Antwerp is therefore limited.
• Ship’s garbage (Annex V). The volume of this type of waste is fairly constant.• Air-polluting waste (Annex VI): includes among others ozone-depleting substances
(e.g. from used fire extinguishers) and residues from scrubbing processes (see the chapter on emission-reducing technology). These waste streams are not included because they are only a very small proportion of the overall amount and the data on them is very limited.

1. Shipping
20 - Sustainability Report 2017

D Sustainability Report 2017- 21
1. Shipping
MOBILITY

2. Mobility
22 - Sustainability Report 2017
2. Mobility
Good accessibility is essential for the port of Antwerp to remain competitive. This means that the port not only need to offer connections to its hinterland by all possible transport modes, but also that these connections must be smooth and efficient.
Thanks to its favourable geographical location deep inland, seagoing ships can carry their goods far into the commercial, industrial and demographic centre of North-West Europe. Furthermore, from Antwerp customers can be reached quickly and efficiently by barge, rail and road in every direction. Together these factors are the main components of the sustainable mobility policy of the Antwerp port community.
The Antwerp Port Authority carries out an annual survey of the modal split of container transport between the port and its hinterland, representing the proportion of maritime containers carried to and from the port by the respective modes of transport on the land-ward side.
In 2016, the modal split for container transport was 56% road, 38% barge and 6% rail (see graphic). For all types of freight combined the split was 52% road, 40% barge and 8% rail.
Fig. 2.1: Modal split: relative proportions of maritime freight carried by the respective modes of transport on the landward side (source: Antwerp Port Authority)
The Antwerp Port Authority aims to generate an even more sustainable modal split in fu-ture, with a target for the year 2030 of 42% of containers being carried by barge, 15% by rail and only 43% by road. For all freight categories combined the objective is a 40-40-20 split (road-barge-rail). In order to achieve this ambitious objective, the port community is pursuing an action plan covering all aspects of sustainable mobility policy: infrastructure upgrades, improving efficiency and conditions, raising the level of safety etc.
Pipelines too are an important mode of transport, with significant quantities of liquid and gaseous products being carried by pipeline not only within the port area but also to and from the hinterland. Various initiatives are being developed to promote the use of this transport mode.
Mobility in the port of Antwerp covers much more than transport of freight. Commuting
P P

Sustainability Report 2017 - 23
2. Mobility
of employees also occupies an important place in the port’s mobility policy. The port community takes active measures to promote cycling and the use of public or collective transport, while at the same time making car transport as efficient and sustainable as pos-sible by means of car sharing or car pooling. Safety forms a key element in each of these these initiatives.
In the last few months various roadwork projects have started in and around the port area, some of them minor but some of them very extensive. All information on the various roadworks and ways of avoiding them is centralised in the Port Authority’s website un-der the title of “Towards an accessible port”. In addition, various information and dialog/working sessions for the entire port community are organised by Alfaport-Voka (Chamber of Commerce) and the Port Authority, with updates on the planned roadworks. Further, possible solutions to guarantee accessibility of the port both for freight transport and for commuting are discussed in smaller groups. At these sessions companies can voice their concerns and also present their own solutions or make proposals so as to inspire others. The follow-up discussions always include an update on the various measures and initiati-ves taken by the companies themselves to improve the mobility situation.
De Rycke innovates with floating concrete plant
8,390 trucks taken off the road! That’s the impressive result of the floating concrete plant used for the first time by the firm of De Rycke Brothers for a construction pro-ject on the St Michiels quay in Antwerp. This family firm in the field of concrete and construction materials was faced with the problem of what to do with an industrial concrete mixer that had become redundant. They came up with the brilliant idea of putting it on a floating pontoon.
The result is a concrete plant with a length of 14 metres mounted on a floating platform measuring 13 by 50 metres. The idea seems simplicity itself, but is actually unique and has now been patented. “The concrete plant is a redundant unit from construction of the Kieldrecht lock,” explains co-manager Koen De Rycke. “For this big construction project we had acquired two mobile concrete mixers, but once the job was over we didn’t immediately have a new use for them, so they were sitting useless in the corner of our site on the St Stevens road in the port. Transporting this type of mixing plant, setting it up and taking it down again takes a lot of time, effort and money, and so it’s only feasible for large projects. We eventually hit on the idea of installing one of the two concrete plants on a pontoon, to make a floating plant that could be transported by water relatively easily. We managed to find a second-hand pontoon fairly quickly, and then we approached a stability expert. This was essential as the plant is 14 metres high and had to be positioned very accurately on the pontoon. Once the pontoon is in position it is held in place by two heavy piles.”
The pontoon is currently lying at anchor at the St Michiels quay in Antwerp where concrete is being supplied for construction of a new quay wall. “The plant delivers between 80 and 120 cubic metres of concrete per hour, equivalent to taking 10 to 12 concrete trucks off the road each time. If you add this up over the total period of the project, it represents 8,390 truck trips being avoided,” says De Rycke proudly. “It also enables us to work much more efficiently. The pontoon has the great advantage that all the aggregate can be delivered by water. For this we use the Bevert, a pusher bar-ge on which we have mounted a crane that can feed the concrete plant continuously. That makes trucks completely unnecessary on any site up to a couple of hundred me-ters away from the water. But if necessary we can also use concrete mixer trucks to cover ‘the last mile.’ In whichever case it means much less emissions.”
The concrete mixing pontoon is suitable for all large construction projects in the gene-ral vicinity of a main waterway. As such it enables De Rycke to make significant savings on transport costs. “Moreover, our own concrete mixer trucks don’t get stuck in road congestion,” De Rycke adds. “We suffer a great deal from mobility problems, just like so many other companies in the region.”
With a height of 14 m the operational scope of the concrete pontoon is mainly limited

2. Mobility
24 - Sustainability Report 2017
to the ports of Antwerp, Ghent and Zeebrugge, but for sufficiently large projects it could be possible to partially dismantle it so that it can get under certain bridges. In the meantime interest has already been shown from Rotterdam, Copenhagen and Pa-ris. “We’re not going to travel all round Europe with our concrete mixer pontoon, but thanks to our expertise you’re sure to see clones of it in different countries in the not too distant future,” De Rycke concludes.
2.1 Travel between home and work
A workforce of nearly 60,000 employees means that tens of thousands of people com-mute to and from the port every day. A survey by the Flemish Traffic Centre has revealed that the average degree of congestion (length of congestion multiplied by the duration) in the Antwerp region rose from 196.18 km-hours in 2014 to 232.82 km-hours in 2016. The increased pressure of traffic combined with the large number of roadworks in and around Antwerp at present is a significant incentive for the Port Authority to look at alterna-tive transport possibilities. The various partners involved have developed a four-pronged series of initiatives based on infrastructure, sustainable modes of transport, limiting the amount of car transport, and safety.
2.1.1 Improvements to infrastructureRoadway operators such as Antwerp Port Authority and the Flemish Region (Roads & Traffic Agency and the Maritime Access department) strive to maintain the road infra-structure in the port in the best possible condition and where necessary to construct ad-ditional infrastructure. Cycling infrastructure is always taken into account in these efforts, as this is a crucial part of convincing employees to cycle to work. One important aid is the online reporting centre where users can report road defects or other obstacles in the port infrastructure, whether large or small. Antwerp Port Authority ensures that the reports are passed on to the relevant body so that they can be dealt with correctly. Particular at-tention is paid to specific difficulties that are revealed by the reports or that are identified by accident analysis. For instance, bridges and locks pose particular difficulties for cyclist. And since research has shown that more than two thirds of accidents on the way to or from work happen outside the port area, consultation with the surrounding municipalities forms an essential part of policy in this field. Particular infrastructure requirements for pu-blic transport and collective transport are also taken into account, with e.g. bus lanes and “park & ride” car parks.
2.1.2 Promoting more sustainable modesResearch has shown that 6% of port employees cycle to work, with each cyclist travelling 19 km on average between home and work each day. On the other hand only 0.4% of port employees make use of public transport. This is due mainly to the limited service in the port area, although collective transport largely makes up for it, mostly in the form of pri-vate initiatives such as the i-Bus and the Port of Antwerp Shuttle Bus. Nearly 10% of port employees make use of this collective transport
The Port of Antwerp Shuttle Bus is an initiative of Antwerp Port Authority and the Left Bank Development Corporation with financial support from the Flemish Government. The Shuttle Bus has been operating since 2009 on the Left bank of the Scheldt, and in 2017 it was extended to the Right bank also. This collective transport offers employees an alter-native to private cars, and also enables those without a car to travel to work in the port.
The typical port landscape with docks, rail infrastructure, the river etc. can be a formidable barrier to cyclists, sometimes forcing them to make detours of 10 km or more. This natu-rally has a negative impact on the number of employees who cycle to work. In order to overcome such barriers the Port Authority participates in creative solutions such as The Water Bus (“De Waterbus”) and the ferry at the Lillo bridge crossing (see box text). These initiatives form part of the Port Authority’s “water mobility” policy. A second Water Bus

Sustainability Report 2017 - 25
2. Mobility
route will be introduced in the course of 2018, linking the centre of Antwerp with the port.
80,8% Car (as driver)
2,2% Car (as passenger)
0,9% Motorbike/moped
9,7% Collective transport
0,0% On foot
6,0% Bicycle
0,3% Tram/bus/metro
0,0% Train
Fig. 2.2: Modal split for transport between home and work (2016, source: Port Authority)
2.1.3 Limiting car transport and making it more sustainable
Four out of five employees in the port drive alone to work, without any passengers. The Port Authority aims to reduce the number of solo drivers by 10% between now and 2030. One way of achieving this is to encourage car pooling, and so the Port Authority in collaboration with Alfaport-Voka (Chamber of Commerce) and the Left Bank Develop-ment Corporation has set up the Port of Antwerp Car Pool Platform (https://portofant-werp.carpool.be/). This enables employees of the participating partners to easily find a carpool partner. A further initiative is Smart to Antwerp (“Slim naar Antwerpen”) which was set up in 2017 as a pilot project to make it even more attractive for employees to become members of this platform.
2.1.4 Promoting safetyA survey of 90 companies with more than 26,000 employees has shown that two-whee-lers (motorbikes, mopeds and bicycles) are by far the most dangerous form of transport for travel between home and work. While the number of bicycle accidents fell further in 2016 and the number of lost-time accidents has remained stable since 2014, there has been a rise in the number of motorbike/moped accidents since the spectacular fall in 2014. The graphic below clearly shows the big difference between two-wheelers and other road users, underlining the importance of focusing relentlessly on traffic safety. However, atten-tion must also be paid to the safety of car users, since in terms of absolute numbers they have the second-highest number of accidents and lost time incidents (after cyclists). The low figure in the graphic can be explained by the large number of kilometres driven by car.

2. Mobility
26 - Sustainability Report 2017
Fig. 2.3: Number of accidents and lost-time days in travel between home and work, per 1,000,000 km on the main route 1) Source: Antwerp Port Authority
The Lillo bridge over the Canal dock frequently forms an obstacle for cyclists. Since shipping has priority in the port, cyclists often have to wait for half an hour or more while the bridge is open. The alternative routes to the North or South of the port represent a detour of 10 or 15 km. When the Lillo bridge was temporarily out of ope-ration for maintenance work in October and November 2016 the Port Authority de-cided to introduce a ferry service. This initiative was warmly welcomed by cyclists, with a total of 2,000 passengers making use of the ferry during this period. Not only that, but more than a quarter of users admitted to taking the car to work before the introduction of the ferry.
In view of the roadworks on the Scheldelaan road and the R2, and in order to get a complete view of the potential of this service, a second trial project was held from June to October 2017. Preliminary results show that nearly 8,000 passengers made use of the ferry in a period of less than two months, four times more than the previous trial project. An assessment will be carried out at the end of the project in order to decide what role this ferry can play in future.

Sustainability Report 2017 - 27
2. Mobility
2.2 Road transport
The port of Antwerp has excellent road connections with its hinterland. An extensive net-work of motorways gives customers direct access to destinations in Belgium, southern Netherlands, western Germany and northern France. The map below shows how the port of Antwerp offers better access than neighbouring ports when it comes to reaching these areas which together form the logistics heart of Europe.
Fig. 2.4: Accessibility of the port of Antwerp (source: Antwerp Port Authority)
However, the Antwerp ring road is frequently burdened with congestion, and in fact the degree of congestion is steadily rising, as shown in the graph.1
0
50
100
150
200
250
201620152014201320122011
Fig. 2.5: Degree of congestion on the main roads of Antwerp (source: Flemish Traffic Centre)
Although only 4.5% of traffic on Antwerp’s main roads is port-related freight transport (Antwerp Port Authority traffic census, 2016), the Port Authority is currently taking va-rious initiatives to make road transport more efficient and sustainable and thus to help make the port and its surrounding region even more accessible.
Antwerp Port Authority provides information on the traffic situation in and around the
1 In 2015 the Flemish Traffic Centre changed the way in which it calculates the degree of congestion. This new calculation method has been applied retroactively to the figures from 2011 onwards, but the figures quoted for 2010 by the DHV consulting company can no longer be recalculated. It is however possible for 2014, and the value for this year is shown according to the new method, thus permitting a comparison with the figures for 2016.

2. Mobility
28 - Sustainability Report 2017
port on its website (www.portofantwerp.com/nl/naar-een-bereikbare-haven). This ena-bles road users to plan their route better and so to reach their destination more quickly and efficiently. The website shows a roadmap with colour codings for traffic density, to-gether with traffic-related tweets (accidents, congestion etc.), mainly from the Flemish Traffic Centre. Users can also consult their journey times on the main approach roads giving access to the port and the Deurganck dock, for alternative routes. This information forms part of a wider “truck guiding system” that will be further developed in the near future with the aim of guiding freight traffic through the port in a smooth, efficient way.
In another initiative, extended opening hours for the Deurganck were introduced on a trial basis in spring 2017, with the dock being open 24/5 from 0500 hours on Monday morning to 0500 on Saturday. The results have been more efficient trip planning, faster turnaround times on the terminal and a reduction in peak traffic2. Another way of making road trans-port more efficient is to reuse empty containers, so that hauliers can combine different jobs and avoid an empty return trip. In 2016, 12% of containers delivered or picked up on the terminal were empties, 3% more than in 2014. Nearly a quarter (24%) of trucks mana-ged to combine a container pick-up with container delivery, thus limiting the number of empty trips. However, this actually represents a fall of 3% compared with 2014. One pos-sible explanation for this development could be the move by the MPET container terminal from the Right to the Left bank which was accompanied by the temporary closure of the empty container depot in 2016.
In addition to streamlining the operational processes, the environmental performance of the trucks is a major area of concern. The graphic below presents the results of the con-tainer census carried out by Antwerp Port Authority in 2017[3]3. This shows clearly that on average, trucks in the port area scored well in terms of the environment, as 86% of trucks were fitted with a Euro 5 engine or better. Indeed 46% of the engines comply with the latest Euro 6 standard.
Fig. 2.6: Breakdown of the Euro standard engine status of trucks in the port of Antwerp (source: Antwerp Port Authority container census, 2016)
Finally, the road infrastructure itself is of crucial importance for efficient, sustainable road transport. In collaboration with its partners Antwerp Port Authority has a rolling program-me of investment in maintenance, improvement and development of its road network. As
2 The average handling time rose from 2,653 sec in 2014 to 2,811 sec in 2016. These figures point to the need for spreading the handling hours and give force to the 24/5 initiative.
3 During the container census, interviews of truck drivers calling at the largest container terminals were carried out over a period of thee days. They were asked among other things about their destination, the Euro standard of the engine and whether they were driving full/empty, in/out. In contrast with the Euro standard diagram in the previous DHV census, the category “unknown” was included, which explains the difference in the numbers compared with the previous census.
P
Sustainability Report 2017 - 29
2. Mobility
a result of these efforts, in 2014 the road infrastructure scored 4.38 on a scale of 5 (source: koac-npc, 2012).
2.3 Rail transport
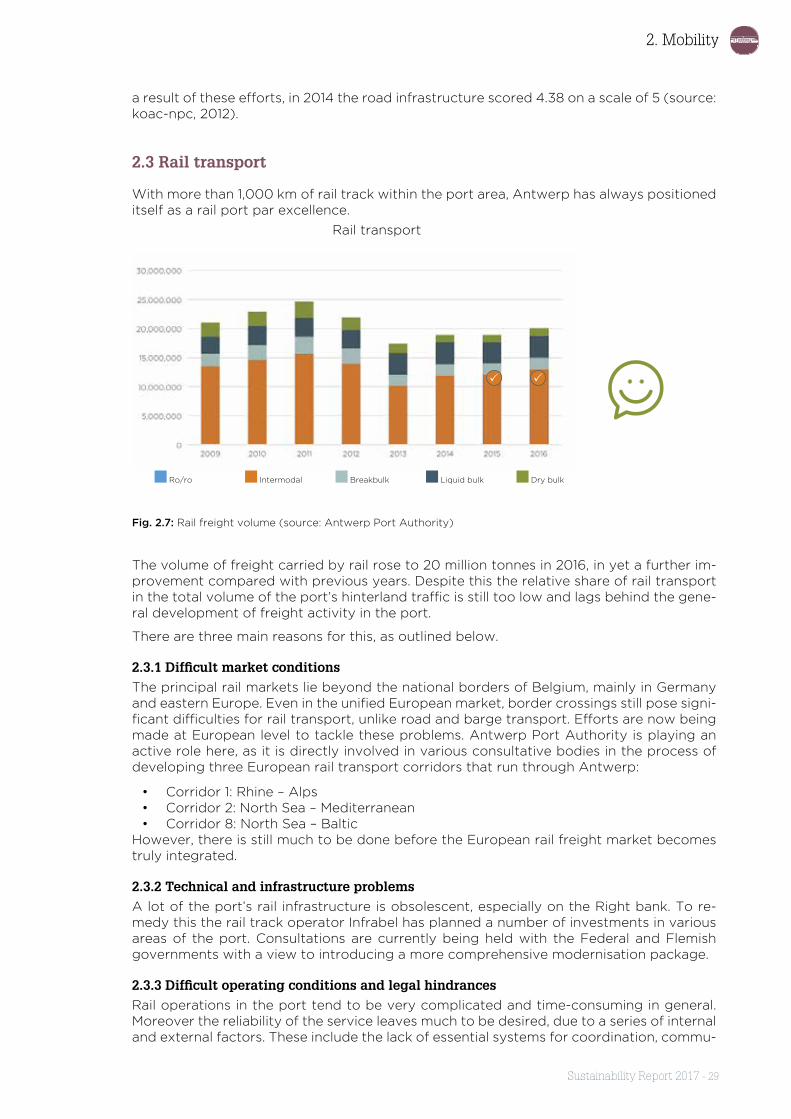
With more than 1,000 km of rail track within the port area, Antwerp has always positioned itself as a rail port par excellence.
Ro/ro Intermodal Breakbulk Liquid bulk Dry bulk
Rail transport
Fig. 2.7: Rail freight volume (source: Antwerp Port Authority)
The volume of freight carried by rail rose to 20 million tonnes in 2016, in yet a further im-provement compared with previous years. Despite this the relative share of rail transport in the total volume of the port’s hinterland traffic is still too low and lags behind the gene-ral development of freight activity in the port.
There are three main reasons for this, as outlined below.
2.3.1 Difficult market conditionsThe principal rail markets lie beyond the national borders of Belgium, mainly in Germany and eastern Europe. Even in the unified European market, border crossings still pose signi-ficant difficulties for rail transport, unlike road and barge transport. Efforts are now being made at European level to tackle these problems. Antwerp Port Authority is playing an active role here, as it is directly involved in various consultative bodies in the process of developing three European rail transport corridors that run through Antwerp:
• Corridor 1: Rhine – Alps• Corridor 2: North Sea – Mediterranean• Corridor 8: North Sea – Baltic
However, there is still much to be done before the European rail freight market becomes truly integrated.
2.3.2 Technical and infrastructure problemsA lot of the port’s rail infrastructure is obsolescent, especially on the Right bank. To re-medy this the rail track operator Infrabel has planned a number of investments in various areas of the port. Consultations are currently being held with the Federal and Flemish governments with a view to introducing a more comprehensive modernisation package.
2.3.3 Difficult operating conditions and legal hindrancesRail operations in the port tend to be very complicated and time-consuming in general. Moreover the reliability of the service leaves much to be desired, due to a series of internal and external factors. These include the lack of essential systems for coordination, commu-
P P

2. Mobility
30 - Sustainability Report 2017
nication and control, as well as complex, time-consuming plan-ning processes.
But apart from this, rail trans-port within the port is burdened by complex regulations and related procedures; these are mainly aimed at guaranteeing the safety of rail transport, but in practice they limit flexibility. This makes it even more diffi-cult for rail to compete with road transport.
Despite all these difficulties intensive efforts have been made in recent years to improve the position of rail transport in Antwerp. These include:
• Extending the opening hours of rail facilities. Until 2016 the rail facilities in the port were closed from Saturday morning to Sunday night. Since then various areas within the port – starting with the entire Right bank area – have been systematically opened to rail traffic during the weekend.
• Development of an ICT platform to provide uniform communication. Even today the different rail operators still use their own communication systems, which makes coordination difficult. A centralised communication system is now being developed in collaboration with the other Flemish ports, which ultimately should also permit better planning.
• Development of a stakeholder consultation system, so that customers can also be involved. In contrast to the situation in the past, customers are now informed direct-ly, well in advance, concerning repair work and other activities with an impact on rail traffic. This enables them to make allowances and to adjust their planning so as to minimise disruptions.
In the meantime there is a gradual trend within business to switch to rail transport. Within the port this makes itself felt with the growing interest being shown in promotional and information activities such as the Rail Café and the Intermodal Event. The response to re-quests for project proposals is also encouraging.
Request for Proposals: Central & Eastern EuropeFast, regular connections with central and eastern Europe are essential for a port such as Antwerp.
The port has long been able to rely on a dense network of multimodal connections between it and crucial areas in the hinterland. However, a market survey has revealed that Antwerp still needs to improve its position in Central & Eastern Europe by offering high-quality, direct rail links with countries in that region. At present these countries are mainly served by truck, with rail services mainly concentrating on German ports.
In response Antwerp Port Authority last year issued an RfP for rail projects aimed at providing sustainable, efficient connections between Antwerp and key regions in Central & Eastern Europe. After extensive screening the three projects below were selected. These will receive financial support from the Port Authority during a start-up period of not more than three years:

Sustainability Report 2017 - 31
2. Mobility
• Raising the frequency on the Ant-werp-Linz (A) rail corridor from three to five direct trains per week
• A new direct rail link between Ant-werp and the Czech Republic
• Raising the frequency of existing connections and developing a new rail network to cover more destina-tions in Poland
2.4 Barge transport
Thanks to its central location at the heart of the European inland waterway network, the port of Antwerp has excellent barge connections with the most important economic cen-tres of Europe. Barge is a safe, sustainable mode of transport with lots of future potential. Furthermore it plays a crucial role in assuring the accessibility of the port, now and in the future, and so Antwerp Port Authority makes every effort to promote this mode of trans-port.
In 2016 some 49,300 barges called at the port of Antwerp, carrying breakbulk, containers and dry and liquid bulk to and from destinations in Belgium, northern France, the Nether-lands, Switzerland, Austria and beyond. These vessels had an average freight capacity of 2,525 tonnes. There were 222 regular container shuttles per week to and from 85 destina-tions in Europe.
The Container barge Efficiency Indicator (CEI) has been developed to measure the per-formance of container barge handling in the port of Antwerp in an objective way. This indicator represents the average turnaround time per container movement: the lower the index, the faster the handling.
After a fall in the CEI index during the first half of 2015, it rose once more in the second half. This is the result of several factors. The exceptionally low water level in the Rhine led to an increase in the average turnaround time per container movement in the second half of 2015, since more barges with smaller volumes called at the port. In the second half of 2016 there was a much greater increase in the CEI index, due to among other things the move by the MPET terminal from the Right to the Left bank of the Scheldt and the ac-companying operational problems. There was a slight improvement during the first half of 2017, although the level of the CEI still remains high, indicating that the handling of barge containers in the port is still not as efficient as it could be.
Fig. 2.8: Variation in the CEI index (Container barge Efficiency Indicator) (source: Antwerp Port Authority)
P P P P

2. Mobility
32 - Sustainability Report 2017
Port of Antwerp Connectivity Platform
The Port of Antwerp Connectivity Platform enables customers to find information about the various transport possibilities offered by the port and the most efficient way of get-ting their goods to their destination. This portal gives access to free information about the maritime and intermodal solutions available within the port. 240 container terminals and 70 intermodal transport operators from 15 European countries have signed up to this platform.
The platform offers:
• An interactive map with a list of all the container terminals in the port of Antwerp and the services offered by them
• A list of all deepsea and shortsea departure and arrival times in the port of Ant-werp
• An online route planner with the intermodal connections between the port of Antwerp and 200 European hinterland terminals. Users are presented with a list of the most suitable means of transport, schedules and operators
Consolidation of barge container volumes
In order to permit more efficient handling of barge containers, Antwerp Port Au-thority seeks to reduce the number of calls by container barges with smaller loads. Consolidating the container volumes reduces the number of terminals that have to be called at, and so also reduces the turnaround time in the port. This results in more effi-cient use of resources and facilities, both for the barge operators and for the terminal operators. For this purpose the Port Authority encourages structural collaboration between the various market players in order to permit consolidation of the cargoes.
CLean Inland SHipping (CLINSH)
CLINSH is an EU project aimed at speeding up the reduction in barge emissions by promoting the use of alternative fuels, emission-reducing technologies and onshore power supplies. The project has 17 partners from Belgium, the Netherlands, Germany and the UK. With a contribution of 1.2 million euros Antwerp Port Authority is the se-cond-largest local partner.
The CLINSH project started in September 2016 and will run until the end of 2020. Du-ring this period the efficiency of alternative fuels and emission-reducing technologies will be measured on board the barges while they are actually under way, while the associated operational costs and the social and economic impacts will also be inves-tigated. The research results and the recommendations based on them will form a handy tool for local, regional, national and international policy makers, enabling them to draw up new, environment-friendly measures for the European barge fleet.
At the same time the CLINSH project will explain to local authorities about the ad-vantages of onshore power supplies. Using an onshore power supply while a barge is berthed in port, as opposed to running the barge’s own generator, causes lower emissions and thus contributes to better air quality.
The European barge fleet numbers around 15,000 vessels, and CLINSH aims to make a quarter of them more environment-friendly by the year 2025. This should result in a reduction of 141 kilotonnes of NOx per year.

Sustainability Report 2017 - 33
2. Mobility
2.5 Pipelines
The future of the European chemical industry lies with its clusters. Further integration within and between clusters, combined with further innovation and advances, will boost the competitive position of Europe and of the individual clusters. Pipelines are the ideal means of transport for achieving this integration. If Antwerp is to develop further and be-come the most advanced and innovative chemical and petrochemical cluster in Europe, then pipelines must be high on the agenda of Antwerp Port Authority and of the Belgian and Flemish governments.
2.5.1 Some facts & figuresThe following substances are transported by pipeline within, to and from the port:
Natural gas Ethylene Chlorine
Dichloroethane Propylene Propane
Acetone Phenol Nitrogen Oxygen
Hydrogen Carbon monoxide Ammonia
Naphtha Gas condensate Raw C4
Demineralised water Isobutane Hydrocarbons
(crude oil, benzene, diesel,
gasoil, kerosene and fuel oil)
These substances represent approximately 864 km of pipelines in the port. *
Their annual volume amounts to 48,325,684 tonnes and 1,693,503,839 tonne.km. *
* Figures obtained from Fetrapi 2016 and the transporters concerned: Fluxys Belgium, Inovyn Manufacturing Bel-gium, Nationale Maatschappij der Pijpleidingen (NMP), Praxair (Nitraco), Rotterdam-Antwerp Pipeline (RAPL), BASF Antwerpen, Petrochemical Pipeline Services (PPS), Total Olefins Antwerp, Total Belgium, Air Liquide Industries Belgium, Belgian Pipeline Organisation (BPO NATO)

2. Mobility
34 - Sustainability Report 2017

Sustainability Report 2017 - 35
2. Mobility
2.5.2 AdvantagesThe Belgian and Flemish governments still do not recognise pipeline transport as a full alternative to road, rail or barge transport. And yet pipelines offer numerous advantages and have a widely positive effect on the environment and mobility. One great advantage of pipelines is that they have hardly any external costs: whether in terms of transport emis-sions, noise nuisance, road congestion, intensive use of space or negative visual effects, pipelines score better than all other transport modes.
Pipelines contribute significantly towards solving the problem of mobility. If the tonnage of crude oil currently pumped through the RAPL (Rotterdam-Antwerp Pipeline) were to be carried by road, then 1,056 trucks would have to trundle between the two cities every single day. The energy consumption per tonne.kilometer of pipeline is only 20 to 25% that of road transport. Emissions too (CO
2, NOx, etc.) are very low, making pipelines very en-
vironment-friendly. Moreover the space taken up by pipelines is relatively limited. And last but not least pipelines are the safest form of freight transport in the world: studies have shown that the social cost of accidents caused by pipelines is negligible. By way of com-parison, the respective annual cost for road transport is 21.4 billion euros1. In fact, pipelines are so safe that some chemical substances may only be transported in this way.
Within the port of Antwerp, 88% of all liquid transport between the chemical companies is by pipeline.
Fig. 2.9: Comparison between transport modes. An underground pipeline carries as much energy per hour as 60 tanker trucks of fuel oil or 3 coal trains
2.5.3 DifficultiesThe main obstacle is that in certain parts of the port there is not enough room set aside for pipelines. Antwerp Port Authority and the petrochemical cluster have identified three areas where solutions are being sought:
• Difficulties within the port of Antwerp• Difficulties between the port of Antwerp and the hinterland (the corridors Ant-
werp-Geel-Tessenderlo-Geleen-Ruhr area and Antwerp-Feluy)• Difficulties between the port of Antwerp and other ports (the corridors Antwerp-Zee-
land-Rotterdam and Antwerp-Terneuzen/Ghent)1 Green Paper Towards Fair and Efficient Pricing in Transport, European Commission (1996), INFRAS (1996) and Rothengarten (1996). Figures based on the situation in 1994.
2. Mobility
36 - Sustainability Report 2017
In addition there are a number of other points for attention, such as streamlining and shortening the process for obtaining permits, updating the land use rights, lowering the investment costs for pipelines etc.
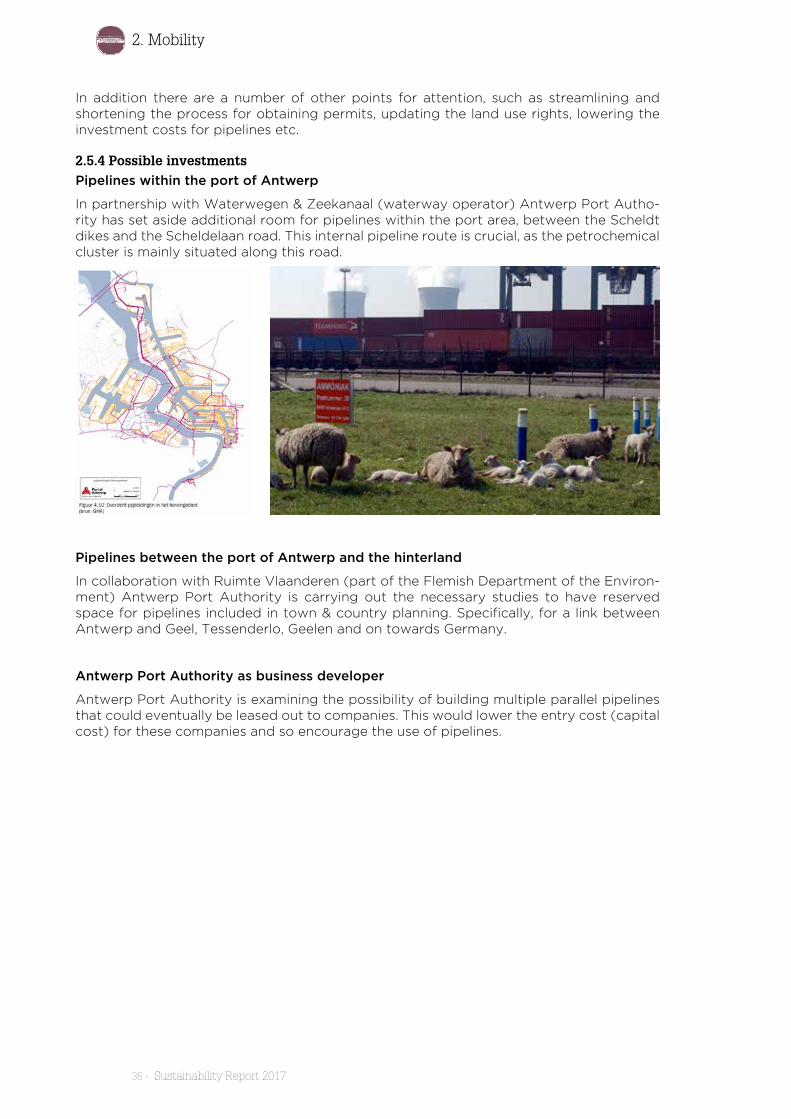
2.5.4 Possible investmentsPipelines within the port of Antwerp
In partnership with Waterwegen & Zeekanaal (waterway operator) Antwerp Port Autho-rity has set aside additional room for pipelines within the port area, between the Scheldt dikes and the Scheldelaan road. This internal pipeline route is crucial, as the petrochemical cluster is mainly situated along this road.
Pipelines between the port of Antwerp and the hinterland
In collaboration with Ruimte Vlaanderen (part of the Flemish Department of the Environ-ment) Antwerp Port Authority is carrying out the necessary studies to have reserved space for pipelines included in town & country planning. Specifically, for a link between Antwerp and Geel, Tessenderlo, Geelen and on towards Germany.
Antwerp Port Authority as business developer
Antwerp Port Authority is examining the possibility of building multiple parallel pipelines that could eventually be leased out to companies. This would lower the entry cost (capital cost) for these companies and so encourage the use of pipelines.

Sustainability Report 2017 - 37
2. Mobility
EMPLOYMENT AND SAFETY AT WORK

3. Employment and safety at work
38 - Sustainability Report 2017
3. Employment and safety at work
This chapter concentrates on the “People” aspect. It does not set out to list all the chal-lenges, let alone to find solutions to them. Rather it aims to give an overall picture of employment and the makeup of the labour force in the port. It then compares this “as is” situation with the challenges of today and tomorrow, such as mobility (personal transport and commuting between home and work), lifelong learning, later retirement and the “em-ployer branding” of the port. The responses to these challenges within the port communi-ty vary greatly, as can be seen from e.g. the different initiatives for improving commuter transport and promoting career development in the port.
3.1 Total employment
The port of Antwerp is by far the biggest employer in the region
The activities in the port of Antwerp generate more than 140,000 full-time jobs. Of these, more than 60,500 full-time equivalents (FTEs) are directly linked to port activities. But the port is much more than simply loading and unloading ships; it also generates a large amount of indirect employment: more than 81,500 FTEs depend indirectly on port activ-ities. This makes the port of Antwerp by far the biggest employer in the local area. The high employment figure is further confirmation of the port’s essential role as the economic engine of the wider region.
Fig. 3.1: Employment in the port of Antwerp (source: National Bank of Belgium, working paper 321)
In the non-maritime cluster the employment level now seems to have stabilised after the sharp drop in employment caused mainly by the worldwide economic crisis in 2009. In the maritime sector, however, the level is declining slightly. This is partly due to outsourcing, with companies concentrating on their core activities and contracting out the support services to third-party service providers. But this does not always mean that the jobs dis-appear: in many cases they are filled by specialist service providers, albeit sometimes on a part-time basis.
P P
Sustainability Report 2017 - 39
3. Employment and safety at work
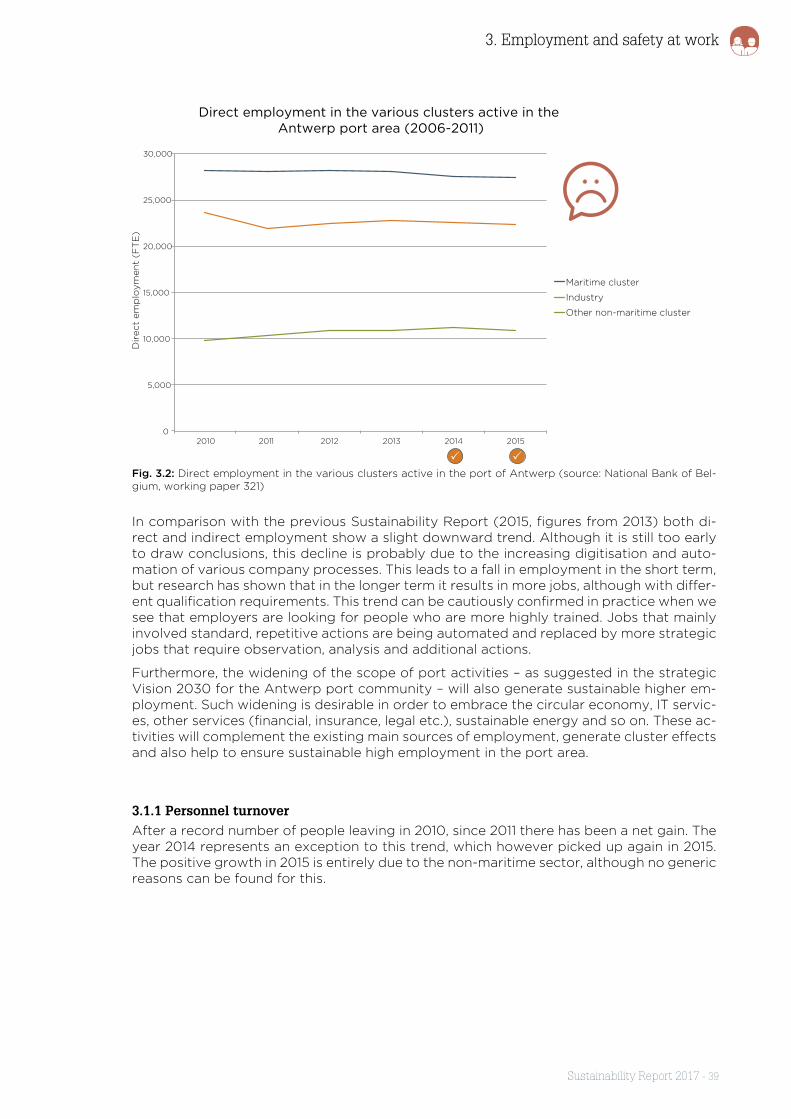
Fig. 3.2: Direct employment in the various clusters active in the port of Antwerp (source: National Bank of Bel-gium, working paper 321)
In comparison with the previous Sustainability Report (2015, figures from 2013) both di-rect and indirect employment show a slight downward trend. Although it is still too early to draw conclusions, this decline is probably due to the increasing digitisation and auto-mation of various company processes. This leads to a fall in employment in the short term, but research has shown that in the longer term it results in more jobs, although with differ-ent qualification requirements. This trend can be cautiously confirmed in practice when we see that employers are looking for people who are more highly trained. Jobs that mainly involved standard, repetitive actions are being automated and replaced by more strategic jobs that require observation, analysis and additional actions.
Furthermore, the widening of the scope of port activities – as suggested in the strategic Vision 2030 for the Antwerp port community – will also generate sustainable higher em-ployment. Such widening is desirable in order to embrace the circular economy, IT servic-es, other services (financial, insurance, legal etc.), sustainable energy and so on. These ac-tivities will complement the existing main sources of employment, generate cluster effects and also help to ensure sustainable high employment in the port area.
3.1.1 Personnel turnoverAfter a record number of people leaving in 2010, since 2011 there has been a net gain. The year 2014 represents an exception to this trend, which however picked up again in 2015. The positive growth in 2015 is entirely due to the non-maritime sector, although no generic reasons can be found for this.
P P

3. Employment and safety at work
40 - Sustainability Report 2017
Fig. 3.3: Personnel turnover in the port of Antwerp (source: National Bank of Belgium)
Modernising dock labour
In March 2014 the European Commission brought a procedure against the Belgian government for non-compliance. The Commission considered the system of dock la-bour in the Belgian seaports to be in conflict with the principle of freedom of establish-ment. The exclusive nature of the pool of dock workers, the shift system, job flexibility and the circumstances in which logistics activities can performed were all called into question.
After a period of constructive consultation between the federal government, the em-ployers and the trade unions in the port, a number of important changes to the organ-isation of dock labour in Belgium were implemented in the summer of 2016. The dock workers themselves support these changes, having approved them in a referendum. In the meantime the legal basis of dock labour, namely the Major Law of 8 June 1972, continues to apply unchanged. This means that only recognised dock workers may perform work within the port area.
However, one important change is that as of July 2016 employers can also hire rec-ognised dock workers from outside the pool with a contract of employment for an unlimited period. Thereafter, the permitted period of the contract will be progressively reduced so that as of July 2020 it will be possible to make a contract of employment for a limited period of one day.
A second important change in the regulations was the abolition of recognition for dock workers in the logistics sector. This means that logistics employees no longer have to meet the specific conditions for recognition. In 2016 all existing logistics dock workers had their status changed automatically to “logistics employee with safety certificate.” New employees automatically receive the new status.
In addition agreements were made to periodically review the shift systems in the port of Antwerp so that they can be modified more quickly. The shift systems determine how many dockers have to be used for handling particular types of freight and/or types of ship. Also, job flexibility for dock workers will be gradually introduced, so that dockers can do different types of work.
Finally, the Belgian government agreed with the European Commission that the basic training for dock workers would be deregulated. Previously all new dock workers in Antwerp had to follow a compulsory training course in the Dock Workers Training Centre (“Opleidingscentrum voor havenarbeiders,” a non-profit organisation responsi-ble for all dock work training in the port of Antwerp). As of July 2016 this training can be freely provided by any training centre that meets the quality criteria laid down by the Flemish Government.
The European Commission gave its agreement to all these fundamental changes to the organisation of dock labour in Belgium, and in May 2017 it called off its procedure for non-compliance.
P P

Sustainability Report 2017 - 41
3. Employment and safety at work
Employer branding You. The port. The world.
In addition to the individual campaigns profiling the various port companies and the vacancies that they offer, Alfaport-Voka (Chamber of Commerce) has developed an employer branding campaign at community level. In this campaign the port presents itself as a community with a strong “us” feeling: a community as an attractive employ-er, one that new members of personnel are keen to join.
The interactive process between Alfaport-Voka and the port companies has resulted in an employer brand with the baseline: “You. The Port. The World.” This baseline stands for six core values that are important for the port of Antwerp, and for working in it:
• The port of Antwerp is a world leader• Our employees are distinguished by their expertise and professional know-how• We are famous for our can-do, hands-on mentality• We go creatively in search of the solutions of tomorrow, with smart ideas and ad-
vanced methods• The port is bustling and full of life. It is a melting pot of different cultures and func-
tions which together form a tight-knit community: a village, a city, a microcosm. Working in the port of Antwerp means coming in contact with many widely diffe-ring nationalities and cultures, without having to physically travel
• Human contact remains primordial within the port: contact among our members of personnel, our suppliers, the various other stakeholders and especially our custo-mers
The practical implementation of this employer branding will be rolled out in the course of 2017 and 2018.
3.2 Working locally, but commuting less by car?
Antwerpse haven belangrijker voor omliggende gemeenten dan voor stad Antwerpen
The port of Antwerp is more important for surrounding communities than for the city of Ant-werp
When it comes to employment, the positive effects of the port of Antwerp make themselves felt much more widely than just the city of Antwerp. The expansion of the port over the past few years has been mainly to the North and the West, resulting in a growth of employment in the wider region.
More than 15,000 residents of the city of Antwerp find work in the port, and so the city makes the largest contribution in absolute terms to direct employment in the port. In relative terms, however, this employment represents only 7.9% of the total number of jobs in the city.
In the surrounding communities the impact of the port on total employment is much greater. For instance, one in three residents in the municipality of Stabroek works in the port. In the mu-nicipality of Beveren the port accounts for nearly one in four jobs. Percentages ranging from 15 to 20% of total employment are also found in the municipalities of Kapellen, Zwijndrecht, Essen, Kalmthout and Wuustwezel.
In other words, a large number of people in the wider Antwerp-Waasland region find employ-ment locally thanks to the port, with consequent positive effects for their work/life balance. Nevertheless, many of them commute to and from their work by car. This has various draw-backs, as the amount of road congestion is steadily increasing: since 2012 it has risen by more than 40%. According to the latest half-yearly “congestion barometer” published by Touring Mobilis (September 2017) the strain on our roads between the morning and evening rush hours is steadily increasing. The degree of congestion between 1000 and 1500 hours has increased significantly. While the maximum length of traffic jam during the rush hour has not increased, there are a greater number of jams throughout the day.
This congestion also puts pressure on the port of Antwerp. Companies are confronted with reduced accessibility for suppliers and customers (see: “Freight transport”), link te maken naar

3. Employment and safety at work
42 - Sustainability Report 2017
modal shift while their employees too suffer from the increasing congestion. Sometimes they give up and find a more congestion-free job. Some potential employees choose not to apply in the first place for fear of the punishing journey between home and work. In other words, congestion also has a negative impact on the image of the port of Antwerp as an attractive employer.
To deal with this various initiatives are being taken, both at the level of the port community and at the level of individual companies. For example, Antwerp Port Authority is collaborating with Alfaport-Voka and Antwerp-Waasland Chamber of Commerce to reduce the number of car trips during peak periods. Measures are being taken to promote alternative means of transport (bicycle, carpooling, public transport and collective transport), to spread the trips out (flexi-time), or to avoid them altogether (home working).
Practical initiatives include The Waterbus (“DeWaterbus”) and a port-wide campaign to pro-mote alternative forms of travel between home and work.
In 2016 Alfaport-Voka and Antwerp-Waasland Chamber of Commerce launched the site www.bereikbaarwerk.be. During the first year 3600 individual users visited the site, accounting for around 4600 web sessions. The site provides companies with information about current and planned roadworks and the impact that these will have on the accessibility of the individual companies. It also offers an outline of possible initiatives that companies can take to organise the commuter travel of their employees in different ways. These include the possibility of car-rying out a “mobi-scan” (mobility survey) and various alternatives such as collective transport, electric bicycles, carpooling etc. These and other possible initiatives are also presented at the Discussion Sessions organised for companies by Antwerp Port Authority and Alfaport-Voka. In 2016 and 2017 eight Discussion Sessions were organised, attended by a total of 120 companies.
Individual companies too take their own initiatives. The Port Authority itself makes company bikes available (soon also to include electric bicycles) and is co-investing in an additional Bike Station near the new Port House. The tram line that hopefully will be extended to the Port House at the beginning of 2019 will be a very welcome contribution, offering members of staff an al-ternative to using their own car.
Partly in response to traffic congestion, individual companies are also introducing measures such as home working and flexitime. At company level, agreements are made with employees for e.g. some of the working week to be spent at home. The practical arrangements for this nat-urally vary from company to company. But in all cases good agreements and especially dialogue between employer and employee are essential. Since they were first introduced in 2014, remote working and flexitime have played an ever greater role within the Port Authority: currently there are 700 or so employees who can work from home on an occasional or structural basis.
Number of inhabitants employed in the port of Antwerp
Proportion of working population, per municipality
Place of residence of employees Essen1.319 16,4%
Kapellen
Kalmthout
Stabroek2.806 33,2%
Wuustwezel
Brecht
Brasschaat
Schilde
Malle
Zoersel
Zandhoven
Grobbendonk
Wijnegem
Ranst
Hove
Duffel
Heist-op-den-berg
Berlaar
Lier
Lint
Boom
Niel
Schelle
AartselaarNijlen
Schoten
Wommelgem
ZwijndrechtBeveren
Kruibeke
Temse
Sint-Niklaas
Sint-Gillis-Waas
Stekene
Lokeren
BorsbeekMortsel
Kontich
Edegem
Hemiksem
RumstRumst
1.221 15,7%
2.280 20,5%
1.415 15,0%
1.879 14,2%
2.001 13,1%
593 7,6%
318 4,7%
648 7,0%
370 6,5%404 9,7%
657 7,7%179 3,5%
282 2,8%
110 2,2%
201 1,1%
325 2,2%
225 3,0%
186 4,6%
155 4,7%
227 3,4%
414 4,5%
450 5,1%
218 3,1%
318 5,3%
194 4,3%
397 8,2%
241 6,6%
406 4,7%
1.429 17,4%5.032 24,2%
12,2%
1.057 14,8%
796 6,4%
1.690 5,6%
1.221 14,3%
951
256 1,5%
356 7,8%
452 8,0%
1.867 13,0%
Boechout
339 6,1%
source: NBB, 2016
Antwerp15.152 7,9 %
Fig. 3.4: N° of residents in the neighbouring municipalities employed in the port of Antwerp in 2014 (source: Antwerp Port Authority)
Conclusion: in relative terms (compared with total employment in the community) the port of Antwerp is more important for the surrounding municipalities than it is for the city of Antwerp itself. This also shows that in addition to the disadvantages (such as the pressure on roads) the port of Antwerp also has a number of significant advantages. Employment is one of the most important of these. In addition the port community takes initiatives to offer added value for the local communities.

Sustainability Report 2017 - 43
3. Employment and safety at work
3.3 Industrial accidents and illness
3.3.1 Accident prevention
3.3.2 Safety at work and absence due to illnessA safe working environment remains a top priority for the Antwerp port community. For this purpose the companies in the port invest intensively in prevention of industrial acci-dents. The objective of the Community Global Prevention Plan is to half the number of in-dustrial accidents relative to the number of jobs carried out by 2020 compared with 2012 and to reduce the number of fatal accidents to zero.
The graphic shows a positive trend, but unremitting efforts towards safety are required if this objective is to be reached.
CEPA (association of port employers) has produced a series of comic strips with the aim of raising safety consciousness. Antwerp Port Authority has followed this example, producing a comic strip on the subject of safety. Further, employees and managers are approached on the subject of safety directly on the workfloor and digital toolboxes are made available to them. Each toolbox gives more information about a particular safety issue and explains how the employee can deal with it. The digital toolboxes should eventually make it easier to reach employees working at other locations and/or in shifts. In 2016 toolboxes were in-troduced on the subject of among other things cycling and personal protection equipment.
The graphics for overall industrial accidents includes accidents both in the workplace and on the way to and from work.
Fig. 3.5: N° of industrial accidents and accidents on the way between home and work occurring to contingent employees under Parity Committee 301.01 (source: CEPA)

3. Employment and safety at work
44 - Sustainability Report 2017
Fig. 3.6: N° of industrial accidents and accidents on the way between home and work occurring to employees of Antwerp Port Authority (source: Port Authority)
Absence due to illness is another major concern in the port of Antwerp. The rate of ab-sences in Belgium in 2016 was practically constant compared with 2015. This is actually quite remarkable, as the rate in Belgium has risen considerably since 2004 (source: SD Worx Research & Development, Absence due to illness in Belgium, 14 February 2017). In the case of Antwerp Port Authority the number of days of absence in 2016 and 2015 was more or less the same: in the case of the dock workers contingent (PC 301.01) there was an increase of nearly 17 days in 2016.
Fig. 3.7: Average N° of days of absence due to illness per employee (source: CEPA, Port Authority)

Sustainability Report 2017 - 45
3. Employment and safety at work
Kirsten Vanleeuw is chosen Safety Advisor of the Year 2017
Kirsten Vanleeuw, head of the internal Safety department at Borealis in Kallo (Bever-en), has been chosen by the technology federation Agoria as “Safety Advisor of the year 2017.”
“As safety advisor my job has a great deal of variety,” says Kirsten Vanleeuw. “One mo-ment I’m dealing with Health & Safety, another I’m busy with the safety of production processes. When all the plants have to close for e.g. maintenance or other work, then I additionally assume the role of safety coordinator. My most important tip for any new safety advisor who is just starting out is make sure you get on the workfloor, so you know what the employees are doing there and why they do it.”
Marc Lambotte, CEO van Agoria, explains: “Prevention is all about avoiding small dif-ficulties and big dramas. The role of the safety advisor is therefore of fundamental importance for all people who work in the company. Kirsten Vanleeuw and Borealis un-derstand this perfectly, and that makes them an example that we warmly welcome.” At the presentation of this award Agoria also introduced its new code of good practice: “Control of exposure to chemical substances during technical operations.” This code, the sixth in the series, has been introduced at the request of both employers and con-tractors who are confronted with accidents with chemical substances during technical operations. Agoria has developed the code in collaboration with companies and con-tractors in the chemical and petrochemical sector. It consists of tips and useful models for such operations which can help to manage risks and prevent accidents or injuries.

3. Employment and safety at work
46 - Sustainability Report 2017
Hoe beter we zijn voorbereid, hoe minder
kans op on-gevallen.
de pbm-matrix is daarbij een handig hulpmiddel!
tijdens een receptie in het havenbedrijf... nooit meer
arbeidsongevallen in ons bedrijf... zou dat
niet mooi zijn?
Hm... da’s een mooie ambitie die onze
CEO heeft...
Die dag wordt er nonchalant omgesprongen met de pbm’s.Jongens, daar loopt
een zootje ongeregeld!
hoog tijd dat we de puntjes
weer op de I zetten...
ho, mannekes!
jullie hebben met de klak naar de pbm’s gesmeten.
Hebben jullie start-werk
overleg gehad?
euh... slik...
oké, daar gaan we iets aan
doen.
Bruno, ge komt als geroepen. Jij bekijkt met de mensen de taken voor
vandaag, welke risico’s hieraan verbonden zijn en wat er van hen
wordt verwacht qua veiligheid.
okidoki,alex.
Kom, mensen. We gaan terug binnen en overlopen alles met de matrix voor persoonlijke beschermingsmiddelen... of
kortweg de pbm-matrix!
de matrix werkt als volgt: met de pijl kies je aan de achterkant de taak die je moet uitvoeren, en aan de voorkant de
locatie. Onderaan verschijnen telkens de pbm’s die je nodig hebt om dit op een
veilige manier te doen.
Effe demonstreren... Tuur wat ga jij doen
vandaag en waar?
wel, de matrix geeft aan dat je
veiligheidshandschoenen, hesje, zwemvest en helm nodig
hebt, tezamen met je gehoorbe-scherming en je veiligheidsbril
als je gaat slijpen.
In het kantoor van de ceo...
enthousiaste bende!... hoe meer pbm’s, hoe minder risico’s op ongevallen! top!
we zijn goed bezig!
Dit moet ik delen met
de collega’s...
Samen met bruno past het team de pbm-matrix toe, met resultaat...
zo’n moment moeten we
vastleggen!
een stuk afslijpen aan de
sluis, bruno.
hé, een nieuwe post van alex... wat een

Sustainability Report 2017 - 47
3. Employment and safety at work
zit jouiets dwars?
Praat erover!
Caroline heeft er een uurtje fietsen op zitten en neemt een douche in de sanitaire ruimte van het havenhuis.
Can’t stop the feeling...
dat had ik al lang moeten doen, zie... Die plakkaatjes
aan de douches hangen.
Dames en heren
apart!
heb mijn bril wel niet
bij, maar ach...
I got that sunshine in my
pocket...
Voilà. De douche-plaatjes voor de mannen hangen.
de vrouwen nog...
Amai, die man heeft een hoog
stemmetje!
Even later... Ah, eindelijk de douches gevonden...
Oei!Euh...
Nu snap ik het. De
bordjes zijnverkeerd ge-
hangen.
enkele uren later... Die bordjes hingen dus niet juist... Man man,
Was me dat een kouwe douche... of liever: een héte!
hohoho!
hèhèhè!
BijAlex...
Caroline, je hebt er alvast goed aan gedaan om langs te
komen en...
Sorry hé caroline, ‘t was ongepast
van mij...
Mja, excuses aanvaard... Maar ik hoop dat ze die bordjes zo rap
mogelijk juist hangen!
Enne... die bordjes van Caroline hingen wel
juist, zenne!
Zit er jou ook iets dwars? Praat erover met
je collega’s of met je leidinggevende.
Zo vermijd je wrevel...
Dinges...Ik...
JaJa...

3. Employment and safety at work
48 - Sustainability Report 2017
3.4 More attention to education and training of present and future employ-ees
Rising level of education and great attention to training
The modest rise in the level of education in the port of Antwerp is holding steady (31.8% in 2015 compared with 30.8% in 2013). The number of employees with only primary edu-cation has fallen to less than 15% compared with all other (secondary and higher) levels of education. This trend is slightly different from the national figures, where the relative proportion of primary education is rising while the proportion of secondary education is falling.
Fig. 3.8: Level of education of employees in the port of Antwerp for the year 2015 (source: National Bank of Belgium)
In comparison with the figures for Belgium as a whole (2015) the maritime sector employs fewer people with a higher level of education. The non-maritime sector on the other hand scores better than the national average. Here the number of employees with a higher level education is 37%, which is more than 50% greater than in the maritime sector.
As in previous years, the proportion of employees with a higher level of education in both sectors is rising slightly, while the proportion with only primary education is falling. The labour market survey by Alfaport-Voka (2017) also confirms the trend for employers to require personnel with a higher level of education.
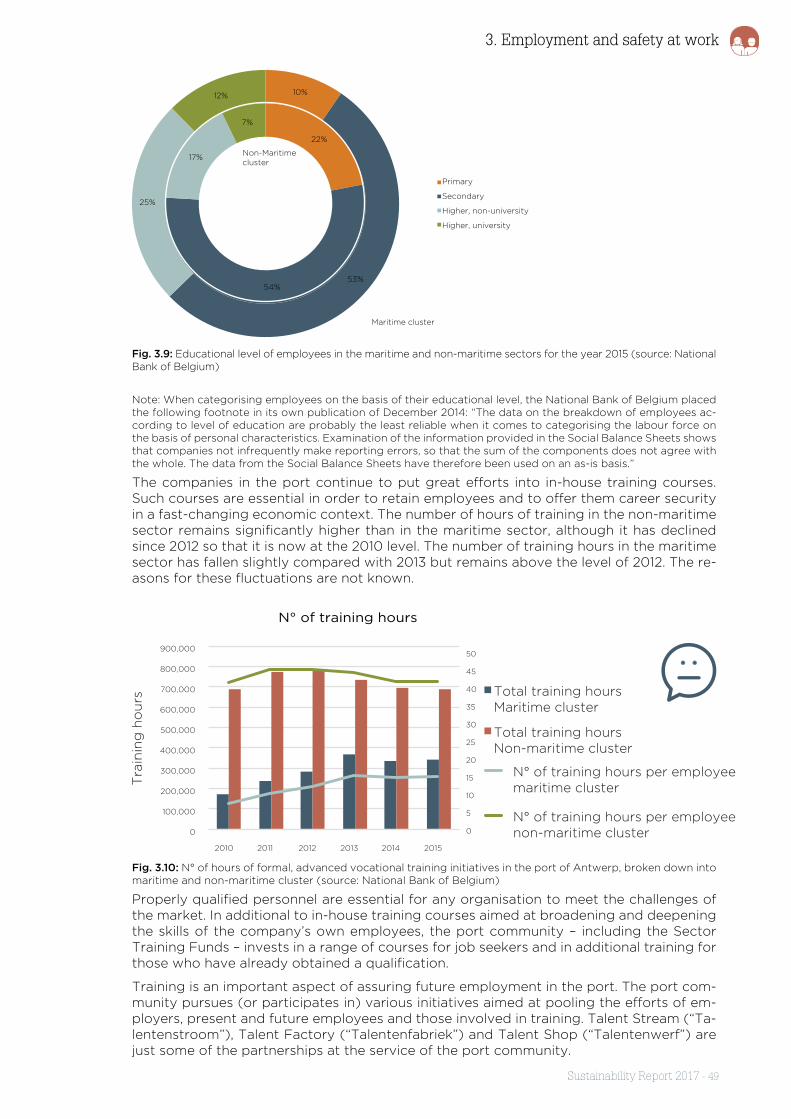
Sustainability Report 2017 - 49
3. Employment and safety at work
Fig. 3.9: Educational level of employees in the maritime and non-maritime sectors for the year 2015 (source: National Bank of Belgium)
Note: When categorising employees on the basis of their educational level, the National Bank of Belgium placed the following footnote in its own publication of December 2014: “The data on the breakdown of employees ac-cording to level of education are probably the least reliable when it comes to categorising the labour force on the basis of personal characteristics. Examination of the information provided in the Social Balance Sheets shows that companies not infrequently make reporting errors, so that the sum of the components does not agree with the whole. The data from the Social Balance Sheets have therefore been used on an as-is basis.”
The companies in the port continue to put great efforts into in-house training courses. Such courses are essential in order to retain employees and to offer them career security in a fast-changing economic context. The number of hours of training in the non-maritime sector remains significantly higher than in the maritime sector, although it has declined since 2012 so that it is now at the 2010 level. The number of training hours in the maritime sector has fallen slightly compared with 2013 but remains above the level of 2012. The re-asons for these fluctuations are not known.
Fig. 3.10: N° of hours of formal, advanced vocational training initiatives in the port of Antwerp, broken down into maritime and non-maritime cluster (source: National Bank of Belgium)
Properly qualified personnel are essential for any organisation to meet the challenges of the market. In additional to in-house training courses aimed at broadening and deepening the skills of the company’s own employees, the port community – including the Sector Training Funds – invests in a range of courses for job seekers and in additional training for those who have already obtained a qualification.
Training is an important aspect of assuring future employment in the port. The port com-munity pursues (or participates in) various initiatives aimed at pooling the efforts of em-ployers, present and future employees and those involved in training. Talent Stream (“Ta-lentenstroom”), Talent Factory (“Talentenfabriek”) and Talent Shop (“Talentenwerf”) are just some of the partnerships at the service of the port community.

3. Employment and safety at work
50 - Sustainability Report 2017
Inclusive and sustainable? The “Inclusive Employer” certificate
Sterpunt Inclusief Ondernemen offers a service to employers and potential employees, bringing them into contact, with the emphasis on people who would normally have difficulty in finding work. It helps employers to find people for difficult-to-fill positions, and offers training, coaching and career help for employees and job-seekers alike. Its members (“Workplace Architects”) are service-providing organisations, “inclusive em-ployers” and social organisations. Its customers are the companies and organisations with whom employees are placed. These are rewarded with a certificate as “Inclusive Employer.” Companies, NGOs, government departments and all other players in soci-ety are challenged to achieve the Sustainable Development Goals. These 17 goals are included in the new certificate for 2017.
In the early part of 2017 the Workplace Architects awarded 578 such certificates. Within the port community three companies obtained an Inclusive Employer certifica-te. Atalian and LNT were awarded a certificate for offering work experience and on-the-job training for people who would otherwise have difficulty in finding employment. Their certificate was presented at an event organised the INTRO group, a Workplace Architect. Switch/IT Pro for its part was awarded a certificate for offering work expe-rience, on-the-job training and job coaching on the workfloor.
A new Inclusive Employer campaign is due to start in the spring of 2018.
Working for longer
How is the port community dealing with the new reality that everyone will have to work until they are older? A survey of 1,671 Belgian employees carried out by the HR group Securex in the summer of 2017 yielded the following findings:
• � Self-motivated employees (those who find their job enjoyable, interesting, worth-while or meaningful) are willing to work four years longer than those who don’t.
• � Employees who work only because they have to (compelled by circumstances or by other people) have twice as many long-term absences: 22% are absent from work for 21 days or more per year, compared with 10% for the rest.
• � Belgians who work do it less and less “because they want to” and more “because they have to.” Their self motivation has declined by 7% since 2009.
Securex therefore concludes that a new mindset is needed, both among employees and among employers: “The figures show that we have to give a new meaning to ‘work’ and to the motivation for it. This can be done by focusing on autonomy, belongingness and competencies (ABC). Any measure that gives a greater feeling of autonomy (A), creates a feeling of belongness to the job, promotes organisation of colleagues at work, or enga-ges their competencies (C) will make people want to work longer and keep on working. This can be done by creating a work context that is more in line with their talents.”
But there is work to be done for the government too: “The government is stuck in ‘you have to work’ mode, but as we have seen this does not offer any added value for the de-sired retiring age. The trend in the past few years has actually been away from autonomy towards more controlled motivation, which explain why employees are still against ha-ving to work for longer. The trick is to create the conditions that make it more enjoyable and meaningful to work for longer. This can be done by for example developing a legal framework that facilitates and supports custom work, job crafting, remote working and flexitime.”
One more reason, then, to focus on in-house training or partnerships for developing the skills of employees. At the same time, remote working and flexitime offer greater auto-nomy, while also having the side effect of reducing road congestion. And if on top of this each employer focuses on employee belongingness with their job (employer branding can also make a contribution here), then we have all the ingredients to make a reality of working for longer.

Sustainability Report 2017 - 51
3. Employment and safety at work
WELT
There are various initiatives to help companies reduce the number of difficult-to-fill positions. In fact there are so many initiative-takers and different types of employment measures that companies have difficulty in finding out which measures are the most suitable for them and how they can best obtain support.
One of these initiatives is WELT: Work Experience & Learning Trajectories. This was introduced in 2016 as an initiative of the Flemish government and Voka (Chamber of Commerce).
WELT follows a two-pronged approach:
• Development of a future-oriented qualification and training policy, taking a proac-tive approach to the challenges of the labour market by for example expanding the recruitment pool through on-the-job training in consultation with the various employment agencies
• Developing a network of companies: a learning consultation platform for sharing know-how, with 13 companies, WELT coordinators and employment agencies. Companies bring up their own subjects at monthly meetings focusing on e.g. em-ployer branding, policy on welcoming new employees, etc. At these meetings they draw inspiration both from each other and from the experts who attend.
“Workplace learning” is currently in vogue, as the teaching and application of skills on the workfloor matches the present and future skills of employers and job-seekers alike. WELT promotes flexible working and provides companies with customised advice and coaching in the field of workplace experience. Together with the companies a practical training plan is drawn up. This is followed by support for implementation of the learn-ing programme, with customised tools, in collaboration with the employment agencies. WELT coaches the companies in putting all this into practice.
In September 2017 there were already 50 member companies, spread over four learn-ing networks. Five of these companies are active in the Antwerp port area. The jobs concerned include technical operational and managerial staff, IT developers, forwar-ders, technical drawers etc.

3. Employment and safety at work
52 - Sustainability Report 2017
3.5 A closer look at the port community workforce
3.5.1 Still mainly full-time contracts with indefinite periodCareer security in the port of Antwerp
Where previously “job security” was the norm, where the employee remains with the same employer throughout their career, “career security” is increasingly the new reality for the next generations. In an ever more rapidly changing economic context, employees incre-asingly seek longer-term employment prospects. This may mean staying with the same company, but it does not always have to be the case. Some employees may deliberately seek a new challenge within the same sector, but perhaps with a different company. The port of Antwerp makes every effort to meet these expectations.
Part-time work is more common in other sectors. The number of part-time contracts in the port may be increasingly slightly, but the great majority of jobs remain full-time, and to large extent also they are for an unlimited period. Thus both employer and employee enter into a long-term commitment.
This means that the port of Antwerp is able to guarantee long-term employment while also affording the opportunity to seek new challenges within the same sector. The large number of companies combined with the many different activities in the port (logistics, industry, freight handling, commerce etc.) offer plenty of opportunities in this respect.
On the other hand, from the data available it is not possible to draw conclusions about the impact of employment under subcontracting, or about the type of employment contract associated with this type of work. If the proportion of subcontractors is increasing, then it become all the more important for employees to secure their employment opportunities in the longer term. By continually improving their qualifications employees can maintain and even improve their value on the labour market.
Fig. 3.11: Full-time versus part-time contracts of employment in the port of Antwerp (source: National Bank of Belgium)
P P

Sustainability Report 2017 - 53
3. Employment and safety at work
Fig. 3.12: Contracts of employment for indefinite versus definite period in the port of Antwerp (source: National Bank of Belgium)
3.5.2 Diversity in the port, but still not enoughThe port community aims to contribute towards a sustainable port by making its workfor-ce reflect the makeup of the active population within the port area.
There are no figures available to reflect this diversity at the level of the port community as a whole, but we may assume that this objective has not yet been attained. By way of illustration we can look at the male/female employment ratio, the only diversity figure available at port level.
While the proportion of men has fallen slightly in favour of a limited rise in the number of women employed in industry and the other non-maritime sectors, there are still a lot more men than women working in the port of Antwerp.
The industrial operators and the freight handlers employ significantly more men than wo-men. The agents and forwarders for their part present a more mixed picture: here the ra-tios tend towards the national averages, with a much larger number of women. The same trend is observable within the Port Authority, where the proportion of female employees has risen to 22%, but this is still far below the national average.
Fig. 3.13: Ratio of men/women employed in the port of Antwerp (source: National Bank of Belgium)
P P
P P

3. Employment and safety at work
54 - Sustainability Report 2017
There is no convincing explanation for this preponderance of male employees in the port sector. The fact that the Parity Committee for dock workers (PC 301) has a very male tradition certainly plays a role here. On the other hand, social and technological develop-ments in dock labour mean that more and more women choose to work here. In October 2016 there were 316 female dock workers (4% of the total number).
Another factor is the high proportion of technical and operative jobs within the port com-panies. The training for these jobs tends to attract mainly male candidates, leading to a correspondingly large supply of male job seekers.
In the meantime the port community is pursuing its efforts to not only to attract both men and women but also to make everyone interested in a job in the port (see box text: “Em-ployer branding”).

Sustainability Report 2017 - 55
3. Employment and safety at work

3. Employment and safety at work
56 - Sustainability Report 201756 - Duurzaamheidsverslag 2017
ECONOMIC ACTIVITY
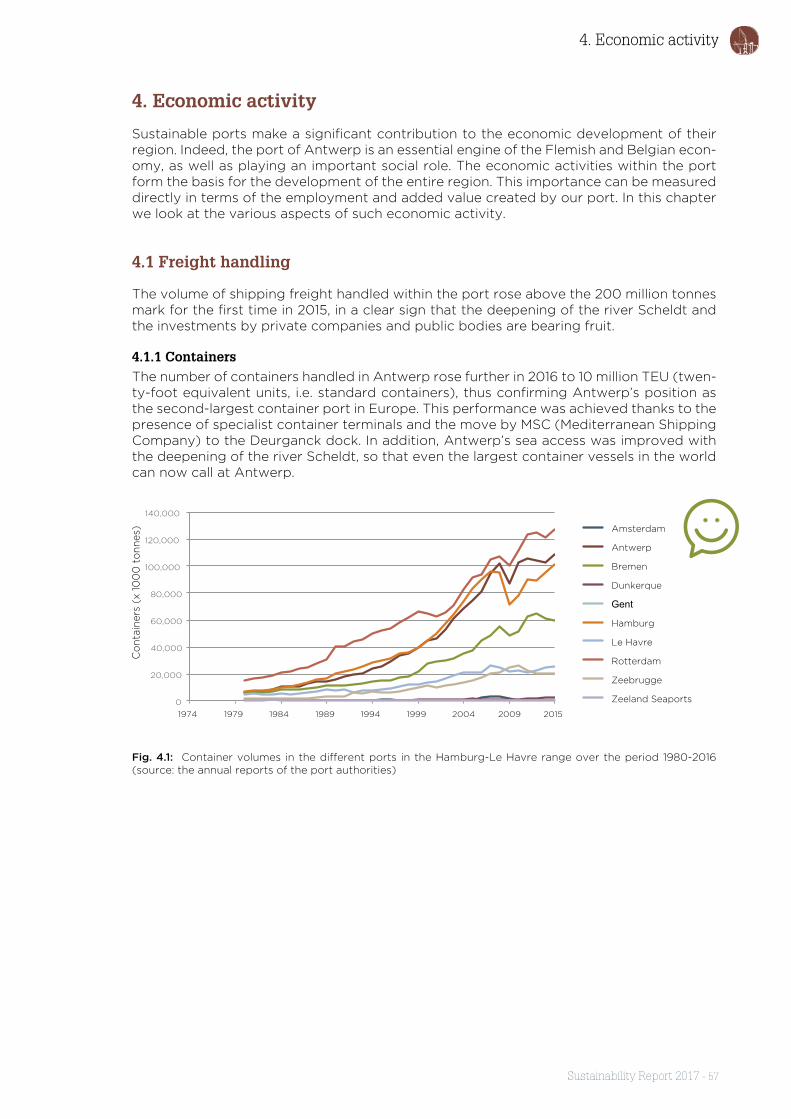
Sustainability Report 2017 - 57
4. Economic activity
4. Economic activity
Sustainable ports make a significant contribution to the economic development of their region. Indeed, the port of Antwerp is an essential engine of the Flemish and Belgian econ-omy, as well as playing an important social role. The economic activities within the port form the basis for the development of the entire region. This importance can be measured directly in terms of the employment and added value created by our port. In this chapter we look at the various aspects of such economic activity.
4.1 Freight handling
The volume of shipping freight handled within the port rose above the 200 million tonnes mark for the first time in 2015, in a clear sign that the deepening of the river Scheldt and the investments by private companies and public bodies are bearing fruit.
4.1.1 ContainersThe number of containers handled in Antwerp rose further in 2016 to 10 million TEU (twen-ty-foot equivalent units, i.e. standard containers), thus confirming Antwerp’s position as the second-largest container port in Europe. This performance was achieved thanks to the presence of specialist container terminals and the move by MSC (Mediterranean Shipping Company) to the Deurganck dock. In addition, Antwerp’s sea access was improved with the deepening of the river Scheldt, so that even the largest container vessels in the world can now call at Antwerp.
Fig. 4.1: Container volumes in the different ports in the Hamburg-Le Havre range over the period 1980-2016 (source: the annual reports of the port authorities)

4. Economic activity
58 - Sustainability Report 2017
4.1.2 BreakbulkThe breakbulk volume, subdivided into conventional breakbulk, non-containerised break-bulk and ro/ro (roll-on/roll-off freight) has levelled off over the past two years. Despite this, Antwerp remains the leading port in the range for conventional breakbulk. Indeed, Antwerp leads the way in Europe for categories such as coffee, wood and fruit. The annual volume of 7.7 million tonnes of steel and non-ferrous metals also makes our port a world leader.
Fig. 4.2: Volume of non-containerised breakbulk in the different ports in the Hamburg-Le Havre range over the period 1980-2016 (source: the annual reports of the port authorities)
Fig. 4.3: Volume of conventional breakbulk in the different ports in the Hamburg-Le Havre range over the period 1980-2016 (source: the annual reports of the port authorities)
0
5,000
10,000
15,000
20,000
25,000
Ro
/ro
(x
100
0 t
on
nes)
Amsterdam
Antwerp
Bremen
Dunkerque
Gent
Hamburg
Le Havre
Rotterdam
Zeebrugge
Zeeland Seaports
Fig. 4.4: Volume of ro/ro freight in the different ports in the Hamburg-Le Havre range over the period 1980-2016 (source: the annual reports of the port authorities)2016 (bron: jaarverslagen havenbedrijven)

Sustainability Report 2017 - 59
4. Economic activity
4.1.3 Dry bulkThe dry bulk volume has continued to decline in recent years, largely due to the trend in industry towards cleaner forms of energy and the consequent lower demand for coal.
Fig. 4.5: Volume of dry bulk in the different ports in the Hamburg-Le Havre range over the period 1980-2016 (source: the annual reports of the port authorities)
4.1.4 Liquid bulkThe volume of liquid bulk has risen further over the past two years, in parallel with the growth in the amount of tank storage capacity available in the port. The port-related pet-rochemical cluster and the tank storage companies ensure that Antwerp has a very strong position within Europe.
Fig. 4.6: Volume of liquid bulk in the different ports in the Hamburg-Le Havre range over the period 1980-2016 (source: the annual reports of the port authorities)
4.2 Investments
After trending downward until 2013, there was a clear rise in the amount of investment in 2014 and 2015, in both the maritime and the industrial cluster. In the industrial field, the two large refineries in the port (Total and ExxonMobil) both announced large-scale investment projects.
ExxonMobil is investing more than 1 billion dollars in construction of a new Delayed Cok-er Unit that is due to become operational in late 2017. The new unit will convert heavy, high-sulphur fuel oil into environment-friendly oil products and transport fuels such as gasoil for shipping and diesel for the European market.
Total with its Optara project for its part is investing in construction of a new solvent desul-phurisation unit and a new mild hydrocracking unit. These will convert the vacuum residue into high-grade oil components that will be further processed in Total’s existing facilities. In addition, Total is investing 1 billion euros in its ROG (Refinery Off-Gas) project in which

4. Economic activity
60 - Sustainability Report 2017
waste gases from the refinery will be converted into ethylene and propylene, which in turn will be used as feedstock for the polymer industry.
Together these investments assure the long-term presence of these two chemical giants in the port of Antwerp.
Fig. 4.7: Investments by the different sectors active in the port of Antwerp (2008-2013)
4.3 Labour productivityThe high productivity of labour for which Belgium is famous is also evident in the port of Antwerp. In this case, labour productivity is defined as the amount of added value created per full-time equivalent (FTE) job. Over the past two years the labour productivity in most sectors rose further compared with the situation in 2013. The sectors “Shipping agents & forwarders,” “Shipping freight” and “Land transport” saw their labour productivity decline in 2014 and recover somewhat in 2015, although it remained lower than in 2013.
Fig. 4.8: Labour productivity in the port of Antwerp (source: National Bank of Belgium, working paper 321)
P P
P
P

Sustainability Report 2017 - 61
4. Economic activity
4.4 Added value
The port of Antwerp makes an important contribution to the Belgian and Flemish econo-my, in fact more than many other sectors in the Belgian economy. This is reflected not only in the amount of employment but also in the amount of added value created. The direct and added value created in the port of Antwerp contributes no less than 5.0% of Belgian and 8.6 of Flemish GDP.
Fig. 4.9: Comparison of added value in the port of Antwerp with other sectors in Belgium (2015). For the other sectors, the share of added value created in the port of Antwerp is shown in red (source: National Bank of Bel-gium, working paper ...)
In both 2014 and 2015 there was a clear increase in both direct and indirect added value, al-though the amount of direct added value remained below that of indirect added value. The increase in direct added value is ascribable to the maritime cluster and to industry within the port. The added value of the other non-maritime cluster remained the same.
Fig. 4.10: Added value divided into direct and indirect added value (source: National Bank of Belgium, working paper 321)
P P

4. Economic activity
62 - Sustainability Report 2017
Fig. 4.11: Added value in the maritime cluster, industry and the other clusters operating in the port (source: Na-tional Bank of Belgium, working paper 321)
Industry remains the largest creator of added value in the port of Antwerp. After a low point in 2013 (4.8 billion euros), the added value in the industry sector rose to 5.4 billion euros, the highest in the past five years.
Freight handling also generates large added value, rising further to 1.6 billion euros in 2014 and 2015.
The only sector that saw its added value actually fall in the past two years (albeit only slightly) is land transport. Nevertheless, the level in 2015 is still higher than in 2011.
Fig. 4.12: Direct added value per sector in the port (source: National Bank of Belgium, working paper 321)
P P

Sustainability Report 2017 - 63
4. Economic activity
4.5 Profitability
Overall, the profitability of the Antwerp port companies is very good. In 2014, the profita-bility was positive for all sectors except shipping companies and land transport.
As regards the shipping companies what immediately stands out is the volatility, with positive profitability in 2013 (2%), a sharp drop in 2014 (- 8%) and then a jump back up in 2015 (7%).
In 2015, land transport was the only sector with negative profitability, although it is also trending upwards, from - 3% to - 0.5%. The most profitable sectors are still Miscellaneous, Freight handling and Shipping agents & forwarders.
The profitability of ther Antwerp Port Authority has risen further over the past two years, to 9%.
Fig. 4.13: Profitability of the different sectors in the port of Antwerp (source: National Bank of Belgium, working paper 321)
4.6 Logistics activities
The port of Antwerp is famous for its “value added logistics,” with goods not only being transhipped but also undergoing further processing. This can range from measuring and weighing to repackaging and labelling and even assembly. These activities are carried out in covered storage facilities. Antwerp now has some 627 hectares of covered storage space. In 2016, 15 ha of new warehouse space was built by Loghidden city, Van Moer, De Rijke, Mexiconatie, Luiknatie Coldstore, D’Hollander Equipment and Cuypers Vorkliften.
P P

4. Economic activity
64 - Sustainability Report 2017
Fig. 4.14: Covered storage space in the Antwerp port area (source: Antwerp Port Authority)
The above figures do not include the tank storage capacity of refineries and liquid bulk storage & distribution companies. The storage capacity of the refineries has remained unchanged over the past few years, while the capacity of the storage & distribution com-panies rose in 2015.
Fig. 4.15: Tank storage capacity in the port of Antwerp (source: Antwerp Port Authority)
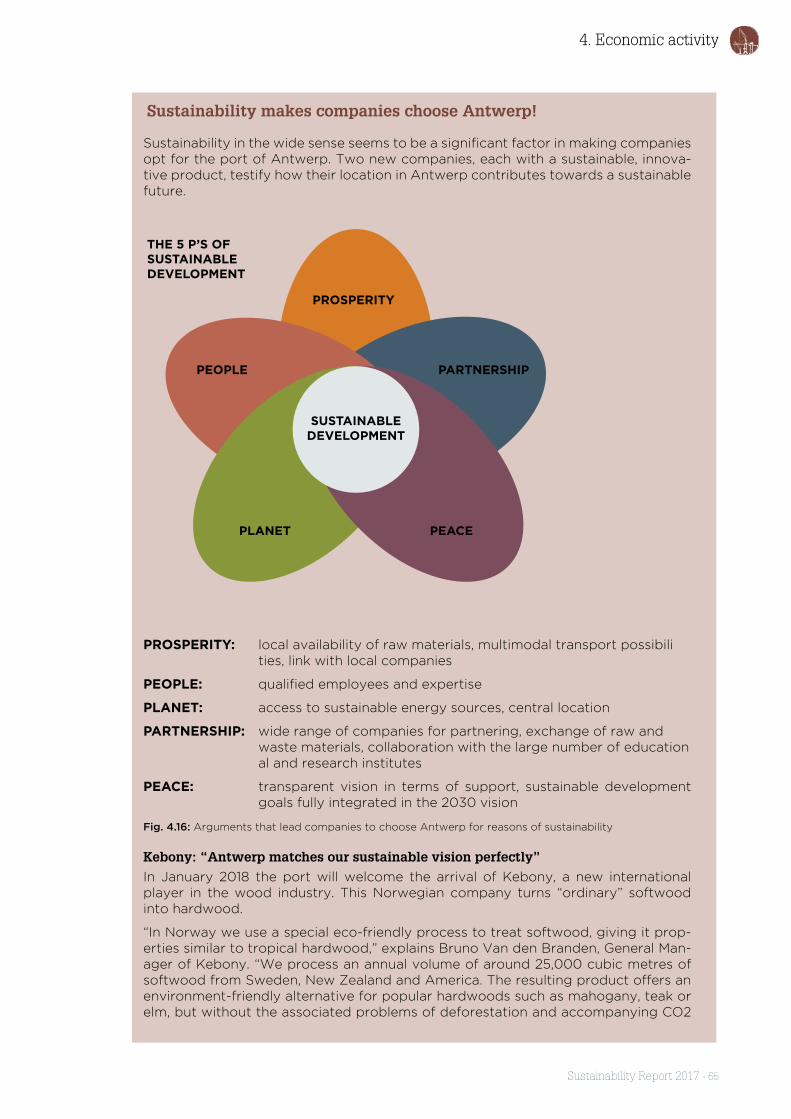
Sustainability Report 2017 - 65
4. Economic activity
Sustainability makes companies choose Antwerp!
Sustainability in the wide sense seems to be a significant factor in making companies opt for the port of Antwerp. Two new companies, each with a sustainable, innova-tive product, testify how their location in Antwerp contributes towards a sustainable future.
PROSPERITY
PEOPLE PARTNERSHIP
SUSTAINABLEDEVELOPMENT
PLANET PEACE
THE 5 P’S OF SUSTAINABLE DEVELOPMENT
PROSPERITY: local availability of raw materials, multimodal transport possibili ties, link with local companies
PEOPLE: qualified employees and expertise
PLANET: access to sustainable energy sources, central location
PARTNERSHIP: wide range of companies for partnering, exchange of raw and waste materials, collaboration with the large number of education al and research institutes
PEACE: transparent vision in terms of support, sustainable development goals fully integrated in the 2030 vision
Fig. 4.16: Arguments that lead companies to choose Antwerp for reasons of sustainability
Kebony: “Antwerp matches our sustainable vision perfectly”In January 2018 the port will welcome the arrival of Kebony, a new international player in the wood industry. This Norwegian company turns “ordinary” softwood into hardwood.
“In Norway we use a special eco-friendly process to treat softwood, giving it prop-erties similar to tropical hardwood,” explains Bruno Van den Branden, General Man-ager of Kebony. “We process an annual volume of around 25,000 cubic metres of softwood from Sweden, New Zealand and America. The resulting product offers an environment-friendly alternative for popular hardwoods such as mahogany, teak or elm, but without the associated problems of deforestation and accompanying CO2

4. Economic activity
66 - Sustainability Report 2017
emissions. As of 2018 we will also do processing in the port of Antwerp, on the site of the chemical giant Lanxess in Beveren-Kallo. Here we will process Radiata pinewood from New Zealand. The raw planks with a length of 3 to 6 metres are impregnated in large baths filled with an eco-friendly liquid obtained from among other things corn cobs and sugar beet. After that the planks are dried in huge ovens. This gives them the properties of tropical hardwood: strong, resistant to mould and damp, not ex-panding, and looking better as it gets older.”
What made Kebony choose Antwerp as its first international site?
“The port of Antwerp is located very centrally within Europe. It’s handy both for distri-bution of the finished product and for the supply of our raw materials. Our softwood comes by sea from New Zealand, while the eco-friendly impregnating liquid comes from Geel, in Belgium. Finishing of the treated wood is then done in a woodworking shop in Kruibeke, near Antwerp. We also collaborate with the University of Ghent for sustainable forest management. So all in all, Antwerp is the ideal base for us.”
What was the deciding factor?
“Antwerp matches our sustainable vision perfectly. The chemical giant Lanxess – whose site we are sharing – will supply steam for our production process from its ECLUSE network. This heat distribution network on the Left bank takes steam from waste processing by chemical companies and supplies it to other companies in the port.”
Avantium: “All the infrastructure and expertise we need are here already”The drink packaging of the future will be bioplastic made from vegetable raw ma-terials instead of fossil fuels. What’s more it will probably be produced in Antwerp, about five years from now: bioplastic manufacturer Synvina, a joint venture between Avantium and BASF, is building its first big production plant in the port.
“Everybody understands that we can’t go on using fossil fuels in the way we do now,” says Avantium CEO Tom van Aken. “Instead, Avantium is focusing on renewable chemistry. In fact we’re a leader in this field. One of our most significant activities is production of PEF, a type of polyester made from fructose syrup. It is entirely plant-based and can be fully recycled. PEF is an environment-friendly alternative for PET (polyethylene terephthalate, produced from fossil fuels), aluminium or glass. It also has unique properties, so that packaging can be made thinner and lighter than with conventional plastic.”
Why choose Antwerp?
“Avantium built a pilot plant five years ago in Geelen, South Netherlands. But to pro-duce on a really big scale we need greater capacity, and so Synvina is building a new plant in Antwerp, on the BASF site. The collaboration with BASF will help us with the financing and will speed up the final commercialisation of PEF. But BASF wasn’t the only reason for choosing Antwerp. All the infrastructure and expertise we need are here already: tank storage, water purification, ships to bring supplies of fructose syrup, etc. In Antwerp we can also find employees with the right qualifications and expertise to successfully scale up the new process. And then there is the financing: subsidies are available in all countries, but such good support for innovative technol-ogy companies is only available here, thanks to the Flemish PMV and federal FPIM programmes.”
What are the plans for the Antwerp plant?
“Production is due to start in 2021, with 50,000 tonnes of PEF per year. There are lots of potential applications: it can be used to package food and drink. We are already in discussions with companies such as Danone and Coca-Cola. But we’re also approach-ing other innovative companies that are looking for new, sustainable plastics. The big players know that the time is ripe for alternative, environment-friendly materials: they follow their customers, and young consumers are increasingly concerned about sustainability.”

Sustainability Report 2017 - 67
4. Economic activity
67 - Duurzaamheidsverslag 2017
NATUUR EN MILIEU

5. Nature and the environment
68 - Sustainability Report 2017
5. Nature and the environment
The above chart illustrates the degree to which national and international objectives for nature and the environment in and around the port area have been attained. The port is pursuing measures to attain the objectives in each of these areas. The different aspects are dealt with in greater detail in the following sections.
5.1 Cleanliness Index
The Cleanliness Index is a measurement based on the presence or absence of litter, fly tipping, weed growth, road defects etc. It does not measure the amount of litter or fly tip-ping in absolute terms, but rather it expresses the degree of cleanliness of public spaces. The index is based on the cleanliness measurements developed by OVAM (Flemish Waste Management Authority) and IVAGO (a local municipal waste management authority).
It has been used by Antwerp Port Authority since 2015 to measure cleanliness within the port area. In parallel an app was developed in 2016 that permits direct measurements to be made easily on the ground. It can be used to alert internal stakeholders about fly tip-ping, road defects etc. The possibilities are being examined for extending the use of this app to other departments (e.g. to report damage to port facilities) and also making it available to external stakeholders such as the City of Antwerp.
The graphic below shows the development of cleanliness on the Left bank, the Right bank and the port area as a whole. While the overall trend is positive, it tends to fluctuate quite a lot.
Fig. 5.1: Variation in Cleanliness Index 2015-2017 (Source: Port Authority Environment Department)

Sustainability Report 2017 - 69
5. Nature and the environment
5.2 Dock litter
Dock litter is made up of things such as packing material (wood and plastic), bits of moor-ing cables and fenders, and other litter (empty drink cans etc.) that ends up in the water. This litter can come from the landward site (all sorts of activities on the quayside, includ-ing fly tipping) or from the seaward site (fly tipping by ships). Antwerp Port Authority takes the necessary measures to clean up this litter, not only because it wants to keep its own port clean but also because floating objects can cause damage to ships and to port infrastructure. The Condor clean-up barge is constantly at work removing litter from the water and from shores.
Fig. 5.2: Dock litter picked up by the Condor barge in the port of Antwerp (source: Antwerp Port Authority)
The amount of litter collected rose constantly until 2014. After that it fluctuated strongly, depending on whether and how much the Condor could be deployed. The rise until 2014 was due to more efficient deployment of the Condor. The sudden drop in 2015 was due either to the Condor being laid up for repairs or to a lack of personnel.
5.3 Barge waste
The 2016-2020 Flemish Barge Waste Management Plan is the local implementation of the international CDNI treaty on barge waste (www.cdni.be), transposing it into local regulations.
This treaty (Convention relative à la Collecte, au dépôt et à la réception des Déchets sur-venant en Navigation Rhénane et Intérieure) distinguishes between three types of waste:
• Waste that contains oil and fat (mainly from the machine room)• Cargo residue (solid, liquid and gaseous)• Other waste from barge operation
To collect waste containing oil and fat, Antwerp Port Authority operates a bilge barge on the Right bank area of the port. In addition there are three waste collection parks (two on the Right bank and one on the Left) where barges can hand over other waste. The waste gathered in this way is taken to a licensed waste processing facility by a recognised waste collector, dealer or broker.
Cargo residue is the responsibility of the shippers and consignees. In the port of Antwerp these players can call upon appropriate loading and unloading facilities with the necessary equipment to collect and process residues.
In future, shippers will also have to cover the costs of degassing, for which Antwerp Port also provides the necessary facilities with a range of degassing equipment. In the mean-time the Port Authority is preparing to implement the ban of free venting of gases, with
P P

5. Nature and the environment
70 - Sustainability Report 2017
the introduction of electronic detectors (iNoses) and an infrared camera in order to catch offenders. The iNoses will mainly provide early warning in case of illicit degassing or ac-cidental release of gas, in order to take the necessary precautions and safety measures, while the infrared camera will be used by the Harbourmaster’s Office in its police capacity in order to detect infringements.
0
500
1000
1500
2000
2500
3000
3500
4000
20162015201420132012
3317
3680
3361
2598 2689
Fig. 5.3: Fig. 1: Collection of bilge water and waste oil from barges in the port of Antwerp from 2012 to 2016, in m� (source: Antwerp Port Authority) Barge bilge and oil (m�)
0
50
100
150
200
250
300
350
400
450
500
20162015201420132012
Miscellaneous non-dangerous barge waste (tonnes)
234 235
339
416
461
P P
P P

Sustainability Report 2017 - 71
5. Nature and the environment
0
35
70
105
140
175
210
245
280
315
350
20162015201420132012
Miscellaneous dangerous barge waste (tonnes)
209
241
335 333326
Fig. 5.4: Collection of solid waste from barges in the port of Antwerp from 2012 to 2016, in tonnes (source: Ant-werp Port Authority)
Between 2012 and 2016 there was a downward trend in the amount of bilge water and barge oil offered for collection (fig. 1). This decrease can be explained by the greater efforts made by the other Flemish inland waterway operators to gather barge waste containing oil and fat. As regards solid barge waste there has been an increase since 2014 in absolute terms (fig. 2). This might be due to the fact that since 1 November 2013 non-dangerous and oily barge waste can no longer be handed over free of charge along the Dutch waterways.
At the same time there has been a significant development in the number of selectively collected fractions of non-dangerous barge waste. In collaboration with the barge industry Antwerp Port Authority is making efforts to reduce the remainder waste fractions to a minimum. For instance, the opening of the waste collection facility on service quay 601 has led to 80% of all non-dangerous barge waste now being collected selectively.
Dangerous barge waste is always collected selectively, although the methods vary accord-ing to the degree and type of danger, and also the recycling possibilities. At the moment 20 different types of dangerous waste are collected selectively, whereas in 2010 the num-ber was only six.
5.4 Soil quality
As required by Flemish legislation, Antwerp Port Authority and the port companies carry out systematic surveys of soil pollution and take effective measures to deal with such pol-lution wherever it is found. Further, soil protection measures enshrined in environmental legislation ensure that any new contamination is avoided as far as possible.
The figures show a clear trend: the number of sites for which information is lacking is steadily declining, while at the same time there are more and more sites that do not require any further clean-up. In other words, soil surveys reveal that either the necessary clean-up has already been done, or that no clean-up is necessary in the first place. However, the number of sites for which no information is available will never drop to zero, as there is no legal obligation to carry out soil surveys on sites where there has never been any activity that carries a risk of pollution.
P P

5. Nature and the environment
72 - Sustainability Report 2017
Fig. 5.5: Soil survey situation in the port of Antwerp in terms of the number of sites (left) and the ground area (right). The sites are divided into those at risk and those not at risk. At-risk sites are those where there is or has been activity with a risk of pollution. For the at-risk sites, a soil survey has shown either that no further measures are required, or that a descriptive soil survey or soil clean-up is required. (source: OVAM)
In 1996, OVAM (Flemish Waste Disposal Authority) set an objective of at least starting clean-ups of all legacy pollution by 2036. The first step towards this is to carry out initial soil surveys of all at-risk sites. At the moment the port of Antwerp is on schedule for this.
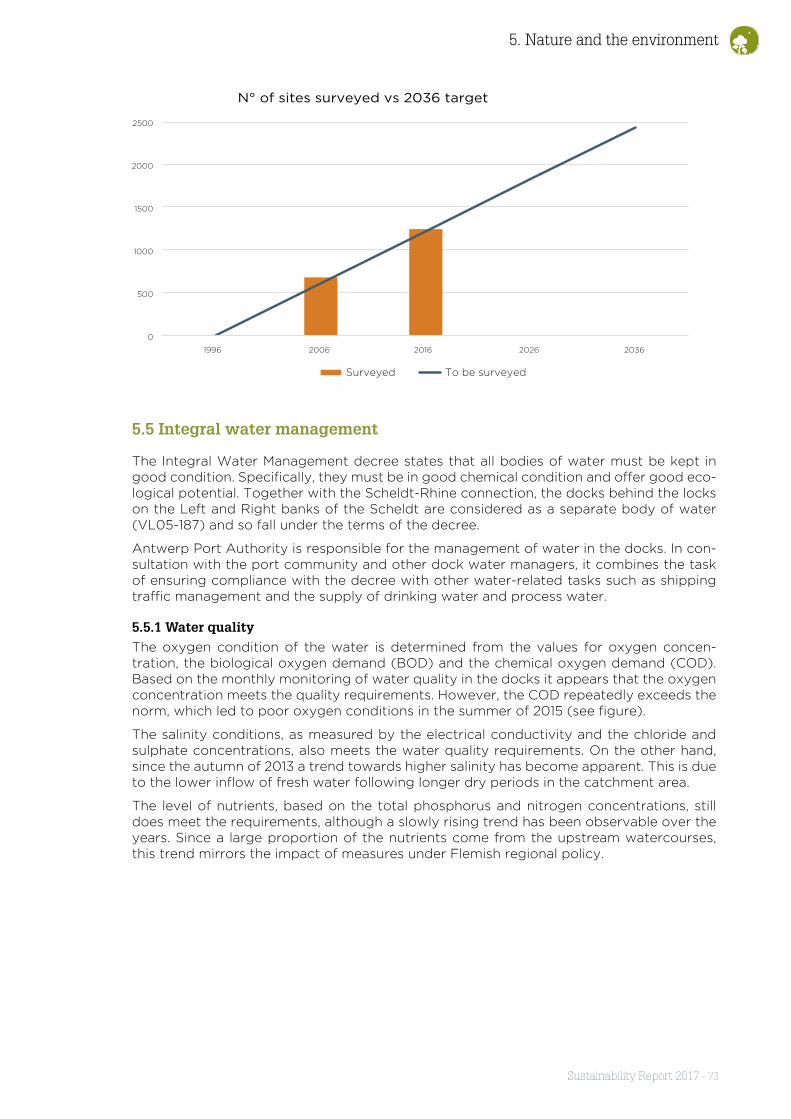
Sustainability Report 2017 - 73
5. Nature and the environment
5.5 Integral water management
The Integral Water Management decree states that all bodies of water must be kept in good condition. Specifically, they must be in good chemical condition and offer good eco-logical potential. Together with the Scheldt-Rhine connection, the docks behind the locks on the Left and Right banks of the Scheldt are considered as a separate body of water (VL05-187) and so fall under the terms of the decree.
Antwerp Port Authority is responsible for the management of water in the docks. In con-sultation with the port community and other dock water managers, it combines the task of ensuring compliance with the decree with other water-related tasks such as shipping traffic management and the supply of drinking water and process water.
5.5.1 Water qualityThe oxygen condition of the water is determined from the values for oxygen concen-tration, the biological oxygen demand (BOD) and the chemical oxygen demand (COD). Based on the monthly monitoring of water quality in the docks it appears that the oxygen concentration meets the quality requirements. However, the COD repeatedly exceeds the norm, which led to poor oxygen conditions in the summer of 2015 (see figure).
The salinity conditions, as measured by the electrical conductivity and the chloride and sulphate concentrations, also meets the water quality requirements. On the other hand, since the autumn of 2013 a trend towards higher salinity has become apparent. This is due to the lower inflow of fresh water following longer dry periods in the catchment area.
The level of nutrients, based on the total phosphorus and nitrogen concentrations, still does meet the requirements, although a slowly rising trend has been observable over the years. Since a large proportion of the nutrients come from the upstream watercourses, this trend mirrors the impact of measures under Flemish regional policy.

5. Nature and the environment
74 - Sustainability Report 2017
Fig. 5.6: Water quality in the Antwerp docks. The values were measured at three locations and compared with the norms laid down by the decree. For the oxygen budget, the average of this ratio was taken for the parameters oxygen concentration, biological oxygen demand (BOD) and chemical oxygen demand (COD). For the nutrients, the criteria used were the presence of nitrogen and phosphorus. For the salt content, the parameters were the electrical conductivity and the concentrations of chloride and sulphate (source: Antwerp Port Authority)
The chemical water quality is based on the list of priority substances laid down in the EU’s Water Framework Directive.
Since 2011 the emphasis has been placed on measuring the concentration of substances that have given problems in the past and for which there are possible emission sourc-es within the port area. Until 2015 the number of substances which exceeded the norm was limited. As of 2016 the water quality norms were made stricter, with consequent excess levels being found for lead and the polyaromatic hydrocarbons benzo(a)pyrene, benzo(ghi)perlene, benzo(b)fluoranthene, benzo(k)fluoranthene, fluoranthene and inde-no(1,2,3-cd)pyrene. Based on the one-out/all-out principle, the chemical condition was therefore assessed as “bad.” For the most important sources we refer to the 2016 water emissions inventory.
Fig. 5.7: Fig. Number of priority substances that exceed or do not exceed the water quality norm. Substances for which no problems were found in 2012 and for which there are no discharge points known within the port were not measured. As of 2016 changes have been made to some of the norms (source: Antwerp Port Authority)
P P P P

Sustainability Report 2017 - 75
5. Nature and the environment
5.5.2 Emissions into the waterIn 2013 an inventory was drawn up for the first time for emissions of metals and polyaro-matic hydrocarbons from diffuse port-specific sources, diffuse non-port-specific sources and point sources, on the basis of data from the year 2010. This inventory was repeated with the help of the Weiss emissions inventory program (Port Authority - VMM - VITO) based on data for the year 2016.
The presence of metals and PACs in the surface water is only partly ascribable to activities in the port area. For lead and mercury the main source is atmospheric deposition, and the same applies to other metals. Zinc mainly comes from anodes used in hydraulic engineer-ing structures and shipping. Hull coatings on seagoing ships are an important source of copper. The PACs, including those for which excess levels were measured in the water, largely come from atmospheric deposition. However the hull coatings of barges are an-other major source. Oil spills are another important source of certain PACs, although the substances concerned do not actually exceed the norm in the water column.
ArsenicC admiumChromium Cobalt Copper Mercury Lead Nickel ZincAtmospheric deposition 44% 36% 36% 26% 13% 96% 51%3 4% 3%
16%0 %5 %0 %0 %1 4% 31%2 %0% 1% 1% 65% 0% 1% 4% 1% 2%
Industry 39% 24% 5% 9% 1% 2% 9% 24% 3%33% 22% 2% 9% 0% 2% 9% 19%3 %
Other industry 6% 2% 1% 0% 0% 0% 2% 0%
corrosion of outer skins of buildings 0% 13%4 %
corrosion of pipework 9% 2% 4% 1% 0%Infrastructure - hydraulic engineering structures 38% 65%Infrastructure - hydraulic engineering structures 1% 0% 43%0 %0 %0 %9 %0 %Transport - road transport - brake wear 0% 0% 0% 0% 4% 0% 4% 0% 0%Transport - seagoing ships - anodes 0% 0% 0% 0% 0% 0% 0% 0% 19%Transport - seagoing ships - coatings 0% 0% 0% 0% 79% 0% 0% 0% 0%Final total in kg. 98 46 1701 1 44339 528 505 36348
Table: Relative importance of emission sources of heavy metals in the Antwerp port area (2016) (empty cells indi-cate that no emissions are expected for the source concerned; sources which did not make a contribution of 3% or more for any particular substance concerned were not included) (source: VMM and Antwerp Port Authority)
Ace
nap
hthe
ne
Ace
nap
hthy
lene
Ant
hrac
ene
Ben
zo(a
)ant
hrac
ene
Ben
zo(a
)pyr
ene
Ben
zo(g
,h,i)
per
lene
Chr
ysen
e
Dib
enzo
(a,h
)ant
hrac
ene
Phe
nant
hren
e
Flu
ora
nthe
ne
Flu
ore
ne
Ind
eno
l(1,
2,3-
cd)p
yren
e
Nap
htha
lene
Pyr
ene
Atmospheric deposition 70% 61% 51%5 7% 60% 40% 14%
Industry - chemicals - polluting chemical base product 0% 0% 0% 1% 2% 2% 0% 0% 0% 2% 0% 1% 0% 3%
Infrastructure - hydraulic engineering - corrosion 4% 4% 13% 2% 0% 0% 0% 0% 2% 0% 17% 0% 12%0 %2 4% 3%
Infrastructure - hydraulic engineering - maintenance 2% 2% 2% 1% 0% 0% 0% 0% 0% 0% 2% 0% 2% 0% 1% 1%
Transport - barge - bilge water 2% 2% 2% 2% 1%
Transport - barge - coatings 9% 9% 19%5 8% 20% 14% 10% 12% 17% 78%5 %6 %9 % 53% 14%1 7%
Transport - shipping - oil spills 73% 75% 56% 19% 3% 0% 0% 0% 4% 2% 56% 12% 61%0 %3 7% 21%
Transport - rail 8% 8% 6% 2% 0% 0% 0% 1% 0% 0% 6% 1% 6% 0% 4% 2%
Transport - road - tyre wear 0% 0% 0% 0% 0% 20% 27%2 5% 65% 17% 5% 15% 1% 3% 1% 35%
Transport - road - engine oil leaks 0% 0% 4% 17% 2% 2% 9% 4% 10% 1% 7% 3% 5% 2% 1% 16%
Final total in kg 5,3 5,6 2,1 0,9 2,4 3,6 3,0 1,6 1,80 ,6 10,7 7,0 5,8 3,6 22,6 3,0
Table: Relative importance of emission sources of heavy metals in the Antwerp port area (2010) (empty cells indicate that no emissions are expected for the source concerned; sources which did not make a contribution of 3% or more for any particular substance were not included) (source: VMM and Antwerp Port Authority)
5.5.3 Water consumptionWater in the port area is either supplied by the water utilities (Water-Link in Antwerp, or the Dutch company Evides Waterbedrijf) or obtained directly by the port companies (from surface, ground or rain water). With the exception of peaks in 2008 and 2011 there has been a downward trend in water consumption. This is due to lower consumption of cooling water, which accounts for around 96% of total water consumption. The cooling water is taken from the docks or from the Scheldt and then pumped back. The remaining water consumption is mostly mains water, largely drawn from surface water by the com-panies that supply it. The big drop in cooling water consumption in 2015 was due to the Doel 1 nuclear reactor being shut down.

5. Nature and the environment
76 - Sustainability Report 2017
Fig. 5.8: Total surface and mains water consumption by companies in the Antwerp port area. Nearly all the sur-face water is used as cooling water (source: VMM)
Fig. 5.9: Mains, ground, rain and other water consumption by companies in the Antwerp port area. “Other water consumption” is mains water supplied from the Netherlands and water produced by Induss (source: VMM)
P
P

5. Nature and the environment
Drinking water consumption by barges
Since 16 March 2015 barge operators must pay for deliveries of drinking water and for offtake of drinking water from fixed supply points, for amounts of more than 6 m�. Previously, all sup-plies of drinking water for barge operators were free of charge. The price charged for water is 3.55 euros/m� for amounts of 7 m� or more. The payment threshold is being reduced by one cubic metre per year, so that each year less drinking water is free of charge. As of 2021 all drinking water for barges must be paid for. The introduction of the payment system has led to a clear reduction in drinking water consumption.
5.6 Air
5.6.1 Sulphur dioxide Emissions of SO2 in the port fell rapidly until 2014, then in 2015 they rose again. This was mainly due to an increase in emissions by the “Refineries” sector (up 1.7 ktonne), only partly offset by a fall in the “Traffic” sector (down 0.2 ktonne). But despite this relatively large upsurge in 2014, the level of SO2 emissions was still less than a third of what they were in 2000.
The further decline in SO2 emissions by the “Seagoing ships and barges” sector is largely the result of a tightening of the standards for the sulphur content of ship fuels on the North Sea and the Scheldt (SECA area) from 1.0 to 0.1% as of 1 January 2015.
Fig. 5.10: Estimated emissions of sulphur oxides (SOx) by the different sectors in the Antwerp port area (source: VMM)

5. Nature and the environment
78 - Sustainability Report 2017
The SO2 concentrations measured in the air show a downward trend that is just as spec-tacular as for emissions. In the past few years the measured SO2 concentration has re-mained stable.
Fig. 5.11: SO2 annual average for the Antwerp port area and Flanders (source: VMM)
The rise in emissions in 2015 is not reflected in the immissions graph (above) or in the air quality maps (below) showing the SO
2 concentrations in the air within the Antwerp port
area over the years 2000 - 2010 - 2013 - 2016. These graphs are still drawn up on the basis of the emissions inventory for the year X-2. The map for the year X=2106 is therefore based on the emissions inventory for 2014.
From the modelling it can be seen that the values are well below the European threshold for SO2 (20µg/m3), a value that was set to protect vegetation in nature conservation areas. The annual average for SO
2 fell further in 2016 compared with previous years, amounting to
only a third of the concentrations measured in 2000. In fact concentrations were nowhere calculated to be higher than 10µg/m3�.
Annual average SO2 concentration in the Antwerp agglomeration in 2000 (VLOPS)

Sustainability Report 2017 - 79
5. Nature and the environment
Annual average SO2 concentration in the Antwerp agglomeration in 2010 (VLOPS)

5. Nature and the environment
80 - Sustainability Report 2017
Fig. 5.12: Annual average SO2 concentration in the port of Antwerp in 2000, 2004, 2010, 2013 and 2016 (source: VMM)
5.6.2 Nitrogen oxides The NOx emissions have trended downwards since 2005, but a rise was seen again in 2015. The “Industry” and “Energy” sectors were each responsible for an increase in NOx emissions of around 0.5 ktonne, while the “Commerce & services” sector accounted for an additional 0.1 ktonne.
All sectors together emitted some 1.2 ktonne more NOx compared with 2014, although this is still 22% less than in 2000.
The increase in the production index is not a sufficient explanation for this rise: as can be seen from the graphic below, the ratio of (a) NOx emitted by industry to (b) the production index fell to a minimum between 2010 and 2014, and rose again in 2015. This increase was restricted to a small number of industrial companies, who have given a plausible (but confidential) explanation to VMM (Flemish Environmental Company). It should also be noted that NOx emissions by the same companies in 2014 were abnormally low, so that in 2015 they actually returned to the “business as usual” level of 2013.
SO2 sampling points 2016 (colour = concentration measured)
Port of Antwerp
Boroughs
SO2 annual average calculated using the VLOPS model (µg/m3)

Sustainability Report 2017 - 81
5. Nature and the environment
Fig. 5.13: Estimated emissions of nitrogen oxides (NOx) by the different sectors in the Antwerp port area (source: VMM)
The fall in emissions between 2000 and 2015 is also reflected in a decline in NO2 concen-trations between these years, as can be seen in the graphic below. However, the fall in NO2 concentration is only 18%. This is due to among other things the long distances over which NOx pollution travels, so that local decreases can be negatively offset by increased pollution from beyond the national borders.
Fig. 5.14: NO2 concentration, annual average for the Antwerp port area and Flanders (source: VMM)
The increase in emissions in 2015 is not yet reflected in the graph of immissions (above), and also not yet in the air quality maps (below). These graphs are still drawn up on the basis of the emissions inventory for the year X-2. The map for the year X=2106 is therefore based on the emissions inventory for 2014.
The maps below show the development of NO2 concentrations in the air in the Antwerp port area over the years 2000 - 2010 - 2013 - 2016. The maps from 2013 onwards have greater resolution, as in this year VMM switched from modelling with VLOPS to a combi-nation of the RIO and IFDM models.

5. Nature and the environment
82 - Sustainability Report 2017
In 2016 the annual limit value of 40 µg/m� was not exceeded at any of the sampling points, but it was exceeded in and around the corridors around the Antwerp ring road and motor-ways, and at the road intersection beside the Canal dock B1 - Churchill dock/6th Harbour dock. In comparison with the previous years, we can make the following observations:
• � There is a decrease in NO2 concentrations on the ring road and motorways• � There is an expansion of the patches within the port area that only just come within
the norm (36 à 40 µg/m�): mainly around the Delwaide dock, the “Petroleum island” (Marshall dock and surrounding area), Waasland canal and Deurganck dock.
Both these observations can be explained as follows:
• � The decrease in NO2 immissions from traffic is thanks to the gradual phasing out of older vehicles
• � The increase in NO2 immissions in the port is due to the more accurate geograph-ical situation of emissions from shipping, thanks to the latest version of the EMMOSS shipping emissions model
Annual average NO2 concentration in the Antwerp agglomeration in 2000 (VLOPS)

Sustainability Report 2017 - 83
5. Nature and the environment
Annual average NO2 concentration in the Antwerp agglomeration in 2010 (VLOPS)
BoroughsPort of Antwerp
NOx measurement stations
The values modelled can vary locally from the real situation due to uncertainties both in the RIO-IFDM model and in the emission values used, and due to allowance not being made for the topography and obstacles along the roads. In street canyons the mo-del may underestimate the concentrations.
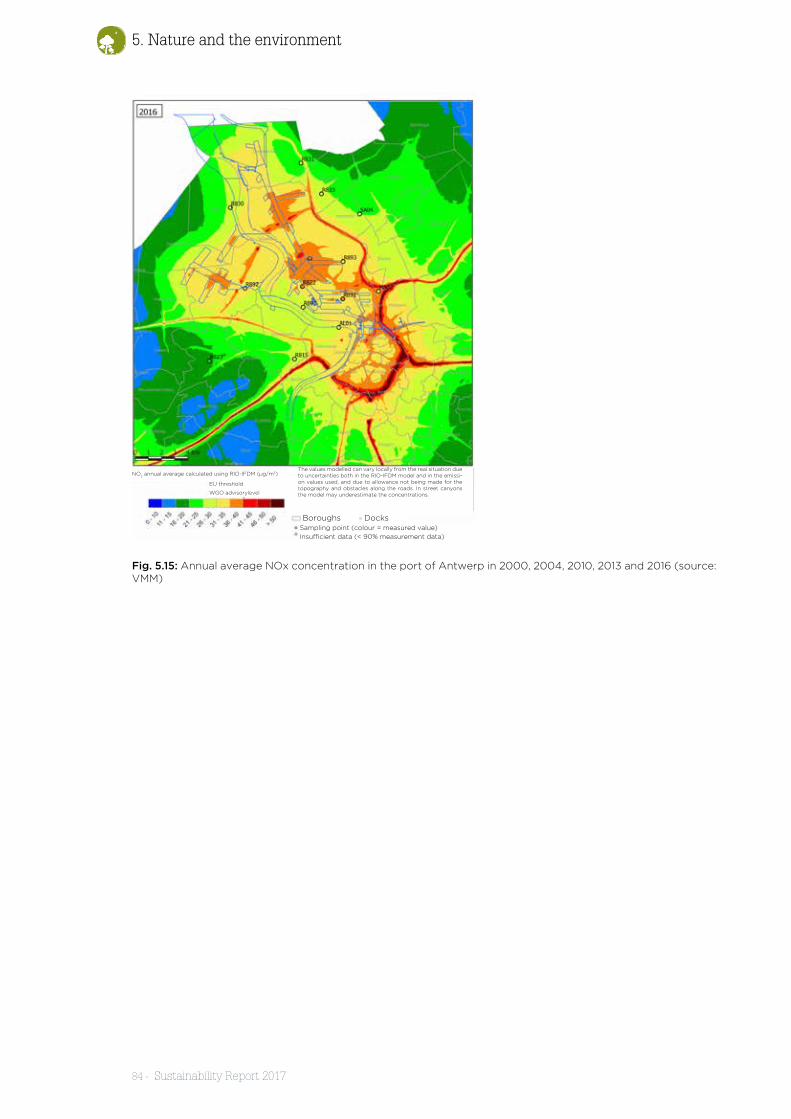
5. Nature and the environment
84 - Sustainability Report 2017
Fig. 5.15: Annual average NOx concentration in the port of Antwerp in 2000, 2004, 2010, 2013 and 2016 (source: VMM)
EU threshold
WGO advisorylevel
Boroughs
The values modelled can vary locally from the real situation due to uncertainties both in the RIO-IFDM model and in the emissi-on values used, and due to allowance not being made for the topography and obstacles along the roads. In street canyons the model may underestimate the concentrations.
NO2 annual average calculated using RIO-IFDM (µg/m3)
DocksSampling point (colour = measured value)
Insufficient data (< 90% measurement data)

Sustainability Report 2017 - 85
5. Nature and the environment
5.6.3 Particulates Emissions of particulates fell steeply in the period 2000-2014, thanks mainly to the efforts by re-fineries. In the “Industry” sector, however, there was an increase in PM10 emissions which was not entirely offset by decreases in the other sectors, so that total emissions of particulars increased slightly in 2015 (up 1%).
The increase in the production index is not a sufficient explanation for this: as can be seen from the graphic below, the ratio of (a) PM10 emitted by industry to (b) the production index rose to a maximum in 2010, then began to fall, but rose again in 2015 This increase was restricted to a small number of industrial companies, who have given a plausible (but confidential) explanation to VMM (Flemish Environmental Company).
Fig. 5.16: Estimated emissions of particulates (PM10) by the different sectors in the Antwerp port area (source: VMM)
The average PM10 concentration has steadily declined since the peak year of 2006 and now lies well below the annual average norm of 40µg/m3, as can be seen from the graph below. A general downward trend is apparent, with the exception of the year 2011 which was characterised by very unfavourable meteorological conditions. In 2013 for the first time ever the daily norm of 50µ/m3 was not exceeded for more than the maximum per-mitted number of days.
Fig. 5.17: PM10 annual average for the Antwerp port area and Flanders (source: VMM)

5. Nature and the environment
86 - Sustainability Report 2017
The increase in emissions in 2015 is not yet reflected in the graph of immissions (above), and also not yet in the air quality maps (below). These graphs are still drawn up on the basis of the emissions inventory for the year X-2. The map for the year X=2106 is therefore based on the emissions inventory for 2014.
The air quality maps therefore show a positive trend in terms of PM10 emissions. The maps below show the development of PM10 concentrations in the air in the Antwerp port area over the years 2005 - 2010 - 2013 - 2016. The maps from 2013 onwards have greater res-olution, as in this year VMM switched from modelling with the RIO interpolation model to a combination of the RIO and IFDM air quality models.
Annual average PM10 concentration in 2005 (RIO-CORINE)

Sustainability Report 2017 - 87
5. Nature and the environment
Annual average PM10 concentration in 2010 (RIO-CORINE)
Annual average PM10 concentration in the Antwerp agglomeration in 2013 (RIO+IFDM)
Figuur: Annual average PM10 concentration in the port of Anwerp in 2005, 2010 and 2013
Port of Antwerp Boroughs PM10 sampling points
The values modelled can vary locally from the real situation due to uncertainties both in the RIO-IFDM model and in the emission values used, and due to allowance not being made for the topography and obstacles along the roads. In street canyons the model may underestimate the concentrations.
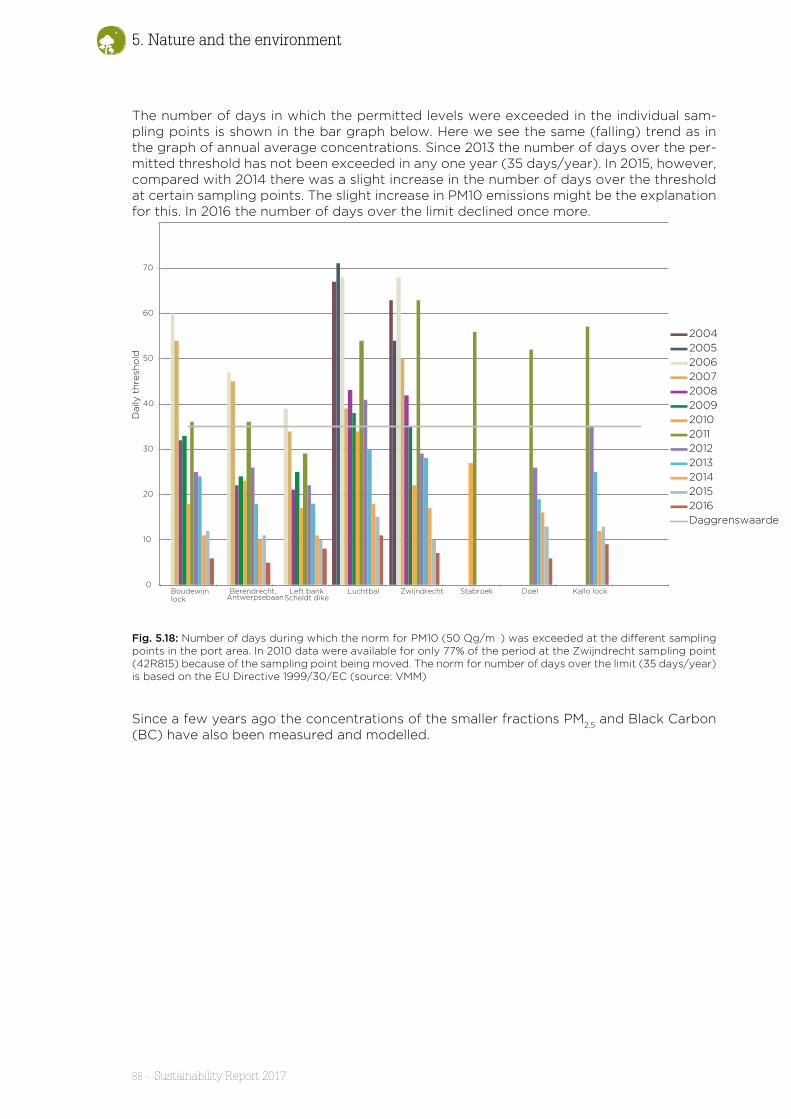
5. Nature and the environment
88 - Sustainability Report 2017
The number of days in which the permitted levels were exceeded in the individual sam-pling points is shown in the bar graph below. Here we see the same (falling) trend as in the graph of annual average concentrations. Since 2013 the number of days over the per-mitted threshold has not been exceeded in any one year (35 days/year). In 2015, however, compared with 2014 there was a slight increase in the number of days over the threshold at certain sampling points. The slight increase in PM10 emissions might be the explanation for this. In 2016 the number of days over the limit declined once more.
Fig. 5.18: Number of days during which the norm for PM10 (50 µg/m�) was exceeded at the different sampling points in the port area. In 2010 data were available for only 77% of the period at the Zwijndrecht sampling point (42R815) because of the sampling point being moved. The norm for number of days over the limit (35 days/year) is based on the EU Directive 1999/30/EC (source: VMM)
Since a few years ago the concentrations of the smaller fractions PM2,5
and Black Carbon (BC) have also been measured and modelled.

Sustainability Report 2017 - 89
5. Nature and the environment
Annual average PM2.5 concentration in 2010 (RIO-CORINE)
Port of Antwerp Boroughs PM2.5 sampling points
The values modelled can vary locally from the real situation due to uncertainties both in the RIO-IFDM model and in the emission values used, and due to allowance not being made for the topography and obstacles along the roads. In street canyons the model may underestimate the concentrations.
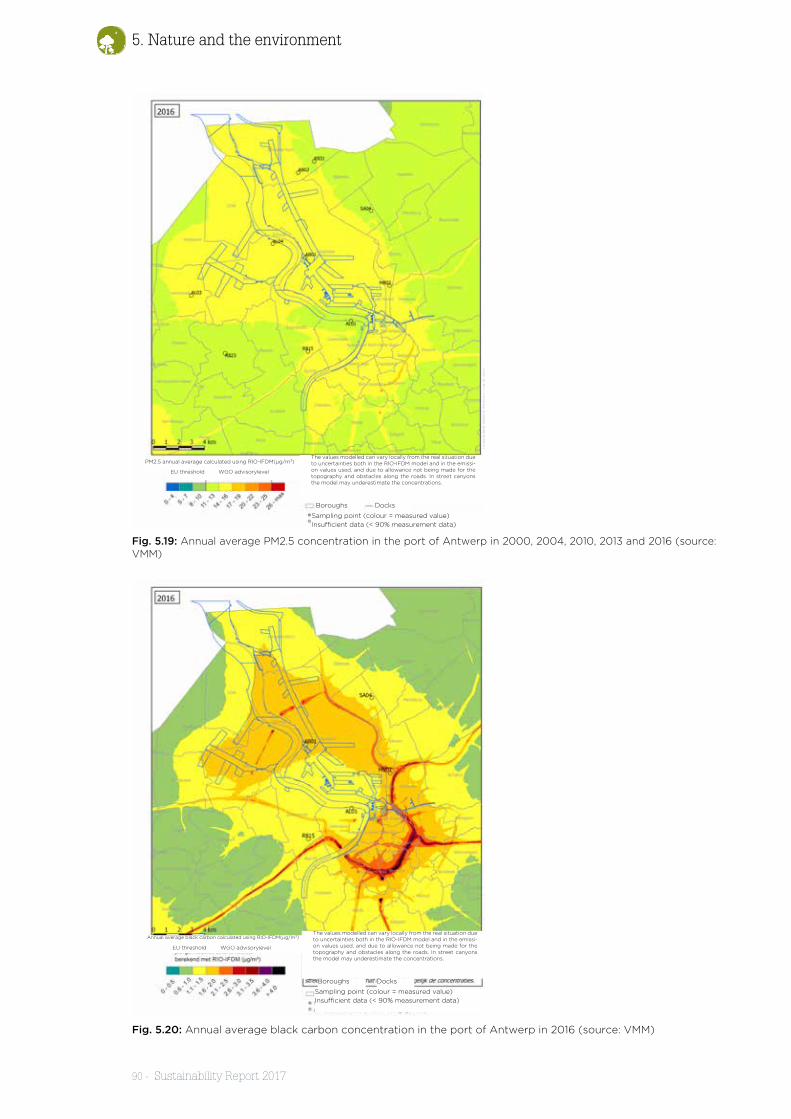
5. Nature and the environment
90 - Sustainability Report 2017
Fig. 5.19: Annual average PM2.5 concentration in the port of Antwerp in 2000, 2004, 2010, 2013 and 2016 (source: VMM)
Fig. 5.20: Annual average black carbon concentration in the port of Antwerp in 2016 (source: VMM)
EU threshold WGO advisorylevel
Boroughs
The values modelled can vary locally from the real situation due to uncertainties both in the RIO-IFDM model and in the emissi-on values used, and due to allowance not being made for the topography and obstacles along the roads. In street canyons the model may underestimate the concentrations.
PM2.5 annual average calculated using RIO-IFDM(µg/m3)
Docks
Sampling point (colour = measured value)
Insufficient data (< 90% measurement data)
EU threshold WGO advisorylevel
Boroughs
The values modelled can vary locally from the real situation due to uncertainties both in the RIO-IFDM model and in the emissi-on values used, and due to allowance not being made for the topography and obstacles along the roads. In street canyons the model may underestimate the concentrations.
Annual average black carbon calculated using RIO-IFDM(µg/m3)
Docks
Sampling point (colour = measured value)
Insufficient data (< 90% measurement data)

Sustainability Report 2017 - 91
5. Nature and the environment
5.7 Noise level map
As required by the EU 2002 directive, Antwerp Port Authority carries out a survey of noise levels in the port area. As part of this process, in 2013 the Port Authority developed a noise level map and a dynamic noise model in order to form a picture of noise levels throughout the port area. These measurement techniques can also be used by other services, for in-stance to calculate the noise levels for different port development scenarios.
Around 45,000 local residents were exposed to noise in 2013, of whom just under 20,000 were exposed to a level > 55dB(A). The noise level map is being updated in 2017, taking 2016 as the reference year. As soon as it is available it will be published on the website www.duurzamehavenvanantwerpen.be.
• Industry: Lday
- Levening
- Lnight
- Lden
:
• � Roadways: Lday
- Levening
- Lnight
- Lden
:
• � Railways: Lday
- Levening
- Lnight
- Lden
:
• � Map totals: Lday
- Levening
- Lnight
- Lden
:
Fig. 5.21: Noise level map 2013, average level Lden (source: Antwerp Port Authority)
5.8 Nature conservation
The Antwerp port area is one of the most important habitats for threatened European species. Large parts of it are classified as Special Protection Zones under the EU Bird and Habitat directives (Natura 2000). In 2000 the Port Authority signed a charter with Natuurpunt (nature conservation society) aimed at developing a network of ecological infrastructure within the port area. This network of core areas, wildlife corridors and “step-ping stones” will assure the long-term conservation of no fewer than 90 threatened spe-cies of plant and animal. The objective is to set aside 5% of the Antwerp seaport area for the development of this network. In order to protect the fauna and flora without interfer-

5. Nature and the environment
92 - Sustainability Report 2017
ing with the development and operation of the port, a Port of Antwerp Species Protection Plan (SPP) was introduced in 2014. This focuses on the long-term conservation of 14 pro-tected species (key species) in the port area, more specifically in the areas that form part of the ecological infrastructure network.
5.8.1 BiodiversityCorrect conservation and management of the Special Protection Zones (SPZs) that par-tially or wholly overlap the port area is measured against the lower limit of the conserva-tion objectives for the Left and Right banks of the Scheldt.
From the graphic below it can be seen that the number of species is increasing year by year, albeit very slowly. This slow progress (or lack of it in some years, on the Right bank) is associated with the availability (or lack) of suitable habitat for the species concerned.
We therefore compare (a) the degree of correct management achieved with (b) the pro-gress towards creating the core nature conservation areas. The close relationship be-tween the two can be seen from the graphics. From this we can deduce that in addition to the degree of development of the existing core nature conservation areas, the creation of new such core areas plays an important role in whether or not the conservation objectives can be attained.
Fig. 5.22: Number of target species (total of 21 for which Conservation Objectives have been set) with respect to the lower limit (= 100%) for the Conservation Objective on the Left bank (source: Antwerp Port Authority)
P P
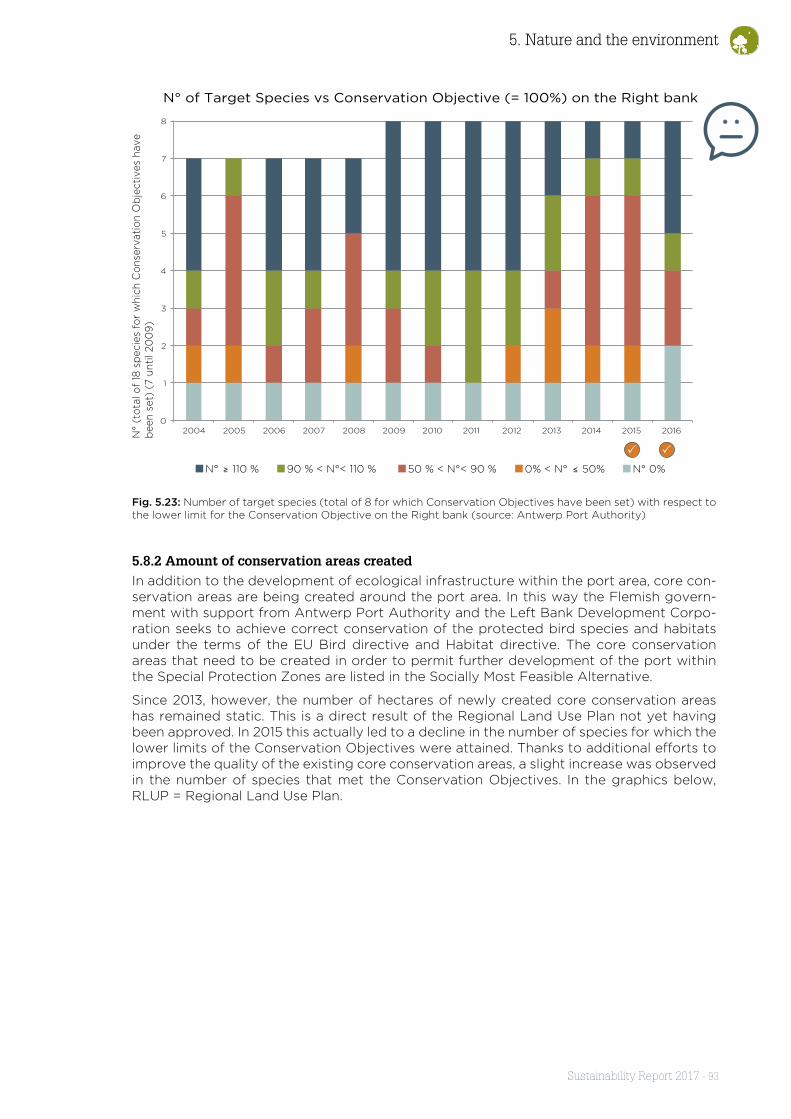
Sustainability Report 2017 - 93
5. Nature and the environment
Fig. 5.23: Number of target species (total of 8 for which Conservation Objectives have been set) with respect to the lower limit for the Conservation Objective on the Right bank (source: Antwerp Port Authority)
5.8.2 Amount of conservation areas createdIn addition to the development of ecological infrastructure within the port area, core con-servation areas are being created around the port area. In this way the Flemish govern-ment with support from Antwerp Port Authority and the Left Bank Development Corpo-ration seeks to achieve correct conservation of the protected bird species and habitats under the terms of the EU Bird directive and Habitat directive. The core conservation areas that need to be created in order to permit further development of the port within the Special Protection Zones are listed in the Socially Most Feasible Alternative.
Since 2013, however, the number of hectares of newly created core conservation areas has remained static. This is a direct result of the Regional Land Use Plan not yet having been approved. In 2015 this actually led to a decline in the number of species for which the lower limits of the Conservation Objectives were attained. Thanks to additional efforts to improve the quality of the existing core conservation areas, a slight increase was observed in the number of species that met the Conservation Objectives. In the graphics below, RLUP = Regional Land Use Plan.
P P

5. Nature and the environment
94 - Sustainability Report 2017
Fig. 5.24: State of conservation of bird species versus hectares of conservation area on the Left bank. The degree of conservation of bird species is the average percentage and standard deviation of the N° of birds counted, set against the lower limit of the Conservation Objective for each species (source: INBO)
Fig. 5.25: State of conservation of bird species versus hectares of conservation area on the Right bank. The de-gree of conservation of bird species is the average percentage and standard deviation of the N° of birds counted, set against the lower limit of the Conservation Objective for each species (source: INBO)
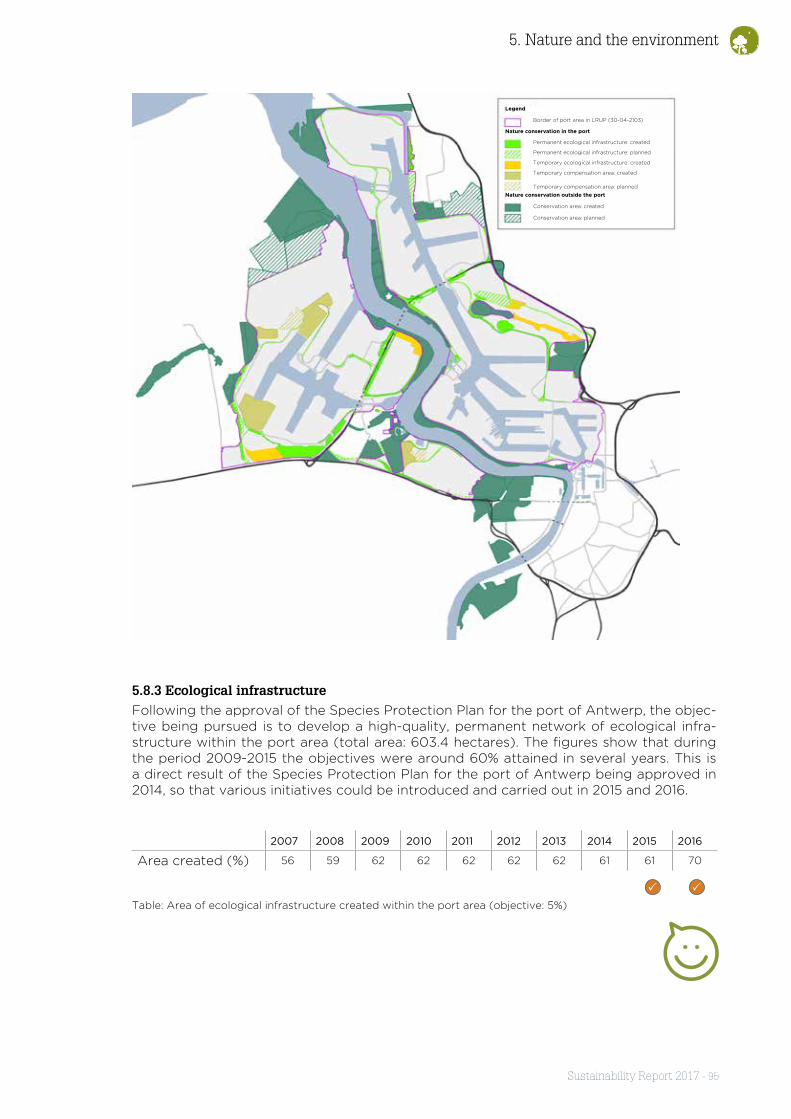
Sustainability Report 2017 - 95
5. Nature and the environment
5.8.3 Ecological infrastructureFollowing the approval of the Species Protection Plan for the port of Antwerp, the objec-tive being pursued is to develop a high-quality, permanent network of ecological infra-structure within the port area (total area: 603.4 hectares). The figures show that during the period 2009-2015 the objectives were around 60% attained in several years. This is a direct result of the Species Protection Plan for the port of Antwerp being approved in 2014, so that various initiatives could be introduced and carried out in 2015 and 2016.
2007 2008 2009 2010 2011 2012 2013 2014 2015 2016
Area created (%) 56 59 62 62 62 62 62 61 61 70
Table: Area of ecological infrastructure created within the port area (objective: 5%)
Border of port area in LRUP (30-04-2103)
Permanent ecological infrastructure: created
Permanent ecological infrastructure: planned
Temporary ecological infrastructure: created
Temporary compensation area: created
Temporary compensation area: planned
Conservation area: created
Conservation area: planned
Nature conservation in the port
Legend
Nature conservation outside the port
P P

5. Nature and the environment
96 - Sustainability Report 2017
Voor 2015 (kwartaal 2 t.e.m. kwartaal 1 2016) en 2016 (kwartaal 2 t.e.m. kwartaal 1 2017) vindt u de score per deelgebied. Bij de opmaak van de kaart worden de wegen met een slechte score (< 70 punten) in rood aangeduid. Indien deze slecht scorende wegen re-current terugkeren, bekijkt het Havenbedrijf samen met de stakeholders (o.a. omliggende bedrijven) welke acties kunnen genomen worden.
Kerncentrale Doel
Mol
enwe
g
Vitshoekstraat
Polderdijkweg
Blikk
en
Geslec
ht
Kruipin
Land
van
Waa
slaan
Sint-Jansweg
Keteldijk
Laageind
Churchilldok
Chemisch eiland Noord
Waaslandhaven Noord
Waaslandhaven Zuid
Delwaidedok
Chemisch eiland Zuid
Logistiek park Schijns
Oosterweeleiland
Industriezone Zwijndrecht
Luithagen
2e-3e Havendok
Logistiek park Waasland
netheidsindex 2015
Uitgave: 01-06-2016´ 315069
0 1.100 2.200550m© GHA - Bron: havenGIS
Legendewegen met score mindern dan 70
netheidsindex_kaart_masterplan GEM 2015
2de 3de havendok 81,1
Chemisch eiland Noord (incl. Scheldeterminals) 85,5
Chemisch eiland Zuid 81,5
Churchilldok 81,0
Delwaidedok 80,2
Industriezone Zwijndrecht 80,3
Logistiek Park Schijns 86,4
Luithagen 79,9
Logistiek park Waasland 84,5
Oosterweeleiland 80,5
Waaslandhaven Noord + Deurganckdok 72,6
Waaslandhaven Zuid 75,1
Kerncentrale Doel 98,8
onderverdeling score
> 80 ptn 70 - 80 ptn
< 70 ptn
Haen
dorp
weg
Natiestraat
Antwerpsebaan
Sint-Antoniusweg
Schoorhavenweg
Keteldijk
Laageind
BoereveldsewegVitshoekstraat
Heizegemweg
Nieuwe weg
Ketenislaan
Muisbroeklaan
Goteborgweg
Noorderlaan-Rostockweg
Antwerpsebaan
Chemisch eiland Noord
Churchilldok
Waaslandhaven Zuid
Deurganckdok
Delwaidedok
Waaslandhaven Noord
Chemisch eiland Zuid
Logistiek park Schijns
Oosterweeleiland
Industriezone Zwijndrecht
Luithagen
2e-3e Havendok
Logistiek park Waasland
Kerncentrale
Netheidsindex2016: Q2, Q3, Q4 - 2017: Q1
Uitgave: 22-06-2017´ 319313
0 1.200 2.400600m© 2017 Port of Antwerp
Legendewegstroken met score < 70
onderverdeling score
< 70
70 - 80
>= 80
2016: Q2, Q3, Q4 2017: Q1
Luithagen 85,582e-3e Havendok 88,54Oosterweeleiland 81,66Churchilldok 85,73Logistiek park Schijns 90,51Delwaidedok 84,08Chemisch eiland Noord 91,58Chemisch eiland Zuid 88,81Industriezone Zwijndrecht 85,93Logistiek park Waasland 89,45Waaslandhaven Zuid 86,23Waaslandhaven Noord 82,79Deurganckdok 86,81Kerncentrale 98,89
Fig. 5.26: Jaargemiddelde Netheidsindex 2015 (kwartaal 2 t.e.m. kwartaal 1 2016) en 2016 (kwartaal 2 t.e.m. kwar-
taal 1 2017)(bron: Havenbedrijf Antwerpen)

Sustainability Report 2017 - 97
5. Nature and the environment

5. Nature and the environment
98 - Sustainability Report 2017
ENERGY AND CLIMATE

Sustainability Report 2017 - 99
6. Energy and climate
Energy and climate
The Sustainable Development Goals for energy and climate set by the United Nations and the Paris Agreement (COP21) are all relevant to the port of Antwerp. They are relevant not only because Antwerp positions itself as a sustainable port, but also because all parties to the agreement (including Belgium) are obliged to prepare “Nationally Determined Contri-butions” and to take the necessary measures to implement them. The binding, worldwide, ambitious character of these objectives and their transposition into Flemish climate policy make it more necessary than ever to consider how the port of Antwerp can maintain and even intensify its competitive position in regard to energy and climate.
Although international transport by sea is specifically excluded from the Paris Agreement, we as a “port landlord” have the moral duty to take action with and on behalf of the ship-ping industry. There are many examples, all of which have climate implications as well as effects on air quality. These include initiatives on the use of scrubbers, onshore power sup-plies for barges, making future terminals and the Deurganck dock West and South-East onshore-power-ready, efforts to promote the use of LNG, etc.
6.1 Energy consumption
During the period 2008-2015 the total energy consumption fluctuated around 250 PJ per year. Since 2011 the trend seems to have reversed and we have seen a fall in energy con-sumption, which in turn reflects the many energy-saving measures that have been taken within the port area. In the year 2015 there was an increase in energy consumption com-pared with the previous year, due paradoxically to greater consumption for energy pro-duction. However, the fall in energy consumption by manufacturing industry is ongoing. All these sectors consume less energy while their energy output is rising. This clearly demonstrates that energy consumption and production have been decoupled and that energy efficiency is rising.
Fig. 6.1: Total energy consumption per sector in the port area. * Data on natural gas consumption for one com-pany in the port are missing for the year 2015 (source: Antwerp Port Authority, based on data from Elia, Fluxys, EANDIS, INFRAX, VITO, Federal Department of the Economy and Federal Department of the Environment)
P P

6. Energy and climate
100 - Sustainability Report 2017
Fig. 6.2: Energy consumption by manufacturing industry, related to the production index (source: Voka). * Data on natural gas consumption for one company in the port are missing for the year 2015.
6.2 Sustainable energy
As regards installed sustainable energy capacity, at the end of October 2016 the situati-on was the same as for 2015. Then at the end of 2016 the “Wind aan de Stroom” project brought the total installed wind power capacity to 122 MWe. As a result we can expect the production of sustainable energy to double in the coming years.
Fig. 6.3: Installed cogeneration capacity along with installed renewable energy capacity. The data for 2016 only run until 31 October (source: VREG). The installed wind power capacity amounted to 122 WMe at the end of 2016 (source: Antwerp Port Authority)
P P
P P

Sustainability Report 2017 - 101
6. Energy and climate
Fig. 6.4: Installed renewable energy capacity. The data for 2016 are still incomplete (up until 31/10/2016) (source: VREG). The installed wind power capacity amounted to 122 MWe at the end of 2016 (source: Antwerp Port Au-thority)
6.3 Greenhouse gas emissions
Absolute CO2 emissions by industry and refineries have fallen steadily since 2012, but in
2015 they were still 8% higher than in 2000.
Since 2011 production has once again become more CO2-efficient (ratio of CO2 emissi-
ons/production index). In 2015 companies were almost 9% more carbon-efficient than in 2000, while in the same period these same companies produced nearly 20% more. This illustrates the efforts made by industry to become more energy efficient.
Fig. 6.5: Energy (primary) and non-energy CO2 emissions by manufacturing industry, based on emission factors and Global Warming Potential as per IPCC 1996 (source: Antwerp Port Authority on the basis of energy con-sumption indicator data: VITO study 2011/TEM/R/56, VMM and Voka). * Data on CO2 emissions from natural gas consumption by companies in the port are missing for the year 2015
During the period 2000-2015, CO2-eq emissions in the Antwerp port area varied around 19,000 ktonnes per year. The downward trend in the carbon footprint was interrupted in 2011, probably because of the economy picking up again after the recession period of 2009-2010. In 2014 the carbon footprint was 7% smaller than in 2000.
P P

6. Energy and climate
102 - Sustainability Report 2017
Fig. 6.6: Emissions of CO2, CH4 and N2O (based on emission factors and Global Warming Potential as per IPCC 1996) by different sectors in the Antwerp port area (source: Antwerp Port Authority on basis of VITO study 2011/TEM/R/56)
Ahlers CO2 Calculator
The Ahlers shipping line has developed its own solution for cal-culating the CO2 emissions of its customers. Actively lowering CO
2 emissions reduces
the environmental impact and has a positive effect on transport costs. The Ahlers CO2
calculator is based on the European CEN-EN16258 standard and so goes further than simply counting up the estimated values. At Ahlers this calculation is looked upon as the first step in making their customers’ transport networks “leaner and greener.” The next step is to use the customer’s logistics data to create a detailed visual model of the transport network. Then, by developing alternative scenarios on the basis of this mo-del, the customer can see what impact certain changes would have on CO
2 emissions.
P P
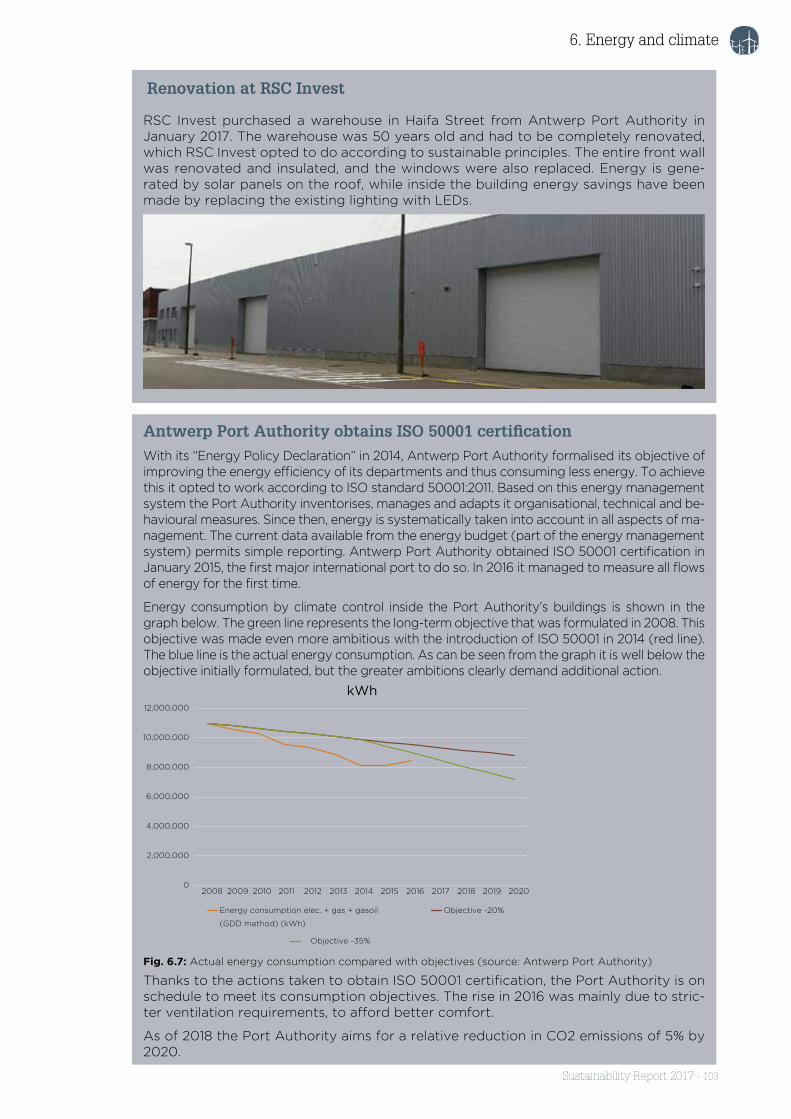
Sustainability Report 2017 - 103
6. Energy and climate
Renovation at RSC Invest
RSC Invest purchased a warehouse in Haifa Street from Antwerp Port Authority in January 2017. The warehouse was 50 years old and had to be completely renovated, which RSC Invest opted to do according to sustainable principles. The entire front wall was renovated and insulated, and the windows were also replaced. Energy is gene-rated by solar panels on the roof, while inside the building energy savings have been made by replacing the existing lighting with LEDs.
Antwerp Port Authority obtains ISO 50001 certificationWith its “Energy Policy Declaration” in 2014, Antwerp Port Authority formalised its objective of improving the energy efficiency of its departments and thus consuming less energy. To achieve this it opted to work according to ISO standard 50001:2011. Based on this energy management system the Port Authority inventorises, manages and adapts it organisational, technical and be-havioural measures. Since then, energy is systematically taken into account in all aspects of ma-nagement. The current data available from the energy budget (part of the energy management system) permits simple reporting. Antwerp Port Authority obtained ISO 50001 certification in January 2015, the first major international port to do so. In 2016 it managed to measure all flows of energy for the first time.
Energy consumption by climate control inside the Port Authority’s buildings is shown in the graph below. The green line represents the long-term objective that was formulated in 2008. This objective was made even more ambitious with the introduction of ISO 50001 in 2014 (red line). The blue line is the actual energy consumption. As can be seen from the graph it is well below the objective initially formulated, but the greater ambitions clearly demand additional action.
Fig. 6.7: Actual energy consumption compared with objectives (source: Antwerp Port Authority)
Thanks to the actions taken to obtain ISO 50001 certification, the Port Authority is on schedule to meet its consumption objectives. The rise in 2016 was mainly due to stric-ter ventilation requirements, to afford better comfort.
As of 2018 the Port Authority aims for a relative reduction in CO2 emissions of 5% by 2020.
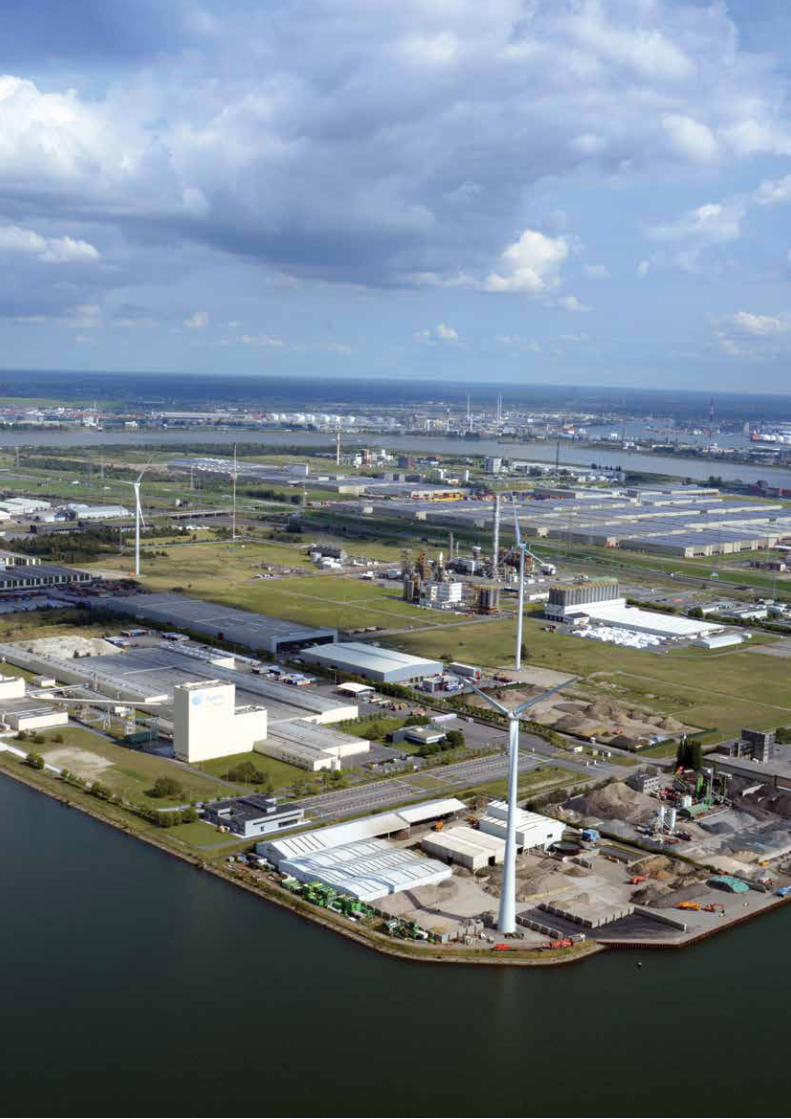
6. Energy and climate
104 - Sustainability Report 2017

Sustainability Report 2017 - 105
6. Energy and climate
RESEARCH AND INNOVATION
7. Research and innovation
106 - Sustainability Report 2017
7. Research and innovation
With technological developments coming along at an ever faster pace in the world in which we live, there is a widening gap between the traditional ways of working and pro-ducing and those brought about by new technological developments. Digitisation, auto-mation, robotisation ... are increasingly being adopted by companies in the port.
These developments are fundamental in order to make the transition to a sustainable economy.
Many industrial companies in the port made additional investments in R&D in 2015. In the petrochemical sector in particular we see a very sharp rise in initiatives towards the circu-lar economy, among others.
However, R&D investments in the maritime cluster continue to fall, despite the major chal-lenges involved in streamlining the supply chain, and also despite the very promising – yet potentially highly disruptive – new challenges that are emerging, such as the blockchain or digital trading platforms.
In 2016 Alfaport-Voka (Chamber of Commerce) helped to organise a hackathon focusing on “Logistics of the future.” For several days computer experts, graphic designers, project managers and students brainstormed on solutions to concrete, port-related problems.
2016 also saw the launch of NxtPort, a data sharing platform aimed at simplifying the exchange of data between the various players in the supply chain. NxtPort, an initiative of the private sector in the port of Antwerp (the industry associations KVBG, ASV, VEA, ABAS and KBRV together with Alfaport-Voka), is a world “first” that will boost the com-petitive position of the port and give it the weapons it needs to become a strong player on the world stage.
Antwerp Capital of Things is a project by the City of Antwerp, Antwerp Port Authority, the University of Antwerp and the Inter-university Micro-Electronics Centre (IMEC), aimed at making the “internet of things” a reality for Antwerp companies, not only in the port but also in the wider region. This will lead to smarter management of the supply chain and will enable logistics process to become more efficient. With the introduction of an Internet of Things postgraduate course in collaboration between the Flemish universities and the de-velopment of Harbour of Things initiatives (such as projects for smart quays and bridges) Antwerp is now in a strong position to implement concrete projects that contribute to-wards an efficient port.
The European Marine Observation and Data Network (EMODnet) is organising its first Open Sea Lab in Antwerp in November 2017. During this three-day bootcamp, coders, de-velopers and data enthusiasts will be challenged to handle the rich flow of maritime data and ocean observations available within EMODnet. At EMODnet Open Sea Lab, experts in maritime data management will team up with experts in digital innovation in order to form ideas for workable applications. During the bootcamp ad-hoc teams will be formed and challenged to come up with ideas and develop prototypes which will then be validated by mentors.
In the meantime there is a sharp rise in investments in research into sustainable energy, leading to “smart wind turbines” as well as research into the possibilities of battery tech-nology and energy recovery for the sea locks in the port.
7.1 R&D investments
Investments in research and development (R&D) rose gradually until 2014, then in 2015 they shot up by more than 100 million euros. As a result they now represent around 5% of overall investment, whereas until 2014 they varied between 0.5 and 1.2%. The sharp rise is a consequence of the economy picking up again, leading to large investments by industry. In addition, the Federal Department of Finance has broadened the definition of R&D so that industrial research is now exempt from withholding tax.
With these investments industry in the port of Antwerp has shown itself to be more viable

Sustainability Report 2017 - 107
7. Research and innovation
than ever. In reality the proportion of R&D investment is even higher, as the total figure does not include expenditure on personnel directly linked to R&D departments, nor does it include R&D investments by establishments outside the port.
Fig. 7.1: R&D investments (source: National Bank of Belgium, working paper 321)
KEY FIGURESRecent investments
• 3M first full scale installation solvent free glues (unique in EU)
• Air Liquide new unit CO & filling station H2
• Arlanxeo expansion butylrubber factory
• BASF installation butadieen & C6H10O & SAP
• Covestro new steam installation
• Eval expansion capacity EVOH
• Evonik new installation methionine
• ExxonMobil new Delayed Coker Unit
• Ferro new facility ftalat-free plasticiser
• FRX Polymers first new commercial factory
• Indaver MediPower for sensitive waste & heat & steam grid
• Ineos Oxide expansion ENB & ethyleen terminal
• Kuwait Lubricants state of the art mixer
• Lanxess new polyamide factory & new ovens glass fibre factory
• Nippon Shokubai expansion SAP & new factory C3H4O2
• Praxair new installation
• Total modernising petrochemical platform
Table: Recent investments by industry in the port of Antwerp (source: Voka)
P P

7. Research and innovation
108 - Sustainability Report 2017
7.2 Number of companies active in R&D
The number of companies in the port that carry out their own research and development is slightly over 50. During the period 2014-2015 there was a strong rise in this number in the “Industry” sector and a decrease in the “Maritime” sector. The rise in the “Industry” sector probably also at least partly explains the increase in R&D investments in this sector. In other words, companies are clearly committed to R&D.
Fig. 7.2: Number of companies in the port that do their own R&D (source: ECOOM - R&D expertise monitoring centre)
Catalisti was set up in 2016 as a new spearhead clus-ter for chemicals and plastics, to promote innovati-on in this sector. It combines the capabilities of Flan-ders Innovation hub for Sustainable Chemistry (FISCH) and Flanders’ PlasticVision (FPV). Its mem-
bership is made up of 100 or so companies, organisations and all Flemish universities, with the mandate of bringing them all together.
The cluster will focus on among other things the challenges of the future, including glo-bal warming and recycling of waste and other materials, and will consider the role that the sector can play in meeting such challenges through joint projects. Catalisti will in the first place serve companies, and based on this vision it will form partnerships with knowledge institutes, industry federations and government departments. By having a central, neutral partner, companies will be able to focus on their core activities while still having easy access to all the right bodies via the cluster.
In this way Catalisti will help to assure the permanent presence of the chemicals and plastics sector in Flanders, make it more competitive and widen its international reach.
Antwerp Port Authority is a member of Catalisti and the Port House functions as a sa-tellite office of this spearhead cluster.

Sustainability Report 2017 - 109
7. Research and innovation
CO.Innovation: a step forward thanks to ICT innovations in the port sector
The term “co-innovation” is a new concept for the port community, expressing the intention to create joint innovative initiatives in the maritime chain. Innovative ICT so-lutions in particular are seen by the port sector as the initiatives with greatest potential for further integration of the maritime chain.
The establishment of the BNP Paribas Fortis Transport, Logistics & Ports Chair at the University of Antwerp has a dual objective. The first of these is to examine the possi-bilities for further integration of the maritime chain and to share the findings with all stakeholders, in the fields of transport, logistics and port activities. This sharing takes the form of BNP Paribas Fortis Port Co.Innovation Cafés. The second objective is to examine how innovation can be supported throughout the chain.
The Chair organised three Co.Innovation Cafés in 2016 and 2017: Innovative ICT solu-tions for Customs; Integration of the maritime chain – best practices for the chemical sector; and Integration of the maritime supply chain – best practices for the air cargo sector. In November a fourth café will be organised on the subject of Integration of the maritime chain – best practices for big data, blockchain, security etc.
For more info and research results, go to: https://www.uantwerpen.be/en/rg/trans-port-and-regional-economics/bnp-paribas-fortis-c/bnp-paribas-fortis-p/
7. Research and innovation
110 - Sustainability Report 2017110 - Duurzaamheidsverslag 2017
SOCIETY

Sustainability Report 2017 - 111
8. Society
8. Society
8.1 How the port is experienced by society
A port is not a separate island with purely economic activities; it is a living organism, roo-ted in the surrounding region and having links with the people who work in it, make use of it or simply live in the neighbourhood. Without this local support the port has no reason to exist. The port community therefore attaches great importance to gaining a picture of how the port is experienced by this society. In this chapter we also seek to illustrate why and how the port and local citizens interact with one another. This approach to the social dimension is unique for a sustainability report.
8.1.1 How do local citizens experience our port?
Annual support barometer
In order to get a picture of how local citizens experience the port, the Port Authority has commissioned the Profacts market research agency to carry out an annual survey. This survey covers 1000 or so people who live or work in the area surrounding the port, who are asked to rate the port’s performance on each of the “3 Ps” (People, Planet, Prosperi-ty). The possible answers are: very positive, positive, neutral, fairly negative, very negative and don’t know. The respondents are also asked how important they personally find these aspects: very important, fairly important, neutral, fairly unimportant, completely unimpor-tant or don’t know.
Report scores for 2016
Both at local and at regional level the contribution made by the port to the economy and employment is rated as positive by more than 80% of respondents, who have a clear view of the port as the engine of the economy and rate it highly in this respect. However if we compare the figures for 2016 with those for 2015 and 2014, we see that these items have slipped back slightly, both for their score and for the importance that people attach to them.
The impact on mobility (Planet) is still seen by respondents as the most negative aspect, with 38% of respondents rating it as negative or very negative. This is almost the same as the score given to it in 2015 and 2014. After “Prosperity” this is the item to which people attach most importance.
The other items are rated as less definitely positive or negative, with “neutral” being the main response.
However, there are two conclusions to be drawn if we compare the 2016 figures with tho-se for 2014. The first is that the appreciation of the port as a tourism and recreational area has risen from 33% to 45% (positive or very positive). Also, the importance attached to this aspect has risen from 55% to 61% (fairly important or very important). Further questi-ons reveal that people actually do bicycle, walk or participate in events in the port area. In the last category the main events attended were the Tall Ships Race and the opening of the new Port House. On the other hand, when people were asked whether they had heard about Havenland (the project for promoting interest in the port area), only one in ten gave a positive answer. So there is still work to be done here. A second conclusion is that the information available concerning projects and activities in the port scored highly. The importance attached to both was more or less the same (around 65% for both items). In other words there seems to be a discrepancy between the appreciation and the perceived importance, although the initiatives taken so far seem to be bearing fruit.
Critical towards the Left bank
In most areas of the port the scores followed the same general trends overall, with the exception of the Left bank area. Here the port scored lower than the general average in nearly all respects, with one exception: the economic importance of the Left bank for Ant-

8. Society
112 - Sustainability Report 2017
werp and the surrounding Waasland region is highly appreciated. The reason for the lower average is that respondents on the Left bank more frequently gave scores of negative or fairly negative. An outlier to this was the item “Development of traffic and mobility in and around Antwerp” which obtained a score of 53.49% fairly negative or very negative on the Left bank, compared with 34.96% on the Right bank. While mobility is the main outlier, “Total impact on the environment” and “Availability of information on projects and activi-ties” were also rated as significantly more negative.
Age
There were fairly large differences between the various age categories.
When it comes to the importance of the port for the city and surrounding region, the sco-res rise from low to high in proportion to the age of the respondent: the older, the more positive. Only 65.16% of those below 30 gave a fairly positive or very positive score for this item, compared with 93% for those aged 60 or above. For the other economic cate-gories the differences were similar. The difference was significantly less only as regards employment.
When it comes to mobility we get a different picture: those below 30 are less negative than the category aged 45 to 59, who gave the most negative scores. Those aged 60 or more took a more positive view. We see the same picture for information about activities and new projects in the port. The highest scores were given by the categories below 30 and 60 or above, with the lowest scores given by the age group between that.
8.1.2 Towards a wider pictureThe effects of the port’s activities in aspects such as prosperity, mobility and employment make themselves felt over a much wider geographical area than the one at present cove-red by the support barometer, and so the survey will be expanded in future to cover a lar-ger area. The “Social Experience” workgroup has already been expanded with the addition of several people from the world of business and a representative from the neighbouring Dutch municipality of Hulst. There is growing interest in how the port is experienced by society beyond the boundaries of the port itself and even across the border in the Nether-lands, and so this will be taken into account by a wider survey in 2019.

Sustainability Report 2017 - 113
8. Society
THE CIRCULAR ECONOMY

9. The circular economy
114 - Sustainability Report 2017
9. The circular economy
Ports are particularly suited for attracting flows of materials, including primary and secon-dary raw materials, and thus also for recycling activities. The port community is therefore convinced of the intrinsic strategic value of having a project in the circular economy where Antwerp Port Authority can play a role as catalyst.
The circular economy is a system designed to maximise the reuse of products and minimi-se loss of value. In its 2030-2050 long-term vision Antwerp Port Authority clearly outlines how the circular economy offers excellent development opportunities for the port. The transition to a circular economy will reduce dependence on fossil fuels and make an ef-fective contribution to the fight against global warming. Moreover the cluster reinforcing effect will boost the competitiveness of port companies and keep Antwerp top-of-mind as an international investment location. Against this background Antwerp Port Authority has together with its stakeholders drawn up a roadmap for putting this transition into practice.
The success of the transition to this new economy will be measured on the basis of the following indicators:
• Employment and added value in the circular economy• Tonnages of waste produced and processed in the port: OVAM (Flemish waste ma-
nagement authority) will report on the port area as of the end of 2019 on the basis of statistics and surveys.
Fig. 9.1: Direct employment in the circular economy in the port of Antwerp on the basis of NACE codes 33, 38 and 39 (source: National Bank of Belgium)

Sustainability Report 2017 - 115
9. The circular economy
Fig. 9.2: Investments and added value in the circular economy in the port of Antwerp on the basis of NACE codes 33, 38 and 39 (source: National Bank of Belgium)
Companies with NACE codes 33 (repair and installation of machines and equipment), 38 (waste collection, processing, disposal and recycling) and 39 (clean-up operations and other waste management) are considered as being in the circular economy. From ana-lyses by the National Bank of Belgium based on the annual reports of companies, the circular economy is clearly a growth sector in the port of Antwerp. There are currently 121 companies active in the circular economy and during the period 2010-2015 there was a significant rise in employment. The added value is also increasing, despite a fall-off in investments. However, this is not the full picture: the circular economy is a very broad concept, and there are many activities that are not included in the selection.
In the meantime Antwerp Port Authority is working on a number of concrete projects such as Carloop. It also supports the projects of major shareholders (e.g. “Flanders recycling hub” and “Antwerp, metabolising flows of materials”), while various companies in the port are already carrying out projects that give form to the circular economy of tomorrow.
Waste methane converted into ammonia
BASF Antwerp is investing 16 million euros to take methane gas from its cracker and use it to produce ammonia. The Flemish government has granted an “eco subsidy” of 1 million euros to support the project. The investment by BASF actually forms part of a programme of investments for upgrading its production process. One side-effect of the upgrades will be a greater amount of methane being produced. However, this methane can be used as raw material for the ammonia production plant, given certain modifications. This will lead to a considerable reduction in the amount of natural gas used by the ammonia plant.
Gyproc C2C: circular economy for plaster products
The plasterboard producer Gyproc seeks to market materials that are healthy, 100% recy-clable and produced with respect for people and nature. This mission fits in perfectly with the Cradle-to-Cradle (C2C) philosophy followed by Gyproc. Plasterboard is ide-ally suited to the circular economy, as Gyproc is able to recycle not only its own pro-duction waste but also demolition waste from outside sources. Indeed when it comes to demolition and construction waste, the Gyproc plant is the only place in Belgium where such materials may be offered for recycling. Gyproc also provides a container service to bring plaster waste back from construction companies. On average the Gy-proc product mix contained about 13% recycled plaster in 2016.

9. The circular economy
116 - Sustainability Report 2017
Circular economy for scrap cars
Many of Europe’s used cars are exported through Antwerp to West Africa where they are given a second lease of life, or even a third, fourth and fifth. But once they finally give up the ghost, that’s the end of the story. Until now, that is. With Carloop, Antwerp Port Authority has set up a pilot project to bring back usable parts and to recycle them here. Cars can be up to 97% recycled by reusing their components or exploiting them as a source of raw materials for new products. With Carloop, usable parts are sorted out by local partners in Benin (the hub of the West African second-hand car market) and sent back to Antwerp where they are recycled by specialist companies. The pilot project started on 1 July and will run for a period of one year. Other partners in the pro-ject are Campine Recycling, Galloo Recyclage, Toyota, Agoria, Febelauto, Worldloop and OVAM (Flemish Waste Management Authority).
The ultimate aim is to build a leading international circular economy in Flanders for second-hand export cars. A second objective of the project is to harmonise European measures to counter the illegal export of scrap cars. In 2012 the port of Antwerp im-posed strict regulations on the export of used cars: only vehicles which have passed an inspection are now allowed out of the country. This has resulted in the number of second-hand car exports falling from 547,172 in 2012 to 307,300 in 2015. At present, however, it is unclear whether this represents an actual decrease in the number of used vehicles being exported from Europe, or whether these “scrap” vehicles are finding their way by another route (i.e. another port). With this project Carloop aims to press for a stricter EU definition of second-hand cars, better tracing of the vehicles concer-ned and uniform standards in all European ports.

Sustainability Report 2017 - 117
9. The circular economy

9. The circular economy
118 - Sustainability Report 2017
SECURITY

Sustainability Report 2017 - 119
10. Security
10 Security
The port community makes intensive efforts to assure a secure port for everyone. Con-stant measures are taken to improve infrastructure, procedures and organisation, raise the level of alertness and make the exchange of information more efficient.
The port has developed a mature security network made up of public and private part-ners: Police, Customs, State Security, Federal Emergency Planning department, disaster coordinators, Fire department, port facility security officers, safety managers, CEPA and other security stakeholders. This network is constantly evolving further. By daring to wi-den the scope – from security procedures to emergency planning procedures, rolling out an ANPR system (Automatic Number Plate Recognition), integrated approach to crime prevention etc. – the security processes become more and more closely interlinked. The efforts of this network and indeed the entire port community ensure that port security is embedded throughout different levels of the chain of transport, contributing to the posi-tive image of the port as a reliable international partner.
10.1 International Ship & Port Facility Security and Maritime Security
10.1.1 ISPS and maritime securityAt the end of 2016 Antwerp had 91 port facilities with ISPS certification. The Harbourmas-ter’s Office has an approved security plan for the whole port area. Each year it also orga-nises at least one multidisciplinary port security exercise with among others members of the Local Committee for Maritime Security and its partners.
The various ISPS measures also help to fight crime in the port. By collaborating and joining forces with the organisations and bodies responsible for security, the port community cre-ates a seamless security system for the maritime chain.
http://www.portofantwerp.com/nl/international-ship-and-port-facility-security-code-ha-venbeveiliging
10.1.2 ISPS in practiceExercises
The ISPS port facilities organise a minor security exercise at least once every three months and one major exercise every year to test the various components of the security plan.
Fig. 10.1: N° of registered ISPS exercises per quarter (Q) or year (Y0) in relation to the N° of facilities at the end of 2016 (source: Harbourmaster’s Office)
P P

10. Security
120 - Sustainability Report 2017
Menu or à la carte
Every quarter the Harbourmaster’s Office suggests a number of options for exercises, from which the PFSOs (Port Facility Security Officers) can choose. For the annual exer-cise they can call upon the support of the Harbourmaster’s Office in drawing up a detai-led playbook, with port employees participating in the scenario. The PFSOs are also free to carry out another exercise of their own, or to take ideas from Exercitium, a security exercise manual drawn up by the Harbourmaster’s Office at the request of the European Commission. This handbook contains lots of useful information about how to organise and carry out security exercises, along with suggestions for participants, different scenarios and practical tips. The manual is widely used by other EU member states, where it is highly regarded.
Security breaches
Security breaches and non-urgent, suspicious situations can be reported using the Har-bourmaster’s incident reporting system, which automatically alerts the security services (Police, Customs and State Security).
The reports are not only investigated by the services concerned but can also lead to chan-ges being made to the Port Police Regulations. For example:
Access to the port, art. 2.2.4: http://www.portofantwerp.com/sites/portofantwerp/files/Gemeentelijke%20Havenpolitieverordening%202017.pdf
Use of drones in the port: http://www.portofantwerp.com/nl/drones-het-havengebied
Fig. 10.2: N° of incident reports. The most frequent security breaches are: unauthorised access, misuse of the badge system, suspicious behaviour in the vicinity, and damage to the perimeter fence (source: Harbourmaster’s office)

Sustainability Report 2017 - 121
10. Security
10.1.3 Authorised Economic OperatorAnother 19 companies gained AEO certification in 2015 and the same number again in 2016.
The number of certificates awarded has risen once more since 2014 and is expected to increase further, as the Customs & Excise are taking various initiatives to encourage com-panies to obtain AEO certification. These include support for companies and courses in how to apply for an AEO certificate. In collaboration with the National Forum (platform for consultation between trade and Customs, in which the port community also participates) they also take measures to grant effective benefits to companies with AEO certification.
Fig. 10.3: N° of AEO certificates issued in Antwerp (source: EU, Taxation and Customs Union, http://ec.europa.eu/taxation_customs/dds2/eos/aeo_consultation.jsp?Lang=en&holderName=&aeoCountry=BE&certificates-Types=AEOC&certificatesTypes=AEOF&certificatesTypes=AEOS&Expand=trrue&offset=1&ange=25)
Fig. 10.4: N° of AEO certificates issued per year (source: EU, Taxation and Customs Union, http://ec.europa.eu/taxation_customs/dds2/eos/aeo_consultation.jsp?Lang=en&holderName=&aeoCountry=BE&certificates-Types=AEOC&certificatesTypes=AEOF&certificatesTypes=AEOS&Expand=trrue&offset=1&ange=25)

10. Security
122 - Sustainability Report 2017
Fig. 10.5: AN° of AEO certificates issued per category (source: EU, Taxation and Customs Union, http://ec.eu-ropa.eu/taxation_customs/dds2/eos/aeo_consultation.jsp?Lang=en&holderName=&aeoCountry=BE&certificat-esTypes=AEOC&certificatesTypes=AEOF&certificatesTypes=AEOS&Expand=trrue&offset=1&ange=25)
10.1.4 Unwanted passengersA distinction is made between stowaways (persons who arrive on a ship illegally) and ille-gals (persons who try to get on board a ship illegally). The Customs and Police services have various technical means at their disposal including fixed and mobile scanners, a backscatter detector, CO2 meter, dogs etc. to check containers for contraband and the presence of un-wanted passengers. Strict inspections are also carried out elsewhere in the port area by the Shipping Police in order to prevent unwanted passengers.
Fig. 10.6: N° of illegals and stowaways recorded by the Shipping Police. In 2009 the recording was incomplete (source: Shipping Police)

Sustainability Report 2017 - 123
10. Security
Don’t give human trafficking a chance
The awareness-raising campaign “Don’t give human trafficking a chance” mounted by Febetra was also publicised in the port of Antwerp by the Local Port Information Net-work on 18 July 2016 and during the “1 day without” campaign week (24-28 October 2016).
BIN Haven (Local Port Information Network)
”Together we assure SECURITY”
The Local Port Information Network was set up by the Harbourmaster’s Office in January 2014 to facilitate public-private collaboration for a secure port environment. The network covers the entire port area and has since grown from 540 to 749
registered members. It also forms part of the federal government’s new BE-Alert noti-fication system for emergency situations.
Members At start-up 2014 2015 2016 540 619 638 749Voice messages received 2014 2015 2016 Real 1 1 4 Test 3 6 2 Preventive messages 2014 2015 2016 Informative 15 19 22 Preventative 19 8 17
The purpose of the Local Port Information Network is to exchange security informati-on between the police and companies in the port in a structured way. The system can be activated in two ways:
• �In real time by the police reporting room, to pass on urgent messages concerning anomalous situations or serious incidents
• �By email from the Harbourmaster’s Office, with preventative messages and practi-cal tips that contribute to security in the port
http://www.portofantwerp.com/nl/bin-haven-antwerpen

10. Security
124 - Sustainability Report 2017
The Local Port Information Network is committed to publicising the national an-ti-burglary campaign “1 day without” once per year. During a period of one week the port community and network members are alerted with a range of security tips and are given the opportunity to participate in one of the awareness-raising activities.
http://www.1dagniet.be/
Wees alert voor verdachte gedragingen en observaties.
Identificeer uw bezoekers en reden van bezoek.
Sluit alle gebouwen/magazijnen goed af (poorten/deuren/ramen) na de werkuren.
Houd uw terrein proper ...let op vuiligheid, graffiti en zorg voor een goede werking en onder-houd van het beveiligingsmateriaal.
Zorg voor een goed sleutel- en badgebeheer.
Maak je terrein goed zichtbaar ...door goede verlichting, overzichtelijke in-deling opslag goederen, beperk duistere hoeken, cctv monitoring...
13 november 2015één dag zonder inbrakendoe mee en kijk op www.1dagniet.be
7TipsInbraken?
...om inbraken te voorkomen in je onderneming
Help de inbreker niet ...laat geen werkmateriaal slingeren, verwijder obstakels/goederen langs de omheining die inklimming vergemakkelijken...

Sustainability Report 2017 - 125
10. Security
10.2 From disaster control to incident control
The Antwerp port area is home to a very wide variety of activities, with the constant in-crease in shipping traffic and associated loading, unloading and transhipment movements, the presence of the largest European chemical cluster and the large number of bunkering operations. Together, these create a heightened risk of incidents, and so in 2012 a standby service was set up in order to react properly in case of disaster. In the course of 2015 this standby service was upgraded to form a dedicated unit that not only reacts to disasters but also pays attention to various incidents that could lead to disaster.
This disaster unit, which is operational 24/7, has a dual mission:
• To take preventive action and to raise the level of awareness among port users• To recognise incidents more quickly and to take appropriate, effective action
The preventative aspect includes among other things carrying out detailed inspections during bunkering and transhipment operations. In 2015 nearly 6% of all reported bunkering operations in the port of Antwerp were inspected, and in 2016 the number of inspections rose to 7.3%. These inspections helped to reduce the number of oil incidents in the course of bunkering and raised the level of safety consciousness.
Fig. 10.7: N° of bunkering operations carried out in the port of Antwerp
Fig. 10.8: N° of preventive inspections (source for both figures: Antwerp Port Authority)
In the meantime seagoing ships are getting longer, wider and higher, making it more and more challenging for the bunkering barge to moor safely alongside the ship. Moreover the rise and fall of tides in some terminals makes things even more difficult. During inspections

10. Security
126 - Sustainability Report 2017
the disaster unit pays extra attention to these high-risk operations.
10.2.1 Oil incidentsThe graph below shows the number of recorded oil incidents since 2007. Since the first standby unit was set up – and later the disaster unit – an increasing number of oil inci-dents have been recorded compared with 2012. An oil incident is any actual or potential presence of unwanted oil on or around the water surface. There can be different causes of such incidents. The number of incidents for which no cause is known is declining in relative terms, as a result of improved monitoring. In the past, oil incidents were not always dealt with in an environment-friendly way, as there was a tendency to use excessive amounts of detergent. This has resulted in the water bottom being contaminated with mineral oil at certain points. This mineral oil can be disturbed by dredging operations and/or the propel-ler wash of deep-draught ships and rise to the surface of the water. This legacy pollution is included in the graphs as “Other.”
Fig. 10.9: Recorded oil incidents (source: Antwerp Port Authority)
Fig. 10.10: Causes of oil incidents (source: Antwerp Port Authority)
P P
Sustainability Report 2017 - 127
10. Security
Fig. 10.10: Causes of oil incidents (source: Antwerp Port Authority)
In 2015 the Port Authority appointed a service provider to clean up oil pollution in an ap-propriate, eco-friendly way. Every two weeks (after a minor incident has occurred) the Port Authority and the service provider assess the way in which it has been dealt with. In case of a major incident the assessment is done immediately after the clean-up work has been completed. If necessary the operational procedures and/or materials used are then modified. In all cases the main aim is good prevention of oil contamination, quick containment of the oil spill and correct (mechanical) cleaning of the polluted structures, scaffolding and water surface, while guaranteeing the continuity of shipping traffic. The approach to oil contamination and the support for dealing with it will be further improved in 2017 with additional training for the full corps of dockmasters and the appointment of incident coordinators.

ANNEXES
Sustainability Report 2017 - 129
11. Annexes
The port community: who we are
The Antwerp port community consists of around 900 companies with a very wide range of activities. Direct employment amounts to 60,656 full-time equivalents (FTE), while in-direct employment accounts for a further 81,692 FTE (2015 figures). The interests of the port community are represented at regional, national and international level by various organisations, of which the most important are Antwerp Port Authority, Alfaport and the Left Bank Development Corporation. Together they have taken the initiative to produce a snapshot of the sustainable nature of the port.
Antwerp Port Authority was set up in 1996 as an independent company owned by the City of Antwerp. On 1 January 2016 its legal form of organisation was changed to become a “naamloze vennootschap van publiek recht” (a type of public limited company under Belgian law), with the official name of “Havenbedrijf Antwerpen.” However, it still conti-nues to trade under the names of “Antwerp Port Authority” and “Port of Antwerp.” The City of Antwerp is the sole shareholder. The board of directors is made up of 13 members: six representatives of the City of Antwerp (mayor, aldermen and council members), six independent directors (in the sense of the Companies Act) and the chief executive officer. The company acts as port authority for the entire port area. Board meetings are attended by the Flemish Ports Commissioner, representing the Flemish Government. This commis-sioner ensures compliance with the Ports Decree, e.g. concerning equal treatment of all port users. In contrast to the situation before the change of legal form, there are no other stakeholders in the board of directors. In order to make up for this, the Corporate Gover-nance Charter of Antwerp Port Authority provides for the setting up of “Stakeholder Con-sultation for Port, Industry and Logistics.” This consultative body includes representatives of interest groups in the private port community as well as representatives of individual port companies in the three main sectors of transhipment, industry and logistics. Consul-tation meetings discuss subjects that concern the port as a whole, ultimately leading to formal opinions or recommendations that can be submitted to the Port Authority board of directors.
The 1,541 members of personnel of Antwerp Port Authority keep the port functioning correctly and ensure that it is able to grow and develop. The Port Authority manages and maintains the docks, bridges, locks, quays and backquays. Its members of personnel are responsible for safe and smooth shipping traffic throughout the port area. In addition the various Port Authority departments provide tugging and dredging services, promote the port at home and abroad, and communicate about the port on a day-to-day basis. The Port Authority invests financially, both directly and indirectly, in the future of the port of Antwerp. This finds expression in among other things the Port Authority’s own business plan and in formulating the long-term vision for the port. The Port Authority strives for a sustainable port in all respects and aims to set an example for corporate social responsi-bility.
Alfaport is the representative platform for private companies and industry associations* in the port, within Voka (Chamber of Commerce) Antwerp-Waasland. Alfaport seeks to ensure that the port of Antwerp remains accessible, facilitating, cost-competitive and sus-tainable, with a view to ensuring long-term continuity of employment and added value in the port.
Alfaport was formed on 1 January 2014 by the merger of Alfaport Antwerpen (federation of port-related and logistics companies in the port) and Voka (Chamber of Commerce) Antwerpen-Waasland.
Alfaport deals with the following matters:
• Environment and sustainability• Trade facilitation / Customs & Excise• Accessibility• Labour market• Flemish ports policy• Port regulations and customs• Mobility

11. Annexes
130 - Sustainability Report 2017
* KBRV (Royal Belgian shipowners’ association); ASF (Antwerp Shipping Federation); ABAS (General trade as-sociation for Antwerp stevedoring & port companies); VEA (Association of Antwerp forwarding, logistics and freight handling companies); KVBG (Royal association of supply chain management companies)
The Left Bank Development Corporation (LBDC) was set up in 1982 and is responsible for policy concerning development, industrialisation and site management of the port area on the Left bank of the river Scheldt. Its main activities are making sites ready for construc-tion, granting concessions to companies on part of the Left bank area, and advising the government on matters concerning expansion of the port area.
The port area on the Left bank at present covers 5,284 hectares, on which concessions have already been granted on more than 1,500 hectares in the past 34 years. In 2016 there was a total of 17,689 full-time employees working on the Left bank area.
Since 2010 the LBDC has taken various concrete measures to put its policy vision concern-ing sustainable port management into practice. In all cases the emphasis is on harmonisa-tion of economic and ecological interests. The LBDC shares responsibility for sustainable growth of the port. Thanks to its intensive collaboration with Antwerp Port Authority it makes an important contribution to the development of sustainable energy.
There are frequent consultations between the three initiative-takers, in various forums. Antwerp Port Authority is a shareholder in LBDC. Alfaport and LBDC are represented in the Port Environment Consultation body and other workgroups coordinated by the Port Authority.
The partners in figures
Antwerp Port Authority Alfaport LBDC
Ownership structure and legal form of
organisationnv van publiek recht
Port-wide non-profit organisation
Mission-driven asso-ciation
N° of employees (FTE)
1.541 4,6 10,2
N° of port employees represented
Net income (public sector) TURNOVER
300,3 mln 0,00 12.232.724,59
Net turnover (private sector)
472.891,66
Total capital (perma-nent)
1.246,4 mln 3.856.101,15
Equity owed (private sector)
429.740,13
Total assets 4.285.841,28 192.780.171,90
Sustainability from a worldwide perspective
The long history of the port of Antwerp teaches how the world and the economy are con-stantly changing and developing. The rising tide of prosperity in the Western world after the Second World War set a number of irreversible process in motion that are still having an impact on ports in the 21st century.
Transport activities – with ports as the link between maritime and continental carriage – reflect developments in the world economy, especially the trend towards globalisation.
Changing economic structures and consumption patterns, demographic changes, offsho-ring of production, liberalisation of trade, new corporate strategies ... Together with in-creased concern for the environment, these form the key factors that will determine the appearance and importance of ports in the 21st century. In such a situation, if we want to be able to grow further the concept of “sustainable development” can hardly be ignored.
Sustainability Report 2017 - 131
11. Annexes
Sustainability in the port of Antwerp
The port of Antwerp is a world player, the second-largest port in Europe. It can draw upon the intensive synergy between the maritime, logistics and industrial activities of the port and its huge cargo-generating capacity. This multifunctional capability creates large ad-ded value for the city, the region and the country. The companies in the port can call upon highly-trained personnel, together employing some 142,000 people directly and indirectly.
The port’s geographical location some 80 km inland not only places it in the consumption heart of Europe but also makes a major contribution to more efficient and sustainable transport to and from the European hinterland. The numerous connections with the hin-terland are further developed year after year, with particular attention to a more evenly balanced modal split between road, rail and barge transport.
Very large investments are being made in the port, not least by energy-intensive com-panies: Antwerp is home to the largest integrated chemical cluster in Europe. Specific measures are being taken to improve the air quality, and investments are being made in nature conservation areas to protect the flora and fauna. In fact, a large proportion of the port area is classified as special protection areas under the European Bird and Habitat directives (Natura 2000).
Over the years the modern port has developed physically farther away from the city, with consequences for local involvement, since “out of sight is out of mind.” Initiatives such as the MAS Port Pavilion, the Flemish Port Days, the new Port House, consultative councils for local residents etc. have successfully restored the links between port and city.
These and other investments and initiatives show clearly that striking a balance between People, Planet, Prosperity, Peace and Partnership is something that concerns the entire port community.
Sustainability as an ongoing process
In order to develop towards a more sustainable port and to present ourselves as a port community more effectively to the outside world, we have decided to base our Sustaina-bility Report on the international GRI standard (Global Reporting Initiative).
The port of Antwerp won the award for Best Belgian Sustainability Report with its first and third reports (in the category “other organisations”). The port has also won two internati-onal awards for the way in which sustainability is implemented, namely the Environmental World Ports Award 2013 and the bronze IAPH Environmental Award.
The Sustainability Report published by the Antwerp port community is unique in that it is produced by a community and not by a stand-alone organisation. The work of drawing it up involves intensive collaboration among a group of stakeholders who all have strong social and economic links with the port of Antwerp. The method of having the report pro-duced by the Antwerp port community as a whole was a deliberate choice.
The first Sustainability Report was followed by a second and a third, in 2013 and 2015 respectively. In the meantime the Sustainable Enterprise Guide was launched as a “virtual knowledge base” that brings together the initiatives by and for the companies in the port.
The port community has chosen to continue along the same path and to publish a Sustai-nability Report every two years. In the intervening period there is a process of intensive stakeholder dialogue, enabling the many initiatives by the various parties to be harmoni-sed and coordinated.

11. Annexes
132 - Sustainability Report 2017
The port of Antwerp in figures
Table: The port of Antwerp in figures (source: Antwerp Port Authority and National Bank of Belgium, working paper 321)
2011 2012 2013 2014 2015 2016
Shipping freight volu-me (million tonnes)
187,2 184,1 190,8 199,0 208,4 214,2
Containers (million tonnes)
105,1 104,1 102,3 108,3 113,3 117,9
Conventional breakbulk (million tonnes)
12,7 10,9 10,1 9,9 10 9,8
Ro/ro (million tonnes) 4,2 4,8 4,6 4,5 4,7 4,6
Liquid bulk (million tonnes)
46 45,3 59,5 62,8 66,7 69,2
Dry bulk (million ton-nes)
19,1 19,1 14,4 13,5 13,8 12,6
N° of seagoing ships 14.240 14.556 14.220 14.009 14.417 14.473
N° of barges 59.444 56.499 57.057 57.633 57.311 58.006
Area
Port area (ha)1 13.057 13.057 13.057 12.068 12.068 12.068
Right bank (ha) 7.239 7.239 7.239 6.784 6.784 6.784
Left bank (ha) 5.818 5.818 5.818 5.284 5.284 5.284
Nature conservation areas in and around the port (ha)
3.417 3.389 3.510 3.251 3.502 3.554
Area of water in the docks (ha)
2.024 1.995 1.948 1.992 1.992 1.992
Port expansion area on Left bank (ha)2
1.073 1.073 1.073 983 983 1.000
Covered storage area (ha)
553 556 560 610 610 610
Tank storage terminal capacity (m3)
5.247.055 5.149.141 6.300.000 6.900.000 6.900.000 7.200.000
Total water frontage (km)
186 190 197 197 195 189
Length of rail track (km)
1.054 1.053 1.053 1.061 1.061 1.061
Length of road (km) 409 409 411 409 430 412
N° of companies 900 900 900 900 1.000 1.000
Employment
Direct (FTE) 60.292 61.392 61.664 61.234 60.656 N.A.
Indirect (FTE) 84.628 84.906 82.735 82.927 81.692 N.A.
Added value
Direct (billion euros) 9,7 10,1 9,8 10 10,9 N.A.
Indirect (billion euros) 8,8 9,1 9,1 8,8 9,7 N.A.
Largest integrated chemical cluster in Europe
Largest steel port in Europe
Largest fruit port in Europe
Second-largest rail port in Europe
Largest coffee warehousing port in the world

Sustainability Report 2017 - 133
11. Annexes
The port of Antwerp and the world
The port community is active in the port areas on the Left and Right banks of the Scheldt. At the same time it forms part of the worldwide supply chains, as the hinge point with the Flemish, Belgian and European hinterland.
The port occupies a particularly advantageous location in the heart of Europe.
Zuid
-Am
eri
kaNoord- en
Midden-Amerika
Afrika
Oceanië
Nabije Oosten
Midden- en Verre OostenEu
ropa
Antwerpen
214.166.958 TONMARITIEM GOEDERENVERKEER IN ANTWERPEN
44%/28%
15%/18%
11%/15%
1%/1%
15% /16%
LOSSINGEN/LADINGEN(IN MILJOEN TON)
LOSSINGEN LADINGEN
BESTEMMING LOSSINGEN LADINGEN
Europa 48,2 29,1
Midden- en Verre Oosten 16,6 18,4
Noord- en Midden-Amerika 16,2 16,5
Nabije Oosten 12,2 15,9
Afrika 8,1 17,4
Zuid-Amerika 8,3 5,6
Oceanië 0,8 0,8
8%/5%7% /17%
Fig.: Imports and exports from and to regions of the world, in tonnes (2016)
Sustainability efforts win national and international recognition
The Sustainability Report has helped to ensure that the sustainability efforts of the Ant-werp port community have gained recognition at home and abroad as an example for others to follow. At the request of foreign ports, “Sustainable Port Development” is now included as one of the standard seminars offered by Antwerp Flanders Port Training Cen-ter (APEC), and is also available as a standalone course. In the meantime CIFAL-Flanders, which forms part of the United Nations Institute for Training and Research (UNITAR), has included “Sustainability in the port of Antwerp” as an action-learning course in its educa-tional programme.
The international IAPH-PIANC workgroup “Sustainability Reporting for Ports,” which draws up industry guidelines for ports on the basis of the GRI-G4 guidelines, is chaired by Antwerp Port Authority.
Meanwhile the Antwerp port community has garnered numerous awards in the past few years. To give just a few examples:
Port of the Year (2014): the port of Antwerp landed the “Port of the Year” award for the second time at the International Seafarers’ Welfare Awards organised by the International Seafarers’ Welfare and Assistance Network (ISWAN). The award was in recognition of the efforts made by the Antwerp port community on a daily basis on behalf of the numerous

11. Annexes
134 - Sustainability Report 2017
seafarers who visit the port.
Bronze IAPH Environment Award (May 2013): the port of Antwerp gained recognition for its efforts to develop into a sustainable port where economic activities and nature con-servation go hand-in-hand. With its submission “Creating Space for Port Development by Proactive Nature Management” Antwerp convinced the jury of the important role played by proactive nature management in the long-term development of the port.
Environmental World Ports Award 2013: Antwerp gained this award in recognition of its efforts for sustainability and the environment, ahead of other large ports such as Rotter-dam and Los Angeles.
Best Belgian Sustainability Report Award 2012 and 2016: this award is an initiative of the Institute of Company Auditors, Business & Society and Kauri, the Belgian network that promotes interaction and collaboration in the field of sustainability. In its very first Sus-tainability Report the port was the winner in the category “Other organisations,” demon-strating that it pays to collaborate with various other players in publishing a report that presents a faithful picture of the shared challenges in the field of sustainability. In 2016 the Sustainability Report won this award for the second time.
East Flanders Heritage Prize 2012: in recognition for restoration of the Left Bank Deve-lopment Corporation’s office building in Kallo.
Lloyd’s List Global Award 2010: Port Operator of the Year. This recognised the efforts made by the port of Antwerp in maintaining its high standards of operation and custo-mer-friendliness even during one of the most difficult years.
Security Award 2009: presented by the National Nuclear Security Administration (US), because the port of Antwerp has carried out intensive monitoring for the presence of radioactive substances at more than 40 points around the port since 2007. This nuclear detection forms part of the worldwide Megaports initiative aimed at deterring the trade in nuclear weapons.
Shipping Star Award 2009: the Shipping Star Awards are an initiative of Shipping China and are presented on the basis of votes by among others traders, forwarders and logistics companies in China.
Best Dry Bulk Port 2009: an award that judges nominated ports on among other things the initiatives by the port management to generate local and international business, as well as the port’s efforts to handle bulk goods in an efficient, safe and environment-friendly way, improve the quality of the logistics post-handling, raise the level of customer-friend-liness, and promote investments in port infrastructure. The port of Antwerp gained the best marks for these parameters overall.

Sustainability Report 2017 - 135
11. Annexes
Report profile and methodology
Report profile
The first Sustainability Report by the Antwerp port community was published in February 2012. The second report appeared in the autumn of 2013. Since then it has been published every two years. In the intervening period, intensive stakeholder dialogue has been car-ried out with a view to improving both the report itself and the sustainability performance of the port community. The fourth report presents the sustainability developments up to and including the year 2016. Where data from 2016 are not available the most recent data are used. To illustrate the most recent actions and development, examples from 2017 are sometimes given. In contrast to the previous editions the present report is no longer available to read in full on the website www.sustainableportofantwerp.com. Instead, the website has been given a makeover and now complements the report. The website pre-sents a more up-to-date picture of the situation, together with many more examples and best practices shared by the port community.
Scope and limits
Sustainability at various levels
The setting up in October 2010 of a “Sustainability Steering Group” within the Total Plan for the Port of Antwerp kick-started the sustainability reporting process for the Antwerp port community. This resulted in the first Sustainability Report, at the beginning of 2012, which later that year won the award for Best Belgian Sustainability Report 2012 in the ca-tegory “other organisations.” The third Sustainability Report, published in 2015, gained the same award once more in 2016. Immediately after publication of the first report a process was set in motion to further improve the sustainability performance and reporting and to make it ongoing. To achieve this the steering group teamed up with three workgroups, each dealing with a particular subject:
• People: social aspects, including employees in the port as well as society in general• Planet: environmental aspects of port operation and development• Prosperity: economic aspects of the port, including added value and prosperity for
the regionAfter the publication of the second Sustainability Report, the port community decided – partly at the urging of the various stakeholder dialogue bodies – to extend the number of workgroups dealing with particular subjects. Various new workgroups were set up, and existing workgroups involved in implementation of the policy and vision concerning sustainable development of the port were included in the sustainability process. This led to workgroups on the following subjects: Mobility, Travel between Home & Work, Road Transport, Rail Transport, Barge Transport, Pipelines, Energy & Climate, Safety & Securi-ty, Social Experience and Research & Innovation. Also at the urging of stakeholders, two more workgroups were added in the run-up to the fourth Sustainability Report, namely Circular Economy and Sea Shipping.
The Sustainability workgroup and the special subject workgroups are made up of re-presentatives of the initiative-takers (Alfaport Antwerpen, Antwerp Port Authority and the Left Bank Development Corporation), together with Catalisti and other stakeholders. Coordination between the steering group and the workgroups is by consultation between the chairmen of the workgroups and a representative of the steering group.
The Sustainability Report is drawn up in accordance with the Global Reporting Initiative standard (GRI Standards, “In accordance” core). As well as being generally recognised, this methodology is also the most comprehensive, most standardised and most com-monly used by companies and organisations. By extension it is also the most suitable for an area wishing to publish a sustainability report. Compliance with this standard is also a guarantee of quality of the report.
This quality guarantee is further backed up by having the report audited by an objective
11. Annexes
136 - Sustainability Report 2017
third party, in this case Deloitte. The audit is carried out according to the “International Standard on Assurance Engagements” (ISAE) 3000, a model that has been developed for attesting non-financial data. This attestation provides “a limited degree of certainty” and is comparable with a review of financial data, making it less comprehensive than a full audit. The procedure comprises a discussion with the persons responsible for the data, concern-ing the choice of indicators and the way in which they are calculated, together with limi-ted checks on the actual information obtained. The attested indicators are accompanied throughout the text by a quality mark:
Since the Sustainability Report is produced jointly by the Antwerp port community, it deals with the activities of this community, covering the entire port area (as defined by the tasks and responsibilities of Antwerp Port Authority and the Left Bank Development Corporation). Data have also been made available by the National Bank of Belgium, VREG (the Flemish regulator of the electricity and gas market), INBO (Institute for nature and forest research), OVAM (Flemish waste authority), VMM (Flemish environment company) and ECOOM (Interuniversity expertise centre for research and development monitoring).
The fourth Sustainability Report covers the Antwerp seaport area as defined geographi-cally in the Regional Land Use Plan approved by the Flemish Government on 24 Octo-ber 2014 and published in the “Belgisch Staatsblad” (Belgian government gazette) on 28 November 2014. However, the data from the National Bank of Belgium also covers the Petroleum South area.
All the indicators and data included in this report refer are far as possible to this aggrega-ted area; where this is not possible, it is explicitly mentioned.
With the first Sustainability Report we wanted to give individual companies an example that could be used for them to draw up their own sustainability report (possibly as part of their annual report). Along with the second Sustainability Report we launched a Sus-tainable Enterprise Guide with information and advice for companies in order for them to implement sustainable enterprise in their day-to-day operations. In the third Sustainability Report the link with the existing workgroups was made even stronger, so that sustainabi-lity was better integrated with the general operation and vision formulation. Now for this fourth report we have opted to give the accompanying website a complete makeover, transforming it into a dynamic site which complements the “static” report. Accordingly, the report and the website cannot be considered separately from one another. The report itself can be downloaded as a PDF. With this combination of website and report the ini-tiative-takers wish to create a dynamic whole that will provide further inspiration for the transition towards a more sustainable port.
Methodology
According to GRI principles
This report follows the protocol and basic principles of the GRI standards.
Relevance and control
We have opted for the most relevant indicators used by companies to monitor their own operations. After the publication of the second Sustainability Report the list of indicators chosen and those rejected was revisited, this time also within the various workgroups. The methodology followed is described in detail in the document “Stakeholderdialoog op weg naar DHV4.”
Balance and completeness
The Sustainability Report is not confined to the positive elements of sustainable deve-lopment; the negative elements too are dealt with. Wherever possible the report states
Sustainability Report 2017 - 137
11. Annexes
clearly whether a particular trend is to be judged as positive or negative. In doing so it also takes account of the desired direction or the objectives that have been set.
Comparability
Sustainable performance must be capable of being benchmarked against other relevant players. This has been done wherever possible. At the same time, the positive or negative judgement concerning the trends is a comparison with the desired objectives, wherever possible.
... with modifications to suit the characteristics of the port of Antwerp
In order to make the reporting framework more relevant to the port of Antwerp, the GRI guidelines and methodology have been “tailored” to suit and/or supplemented where ne-cessary. The lack of GRI standard indicators that are specific to ports make a number of modifications necessary. However, all the indicators chosen are based on the criteria of relevance, as decided in consultation with the stakeholders. From the GRI list we have taken only those generic indicators that are relevant to a port context. These have been supplemented with relevant indicators from official sources and other external organisati-ons, but always in accordance with the GRI guidelines and their basic principles.
Use of official data
The data used are based on official statistics as far as possible. This report presents deve-lopments up to and including 2016, to the extent that the data are available. Economic and social data taken from the annual accounts and “social balance sheets” of companies, as submitted to the National Bank of Belgium, are included up to and including 2015.