suspended matter in deep ocean water
TRANSCRIPT

Suspended Matter in Deep Ocean Water
Abstract. A nepheloid layer has been observed by optical means in the lower part of the water column on the continental slope and rise. By sampling it has been found to be a suspension of lutite, apparently in sufficient quantity to induce downslope flow. Sediment transported in the nepheloid layer may be a major component of deep-sea sediment bodies.
Several workers have reported opti- cal studies of suspended matter in sea water samples (1). More information about the amount and distribution of suspended material in the oceans is nec- essary in order to appraise its geological importance. This appraisal is given new urgency by seismic reflector surveys which reveal that the major deep-sea sediment bodies of the world are adja- cent to continents and were for the most part laid down as homogeneous deposits having level surfaces at every stage of accumulation (2). It appears from these surveys that some process played the same role in the distribution of clay-size sediments as turbidity cur- rents play in the distribution of the sands and silts.
Strong background haze in some of our ocean bottom photographs has been difficult to explain by any cause other than clouded (nepheloid) water. Ob- servations of ripples and current scour marks in parts of the deep sea floor have likewise pointed to the importance of studying sediment content of the deep water and of measuring the light scattering in these water masses.
Further impetus was given to our long-standing plan to measure light scattering versus depth by the discovery of a considerable amount of suspended matter by centrifuging one sample of deep water (3).
It appears that the nephelometer, a meter for measuring light scattering in situ, offers the best possibility for rapid and effective search for suspended par- ticles and for immediate shipboard guidance on where to collect water samples for detailed analysis.
The nephelometer used is a photo- graphic instrument designed by Thorn- dike. It is made from components of our deep-sea camera system (4). The light source is an electronic flash tube that produces a short flash each 10 sec- onds, giving a measurement at depth intervals of about 10 m at normal speed of raising or lowering.
The recorder is a shutterless deep-sea camera modified to give constant film transport speed. The camera holds ap- proximately 8 m of 35-mm film and
12 MARCH 1965
provides a photograph on each 6 mm of film. Each photograph contains a light and a dark calibration patch, ob- tained from the direct beam, and two patches obtained from scattered light, one on either side of the direct beam. White, unpolarized light, scattered at all angles from approximately 90? to 0? forms the scattered beams. Care is taken to keep unwanted light from the scattered light patches. The camera is used at an aperture of //11 and is focused for a distance of 2 m. It is pointed directly at the light source, which is at a distance of 3 m. The scattered light patches subtend angles from about 3.5? to 8.5? from the axis of the camera.
This apparatus yields information about a nepheloid layer near the surface (on night stations only) and the pene- tration of daylight into the sea, and also provides photographs of large organ- isms such as those in the sound scatter- ing layers.
The difference between the average optical density at the centers of the two scattered-light patches and at the cen- ters of the calibration patches constitute a "reading." A reading is a somewhat arbitrary quantity which should be cor- rected for film contrast, but which we have used without correction and have taken as a measure of the degree to which the water is nepheloid.
The location and geographic setting of each of the stations is shown in Fig. 1. The principal facts are given in Table 1.
Robert D. Conrad-7: At station RC7-1, a sample of 200 liters obtained from the nepheloid layer was found, by centrifuging, to contain some organisms and about 0.50 g of suspended lutite. By contrast, fifteen samples of 3000 liters each from a depth of 3 m yielded no measurable quantity of suspended mineral particles when treated in the same way (3).
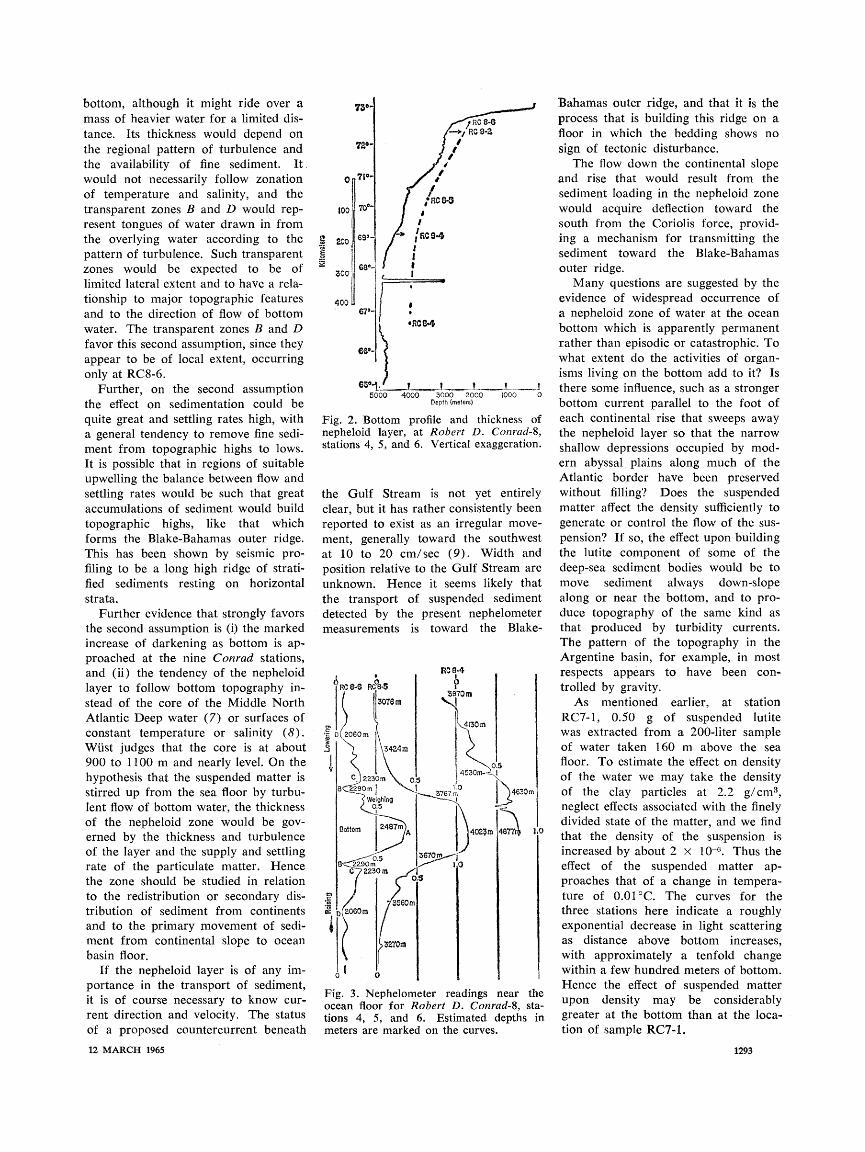
Robert D. Conrad-8: Stations RC8-4, -5, and -6 span a distance of about 560 km from the continental slope to the abyssal plain. At each station the light scattering tends to increase markedly as the bottom is approached. Figure 2 shows the bottom profile along the traverse, the approximate top of the nepheloid layer being indicated by the dotted line.
The variation of light scattering with depth is shown in Fig. 3. There are noteworthy narrow transparent zones, marked B and D, at 2290 and 2060 m on station RC8-6. Similar zones were perceptible but less definite and more numerous at station RC8-4, but not at the intervening station.
At stations RC8-2 and -3 the meas- urements were made at night in order to study the optical properties of the sound-scattering layers and did not ex- tend to the bottom. RC8-1, on the outer ridge of the Puerto Rico Trench, in a depth of 5073 m, showed a slight but definite increase in light scattering in the bottom 1600 m.
Robert D. Conrad-9: Preliminary re- sults from stations RC9-2, -4, -5, -6,
Table 1. Locations of nepheloid zones from which sediment was collected.
Water Depth to Thickness of Station Date Lat. N Long. W depth nepheloid nepheloid
(m) zone (m) zone (m)
RC7-1 31 Aug 63 32?15' 74045' 4190 (Suspended clay col- lected in a water sample from 4030 m)
RC8-4 18 Aug 64 36?13' 66045' 4877 3927 950 RC8-5 20 Aug 64 37035' 70?14' 4023 3363 660 RC8-6 21 Aug 64 38?39' 72?29' 2487 2087 400 RC9-2 18 Oct 64 38?28' 71?38' 2779 2549 230* RC9-4 19 Oct 64 36?29' 69?08' 4356 4161 195* RC9-5 21 Oct 64 33?38' 72? 10' 4975 4575 400* RC9-6 22 Oct 64 33019' 750121 3442 3212 230* RC9-7 25 Oct 64 28?56' 74?26' 4484 4074 410* Trieste 24 June 63 410451 64?56' 2680 (Beginning at about
8 m above the bot- tom, cloudiness inter- fered with visibility)
* There are small uncertainties in these numbers, since they were read by eye instead of by optical densitometer, and in several cases the lowering was stopped just short of the ocean bottom.
1291

and -7 of the current cruise are in- cluded for their strong implication that the nepheloid layer is a permanent and widespread feature, neither a transitory response to a storm or earthquake nor restricted to the vicinity of a submarine canyon.
Trieste: On a dive of the U.S. bathyscaphe Trieste, during the search for the wreckage of the U.S.S. Thresher, Keach (5) reported that "a dense 'cloud layer' of fine organic mat- ter suspended 25 feet [7.5 m] above the bottom forces us to cruise lower." This phenomenon may have been an artifact of the search or a local bottom current from the passage between Brown and
Georges Banks (6), but if valid it sup- ports the concept of a widespread nepheloid layer.
Two possible assumptions for ex- plaining the observed distribution of the nepheloid water are: (i) that the cloudiness is associated with a water mass containing suspended matter that has remained more or less permanently in that layer, in effect serving as a marker of the water mass; or (ii) that it results from sediment stirred up from the sea floor by turbulent flow of the bottom water, the flow being controlled either by the influence of the suspended matter upon the density, or by other factors.
On the first assumption the nepheloid zone would generally have nearly hori- zontal boundaries and correlate with the zonation of temperature and salin- ity. The transparent zones B and D of RC8-6 would then represent thin tongues of different water masses that would be expected to have great lateral extent. The effect on sedimentation would be slight, owing to the slow settling rate, and would tend to produce "pelagic" deposits, that is, deposits of equal thickness over hill and valley ex- cept where the hills extend far into or through the nepheloid zone.
On the second assumption, the neph- eloid zone would generally follow the
Fig. 1. Locations of the stations (contours in fathoms; I fathom = 1.8 m). 1292 SCIENCE, VOL. 147
bottom, although it might ride over a mass of heavier water for a limited dis- tance. Its thickness would depend on the regional pattern of turbulence and the availability of fine sediment. It would not necessarily follow zonation of temperature and salinity, and the transparent zones B and D would rep- resent tongues of water drawn in from the overlying water according to the pattern of turbulence. Such transparent zones would be expected to be of limited lateral extent and to have a rela- tionship to major topographic features and to the direction of flow of bottom water. The transparent zones B and D favor this second assumption, since they appear to be of local extent, occurring only at RC8-6.
Further, on the second assumption the effect on sedimentation could be quite great and settling rates high, with a general tendency to remove fine sedi- ment from topographic highs to lows. It is possible that in regions of suitable upwelling the balance between flow and settling rates would be such that great accumulations of sediment would build topographic highs, like that which forms the Blake-Bahamas outer ridge. This has been shown by seismic pro- filing to be a long high ridge of strati- fied sediments resting on horizontal strata.
Further evidence that strongly favors the second assumption is (i) the marked increase of darkening as bottom is ap- proached at the nine Conrad stations, and (ii) the tendency of the nepheloid layer to follow bottom topography in- stead of the core of the Middle North Atlantic Deep water (7) or surfaces of constant temperature or salinity (8). Wiist judges that the core is at about 900 to 1100 m and nearly level. On the hypothesis that the suspended matter is stirred up from the sea floor by turbu- lent flow of bottom water, the thickness of the nepheloid zone would be gov- erned by the thickness and turbulence of the layer and the supply and settling rate of the particulate matter. Hence the zone should be studied in relation to the redistribution or secondary dis- tribution of sediment from continents and to the primary movement of sedi- ment from continental slope to ocean basin floor.
If the nepheloid layer is of any im- portance in the transport of sediment, it is of course necessary to know cur- rent direction and velocity. The status of a proposed countercurrent beneath
12 MARCH 1965
0
100
20o
400
5r '
'RC 84 //
r
:RC 844
5000 4000 3000 2000 3000 0 Depth (meters)
Fig. 2. Bottom profile and thickness of nepheloid layer, at Robert D. Conrad-8, stations 4, 5, and 6. Vertical exaggeration.
the Gulf Stream is not yet entirely clear, but it has rather consistently been reported to exist as an irregular move- ment, generally toward the southwest at 10 to 20 cm/sec (9). Width and position relative to the Gulf Stream are unknown. Hence it seems likely that the transport of suspended sediment detected by the present nephelometer measurements is toward the Blake-
TM c
0W .1 3
e
1,0
Fig. 3. Nephelometer readings near the ocean floor for Robert D. Conrad-8, sta- tions 4, 5, and 6. Estimated depths in meters are marked on the curves.
Bahamas outer ridge, and that it is the process that is building this ridge on a floor in which the bedding shows no sign of tectonic disturbance.
The flow down the continental slope and rise that would result from the sediment loading in the nepheloid zone would acquire deflection toward the south from the Coriolis force, provid- ing a mechanism for transmitting the sediment toward the Blake-Bahamas outer ridge.
Many questions are suggested by the evidence of widespread occurrence of a nepheloid zone of water at the ocean bottom which is apparently permanent rather than episodic or catastrophic. To what extent do the activities of organ- isms living on the bottom add to it? Is there some influence, such as a stronger bottom current parallel to the foot of each continental rise that sweeps away the nepheloid layer so that the narrow shallow depressions occupied by mod- ern abyssal plains along much of the Atlantic border have been preserved without filling? Does the suspended matter affect the density sufficiently to generate or control the flow of the sus- pension? If so, the effect upon building the lutite component of some of the deep-sea sediment bodies would be to move sediment always down-slope along or near the bottom, and to pro- duce topography of the same kind as that produced by turbidity currents. The pattern of the topography in the Argentine basin, for example, in most respects appears to have been con- trolled by gravity.
As mentioned earlier, at station RC7-1, 0.50 g of suspended lutite was extracted from a 200-liter sample of water taken 160 m above the sea floor. To estimate the effect on density of the water we may take the density of the clay particles at 2.2 g/cm3, neglect effects associated with the finely divided state of the matter, and we find that the density of the suspension is increased by about 2 x 10⁻⁶. Thus the effect of the suspended matter ap- proaches that of a change in tempera- ture of 0.01?C. The curves for the three stations here indicate a roughly exponential decrease in light scattering as distance above bottom increases, with approximately a tenfold change within a few hundred meters of bottom. Hence the effect of suspended matter upon density may be considerably greater at the bottom than at the loca- tion of sample RC7-1.
1293
It follows that the effect of the weight of suspended sediment upon the motion of deeper water masses cannot be neglected in any part of the ocean where the nepheloid zone is present.
MAURICE EWING
Lanmont Geological Observatory, Columbia University, Palisades, New York
EDWARD M. THORNDIKE Lamont Geological Observatory, and Qutteens College, New York
References and Notes
1. K. Kalle, Der Stoffhaushalt des Meeres, Bd. 23, Proble me der Kosnischen Physik (Leipzig, Akademie Verlag, 1945); N. G. Jerlov, Rep. Swedish Deep-Sea Exped. III, fasc. 3, 71 (1953); N. G. Jerlov, in Oceanography and Marine Biology, H. Barnes, Ed. (Allen & Unwin, London, 1963), vol. 1, p. 89; A. P. Lisitzin, Tr. Inst. Okeanol. Akad. Nauk SSSR 19, 204 (1956); M. V. Klenova, V. M. Lavrov, V. K. Nikolayeva, Dokl. Akaid. Nauk SSSR 114, 1153 (1962).
Mathematical models are being used in an increasing number of morphologi- cal studies. In such studies, equations are written which describe in idealized form a morphological character or set of characters common to a group of organisms. Morphological differences can thus be expressed by differences in the values of variables in the equations. One advantage of this approach is that it puts each morphological type in a conceptual framework which makes possible comparison with all other pos- sible types.
Applications of mathematical models to morphological problems have been confined mostly to the description of naturally occurring soecies. Too little use has been made of the fact that the models are equally useful for treating morphological types not found in na- ture. As will be shown, the types that do not occur are important in interpret- ing observed morphology.
The mathematical model used to de- scribe the coiled shell has recently re- ceived particular attention (1-3). Coil- ing is found in such diverse invertebrate groups as the Mollusca (bivalves as well as univalves), Brachiopoda, and Foram- inifera. The coiled shell may be thought of geometrically as a tapered, hollow
1294
2. M. Ewing, in Man, Science, Learning and Education, S. W. Higginbotham, Ed. (Univ. of Chicago Press, Chicago, 1964), pp. 41-59; M. Ewing, W. J. Ludwig, J. 1. Ewing, J. Geophys. Res. 69, 2003 (1964).
3. J. J. Groot and M. Ewing, Science 142, 579 (1963).
4. M. Ewing, A. Vine, J. L. Worzel, J. Opt. Soc. Amer. 36, 307 (1946); E. M. Thorndike, Deep-Sea Res. 5, 234 (1959).
5. D. L. Keach, Nat. Geogr. Mag. 125, 764 (1964).
6. C. O'D. Iselin, Oceatnus 10, No. 1, 4 (1963). 7. G. Wtist, Wiss. Ergebn. Deut. Atlant. Exped.
'Meteor,' 1925-1927, 6, TI. 1 (Berlin, 1936). 8. F. C. Fuglister, Atlantic Ocean Atlas of Tenm-
perature and Salinity Profiles and Data from the International Geophysical Year 1957-58, vol. 1 (Woods Hole Oceanographic Institu- tion, Woods Hole, Mass., 1960).
9. The advice of Arnold Gordon about the pres- ent status of observations of the Gulf Stream countercurrent is gratefully acknowledged.
10. We acknowledge the contribution of those who made the observations on Robert D. Conrad voyages 8 and 9: Charles Fray, Marek Truchan, Phillip Rabinowitz, James Heirtzler, and Thomas Aitken. This research was supported by the Office of Naval Re- search. Lamont Geological Observatory (Co- lumbia University) Contribution No. 787.
12 January 1965 II
tube, open at the larger end and coiled about a fixed axis. During growth, addi- tion of shell material takes place prin- cipally at the margin of the open end.
Within this framework, shell form can be expressed in terms of several variables (3). The four most important are: the shape of the generating curve (s) (equivalent to the cross-sectional shape of the tube) (4), the rate of in- crease in the size of the generating curve per revolution (w), the distance between the generating curve and the coiling axis (d), and the rate of movement or
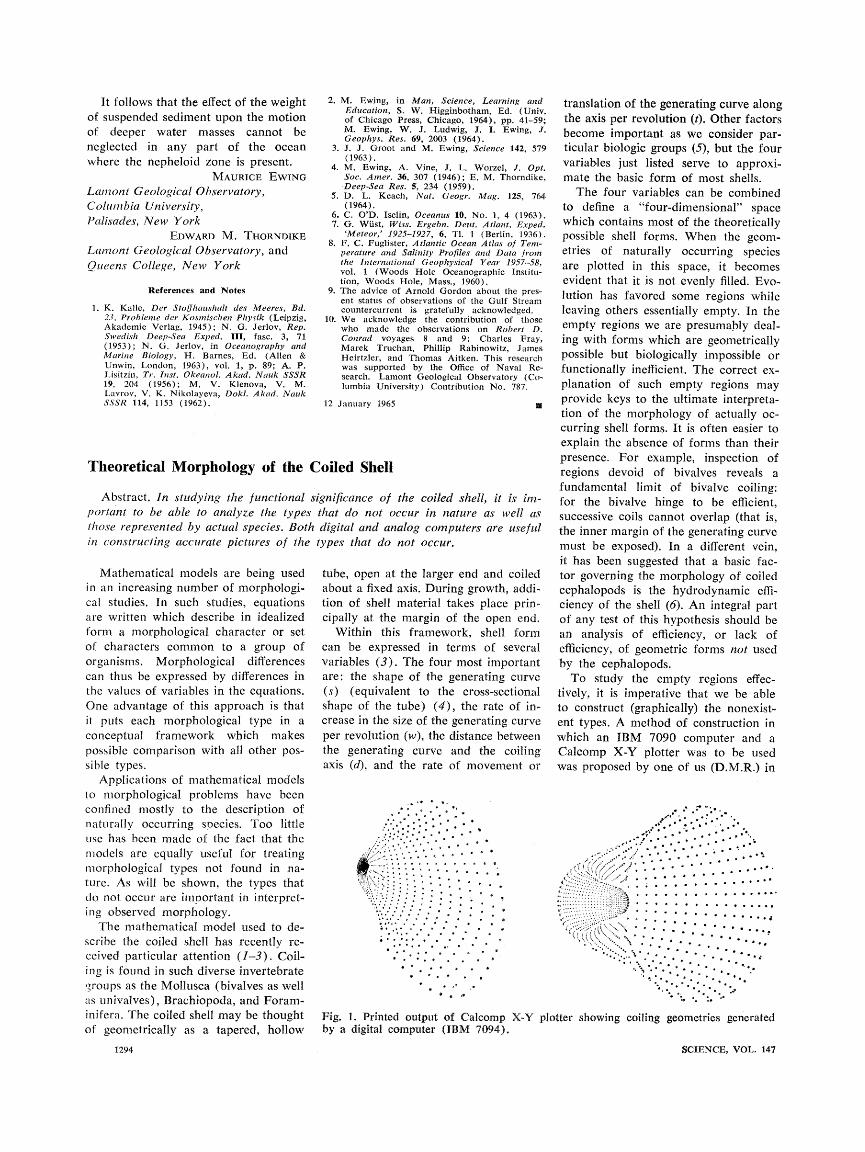
Fig. 1. Printed output of Calcomp X-Y by a digital computer (IBM 7094).
tube, open at the larger end and coiled about a fixed axis. During growth, addi- tion of shell material takes place prin- cipally at the margin of the open end.
Within this framework, shell form can be expressed in terms of several variables (3). The four most important are: the shape of the generating curve (s) (equivalent to the cross-sectional shape of the tube) (4), the rate of in- crease in the size of the generating curve per revolution (w), the distance between the generating curve and the coiling axis (d), and the rate of movement or
Fig. 1. Printed output of Calcomp X-Y by a digital computer (IBM 7094).
translation of the generating curve along the axis per revolution (t). Other factors become important as we consider par- ticular biologic groups (5), but the four variables just listed serve to approxi- mate the basic form of most shells.
The four variables can be combined to define a "four-dimensional" space which contains most of the theoretically possible shell forms. When the geom- etries of naturally occurring species are plotted in this space, it becomes evident that it is not evenly filled. Evo- lution has favored some regions while leaving others essentially empty. In the empty regions we are presumably deal- ing with forms which are geometrically possible but biologically impossible or functionally inefficient. The correct ex- planation of such empty regions may provide keys to the ultimate interpreta- tion of the morphology of actually oc- curring shell forms. It is often easier to explain the absence of forms than their presence. For example, inspection of regions devoid of bivalves reveals a fundamental limit of bivalve coiling: for the bivalve hinge to be efficient, successive coils cannot overlap (that is, the inner margin of the generating curve must be exposed). In a different vein, it has been suggested that a basic fac- tor governing the morphology of coiled cephalopods is the hydrodynamic effi- ciency of the shell (6). An integral part of any test of this hypothesis should be an analysis of efficiency, or lack of efficiency, of geometric forms not used by the cephalopods.
To study the empty regions effec- tively, it is imperative that we be able to construct (graphically) the nonexist- ent types. A method of construction in which an IBM 7090 computer and a Calcomp X-Y plotter was to be used was proposed by one of us (D.M.R.) in
X '?w.' ' ..*;'.'..,".
plotter showing coiling geometries generated plotter showing coiling geometries generated
SCIENCE, VOL. 147 SCIENCE, VOL. 147
Theoretical Morphology of the Coiled Shell
Abstract. In studying the functional significance of the coiled shell, it is im- portant to be able to analyze the types that do not occur in nature as well as those represented by actual species. Both digital and analog computers are useful in constructing accurate pictures of the types that do not occur.
0
D,
0
D,