susan randolph university of connecticut social & economic rights fulfillment index holding...
TRANSCRIPT
S u s a n R a n d o l p hU n i v e r s i t y o f C o n n e c ti c u t
Social & Economic Rights Fulfillment Index
Holding Governments Accountable
Social Watch International Assembly, July 2011

The Economic & Social Rights Empowerment Initiative
www.serfindex.org
Social Watch International Assembly, July 2011
The SERF Index Approach
SERF Index MethodologyCore & High Income Country SERF IndexHistorical SERF IndexApplication to the USA
Social Watch International Assembly, July 2011
The SERF Index Methodology
Social Watch International Assembly, July 2011
General Approach
Principle of progressive realizationcountries commit maximum of available resources to fulfill economic and social rights.
Zi = right enjoyment level / state obligation level
Socio-economic indicators assess enjoyment Achievement Possibility Frontiers assess state capacity
Social Watch International Assembly, July 2011
Measuring Rights Enjoyment
For each substantive right the right to food, right to adequate shelter, right to health care, right to education, Right to decent work, right to social security.
Identify socio-economic indicators reflecting relevant aspects of right Objective survey based data
Social Watch International Assembly, July 2011
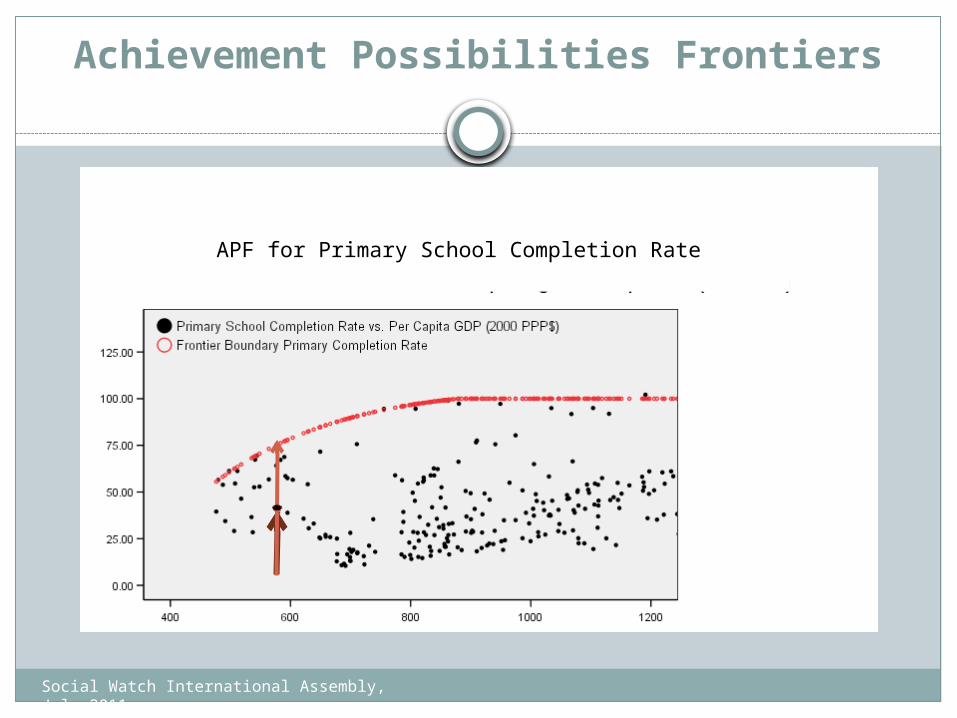
Achievement Possibilities Frontiers
APF for Primary School Completion Rate
Social Watch International Assembly, July 2011
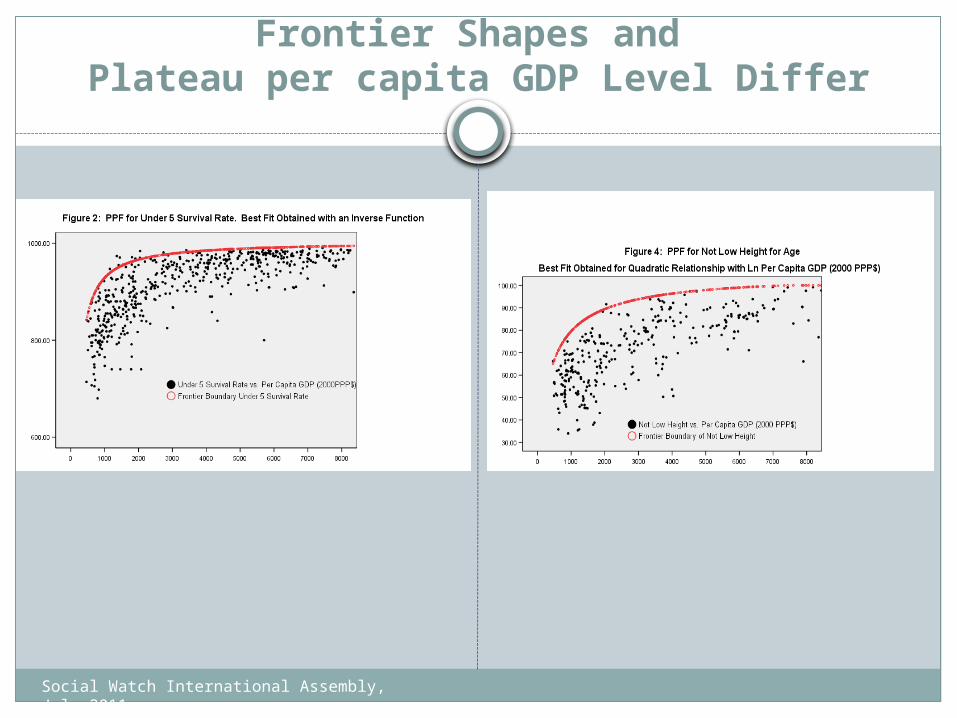
Frontier Shapes and Plateau per capita GDP Level Differ
Social Watch International Assembly, July 2011
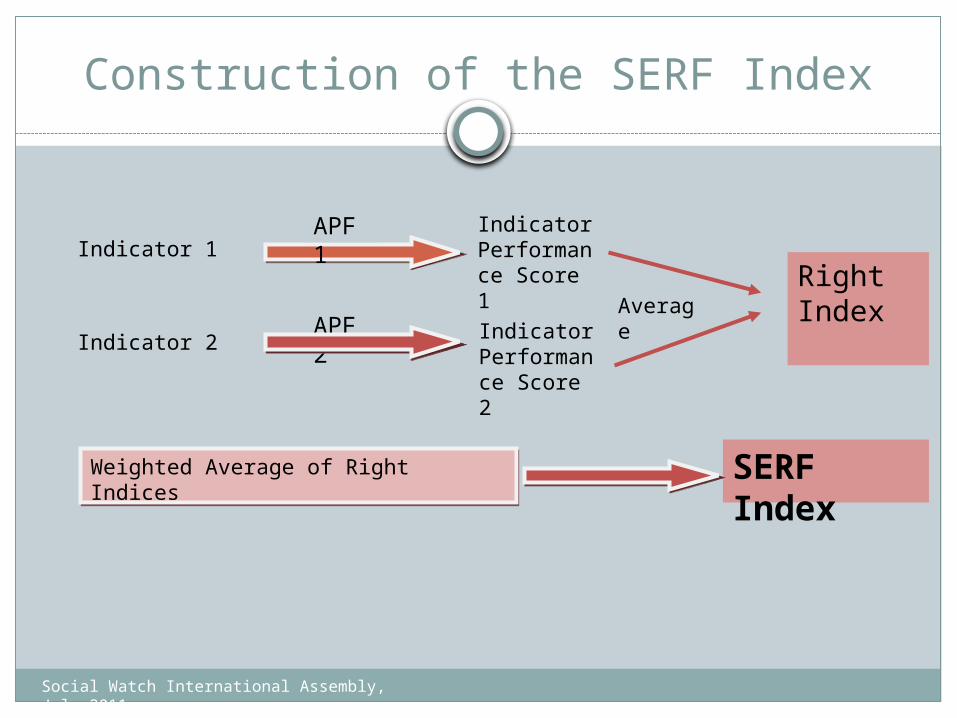
Construction of the SERF Index
Indicator Performance Score 2
APF 2Indicator 2
Indicator 1 Indicator Performance Score 1
APF 1
Right IndexAverage
SERF IndexWeighted Average of Right IndicesWeighted Average of Right Indices
Social Watch International Assembly, July 2011
Core & High Income Country SERF Indices
Social Watch International Assembly, July 2011
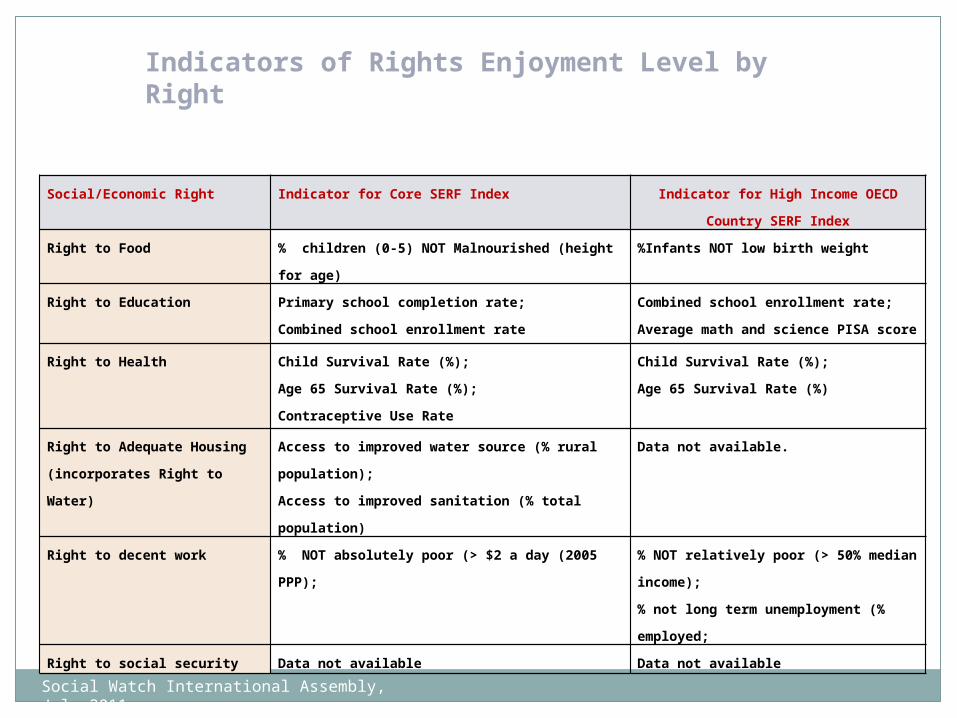
Social/Economic Right Indicator for Core SERF Index Indicator for High Income OECD Country SERF
Index
Right to Food % children (0-5) NOT Malnourished (height for age) %Infants NOT low birth weight
Right to Education Primary school completion rate;
Combined school enrollment rate
Combined school enrollment rate;
Average math and science PISA score
Right to Health Child Survival Rate (%);
Age 65 Survival Rate (%);
Contraceptive Use Rate
Child Survival Rate (%);
Age 65 Survival Rate (%)
Right to Adequate Housing
(incorporates Right to Water)
Access to improved water source (% rural population);
Access to improved sanitation (% total population)
Data not available.
Right to decent work % NOT absolutely poor (> $2 a day (2005 PPP); % NOT relatively poor (> 50% median income);
% not long term unemployment (% employed;
Right to social security Data not available Data not available
Indicators of Rights Enjoyment Level by Right
Social Watch International Assembly, July 2011
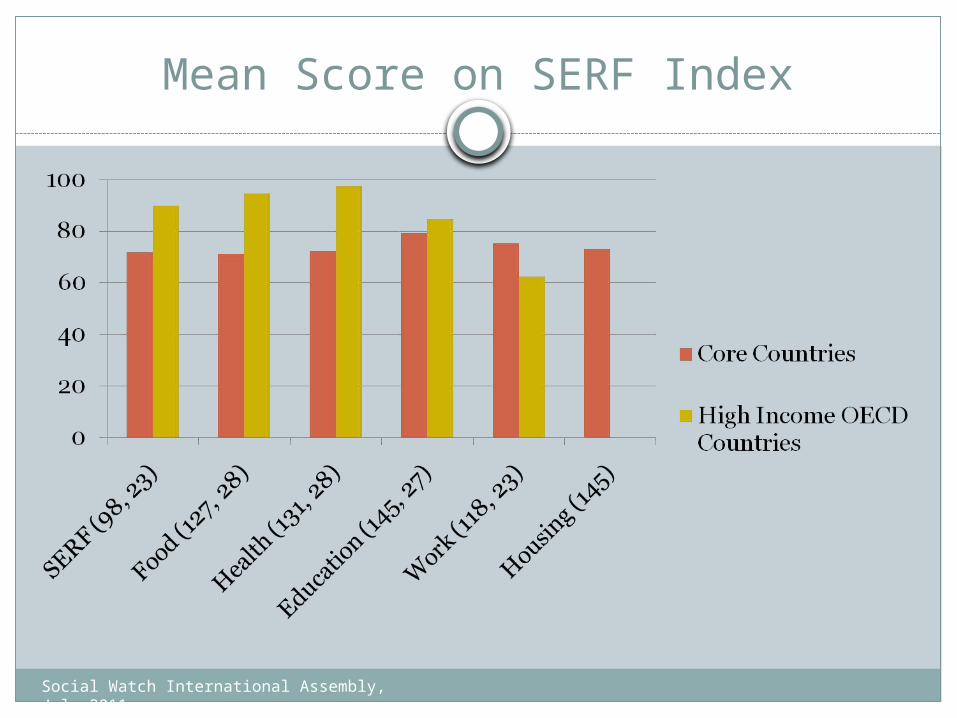
Mean Score on SERF Index
Social Watch International Assembly, July 2011
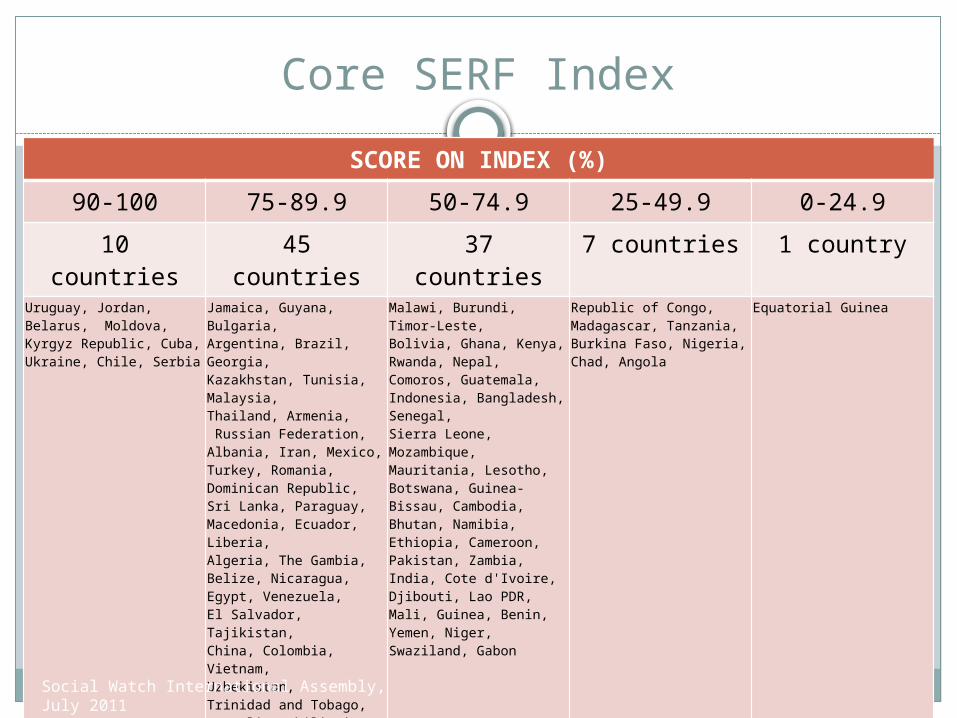
Core SERF Index
SCORE ON INDEX (%)
90-100 75-89.9 50-74.9 25-49.9 0-24.9
10 countries 45 countries 37 countries 7 countries 1 countryUruguay, Jordan, Belarus, Moldova, Kyrgyz Republic, Cuba, Ukraine, Chile, Serbia
Jamaica, Guyana, Bulgaria, Argentina, Brazil, Georgia, Kazakhstan, Tunisia, Malaysia, Thailand, Armenia, Russian Federation, Albania, Iran, Mexico, Turkey, Romania, Dominican Republic, Sri Lanka, Paraguay, Macedonia, Ecuador, Liberia, Algeria, The Gambia, Belize, Nicaragua, Egypt, Venezuela, El Salvador, Tajikistan, China, Colombia, Vietnam, Uzbekistan, Trinidad and Tobago, Mongolia, Philippines, Suriname, Morocco, Honduras, Togo, Azerbaijan, Peru, Dem. Rep. of Congo
Malawi, Burundi, Timor-Leste, Bolivia, Ghana, Kenya, Rwanda, Nepal, Comoros, Guatemala, Indonesia, Bangladesh, Senegal, Sierra Leone, Mozambique, Mauritania, Lesotho, Botswana, Guinea-Bissau, Cambodia, Bhutan, Namibia, Ethiopia, Cameroon, Pakistan, Zambia, India, Cote d'Ivoire, Djibouti, Lao PDR, Mali, Guinea, Benin, Yemen, Niger, Swaziland, Gabon
Republic of Congo, Madagascar, Tanzania, Burkina Faso, Nigeria, Chad, Angola
Equatorial Guinea
Social Watch International Assembly, July 2011
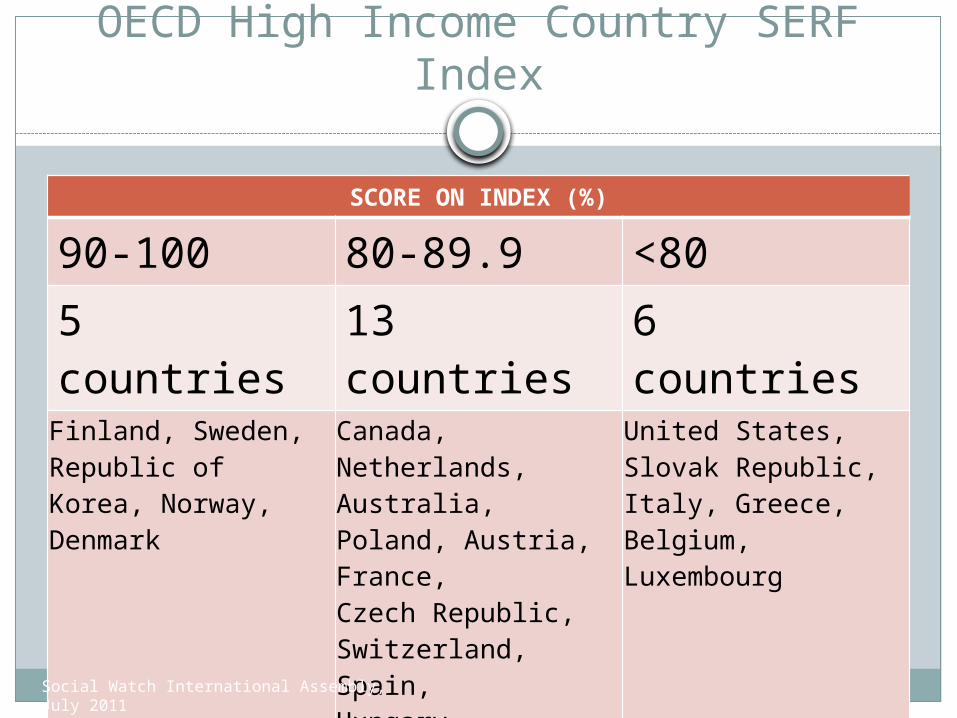
OECD High Income Country SERF Index
SCORE ON INDEX (%)
90-100 80-89.9 <805 countries 13
countries6 countries
Finland, Sweden, Republic of Korea, Norway, Denmark
Canada, Netherlands, Australia, Poland, Austria, France, Czech Republic, Switzerland, Spain, Hungary, United Kingdom, Ireland, Belgium
United States, Slovak Republic, Italy, Greece, Belgium, Luxembourg
Social Watch International Assembly, July 2011
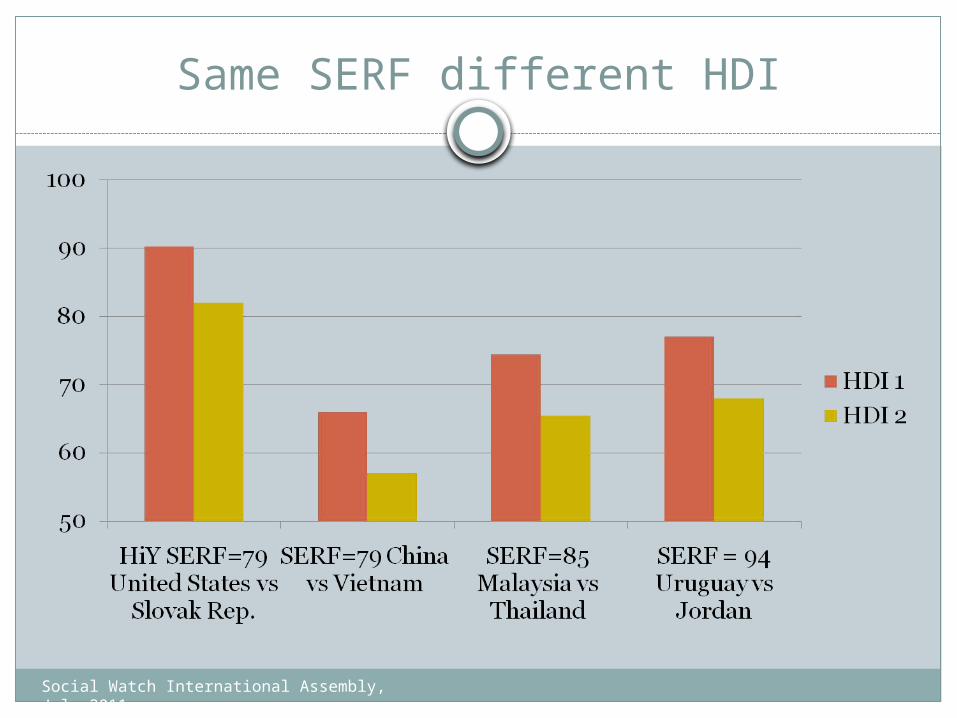
Same SERF different HDI
Social Watch International Assembly, July 2011

WITHPATRICK GUYER
Historical SERF Index
Social Watch International Assembly, July 2011
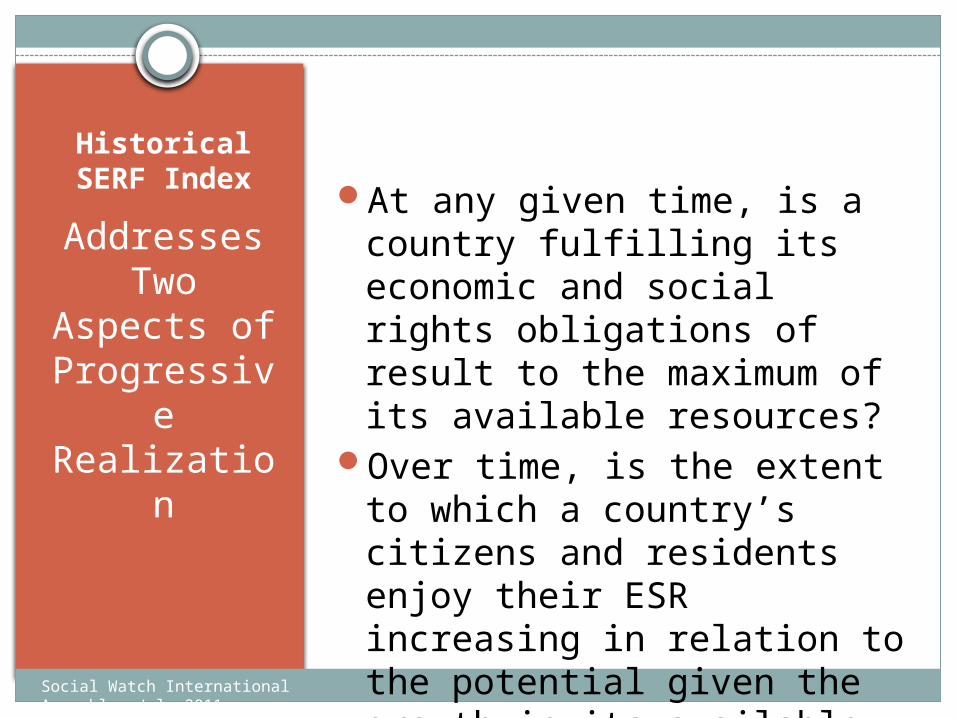
Historical SERF Index
Addresses Two
Aspects of Progressive Realization
At any given time, is a country fulfilling its economic and social rights obligations of result to the maximum of its available resources?
Over time, is the extent to which a country’s citizens and residents enjoy their ESR increasing in relation to the potential given the growth in its available resources?
Social Watch International Assembly, July 2011
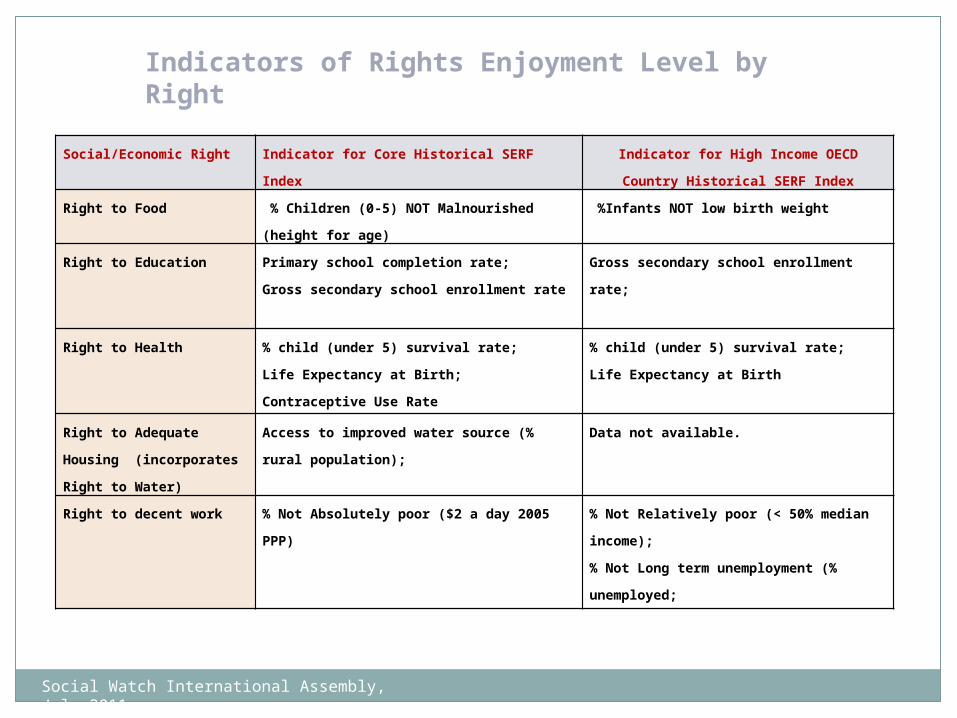
Social/Economic Right Indicator for Core Historical SERF Index Indicator for High Income OECD Country
Historical SERF Index
Right to Food % Children (0-5) NOT Malnourished (height for age) %Infants NOT low birth weight
Right to Education Primary school completion rate;
Gross secondary school enrollment rate
Gross secondary school enrollment rate;
Right to Health % child (under 5) survival rate;
Life Expectancy at Birth;
Contraceptive Use Rate
% child (under 5) survival rate;
Life Expectancy at Birth
Right to Adequate Housing
(incorporates Right to Water)
Access to improved water source (% rural population); Data not available.
Right to decent work % Not Absolutely poor ($2 a day 2005 PPP) % Not Relatively poor (< 50% median income);
% Not Long term unemployment (% unemployed;
Indicators of Rights Enjoyment Level by Right
Social Watch International Assembly, July 2011
Historical SERF Index
Four Waves Wave 1: 1971-1980 Wave 2: 1981 – 1990 Wave 3: 1991-2000 Wave 4: 2001 – 2010
Results Trends in average performance Variation in performance Relationship between ESR fulfillment & per capita
income growth
Social Watch International Assembly, July 2011
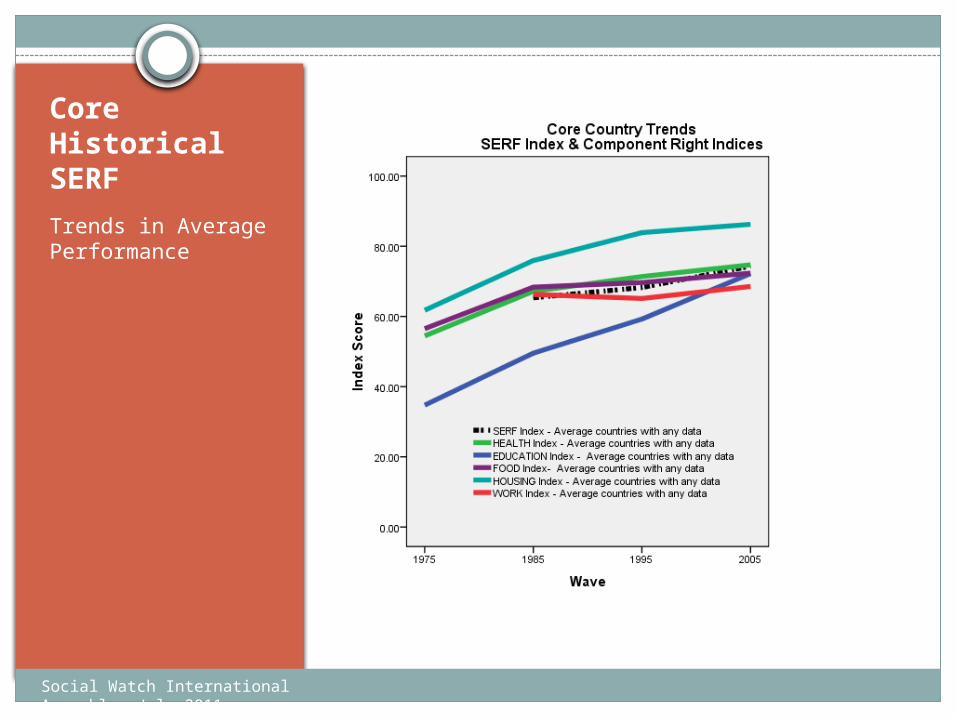
Core Historical SERF
Trends in Average Performance
Social Watch International Assembly, July 2011

Core Education Index Trends
Social Watch International Assembly, July 2011
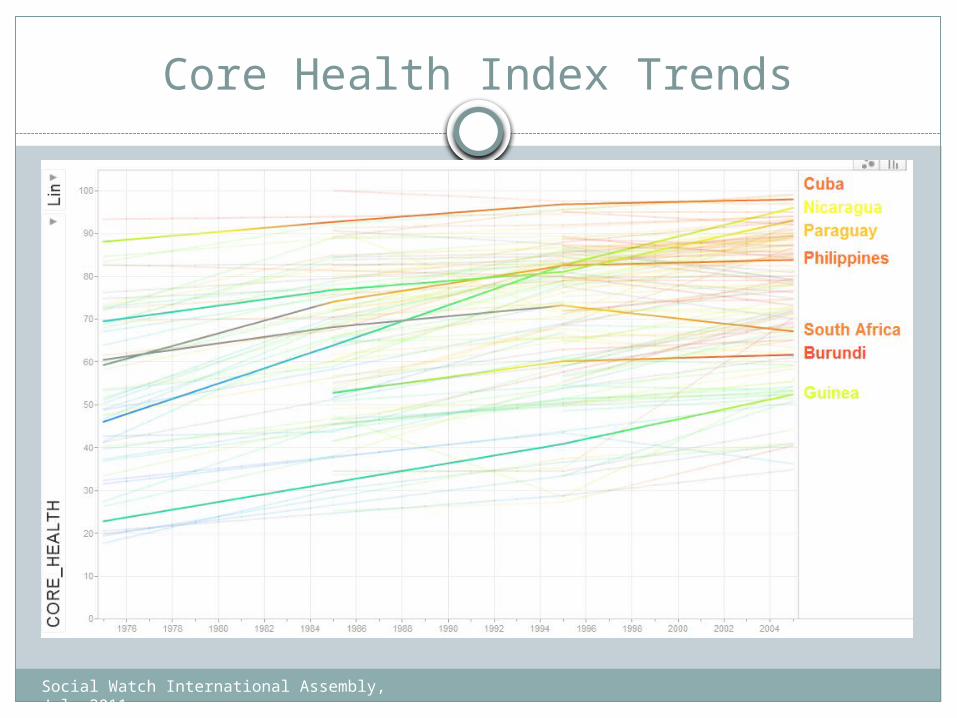
Core Health Index Trends
Social Watch International Assembly, July 2011
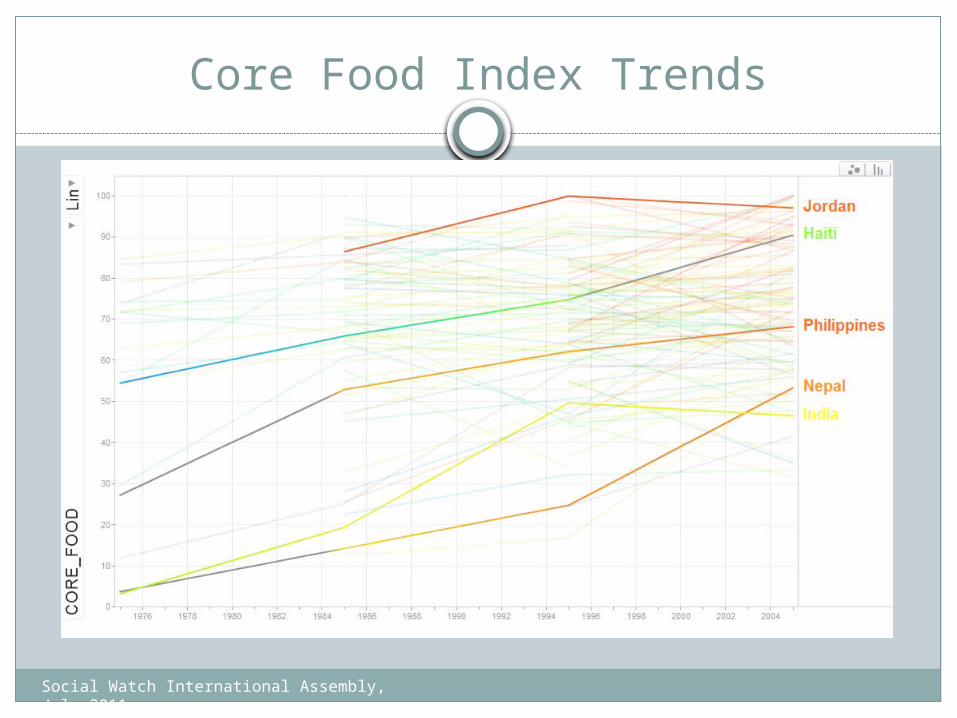
Core Food Index Trends
Social Watch International Assembly, July 2011
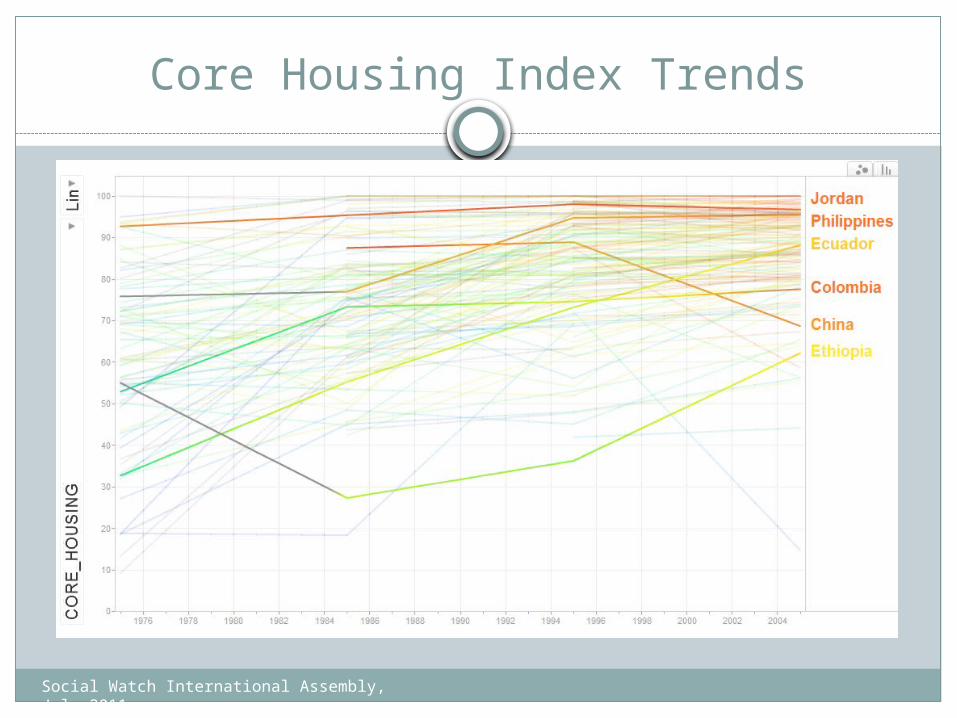
Core Housing Index Trends
Social Watch International Assembly, July 2011
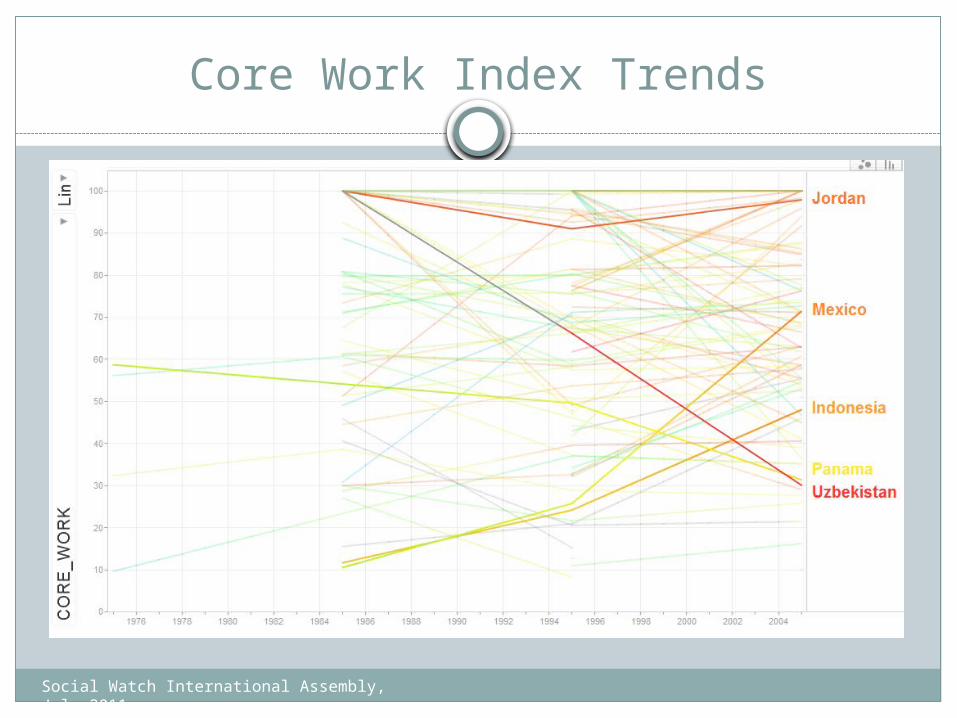
Core Work Index Trends
Social Watch International Assembly, July 2011
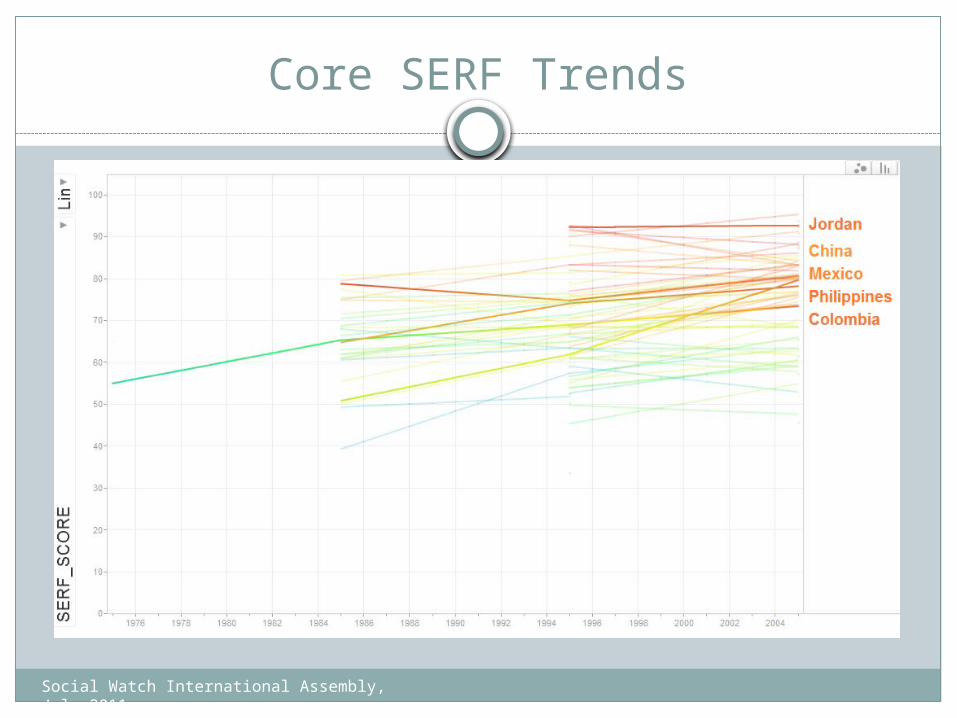
Core SERF Trends
Social Watch International Assembly, July 2011
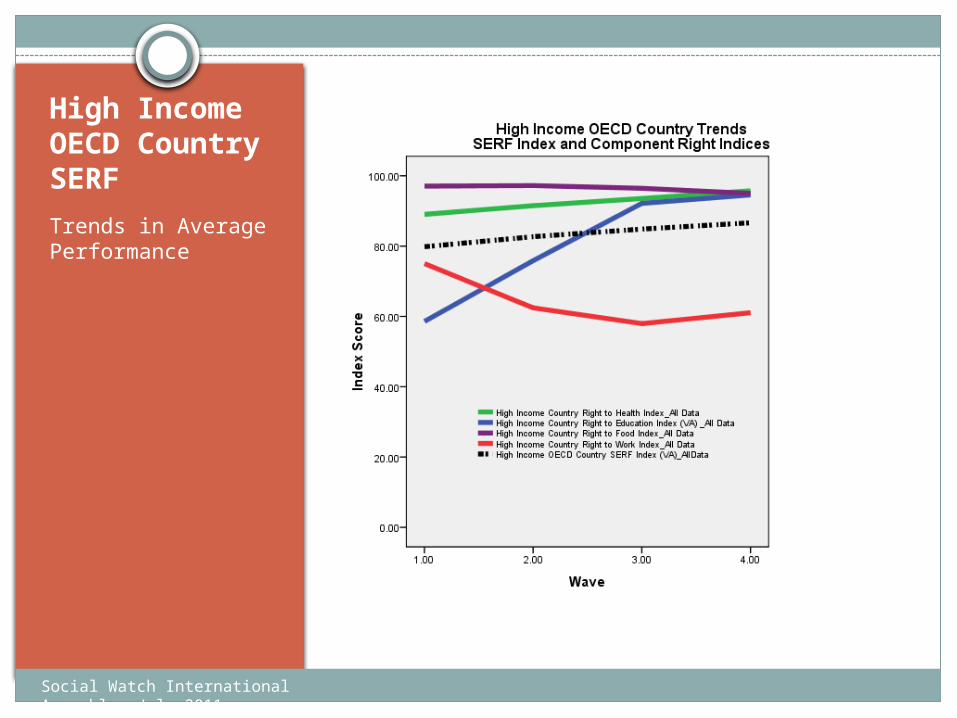
High Income OECD Country SERF
Trends in Average Performance
Social Watch International Assembly, July 2011
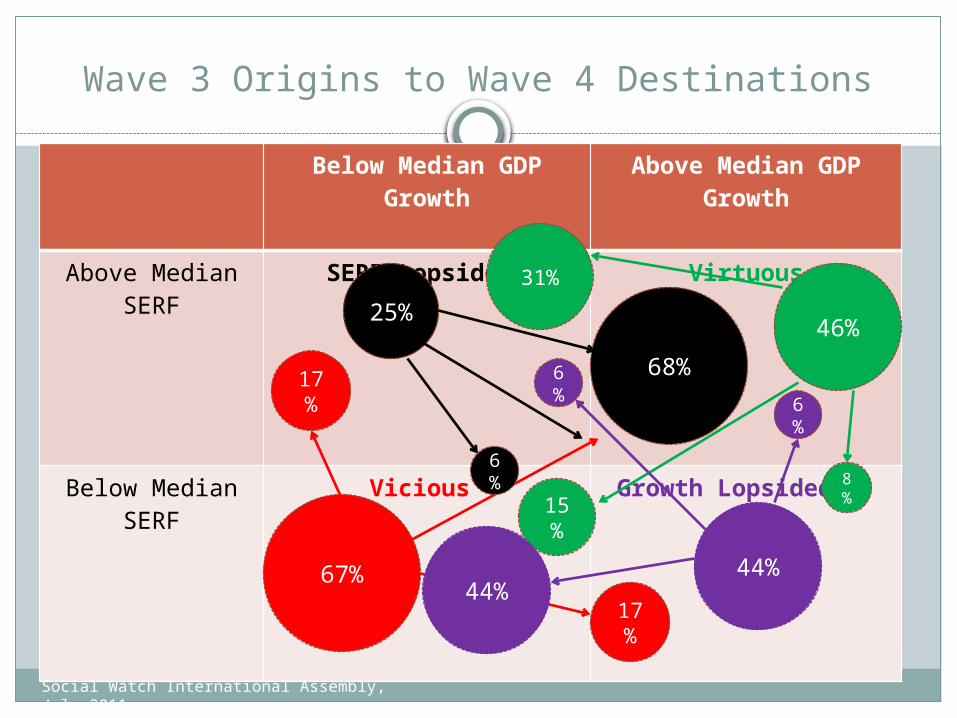
Wave 3 Origins to Wave 4 Destinations
Below Median GDP Growth
Above Median GDP Growth
Above Median SERF
SERF Lopsided Virtuous
Below Median SERF
Vicious Growth Lopsided
67%
17%
17%
46%25%
44%
31%
15%
8%
6%
44%
6%
68%
6%
Social Watch International Assembly, July 2011
WITHMICHELLE PRAIRIE
&JOHN STEWART
Application to the United States
Social Watch International Assembly, July 2011
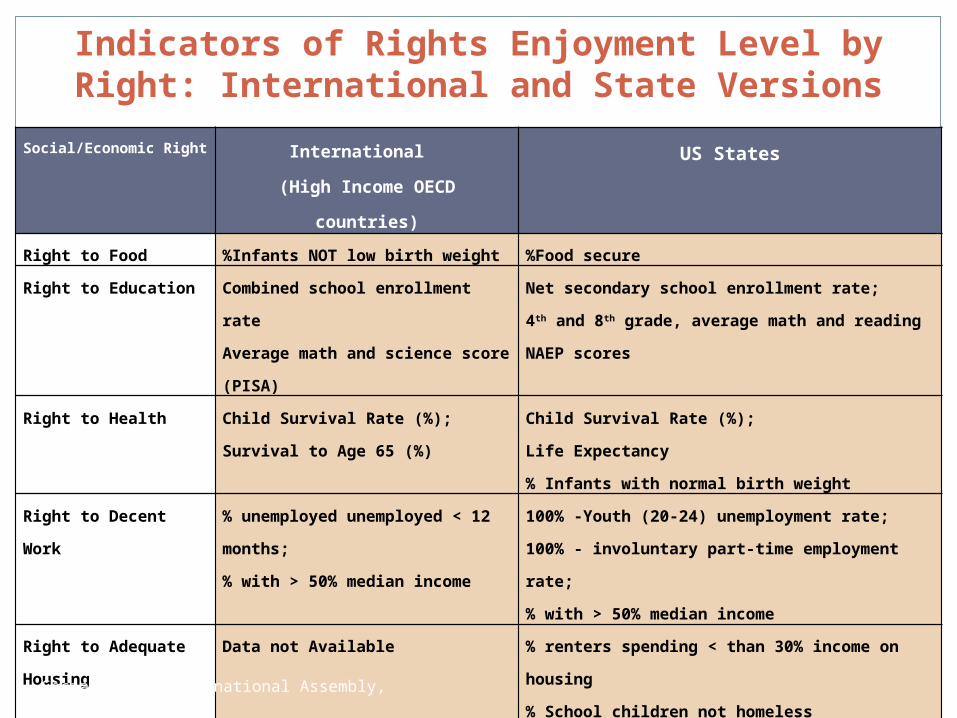
Social/Economic Right International (High Income OECD countries)
US States
Right to Food %Infants NOT low birth weight %Food secure
Right to Education Combined school enrollment rateAverage math and science score (PISA)
Net secondary school enrollment rate;4th and 8th grade, average math and reading NAEP scores
Right to Health Child Survival Rate (%);Survival to Age 65 (%)
Child Survival Rate (%);Life Expectancy% Infants with normal birth weight
Right to Decent Work % unemployed unemployed < 12 months; % with > 50% median income
100% -Youth (20-24) unemployment rate;100% - involuntary part-time employment rate;% with > 50% median income
Right to Adequate Housing Data not Available % renters spending < than 30% income on housing% School children not homeless
Right to Social Security Data not available % with Health Insurance% NOT Absolutely poor (US Standard)
Right to Equality and Non-discrimination
Data disaggregated by sex and racial/ethnic group
Indicators of Rights Enjoyment Level by Right: International and State Versions
Social Watch International Assembly, July 2011
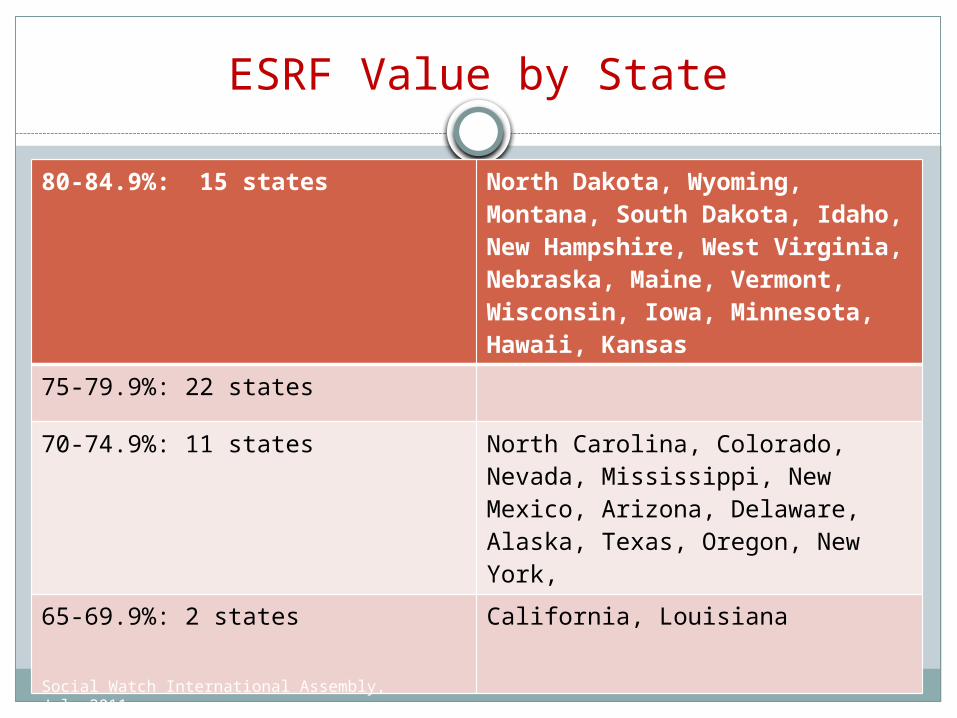
ESRF Value by State
80-84.9%: 15 states North Dakota, Wyoming, Montana, South Dakota, Idaho, New Hampshire, West Virginia, Nebraska, Maine, Vermont, Wisconsin, Iowa, Minnesota, Hawaii, Kansas
75-79.9%: 22 states
70-74.9%: 11 states North Carolina, Colorado, Nevada, Mississippi, New Mexico, Arizona, Delaware, Alaska, Texas, Oregon, New York,
65-69.9%: 2 states California, Louisiana
Social Watch International Assembly, July 2011

Social Watch International Assembly, July 2011
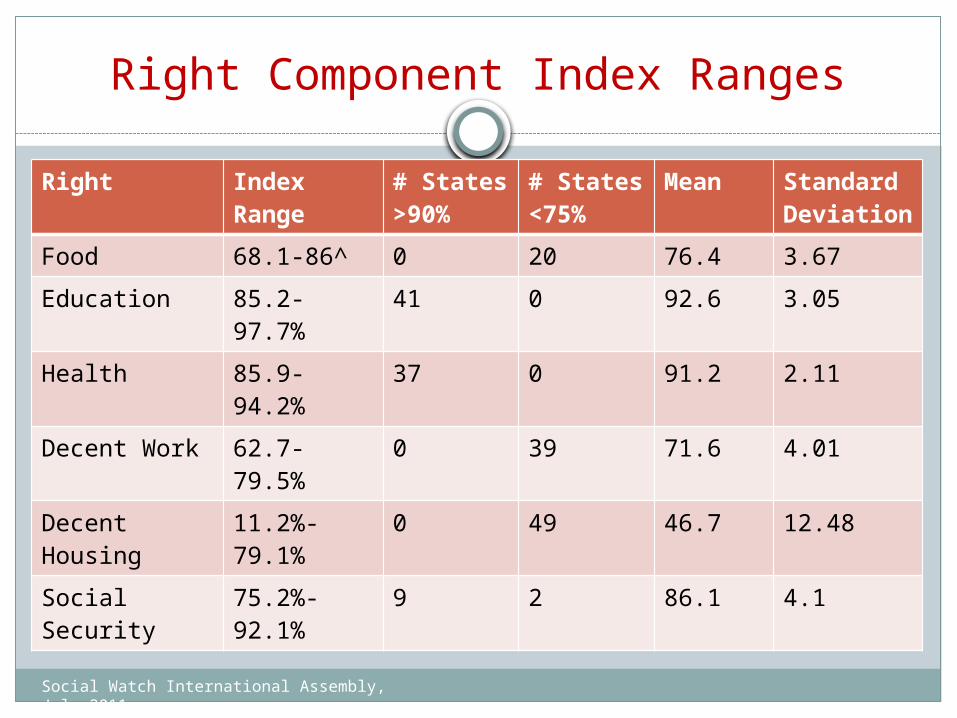
Right Component Index Ranges
Right Index Range
# States >90%
# States <75%
Mean Standard Deviation
Food 68.1-86^ 0 20 76.4 3.67
Education 85.2-97.7% 41 0 92.6 3.05
Health 85.9-94.2% 37 0 91.2 2.11
Decent Work 62.7-79.5% 0 39 71.6 4.01
Decent Housing
11.2%-79.1%
0 49 46.7 12.48
Social Security
75.2%-92.1%
9 2 86.1 4.1
Social Watch International Assembly, July 2011
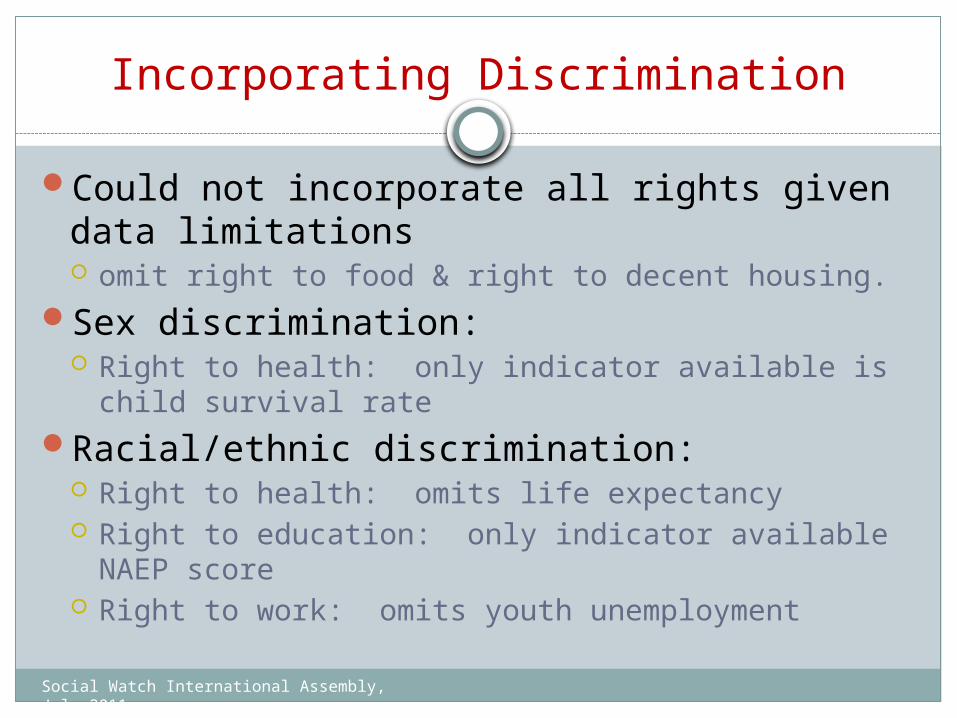
Incorporating Discrimination
Could not incorporate all rights given data limitations omit right to food & right to decent housing.
Sex discrimination: Right to health: only indicator available is child
survival rateRacial/ethnic discrimination:
Right to health: omits life expectancy Right to education: only indicator available NAEP
score Right to work: omits youth unemployment
Social Watch International Assembly, July 2011
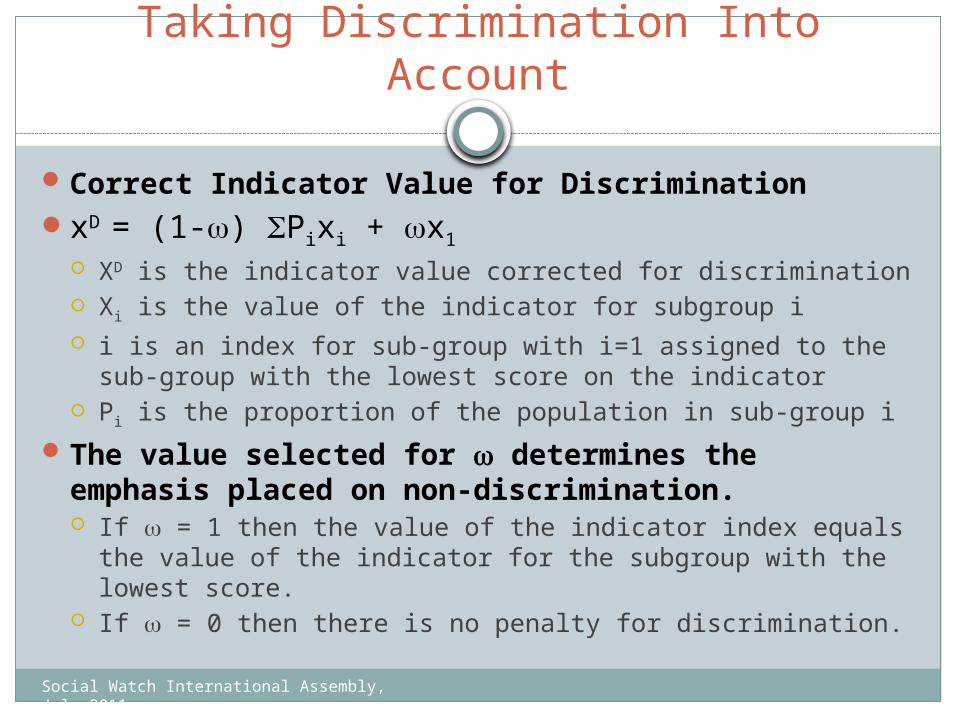
Taking Discrimination Into Account
Correct Indicator Value for DiscriminationxD = (1-w) SPixi + wx1
XD is the indicator value corrected for discrimination Xi is the value of the indicator for subgroup i i is an index for sub-group with i=1 assigned to the sub-group with the lowest
score on the indicator Pi is the proportion of the population in sub-group i
The value selected for w determines the emphasis placed on non-discrimination. If w = 1 then the value of the indicator index equals the value of the indicator
for the subgroup with the lowest score. If w = 0 then there is no penalty for discrimination.
Social Watch International Assembly, July 2011
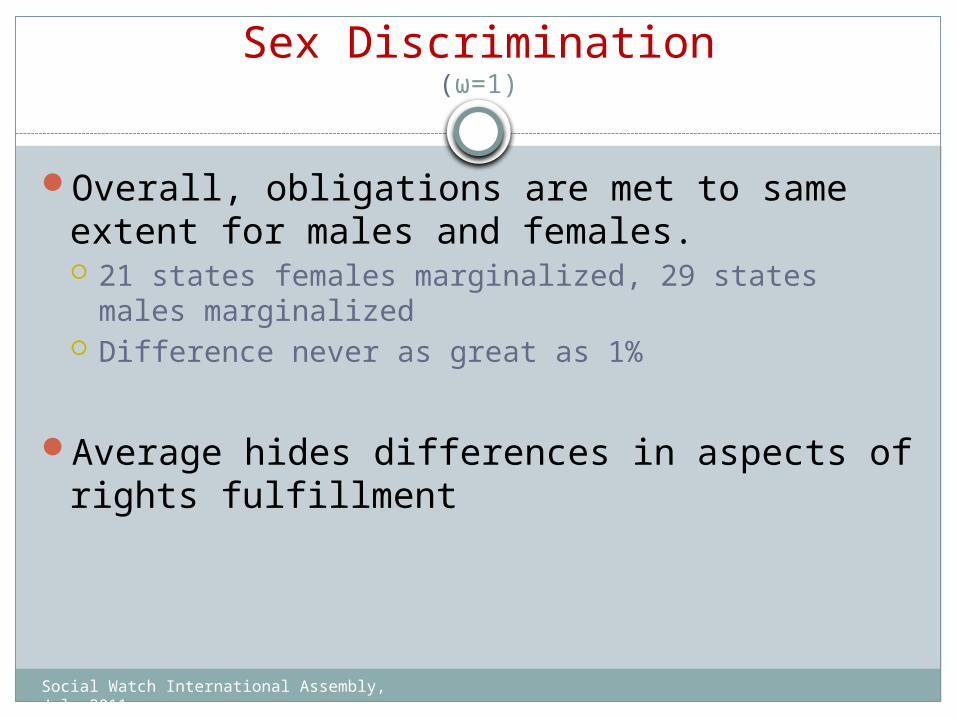
Sex Discrimination(ω=1)
Overall, obligations are met to same extent for males and females. 21 states females marginalized, 29 states males
marginalized Difference never as great as 1%
Average hides differences in aspects of rights fulfillment
Social Watch International Assembly, July 2011
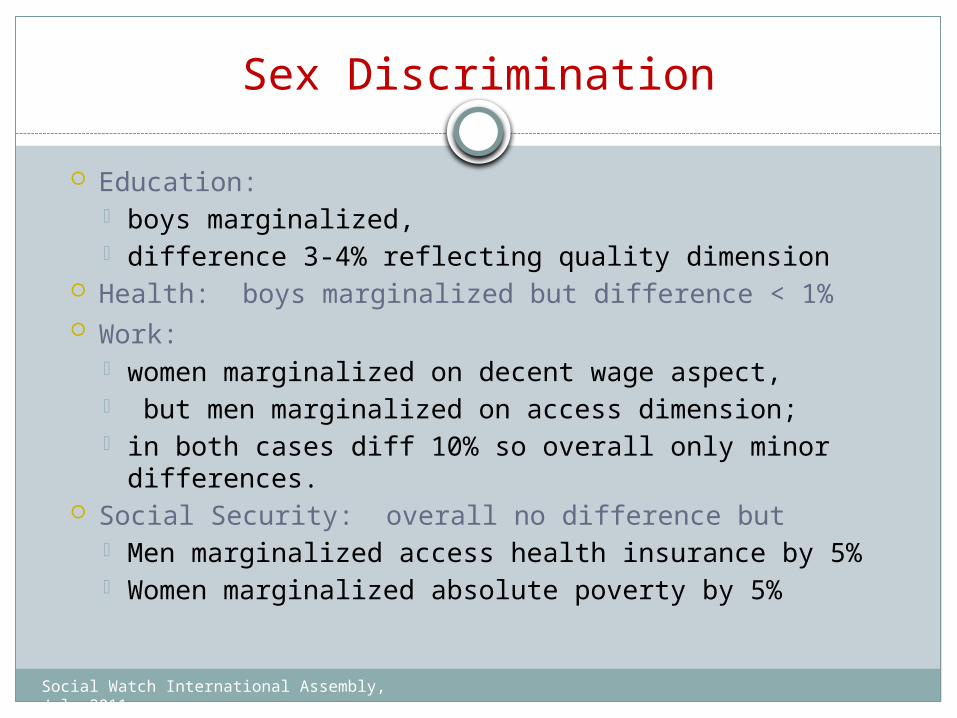
Sex Discrimination
Education: boys marginalized, difference 3-4% reflecting quality dimension
Health: boys marginalized but difference < 1% Work:
women marginalized on decent wage aspect, but men marginalized on access dimension; in both cases diff 10% so overall only minor differences.
Social Security: overall no difference but Men marginalized access health insurance by 5% Women marginalized absolute poverty by 5%
Social Watch International Assembly, July 2011
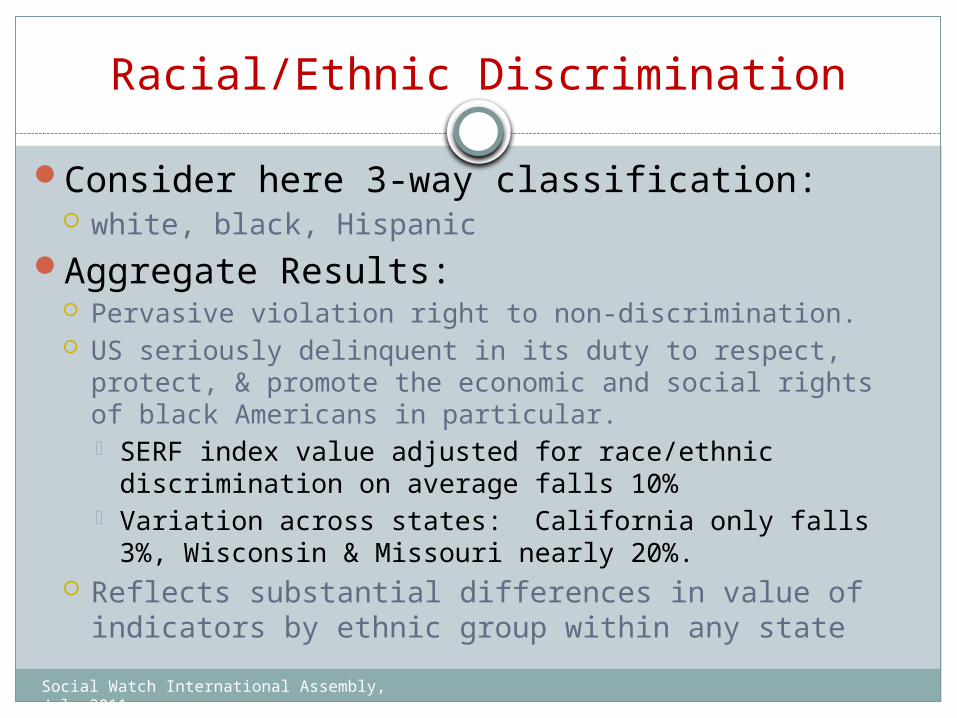
Racial/Ethnic Discrimination
Consider here 3-way classification: white, black, Hispanic
Aggregate Results: Pervasive violation right to non-discrimination. US seriously delinquent in its duty to respect, protect, &
promote the economic and social rights of black Americans in particular. SERF index value adjusted for race/ethnic discrimination
on average falls 10% Variation across states: California only falls 3%,
Wisconsin & Missouri nearly 20%. Reflects substantial differences in value of indicators
by ethnic group within any state
Social Watch International Assembly, July 2011
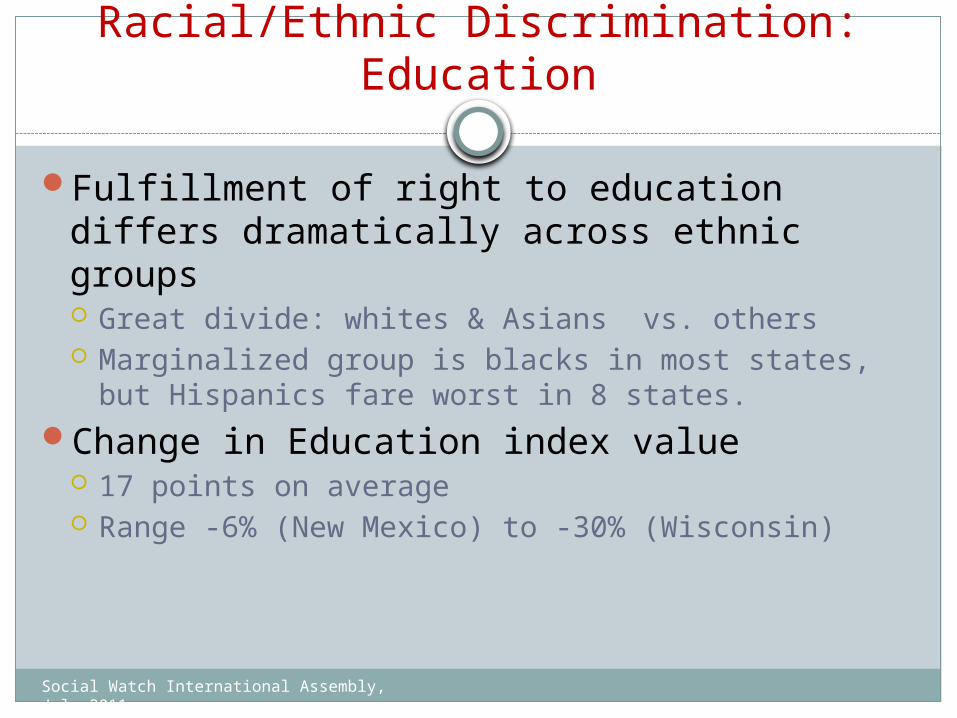
Racial/Ethnic Discrimination: Education
Fulfillment of right to education differs dramatically across ethnic groups Great divide: whites & Asians vs. others Marginalized group is blacks in most states, but
Hispanics fare worst in 8 states.Change in Education index value
17 points on average Range -6% (New Mexico) to -30% (Wisconsin)
Social Watch International Assembly, July 2011
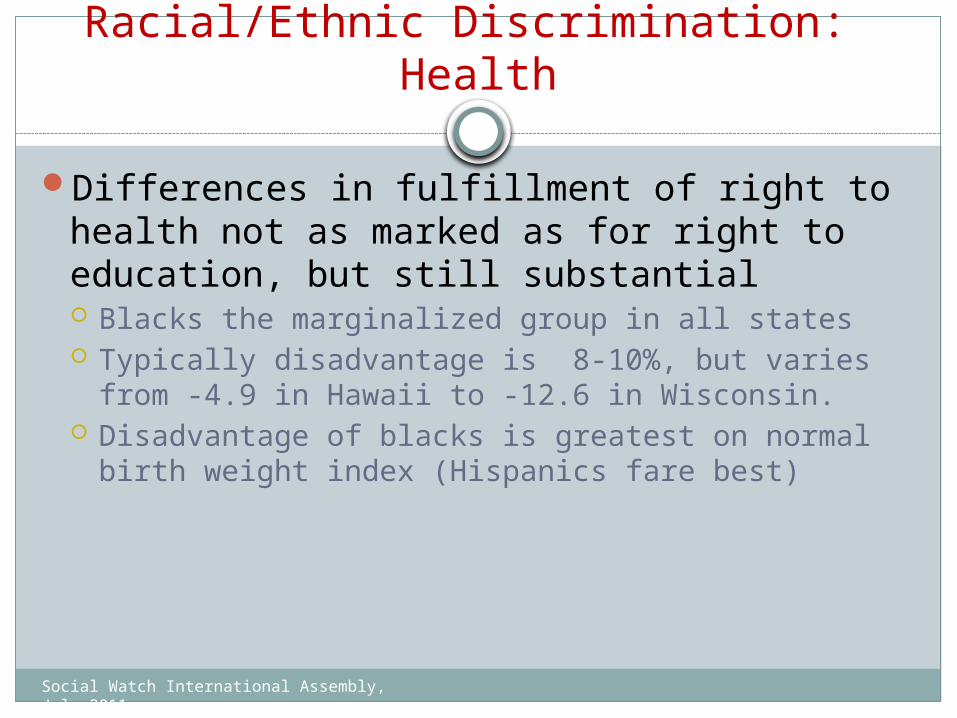
Racial/Ethnic Discrimination: Health
Differences in fulfillment of right to health not as marked as for right to education, but still substantial Blacks the marginalized group in all states Typically disadvantage is 8-10%, but varies from -4.9
in Hawaii to -12.6 in Wisconsin. Disadvantage of blacks is greatest on normal birth
weight index (Hispanics fare best)
Social Watch International Assembly, July 2011
Racial/Ethnic Discrimination: Decent Work
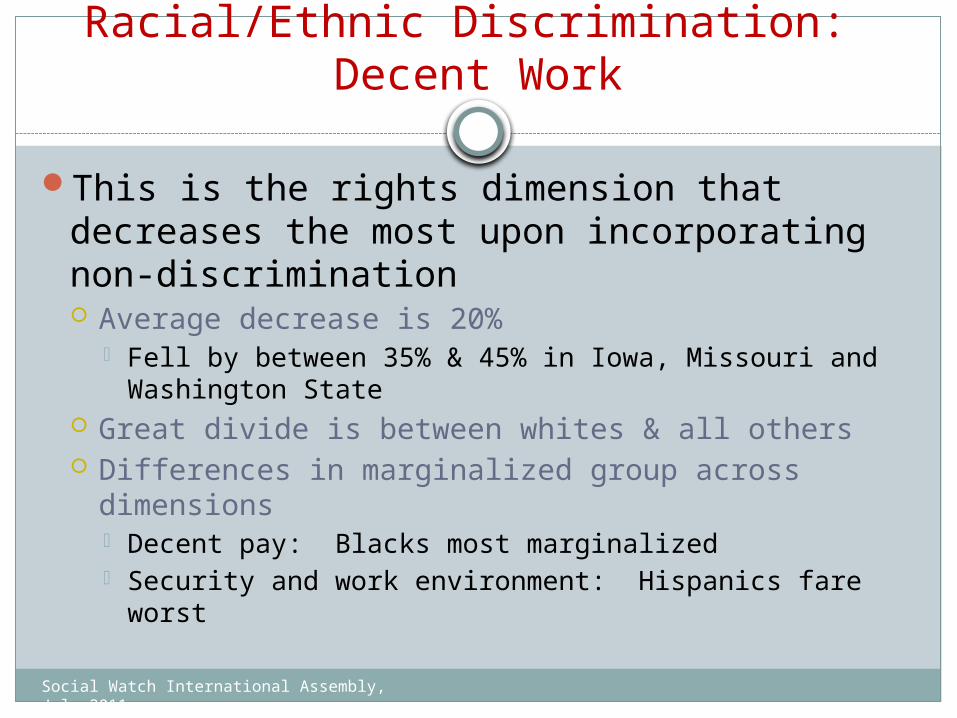
This is the rights dimension that decreases the most upon incorporating non-discrimination Average decrease is 20%
Fell by between 35% & 45% in Iowa, Missouri and Washington State
Great divide is between whites & all others Differences in marginalized group across dimensions
Decent pay: Blacks most marginalized Security and work environment: Hispanics fare worst
Social Watch International Assembly, July 2011
Racial/Ethnic Discrimination: Social Security
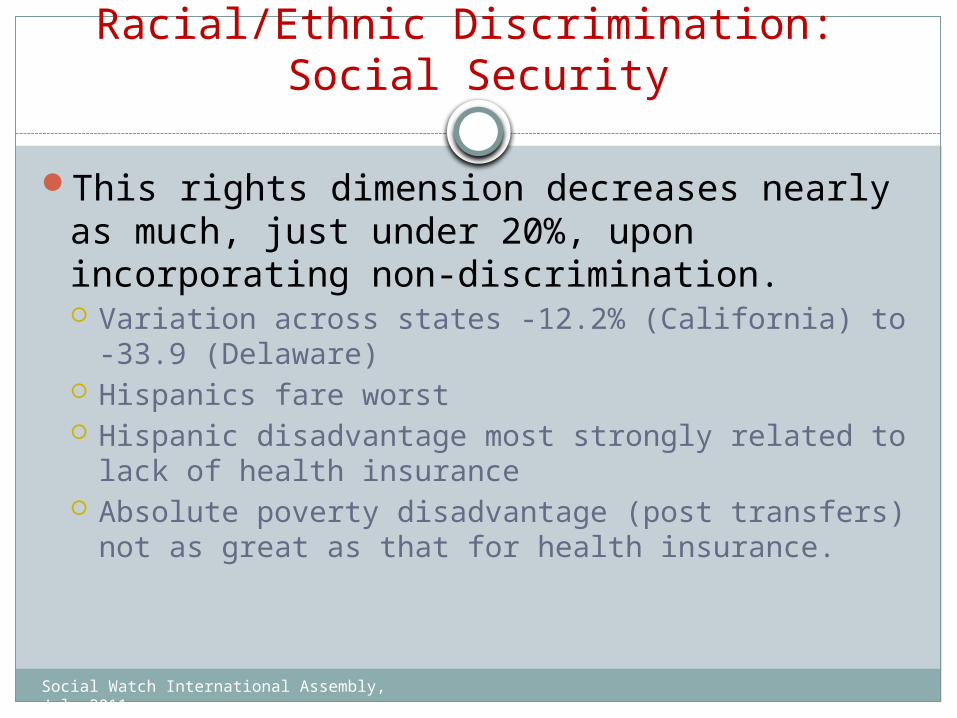
This rights dimension decreases nearly as much, just under 20%, upon incorporating non-discrimination. Variation across states -12.2% (California) to -33.9
(Delaware) Hispanics fare worst Hispanic disadvantage most strongly related to lack of
health insurance Absolute poverty disadvantage (post transfers) not as
great as that for health insurance.
Social Watch International Assembly, July 2011
THANK YOU
Social Watch International Assembly, July 2011

EXTRA SLIDES
Social Watch International Assembly, July 2011
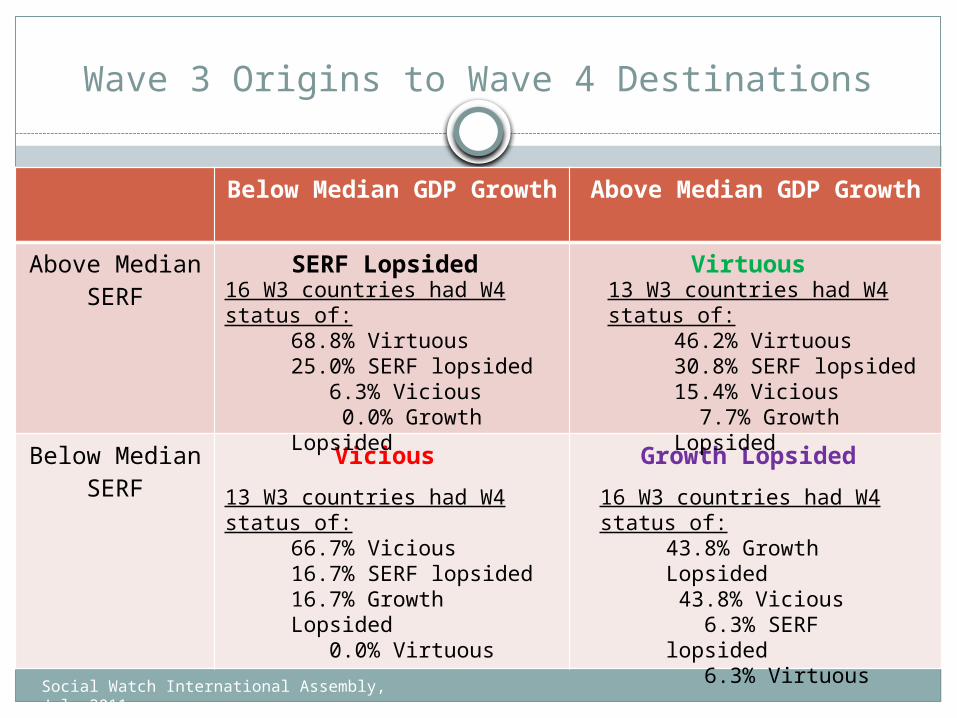
Wave 3 Origins to Wave 4 Destinations
Below Median GDP Growth
Above Median GDP Growth
Above Median SERF
SERF Lopsided Virtuous
Below Median SERF
Vicious Growth Lopsided
16 W3 countries had W4 status of:68.8% Virtuous25.0% SERF lopsided 6.3% Vicious 0.0% Growth Lopsided
13 W3 countries had W4 status of:66.7% Vicious16.7% SERF lopsided16.7% Growth Lopsided 0.0% Virtuous
13 W3 countries had W4 status of:46.2% Virtuous30.8% SERF lopsided15.4% Vicious 7.7% Growth Lopsided
16 W3 countries had W4 status of:43.8% Growth Lopsided 43.8% Vicious 6.3% SERF lopsided 6.3% Virtuous
Social Watch International Assembly, July 2011
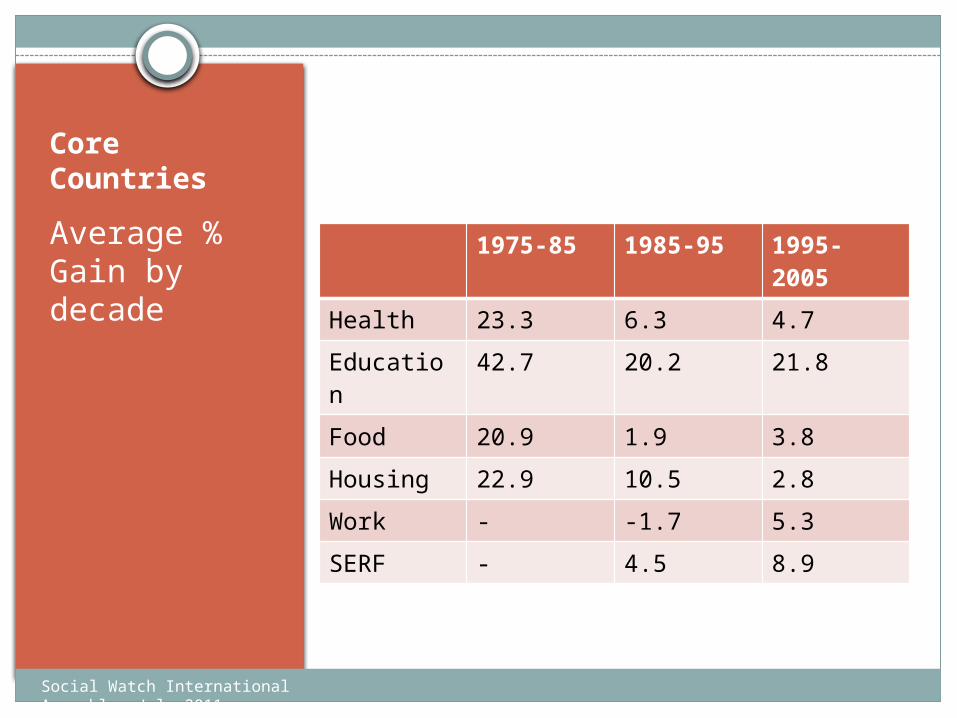
Core Countries
Average % Gain by decade
1975-85 1985-95 1995-2005
Health 23.3 6.3 4.7
Education 42.7 20.2 21.8
Food 20.9 1.9 3.8
Housing 22.9 10.5 2.8
Work - -1.7 5.3
SERF - 4.5 8.9
Social Watch International Assembly, July 2011
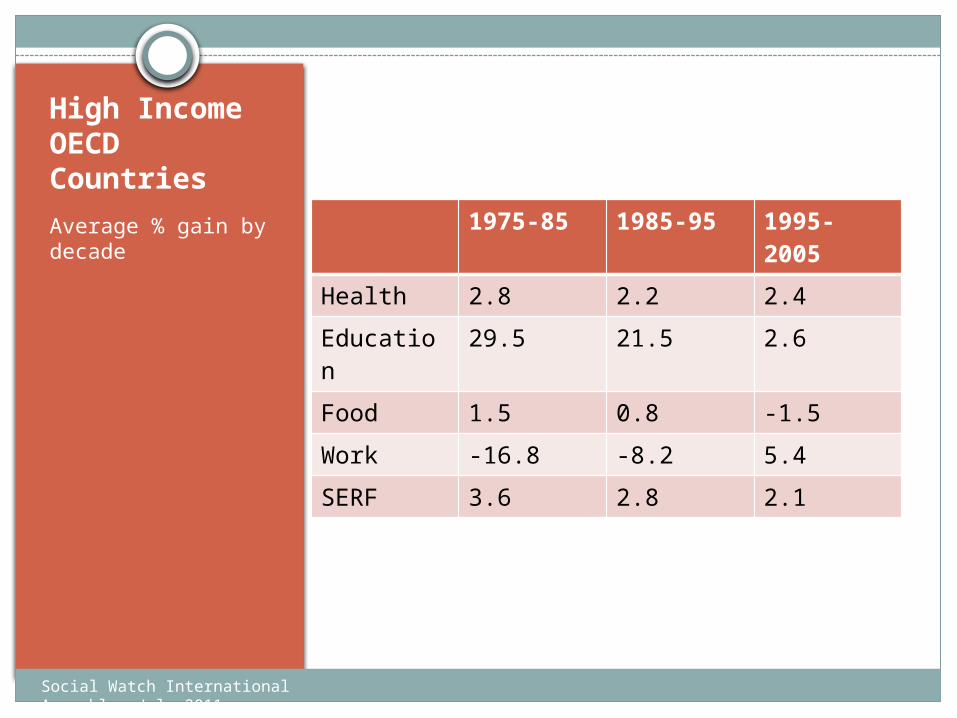
High Income OECD Countries
Average % gain by decade
1975-85 1985-95 1995-2005
Health 2.8 2.2 2.4
Education 29.5 21.5 2.6
Food 1.5 0.8 -1.5
Work -16.8 -8.2 5.4
SERF 3.6 2.8 2.1
Social Watch International Assembly, July 2011
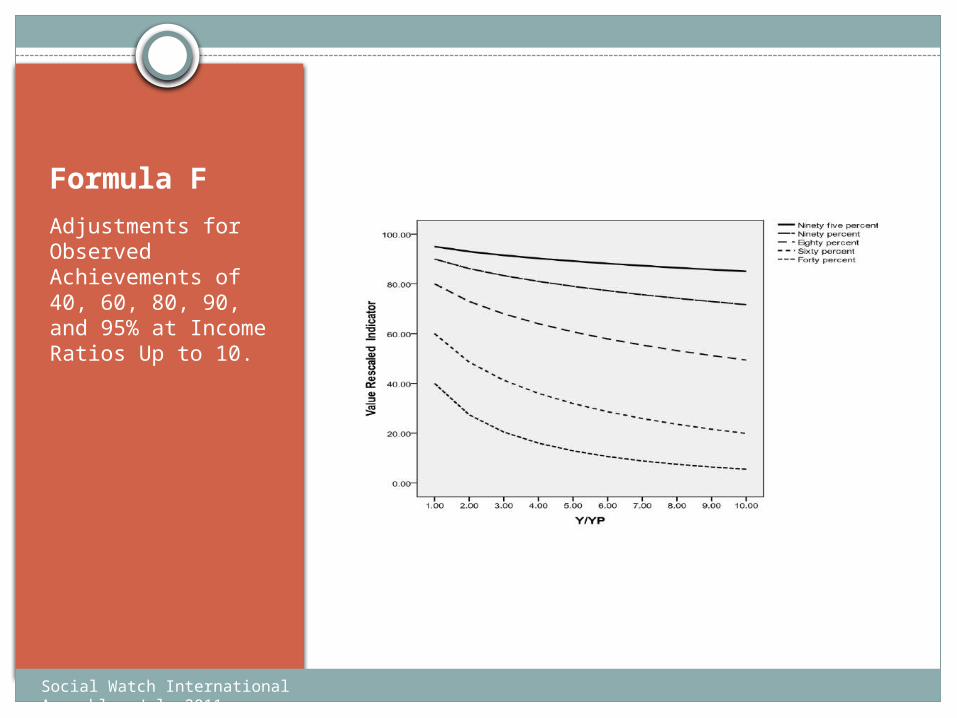
Formula F
Adjustments for Observed Achievements of 40, 60, 80, 90, and 95% at Income Ratios Up to 10.
Social Watch International Assembly, July 2011
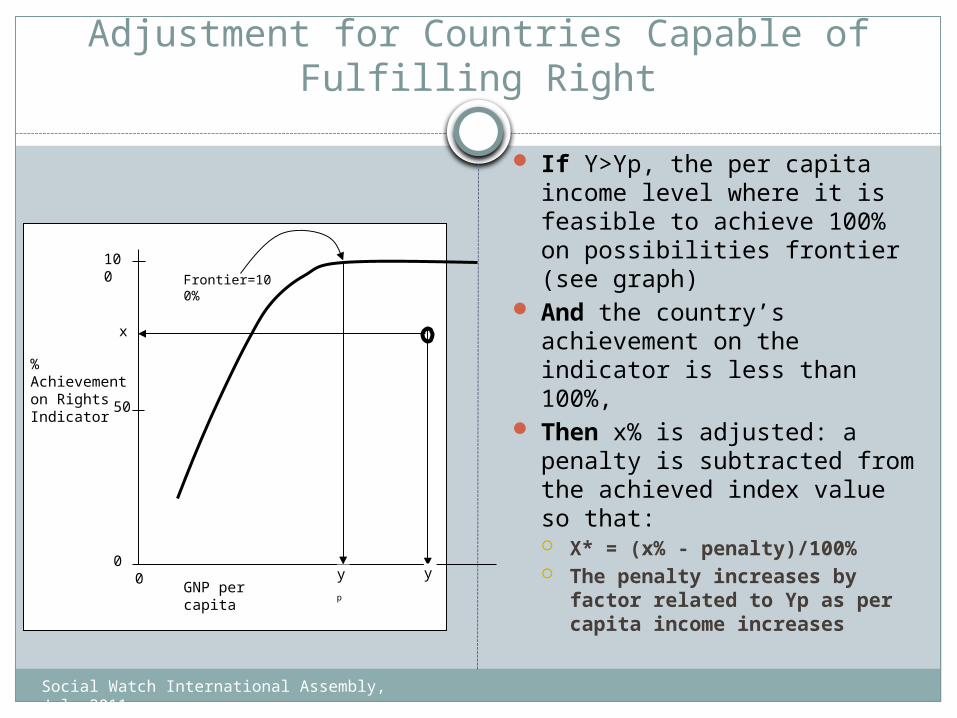
Adjustment for Countries Capable of Fulfilling Right
If Y>Yp, the per capita income level where it is feasible to achieve 100% on possibilities frontier (see graph)
And the country’s achievement on the indicator is less than 100%,
Then x% is adjusted: a penalty is subtracted from the achieved index value so that: X* = (x% - penalty)/100% The penalty increases by
factor related to Yp as per capita income increases
GNP per capita
% Achievement on Rights Indicator
100
00
50
x
yp y
Frontier=100%
Social Watch International Assembly, July 2011