susan h. cochrane and dean t. jamison educational...
TRANSCRIPT
World Bank Reprint Series: Number 396
Susan H. Cochrane and Dean T. Jamison
Educational Attainent andAchievement in Rural Thailand
Reprinted with permission from New Directions fOr Testinzg anitd N-Ieasuremnent: Productkily Assesstnetif intEduttction)l, no. 15 (September 1982), pp. 43-59, published by Jossey-Bass, San Francisco.
Pub
lic D
iscl
osur
e A
utho
rized
Pub
lic D
iscl
osur
e A
utho
rized
Pub
lic D
iscl
osur
e A
utho
rized
Pub
lic D
iscl
osur
e A
utho
rized
Pub
lic D
iscl
osur
e A
utho
rized
Pub
lic D
iscl
osur
e A
utho
rized
Pub
lic D
iscl
osur
e A
utho
rized
Pub
lic D
iscl
osur
e A
utho
rized
This chapter examines the effect of individual, household,and community characteristics on educational attainment andother individual characteristics on the numeracy and literacyof adults in rural Thailand.
Educational Attainment andAchievement in Rural Thailand
Susan H. CochraneDean T Jamison
Modernization of developing nations always includes the spread of education,but factors influencing the rate and consequences of its spread remain poorlyunderstood. Data recently available from rural Thailand allow us to examinethe effect of access to schools on educational attainment and its effect on cogni-tive achievement. Although our emphasis in this chapter is on results fromThailand, some of what has been learned may be transferable to other devel-oping nations, particularly if the findings appear to be common to severalcountries. In this chapter, the factors determining educational attainment(years of schooling completed) will be examined for children and adults, andthen the determinants of two dimensions of cognitive achievement, literacyand numeracy, for those over age fifteen will be explored. Factors influencing
The authors thank Anita Summers, Erwin Chou, and Kowit Pravalpruk fortheir helpful comments and Kalpana Mehra for her hard work and insights in the prep-aration of this paper. They are also indebted to Dr. Manu Seetisarn and Mr. PichitThani of the Faculty of Agriculture, Chiang Mai University, for their collaboration ondata collection.
A. Sumn.. r. (Ed ) Ne., Direetion,for Teoline and Measurement Productiriy Assessment an m ducation, no. 15.San Francisco:Jossey-Bass, September 1982. 43
44
current participation in schooling of those who are of school age are pertinentto this analysis; we shall examine them briefly here.
In assessing education's spread in rural Thailand, our analysis spansthree generations. The literacy of the parents of the household heads in oursample is postulated to affect both their educational participation and theireducational attainment. These variables, and others (including proximity toschools), are then postulated to affect the educational participation and attain-ment of the children of the household heads. Before turning to these points,however, we will provide a brief account of the educational context in Thai-land.
Historical Perspective
Modernization of Thai society has been profoundly shaped by theintroduction of formal education during the reign of King Chulalongkorn(1868-1910). In the early years, this concern was restricted to the elite, but in1906 the purposes of mass education were beginning to be articulated. AsWyatt has shown (1975), universal education began to be seriously pursued by1909, and 4,000 state schools had been established by 1921. In that year,education was made compulsory for all children between the ages of seven andfourteen, but it was some time before facilities were available to provide evenlower primary education to all children. The Economic and Social Commis-sion for Asia and the Pacific (ESCAP) monograph on Thailand (Economicand Social Commission for Asia and the Pacific, 1976) provides details of thisexpansion. By the mid 1960s, more than 50 percent of those over age fifteenhad four or more years of schooling, and by 1970 adult literacy attained 70percent.
Despite this remarkable achievement, important regional inequalitiesremain, particularly in access to upper primary education (five to sevenyears). In the sample area used in the present study, for example, all villageshad a lower primary school within two kilometers in 1972-73, but access toupper primary school was much more limited; some potential students wouldhave had to travel fifteen kilometers to reach an upper primary school. In1978, the old four-year (lower) and three-year (upper) primary school systemcycles were reorganized as two three-year cycles, and the availability of upperprimary schools was increased. In fourteen of the seventeen villages in oursample for which we have data, upper secondary schools were closer to the vil-lage in 1978 than they were in 1972-73.
For the sample used here, there has been a gradual but substantial in-crease in educational attainment over time. Males over fifty years of age havean average of two years of school, and females have an average of one year.
45
For those who are now in the fifteen- to twenty-five-year-old age bracket, theaverages are 6.0 and 5.5, respectively. At all ages, females have about a half-year less schooling than males do. The determinants of educational participa-tion and attainment among those of school age (five to twenty-five) and ofthose beyond normal school age (twenty-five to sixty) will be examined in thenext section of this chapter. The consequences of school attainment for theachievement of literacy and numeracy will be reviewed in the following section.
Determinants of Educational Participation and Attainment
Factors Influencing School Attendance. A number of authors haveanalyzed investment in the education of children in developing countries as aneconomic decision. Their analyses have been reviewed by Birdsall andCochrane (forthcoming). Education is an investment in human capital, anddecisions depend on the costs and benefits of such investment as well as onhousehold preferences. The costs of education depend on both the direct costsof education and the value of foregone child labor (and perhaps foregoneleisure of children, depending on the family utility function). The benefits toeducation include (but are far from limited to) the greater potential earningsfor those who have more education. The benefits also include the consumptionvalue of education.
It is natural to expect that, as the costs of education increase, both thelevel of participation of children in school and the levels of educational attain-ment will decrease. In this sample, the direct costs of schooling include thecosts of books and uniforms. These costs can vary slightly across households,but the variation is likely to be small. The major variation in the cost of educa-tion probably arises from variations in opportunity costs of the child's time.These costs include the loss of labor (or leisure) for the time that the childspends in school and the travel time to school, which we measure by the dis-tance to school. In this study, these two costs have been measured at the com-munity level. At the household level, the need for child labor depends on landownership and the presence of younger siblings who need childcare.
The benefits to schooling depend on labor market conditions that canvary somewhat between villages. They also depend on the ability of individualchildren to capitalize on schooling. This ability is reflected in a measure of in-nate ability, which has been collected for all household nmembers fourteenyears of age and older. The return to schooling can depend on the sex of thechild as well as on the child's ability.
Parental ability and schooling can increase the parents' educationalaspirations for their children as well as affect the environment within the homethat makes education less costly or more rewarding. These environmental fac-
46
tors include the presence of reading material and the ability of parents to helpwith homework. The household's demand for schooling depends on income
and preferences as well as on the costs and benefits of education.In analyzing the determinants of schooling, we split the sample into
three groups: those between the ages of five and fourteen, some of whom are
still attending school; those between the ages of fourteen and twenty-five, most
of whom have completed school, but some of whom are making important
investments beyond the normal level; and those between the ages of twenty-
five and sixty, whose educational decisions were made at some time in the
past. The data available on these three groups vary substantially, and the
analysis will therefore vary. The educational participation and achievement of
those aged five to twenty-five show little variation by sex. After age ten, edu-
cational participation drops off rapidly, but average achievement continues to
increase until the late teens. We shall study the determinants of achievement,
allowing the considerationsjust stated to guide our analysis. Before examiining
the empirical results, however, it is necessary to discuss the data used.The Data. The survey described here is based on a random sainple of
about 400 farm households in twenty-two villages of the Chiang Mai Valley in
'I'hailand. A parallel survey was carried out in the Nepal Terai (Jamison and
Lockheed, 1981). The data analyzed in this chapter conme from several differ-
ent sections of the survey. Def'initions of variables and their means ancl stan-
dard deviations are shown in Table 1.For children between the ages of finve and thirteen, data on their educa-
tional attainment and current enrollmiient status were obtained from the house-
hold roster. Household data are also available on land ownership, and the
nurnber of younger children can be learned fromi other portions of the ques-
tionnaire. Village-level data on access to schools are available, and the propor-
tion of children between the ages of' ten and fourteen working in each village
has been aggregated from household rosters. This data set on individuals is
unique for the extensive information on parents that it contains. Such infor-
mation includes not only the parents' own education but measures of their in-
nate intellectual ability and of their educational aspirations for their sons and
daughters.For individuals fourteen and older, lata on roster information
measures of their own schooling, parents' literacy status, and their own intel-
lectual ability, literacv, and nunieracy were gathered. In acldition, for many of
those between fourteen and twenty-five, data on their parents' educational
attainment and abilities were available. Thus, for manv of those in the five- to
twentv-five-year-old age bracket, data were available not only on their own
educational attainment but on that of their parents and grandparents.The measures of intellectual ability, literacy, and numeracy need some

Table 1. Variable Definitions and Distribution for Various Data SetsVariable StandardName Definition Mean deviation n
Children 5-13
INSCH If child in school 1, otherwise zero 0.74 0.44 289YRSSCH Years of school completed 3.70 1.93 289AGE Age 10.67 2.36 289MSCHYRS Years of school completed by person's mother 3.20 1.74 289FSCHYRS Years of school completed by person-s father 3.43 1.63 289MRAVSC Mother's Ravens Score 16.43 4.84 289FRAVSC Father's Ravens Score 19.72 5.78 289MDEC Mothers' Desired Education for the Individual 8.66 4.11 289FDEC Father-s Desired Education for the Individual 9.87 4.08 289MDES Mother's Desired Education for Sons 9.13 4.25 426FDES Father-s Desired Education for Sons 10.12 4.29 386MDED Mother's Desired Education for Daughters 8.60 4.03 429FDED Father's Desired Education for Daughters 9.73 4.28 388LAND78 Household Land Ownership 1978 5.69 7.62 289CUNDR5 Number of Chil-dren under 6 0.24 0.49 289PCW10-14 Proportion of children 10-14 working in village 0.23 0.13 289LDRIMD78 Distance to lower primary school 1978 0.47 0.67 289UPRIMD78 Distance to upper primary school 1978 2.39 3.83 289SEX Male - 1; female - 0 0.52 0.50 289MADEC Mother's desired add'l education for children 4.96 4.28 289FADEC Father's desired add-l education for children 6.17 4.23 289ROADD Distance to main road 3.27 3.34 289AVW4ATER Water availability index 0.76 0.26 289
Individuals 14-25
INSCH If individual is in school-l, otherwise zero 0.15 0.36 347YRSSCH School years completed 5.61 2.42 345AGE Age 18.54 2.98 345MSCHYRS Years of school completed by person's mother 2.63 1.93 345FSCHYRS Years of school completed by person's father 3.23 1.80 345RAVSC Individual's Ravens score 23.01 6.31 345MRAVSC Mother's Ravens Score 16.10 4.60 345FRAVSC Father's Ravens Score 19.33 5.64 345MDEC Mother-s desired education for the individual 8.52 4.19 345FDEC Father's desired education for the individual 9.80 4.38 345
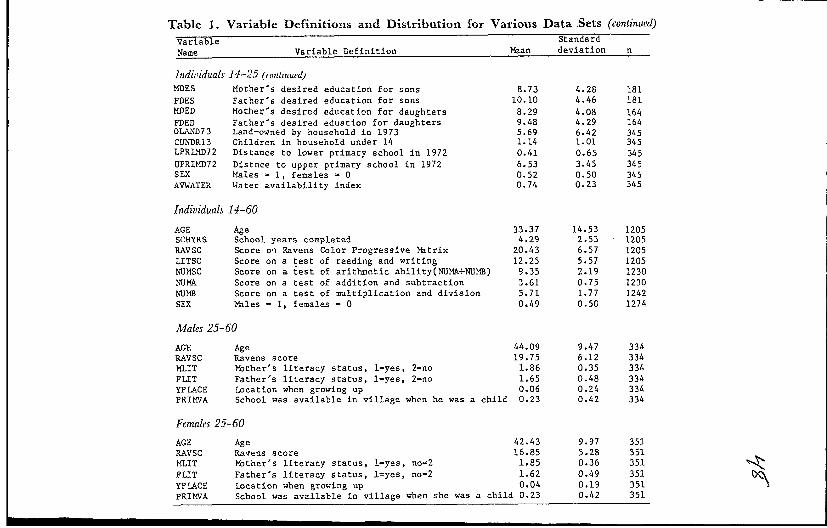
Table 1. Variable Definitions and Distribution for Various Data Sets (continued)
Variable StandardName Variable Definition Mean deviation n
IndizviduaLs 14-25 (continued)MDES Mother's desired education for sons 8.73 4.28 181FDES Father's desired education for sons 10.10 4.46 181MDED Mother's desired education for daughters 8.29 4.08 164FDED Father's desired eduation for daughters 9.48 4.29 164OLAND73 Land-owned by household in 1973 5.69 6.42 345CUNDR13 Children in household under 14 1.14 1.01 345LPRLMD72 Distance to lower primary school in 1972 0.41 0.65 345UPRIMD72 Distnce to upper primary school in 1972 6.53 3.45 345SEX Males - 1, females = 0 0.52 0.50 345AVWATER Water availability index 0.74 0.23 345
Individuals 14-60
AGE Age 33.37 14.53 1205SCHYRS School years completed 4.29 2.53 1205RAVSC Score on Ravens Color Progressive Matrix 20.43 6.57 1205LITSC Score on a test of reading and writing 12.25 5.57 1205NUMSC Score on a test of arithmetic ability(NUMA+NUMB) 9.35 2.19 1230NUMA Score on a test of addition and subtraction 3.61 0.75 1230NUMB Score on a test of multiplication and division 5.71 1.77 1242SEX Males = 1, females = 0 0.49 0.50 1274
MaIles 25-60
AGE Age 44.09 9.47 334RAVSC Ravens score 19.75 6.12 334MLIT Mbther's literacy status, l=yes, 2=no 1.86 0.35 334FLIT Father's literacy status, l=yes, 2=no 1.65 0.48 334YPLACE Location when growing up 0.06 0.24 334PRIMVA School was available in village when he was a child 0.23 0.42 334
Females 25-60
AGE Age 42.43 9.97 351RAVSC Ravens score 16.85 5.28 351MLIT lbther's literacy status, l=yes, no-2 1.85 0.36 351FLIT Father's literacy status, l=yes, no-2 1.62 0.49 351YPLACE Location when growing up 0.04 0.19 351PRIMVA School was available in village when she was a child 0.23 0.42 351
49
further explanation. To measure innate ability, Ravens's Coloured Progressive
Matrix (Ravens, 1956) was used. This is an inferential test that is not lan-
guage dependent and that does not depend on schooling per se; it is intended
to be a measure (though imperfect) of natural intellectual endowment. This
test has been used in a wide variety of cultures. The mean score was 20.43 for
the sample; the maximum score was 36.
Tests of reading and writing were used to measure literacy. Scores on
these tests have been aggregated. A test of comprehension was also given, but
results were not used in the analysis presented here, because the subject matter
used for the test was widely known. The mean score for reading and writing
was 12.25; the maximum was 16.To measure numeracy, individuals were asked ;our questions that re-
quired addition or subtraction and nine that required multiplication or divi-
sion. On the average, 3.6 of the first four questions and 5.7 of the last nine
questions were answered correctly.Evidence on Determinants of Educational Attainment. Multiple regres-
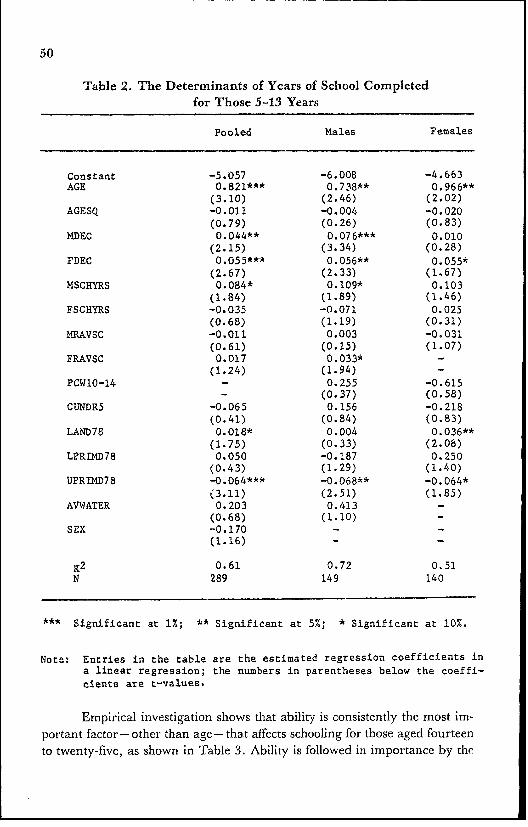
sion was used to analyze the determinants of educational attainment. The
results for children aged five to thirteen, displayed in Table 2, show that (other
than age) the aspirations of father and mother for the child's schooling are the
most significant factors affecting attainment for boys. A-cess to upper primary
schooling is a significant constraint on the participation of boys and girls. Forgirls, attainment increases as ownership of land by the family increases.
Father's-but not mother's-aspirations for their daughter's schooling andfather's innate ability have positive effects on attainment. While there is some
clifference in the factors that are significant for boys and girls, there is no sig-
nificant difference in the level of attainment of boys and girls after controllingfor other factors. Measures of the benefits of educating children include the
presence of younger children in the household, water availability for year-
round cropping, and proportion of children aged ten to fourteen working in
the village; all are insignificant. Thus, aspirations of parents and access to up-
per primary school proved the most significant factors.To explore the role of access more fully, the effect of school availability
five years ago on the attainment of those aged fourteen to twenty-five can be
analyzed. Another way of exploring the impact of access on achievement is by
examining the current enrollment of children in school and its relationship to
access. Both of these will be discussed here.The same factors that affect the educational attainment of young adults
should affect the attainment of younger children, except that age may play a
lesser role, since most children in the sample complete school prior to age four-
teen. Determinants of schooling can be more fully analyzed with this age
group, because measures of their innate ability are available.
50
Table 2. The Determinants of Years of School Completedfor Those 5-13 Years
Pooled Males Females
Constant -5.057 -6.008 -4.663AGE 0.821*** 0.738** 0.966**
(3.10) (2.46) (2.02)AGESQ -0.011 -0.004 -0.020
(0.79) (0.26) (0.83)SDEC 0.044** 0.076*** 0.010
(2.15) (3.34) (0.28)FDEC 0.055*** 0.056** 0.055*
(2.67) (2.33) (1.67)MSCHYRS 0.084* 0.109* 0.103
(1.84) (1.89) (1.46)FSCHYRS -0.035 -0.071 0.025
(0.68) (1.19) (0.31)lRAVSC -0.011 0.003 -0.031
(0.61) (0.15) (1.07)FRAVSC 0.017 0.033* -
(1.24) (1.94) -PCW10-14 0.255 -0.615
- (0.37) (0.58)CUNDR5 -0.065 0.156 -0.218
(0.41) (0.84) (0.83)LAND78 0.018* 0.004 0.036**
(1.75) (0.33) (2.08)LPRfDl.78 0.050 -0.187 0.250
(0.43) (1.29) (1.40)UPRIMD78 -0.064*** -0.068** -0.064*
(3.11) (2.51) (1.85)AVWATER 0.203 0.413 -
(0.68) (1.10) -
SEX -0.170 - -
(1.16) - -
Z2 0.61 0.72 0.51N 289 149 140
* Significant at 1%; ** Significant at 5%; * Significant at 10%.
Note: Entries in the table are the estimated regression coefficients ina linear regression; the numbers in parentheses below the coeffi-cients are t-values.
Empirical investigation shows that ability is consistently the most im-portant factor - other than age - that affects schooling for those aged fourteento twenty-five, as shown in Table 3. Ability is followed in importance by the

51
Table 3. Determinants of Schooling Among Young Adults (14-25)
Pooled Males Females
Constant -1.279 -11.886 6.512AGE 0.367 1.408** -0.377
(0.87) (2.15) (0.68)AGESQ -0.012 -0.039** 0.007
(1.14) (2.31) (0.47)RAVSC 0.119*** 0.165*** 0.091***
(6.50) (5.65) (3.86)MDEC 0. 137*'** 0.140*** 0.116***
(4.83) (3.48) (2.83)FDEC 0.079*** 0.046 0.117***
(3.04) (1.26) (3.23)MSCIYRS -0.009 -0.059 0.054
(0.14) (0.65) (0.61)FSCHYRS 0.101 0.077 0.124
(1.50) (0.78) (1.33)MRAVSC -. 0.033 -0.022 -0.031
(1.21) (0.53) (0.63)FRAVSC 0.025 0.028 0.019
(1.20) (0.97) (0.90)PCW10-14 -1.010 -0.549 -1.277
(1.20) (0.43) (1.14)CUNDR13 -0e353*** -0.542*** -0.291**
(3.23) (3.24) (2.07)OLAND73 0.048*** 0.074***
(2.73) (3.04) -LPRIMD72 -0.451** -0.556* -0.332
(2.46) (1.94) (1.39)UPRIMD72 -0.067* -0.070 -0.074
(1.89) (1.34) (1.50)AVWATER 0.505 0.923 0.194
(1.06) (1.24) (0.31)SEX 0.262
(1.24) - -
Z2 0.38 0.38 0.38N 345 181 164
S Significant at 1%; ** Significant at 5%; * Significant at 10%.
Note: Entries in the table are the estimated regression coefficientsin a linear regression; the numbers in parentheses below thecoefficients are t-values.
educational aspirations of mothers for their children. Fathers' educationalaspirations for sons is not significant, but it is significant for daughters. Paren-tal education and ability are generally insignificant, since they probably oper-ate by increasing parental aspirations. The availability of land has a positive
52
effect on schooling of sons but not on that of daughters. The presence of chil-dren under age thirteen has a negative effect on the attainment of sons anddaughters.
Most interesting from a policy perspective, the availability of upperan-! lower primary schools in 1972 has a generally significant effect. This effectis much stronger and more consistent than the parallel effect in the achieve-ment of all those between the ages of five and thirteen. This probably resultsfrom the fact that there were fewer schools in the area in 1972 and that traveldistances were greater as a result.
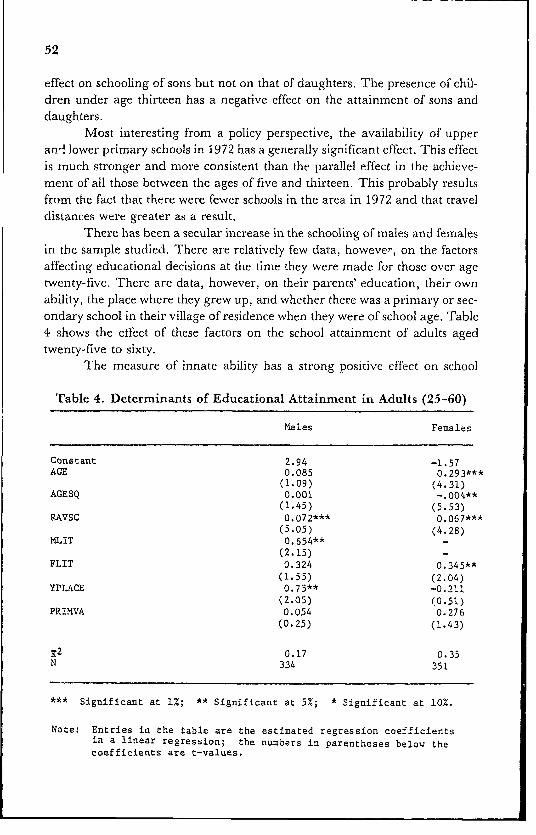
There has been a secular increase in the schooling of males and femalesin the sample studied. There are relatively few data, however, on the factorsaffecting educational decisions at the time they were made for those over agetwenty-five. There are data, however, on their parents' education, their ownability, the place where they grew up, and whether there was a primary or sec-ondary school in their village of residence when they were of school age. Table4 shows the effect of these factors on the school attainment of adults agedtwenty-five to sixty.
The measure of innate ability has a strong positive effect on school
Table 4. Determinants of Educational Attainment in Adults (25-60)
Males Females
Constant 2.94 -1.57AGE 0.085 0.293***
(1.09) (4.31)AGESQ 0.001 -. 004**
(1.45) (5.53)RAVSC 0.072*** 0.067***
(5.05) (4.28)HLIT 0.654**
(2.15)FLIT 0.324 0.345**
(1.55) (2.04)YPIACE 0.75** -0.211
(2.05) (0.51)PRLVA 0.054 0.276
(0.25) (1.43)
K2 0.17 0.35N 334 351
*** Significant at 1%; ** Significant at 5%; * Significant at 10%.
Note: Entries in the table are the estimated regression coefficientsin a linear regression; the numbers in parentheses below thecoefficients are t-values.
53
attainment for both men and women. The literacy of the parent of opposite
sex has a significantly positive effect for men and women. For women, age has
a significant inonlinear effect. The older the woman, the less education she is
likely to have. This effect levels off only at very advanced ages. The only other
variable of significance is whether a man lived in a town or a city before com-
ing to the village, which increases schooling. Our measure of the availability of
a primary school in the village at the time when the adult was growing up was
insignificant, but this may reflect the poor quality of data on the length of time
that a school had been present in the village.
In this section, factors influencing the educational attainment of those
aged five to thirteen, fourteen to twenty-five, and over twenty-five have been
examined for males and females. Access to school and parental aspirations are
most important for the two younger groups. Innate ability is, however, the
most significant factor for those in the fourteen- to twenty-five year bracket.
For the oldest individuals, who are no longer likely to be investing in addi-
tional years of school. innate ability and their parents' education level are the
most consistent factors. For those who are still of an age to increase their
schooling, it is important to study the determinants of current enrollment in
school, and to that we now turn.
Evidence on Determinants of Educational Participation. Attainnment is
the result of a series of decisions to enroll in school and to remain in school.
One problem in investigating the factors that determine attainment is that the
variables measured may not always be relevant to the time period in which the
decision was made. This is true of family variables, such as income 'evel or
number of dependent children, and of village variables such as the availability
of employment opportunities for children and the availability of schools. To
get a more accurate picture of the factors alfecting the sequences of decisions
that determine ultimate educational attainment, we will examine deternmi-
nants of current participation in school.
Factors assumed to influence current participation in school include
the excess demand for education by mothers and fathers (that is, aspiration
minus achievement), the access to lower and upper primaty schools, and the
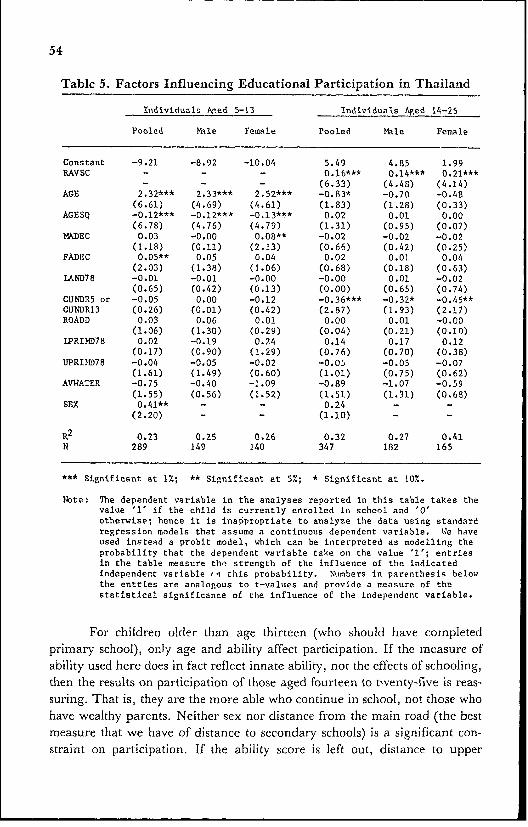
individual's age. Table 5 shows that the factors affecting participation d ffer by
age group and also by sex for the youngest group. Age has the expected
nonlinear effect for the youngest group, and the males in this group are more
likely to attend school than the girls are. The parents' demand for additional
schooling for their children has a significant effect on the participation of
young girls but no effect on the participation of young males or older children.
Access to upper primary school is clearly a significant constraint on the school-
ing of young males but-rather surprisingly-not for females or for older
males or females.
54
Table 5. Factors Influencing Educational Participation in Thailand
Individuals AMed 5-13 Individuals Aged 14-25
Pooled Vhle Female Pooled Vale Female
Constant -9.21 -8.92 -10.04 5.49 4.85 1.99RAVSC - - - 0.16*** 0.14*** 0.21***
- - (6.33) (4.48) (4.14)AGE 2.32*** 2.33*** 2.52*** -0.83* -0.70 -0.48
(6.61) (4.69) (4.61) (1.83) (1.28) (0.33)AGESQ -0.12*** -0.12*** -0.13*** 0.02 0.01 0.00
(6.78) (4.76) (4.79) (1.31) (0.95) (0.07)MADEC 0.03 -0.00 0.08** -0.02 -0.02 -0.02
(1.18) (0.11) (2.13) (0.66) (0.42) (0.25)FADEC 0.05** 0.05 0.04 0.02 0.01 0.04
(2.03) (1.38) (1.06) (0.68) (0.18) (0.63)IAND78 -0.01 -0.01 -0.00 -0.00 0.01 -0.02
(0.65) (0.42) (0.13) (0.00) (0.65) (0.74)CUNDR5 or -0.05 0.00 -0.12 -0.36*** -0.32* -0.45**CUNDR13 (0.26) (0.01) (0.42) (2.87) (1.93) (2.17)ROADD 0.03 0.06 0.01 0.00 0.01 -0.00
(1.06) (1.30) (0.29) (0.04) (0.21) (0.10)LPRIMD78 0.02 -0.19 0.24 0.14 0.17 0.12
(0.17) (0.90) (1.29) (0.76) (0.70) (0.38)UPRINID78 -0.04 -0.05 -0.02 -0.0:' -0.05 -0.07
(1.61) (1.49) (0.60) (1.01) (0.75) (0.62)AVWATER -0.75 -0.40 -1.09 -0.89 -1.07 -0.59
(1.55) (0.56) (1.52) (1.51) (1.31) (0.68)SEX 0.41** - - 0.24 - -
(2.20) - - (1.10) - -
R2 0.23 0.25 0.26 0.32 0.27 0.41N 289 149 140 347 182 165
*** Significant at 1%; ** Significant at 5%; * Significant at 10%.
Nbte: The dependent variable in the analyses reported in this table takes thevalue '1' if the child is currently enrolled in school and 'O'otherwise; hence it is inappropriate to analyze the data using standardregression models that assume a continuous dependent variable. We haveused instead a probit model, which can be interpreted as modelling theprobability that the dependent variable take on the value '1'; entriesin the table measure the strength of the influence of the indicatedIndependent variable i'n this probability. Ntunbers in parenthesis belowthe entries are analogous to t-values and provide a measure of thestatistical significance of the influence of the indepenident variable.
For children older than age thirteen (who should have completedprimary school), only age and ability affect participation. If the measure ofability used here does in fact reflect innate ability, not the effects of schooling,then the results on participation of those aged fourteen to twenty-five is reas-suring. That is, they are the more able who continue in school, not those whohave wealthy parents. Neither sex nor distance from the main road (the bestmeasure that we have of distance to secondary schools) is a significant con-straint on participation. If the ability score is left out, distance to upper
55
primary schools has a significantly negative effect on participation of sons but
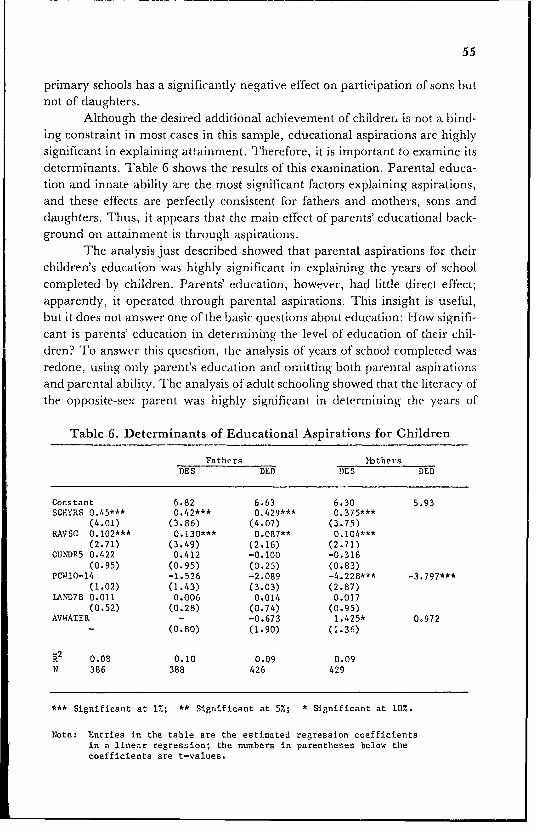
not of daughters.Although the desired additional achievement of childrern is not a bind-
ing constraint in most cases in this sample, educational aspirations are highly
significant in explaining attainmnent. Therefore, it is important to examine its
determinants. Table 6 shows the results of this examination. Parental educa-tion and innate ability are the most significant factors explaining aspirations,
and these effects are perfectly consistent for fathers and mothers, sons anddaughters. Thus, it appears that the main effect of parents' educational back-ground on attainment is through aspirations.
The analysis just described showed that parental aspirations for their
children's education was highly significant in explaining the years of school
completed by children. Parents' education, however, had little direct effect;apparently, it operated through parental aspirations. This insight is useful,
but it does not answer one of the basic questions about education: How signifi-cant is parents' education in determining the level of education of their chil-
dren? To answer this question, the analysis of years of school conmpleted wasredone, using only parent's education and omitting both parental aspirationsand parental ability. The analysis of adult schooling showed that the literacy of
the opposite-sex parent was highly significant in determining the years of
Table 6. Determinants of Educational Aspirations for Children
Fathers lbthersDES DED DES DED
Constant 6.82 6.63 6.30 5.93SCHYRS 0.45*** 0.42*** 0.429*** 0375***
(4.01) (3.86) (4.07) (3.75)RAVSC 0.102*** 0.130*** 0.087** 0.104***
(2.71) (3.49) (2.16) (2.71)CUNDR5 0.422 0.412 -0.100 -0.318
(0.95) (0.95) (0.25) (0.83)PCWIO-14 -1.526 -2.089 -4.228*** -3.797***
(1.02) (1.43) (3.03) (2.87)IAND78 0.011 0.006 0.014 0.017
(0.52) (0.28) (0.74) (0.95)AVWATER - -0.673 1.425* 0.972
- (0.80) (1.90) (1.36)
R2 0.08 0.10 0.09 0.09N 386 388 426 429
*** Significant at 1%; ** Significant at 5%; * Significant at 10%.
Note: Entries in the table are the estimated regression coefficientsin a linear regression; the numbers in parentheses below the
coefficients are t-values.
56
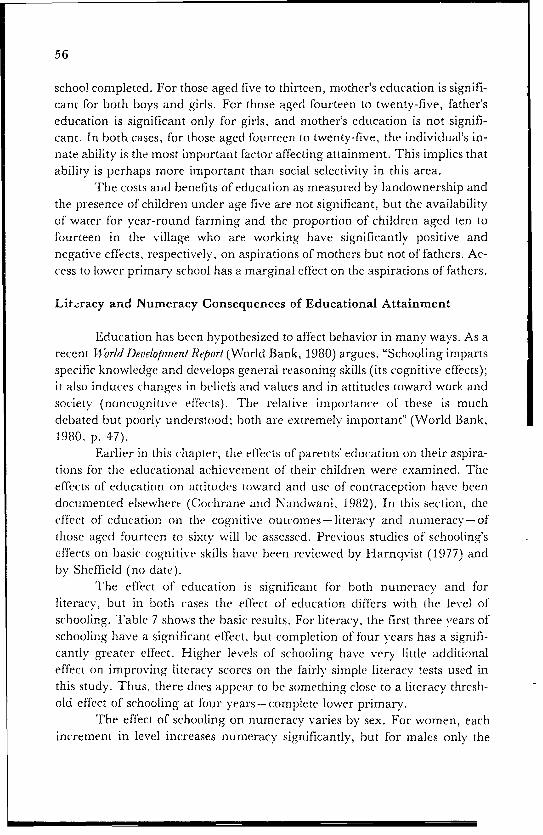
school completed. For those aged five to thirteen, mother's education is signifi-cant for both boys and girls. For those aged fourteen to twenty-five, father'seducation is significant only for girls, and mother's education is not signifi-cant. In both cases, for those aged fourteen to twenty-five, the individual's in-nate ability is the most important factor affecting attainmnent. This implies thatability is perhaps more important than social selectivity in this area.
The costs and benefits of education as measured by landownership andthe presence of' children under age five are not significant, but the availabilityof' water for year-round farming and the proportion of children aged ten tofourteen in the village who are working have significantly positive andnegative effects, respectively, on aspirations of mothers but not of' fathers. Ac-cess to lower primary school has a marginal effect on the aspirations of' fathers.
Litzracy and Numeracy Consequences of Educational Attainment
Education has been hypothesized to af'fect behavior in many ways. As arecent World Development Report (World Bank, 1980) argues, "Schooling impartsspecific knowledge and develops general reasoning skills (its cognitive effects);it also induces changes in belief's and values and in attitudes toward work andsociety (noncognitive effects). The relative importance of' these is muchdebated but poorly understood, both are extremely importarnt" (World Bank,1980, p. 47).
Earlier in this c(hapter, the effects of parents' education on their aspira-tions for the educational achievement of their children were examined. Theef'f'ects of education oni attitutdes toward and use of contraception have beenclocumented elsewherc (Cochrane ancd Nandwani, 1982). In this section, theef'fect of' education on the cognitive outcomes-literacy ancd numeracv-oftl-lose aged fourteen to sixty will be assessed. Previous studies of schooling'sef'f'ects on basic cognitive skills have been reviewed by Harnqvist (1977) andb)y Sheffield (no date).
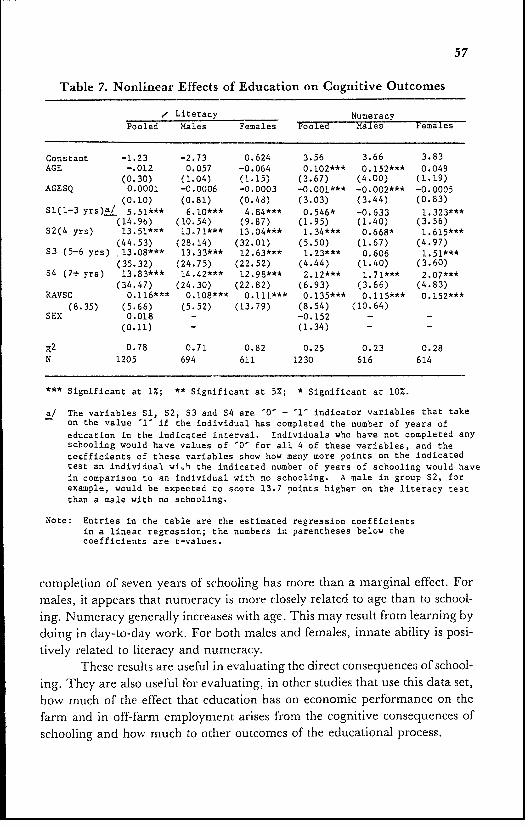
The effect of education is significant for both nurneracv and forliteracy, but in both cases the effect of' education diflers with the level ofschooling. Table 7 shows the basic results. For literacy, the First three vears ofschooling has'e a significant effect, but completion of' four years has a signifi-cantly greater effect. Higher levels of' schooling have very, little additionaleffect on improving literacy scores on the fairly sirmple literacv tests used inthis study. Thus, there (oes appear to be something close to a literacy thresh-old effect of' schooling at four years-complete lower primary.
The effect of schooling on numeracy varies by sex. For women, eachincrement in level increases numeracy significantly, but for males only the
57
Table 7. Nonlinear Effects of Education on Cognitive Outcomes
s Literacy NumeracyPooled Males Females Pooled Males Females
Constant -1.23 -2.73 0.624 3.56 3.66 3.83AGE -.012 0.057 -0.064 0.102*** 0.152*** 0.049
(0.30) (1.04) (1.15) (3.67) (4.00) (1.19)AGESQ 0.0001 -0.0006 -0.0003 -0.0Ol*** -0.002*** -0.0005
(0.10) (0.81) (0.48) (3.03) (3.44) (0.83)S1(1-3 yrs)a/ 5.51*** 6.10*** 4.84*** 0.546* -0.633 1.323***
(14.96) (10.54) (9.87) (1.95) (1.40) (3.56)S2(4 yrs) 13.51*** 13.71*** 13.04*** 1.34*** 0.668* 1.615***
(44.53) (28.14) (32.01) (5.50) (1.67) (4.97)S3 (5-6 yrs) 13.08*** 13.33*** 12.63*** 1.23*** 0.606 1.51***
(35.32) (24.75) (22.52) (4.44) (1.40) (3.60)S4 (7+ yrs) 13.83*** 14.42*** 12.98*** 2.12*** 1.71*** 2.07***
(34.47) (24.30) (22.82) (6.93) (3.66) (4.83)RAVSC 0.116*** 0.108*** 0.111*** 0.135*** 0.115*** 0.152***
(8.35) (5.66) (5.52) (13.79) (8.54) (10.64)SEX 0.018 - -0.152 - -
(0.11) - (1.34) - -
R2 0.78 0.71 0.82 0.25 0.23 0.28N 1205 694 611 1230 616 614
*** Significant at 1%; ** Significant at 5%; * Significant at 10%.
a/ The variables Sl, S2, S3 and S4 are -0' - '1' indicator variables that takeon the value '1' if the individual has completed the number of years of
education in the indicgted interval. Individuals who have not completed anyschooling would have values of '0' for all 4 of these variables, and thecoefficients of these variables show how many more points on the indicatedtest an individual wiTh the indicated number of years of schooling would havein comparison to an individual with no schooling. A male in group S2, forexample, would be expected to score 13.7 points higher on the literacy testthan a male with no schooling.
Note: Entries in the table are the estimated regression coefficientsin a linear regression; the numbers in parentheses below thecoefficients are t-values.
completion of seven years of schooling has more than a marginal effect. Formales, it appears that numeracy is more closely related to age than to school-ing. Numeracy generally increases with age. This may result from learning bydoing in day-to-day work. For both males and females, innate ability is posi-tively related to literacy and numeracy.
These results are useful in evaluating the direct consequences of school-ing. They are also useful for evaluating, in other studies that use this data set,how much of the effect that education has on economic performance on thefarm and in off-f:arm employment arises from the cognitive consequences ofschooling and how much to other outcomes of the educational process.
58
Summary and Policy Conclusions
The determinants of educational participation and attainment vary inour sample between males and females and between younger and older chil-dren. Current participation in school is determined exclusively by age and in-nate ability among those aged fourteen to twenty-five. This is reasuring if ourmeasure of innate ability indicates that the more able remain in school.Among younger children, the main constraint on participation for boys is ac-cess to upper primary school, while for girls it is mother's desire for additionaleducation for girls. This sex difference is rather surprising and implies that in-creased access alone may not increase participation for girls.
For attainment, access to upper primary school appears to have beensignificant for young boys and girls, and access to both upper and lowerprimary school five years ago was a constraint on the actainment of older boysbut not of girls. For older girls, mother's desire for daughter's education is themost significant factor. This seems to reinforce the findings on current enroll-ment.
The effect of other variables, such as family landownership, wateravailability, presence of younger children, and child employment in thevillage, all vary substantially from group to group. Wealth as measured bylandownership and water availability have positive effects when they are sig-nificant. This implies that the income effect of these factors increases the de-mand for schooling more than these factors increase the demand for childlabor. The presence of younger children in the household significantly reducesthe attainment of boys and girls aged fourteen to twenty-five, but not ofyounger children. Thus, the economic model provides a useful way of study-ing the determirnants of schooling. It is particularly interesting that the bindingconstraints vary between males and females in a society where there is sluch ahigh degree of equity in education.
References
Birdsall, N., and Cochrane, S. H. "Education and Parental Decision Making: A Two-Generation Approach." In L. Anderson and D. Windham (Eds.), Education and De-velopment. Lexington, Mass.: Lexington Press, forthcoming.
Cochrane, S. H., and Nandwani, K. The Determinants of Fertility in Twenty-Two Villagesof Northern 7hailand. Discussion Paper No. 81-59. Washington, D.C.: Populationand Human Resources Division, World Bank, 1981.
Economic and Social Cormirnissioni for Asia and the Pacific. Gountry Monograph SeriesNVo. 3: Population of Thailand. Bangkok: United Nations, 1976.
Harnqvist, K. "Enduring Effects of' Schooling: A Neglected Area in Educational Re-search." Educatfional Researcher, 1977, 6 (10), 5-11.
59
Jamison, D. T., and Lockheed, M. E. Participation in Schooling: Determinants and LearningOutcomes in Nepal. Washington, D.C.: Population and Human Resources Division,World Bank, 1981,
Ravens, J. C. Guide to Ulsirng the Coloured Progressive Iatrices. London: Lewis, 1956.Sheffield, J. R. "Retention of Literacy and Basic Skills: A Review of the Literature."
Paper prepared for the Education Department, World Bank, no date.World Bank. World Development Report, 1980.Washington, D.C.: World Bank, 1980.Wyatt, D. K. "Education and the Modernization of Thai Society." In A. W. Skinner
and A. T. Kirsch (Eds.), Change and Persistence in Thai Society. Ithaca, N.Y.: CornellUniversity Press, 1975.
Susan H. Cochrane joined the Population and Hu-nan ResourcesDivision of the World Bank as Brookings Policy Fellow in 1976.
She has published widely in thefield of population economicsas well as in development economics.
Dean T Jamison joined the Population and Human Resources
Division of the World Bank in 1976 and is now project officerin its Population, Health, and Nutrition Department. He has
published widely in the economics of education as well as in
economic theoy.