survival and growth performance of - new york...
TRANSCRIPT

Survival and Growth Performance of Crassostrea virginica in the NYC Harbor
Cézanne Bies and Zain Bin Khalid
Advisor: Mauricio González, M.Sc.
Mentor: Matthew P. Hare, Associate Professor, Natural Resources
(NTRES/DNR), College of Agriculture and Life Sciences (CALS)
Marine Biology Research Program
New York Harbor School
New York
2016
Source: C.Bies

2 | P a g e B i e s , K h a l i d R e v i s e d 3 / 1 3 / 2 0 1 6
Abstract
Bacterial contamination, over harvesting, pollution, and sewage overflows have depleted the
Eastern Oyster population. (Munoz, et al. 2010). Many restoration projects are using wild oysters
to replenish the decreasing supply; however, these projects lack enough scientific data to allow
for comparison of the growth performance and phenotype for the different spats and their
spawning methods. In this study, oyster growth performance was compared between mass and
Individually spawned Eastern Oysters, (Crassostrea virginica). The process was performed by
measuring the size and mortality of both spats over the span of 4 weeks, and physical– chemistry
data was collected and analyzed at the site to determine if there were any environmental
disturbances present in the water. If two wild spats of Crassostrea virginica are produced with
different spawning methods and compared using growth performance and mortality as measures,
then the individual spawned oyster group will exhibit faster growth rate and have less mortality.
After conducting three statistical analyses, the performance between the mass and Individual
spawning methods were found to have a significant difference. Physical chemistry did not appear
to significantly alter the growth and mortality patterns of the oysters. From this research, mass
spawned Eastern Oysters, (Crassostrea virginica), were found to have better growth and
mortality patterns.

3 | P a g e B i e s , K h a l i d R e v i s e d 3 / 1 3 / 2 0 1 6
TABLE OF CONTENTS
Abstract ………………………...……………………………………………… 2
Table of Contents………...……………………………………………………… 3
Introduction ………………………...…………………………………………… 4
Background Information ……………...………………………………………… 4
Project Design Chart ...………………………...…………………………………6
Locality ....………………………...………………………………………………7
Materials...………………………...………………………………………………8
Procedures ...………………………...……………………………………………9
Observations and Results ...………………………………………………………
Analysis of Results ………………………………………………………………
Conclusions………………………………………………………………………
Bibliography………………………………………………………………………
Annex ……………………………………………………………………………

4 | P a g e B i e s , K h a l i d R e v i s e d 3 / 1 3 / 2 0 1 6
Introduction
New York City’s ground and surface waters are being contaminated with heavy metals,
persistent organic pollutants, and nutrients that have an adverse effect on human health (Bharali,
2007). However, eastern oysters (Crassostrea virginica) act as nature’s biofiltration system, each
providing ~50 gallons of purified water per day (Merrill, 2014). New York harbor once had up
to 350 square miles of oysters, producing roughly about 300,000 bushels a year (Nigro, 2011).
Today, that population has substantially decreased due to the effect of bacterial contamination,
over harvesting, pollution and sewage (Munoz, et al. 2010). Only a small number of oysters
remain in the NYC harbor, and that damage cannot be fixed without proactive conservation
efforts. By tracking the growth and mortality each week, a better comparison between spawnings
can be found.
Background Information
The Eastern Oyster (Crassostrea Virginica) also called the Atlantic Oyster, American Oyster,
Common Oyster and Virginia Oyster inhabits the North Atlantic shores from the rocky coastlines
of Maine to the southern shores of the Gulf coast. The Eastern Oyster shell (valve) length can
grow in to approximately 8 inches (20cm). The covering shells are known as bivalve connect by
a natural joint and single large muscle (abductor). The coloration may range from alabaster
white to dark gray. The shell texture also varies from those patterned with smooth but ridged
surfaces to others with coarse, ridge– like surfaces. They mainly ingest algae and plankton, and
their biggest predators are humans who harvest them. Other predators are crabs, snails, sea stars,
5 | P a g e B i e s , K h a l i d R e v i s e d 3 / 1 3 / 2 0 1 6
sea nettles, sea stars, sea anemones and parasites threatening them while also sharing their
marine habitat. The spawning season for oysters is approximately seven months from late spring
to early fall.
During this season a female can produce and release over 100 million eggs. Oyster larvae are
about the size of pepper grains. They will dive down several feet below water, and excrete a
gorilla– like glue substance that serves to attach it to rock or dead shell, thereby becoming a
permanent, lifelong resident. Eastern Oysters can live in a variety of water conditions, ranging
from shallow near– fresh waters to the saltier ocean water bays and estuaries. They are found in
depths of water from 8 to 25 feet deep and with water temperatures that vary from 28 and 90
degrees. They are found attached to rocks, boats, bottles, crabs, and ideally other oysters (also
known as an oyster reef). In a conductive environment, an oyster can grow in a short period of
time – with spat growing one inch in three months, two inches in seven months, and three inches
in 15 months. Approximately one percent of fertilized eggs reach maturity. Lifespans of oysters
vary based on freshwater and the number of predators. Oysters are protandric in the first year
(having male sexual organs while young and female organs later in life). Oysters survive using
their gills to filter plankton and algae for nutrition. Due to bacterial contamination, over
harvesting, pollution and sewage overflows, the number of wild Eastern oysters (Crassostrea
virginica) have decreased dramatically over the last few decades. There is not much scientific
data available to compare phenotypes of mass and individual cohorts of eastern oysters. A city–
wide effort has been started with the goal of restoring a self– sustaining population of Eastern
oysters in the Hudson River and other regional waters. The C. virginica, or eastern oysters, play
a major role in the proper functioning of estuary ecosystems (Dame 1972) especially within New
York harbor.

6 | P a g e B i e s , K h a l i d R e v i s e d 3 / 1 3 / 2 0 1 6
Project Design Chart
Table 01. Project Design Chart
Category Entry
Scientific Problem:
Which method oyster spawning is better adapted to the conditions of the Hudson River Estuary, mass or Individually spawned oysters?
Hypothesis 01: Individually spawned oyster groups will exhibit faster growth rates and experience less mortality
Hypothesis 02: Mass spawned oyster groups will exhibit less mortality rates and faster growth rates
Null Hypothesis: Both groups mass and individual spawned will show similar mortality and growth rates
Objective 01: Determine which spawning method (mass, individually) will exhibit a faster growth and/or lower mortality rate
Objective 02: Understand how water stressors and changes in water quality affect oyster performance
Table 02. Experimental Design
Proposed Variables Proposed Controls Proposed Constants
Independent Dependent
N/A observational project
• Location of the cage
containing the oysters • Depth placement of the
cage • Size and Shape of cage • Number of spat counted
Spawning Method Type
(Mass or Individual)
Growth & Fitness of
both oyster groups

7 | P a g e B i e s , K h a l i d R e v i s e d 3 / 1 3 / 2 0 1 6
8 | P a g e B i e s , K h a l i d R e v i s e d 3 / 1 3 / 2 0 1 6
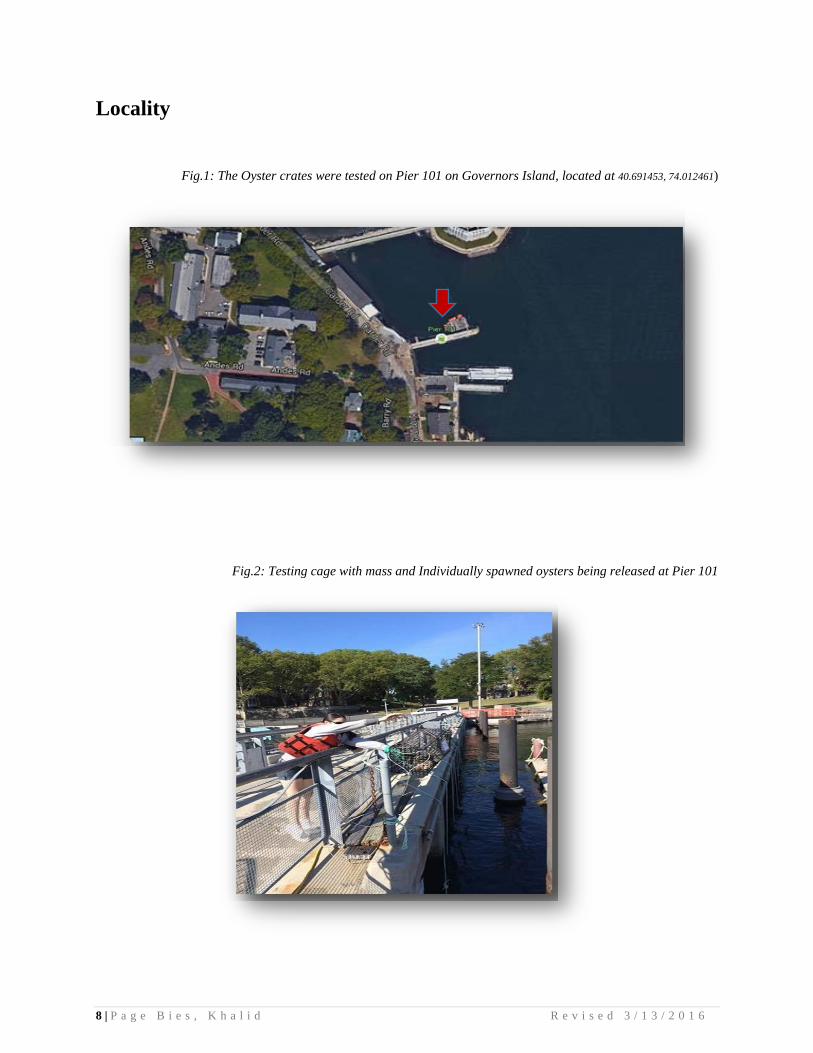
Locality
Fig.1: The Oyster crates were tested on Pier 101 on Governors Island, located at 40.691453, 74.012461)
Fig.2: Testing cage with mass and Individually spawned oysters being released at Pier 101

9 | P a g e B i e s , K h a l i d R e v i s e d 3 / 1 3 / 2 0 1 6
Materials
Item Function Quantity
Waste beaker To remove possible toxic chemicals from surfaces 1
Moshnet cage with screen– boxed bottom. 26x16x14(in) / 6.04x40.64x35.56 (cm) To contain Oysters 1
Temperature monitors To measure temperature of oysters 1
Rope To secure moshnets 2
Nursery tanks (Individual, Mass)
To hold larvae strains and breeding oysters 2
Water heater To incubate Nursery tanks 2
Dead Oyster Shells Surface for the larvae to set and cement properly
2 Bushels full
~300 shells
Winkler Method test kits To test the Dissolved Oxygen 1
Plankton, algae particles Food for the oysters ~ 30 ml bottle
YSI ProPlus Sans To measure Dissolved Oxygen (ppm), PH, Salinity (ppt) and Temperature (C)
2
Test Strips To test Ammonia, Nitrite, Nitrate, and PH 5 bottles
Caliper To Measure oysters (cm) 2
Refractometer For measuring Salinity (ppt) 1
Secchi Disk To measure water transparency 2
Sample Vials To hold water samples 4

10 | P a g e B i e s , K h a l i d R e v i s e d 3 / 1 3 / 2 0 1 6
Procedures
A selected collection of 50 spat were provided by a first generation of mature oysters, C.
virginica cultivated in Martha’s Vineyard. The mature oysters, C. virginica were originally
collected from the shores of Martha’s Vineyard, placed into two tanks of standard dimensions,
and then acclimated in hatcheries (41.395614, – 70.521689). The oysters were divided into two
groups to be bred: Mass spawning, and Individually spawned. The oyster strain bred through
Mass spawning was successfully created by removing the mature oysters from their tank,
keeping them together in the same bucket, and subsequently bred collectively. The Individual
spawning cohort was established by redistributing oyster semen equally, coming from each
mature male sexed to each female via micropipette. This ensured that each male’s gametes had
an equal chance of becoming a zygote. Both groups were placed in identically salinized and
heated tanks water temperatures between 20°C to 30°C (74°F to 86°F) and salinity was at set at a
level above 10ppt (Meritt, 2012) simulating an environment for breeding. After breeding,
sedimentation was facilitated by placing larvae onto dead shell. In the shared habitat, once in
juvenile state (when the oyster spat has successfully settled itself), both spawnings were packed
into two different nets with 50 cohorts (1– 2 spat per shell). These two different nettings were
identified by the amount of zip ties attached to each – 2 zip ties for Mass, and 1 zip tie for
Individual Spawning. The nets were packaged into a cage with the dimensions of 26x16x14(in) /
6.04x40.64x35.56 (cm), which was then set in the New York (Upper Bay) waters of Pier 101 off
Governors Island, located at (40.691453, – 74.012461). Fitness (mortality and growth) and
Physical Chemistry (salinity, temperature, pH, dissolved oxygen, ammonia, phosphate, nitrate,
nitrite, and secchi depth) were measured every week, in the span of 4 weeks, from the release of

11 | P a g e B i e s , K h a l i d R e v i s e d 3 / 1 3 / 2 0 1 6
the cage. Mortality is assessed by how many shells are emitting an “ooze” (releasing water when
pressure is added), half open, or have only half of a shell. For analyzing the data collected from
each spawning, 3 t– tests were used to evaluate the significant difference between Mass and
Individual spawning:
1.) An evaluation of the total data collected over the course of four sample weeks.
2.) A comparison of this new data with the last oyster measurement data collected,
performed on 11/18/15; and
3.) Analysis of dead oyster measurements.
Each t–test was created using the following equation:
12 | P a g e B i e s , K h a l i d R e v i s e d 3 / 1 3 / 2 0 1 6
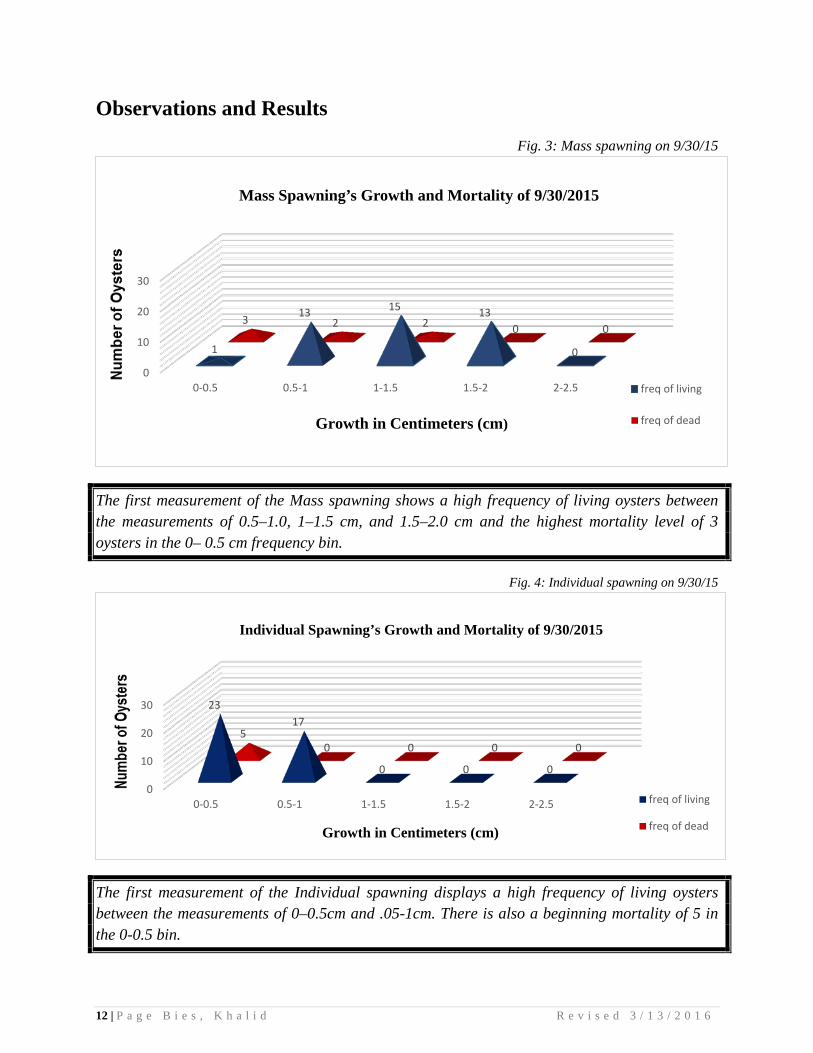
Observations and Results Fig. 3: Mass spawning on 9/30/15
The first measurement of the Mass spawning shows a high frequency of living oysters between the measurements of 0.5–1.0, 1–1.5 cm, and 1.5–2.0 cm and the highest mortality level of 3 oysters in the 0– 0.5 cm frequency bin.
Fig. 4: Individual spawning on 9/30/15
The first measurement of the Individual spawning displays a high frequency of living oysters between the measurements of 0–0.5cm and .05-1cm. There is also a beginning mortality of 5 in the 0-0.5 bin.
0
10
20
30
0-0.5 0.5-1 1-1.5 1.5-2 2-2.5
1
13 15 13
0
3 2 2 0 0
Mass Spawning’s Growth and Mortality of 9/30/2015
freq of living
freq of deadGrowth in Centimeters (cm)
0
10
20
30
0-0.5 0.5-1 1-1.5 1.5-2 2-2.5
23 17
0 0 0
5 0 0 0 0
freq of living
freq of deadGrowth in Centimeters (cm)
Individual Spawning’s Growth and Mortality of 9/30/2015

13 | P a g e B i e s , K h a l i d R e v i s e d 3 / 1 3 / 2 0 1 6
Fig. 5: Mass spawning on 10/16/15
The second measurement of the Mass spawning showed a decrease in the frequencies between the measurements of 0–0.5 cm, and 1-1.5 cm. However, the measurements of .5-1 cm have increased by 10. No dead oysters in the 0–0.5 cm bin were counted in the random selection process. There is a new peak of oysters in the 2-2.5 bin, meaning those in the 1.5- bin must have grown.
Fig. 6: Individual spawning on 10/16/15
The second measurement of Individual spawning shows a significant growth of the oysters, spiking at 1.0–1.5 cm, and starting to make a peak at 1.5–2.0 cm. This means that the oysters that once had a frequency of 0–0.5 cm, have now began to grow without significant mortality.
0
10
20
30
0-0.5 0.5-1 1-1.5 1.5-2 2-2.5
0 0
10
16
5 0 0
6
0 0
freq of living
freq of dead
Mass Spawning’s Growth and Mortality of 10/16/2015
Growth in Centimeters (cm)
f…
f…
0
10
20
30
0-0.5 0.5-1 1-1.5 1.5-2 2-2.5
0
16
26
4 0
0 1 1 0 0
freq of living freq of dead
Individual Spawning’s Growth and Mortality of 10/16/2015
Growth in Centimeters (cm)

14 | P a g e B i e s , K h a l i d R e v i s e d 3 / 1 3 / 2 0 1 6
Fig. 7 Mass spawning of 10/30/15
The third measurement of Mass spawning, similarly to the third Individual spawning, displays a dramatic decrease of bins 1.0–1.5 cm, 1.5–2.0cm, and 2.0 cm compared to the last sampling,
Fig. 8 Individual spawning of 10/30/15
The third measurement of Individual spawning shows a dramatic decrease in the frequency in the bins 0.5– 1.0 cm, 1.0– 1.5 cm and 1.5– 2.0 cm. This extreme change could have been the product of three variables–the predatory species, Microciona prolifera, began appearing on some of the shells and could be a cause of the decrease of large oysters. Next, spat could have been overlooked during the process of collecting 50 spat, due to their poor visibility.
0
10
20
30
0-0.5 0.5-1 1-1.5 1.5-2 2-2.5
0
9 12
9
1
0 0 2 0 0
freq of living
freq of dead
Mass Spawning’s Growth and Mortality of 10/30/2015
0
10
20
30
0-0.5 0.5-1 1-1.5 1.5-2 2-2.5
0
17 15
2 1
0 0 2 0 0
freq of living
freq of dead
Individual Spawning’s Growth and Mortality of 10/30/2015
Growth in Centimeters (cm)
15 | P a g e B i e s , K h a l i d R e v i s e d 3 / 1 3 / 2 0 1 6
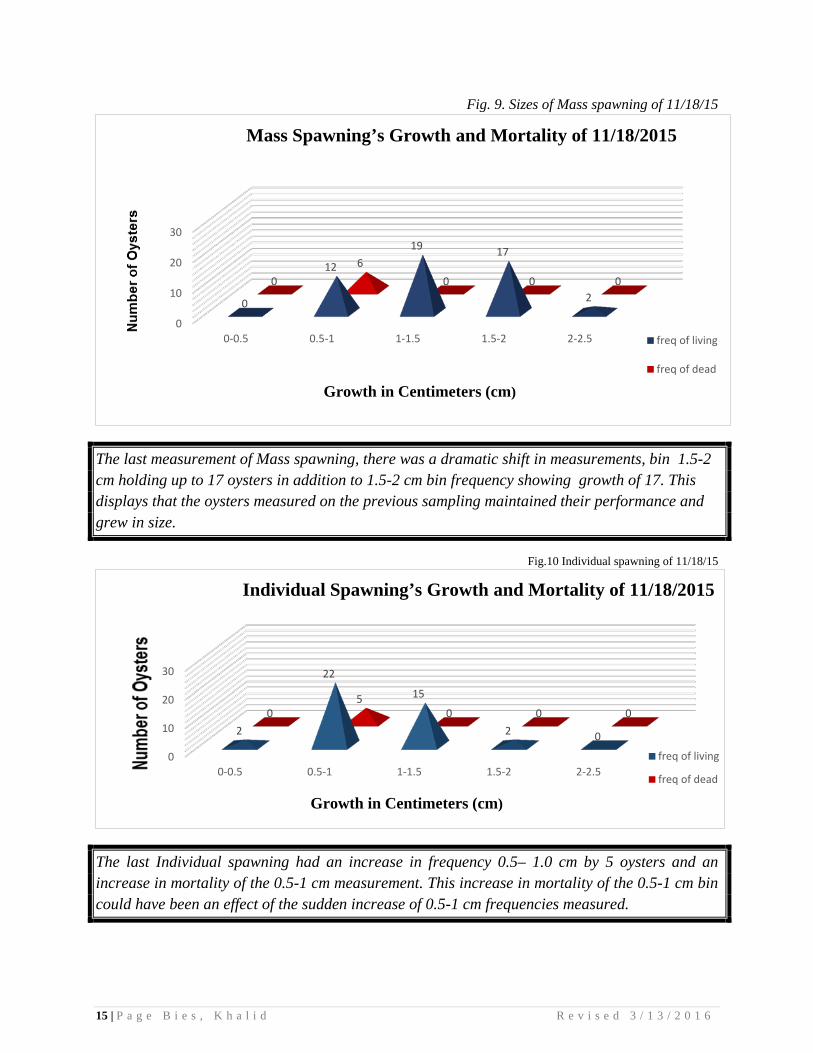
Fig. 9. Sizes of Mass spawning of 11/18/15
The last measurement of Mass spawning, there was a dramatic shift in measurements, bin 1.5-2 cm holding up to 17 oysters in addition to 1.5-2 cm bin frequency showing growth of 17. This displays that the oysters measured on the previous sampling maintained their performance and grew in size.
Fig.10 Individual spawning of 11/18/15
The last Individual spawning had an increase in frequency 0.5– 1.0 cm by 5 oysters and an increase in mortality of the 0.5-1 cm measurement. This increase in mortality of the 0.5-1 cm bin could have been an effect of the sudden increase of 0.5-1 cm frequencies measured.
0
10
20
30
0-0.5 0.5-1 1-1.5 1.5-2 2-2.5
0
12
19 17
2 0
6 0 0 0
freq of living
freq of dead
Mass Spawning’s Growth and Mortality of 11/18/2015
Growth in Centimeters (cm)
0
10
20
30
0-0.5 0.5-1 1-1.5 1.5-2 2-2.5
2
22
15
2 0
0 5
0 0 0
freq of living
freq of dead
Individual Spawning’s Growth and Mortality of 11/18/2015
Growth in Centimeters (cm)

16 | P a g e B i e s , K h a l i d R e v i s e d 3 / 1 3 / 2 0 1 6
Observations and Results (Cont’d)
A Range and an average of Physical– chemistry parameters (9/29/15– 11/18/15) Average (Range)
Temp
(C)
D. Oxygen
(ppm) pH
Salinity
(ppt)
Nitrite
(ppm)
Nitrate
(ppm)
Secchi Depth
(m)
Alkalinity
(ppm)
Ammonia
(ppm)
Phosphate
(ppm)
17.6
(13.26– 24.4)
6.22
(4.5– 9.5)
7.9
(6– 9.5)
27
(25– 35)
0
(0– 0)
0
(0– 0) 1m
84
(80– 120)
1
(0.5– 1)
8
(0.5– 15)
Analysis of Results
Test 1 revealed the differences between Mass and Individually spawned groups from the total
growth measurements. The absolute value of the derived t = 0.668 does not exceed the critical
value of t = 1.96 at p = 0.5 with df = 334. Based on the statistical test, we accepted H0 which
stated that there are no significant differences in the total growth rate between the two groups.
Test 2 The next two-tailed t-test preformed to compare the variation between the last oyster
measurements collected, performed on 11/18/15. Specifically, this compared the last live oyster
growth sampling, comparing Mass and Individual spawning. When tested, the derived t = 2.00
exceeds the critical value of t = 2.00 at p = .05 with df = 37. Therefore Ha is accepted and it is
concluded that the mean growth of Mass spawning (1.53) was significantly higher than the mean
of the Individual spawning (0.9), t (37) = 2.00 p< .05.

17 | P a g e B i e s , K h a l i d R e v i s e d 3 / 1 3 / 2 0 1 6
Test 3 The last t– test preformed analyzed the total dead oyster measurements collected. When
tested, the derived t = 1.99 exceeds the critical value of t = 1.98 at p = .05 with df = 87.
Therefore Ha is accepted and it is concluded that the mean mortality of Mass spawning ~(1.00)
was significantly lower than the mean of the Individual spawning ~(0.8), t (87) = 1.99 p< .05.
CONCLUSION
The goal of this project was to find significant differences, if any, in the growth rate and mortality of
Crassostrea virginica, and to see if that had any correlation to the water parameters present. After
thoroughly investigating the correlation of the mortality samples and their matching water physical
chemistry, there was no obvious correlation between physical, chemical data readings and mortality rates
to draw any conclusions that the physical chemistry of the water significantly affected the oysters. From
our findings, we concluded that the Mass spawning had a faster growth rate and a lower mortality rate.
Therefore, from this research, conservationists should favor Mass over Individual methods of spawning.

18 | P a g e B i e s , K h a l i d R e v i s e d 3 / 1 3 / 2 0 1 6
Bibliography
Bharali, Krishna. 2007. Health Impacts of Water Pollution, TERI. Retrieved October 22, 2014, from http://edugreen.teri.res.in/explore/water/health.htm.
Camara, Mark D., and Brent Vadopalas. "Genetic Aspects of Restoring Olympia Oysters and Other Native Bivalves: Balancing the Need for Action, Good Intentions, and the Risks of Making Things Worse." Journal of Shellfish Research 28.1 2009: 121– 145.
Eble, Albert F., and Scro, Robert. "General Anatomy." The Eastern Oyster Crassostrea Virginica. Maryland Sea Grant College, College Park, MD 1996: 19– 73.
Galtsolf, P.S., & U.S. Fish and Wildlife Service. 1964. The American Oyster, Crassostrea Virginica Gmelin. Washington, D.C.:U.S. G.P.O.
Herbility: Introduction. (n.d). Received August 27, 2014, from http://psych.colorado.edu/~carey/hgss/hgssapplets/herbability/herbability.intro.ht ml.
Merrill, Philip. 2014. Eastern Oyster. (n.d). Retrieved October 28, 2014, from http://www.cbf.org/about– the– bay/more– than– just– the– bay/creatures– of the Chesapeake/eastern– oyster.
Meritt, D., 2012. Oysters Life Cycle Horn Point Lab Oyster Hatchery. Retrieved December 8, 2015, from http://hatchery.hpl.umces.edu/oysters/oysters– life– cycle/
Munoz, G., Myers, J., Pflugh, K., & Nyman, R. (Eds.). (2010). Special Issue Dedicated to the Eastern Oyster. The Tidal Exchange, 12– 12.
Newell, Rodger. 1988. Ecological Changes in Chesapeake Bay: Ecological Changes in Chesapeake Bay: Are They the Result of Overharvesting the American Oyster, Crassostrea virginica? Understanding the Estuary: Advances in Chesapeake Bay Research, 129, 1988: 536– 546.
Nigro, Carmen and Stephen A. 2011. History on the Half– Shell: The Story of New York City and Its Oysters. Retrieved October 28, 2014, from http://www.nypl.org/blog/2011/06/01/history– half– shell– intertwined– story New York– city– and– its– oysters.
“Oyster” 22 April 2008 (n.d). How Stuff Works. Received July 28, 2014, from http://animals.howstuffworks.com/marine– life/oyster– info.htm.
Yu, Z. and K. H. Chu. 2006. Genetic Analysis of Selected Strains of Eastern Oyster (Crassostrea Virginica Gmelin) Using AFLP and Microsatellite Markers. Marine Biotechnology. 6: 575– 586.
Zhang, H., J. Scarpa, and M.P. Hare. October 2010. Differential Fertilization Success Between Two Populations of Eastern Oyster, Crassostrea virginica. Biological Bulletin,
219 (2), 142–150. Retrieved September 5, 2014, from http://www.jstor.org/stable/27899000.
19 | P a g e B i e s , K h a l i d R e v i s e d 3 / 1 3 / 2 0 1 6
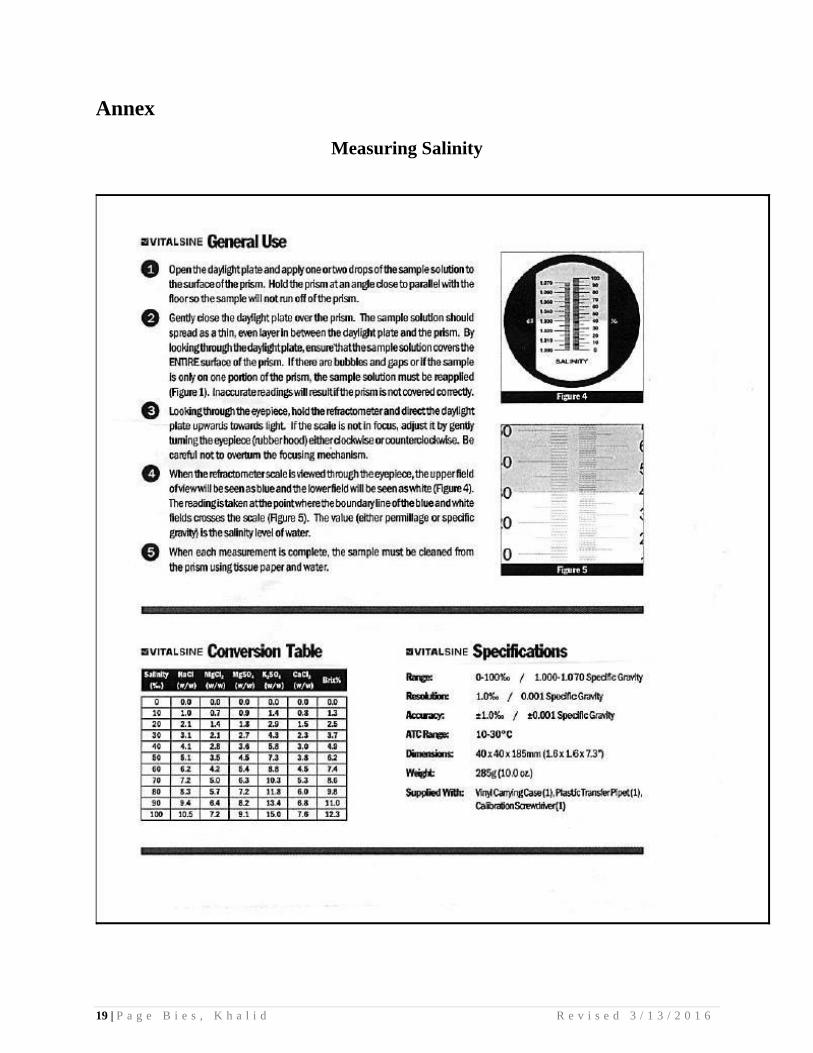
Annex
Measuring Salinity

20 | P a g e B i e s , K h a l i d R e v i s e d 3 / 1 3 / 2 0 1 6
Annex Con’t

21 | P a g e B i e s , K h a l i d R e v i s e d 3 / 1 3 / 2 0 1 6
Annex Con’t
Dissolved Oxygen (ppm) with the Modified Winkler Method
Acquire Water Sample by lowering either a 7 gallon (26.4979 Liter) Beta Bottle or a 5 gallon (18.9271 Liter) bucket with an attached rope.
Fill Sampling Bottle by submerging bottle fully in water Empty and refill bottle for accuracy Once filled, cap while underwater and set aside on a flat surface Uncap and add 8 drops of Maganous Sulfate Solution (Note: all chemical
dropper bottles should be held at a 90°angle directly facing the Sample bottle)
Add 8 drops of Alkaline Iodide Azide Cap and invert bottle vigorously 3 times Set aside and let precipitate settle to the neck of the sample bottle Add 8 drops of Sulfuric Acid to Sample Bottle Cap and invert bottle vigorously 3 times Set aside and let precipitate settle to the bottom of the sample bottle Fill Test Tube with the mixture from the Sample Bottle to the 20 mL line.
Cap and set aside Depress the plunger of the Titrator Insert the Titrator into the opening of the Sodium Thiosulfate Invert the bottle of Sodium Thiosulfate and slowly withdraw the plunger
until slightly over zero (for next step) If any air bubbles have occurred, flick Titrator lightly with finger and push
plunger up to the zero line With the Titrator, add Sodium Thiosulfate to the Test Tube until the mixture
turns a pale yellow (Note: Slowly swirling Test Tube in clockwise directions while adding Sodium Thiosulfate is recommended) Set aside Titrator
Add 8 drops of Starch indicator to Test Tube; shake slightly until mixture turns black or purple
With the Titrator, add Sodium Thiosulfate drops until clear Read result by measuring how much Sodium Thiosulfate is remaining in
Titrator in ppm For accuracy, perform sampling test twice
22 | P a g e B i e s , K h a l i d R e v i s e d 3 / 1 3 / 2 0 1 6
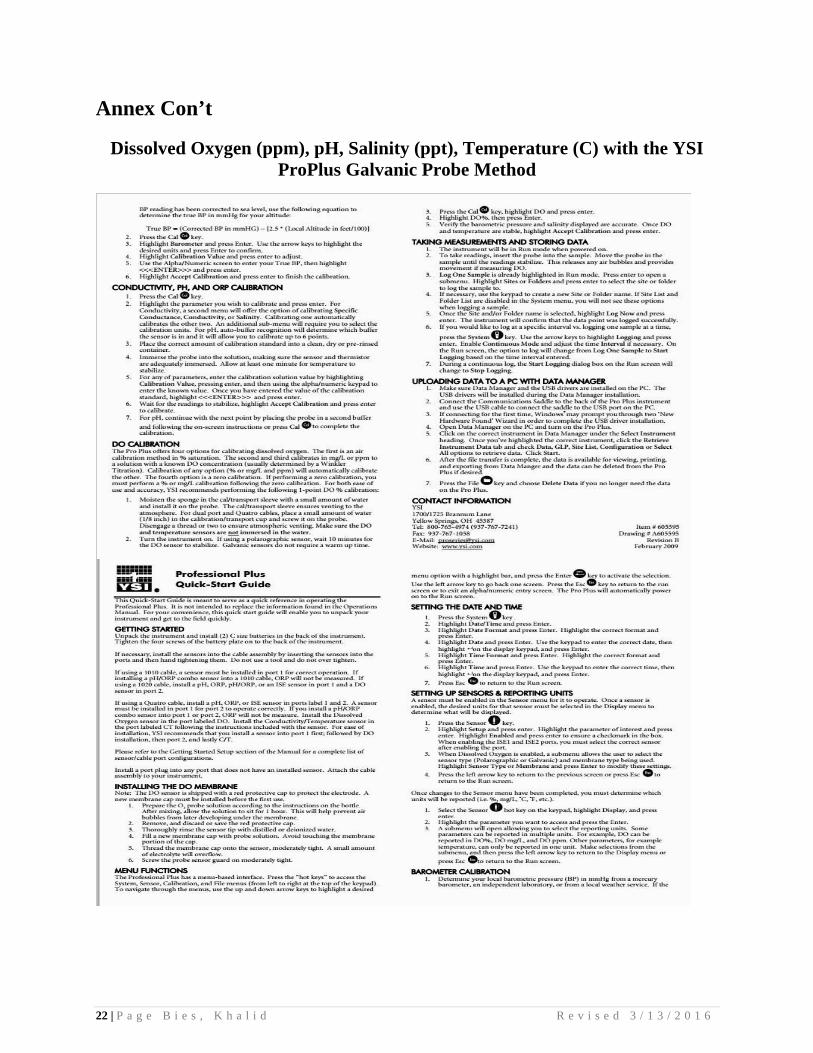
Annex Con’t
Dissolved Oxygen (ppm), pH, Salinity (ppt), Temperature (C) with the YSI ProPlus Galvanic Probe Method

23 | P a g e B i e s , K h a l i d R e v i s e d 3 / 1 3 / 2 0 1 6
Annex Con’t
Taking a Secchi Disk Reading
The Secchi disk into the water in the spot of testing. Keep lowering the disk slowly until it disappears. Note the depth on the cord.
Record the average Secchi depth on the data sheet along with the date and time of the reading. pH, Nitrite, and Nitrate with Aquacheck Colorimetry

24 | P a g e B i e s , K h a l i d R e v i s e d 3 / 1 3 / 2 0 1 6
Annex Con’t
Ammonia with Aquacheck Colorimetry
Phosphate with Aquacheck Colorimetry
)