survival analysis of foreign banks in pakistan
TRANSCRIPT
Survival Analysis of Foreign Banks in Pakistan
Qurat ul ain1
Dr Muhammad Azmat Hayat2
Abstract
Purpose. The objective of this paper is to explore the major macroeconomic and financial
variables which contribute towards the survival or failure of foreign banks in Pakistan from 1990
to 2015 by applying discrete time logistic survival analysis.
Design/ Methodology/ Approach. Discrete time logistic survival analysis is applied in this
paper which highlights the major macroeconomic and financial factors contributing towards the
survival or failure of foreign banks in Pakistan.
Findings. The findings of discrete time logit model indicate that all the major macroeconomic
variables which are included in this paper i.e. GDP growth rate, Inflation and Exchange rate are
found to contribute towards failure of foreign banks in Pakistan. While out of 6 financial ratios
only operating expenses to total assets ratio and net advances to total assets ratio are found to
contribute towards the survival of foreign banks in Pakistan.
Research Limitations. This research paper could be further extended if continuous time survival
analysis is applied through quarterly available data and with a different form of baseline hazard
model the results may vary.
Practical Implications. Foreign banks directly or indirectly boost up the economy of the host
country. Thus, by highlighting the factors which contribute towards their failure precautions
could be taken to control foreign banks failure in Pakistan so that their survival time might be
enhanced.
1 Research Scholar, Department of Economics, University of the Punjab, Lahore. Email: [email protected] 2 Assistant Professor, Department of Economics, University of the Punjab, Lahore. Email:[email protected]
Originality/ Value. This research paper would be the first practical work which is investing the
factors contributing towards the failure or survival of foreign banks in Pakistan.
Key Words. Discrete time logistic survival analysis, Pakistan, Foreign banks, Macroeconomic
variables, Financial Variables
1. Introduction
Foreign banks are defined as the banks which operate in other countries by having their
branches in those countries and following the regulations of both the home and the host countries.
Directly foreign banks bring capital in the host country in the form of investment and capture most
of the market by providing standard quality services. While indirectly foreign banks capture
customers in the host country by promoting the use of modern technology in the financial sector
and encourage domestic banks to provide better quality services by increasing competition in the
financial sector along with provision of better quality services at lower cost as supported by
(Bilgrami & Fatima ,2012). Bhattacharya and Thakor (1993) presents individual cases of Pakistan,
Turkey and Korea where the access to foreign capital is made by capitalized foreign banks in order
to fund domestic projects. Although foreign banks are found to indulge in capital flight and
sometimes dominating the domestic financial market by beating domestic financial sector through
their advanced and better quality services. But irrespective of the cost and benefits of foreign
banks, they can stimulate the growth of financial sector of the host country through direct or
indirect channels.
Foreign banks are playing their role in the financial development of many developing
countries including Pakistan but their role usually depends upon several factors which contributes
towards their operation or exist in the host countries or sometimes such banks might merge in the
domestic banking sector. This study basically examines the factors which contributes towards the
survival of foreign banks in Pakistan. . Operation of foreign banks in Pakistan could create several
benefits for our economy for example such banks could provide a platform to merge in the world
economy, having investment from abroad, international explore could increase and moreover use
of advanced technology in the banking sector could provide improved and better quality services
to the customers. For instance, a comprehensive range of banking services including credit cards,
retail banking, corporate and investment banking and wealth management are offered to
individuals and corporations by Barclays bank in Pakistan.
In 1999, Citibank was the first foreign bank to launch MasterCard in Pakistan and in 2000
it is the first financial institution to launch personal loans in Pakistan. Deutsche Bank was
established on 22 July 1961 with named as Deutsche Asiatische Bank although it was later named
as Deutsche Bank A.G on 5 April 1988. Deutsche Bank A.G has captured a handsome number of
customers by providing quality services to the investors and the individuals due to its regional and
international expertise thus it was named the best Bank in The Asset’s Triple A Awards 2008. a
glimpse on the registration of some major foreign banks in Pakistan is presented in the following
table.
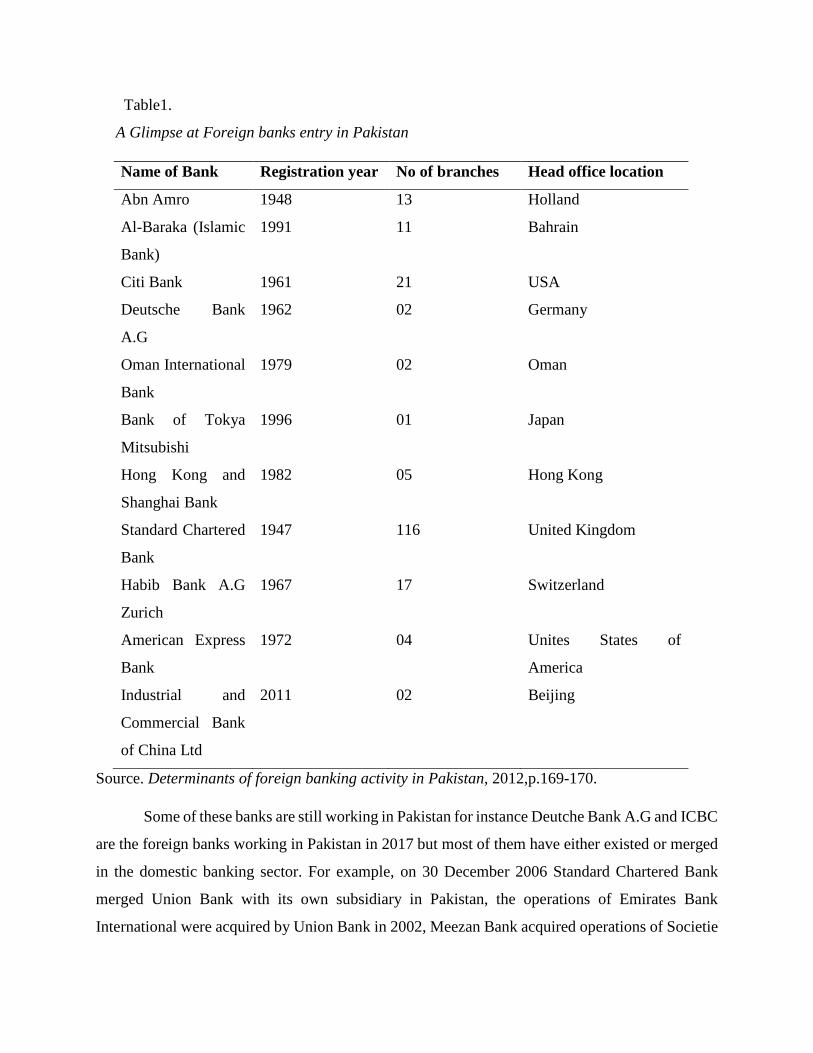
Table1.
A Glimpse at Foreign banks entry in Pakistan
Name of Bank Registration year No of branches Head office location
Abn Amro 1948 13 Holland
Al-Baraka (Islamic
Bank)
1991 11 Bahrain
Citi Bank 1961 21 USA
Deutsche Bank
A.G
1962 02 Germany
Oman International
Bank
1979 02 Oman
Bank of Tokya
Mitsubishi
1996 01 Japan
Hong Kong and
Shanghai Bank
1982 05 Hong Kong
Standard Chartered
Bank
1947 116 United Kingdom
Habib Bank A.G
Zurich
1967 17 Switzerland
American Express
Bank
1972 04 Unites States of
America
Industrial and
Commercial Bank
of China Ltd
2011 02 Beijing
Source. Determinants of foreign banking activity in Pakistan, 2012,p.169-170.
Some of these banks are still working in Pakistan for instance Deutche Bank A.G and ICBC
are the foreign banks working in Pakistan in 2017 but most of them have either existed or merged
in the domestic banking sector. For example, on 30 December 2006 Standard Chartered Bank
merged Union Bank with its own subsidiary in Pakistan, the operations of Emirates Bank
International were acquired by Union Bank in 2002, Meezan Bank acquired operations of Societie
Gereral in Pakistan, The Royal Bank of Scotland sold out its operations although it was the largest
foreign bank in Pakistan having 79 branches across the country.
Iqbal (2013) reported in his article that regarding the case of Pakistan the profit margin of
foreign banks is most of the time adversely affected due to several reasons including both the
financial factors and some major economic factors. Some of the financial factors which have
contributed towards the desperate results on the part of foreign banks in Pakistan are shrinking
spread (the difference between the lending and borrowing rates), declining yields on T-bills, non-
availability of foreign exchange deposits and disrupted cash flows from the declining repayment
ability of the borrowers, declining deposits registration and declining lending rates. But on the
other hand, some of the other factors including slow pace of economic development, political
instability, foreign currency freezing accounts policy, poor domestic governance, poor law and
order situation and exchange rate instability have also worsened the situation by shrinking their
deposits base.
Dar (2015) reported that 5 major banks including Allied Bank, Habib Bank, United Bank,
National Bank and Muslim Commercial Bank have attained their goal of capturing most of the
customers in the country by proving better quality services and expanding their network in the
whole country thus making it difficult for the foreign banks to increase their size in the whole
country. When exchange rate of Pakistani rupee against the international currencies like US dollar
or British pound detoriates, profit margin of foreign banks declines. . For example, due to
detoriating macro-economic conditions in the country Societe General decided to close its 4
branches in the country while Meezan Bank acquired the local operations of Societe General in
2002. Similarly in 2015 Meezan Bank have decided to purchase the sole branch of HSBC Oman.
This paper is carried out to find out the average survival time of a foreign bank in Pakistan
by exploring some macroeconomic and financial factors which contributes towards their operation
or failure. For this purpose statistical technique known as survival analysis is used while Survival
analysis basically explains the time to a specific event and that event can be a death, divorce or
bank failure. Survival analysis is classified on the basis of time whether the time is treated as
continuous or discrete. In this analysis the time to bank failure is measured in year’s thus discrete
time logistic survival analysis is applied with some major macroeconomic variables including gdp
growth rate, inflation rate and exchange rate and 6 major financial ratios of the foreign banks .
Data on the financial ratios of foreign banks is collected from the financial statements of foreign
banks from State Bank of Pakistan and for macro-economic variables data is collected from World
Development Indicator.
2. Literature Review
Meyer and Pifer (1970) presented the first work on the introduction and development of
the bank failure prediction model by using the discriminant analysis for the creation of the bank
failure prediction models. The authors concluded that the discriminant analysis used to verify the
bankruptcy up to two years provided the reliable results but for a period more than two years it
was not reliable to foresee the future failure by using the financial indicators. Thus, other methods
were introduced to construct the bank failure prediction models including logistic regression
analysis and survival analysis.
The bank failure prediction model developed by using the survival analysis has presented
better results for a horizon of two years prior to the insolvency of banks when a comparison was
made between the survival analysis and the discriminant analysis. Although a semi parametric
technique of survival analysis known as Cox proportional hazards model was applied to estimate
the bank failure. (Lane et al, 1986).
Mayes and Stremmel (2012) applied logit model in discrete time survival analysis to
predict bank failure in USA on the quarterly base data of Federal Deposit Insurance Cooperation
from 1992 to 2012. The authors constricted their model on the risked based and non-risked
weighted measure of capital adequacy and concluded that non-risked weighted capital measure
along with the adjusted leverage ratio better explains bank failure in USA.
Canicio and Blessing (2014) investigated the causes of bank failure in Zimbabwe during
multiple currency regime covering the time period from 2009 to 2012 with the implementation of
logit model on fourteen banks. They concluded that GDP growth rate was the only strongest
macro-economic variable to have a negative impact on the bank failure in Zimbabwe because
inflation is not a problem in the country and exchange rate is not included in the study as Zimbabwe
own multiple currencies. Among the financial variables, loan to deposits ratio (LTD), deposits to
assets ratio (DTA), return on assets (ROA), efficiency ratio (EFR) and size of the bank are found
to influence negatively the chances of bank failure while loan to assets ratio (LTA) was found to
have positive influence on bank failure in Zimbabwe.
Lane et al (1986) have done the initial work to predict bank failure by using the survival
analysis. They made a sample of 464 banks including 334 successful and 130 failed banks covering
the time period from 1979 to 1983 to predict the bank failure by using a cox proportional hazards
model. The predicted values for two years were comparable with the results obtained by using the
discriminant analysis but the two year predictions made by using the survival analysis’s cox
proportional hazards model produced lower type 1 errors. The prediction accuracy of using the
cox proportional hazards model of survival analysis was supported when it was applied on some
credit unions in Australia and it produced the similar results (Crapp & Stevenson, 1987).
Leung (1997) have applied discrete time logit model to find out the determinants which
influence the decisions of foreign banks of having their branches in China. Researcher concluded
that foreign banks with sound financial position are found to boost up investment in China while
China’s restricted capital movement and insufficient legal framework have contributed towards
the entry of foreign banks in the domestic banking sector. Arabi (2013) predicted bank failure in
Sudan by applying both the logistic regression and the discriminant analysis and concluded that
among asset quality, liquidity and capital adequacy, earning on the part of a bank was the most
dominant factor to cause bank failure.
No standards are set for the use of the number of the predictor variables thus the choice is
simply in the hands of the author. Sales (2005) applied survival analysis irrespective of the time
distinction to predict bank failure in Brazil by using a larger set of predictor variables having high
ability to predict bankruptcy. Although same results were obtained by Whalen (1991) using the
statistical technique of survival analysis to predict the bank failure but the major difference
between their analyses was that the number of predictors used by both the authors were different.
Irrespective of the number of explanatory variables most of the work on the bank failure
prediction is done in Brazil by applying the Logistic regression analysis by Matias and de Oliveira
Siqueira (1996), Araújo (1998), Matias (1999), Alexandre, Canuto and Silveira (2003), Correa et
al (2006) and Costa (2007). Araújo (1998) applied logistic regression analysis to predict bank
failure in Brazil with capital index and operating expenses as the explanatory variables while both
the variables were found to be statistically significant to explain likelihood of bank failure in
Brazil.
Laitinen and Luoma (1991) presented the first paper which did not only describe the use
of cox proportional hazard model for predicting bank failure but also presents the merits and
demerits of using the cox proportional hazard model technique as a bank failure prediction model.
By using total 72 businesses including 36 failed finish limited companies and 36 successful

counterparts the accuracy of cox proportional model was empirically compared with the
Discriminant analysis and Logit analysis. Than the prediction of failure was made by dividing the
businesses into two groups based on their hazard ratio and then businesses with higher hazard ratio
were predicted to fail while with lower hazard ratio businesses were predicted to be succeeded.
The techniques were compared and the DA and LA were found superior to the cox model.
But Laitinen and Luoma (1991) stated that that the Survival analysis technique was more natural,
flexible, and used more information. So the empirical superiority of DA and LA could be due to
the small sample size which could be increased to gain an over the traditional models. Although
earlier support was given by Keasey et al. (1990) and Ogg (1988) who recommended that Survival
Analysis techniques should be used in bank failure prediction.
Kauffman and Wang (2001) illustrated the adequacy of using the survival analysis models
to explain the business failure process by examining the derivers behind the survival of internet
business by using a data set of consisting quarterly data on 100 internet businesses covering the
time period from 1996 to 2001.The non-parametric approach known as Kaplan Meier was used to
presents the descriptive analysis and the semi parametric approach was used to explore the relative
strength of the six explanatory variables. While both of the approaches present accurate results for
predicting the internet business failure process. Shumway (2001) presented the first work on the
use of a multi-period logit model to estimate the coefficients of survival analysis model although
he only considered the Type 1 error.
Income to assets ratio indicates the return on assets and the profitability of a bank as
justified by Bongini et al. (2001), Lanine and Vennet (2006). This ratio indicates the efficiency of
the bank management to generate income and the higher the income of the bank the higher the
chances for a bank to make further investment and loans to earn more profit. But on the other hand
if a bank issues more loan it will damage the credibility of the bank making it unable to meet its
liquidity requirements. Thus the influence of the earning factor on the survival or failure of a bank
is quite arguable as supported by Taran (2012).The findings by the author suggested that higher
profitability of a bank indicates efficient working of the bank management which reduces the
chances of bank failure and this argument is supported by Lanine and Vennet (2006) while on
the other hand higher earnings on the part of a bank leads towards portfolio risk thus increasing
the chances of bank failure and this conclusion is supported by Jordan et al. (2010).
3. METHODOLOGY
Survival analysis is a technique which is used to examine the time to a specific event while
the event is defined as death, divorce or birth. In survival analysis the time to an event can be
described in days, weeks or months and the dependent variable is the time until the occurrence of
a specific event while the covariates may vary over time. Thus, the whole matter of interest is the
time to the occurrence of an event in the survival analysis so it is also termed as duration analysis
or event history analysis.
3.1. Particular aspects of Survival Analysis
Survival analysis is preferred to linear regression model due to its specific aspects which
contributes towards the measurement of the time to an event or survival time. Following are
discussed some of the notable attributes of the event history analysis or survival analysis
3.1.1. Durations
Duration is defined as the time during which an activity continues until the event of interest
occurs. Allison (1995) concluded that observations with different durations (staggered entry) can
be analyzed in survival analysis and this feather is an advantage of this technique. In survival
analysis since the time to an event of interest is examined and this act is accomplished on the basis
of the durations of the event. One of the reasons of not applying linear regression to model the
survival time as a function of explanatory variables is that durations are always positive having a
positively skewed distribution while ordinary linear regression remains no more appropriate until
this restriction is removed.
3.1.2. Censoring
Kleinbaum and Klein (2012) have explained that censoring occurs when some observations
during the study time do not experience the event but might face the event at some unknown time
in future. Jenkins, (2008) Observations are termed as censored when the information about their
survival time is incomplete thus censoring is a specific type of missing data. Kleinbaum and Klein
(2012) provided three accepted justification for censoring which are as following
An observation do not encounter an event till the end of the study time.
The observation is lost to pursue.
People choose to quit when we are working with them.
In either situation the observation will be censored and we can analyze such an observation
by applying survival analysis.
3.1.3. Event and censoring times
Each observation is termed as censored or failed on the basis of observation time thus event
and censoring times are of crucial importance in duration analysis. The following table explains
the difference between event and censoring times and denotes their specific symbol.
Table 3.1
Difference between event times and censoring times
Event time (𝑡𝑖) Censoring time (ci)
The time at which a specific event occurs is
defined as the event time which is also known
as duration time or failure time and it is
denoted by T, the random variable as
𝑡𝑖= Event time for individual i.
While the time at which an observation is
censored is described as the censoring time
indicated by 𝛿𝑖 where
if ci=1 Uncensored individual.
if ci =0 Censored individual.
3.2. Recording Discrete Event History Data
Durations, censoring, event and censoring times are important features of survival analysis.
The simplest situation of all these is described in the following graph.
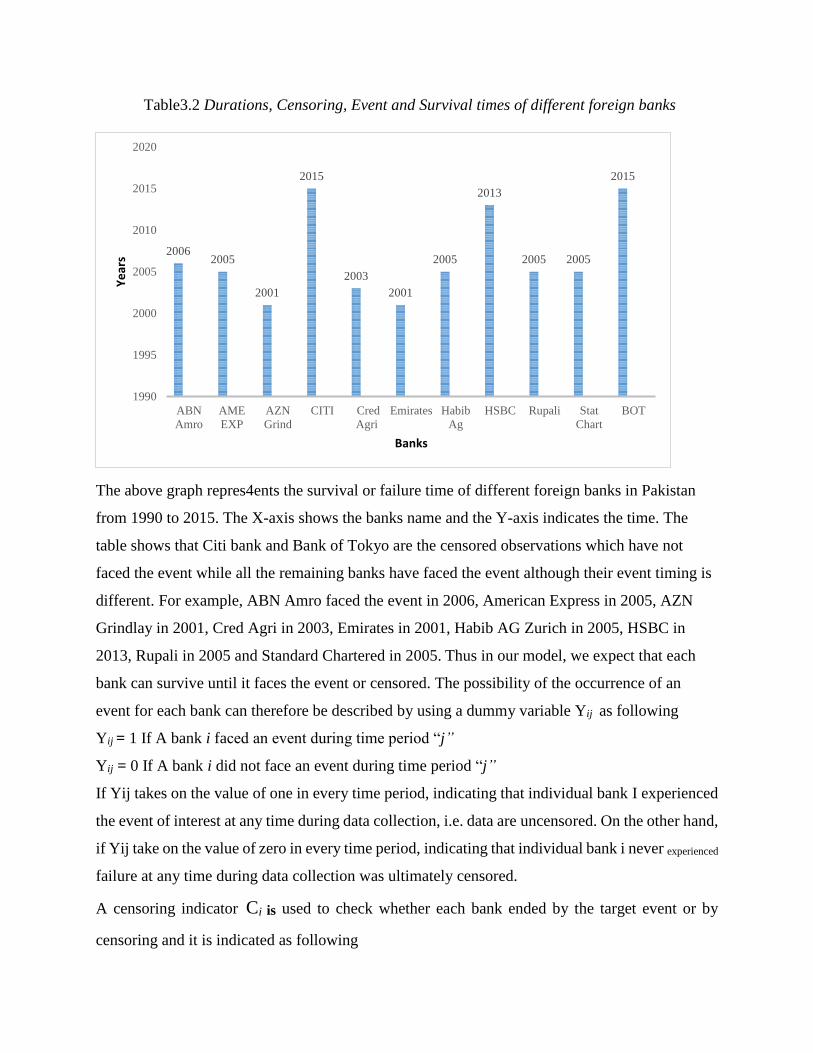
Table3.2 Durations, Censoring, Event and Survival times of different foreign banks
The above graph repres4ents the survival or failure time of different foreign banks in Pakistan
from 1990 to 2015. The X-axis shows the banks name and the Y-axis indicates the time. The
table shows that Citi bank and Bank of Tokyo are the censored observations which have not
faced the event while all the remaining banks have faced the event although their event timing is
different. For example, ABN Amro faced the event in 2006, American Express in 2005, AZN
Grindlay in 2001, Cred Agri in 2003, Emirates in 2001, Habib AG Zurich in 2005, HSBC in
2013, Rupali in 2005 and Standard Chartered in 2005. Thus in our model, we expect that each
bank can survive until it faces the event or censored. The possibility of the occurrence of an
event for each bank can therefore be described by using a dummy variable Yij as following
Yij = 1 If A bank i faced an event during time period “j”
Yij = 0 If A bank i did not face an event during time period “j”
If Yij takes on the value of one in every time period, indicating that individual bank I experienced
the event of interest at any time during data collection, i.e. data are uncensored. On the other hand,
if Yij take on the value of zero in every time period, indicating that individual bank i never experienced
failure at any time during data collection was ultimately censored.
A censoring indicator Ci is used to check whether each bank ended by the target event or by
censoring and it is indicated as following
20062005
2001
2015
2003
2001
2005
2013
2005 2005
2015
1990
1995
2000
2005
2010
2015
2020
ABN
Amro
AME
EXP
AZN
Grind
CITI Cred
Agri
Emirates Habib
Ag
HSBC Rupali Stat
Chart
BOT
Years
Banks

Ci = 1 If bank i is censored → Yij =1 for j = Ti , Yij = 0 otherwise
Ci = 0 If bank i is not censored → Yij =0 for all j.
Let T denote the discrete time interval of the event where T is indexed by using positive integers
{1, 2, 3, . . . , J} and Yij represents the binary dependent variable, i.e. if a bank’s spell ends in
year j or not.Each bank’s spell is observed from year one through to the end of the jth year, at
which bank i’s spell is either complete (ci =1), or right censored (ci =0) (Singer and Willett,
1993; Jenkins, 2004).
3.3. Discrete-time intervals
An event scale can be categorized as either continuous or discrete. If the time units are large,
such as months, years, or decades, it is more suitable to use discrete time methods (Jenkins,
2004). Thus, as we have an annual data set, the research deals with events measured or occurring
in discrete-time or group-time intervals. In such studies, spell lengths are observed in intervals
and indexed by using positive integers, such as 1, 2, 3, . . . , etc. and the observations are
summarized discretely rather than continuously.
3.3.1. Discrete Time Logit model or Proportional Odds Model
This model reports coefficients along with the odds ratio in discrete time survival analysis.
When we estimate coefficients we use Logit and for estimating odds ratio we use logistic and
regress the independent variables along with the baseline hazard function on the binary dependent
variable. A logit model is described as following
𝑙𝑜𝑔 (𝑝𝑡𝑖
1−𝑝𝑡𝑖)=α𝐷𝑡𝑖 +β𝑥𝑡𝑖 (1)
In the above equation
𝑝𝑡𝑖 Is the probability of an event during interval t
𝐷𝑡𝑖 Is a vector of functions with coefficient α
𝑥𝑡𝑖 Is a vector of covariates with coefficient β
α𝐷𝑡𝑖 is the baseline hazard with explains the changes in 𝑝𝑡𝑖 with time and this baseline hazard can
be defined in different ways for example as a step function, log of time or polynomial form (Fiona
& Elizabeth,2013).
In logistic regression a coefficient βj=1 means that if we change Xj by 1, the log of the
odds that Y occurs will go up by 1.Suppose odds ratio (OR) =4 than it can be interpreted as the
odds for the group coded as 1 are 4 times more than the odds for the group coded as 0. The logit

model is employed for the discrete time survival analysis because we have a binary dependent
variable and this model is dealing with both of the failed and the survived subjects (Greene, 2008).
3.3.2. Discrete time Functions
Kiefer (1988) have described survival analysis in detail by presenting the main concepts
of the survival analysis which are the survival function and the hazard function. Thus, the
discrete time functions are classified as followings
1. Discrete time hazard function
2. Discrete time Survival function
3.3.2.1 Discrete time hazard function
Discrete time hazard function is given as following
𝑝𝑡𝑖 =𝑃𝑟 (𝑦𝑡𝑖 =1ǀ𝑦𝑡−𝑖 , i=0) (2)
Where 𝑝𝑡𝑖a discrete time approximation to the continuous time hazard function hi (t)
.Discrete time hazard function denoted by 𝑝𝑡𝑖 is the probability that individual i has an event during
interval t, given that no event has occurred before the start of t.
The conditional failure probability which is often termed as discrete time hazard is given
as
h (t)=P(T=t ǀ T≥t) (3)
But here h (t) is only approximately a rate and if intervals are small only then this
approximation is good (Fiona & Elizabeth, 2013).
The hazard function actually explains the probability of experiencing the event over time
and how that probability changes with time. However there is a concept to be clarified before the
estimation of hazard function: the event of interest, also called failure event, which corresponds to
the time when a company or individual no longer remain as they were before. In case f Pakistan
the hazard rate of foreign banks have an upward trend and it is calculated in Appendix 1 and
graphically the increasing hazard rate is presented in Appendix 2(table 1).
3.3.2.2. Discrete Time Survival Function
The survival function which indicates the probability of survival during a specific time
period in discrete time model is explained by Bruderl (2012) as
S (t)=P(T>t) =∏ (1 − ℎ(𝑢))𝑡𝑢=1 (4)

Kiefer (1988) described the logic of the survival function being P (T>t) rather than P (T =
t) is that some observations in the study will not experience the event during our study and thus
there time to event is unknown usually called the censored observations. The survival rate of
foreign banks in Pakistan is decreasing and it is calculated in Appendix 1 and graphically
represented in Appendix 2(table 2).
4. DATA AND VARIABLE DESCRIPTION
4.1. Data
In order to analyze the survival of foreign banks in Pakistan we used data of the 6 financial
ratios including NITA, NATA, DTA, OETA, NPLTA and NAD of 21 foreign banks along with
some major macroeconomic indicators including GDP growth rate annual percentage, inflation
GDP deflator and exchange rate rupee per US$ covering the time period from 1990 to 2015. The
data of the financial ratios of foreign banks is collected from the financial statements of foreign
banks from the annual report of State bank of Pakistan. Data for GDP annual percentage growth
rate and inflation as GDP deflator annual percentage growth is collected from World Development
Indicator (WDI) while for exchange rate data is collected from Knoema as exchange rate rupee
per US $.
4.2. Definition of variables and Measurement
The variables used in this study along with their description are as following
4.2.1. Dependent Variable
4.2.2. Explanatory Variable
4.2.1. Dependent Variable
In discrete time survival analysis of foreign banks in Pakistan the dependent variable is in
binary form to categorize failed or survived bank. Thus, the dependent variable is the survival and
hazard ratios of foreign banks which takes the binary form as 1 if the bank have experienced the
event during a specific time period or have failed and 0 if the bank is censored or have survived or
have not faced the event.
4.2.2. Independent variable
The Explanatory variables applied in this study are a combination of financial
Ratios of foreign banks and major macroeconomic variables. The financial ratios are calculated
by using data on financial variables from the financial statements of the foreign banks.
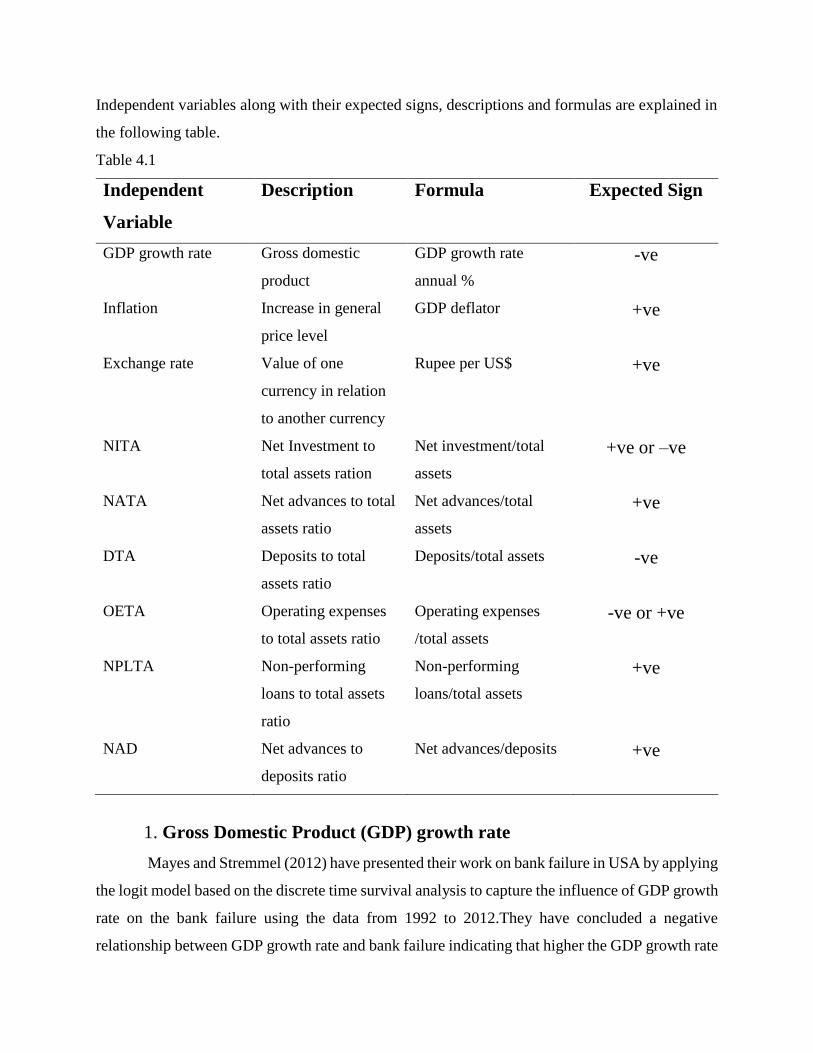
Independent variables along with their expected signs, descriptions and formulas are explained in
the following table.
Table 4.1
Independent
Variable
Description Formula Expected Sign
GDP growth rate Gross domestic
product
GDP growth rate
annual %
-ve
Inflation Increase in general
price level
GDP deflator +ve
Exchange rate Value of one
currency in relation
to another currency
Rupee per US$ +ve
NITA Net Investment to
total assets ration
Net investment/total
assets
+ve or –ve
NATA Net advances to total
assets ratio
Net advances/total
assets
+ve
DTA Deposits to total
assets ratio
Deposits/total assets -ve
OETA Operating expenses
to total assets ratio
Operating expenses
/total assets
-ve or +ve
NPLTA Non-performing
loans to total assets
ratio
Non-performing
loans/total assets
+ve
NAD Net advances to
deposits ratio
Net advances/deposits +ve
1. Gross Domestic Product (GDP) growth rate
Mayes and Stremmel (2012) have presented their work on bank failure in USA by applying
the logit model based on the discrete time survival analysis to capture the influence of GDP growth
rate on the bank failure using the data from 1992 to 2012.They have concluded a negative
relationship between GDP growth rate and bank failure indicating that higher the GDP growth rate
is the less the chances for a bank to fail and vice versa. Thus in our analysis we are expecting a
negative relationship between the GDP growth rate and bank failure which indicates that as the
GDP growth rate increases there are less chances for banks to fail and vice versa
2. Inflation
Azam and Siddiqui (2012) concluded that foreign bank’s profitability is affected by inflation
which is associated with both the higher cost and the higher income. The profitability of the bank
is expected to be positively related to inflation if bank’s income increases more than its cost
while a negative relationship will exist if bank’s cost increases greater than its income. Thus, in
our analysis we are expecting a positive relationship between inflation and bank failure as when
there is inflation there are more chances for a foreign bank to fail in Pakistan and vice versa.
3. Exchange rate
Exchange rate is defined as the value of one currency in relation to another currency.
Fluctuations in the exchange rate contributes towards the survival or failure of foreign banks in
Pakistan. When exchanges rate rises profitability opportunities decreases for foreign banks thus
contributes towards their failure. While a decrease in exchange rate raises the profitability
opportunities for foreign banks dealing in foreign currency thus contributing towards their survival
.So in our analysis we expect a positive relationship between exchange rate and bank failure as
exchange rate rises profitability of foreign banks decreases thus leading towards their failure and
vice versa.
4. Net Investment to Total Assets Ratio
The NITA ratio is considered as the return on the assets (ROA).If the bank is investing a
huge amount out of its assets than it will definitely face liquidity issue. When more amount is
invested there is less amount to meet the current requirement of the customers or the sudden
financial requirements. Allen and Gale (2004) have presented their work on the role of a bank as
a liquidity creator and risk transformer which leads such a bank towards failure because creating
more liquidity means the bank is issuing more loans and issuing more loans creates liquidity
problem for the bank to meet its liquidity demand thus increasing the chances for the bank failure.
Moreover if the return on investment is higher than the bank will invest more out of its assets
because it will raise the profitability of the bank. Thus, in our analysis we could expect both a
negative and a positive relationship between NITA ratio and bank survival or failure respectively.
5. Net Advances to Total Assets Ratio
This ratio shows the amount of advances which are going to be made out of the total assets
of a bank. Wheelock and Wilson (2000) concluded a positive relationship between NATA ratio
and the chances of bank failure indicating that the higher this ratio is the more the chances for a
bank to fail. Shaffer (2012) found a positive relation between NATA ratio and bank failure which
indicates that a higher ratio is associated with more chances of failure on the part of the bank.
Arena (2004) empirical investigation concluded that liquidity shocks stimulate bank failures due
to the bank inability to meet their short term commitments. So a positive relationship between
bank failure and NATA ratio is expected indicating that the higher the NATA ratio the more the
chances for a bank to fail and vice versa.
6. Deposits to Total Assets Ratio (DTA)
This ratio indicates the amount of assets which is obtained by the deposits in the bank while
the deposit is a liability owned by the bank to the depositors. When deposits of a bank increase it
will increase the assets of the bank while the increase in the deposits of a bank shows that the bank
have attained the trust of its customers. Than the bank can use these deposits for several purposes
to attain profit its profit for example for investment purpose or for making loans .Investment and
advances will increase the profitability of the bank and as a result this will further increase its assts.
Thus, we are expecting a negative relationship between DTA ratio and the bank failure indicating
that the higher the DTA ratio is the less the chances for a bank to fail and vice versa.
7. Operating Expenses to Total Assets Ratio (OETA)
This ratio indicates the amount of operating expenses which the bank is going to meet out
of its assets. A foreign bank can capture a large number of customers in a host country by providing
better quality services thus, enhancing its chances of survival. While an increase in operating
expenses is required to provide these services. So, we can expect a positive relationship between
bank survival and operating expenses. DeYoung (2003) indicated that a continuous increase in
operating expenses creates liquidity problem for the bank and liquidity shortage leads towards
bank failure. Thus in our analysis we are expecting both a positive and a negative relationship
between bank failure and OETA ratio.
8. Non-performing Loans to Total Assets Ratio (NPLTA)
This ratio indicates the proportion of NPL’s to total assets. NPL is the sum of borrowed money
upon which the debtor has not made his scheduled payments for at least 90 days. Oshinsky and
Olin (2005) presented a study indicating that banks with riskier assets are more likely to fail than
the banks with less riskier assets because riskier assets always decline the assets of the banks by
making the bank recovery uncertain. Oshinsky and Olin (2005), Shaffer (2012) and Babanskiy
(2012) concluded that banks with higher level of non-performing loans were more likely to fail
because higher level of non-performing loans leads towards deterioration of bank assets thus
causing bank failure. Shaffer (2012) concluded that bank failures in US were more likely for the
banks with eroding capital base due to higher non-performing loans in 2008 and 1980’s. Thus,
NPLTA ratio is expected to be positively related to bank failure indicating that the higher the
NPLTA ratio is more the chances for a bank to fail.
9. Net Advances to Deposits Ratio (NAD)
This ratio is used to assess the liquidity of a bank because it indicates the amount of
advances which are made out of the deposits in the bank. Babanskiy (2010) found that a higher
NAD ratio indicates that the bank is more depending on the borrowed funds thus if this ratio is
high it will create liquidity problem for the bank in case of any unforeseen event. DeYoung (2003)
have concluded that an excessive lending by a bank damages the credibility of a bank making it
unable to meet the requirements of its customers and thus leading the bank towards failure. So in
our analysis we are expecting a positive relationship between NAD ration and bank failure which
indicates that the higher the NAD ratio the higher the chances for a bank to fail and vice versa.
5. ESTIMATION RESULTS DISCUSSION
5.1. Estimation Results of the Logit Model
In discrete time survival analysis logit regression model is implied to estimation the
survival of foreign banks in Pakistan. In logit model the description of coefficients is different
from the OLS estimates because in case of OLS estimates the dependent variable is continuous
while in logistic regression the dependent variable is in binary form( coded as 1 and 0).In logistic
regression a coefficient 𝛽𝑗=1 means that if you change the explanatory variable that is 𝑥𝑗 by 1, the
log of the odds that Y occurs will go up by 1 and in logistic regression the odds ratio(OR) indicates
the chances of the occurrence of an event. The following table 5.1 indicates the results from the
logit model including the coefficients, significance level and odds ratio.

Table 5.1
Estimation results of the Logit Model (Proportional Odds Model)
Variable Name Coefficient Odds Ratio P Value
GDP growth rate .6717758 1.957711 0.000
Inflation .0276851 1.028072 0.093
Exchange rate .0599285 1.061761 0.000
NITA .0548941 1.056429 0.907
NATA -.6922297 .5004589 0.356
DTA .7584047 2.134868 0.167
OETA -1.005773 .3657618 0.772
NPLTA 9.529513 13759.89 0.000
NAD .1850845 1.20332 0.019
Lntime -.4423819 .6425042 0.000
_cons -8.873122 .0001401 0.000
Table 5.2
Logistic Regression
Number of observations 5212
LR chi2(12) 375.39
Prob > chi2 0.0000
Pseudo R2 0.2329
5.2. Results discussion of Logit Model
The results from the logit model coincide to our theoretical expectation for some variables
including inflation, exchange rate, NITA, NPLTA, NAD and OETA. However some variable
contradicted the theoretical expectations including GDP growth rate, NATA and DTA. The
explanatory variables along with their coefficients and odds ratio are explained as following
5.2.1. Major Macro-economic Variables
5.2.1.1 GDP growth rate and bank failure
The coefficient of GDP growth rate is .6717758 which indicates a positive relationship
between the bank failure and GDP growth rate as opposite to our theoretical expectation. The
coefficient of GDP growth rate indicates that for each unit increase in GDP growth rate an increase
of .6717758 is expected in the log odds of bank failure. The odds ratio of GDP growth rate is
1.957711 which indicates that the higher the GDP growth rate is there are 1.957711 times more
chances for the bank to fail. The significance of GDP growth rate at 1 % and positivity of the
variable justifies the result. However a positive relationship between GDP growth rate and bank
failure can be justified on the bases that the higher GDP growth rate indicates that the domestic
financial sector is strong enough to contribute towards the growth in the economy by providing
easy lending thus capturing a huge market share. So, in such a situation it will be challenging for
foreign banks to capture a sufficient portion of the market with their tight policies thus reducing
their survival.
5.2.1.2. Inflation and bank failure
The coefficient for inflation is .0276851 having the expected positive sign indicating that
for each unit increase in inflation the increase of .0276851 is expected in the log odds of bank
failure. The odds ratio of inflation is 1.028072 which indicates that the higher the inflation is there
are 1.028072 times more chances of foreign bank failure. The coefficient for inflation is
statistically significant at 10% level. This conclusion is supported by Azam and Siddiqui (2012).
5.2.1.3 Exchange rate and bank failure
The estimated results for exchange rate are similar to our theoretical expectations. The
coefficient for exchange rate is .0599285 indicating that for each unit increase in exchange rate the
log odds of failure increases by .0599285. The odds ratio associated with exchange rate is 1.035928
indicating that when exchange rate is high there are 1.035928 times more chances for banks to fail.
The coefficient for exchange rate is statistically significant at 1% level.
5.2.2. Financial Ratios of Foreign banks
5.2.2.1. NITA Ratio and Bank Failure
The coefficient for NITA ratio is .0548941 indicating that an increase of .0548941 is
expected in the log odds of bank failure with a one unit increase in NITA. The odds ratio of
1.056429 indicates that bank with higher NITA ratio foreign banks are 1.056429 times more likely
to fail than the banks with lower NTA ratio although the variable is not statistically significant.
The positive sigh with NITA ratio justifies our theoretical expectation and is supported by Allen
and Gale (2004) that making more investment creates liquidity problem for the bank thus
ultimately contributing towards the failure of a foreign bank.
5.2.2.2. NATA Ratio and Bank Survival
The results of logit model are opposite to our theoretical expectation for NATA ratio. The
coefficient for NATA ratio is -.6922297 indicating that with one unit increase in NATA a decrease
of .6922297 is expected in the log odds of bank failure. The odds ratio for NATA is .5004589
indicating that bank with higher NATA ratio are .5004589 times less likely to fail than the banks
with lower NATA ratio. This result is opposite to the theoretical expectation.
5.2.2.3. DTA Ratio and Bank Failure
In the logit model the coefficient for DTA is positive opposite to our theoretical expectation
as .7584047 indicating that the higher the deposits the more the chances for a bank to fail. The
odds ratio of 2.134868 for DTA indicates that bank with higher DTA ratio are 2.134868 times
more likely to fail than the banks with lower DTA ratio.
5.2.2.4. OETA Ratio and Bank Survival
The coefficient of OETA ratio that is -1.00577 indicating that for each unit increase in
OETA ratio of a bank the log odds of the bank failure decreases by 1.005773 and the odds ratio
associated with OETA ratio is .3657618 express that the bank with higher OETA ratio is .3657618
times less likely to fail than the bank with lower OETA ratio. The result of the logit model is
similar to our theoretical expectation. Dar (2015) supported the idea that foreign banks have to
increase their expenditures to capture the domestic market in a host country which ultimately
increase their profit opportunity.
5.2.2.5. NPLTA Ratio and Bank Failure
The coefficient for NPLTA is 9.529513 indicating that for each unit increase in NPLTA
the log odds of bank failure increases by 9.529513 and it is statistically significant at 1% level of
significance while the odds ratio for NPLTA is 13759.89 expressing that a bank with higher
NPLTA ratio are 13759.89 times more likely to fail than the bank with lower NPLTA ratio. The
results of logit estimation for NPLTA ratio are similar to the theoretical expectation although this
ratio have the highest odds ratio indicating that NPLTA ratio is the biggest factor for the failure of
a foreign bank in Pakistan. Oshinsky and Olin (2005), Shaffer (2012) and Babanskiy (2012)
supported the same results.
5.2.2.6. NAD Ratio and Bank Failure

The coefficient of NAD ratio is .1850845 indicating that the higher the NAD ratio is the
more the chances for a foreign bank in Pakistan to fail. This positive relationship is justified
because when a bank increases its NAD ratio it will face the liquidity problem for the bank and
when a bank is unable to meet the liquidity demands of its customers it will lose its customers and
thing will lead towards its failure. Babanskiy (2010) and DeYoung (2003) supported the same
results. In case of Pakistan where minority have accounts in foreign banks if the concerned bank
faces the liquidity problem it will easily loose its valuable customers and at the end it will fail.
Conclusion
Foreign banks with international expertise influence the financial structure of the host
country because with the provision of standard quality services and access to international capital
these banks enhance competiveness of domestic banking sector. But working of foreign banks in
a host country is influenced by several financial and macroeconomic factors. Sometimes the
prevailing financial market conditions of the host country result in the merge of foreign banks in
the domestic banking sector or in their exist. Thus, in either case, the impact of foreign banks on
the economy of the host country cannot be ignored.
Keeping in view the importance of foreign banks for the financial growth of the host
country this study is performed to indicate the major financial ratios and macroeconomic variables
which are contributing towards survival or failure of foreign banks in Pakistan. Discrete time logit
model is applied on six major financial ratios including NITA, NATA, DTA, OETA, NPLTA and
NAD and macroeconomic variables consisting GDP growth rate, Inflation and Exchange rate using
the from 1990 to 2015. Data for financial ratios is obtained from the financial statements of foreign
banks from the annual report of State Bank of Pakistan and for GDP growth rate and inflation data
is acquired from WDI while data for exchange rate is attained from Knoema.
Among the six financial ratios NITA, DTA, NPLTA and NAD are found to contribute
towards the failure of foreign banks in Pakistan while NATA ratio and OETA ratio are found to
increase the survival of foreign banks in Pakistan. The study indicates that the effect of these
financial ratios is strong enough that out of 21 foreign banks from the time period 1990 to 2015
only 4 banks are survived while 17 banks have experienced failure. Surprisingly, GDP growth rate,
inflation and exchange rate are resulting in the failure of foreign banks in Pakistan. NPLTA ratio
is found to be the strongest financial ratio to result in the failure of foreign banks. Although some
variables are not statistically significant but their role in the survival or failure of foreign banks
cannot be ignored. Thus, it is concluded in this study that the role of macroeconomic variables in
the failure of foreign banks in Pakistan is stronger than the influence of financial ratios as all
macroeconomic variables included in this study are statistically significant. There should be a
flexibility in the operating conditions of foreign banks if such banks want to capture a sufficient
proportion of the financial market in Pakistan. Moreover, SBP should provide policy
recommendations to foreign banks for their efficient operation in Pakistan.
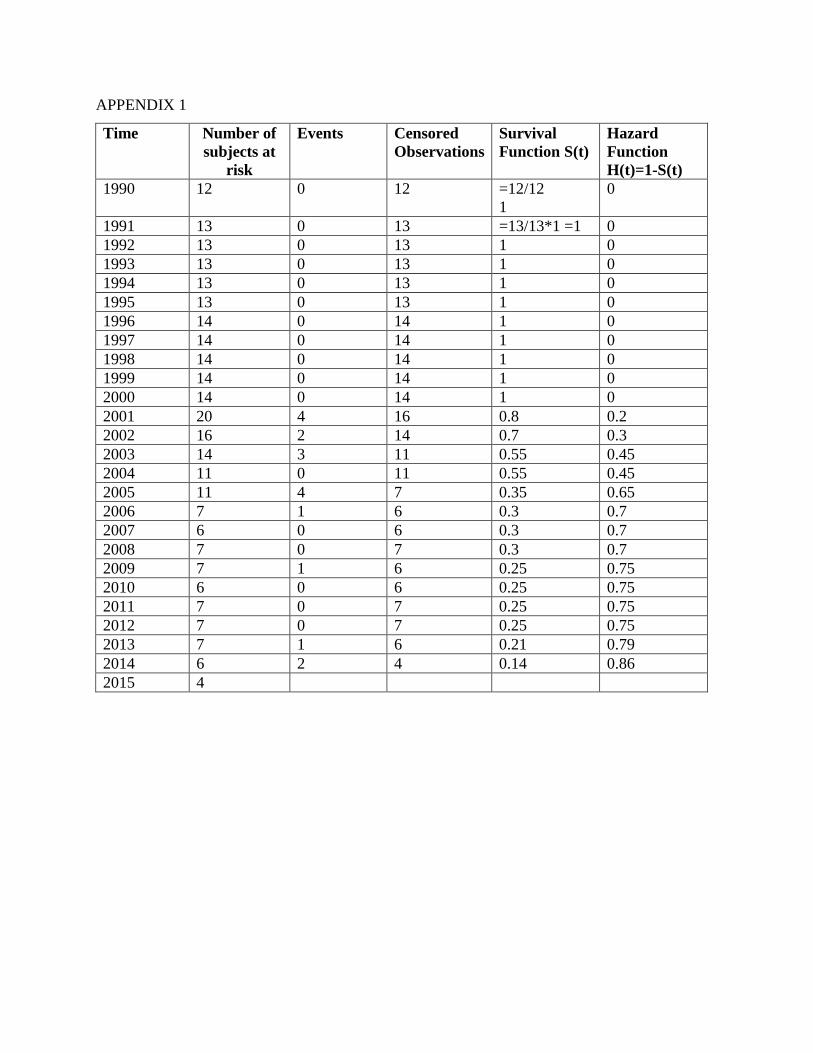
APPENDIX 1
Time Number of
subjects at
risk
Events Censored
Observations
Survival
Function S(t)
Hazard
Function
H(t)=1-S(t)
1990 12 0 12 =12/12
1
0
1991 13 0 13 =13/13*1 =1 0
1992 13 0 13 1 0
1993 13 0 13 1 0
1994 13 0 13 1 0
1995 13 0 13 1 0
1996 14 0 14 1 0
1997 14 0 14 1 0
1998 14 0 14 1 0
1999 14 0 14 1 0
2000 14 0 14 1 0
2001 20 4 16 0.8 0.2
2002 16 2 14 0.7 0.3
2003 14 3 11 0.55 0.45
2004 11 0 11 0.55 0.45
2005 11 4 7 0.35 0.65
2006 7 1 6 0.3 0.7
2007 6 0 6 0.3 0.7
2008 7 0 7 0.3 0.7
2009 7 1 6 0.25 0.75
2010 6 0 6 0.25 0.75
2011 7 0 7 0.25 0.75
2012 7 0 7 0.25 0.75
2013 7 1 6 0.21 0.79
2014 6 2 4 0.14 0.86
2015 4
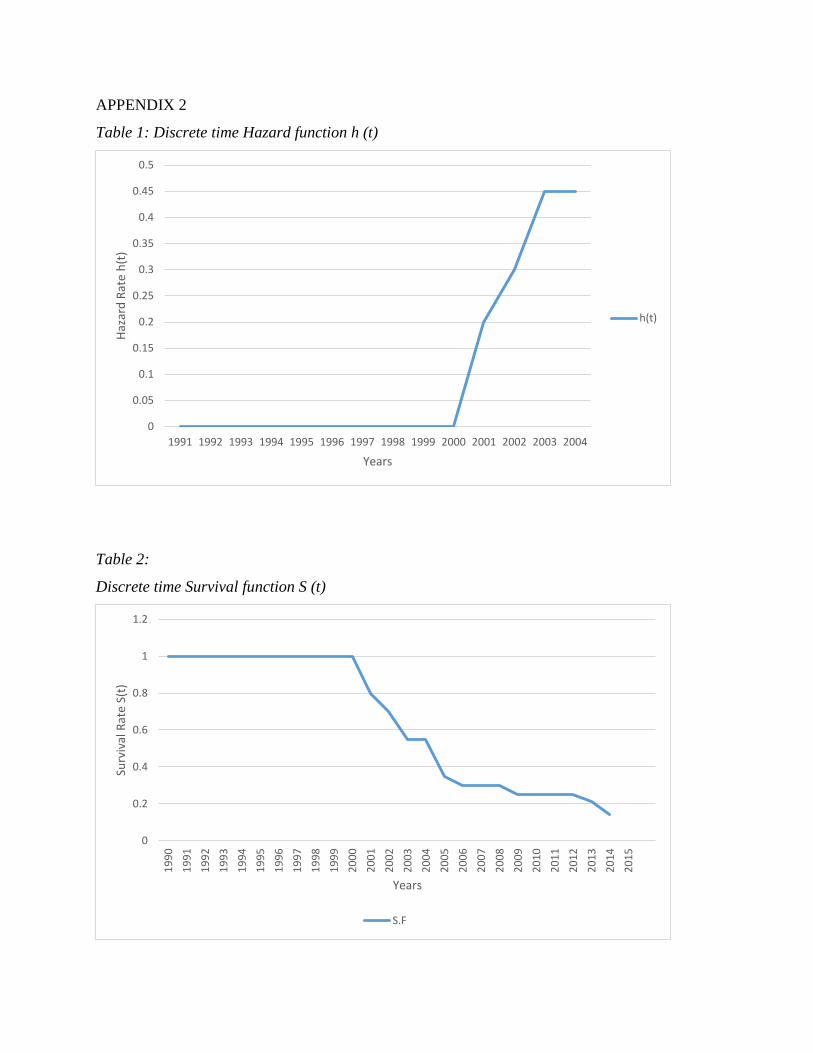
APPENDIX 2
Table 1: Discrete time Hazard function h (t)
Table 2:
Discrete time Survival function S (t)
0
0.05
0.1
0.15
0.2
0.25
0.3
0.35
0.4
0.45
0.5
1991 1992 1993 1994 1995 1996 1997 1998 1999 2000 2001 2002 2003 2004
Haz
ard
Rat
e h
(t)
Years
h(t)
0
0.2
0.4
0.6
0.8
1
1.2
19
90
19
91
19
92
19
93
19
94
19
95
19
96
19
97
19
98
19
99
20
00
20
01
20
02
20
03
20
04
20
05
20
06
20
07
20
08
20
09
20
10
20
11
20
12
20
13
20
14
20
15
Surv
ival
Rat
e S(
t)
Years
S.F
References
Alexandre, M., Canuto, O., & Silveira, J. M. D. (2003). Microfundamentos de falência de bancos
atacadistas: a experiência brasileira nos anos 90. Estudos Econômicos (São Paulo), 33(2),
249-285.
Allen, F., & Gale, D. (2004). Financial fragility, liquidity, and asset prices. Journal of the
European Economic Association, 2(6), 1015-1048
Allison, P. D. (1995). Survival Analysis Using SAS. Cary, NC: SAS Institute
Alves, K. L. D. F. (2009). Análise de sobrevivência de bancos privados no Brasil (Doctoral
dissertation, Universidade de São Paulo).
Arabi, K. A. M. (2013). Predicting Banks' Failure: The Case of Banking Sector in Sudan for the
Period (2002-2009). Journal of Business Studies Quarterly, 4(3), 160.
Arena, M. (2008). Bank failures and bank fundamentals: A comparative analysis of Latin
America and East Asia during the nineties using bank-level data. Journal of Banking &
Finance, 32(2), 299-310.
Athanasoglou, P. P., Brissimis, S. N., & Delis, M. D. (2008). Bank-specific, industry-specific and
macroeconomic determinants of bank profitability. Journal of international financial
Markets, Institutions and Money, 18(2), 121-136.
Ayşe Y.Evrensel (2008).Banking crisis and financial structure: A survival time analysis,
International review of economics & finance, 17(4), 589-602
https://doi.org/10.1016/j.iref.2007.07.002
Babanskiy, A. (2012). Determinants of bank failures.: The case of Russia.
Bhattacharya, S., & Thakor, A. V. (1993). Contemporary banking theory. Journal of financial
Intermediation, 3(1), 2-50.
Blossfeld, H. P. (2001). Techniques of event history modeling: New approaches to casual analysis.
Psychology Press.
Bongini, P., Claessens, S., & Ferri, G. (2001). The political economy of distress in East Asian
financial institutions. Journal of Financial Services Research, 19(1), 5-25.
Canicio, D., & Blessing, K. (2014). Determinants of bank failures in multiple-currency regime in
Zimbabwe (2009–2012). International Journal of Economics and Finance, 6(8), 229.
Corrêa, A. C. C., Costa, R. D. M., & Matias, A. B. (2006). Previsão de insolvência de pequenos
bancos brasileiros. Semead–Seminários Em Administração, 9(6), 87-90.
Crapp, H. R., & Stevenson, M. (1987). Development of a method to assess the relevant variables
and the probability of financial distress. Australian Journal of Management, 12(2), 221-
236.
Dar, H. (2015, July 6).Sector Overview: The exit of foreign banks. The Express Tribute. Retrieved
from https://tribune.com.pk/story/915410/sector-overview-the-exit-of-foreign-banks/
DeYoung, R. (2003). De novo bank exit. Journal of Money, Credit, and Banking, 35(5), 711-728.
Espahbodi, P. (1991). Identification of problem banks and binary choice models. Journal of
Banking & Finance, 15(1), 53-71.
Fiona, S & Elizabeth,W (2013). Discrete time event history analysis
Görg, H., & Strobl, E. (2003). Multinational companies, technology spillovers and plant survival.
The Scandinavian Journal of Economics, 105(4), 581-595.
Greene, W. (2008). Functional forms for the negative binomial model for count data. Economics
Letters, 99(3), 585-590.
Hosmer, D. W., Lemeshow, S., & May, S. (2008). Model development. Applied Survival Analysis:
Regression Modeling of Time-to-Event Data, Second Edition, 132-168.
Iqbal, S. (2013, February 10). Citibank closes most local branches. Dawn. Retrieved from
https://www.dawn.com/news/784979
Janot, M. M. (2001). Modelos de previsão de insolvência bancária no Brasil. Estudos Econômicos,
34(3), 553-585.
Joseph, M. T., Edson, G., Manuere, F., Clifford, M., & Michael, K. (2012). Non-performing loans
in commercial banks: a case of CBZ Bank Limited in Zimbabwe. Interdisciplinary Journal
of Contemprorary Research in Business, 4(7), 467-488.
Kauffman, R. J., & Wang, B. (2001). New buyers' arrival under dynamic pricing market
microstructure: The case of group-buying discounts on the Internet. Journal of
Management Information Systems, 18(2), 157-188.
Keasey, K., McGuinness, P., & Short, H. (1990). Multilogit approach to predicting corporate
failure—further analysis and the issue of signal consistency. Omega, 18(1), 85-94.
Klein, J. P., & Moeschberger, M. L. (2005). Survival analysis: techniques for censored and
truncated data. Springer Science & Business Media.
Kleinbaum, D. G., & Klein, M. (2012). Evaluating the proportional hazards assumption. Survival
analysis, 161-200.
Lane, W. R., Looney, S. W., & Wansley, J. W. (1986). An application of the Cox proportional
hazards model to bank failure. Journal of Banking & Finance, 10(4), 511-531.
Lanine, G., & Vander Vennet, R. (2006). Failure prediction in the Russian bank sector with logit
and trait recognition models. Expert Systems with Applications, 30(3), 463-478.
Leung, M. K. (1997). Foreign banks in the People's Republic of China. Journal of Contemporary
China, 6(15), 365-376.
Leung, M. K., Rigby, D., & Young, T. (2003). Entry of foreign banks in the People's Republic of
China: a survival analysis. Applied Economics, 35(1), 21-31.
Luoma, M., & Laitinen, E. K. (1991). Survival analysis as a tool for company failure prediction.
Omega, 19(6), 673-678.
Martin, D. (1977). Early warning of bank failure: A logit regression approach. Journal of banking
& finance, 1(3), 249-276.
Matias, A. B. (1999). Insucesso de grandes bancos privados brasileiros. Recuperado de Retrieved
from http://www. cepefin. org. br/publicados_pdf/tese_livre_docencia. pdf.
Matias, A. B., & de Oliveira Siqueira, J. (1996). Risco bancário: modelo de previsão deinsolvência
de bancos no Brasil. Revista de Administra&ccdeil; ão da Universidade de São Paulo,
31(2).
Mayes, D. G., & Stremmel, H. (2012). The effectiveness of capital adequacy measures in
predicting bank distress.
Meyer, P. A., & Pifer, H. W. (1970). Prediction of bank failures. The Journal of Finance, 25(4),
853-868
Ogg, P. J. (1988). Quantitative aspects of modeling financial distress. Working Paper. Submitted
to The Inaugural Australasian Finance and Banking Conference without acceptance.
Oshinsky, R., & Olin, V. (2005). Troubled Banks: Why Don't They All Fail?
Shaffer, S. (2012). Bank failure risk: Different now? Economics Letters, 116(3), 613-616.
Shumway, T. (2001). Forecasting bankruptcy more accurately: A simple hazard model. The
Journal of Business, 74(1), 101-124.
Sinkey, J. F. (1975). A multivariate statistical analysis of the characteristics of problem banks. The
Journal of Finance, 30(1), 21-36.
Steele, F. & Washbrook, E. (2013). Lectures on Discrete time event history analysis. National
Centre for Research Methods, Centre for Multilevel Modelling University of Bristol,
Bristol.
Taran, Y. (2012). What factors can predict that bank will get into trouble during crisis (pp. 4–28).
Evidence from Ukraine, KSE MA thesis.
Ursacki, T., & Vertinsky, I. (1992). Choice of entry timing and scale by foreign banks in Japan
and Korea. Journal of Banking & Finance, 16(2), 405-421.
Wheelock, D. C., & Wilson, P. W. (2000). Why do banks disappear? The determinants of US bank
failures and acquisitions. The Review of Economics and Statistics, 82(1), 127-138.