survey the relationships between … · product or service’’ and ‘‘probability to ......
TRANSCRIPT

Aug. 2015. Vol. 5, No.6 ISSN 2307-227X
International Journal of Research In Social Sciences © 2013-2015 IJRSS & K.A.J. All rights reserved
www.ijsk.org/ijrss
27
SURVEY THE RELATIONSHIPS BETWEEN DESTINATION IMAGE,
TOURIST SATISFACTION AND DISTINATION LOYALTY
SAHAND HOSSEINI, M.A.
Management student at the University of Kurdistan, Sanandaj, Iran [email protected]
ABSTRACT
The purpose of this study was to develop an integrated model to examine the theoretical and empirical evidence on
the causal relationships among destination image, tourist trait and overall satisfaction, to Iranian domestic
tourists’ destination loyalty. Data were collected from tourists of Uremia city and analyzed utilizing a structural
equation modeling approach. The results supported the proposed destination loyalty model: (1) destination image
directly influenced trait of satisfaction; the findings reveal that the impact of destination image on tourist loyalty is
significant. Similarly, the image has an effect on tourist loyalty, which is followed by affective image and cognitive
image. (2) Destination image and trait of satisfaction were both direct antecedents of overall satisfaction; and (3)
overall satisfaction and trait of satisfaction in turn had direct and positive impact on destination loyalty and
destination familiarity, destination image, perceived value, and tourist satisfaction all influenced Iranian domestic
tourists’ destination loyalty. The theoretical and managerial implications were drawn based on the study findings,
and recommendations for future researchers were made.
KEYWORD: Destination image; Destination loyalty; Tourist satisfaction; Trait of satisfaction
INTRODUCTION
A plethora of studies has examined the impacts
of the destination image and perceived value on
tourist satisfaction (Patterson & Spreng, 1997).
Most of these studies concluded that destination
image and perceived value are two important
antecedents of tourist satisfaction and to
influence a tourist’s destination choice behavior
(Chen & Kerstetter, 1999; Yoon & Uysal, 2005).
Customer satisfaction has been considered an
essential business goal because it was assumed
that satisfied customers would buy more. Studies
also suggested that positive destination image
and value perceptions tend to lead to favorable
outcomes, such as intention to propose and
revisit intentions (Faullant, Matzler, & Fu¨ Lear,
2008). On the other hand, a few studies
examined the factors that are likely to influence
tourists’ destination image perceptions (Beerli &
Martin, 2004; Tasci, Gartner, & Cavusgil, 2007).
However, many companies have started to attend
a high customer defection despite high
satisfaction ratings (Oliver, 1999; Taylor, 1998).
This circumstance has prompted a number of
scholars (Oliver, 1999; Reichheld, 1996) to
criticize only a satisfaction study and call for a
paradigm shift to the quest of loyalty as a
strategic business goal. As a result, satisfaction
measurement has recently been displaced by the
concept of customer loyalty, because loyalty is
seen as a better predictor of actual behavior. Two
of the three measures making up most Customer
Loyalty Indices (CLI) are behavior based,
such as ‘‘probability to repurchase the
product or service’’ and ‘‘probability to
propose a product or service to others.’’
The third element of a CLI is itself the
satisfaction (Taylor, 1998). To
understand retention of a measure
loyalty which is desires a direct link to a
company’s bottom line? If the tourists’
experience at, a destination is as a
product, the level of loyalty can be
reflected intention to revisit the destination to
friends and relatives (Oppermann, 2000). A
number of studies have addressed tourist loyalty
in relation to travel motivation, satisfaction,

Aug. 2015. Vol. 5, No.6 ISSN 2307-227X
International Journal of Research In Social Sciences © 2013-2015 IJRSS & K.A.J. All rights reserved
www.ijsk.org/ijrss
28
service quality, and destination image
(Mechinda, Serirat, & Guild, 2009; Ramkissoon,
Uysal, & Brown, 2011). Baloglu and McCleary
(1999) and Tasci et al. (2007) suggested that a
tourist destination is playing a significant role in
the destination image formation process. Most of
those studies utilized visits to a destination as a
measure of tourists’ familiarity with a destination
(Gursoy, 2001, 2011). But familiarity with a
destination enables tourists to form positive or
negative perceptions of a destination and helps
found a destination’s attractiveness (Horng, Liu,
Chou, & Tsai, 2012). Even though the role of
familiarity with a destination in decision making
and the destination selection process has been
well founded (Gursoy, 2003), the impact and
importance of familiarity on destination image
and destination loyalty formation have been
somewhat overlooked in tourism studies
(Prentice, 2004). Furthermore, loyal customers
are more likely to act as free word-of mouth
(WOM) advertising agents that informally bring
networks of
friends, relatives to a product/service
(Shoemaker & Lewis, 1999). In fact, WOM
referrals account for up to 65% of sales to new
customers (Reichheld & Sasser, 1990). So
loyalty becomes a fundamental strategic
component for organizations. However, in the
context of travel and tourism, a review of
literature reveals that there has not been more
investigation on tourist satisfaction; and
destination loyalty (Oppermann, 2000).
Therefore, it is time for practitioners and
academics to conduct more studies of loyalty in
order to have more knowledge of this
conceptualization to understand the role of
customer satisfaction in developing loyalty, the
impact of other non-satisfaction determinants of
customer loyalty, and their interrelationships.
Therefore, all these about customer loyalty will
allow management to concentrate on customer
retention. The results of such researches have
shown that satisfaction, quality/performance, and
different other variables are good predictors of
customer intended loyalty. The more satisfied the
customers are, the more likely to encourage
others to become customers. In order to retain
customers, organizations must seek to satisfy
them, but a further objective must be to found
customer loyalty. In the tourism context,
satisfaction with travel experiences contributes to
destination loyalty (Bramwell, 1998;
Oppermann, 2000). The degree of tourists’
loyalty to a destination is reflected in their
intentions to revisit the destination and in their
willingness to propose it (Oppermann, 2000;
Maroofi & Dehqani, 2012). Maroofi & Dehqani,
(2012) suggest that tourists’ positive experiences
of service, products, and other resources
provided by tourism destinations could produce
repeat visits as well as positive WOM effects to
friends and/or relatives. According to customer
satisfaction rule, one should not be surprised that
a great deal of research has been devoted to
investigating the antecedents of satisfaction
(Oliver & DeSarbo, 1988; Tse & Wilton, 1988).
Early researches, focused on satisfaction at the
global level (Oliver, 1980). Recently, there
emerged a trait-level conceptualization of the
antecedents of satisfaction (Oliver, 1993).
Overall satisfaction is a function of trait-level
evaluations. These evaluations typically capture
a significant amount of variation in satisfaction
(Oliver, 1993). Overall satisfaction and trait of
satisfaction are distinct, though related,
constructs (Maroofi & Dehqani, 2012). This
study focused on overall evaluation, trait of
satisfaction, and the relationship between the
two. Furthermore, previous studies (Baloglu &
McCleary, 1999) showed that destination image
will influence tourists in the process of choosing
a destination, the subsequent evaluation of the
trip and in their future intentions. A positive
image deriving from positive travel experiences
would result in a positive evaluation of a
destination (Maroofi & Dehqani, 2012). If the
destination has a positive image tourist
satisfaction will improve and destination image
affects tourists’ behavioral intentions. The more
favorable image will lead to higher probability to
return to the same destination. To sum up, the
following sequence could be founded:
destination image - tourist satisfaction –
destination loyalty. The destination image is an
antecedent of satisfaction. Satisfaction in turn
has a positive influence on destination loyalty. In
an increasingly saturated marketplace, the
success of marketing destinations should be
analyzed destination loyalty, Familiarity and its
interplay with tourist satisfaction and destination
image. Nevertheless, the tourism studies to date
have addressed and examined the constructs of
image, satisfaction, and loyalty independently
(Bigne, Sanchez, & Sanchez, 2001); studies
discussing the causal relationships among
destination image, Familiarity, tourist

Aug. 2015. Vol. 5, No.6 ISSN 2307-227X
International Journal of Research In Social Sciences © 2013-2015 IJRSS & K.A.J. All rights reserved
www.ijsk.org/ijrss
29
satisfaction, and destination loyalty are lacking.
This study proposes an integrated approach for
understanding destination loyalty and to examine
the theoretical and empirical evidence on the
causal relationships among destination image,
Familiarity, tourist satisfaction, and destination
loyalty. A research model was investigated the
relevant relationships among the constructs by
using a structural equation modeling (SEM)
approach. The empirical data for the study was
collected in a major tourism destination in the
state of uremia. The city has attracted people of
all ages from all around the country for several
decades.
2. LITERATURE REVIEW
There are many proposed about concepts in social
and behavioral sciences from different philosophical
assumptions and paradigms. Therefore, their theory
and operation may not be identical and often suggest
multidimensional nature. As the focus of this study is
to develop and test a theoretical model, which
presented the elements contributing to the building of
destination loyalty: destination image, trait of
satisfaction, and overall satisfaction and the
interrelationships of the constructs in the model is
presented below. Therefore, destination images the
effect of tourists’ subjective perception, consequent
behavior, and destination choice (Castro, Armario, &
Ruiz, 2007; Echtner & Ritchie, 1991; Milman &
Pizam, 1995). Tourists’ behavior is expected to
image that they have of destinations and the image
will influence tourists in choosing process
destination, the subsequent evaluation of the trip, and
in their future intentions, which has been studied by
various authors (Gartner, 1989; Goodall, 1988). It is
believed that destinations with more positive images
will be included in the process of decision making.
Moreover, destination image has a positive influence
on perceived quality and satisfaction. As well as
images will lead to higher tourist satisfaction. In turn,
the evaluation of the destination experience will
influence the image and modify it (Echtner &
Ritchie, 1991; Ross, 1993). Court and Lupton (1997)
suggest that the image of the destination positively
affects visitors’ intention to revisit in the future.
Kotler, Bowen, and Makens (1996) founded the
following sequence: image - quality - satisfaction.
Therefore, image would affect how customers
perceive quality positive image corresponds to a
higher perceived quality. Perceived quality will in
turn found the satisfaction of consumers (Kozak &
Rimmington, 2000), because satisfaction is the result
of customers’ evaluation of the perceived quality.
Therefore, the following hypotheses were proposed:
H1. Destination image positively influences tourist’s
satisfaction.
Recently, researchers started to pay attention to trait-
level conceptualization of the antecedents of
satisfaction (Oliver, 1993). According to Oliver
(1993), satisfaction and trait of satisfaction are
distinct but related constructs. Trait of satisfaction
has a positive, and direct effects on overall
satisfaction; and it captures a significant amount of
variation in overall satisfaction (Oliver, 1993;
Spreng, Mankenzie, & Olshavsky, 1996). Satisfaction
research in tourism and recreation has indicated that
tourists’ satisfaction with individual component of
the destination leads to their satisfaction with the
overall destination (Danaher & Arweiler, 1996;
Mayer, Johnson, Hu, & Chen, 1998). It is important
in tourism to distinguish overall satisfaction from
satisfaction with individual traits; because the
characteristics of tourism have a remarkable effect on
tourist satisfaction (Seaton & Benett, 1996). Tourists
experience such as hotels, restaurants, shops,
attractions, etc.; and they may evaluate each element
separately. Overall satisfaction with a hospitality
experience is a function of satisfactions with the
individual elements of all the services that make up
the experience, such as accommodation, weather,
natural environment, social environment, etc. (Pizam
& Ellis, 1999). Therefore, the following hypotheses
were proposed:
H2. Trait of satisfaction positively influences overall
satisfaction.
H3. Destination image positively influences tourists’
trait of satisfaction.
H4. Trait of satisfaction mediated the relationship
between destination image and overall satisfaction.
Satisfaction is frequently examined concepts of
modern marketing thought and practice because it is
essential for the survival of any type of business
(Oliver, 1997; Spreng & Chiou, 2002). There are
several definitions for satisfaction (Giese & Cote,
2000). But in this study, we use the definitions
satisfaction as is conceptualized as a post-purchase
evaluation (Fornell, 1992). The link between
satisfaction and post-purchase behavior has been
founded by prior literature (Hallowell, 1996; Rust &

Aug. 2015. Vol. 5, No.6 ISSN 2307-227X
International Journal of Research In Social Sciences © 2013-2015 IJRSS & K.A.J. All rights reserved
www.ijsk.org/ijrss
30
Zahorik, 1993). It is believed that satisfaction leads to
repeat purchase and positive WOM support sedation,
which are indicated a loyalty. Marketing literature
has paid much attention to the relationship between
customer satisfaction and loyalty, and there is a
significant positive relationship between customer
satisfaction and loyalty/ retention (Cronin et al;
2000). If consumers are satisfied with the
product/service, they are continuing to purchase, and
are willing to spread positive WOM. According to
these studies, satisfaction is a necessity for a
successful tourist destination because one of the most
important predictors of customer loyalty is a
satisfaction (Ozdemir et al., 2012). It tends to
influence the choice of a destination, the
consumption of products and services, and the
decision to return (Chi, 2011, 2012). Satisfied tourists
are revisiting and recommend the destination to
friends and relatives compared to others (Prayag &
Ryan, 2012). The more satisfied customers are
repurchasing the product/service and encourage
others to become customers. In the tourism industry,
there are empirical evidences that tourists’
satisfaction is a strong indicator of their intentions to
revisit and proposed the destination to other people
(Juaneda, 1996; Kozak, 2001). Satisfied tourists are
returning to the same destination, and are more
willing to share their positive traveling experience
with their friends and relatives. As WOM are a
critical in tourism marketing, they are considered to
be the most reliable, and are one of the most sought-
after information sources for potential tourists (Yoon
& Uysal, 2005). The above discussion leads to the
following hypotheses:
H5. Satisfaction significantly influenced destination
H6. Satisfaction mediated the relationship between
destination image and destination loyalty.
H7. Satisfaction mediated the relationship between
trait of satisfaction and destination loyalty.
3. METHODOLOGY
3.1. SURVEY INSTRUMENT
The survey instrument followed the procedures
recommended by Churchill & Surprenant (1982) and
DeVellis (1991) for developing a standardized survey
instrument. A number of items to measure were
identified from the literature. The survey
questionnaire consisted of the following sections:
destination image, tourists’ trait of satisfaction,
satisfaction, destination loyalty, and questions
designed to gather tourist demographic information
and travel behavior. Regarding destination image; a
combination of two structured and unstructured
techniques were used in order to capture various
aspects of the respondents’ perceptions of a Uremia
city (west of Iran) as a travel destination, content
analysis of tourism literature, promotional brochures,
and the employment of qualitative research
techniques such as focus group sessions, unstructured
personal interviews, and managerial judgment. The
selected 48 destination items were rated on a 5-point
Likert scale where 1 = strongly disagree and 5 =
strongly agree. According a trait of satisfaction; most
of the relevant tourism literature and destination traits
applicable to the Uremia situation, consisting of 29
items were found. The destination traits encompassed
five domains of tourism activities: accommodation,
dining, shopping, attractions, and environment. The
choice of traits within each domain, varied with the
chosen mix of the five tourism activities. Along five-
point Likert-scales, tourists were asked to evaluate
their satisfaction with each tourist attracting trait (1 =
Very dissatisfied and 5 = Very satisfied).
Satisfaction; a number of studies have measured for
satisfaction (Bolton & Lemon, 1999; Fornell et al.,
1996). A single measurement of satisfaction was used
in this study was empirical support. The respondents
were asked to rate their satisfaction with the overall
traveling experience on a 5-point Likert scale with 1
being Very dissatisfied and 5 being Very satisfied.
Destination loyalty; the measurement of repeat
purchasing intentions and WOM recommendations
were used to indicate consumer loyalty, and were
found to be a relevant measurement (Jones & Sasser,
1995). Prior research has shown that loyal customers
are to repurchase a product in the future (Petrick et
al., 2001; Sonmez & Graefe, 1998). It has also been
suggested that loyal visitors are willing to propose
the product to others (Shoemaker & Lewis, 1999). In
addition, correlation has been found between
consumers’ repurchase intentions and significant
WOM referrals (Oh, 2000). In this study, two single-
item measures were used for evaluating tourist
destination loyalty as the ultimate dependent
construct: tourists’ intention to revisit Uremia and
their willingness to propose Uremia as a favorable
destination to others, with 5-point Likert scale (1 =
most unlikely; 5 = most likely).
Aug. 2015. Vol. 5, No.6 ISSN 2307-227X
International Journal of Research In Social Sciences © 2013-2015 IJRSS & K.A.J. All rights reserved
www.ijsk.org/ijrss
31
3.2. RELIABILITY
Reliability presents the variances among a set of
observed variables that measure an underlying
construct (Fornell & Larcker, 1981). All reliabilities
for each constructs were acceptable (above 0.798). In
addition, each of the Cronbach alpha values passed
the threshold value of 0.8 (Nunnally, 1978), which
suggests that for each of the constructs, there is a
reasonable degree of internal consistence between the
corresponding indicators. Based on the results of the
pilot test and feedbacks from Uremia city, the final
version of the survey instrument was developed.
3.3. SAMPLATION PLAN
The target population was all the visitors who
stopped by the Uremia Welcome Center, stayed at
hotels, motels, and they also visited art galleries
during a 2-month survey period. The confidence
interval approach was used to find the sample size
(Burns & Bush, 1995) and for obtaining 95%
accuracy at the 95% confidence level the
Where z is the standard error related to choosing a
level of confidence (94%); p the estimated variability
in the population (52%); q = 1_ p; and e the
acceptable error 74% (desired accuracy 94%). The
amount of variation in the population is estimated to
be 52%. Assuming a response rate of 52% and an
unusable rate of9%, a total of 961 (382/0. A two-
stage sampling approach was used: first, sampling
was applied for deciding on the stratum sample size,
and second, systematic random sampling (SRS) was
used to select the survey participant within each
stratum, which involved choosing every kth element
after a random start.
3.4. DATA ANALYSIS
In testing the hypotheses we used exploratory factor
analysis (EFA) to derive the underlying dimensions
of the destination image and visitors’ trait of
satisfaction. We develop our conceptual model in this
section according to the research background and
discussed. Therefore, confirmatory factor analysis
(CFA) and SEM were tested regarding the conceptual
model that examined the antecedents of destination
loyalty.
4. RESULTS
A total of 401 questionnaires were returned (90%).
The majority of the respondents (99%) where
domestic visitors from 7 different Iran states. The
97% of the respondents were traveling with partners
(family and friends), and vacation/ leisure was quoted
as the major purpose of the trip (89%). 23%, of the
respondents were first-time visitors. Previous visits
(47%) and WOM (40%) emerged as the two key
information sources for respondents to learn about
the travel destination.
4.1. Underlying dimensions of ‘destination
image’ and ‘trait satisfaction’
To find the basic dimension of ‘destination image
‘for analyzing patterns of correlations among the 43
image attributes the EFA was performed. Oblimin
rotation Principle of factoring method was adopted
because (1) when the goal factor analysis is obtained
several theoretically factors; the sloping rotation is
best; (2) sloping rotation assumes that factors are
correlated to each other, (Hair, Anderson, Tatham, &
Black, 1998). A range of cutoff criteria was used to
find the number of factors derived, such as
eigenvalues, the percentage of variance, common
items, and factor loadings (Hair et al., 1998). Items
with loadings lower than 0.4 were eliminated. A
seven factor were solution, with 33 variables being
retained (Table 1).

Aug. 2015. Vol. 5, No.6 ISSN 2307-227X
International Journal of Research In Social Sciences © 2013-2015 IJRSS & K.A.J. All rights reserved
www.ijsk.org/ijrss
32
Table 1
Dimensions of destination image
Communalities Factor Cronbach’s
Variance
(%)
Eigenvalue
0.88 41.77 15.49 F1 Travel environment
0.73 0.70 Safe and secure environment
0.73 0.65 Clean environment
0.66 0.54 Friendly and helpful local people
0.47 0.43 Pleasant weather
0.94 9.43 3.45 F2 Natural attractions
0.75 _0.84 Scenic mountain and valleys
0.82 _0.83 Natural attractions
0.77 _0.77 Gardens and springs
0.79 _0.69 parks /rivers
0.55 _0.45 Caves and underground formations
0.85 3.85 1.44 F3 Historic attractions
0.77 0.85 Distinctive history and heritage
0.65 0.67 Vintage buildings
0.83 3.79 1.33 F4 Infrastructure
0.73 _0.79 Restaurants
0.72 _0.69 Variety of shop facilities
0.53 _0.54 Choice of accommodations
0.82 2.98 1.19 F5 Accessibility
0.75 0.75 Parking information
0.57 0.65 Available parking downtown
0.58 0.57 Easy access to the area
0.87 2.47 0.91 F6 Outdoor activities
0.82 0.78 Exciting water sports/ boating, fishing,
0.64 0.44 Opportunities for outdoor recreation
0.64 0.45 Good facilities for sports
0.88 2.29 0.83 F7 Price and value
0.92 _0.95 Reasonable price for food and
accommodation
0.74 _0.73 Value for money
0.74 _0.65 Reasonable price for attractions and
activities
Although only five factors had eigenvalues greater
than 1.0. Both five -factor and seven-factor solutions
were analyzed, and the loadings of the seven-factor
model presented a cleaner and more interpretable
solution. The last two factors included in the seven-
factor model also represented important aspects of
the destination image. The 33 variables ranged from
0.41 to 0.86, suggesting that the variances of each
original variable (from 41% to 86%) were explained
by the seven-factor solution. Factor loadings of the
variables ranged from 0.41 to 0.96, above the
suggested threshold value of 0.30 for practical and
statistical significance (Hair et al., 1998). The
Cronbach alpha for the seven factors varied from
0.81 to 0.95, suggested high internal consistency. The
seven factors were based on the core variables as:
travel environment, natural attractions, historic
attractions, travel infrastructure, accessibility,
relaxation, and price and value seven composite
variables were used as indicators for the inactive
construct ‘destination image’ in the subsequent SEM.
The EFA procedure was used to verify the
dimensions of tourist satisfaction. Six factors with
eigenvalues above 1.0, were generated, which
explained about 73% of the total variance (Table 2).

Aug. 2015. Vol. 5, No.6 ISSN 2307-227X
International Journal of Research In Social Sciences © 2013-2015 IJRSS & K.A.J. All rights reserved
www.ijsk.org/ijrss
33
Table 2
Underlying dimensions of ‘attribute satisfaction
Commonalities Factors Cronbach’s α Variance Eigenvalue
0.86 44.04 13.77 F1 Shopping
0.73 0.81 Quality of merchandise
0.60 0.62 Reasonable price of merchandise
0.60 0.59 Variety of shops
0.53 0.60 Friendliness of service
0.91 5.43 1.78 F2 Lodging
0.83 0.88 Uniqueness of lodging and facilities
0.74 0.80 Quality and cleanliness of lodging
0.52 0.62 Historic interests of lodging
0.72 0.52 Service in lodging facilities
0.51 0.43 Reasonable price of meals
0.63 0.43 Variety of lodging options
F3 Accessibility
0.54 0.74 Availability of local parking
0.72 0.65 Travel information
0.61 0.61 Welcome center
0.55 0.62 Ease of access
0.84 3.44 1.12 F4 Attractions
0.93 _0.74
Variety of cultural sites
0.77 _0.62 Variety of natural attractions
0.73 _0.53 Variety of cultural options
0.65 _0.35 Reasonable price for sightseeing
0.86 3.34 1.12 F5 Environment
0.74 0.67 Restful atmosphere
0.78 0.64 Cleanliness
0.72 0.63 Friendliness of local people
Safety and security
0.86 3.22 1.06 F6 Dining
0.76 0.82 Quality of food
0.68 0.73 Service in restaurants
0.61 0.61 Reasonable price of meals
The common items varied from 0.40 to 0.90,
suggesting that the variance in each original variable
was explained by the six common factors. The factor
loadings for the 31 variables ranged from 0.38 to
0.92, within the threshold value suggested by Hair et
al. (1998). The loadings, also showed interpretable
solution: the 31 variables loaded significantly on six
factors as the researchers conceptualized lodging,
dining, shopping, attractions, environment, and
accessibility; no variables loaded significantly on
more than one factor. The Cronbach’s alphas for the
six factors were robust, ranging from 0.85 to 0.91,
(Nunnally & Bernstein, 1994), indicating high
internal consistency among the variables within each
factor. Six summated scales were used for the latent
variable ‘trait of satisfaction’ in the subsequent SEM
analysis.
4.2. THE MODEL FITS
Model fit depicts the degree to which suggested the
hypothesized constructs. The 𝑥2 value (693.62 with
152 degrees of freedom) has a statistical significance
level of 0.0. Therefore, the 𝑥2 value should be used as
a guide rather than an absolute index of fit due to its
sample size and model complexity (Anderson &
Gerbing, 1982). Thus, other indices should also be
evaluated. Incremental Fit Measures evaluate the

Aug. 2015. Vol. 5, No.6 ISSN 2307-227X
International Journal of Research In Social Sciences © 2013-2015 IJRSS & K.A.J. All rights reserved
www.ijsk.org/ijrss
34
incremental fit of the model compared to a null
model that has no relation among the constructs and
variables. These were the Comparative Fit Index
(CFI), the Tucker–Lewis Index (TLI), and the
Normed Fit Index (NFI), which were 0.94, 0.95, and
0.95, respectively. These measures were indicating
support for the proposed model. Another measure to
evaluate the model fit is the Root Mean Square Error
of Approximation (RMSEA), which provides a
measure of fit that adjusts for parsimony by
evaluating the discrepancy per degree of freedom in
the model. The RMSEA value was a marginal 0.12.
SEM was applied for testing the destination loyalty
model in which seven hypotheses were developed
based on a literature review. Various measures of
overall model goodness-of-fit and measurement
model fit were evaluated to find if the proposed
conceptual model was acceptable.
4.2.1. MEASUREMENT MODEL
The measurement model provides latent variables in
the model. The evaluation of the measurement model
is a pre-requisite to the evaluation of the structural
model (Anderson & Gerbing, 1982). The convergent
validity of the measurement scale via the following
tests was examined. First, for each variable the t
value related to each of the loadings was significant
at the 0.01 level (Table 3).
Table 3
LISREL results for measurement model
AVE CR SMC Std
0.51 0.92 Exogenous: destination image
0.65 0.81 Travel environment
0.50 0.72 Natural attractions
0.32 0.56 Historic attractions
0.54 0.75 Infrastructure
0.53 0.71 Accessibility
0.66 0.82 Price and value
0.51 0.71 Outdoor activities
0.62 0.92 Endogenous: attribute satisfaction
0.55 0.74 Lodging
0.72 0.86 Attractions
0.67 0.81 Shopping
0.53 0.74 Dining
0.55 0.74 Accessibility
0.57 0.77 Environment
0.61 0.91 Endogenous: destination loyalty
0.72 0.83 Revisit intention
0.93 0.95 Recommend intention
The results indicated that all variables were
significantly related to their constructs, verifying the
relationships among educators and constructs.
Second, squared multiple correlation coefficients
(SMC) for the y- and 𝑥-variables were evaluated.
Therefore, SMCs lie between 0 and 1. Table 3
revealed that the SMCs for y-variables ranged from
0.54 to 0.94 and for 𝑥- v varies from 0.32 to 0.63,
indicating high reliability (convergent validities) of
the measurement model. The construct reliability
(CR) and the average variance extracted (AVE) were
also computed. For both CR and AVE, constructs
surpassed the threshold value of .72 and.53,
respectively. Therefore, the indicators for all
constructs were sufficient in terms of how the
measurement model was specified. To examine the
discriminant validity of the measurement model, the
AVE values was compared to the squared
correlations between the corresponding constructs
(Fornell & Larcker, 1981), and none of the squared
correlations surpassed the AVE. The above tests
indicated that the discriminant validity was upheld
for the measurement model.
Aug. 2015. Vol. 5, No.6 ISSN 2307-227X
International Journal of Research In Social Sciences © 2013-2015 IJRSS & K.A.J. All rights reserved
www.ijsk.org/ijrss
35
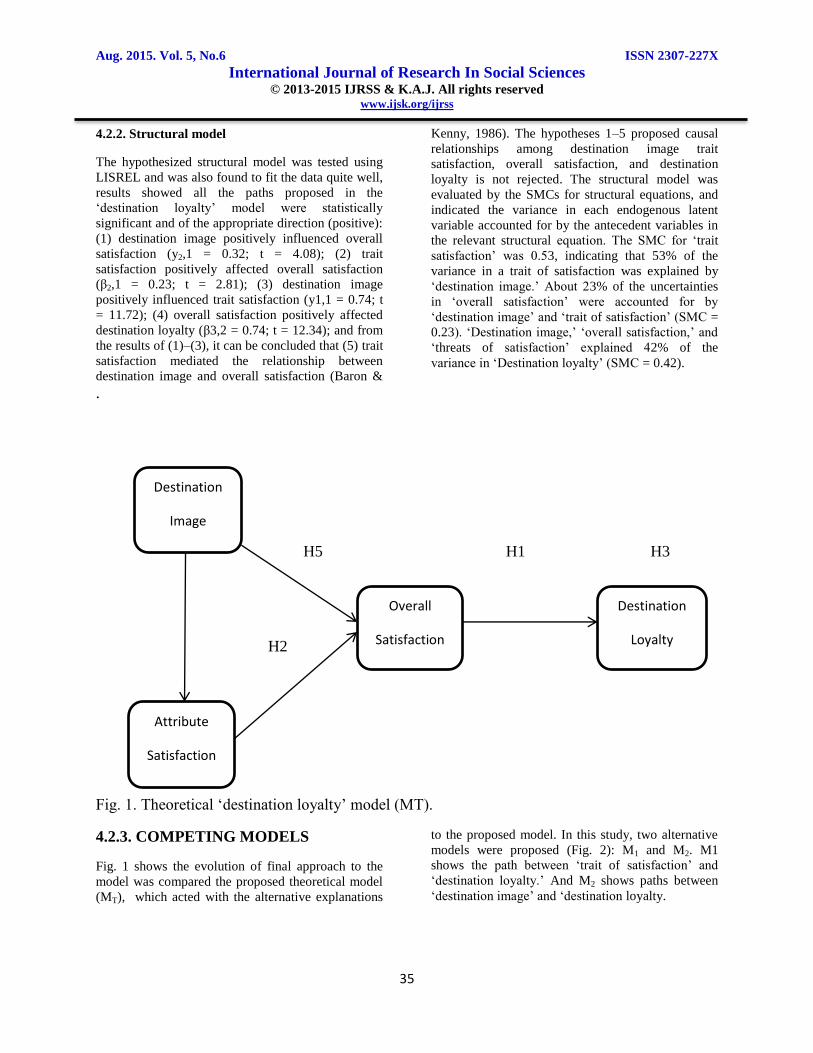
4.2.2. Structural model
The hypothesized structural model was tested using
LISREL and was also found to fit the data quite well,
results showed all the paths proposed in the
‘destination loyalty’ model were statistically
significant and of the appropriate direction (positive):
(1) destination image positively influenced overall
satisfaction (y2,1 = 0.32; t = 4.08); (2) trait
satisfaction positively affected overall satisfaction
(β2,1 = 0.23; t = 2.81); (3) destination image
positively influenced trait satisfaction (y1,1 = 0.74; t
= 11.72); (4) overall satisfaction positively affected
destination loyalty (β3,2 = 0.74; t = 12.34); and from
the results of (1)–(3), it can be concluded that (5) trait
satisfaction mediated the relationship between
destination image and overall satisfaction (Baron &
Kenny, 1986). The hypotheses 1–5 proposed causal
relationships among destination image trait
satisfaction, overall satisfaction, and destination
loyalty is not rejected. The structural model was
evaluated by the SMCs for structural equations, and
indicated the variance in each endogenous latent
variable accounted for by the antecedent variables in
the relevant structural equation. The SMC for ‘trait
satisfaction’ was 0.53, indicating that 53% of the
variance in a trait of satisfaction was explained by
‘destination image.’ About 23% of the uncertainties
in ‘overall satisfaction’ were accounted for by
‘destination image’ and ‘trait of satisfaction’ (SMC =
0.23). ‘Destination image,’ ‘overall satisfaction,’ and
‘threats of satisfaction’ explained 42% of the
variance in ‘Destination loyalty’ (SMC = 0.42).
.
H5 H1 H3
H2
Fig. 1. Theoretical ‘destination loyalty’ model (MT).
4.2.3. COMPETING MODELS
Fig. 1 shows the evolution of final approach to the
model was compared the proposed theoretical model
(MT), which acted with the alternative explanations
to the proposed model. In this study, two alternative
models were proposed (Fig. 2): M1 and M2. M1
shows the path between ‘trait of satisfaction’ and
‘destination loyalty.’ And M2 shows paths between
‘destination image’ and ‘destination loyalty.
Destination
Image
Overall
Satisfaction
Attribute
Satisfaction
Destination
Loyalty

Aug. 2015. Vol. 5, No.6 ISSN 2307-227X
International Journal of Research In Social Sciences © 2013-2015 IJRSS & K.A.J. All rights reserved
www.ijsk.org/ijrss
36
Competing Model M1
Competing Model M2
Fig. 2. Competing ‘destination loyalty’ models.
The sequential Chi-square (𝑥2) difference tests
(SCDTs) were performed to evaluate and there were
significant differences in estimated construct
covariance’s (Joreskog & Sorbom, 1995). The 𝑥2
Destination
Imag
Overall
Satisfaction
Destination
Loyalty
Attribute
Satisfaction
Overall
Satisfaction
Attribute
Satisfaction
Destination
Loyalty
Destination
Imag

Aug. 2015. Vol. 5, No.6 ISSN 2307-227X
International Journal of Research In Social Sciences © 2013-2015 IJRSS & K.A.J. All rights reserved
www.ijsk.org/ijrss
37
difference test examined the null hypotheses of no
significant difference between two nested structural
models (denoted as M1–MT = 0 and M1–M2 = 0). The
difference between 𝑥2 statistic values (Δ𝑥2
) for nested
models was itself distributed as 𝑥2, with degrees of
freedom equal to the difference in degrees of freedom
for the two models (Δdf). If the null hypothesis was
upheld, the more constrained model of the two would
be accepted. The 𝑥2 difference test between MT and
M1 (Δ𝑥2 = 5.51; Δdf = 1) suggested that M1 was
performing better than the theoretical model MT; and
the 𝑥2 difference test between M1 and M2 (Δ𝑥2
= 0.31;
Δdf = 1) suggested that M2 was not performing better
than M1. The results of the 𝑥2 difference t test the
competing model M1 to the proposed theoretical
model MT and the alternative model M2 (saturated
model). To the effect of causal relationships, it was
necessary to examine the statistical parameter
coefficients for the additional paths for M1 and M2.
The causal relationship between ‘trait of satisfaction’
and ‘destination loyalty’ was significant (β= 0.14; t -
2.37); whereas the causal path from ‘destination
image’ to ‘destination loyalty’ was not significant (y
= 0.04; t = 0.56). This suggested that there should be
a direct path between ‘trait of satisfaction’ and
‘destination loyalty’ as the competing model M1
proposed. Therefore, the relationship of tourists’
satisfaction with various components of a destination
could directly lead to their loyalty with the
destination. Therefore, H6 supported the overall
satisfaction on the relationship between destination
image and destination loyalty, and H7 did not support
the overall satisfaction on the relationship between
trait of satisfaction and destination loyalty. Therefore,
overall satisfaction mediated the relationship between
trait of satisfaction and destination loyalty (Baron &
Kenny, 1986). Another comparison, a set of
goodness-of-fit measures was also compared to find
the three models which had the best model fit (Table
4)?
Table 4
Competing models
M2 M1 MT
681.35 682.87 693.62 Chi-square 690.67
149 150 152 Degrees of freedom
0.12 0.12 0.12 RMSEA
0.058 0.057 0.063 RMR
0.82 0.82 0.82 GFI
0.94 0.94 0.94 CFI
0.96 0.96 0.96 NNFI
0.80 0.80 0.81 PNFI
The fit indices such as RMSEA, CFI, and PNFI were
identical, indicating that the three competing models
achieved the same level of model fit. Thus, it was
concluded that the competing model M1 could be
retained as a feasible alternative for acceptance.
Considering the measurement for large models and
large sample sizes, the final model M1 (Fig. 3), not
achieving the desirable levels of fitness, may
represent the best available model until further
research identifies improvements in theoretical
relationships or the measurement of the constructs.

Aug. 2015. Vol. 5, No.6 ISSN 2307-227X
International Journal of Research In Social Sciences © 2013-2015 IJRSS & K.A.J. All rights reserved
www.ijsk.org/ijrss
38
* X1…..X9: travel environment, natural attractions,
entertainment and events, historic attractions, travel
infrastructure, accessibility, relaxation, outdoor
activities, and price and value
* Y1…..Y10: lodging, dining, shopping, attractions,
activities and events, environment, accessibility,
satisfaction, revisit intention, referential intention
* Values in parenthesis are t-statistics (t critical value
at 0.05 levels = 1.96)
Fig. 3. Results of destination loyalty model (M1).
5. IMPLICATIONS
5.1. THEORITICAL IMPLICATIONS
The SEM analysis statistically supported significant
relationships between destination image and overall
satisfaction (H1), trait of satisfaction and overall
satisfaction (H2), destination image and trait of
satisfaction (H3), and overall satisfaction and
destination loyalty (H5). The SEM analysis also
confirmed the mediation role and trait of satisfaction
played between destination image and overall
satisfaction (H4), and the mediation role overall
satisfaction played between destination image and
destination loyalty (H6). The only hypothesis (H7)
that was not supported overall satisfaction as a
mediator, rather than a full mediator as originally
proposed, between the trait of satisfaction and
destination loyalty. Therefore, it can be said that
tourist overall satisfaction was found by destination
image and trait satisfaction, tourist trait of
satisfaction was also directly influenced by
destination image, and destination loyalty was in turn
influenced by overall satisfaction. In addition, the
newly proposed direct path from the trait of
satisfaction to destination loyalty was shown to be
significant; thus, trait of satisfaction was also a direct
antecedent of destination loyalty. The findings
confirmed that tourists’ loyalty was enhanced by
positive destination image and high satisfaction. The
empirical results of this study providing arguable
evidence that the proposed structural equation model
consider simultaneously destination image, overall
and trait of satisfaction, and destination loyalty.

Aug. 2015. Vol. 5, No.6 ISSN 2307-227X
International Journal of Research In Social Sciences © 2013-2015 IJRSS & K.A.J. All rights reserved
www.ijsk.org/ijrss
39
Moreover, the trait of satisfaction influenced the
destination loyalty. Therefore, destination image
plays an essential role in achieving the loyalty of an
individual, and tourists ’satisfaction must be handled
proactively in order to develop it into a lasting
relationship beneficial to both parties. Destination
image had a positive effect on tourist satisfaction and
destination loyalty. An improvement in the overall
image of an individual increased to make a positive
evaluation of the stay. Consequently, by the review
of the literature, the analysis of the interrelationships
as a whole confirmed the proposed model. This study
confirmed the existence of the critical relationships
among destination image, trait/overall satisfaction,
and destination loyalty. The findings suggested that it
would be useful for destination managers to make
investments in their tourism destination resources, in
order to continue to enhance the tourists’
experiences.
5.2. MANAGRAL IMPLICATIOS
Destinations today are facing vertical competitions.
It is essential to understanding of why travelers are
loyal to a destination and what drives the loyalty. The
findings show significant managerial implications for
tourism and marketers. The analyses revealed that
destination image was consisting of six latent
dimensions, and the trait of satisfaction had six
underlying factors. These results could help
destination marketers better and factors contributing
to tourist satisfaction and loyalty so that they are able
to deliver products and services that accommodate
the tourists’ needs and wants. Despite the
considerable amount of studies on destination image
and tourist loyalty, the multi-dimensional nature of
the constructs and the variability across studies make
it difficult to ascertain a solid linkage between the
variables. Additionally, the SEM findings are
providing guideline for the marketing destinations. It
is a direct antecedent of the traits of satisfaction and
overall satisfaction as well as a major factor in
influencing destination loyalty. Therefore, destination
managers must attempt to improve the image tourists
hold of a destination. As an image is formed, it is
difficult to change; it is important for destinations to
present the right image and then maintain it. Because
the image that tourists hold of a destination will
affect tourists’ satisfaction with the travel
experiences, the WOM communication after the trips
as well as the intention in the future, destination
marketers should take a serious approach to manage
the image. Although it is not possible to control all
the elements contributing to the shaping of the image
of a destination, it is possible to manipulate some of
them such as advertising and promoting tourist
attractions, administering service quality, providing
by tourism infrastructure such as hotels, restaurants,
tourist centers, etc. Similarly, the current study
proposed and confirmed a framework which is more
comprehensive in accounting for and testing the
multiple dimensions simultaneously. Since the image
is modified by information or stimulus received by an
individual, friends, or family will help to find the
diversification of a detail and realistic image of a
destination. Because tourists tend to rely on this
image for satisfaction evaluation and destination
choice decisions, all efforts should improve the
experience. To conclude, tourism destinations must
take care of the image that they attempt to convey
and the quality of the services and products they
offer, as all these will affect visitors’ satisfaction and
their intentions for future behavior. Moreover,
destination managers should consider the role tourist
satisfaction played in developing destination loyalty.
It is assumed that if tourists are satisfied with their
travel experiences, they are willing to revisit a
destination as well as positive WOM. This study
provided empirical evidence supporting this
assumption: satisfaction was directly affected
destination loyalty in a positive direction. Higher
tourist satisfaction will lead to higher destination
loyalty, which prompts tourists to visit a destination
again and/or proposed the destination to others.
Therefore, destination managers should focus on
finding a high tourists’ satisfaction level so improve
sustain destination competitiveness. Since the threat
of satisfaction affects destination loyalty both directly
and indirectly through overall satisfaction, its
measurement and improvement is critical to
destination managers. The special characteristics of
tourism found that many elements are involved in the
formation of tourists’ satisfaction, from the providers
of specific services of accommodation, leisure,
among others, to the tourism information offices, the
local residents, etc. The situations are complicated
when a single unpleasant incident leads to a negative
evaluation, depending on how important the incident
is to the tourist. Therefore, in order to achieve a high
overall level of satisfaction, it is essential for all
parties involved to have a coordination and
cooperation and should be aware of the critical
importance of providing quality service/product
quality.

Aug. 2015. Vol. 5, No.6 ISSN 2307-227X
International Journal of Research In Social Sciences © 2013-2015 IJRSS & K.A.J. All rights reserved
www.ijsk.org/ijrss
40
6. LIMITATIONS
The limitation of this research is as: first, tourists
who travel in different seasons may have different
opinions of a destination. Therefore, tourism research
findings should be taken into consideration in the
interpretation stage. Therefore, future researchers
could conduct similar surveys in different seasons.
The survey results should be compared to identify
similarities and differences in them. In addition, the
population of this study was limited to visitors of a
tourist destination. Overall satisfaction and
repurchase were measured by a single question. In
the present study, overall image demonstrated the
potential of serving as a strong proxy for the
destination image. Compared to the traditional
approach which treats the cognitive aspects of
destination image, overall image may represent a
novel and broader theoretical view and therefore
deserves further scrutiny into its nature and possible
underlying dimensions. The findings also provided
tenable evidence that the destination image exerts
different influence on the different dimensions of
tourist loyalty. Destination image, trait of satisfaction
and overall satisfaction was studied as antecedents to
destination loyalty. Therefore, future researchers are
advised to investigate additional antecedents of
tourist loyalty. This may not lead to the relationships
tested in the current study and to conceptual
refinement and extension. In addition, since the
survey was conducted by the staffs working at
different local destinations such as the welcome
center, hotels/motels, and shops, it was not sure that
all respondents would have completed their traveling
experiences with Uremia while replying to the
survey. Therefore, Data collected from this study
were affected relationships reported. Although SEM
allows one to assume causal relationships, the present
study’s model specification was based on previous
research and theory. As a consequence, the
relationships suggested by the model in this study
may not represent the true causal relationships among
the constructs.
REFERENCES
1. Anderson, J., & Gerbing, D. (1982). Some
methods of respecifying measurement
models to obtain unidimensional construct
measurement. Journal of Marketing
Research, 19, 453–460.
2. Baloglu, S., & McCleary, K. W. (1999). A
model of destination image formation.
Annals of Tourism Research, 26(4), 868–
897.
3. Baron, R. M., & Kenny, D. A. (1986). The
moderator–mediator variable distinction in
social psychological research: Conceptual,
strategic, and statistical considerations.
Journal of Personality and Social
Psychology, 51, 1173–1182.
4. Beerli, A., & Martin, J. (2004). Factors
influencing destination image. Annals of
Tourism Research, 31(3), 657–681.
5. Bettman, J. R., & Park, C. W. (1980).
Effects of prior knowledge and experience
and phase of the choice process on
consumer decision processes: A protocol
analysis. Journal of Consumer Research,
7(3), 234–248.
6. Bigne, J. E., Sanchez, M. I., & Sanchez, J.
(2001). Tourism image, evaluation variables
and after-purchase behavior: Inter-
relationship. Tourism Management, 22(6),
607–616.
7. Bolton, R. N., & Lemon, K. N. (1999). A
dynamic model of customers’ usage of
services: Usage as an antecedent and
consequence of satisfaction. Journal of
Marketing Research, 36(2), 171–186.
8. Bramwell, B. (1998). User satisfaction and
product development in urban tourism.
Tourism Management, 19(1), 35–47.
9. Burns, A. C., & Bush, R. F. (1995).
Marketing research. New Jersey: Prentice-
Hall. Castro, C. B., Armario.
10. Castro, C. B., Armario, E. M., & Ruiz, D.
M. (2007). The influence of market
heterogeneity on the relationship between a
destination’s image and tourists’ future
behavior. Tourism Management, 28(1), 175-
187.
11. Chen, P. J., & Kerstetter, D. L. (1999).
International students’ image of rural
Pennsylvania as a travel destination. Journal
of Travel Research, 37(3), 256–266.
12. Chi, C. G.-Q. (2011). Destination loyalty
formation and travelers’ demographic

Aug. 2015. Vol. 5, No.6 ISSN 2307-227X
International Journal of Research In Social Sciences © 2013-2015 IJRSS & K.A.J. All rights reserved
www.ijsk.org/ijrss
41
characteristics: A multiple group analysis
approach. Journal of Hospitality and
Tourism Research, 35(2), 191–212.
13. Chi, C. G.-Q. (2012). An examination of
destination loyalty: Differences between
first time and repeat visitors. Journal of
Hospitality and Tourism Research, 36(1), 3–
24.
14. Churchill, G. A., Jr., & Surprenant, C.
(1982). An investigation into the
determinants of customer satisfaction.
Journal of Marketing Research,
19(November), 491–504.
15. Court, B. C., & Lupton, R. A. (1997).
Customer portfolio development: Modeling
destination adopters, inactives, and rejecters.
Journal of Travel Research, 36(1), 35–43.
16. Cronin, J. J., Jr.,Brady,M.K.,&Hult, G. T.
M. (2000).Assessing the effects of quality,
value and customer satisfaction on consumer
behavioral intentions in service
environments. Journal of Retailing, 76(2),
193–218.
17. Danaher, P. J., & Arweiler, N. (1996).
Customer satisfaction in the tourist industry:
A case study of visitors to New Zealand.
Journal of Travel Research, 35(1), 89–93.
18. DeVellis, Robert F (1991). Scale
development: theory and applications 2 ed.
(Applied social research methods series ; v.
26)
19. Echtner, C. M., & Ritchie, J. R. B. (1991).
The meaning and measurement of
destination image. The Journal of Tourism
Studies, 2(2), 2–12.
20. Faullant, R., Matzler, K., & Fu¨ ller, J.
(2008). The impact of satisfaction and image
on loyalty: The case of Alpine ski resorts.
Managing Service Quality, 18(2), 163–178.
21. Fornell, C. (1992). A national customer
satisfaction barometer: The Swedish
experience. Journal of Marketing, 56(1), 6–
21.
22. Fornell, C., Johnson, M. D., Anderson, E.
W., Cha, J., & Bryant, B. E. (1996). The
American customer satisfaction index:
Nature, purpose, and findings. Journal of
Marketing, 60(Oct.), 7–18.
23. Fornell, C., & Larcker, D. F. (1981).
Evaluating structural equation models with
unobservable variables and measurement
error. Journal of Marketing Research,
18(February), 39–50.
24. Gartner, W. C. (1989). Tourism image:
Attribute measurement of state tourism
products using multidimensional scaling
techniques. Journal of Travel Research,
28(2), 16–20.
25. Giese, J. L., & Cote, J. A. (2000). Defining
consumer satisfaction. Academy of
Marketing Science Review, 2000(1), 1–24.
26. Goodall, B. (1988). How tourists choose
their holidays: An analytical framework. In
B. Goodall, & G. Ashworth (Eds.),
Marketing in the tourism industry: The
promotion of destination regions (pp. 1–17).
London: Routledge.
27. Gursoy, D. (2011). Modeling tourist
information search behavior: A structural
modeling approach. Saarbru¨cken: Lambert
Academic Publishing.
28. Gursoy, D. (2003). Prior product knowledge
and its influence on the traveler’s
information search behavior. Journal of
Hospitality and Leisure Marketing, 10(3),
113–131.
29. Gursoy, D., & McCleary, K. W. (2004a). An
integrative model of tourists’ information
search behavior. Annals of Tourism
Research, 31(2), 353–373.
30. Hair, J. F., Anderson, R. E., Tatham, R. L.,
& Black, W. C. (1998). Multivariate data
analysis with readings (5th ed). Englewood
Cliffs, NJ: Prentice-Hall International.
31. Hallowell, R. (1996). The relationship of
customer satisfaction, customer loyalty,
profitability: An empirical study.
International Journal of Service Industry
Management, 7(4), 27–42.
32. Horng, J.-S., Liu, C.-H., Chou, H.-Y., &
Tsai, C.-Y. (2012). Understanding the
impact of culinary brand equity and
destination familiarity on travel intentions.
Tourism Management, 33(4), 815–824.
33. Jones, T. O., & Sasser, W. E., Jr. (1995).
Why satisfied customers defect. Harvard
Business Review, 73(November/December),
88–99.
34. Joreskog, K. G., & Sorbom, D. (1995).
LISREL 8: User’s reference guide and
LISREL 8: The SIMPLIS command
language and PRELIS 2: User’s reference
guide. Chicago, IL: Scientific Software
International.
35. Juaneda, C. (1996). Estimating the
probability of return visits using a survey of

Aug. 2015. Vol. 5, No.6 ISSN 2307-227X
International Journal of Research In Social Sciences © 2013-2015 IJRSS & K.A.J. All rights reserved
www.ijsk.org/ijrss
42
tourist expenditure in the Balearic Islands.
Tourism Economics, 2(4), 339–352.
36. Kotler, P., Bowen, J., & Makens, J. (1996).
Marketing for hospitality and tourism. New
Jersey: Prentice-Hall.
37. Kozak, M. (2001). Repeaters’ behavior at
two distinct destinations. Annals of Tourism
Research, 28(3), 784–807.
38. Kozak, M., & Rimmington, M. (2000).
Tourist satisfaction with Mallorca, Spain, as
an off-season holiday destination. Journal of
Travel Research, 38(1), 260–269.
39. Maroofi Fakhraddin, dehghan Samira
(2012),Investigating the Relationships of
Destination Reflect, Tourist Satisfaction and
Destination Loyalty; World Applied
Sciences Journal, 8, 19 1160-1173.
40. Mayer, K. J., Johnson, L., Hu, C., & Chen,
S. (1998). Gaming customer satisfaction: An
exploratory study. Journal of Travel
Research, 37(2), 178–183.
41. Mechinda, P., Serirat, S., & Gulid, N.
(2009). An examination of tourists’
attitudinal and behavioral loyalty:
Comparison between domestic and
international tourists. Journal of Vacation
Marketing, 15(2), 129–148.
42. Milman, A., & Pizam, A. (1995). The role of
awareness and familiarity with a destination:
The central Florida case. Journal of Travel
Research, 33(3), 21–27.
43. Nunnally, J. C. (1978). Psychometric theory.
New York: McGraw-Hill.
44. Nunnally, J. C., & Bernstein, I. H. (1994).
Psychometric theory (3rd ed). New York:
McGraw-Hill.
45. Oh, H. (2000). The effects brand class,
brand awareness, and price on customer
value and behavioral intentions. In Journal
of Hospitality and Tourism Research: Vol.
24(2). Advances in consumer behavior and
research in hospitality and tourism (pp. 136–
162) (special issue).
46. Oliver, R. L. (1980). A cognitive model of
the antecedents and consequences of
satisfaction decisions. Journal of Marketing
Research, 17(4), 46–49.
47. Oliver, R. L. (1993). Cognitive, affective,
and attribute bases of the satisfaction
response. Journal of Consumer Research,
20(December), 418–430.
48. Oliver, R. L. (1997). Satisfaction: A
behavioral perspective on the consumer.
New York: Irwin/McGraw-Hill.
49. Oliver, R. L. (1999). Whence consumer
loyalty? Journal of Marketing, 63, 33–44.
50. Oliver, R. L., & DeSarbo, W. S. (1988).
Response determinants in satisfaction
judgments. Journal of Consumer Research,
14(March), 495–507.
51. Oppermann, M. (2000). Tourism destination
loyalty. Journal of Travel Research, 39(1),
78–84.
52. Ozdemir, B., Aksu, A., Ehtiyar, R., C¸ izel,
B., C¸ izel, R. B., & _Ic¸igen, E. T. (2012).
Relationships among tourist profile,
satisfaction and destination loyalty:
Examining empirical evidences in Antalya
region of Turkey. Journal of Hospitality
Marketing & Management, 21(5), 506–540.
53. Park, C. W., & Lessing, V. P. (1981).
Familiarity and its impact on consumer
decision biases and heuristics. Journal of
Consumer Research, 8(2), 223–230.
54. Patterson, P. G., & Spreng, R. A. (1997).
Modelling the relationship between
perceived value, satisfaction and purchase
intentions in a business-to-business, services
context: An empirical examination.
International Journal of Service Industry
Management, 8(5), 414–434.
55. Petrick, J. F., Morais, D. B., & Norman, W.
(2001). An examination of the determinants
of entertainment vacationers’ intentions to
visit. Journal of Travel Research, 40(1), 41–
48.
56. Pizam, A., & Ellis, T. (1999). Customer
satisfaction and its measurement in
hospitality enterprises. International Journal
of Contemporary Hospitality Management,
11(7), 326–339.
57. Prentice, R. (2004). Tourist familiarity and
imagery. Annals of Tourism Research,
31(4), 923–945.
58. Prayag, G., & Ryan, C. (2012). Antecedents
of tourists’ loyalty to Mauritius: The role
and influence of destination. Journal of
Travel Research, 51(3), 342–356.
59. Ramkissoon, H., & Uysal, M. S. (2011). The
effects of perceived authenticity,
information search behaviour, motivation
and destination imagery on cultural
behavioral intentions of tourists. Current
Issues in Tourism, 14(6), 537e562.

Aug. 2015. Vol. 5, No.6 ISSN 2307-227X
International Journal of Research In Social Sciences © 2013-2015 IJRSS & K.A.J. All rights reserved
www.ijsk.org/ijrss
43
60. Reichheld, F. F. (1996). The loyalty effect.
Boston, MA: Harvard Business School
Press.
61. Reichheld, F. F., & Sasser, W. E. (1990).
Zero defections: Quality comes to services.
Harvard Business Review,
68(September/October), 105–111.
62. Ross, G. F. (1993). Destination evaluation
and vacation preferences. Annals of
Tourism Research, 20, 477–489.
63. Rust, R. T., & Zahorik, A. J. (1993).
Customer loyalty, customer retention and
market share. Journal of Retailing, 69(2),
193–215.
64. Seaton, A. V., & Benett, M. M. (1996).
Marketing tourism products: Concepts,
issues, cases. London: International
Thomson Business Press.
65. Shoemaker, S., & Lewis, R. C. (1999).
Customer loyalty: The future of hospitality
marketing. International Journal of
Hospitality Management, 18, 345–370.
66. Sonmez, S. F., & Graefe, A. R. (1998).
Determining future travel behavior from
past travel experience and perceptions of
risk and safety. Journal of Travel Research,
37(2), 171–178.
67. Spreng, R. A., Mankenzie, S. B., &
Olshavsky, R. W. (1996). A reexamination
of the determinants of consumer satisfaction.
Journal of Marketing, 60(3), 15–32.
68. Spreng, R. A., & Chiou, J.-S. (2002). A
cross-cultural assessment of the satisfaction
formation process. European Journal of
Marketing, 36(7), 829–839.
69. Tasci, A. D. A., Gartner, W. C., & Cavusgil,
S. T. (2007). Conceptualization and
operationalization of destination image.
Journal of Hospitality & Tourism Research,
31(2), 194–223.
70. Taylor, S. A., & Baker, T. L. (1994). An
assessment of the relationship between
service quality and customer satisfaction in
formation of consumers’ purchase
intentions. Journal of Retailing, 70(2), 163–
178.
71. Taylor, T. B. (1998). Better loyalty
measurement leads to business solutions.
Marketing News, 32(22), 41–42.
72. Tse, D. K., & Wilton, P. C. (1988). Models
of consumer satisfaction formation: An
extension. Journal of Marketing Research,
25, 204–212.
73. Yoon, Y., & Uysal, M. (2005). An
examination of the effects of motivation and
satisfaction on destination loyalty: A
structural model. Tourism Management,
26(1), 45–56.