survey on international operations of japanese firms … · survey on international operations of...
TRANSCRIPT

Survey on International Operations of Japanese Firms (FY 2008)
March 23, 2009
Japan External Trade Organization (JETRO)
Japan External Trade Organization
Provisional Translation
Japan External Trade Organization (JETRO)
Contents
2
I. Survey Outline and Profile of Respondent Firms・・・・・・・・・・・・・・・・・・・・・・・・・・・・・・・・・・・・・・・・・・・・・・・・・・・・・・・・・・・・・・・・・・・ 3Approximately half of the firms surveyed have bases in China・・・・・・・・・・・・・・・・・・・・・・・・・・・・・・・・・・・・・・・・・・・・・・・・・・・・・・・ 4
II. Domestic and Overseas Business Operations・・・・・・・・・・・・・・・・・・・・・・・・・・・・・・・・・・・・・・・・・・・・・・・・・・・・・・・・・・・・・・・・・・・・・・ 5(1) Approximately half of the firms surveyed have bases in China・・・・・・・・・・・・・・・・・・・・・・・・・・・・・・・・・・・・・・・・・・・・・・・・・・・ 5(2) Slowdown in plans to expand domestic and overseas operations・・・・・・・・・・・・・・・・・・・・・・・・・・・・・・・・・・・・・・・・・・・・・・・・ 6(3) Overall declining interest in expanding business in China・・・・・・・・・・・・・・・・・・・・・・・・・・・・・・・・・・・・・・・・・・・・・・・・・・・・・・・・・ 7(4) Expansion plans (for the next 3 years or so): Countries or regions and functions ・・・・・・・・・・・・・・・・・・・・・・・・・・・・・・・・・・・・・・・ 8(5) Overall declining interest in expanding sales and production functions in China・・・・・・・・・・・・・・・・・・・・・・・・・・・・・・・・・・・・・・・・ 10(6) Diversified sales targets・・・・・・・・・・・・・・・・・・・・・・・・・・・・・・・・・・・・・・・・・・・・・・・・・・・・・・・・・・・・・・・・・・・・・・・・・・・・・・・・・・・・ 11(7) Shift to high-end products seen in production in Vietnam and India・・・・・・・・・・・・・・・・・・・・・・・・・・・・・・・・・・・・・・・・・・・・・・・・・ 12(8) Growing interest in expanding sales in Brazil and Russia & the CIS・・・・・・・・・・・・・・・・・・・・・・・・・・・・・・・・・・・・・・・・・・・・・・・・・ 13
III. Effects of the US Financial Crisis and Countermeasures・・・・・・・・・・・・・・・・・・・・・・・・・・・・・・・・・・・・・・・・・・・・・・・・・・・・・・・・・・・・ 14(1) Effects of the US financial crisis on overseas business operations ・・・・・・・・・・・・・・・・・・・・・・・・・・・・・・・・・・・・・・・・・・・・・・・・ 14(2) Specific effects and causes・・・・・・・・・・・・・・・・・・・・・・・・・・・・・・・・・・・・・・・・・・・・・・・・・・・・・・・・・・・・・・・・・・・・・・・・・・・・・・・・・・ 16(3) Countermeasures・・・・・・・・・・・・・・・・・・・・・・・・・・・・・・・・・・・・・・・・・・・・・・・・・・・・・・・・・・・・・・・・・・・・・・・・・・・・・・・・・・・・・・・・・ 17(4) Duration of the crisis・・・・・・・・・・・・・・・・・・・・・・・・・・・・・・・・・・・・・・・・・・・・・・・・・・・・・・・・・・・・・・・・・・・・・・・・・・・・・・・・・・・・・・ 18
IV. Business Development in China・・・・・・・・・・・・・・・・・・・・・・・・・・・・・・・・・・・・・・・・・・・・・・・・・・・・・・・・・・・・・・・・・・・・・・・・・・・・・・・・・ 19(1) Slowdown in the expansion trend and more firms maintaining the status quo・・・・・・・・・・・・・・・・・・・・・・・・・・・・・・・・・・・・・・・・・・ 19(2) Marked slowdown in demand in the domestic market after the Olympics・・・・・・・・・・・・・・・・・・・・・・・・・・・・・・・・・・・・・・・・・・・・・ 20
V. Free Trade Agreement (FTA)・・・・・・・・・・・・・・・・・・・・・・・・・・・・・・・・・・・・・・・・・・・・・・・・・・・・・・・・・・・・・・・・・・・・・・・・・・・・・・・・・・・ 21(1) Japanese FTAs utilized in a wide range of industries・・・・・・・・・・・・・・・・・・・・・・・・・・・・・・・・・・・・・・・・・・・・・・・・・・・・・・・・・・・・・ 21(2) Increasing FTA utilization in both imports and exports・・・・・・・・・・・・・・・・・・・・・・・・・・・・・・・・・・・・・・・・・・・・・・・・・・・・・・・・・・・ 22
VI. Asian Business Environment・・・・・・・・・・・・・・・・・・・・・・・・・・・・・・・・・・・・・・・・・・・・・・・・・・・・・・・・・・・・・・・・・・・・・・・・・・・・・・・・・・・ 23(1) Overall growing concern over foreign exchange risks・・・・・・・・・・・・・・・・・・・・・・・・・・・・・・・・・・・・・・・・・・・・・・・・・・・・・・・・・・・・ 23(2) Risks in doing business in major Asian countries (country ranking) ・・・・・・・・・・・・・・・・・・・・・・・・・・・・・・・・・・・・・・・・・・・・・・・・・ 24
Copyright (C) 2009 JETRO. All rights reserved.

1. Survey topics and targets
(1) Survey topicsa. Domestic and overseas business operationsb. Effects of the US financial crisis on Japanese firms’
overseas business activitiesc. Business development in Chinad. Free Trade Agreement (FTA)-related activitiese. The Asian business environment
(2) Survey targets
A total of 3,283 JETRO member firms
Note: Starting this year, the survey includes non-manufacturing firms in addition to firms engaged in manufacturing, trading (import/export), and wholesale/retailing.
2. Period
Distribution of questionnaires: November 20, 2008Deadline: December 22, 2008
3. Response
Number of firms sent questionnaires: 3,283 Number of responses: 928Response ratio: 28.3%
3
Figure I-1 Profile of respondent firms by industryNo. of firms %
All respondents 928 100.0Manufacturing/trade & wholesale/retail total 756 81.5
Firms with overseas production bases 513 55.3Firms with domestic production bases 243 26.2
Manufacturing total 546 58.8Food & beverages 56 6.0Textiles/clothing 33 3.6Wood & wood products/furniture & building materials/paper & pulp 19 2.0Chemicals 46 5.0Medical products & cosmetics 13 1.4Coal & petroleum products/plastics/rubber products 39 4.2Ceramics/earth & stones 18 1.9Iron & steel/non-ferrous metals/metal products 50 5.4General machinery 70 7.5Electrical equipment 53 5.7IT equipment/electronic parts & devices 36 3.9Cars/car parts/other transportation machinery 55 5.9Precision equipment 21 2.3Other manufacturing 37 4.0
Trade & wholesale/retail total 210 22.6Trade & wholesale 193 20.8Retail 17 1.8
Non-manufacturing (exclusive of trade & wholesale/retail total) total 172 18.5Construction 24 2.6Transport 22 2.4Finance & insurance 41 4.4Professional services 21 2.3Electricity, gas and water 5 0.5Telecommunications services 11 1.2Other nonmanufacturing 48 5.2
(For reference) Non-manufacturing (inclusive of trade & wholesale/retail total) totals 382 41.2Large-scale companies 371 40.0Small and medium-sized enterprises (SMEs) 557 60.0
〔Notes〕SMEs are classified as such based on the definition given in the Small and Medium-SizedEnterprise Basic Act
Japan External Trade Organization (JETRO)Copyright (C) 2009 JETRO. All rights reserved.
I. Survey Outline and Profile of Respondent Firms
Approximately half of the firms surveyed have bases in China
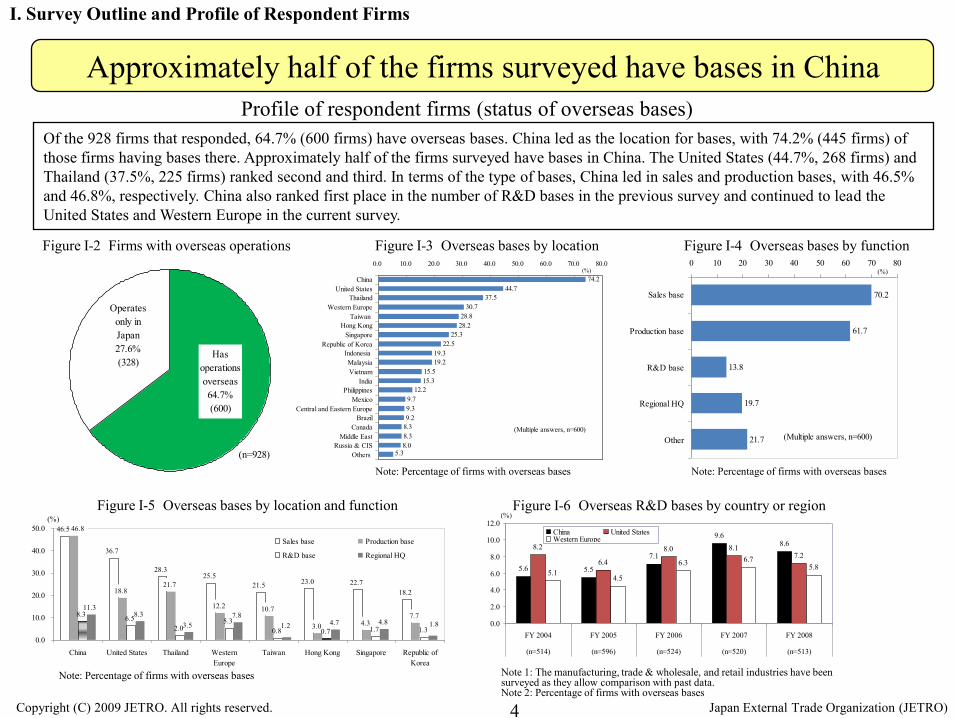
Of the 928 firms that responded, 64.7% (600 firms) have overseas bases. China led as the location for bases, with 74.2% (445 firms) of those firms having bases there. Approximately half of the firms surveyed have bases in China. The United States (44.7%, 268 firms) and Thailand (37.5%, 225 firms) ranked second and third. In terms of the type of bases, China led in sales and production bases, with 46.5% and 46.8%, respectively. China also ranked first place in the number of R&D bases in the previous survey and continued to lead the United States and Western Europe in the current survey.
Figure I-2 Firms with overseas operations
I. Survey Outline and Profile of Respondent Firms
Figure I-3 Overseas bases by location
Figure I-5 Overseas bases by location and function
Profile of respondent firms (status of overseas bases)
Note: Percentage of firms with overseas bases Note: Percentage of firms with overseas bases
Note: Percentage of firms with overseas bases Note 1: The manufacturing, trade & wholesale, and retail industries have been surveyed as they allow comparison with past data. Note 2: Percentage of firms with overseas bases
4 Japan External Trade Organization (JETRO)Copyright (C) 2009 JETRO. All rights reserved.
Figure I-4 Overseas bases by function
Operatesonly inJapan27.6%(328)
Hasoperationsoverseas64.7%(600)
(n=928)
74.244.7
37.530.7
28.828.2
25.322.5
19.319.2
15.515.3
12.29.79.39.2
8.38.38.0
5.3
0.0 10.0 20.0 30.0 40.0 50.0 60.0 70.0 80.0
ChinaUnited States
ThailandWestern Europe
Taiwan Hong Kong
SingaporeRepublic of Korea
Indonesia MalaysiaVietnam
IndiaPhilippines
MexicoCentral and Eastern Europe
BrazilCanada
Middle EastRussia & CIS
Others
(%)
(Multiple answers, n=600)
70.2
61.7
13.8
19.7
21.7
0 10 20 30 40 50 60 70 80
Sales base
Production base
R&D base
Regional HQ
Other (Multiple answers, n=600)
(%)
46.5
36.7
28.325.5
21.5 23.0 22.718.218.8
21.7
12.2 10.7
3.0 4.37.78.3 6.5
2.05.3
0.8 0.7 1.7 1.3
11.38.3
3.57.8
4.7 4.8
46.8
1.2 1.8
0.0
10.0
20.0
30.0
40.0
50.0
China United States Thailand WesternEurope
Taiwan Hong Kong Singapore Republic ofKorea
Sales base Production base
R&D base Regional HQ
(%)
5.6 5.5
7.1
9.68.68.2
6.4
8.0 8.17.2
5.14.5
6.3 6.75.8
0.0
2.0
4.0
6.0
8.0
10.0
12.0
FY 2004 FY 2005 FY 2006 FY 2007 FY 2008
(n=514) (n=596) (n=524) (n=520) (n=513)
China United StatesWestern Europe
(%)Figure I-6 Overseas R&D bases by country or region

Domestic and overseas business plans for the next 3 years or so Nearly 50% aim to expand overseas operationsIn the next 3 years or so, 50.3% plan to expand their business overseas, with either new investments or expansion of existing bases. This figure outstripped those planning to expand domestic operations (35.5%). In terms of trends of industries for which chronological comparisons are possible, i.e. manufacturing, trade & wholesale, and retail, those planning to expand operations dropped significantly both domestically and overseas, while those planning to maintain the current scale increased significantly. However, while those planning to scale down or close business increased from 1.6% to 4.1% domestically, in terms of business overseas there was little change from the previous survey at 2.1%.
II. Domestic and Overseas Business Operations
5 Japan External Trade Organization (JETRO)Copyright (C) 2009 JETRO. All rights reserved.
(1) Slowdown in plans to expand domestic and overseas operations
Expand operations50.3% (467)
Maintain current scale32.9% (305)
Scale down or closebusiness 2.0% (19)
No investment overseas9.5% (88)
Others 2.4% (22)
No answer 2.9% (27)
0% 10% 20% 30% 40% 50% 60% 70% 80% 90% 100%
Expand operations35.5% (329)
Maintain current scale49.4% (458)
Scale down or closebusiness 3.9% (36)
Others 1.2% (11)
No answer 10.1% (94)
0% 10% 20% 30% 40% 50% 60% 70% 80% 90% 100%
64.8
65.6
65.4
66.4
52.8
22.1
23.2
22.8
21.3
33.7
7.8
6.3
9.1
6.5
7.5
3.5
0.6
0.8
0.3
1.8
2.1
1.1
2.4
1.0
1.6
1.2
1.8
1.5
2.3
2.6
0 10 20 30 40 50 60 70 80 90 100
2004 survey
2005 survey
2006 survey
2007 survey
2008 survey
Expand operations Maintain current scale Scale down or close business
No investment overseas Other No answer
(n=714)
(n=796)
(n=729)
(n=756)
(n=733)
(%)
47.3
51.0
52.8
50.2
34.1
41.6
40.1
40.2
37.9
50.4
4.1
9.0
10.4
2.9
1.8
1.8
1.6
4.1
1.0
0.6
1.1
1.2
0.9
7.1
6.5
0 10 20 30 40 50 60 70 80 90 100
2004 survey
2005 survey
2006 survey
2007 survey
2008 survey
Expand operations Maintain current scale Scale down or close business Other No answer
(n=714)
(n=796)
(n=729)
(n=756)
(n=733)
(%)
Figure II-2 Domestic business plans (all industries)
Figure II-3 Overseas business plans (manufacturing, trade & wholesale, retail) Figure II-4 Domestic business plans (manufacturing, trade & wholesale, retail)
Figure II-1 Overseas business plans (all industries)

Figure II-5 Functions to be expanded in Japan and overseas (all industries)
Figure II-6 Functions to be expanded in Japan (manufacturing, trade & wholesale, retail)
Business plans by function for the next 3 years or so Strong interest in expanding overseas business by the materials industriesFocusing on domestic and overseas business plans by function for the next 3 years or so, while firms were strongly inclined to expand their production (high-end products) and R&D (primary research, new product development) functions domestically, they intended to expand their sales, production (mid to low-end products), and R&D (localization) functions overseas. In terms of industries, there was a strong tendency among the non-manufacturing industries to expand their domestic functions, while the majority of firms in the medical products & cosmetics and chemicals industries responded that they intended to expand their overseas functions.
II. Domestic and Overseas Business Operations
6
Figure II-7 Functions to be expanded overseas(manufacturing, trade & wholesale, retail) Figure II-8 Major industries expanding business in Japan and overseas
Japan External Trade Organization (JETRO)Copyright (C) 2009 JETRO. All rights reserved.
(2) Expanding sales and production (mid to low-end products) overseas
76.9
49.7
37.5
22.5
20.8
2.4
19.9
9.6
15.2
9.9
18.0
1.76.2
64.1
41.9
14.6
37.7
41.0
17.3
39.2
37.4
10.3
6.1
12.5
1.511.6
0.0 10.0 20.0 30.0 40.0 50.0 60.0 70.0 80.0 90.0
Sales operations
Production (mid to low-end products, high-end products)
Production (mid to low-end products)
Production (high-end products)
R&D (primary research, new product development, localization)
R&D (primary research)
R&D (new product development, localization)
R&D (new product development)
R&D (localization)
Regional HQ
Distribution
Other
No Answer
OverseasIn Japan
(Multiple answers, No. of firms expanding in Japan: 329,No. of firms expanding overseas: 467)
81.9
48.2
32.8
5.4
11.9
14.3
16.4
1.7
78.5
48.1
23.0
4.8
16.8
16.9
17.6
1.1
77.4
49.9
32.9
6.7
25.4
15.1
18.9
1.9
81.7
43.3
26.3
5.1
25.5
13.3
18.3
1.8
77.4
41.6
23.3
2.8
20.8
10.3
17.5
0.5
0.0 10.0 20.0 30.0 40.0 50.0 60.0 70.0 80.0 90.0
Sales operations
Production (mid to low-end products)
Production (high-end products)
R&D (primary research)
R&D (new product development, localization)
Regional HQ
Distribution
Other
2004 survey (n=463)
2005 survey (n=522)
2006 survey (n=477)
2007 survey (n=487)
2008 survey (n=339)
(%)
(Multiple answers)
76.0
13.6
20.4
42.6
6.5
12.4
66.7
16.7
44.6
9.4
62.3
7.0
0.3
60.3
16.3
26.9
11.1
64.0
41.1
20.2
43.8
48.8
1.2
20.4
43.3
16.0
0.7
18.7
44.7
20.5
45.2
13.8
50.5
45.1
7.3
0.3
16.3
7.0
12.8
0.4
0.0 10.0 20.0 30.0 40.0 50.0 60.0 70.0 80.0
Sales operations
Production (mid to low-end products)
Production (high-end products)
R&D (primary research)
R&D (new product development, localization)
Regional HQ
Distribution
Other
2004 survey (n=338)
2005 survey (n=406)
2006 survey (n=385)
2007 survey (n=368)
2008 survey (n=258)
(%)
(Multiple answers)
No. ofrespondingfirms (n)
Firmsexpandingoverseas
Percentage(%)
928 329 35.51 Retail 17 10 58.82 Professional services 21 12 57.13 Telecommunications services 11 6 54.54 Medical products & cosmetics 13 6 46.25 Chemicals 46 21 45.7
928 467 50.31 Medical products & cosmetics 13 11 84.62 Chemicals 46 34 73.93 Telecommunications services 11 8 72.74 Cars/car parts/other transportation machinery 55 36 65.55 Wood & wood products/furniture & building materials/paper & pulp 19 12 63.2
Industry
Expa
nd o
vers
eas All respondents
Expa
nd in
Japa
n All respondents
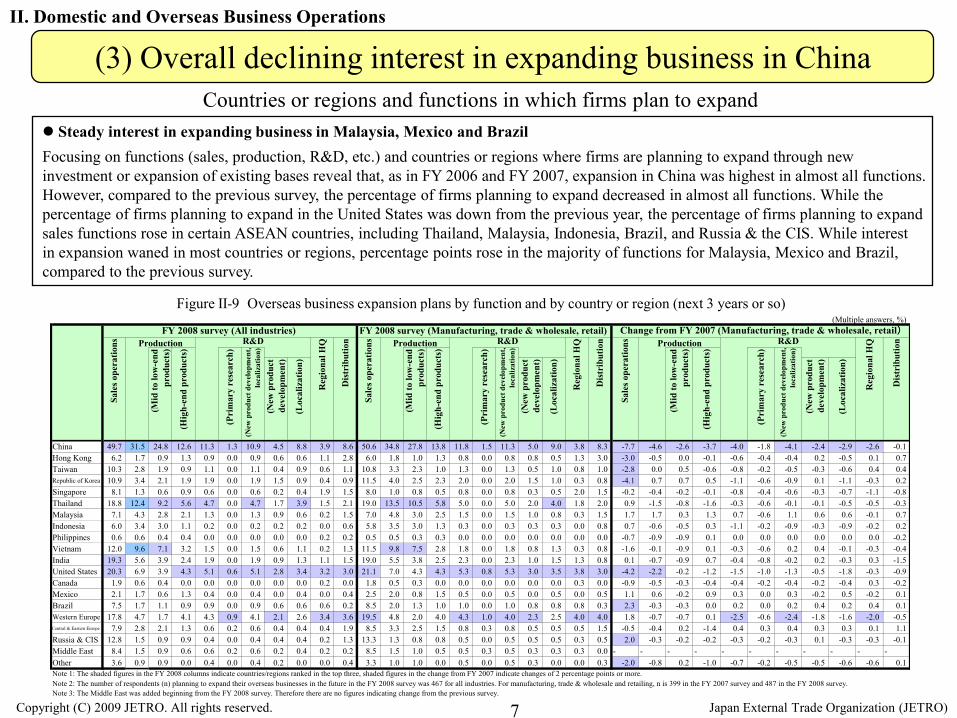
Steady interest in expanding business in Malaysia, Mexico and Brazil Focusing on functions (sales, production, R&D, etc.) and countries or regions where firms are planning to expand through new investment or expansion of existing bases reveal that, as in FY 2006 and FY 2007, expansion in China was highest in almost all functions. However, compared to the previous survey, the percentage of firms planning to expand decreased in almost all functions. While the percentage of firms planning to expand in the United States was down from the previous year, the percentage of firms planning to expand sales functions rose in certain ASEAN countries, including Thailand, Malaysia, Indonesia, Brazil, and Russia & the CIS. While interest in expansion waned in most countries or regions, percentage points rose in the majority of functions for Malaysia, Mexico and Brazil, compared to the previous survey.
Figure II-9 Overseas business expansion plans by function and by country or region (next 3 years or so)
Countries or regions and functions in which firms plan to expand
II. Domestic and Overseas Business Operations
7 Japan External Trade Organization (JETRO)Copyright (C) 2009 JETRO. All rights reserved.
(3) Overall declining interest in expanding business in China
(Multiple answers, %)
(New
pro
duct
deve
lopm
ent)
(Loc
aliz
atio
n)
(New
pro
duct
deve
lopm
ent)
(Loc
aliz
atio
n)
(New
pro
duct
deve
lopm
ent)
(Loc
aliz
atio
n)
China 49.7 31.5 24.8 12.6 11.3 1.3 10.9 4.5 8.8 3.9 8.6 50.6 34.8 27.8 13.8 11.8 1.5 11.3 5.0 9.0 3.8 8.3 -7.7 -4.6 -2.6 -3.7 -4.0 -1.8 -4.1 -2.4 -2.9 -2.6 -0.1Hong Kong 6.2 1.7 0.9 1.3 0.9 0.0 0.9 0.6 0.6 1.1 2.8 6.0 1.8 1.0 1.3 0.8 0.0 0.8 0.8 0.5 1.3 3.0 -3.0 -0.5 0.0 -0.1 -0.6 -0.4 -0.4 0.2 -0.5 0.1 0.7Taiwan 10.3 2.8 1.9 0.9 1.1 0.0 1.1 0.4 0.9 0.6 1.1 10.8 3.3 2.3 1.0 1.3 0.0 1.3 0.5 1.0 0.8 1.0 -2.8 0.0 0.5 -0.6 -0.8 -0.2 -0.5 -0.3 -0.6 0.4 0.4Republic of Korea 10.9 3.4 2.1 1.9 1.9 0.0 1.9 1.5 0.9 0.4 0.9 11.5 4.0 2.5 2.3 2.0 0.0 2.0 1.5 1.0 0.3 0.8 -4.1 0.7 0.7 0.5 -1.1 -0.6 -0.9 0.1 -1.1 -0.3 0.2Singapore 8.1 1.3 0.6 0.9 0.6 0.0 0.6 0.2 0.4 1.9 1.5 8.0 1.0 0.8 0.5 0.8 0.0 0.8 0.3 0.5 2.0 1.5 -0.2 -0.4 -0.2 -0.1 -0.8 -0.4 -0.6 -0.3 -0.7 -1.1 -0.8Thailand 18.8 12.4 9.2 5.6 4.7 0.0 4.7 1.7 3.9 1.5 2.1 19.0 13.5 10.5 5.8 5.0 0.0 5.0 2.0 4.0 1.8 2.0 0.9 -1.5 -0.8 -1.6 -0.3 -0.6 -0.1 -0.1 -0.5 -0.5 -0.3Malaysia 7.1 4.3 2.8 2.1 1.3 0.0 1.3 0.9 0.6 0.2 1.5 7.0 4.8 3.0 2.5 1.5 0.0 1.5 1.0 0.8 0.3 1.5 1.7 1.7 0.3 1.3 0.7 -0.6 1.1 0.6 0.6 -0.1 0.7Indonesia 6.0 3.4 3.0 1.1 0.2 0.0 0.2 0.2 0.2 0.0 0.6 5.8 3.5 3.0 1.3 0.3 0.0 0.3 0.3 0.3 0.0 0.8 0.7 -0.6 -0.5 0.3 -1.1 -0.2 -0.9 -0.3 -0.9 -0.2 0.2Philippines 0.6 0.6 0.4 0.4 0.0 0.0 0.0 0.0 0.0 0.2 0.2 0.5 0.5 0.3 0.3 0.0 0.0 0.0 0.0 0.0 0.0 0.0 -0.7 -0.9 -0.9 0.1 0.0 0.0 0.0 0.0 0.0 0.0 -0.2Vietnam 12.0 9.6 7.1 3.2 1.5 0.0 1.5 0.6 1.1 0.2 1.3 11.5 9.8 7.5 2.8 1.8 0.0 1.8 0.8 1.3 0.3 0.8 -1.6 -0.1 -0.9 0.1 -0.3 -0.6 0.2 0.4 -0.1 -0.3 -0.4India 19.3 5.6 3.9 2.4 1.9 0.0 1.9 0.9 1.3 1.1 1.5 19.0 5.5 3.8 2.5 2.3 0.0 2.3 1.0 1.5 1.3 0.8 0.1 -0.7 -0.9 0.7 -0.4 -0.8 -0.2 0.2 -0.3 0.3 -1.5United States 20.3 6.9 3.9 4.3 5.1 0.6 5.1 2.8 3.4 3.2 3.0 21.1 7.0 4.3 4.3 5.3 0.8 5.3 3.0 3.5 3.8 3.0 -4.2 -2.2 -0.2 -1.2 -1.5 -1.0 -1.3 -0.5 -1.8 -0.3 -0.9Canada 1.9 0.6 0.4 0.0 0.0 0.0 0.0 0.0 0.0 0.2 0.0 1.8 0.5 0.3 0.0 0.0 0.0 0.0 0.0 0.0 0.3 0.0 -0.9 -0.5 -0.3 -0.4 -0.4 -0.2 -0.4 -0.2 -0.4 0.3 -0.2Mexico 2.1 1.7 0.6 1.3 0.4 0.0 0.4 0.0 0.4 0.0 0.4 2.5 2.0 0.8 1.5 0.5 0.0 0.5 0.0 0.5 0.0 0.5 1.1 0.6 -0.2 0.9 0.3 0.0 0.3 -0.2 0.5 -0.2 0.1Brazil 7.5 1.7 1.1 0.9 0.9 0.0 0.9 0.6 0.6 0.6 0.2 8.5 2.0 1.3 1.0 1.0 0.0 1.0 0.8 0.8 0.8 0.3 2.3 -0.3 -0.3 0.0 0.2 0.0 0.2 0.4 0.2 0.4 0.1Western Europe 17.8 4.7 1.7 4.1 4.3 0.9 4.1 2.1 2.6 3.4 3.6 19.5 4.8 2.0 4.0 4.3 1.0 4.0 2.3 2.5 4.0 4.0 1.8 -0.7 -0.7 0.1 -2.5 -0.6 -2.4 -1.8 -1.6 -2.0 -0.5Central & Eastern Europe 7.9 2.8 2.1 1.3 0.6 0.2 0.6 0.4 0.4 0.4 1.9 8.5 3.3 2.5 1.5 0.8 0.3 0.8 0.5 0.5 0.5 1.5 -0.5 -0.4 0.2 -1.4 0.4 0.3 0.4 0.3 0.3 0.1 1.1Russia & CIS 12.8 1.5 0.9 0.9 0.4 0.0 0.4 0.4 0.4 0.2 1.3 13.3 1.3 0.8 0.8 0.5 0.0 0.5 0.5 0.5 0.3 0.5 2.0 -0.3 -0.2 -0.2 -0.3 -0.2 -0.3 0.1 -0.3 -0.3 -0.1Middle East 8.4 1.5 0.9 0.6 0.6 0.2 0.6 0.2 0.4 0.2 0.2 8.5 1.5 1.0 0.5 0.5 0.3 0.5 0.3 0.3 0.3 0.0 - - - - - - - - - - -Other 3.6 0.9 0.9 0.0 0.4 0.0 0.4 0.2 0.0 0.0 0.4 3.3 1.0 1.0 0.0 0.5 0.0 0.5 0.3 0.0 0.0 0.3 -2.0 -0.8 0.2 -1.0 -0.7 -0.2 -0.5 -0.5 -0.6 -0.6 0.1Note 1: The shaded figures in the FY 2008 columns indicate countries/regions ranked in the top three, shaded figures in the change from FY 2007 indicate changes of 2 percentage points or more. Note 2: The number of respondents (n) planning to expand their overseas businesses in the future in the FY 2008 survey was 467 for all industries. For manufacturing, trade & wholesale and retailing, n is 399 in the FY 2007 survey and 487 in the FY 2008 survey.Note 3: The Middle East was added beginning from the FY 2008 survey. Therefore there are no figures indicating change from the previous survey.
(New
pro
duct
dev
elop
men
t,lo
caliz
atio
n)
(Mid
to lo
w-e
ndpr
oduc
ts)
(Hig
h-en
d pr
oduc
ts)
(New
pro
duct
dev
elop
men
t,lo
caliz
atio
n)
(Pri
mar
y re
sear
ch)
Sale
s ope
ratio
ns
Reg
iona
l HQ
Dis
trib
utio
n
Sale
s ope
ratio
ns
Dis
trib
utio
n
Reg
iona
l HQ
Change from FY 2007 (Manufacturing, trade & wholesale, retail)FY 2008 survey (All industries)
Sale
s ope
ratio
ns
Reg
iona
l HQ
Dis
trib
utio
nProduction R&D
(Mid
to lo
w-e
ndpr
oduc
ts) Production R&DProduction R&D
(Mid
to lo
w-e
ndpr
oduc
ts)
FY 2008 survey (Manufacturing, trade & wholesale, retail)
(Pri
mar
y re
sear
ch)
(Hig
h-en
d pr
oduc
ts)
(New
pro
duct
dev
elop
men
t,lo
caliz
atio
n)
(Pri
mar
y re
sear
ch)
(Hig
h-en
d pr
oduc
ts)

Planned expansion rankings on each function by country or region (all industries) Figure II-10 Country or region rankings by function on expansion planned in the next 3 years or so (all industries)
II. Domestic and Overseas Business Operations
8 Japan External Trade Organization (JETRO)Copyright (C) 2009 JETRO. All rights reserved.
(4) Expansion plans (for the next 3 years or so): Countries or regions and functions (1)
(Multiple answers, %)Sales operations
R&D (primary research) FY 2008 survey FY 2008 survey FY 2008 survey FY 2008 survey FY 2008 survey FY 2008 survey
1 China 49.7 China 31.5 China 24.8 China 12.6 China 11.3 China 1.32 United States 20.3 Thailand 12.4 Thailand 9.2 Thailand 5.6 United States 5.1 Western Europe 0.93 India 19.3 Vietnam 9.6 Vietnam 7.1 United States 4.3 Thailand 4.7 United States 0.64 Thailand 18.8 United States 6.9 India 3.9 Western Europe 4.1 Western Europe 4.3 Central & Eastern Europe 0.25 Western Europe 17.8 India 5.6 United States 3.9 Vietnam 3.2 Republic of Korea 1.9 Middle East 0.26 Russia & CIS 12.8 Western Europe 4.7 Indonesia 3.0 India 2.4 India 1.9 Hong Kong 0.07 Vietnam 12.0 Malaysia 4.3 Malaysia 2.8 Malaysia 2.1 Vietnam 1.5 Taiwan 0.08 Republic of Korea 10.9 Republic of Korea 3.4 Republic of Korea 2.1 Republic of Korea 1.9 Malaysia 1.3 Republic of Korea 0.09 Taiwan 10.3 Indonesia 3.4 Central & Eastern Europe 2.1 Hong Kong 1.3 Taiwan 1.1 Singapore 0.0
10 Middle East 8.4 Taiwan 2.8 Taiwan 1.9 Mexico 1.3 Hong Kong 0.9 Thailand 0.011 Singapore 8.1 Central & Eastern Europe 2.8 Western Europe 1.7 Central & Eastern Europe 1.3 Brazil 0.9 Malaysia 0.012 Central & Eastern Europe 7.9 Hong Kong 1.7 Brazil 1.1 Indonesia 1.1 Singapore 0.6 Indonesia 0.013 Brazil 7.5 Mexico 1.7 Hong Kong 0.9 Thailand 0.9 Central & Eastern Europe 0.6 Philippines 0.014 Malaysia 7.1 Brazil 1.7 Russia & CIS 0.9 Singapore 0.9 Middle East 0.6 Vietnam 0.015 Hong Kong 6.2 Russia & CIS 1.5 Middle East 0.9 Brazil 0.9 Mexico 0.4 India 0.016 Indonesia 6.0 Middle East 1.5 Singapore 0.6 Russia 0.9 Russia & CIS 0.4 Canada 0.017 Mexico 2.1 Singapore 1.3 Mexico 0.6 Middle East 0.6 Indonesia 0.2 Mexico 0.018 Canada 1.9 Philippines 0.6 Philippines 0.4 Philippines 0.4 Philippines 0.0 Brazil 0.019 Philippines 0.6 Canada 0.6 Canada 0.4 Canada 0.0 Canada 0.0 Russia & CIS 0.0
Regional HQ Distribution
FY 2008 survey FY 2008 survey FY 2008 survey FY 2008 survey FY 2008 survey
1 China 10.9 China 4.5 China 8.8 China 3.9 China 8.62 United States 5.1 United States 2.8 Thailand 3.9 Western Europe 3.4 Western Europe 3.63 Thailand 4.7 Western Europe 2.1 United States 3.4 United States 3.2 United States 3.04 Western Europe 4.1 Thailand 1.7 Western Europe 2.6 Singapore 1.9 Hong Kong 2.85 Republic of Korea 1.9 Republic of Korea 1.5 India 1.3 Thailand 1.5 Thailand 2.16 India 1.9 Malaysia 0.9 Vietnam 1.1 Hong Kong 1.1 Central & Eastern Europe 1.97 Vietnam 1.5 India 0.9 Taiwan 0.9 India 1.1 Singapore 1.58 Malaysia 1.3 Hong Kong 0.6 Republic of Korea 0.9 Taiwan 0.6 Malaysia 1.59 Taiwan 1.1 Vietnam 0.6 Hong Kong 0.6 Brazil 0.6 India 1.5
10 Hong Kong 0.9 Brazil 0.6 Malaysia 0.6 Republic of Korea 0.4 Vietnam 1.311 Brazil 0.9 Taiwan 0.4 Brazil 0.6 Central & Eastern Europe 0.4 Russia & CIS 1.312 Singapore 0.6 Central & Eastern Europe 0.4 Singapore 0.4 Malaysia 0.2 Taiwan 1.113 Central & Eastern Europe 0.6 Russia & CIS 0.4 Mexico 0.4 Philippines 0.2 Republic of Korea 0.914 Middle East 0.6 Singapore 0.2 Central & Eastern Europe 0.4 Vietnam 0.2 Indonesia 0.615 Mexico 0.4 Indonesia 0.2 Russia & CIS 0.4 Canada 0.2 Mexico 0.416 Russia & CIS 0.4 Middle East 0.2 Middle East 0.4 Russia & CIS 0.2 Philippines 0.217 Indonesia 0.2 Philippines 0.0 Indonesia 0.2 Middle East 0.2 Brazil 0.218 Philippines 0.0 Canada 0.0 Philippines 0.0 Indonesia 0.0 Middle East 0.219 Canada 0.0 Mexico 0.0 Canada 0.0 Mexico 0.0 Canada 0.0
Note: The number of respondents (n) planning to expand their overseas businesses in the future in the survey was 467.
Production (mid to low-end products, high-end products) R&D (primary research, new product development, localization) Rank
RankR&D (new product development, localization)
Production (mid to low-end products) Production (high-end products)
R&D (new product development) R&D (localization)
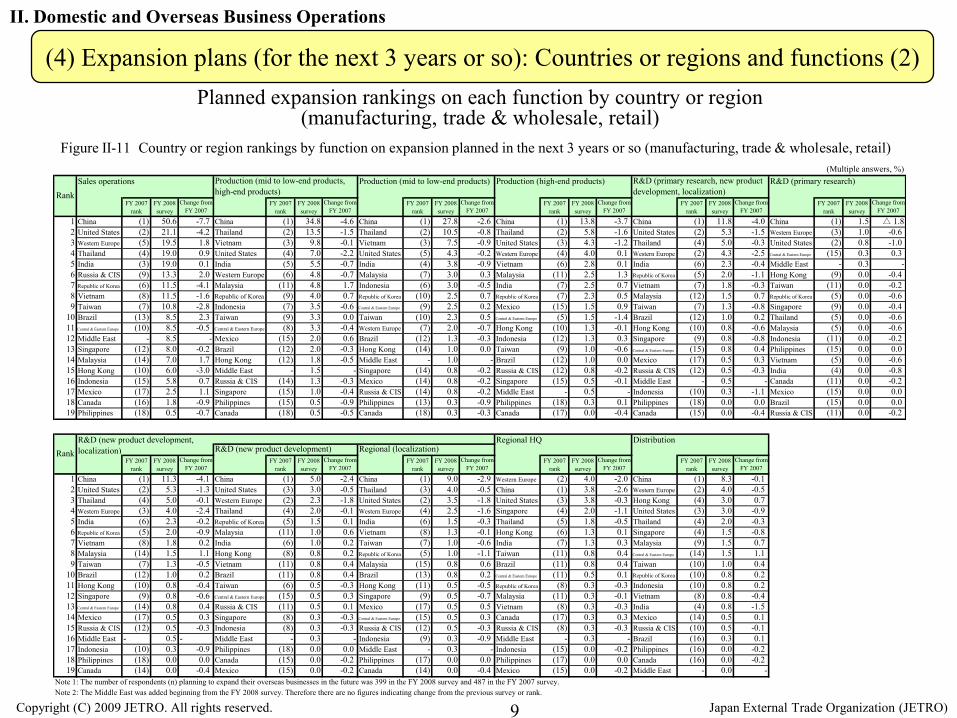
Planned expansion rankings on each function by country or region (manufacturing, trade & wholesale, retail)
Figure II-11 Country or region rankings by function on expansion planned in the next 3 years or so (manufacturing, trade & wholesale, retail)
II. Domestic and Overseas Business Operations
9 Japan External Trade Organization (JETRO)Copyright (C) 2009 JETRO. All rights reserved.
(4) Expansion plans (for the next 3 years or so): Countries or regions and functions (2)
(Multiple answers, %)Sales operations
FY 2007rank
FY 2008survey
Change fromFY 2007
FY 2007rank
FY 2008survey
Change fromFY 2007
FY 2007rank
FY 2008survey
Change fromFY 2007
FY 2007rank
FY 2008survey
Change fromFY 2007
FY 2007rank
FY 2008survey
Change fromFY 2007
FY 2007rank
FY 2008survey
Change fromFY 2007
1 China (1) 50.6 -7.7 China (1) 34.8 -4.6 China (1) 27.8 -2.6 China (1) 13.8 -3.7 China (1) 11.8 -4.0 China (1) 1.5 △ 1.82 United States (2) 21.1 -4.2 Thailand (2) 13.5 -1.5 Thailand (2) 10.5 -0.8 Thailand (2) 5.8 -1.6 United States (2) 5.3 -1.5 Western Europe (3) 1.0 -0.63 Western Europe (5) 19.5 1.8 Vietnam (3) 9.8 -0.1 Vietnam (3) 7.5 -0.9 United States (3) 4.3 -1.2 Thailand (4) 5.0 -0.3 United States (2) 0.8 -1.04 Thailand (4) 19.0 0.9 United States (4) 7.0 -2.2 United States (5) 4.3 -0.2 Western Europe (4) 4.0 0.1 Western Europe (2) 4.3 -2.5 Central & Eastern Europe (15) 0.3 0.35 India (3) 19.0 0.1 India (5) 5.5 -0.7 India (4) 3.8 -0.9 Vietnam (6) 2.8 0.1 India (6) 2.3 -0.4 Middle East - 0.3 -6 Russia & CIS (9) 13.3 2.0 Western Europe (6) 4.8 -0.7 Malaysia (7) 3.0 0.3 Malaysia (11) 2.5 1.3 Republic of Korea (5) 2.0 -1.1 Hong Kong (9) 0.0 -0.47 Republic of Korea (6) 11.5 -4.1 Malaysia (11) 4.8 1.7 Indonesia (6) 3.0 -0.5 India (7) 2.5 0.7 Vietnam (7) 1.8 -0.3 Taiwan (11) 0.0 -0.28 Vietnam (8) 11.5 -1.6 Republic of Korea (9) 4.0 0.7 Republic of Korea (10) 2.5 0.7 Republic of Korea (7) 2.3 0.5 Malaysia (12) 1.5 0.7 Republic of Korea (5) 0.0 -0.69 Taiwan (7) 10.8 -2.8 Indonesia (7) 3.5 -0.6 Central & Eastern Europe (9) 2.5 0.2 Mexico (15) 1.5 0.9 Taiwan (7) 1.3 -0.8 Singapore (9) 0.0 -0.4
10 Brazil (13) 8.5 2.3 Taiwan (9) 3.3 0.0 Taiwan (10) 2.3 0.5 Central & Eastern Europe (5) 1.5 -1.4 Brazil (12) 1.0 0.2 Thailand (5) 0.0 -0.611 Central & Eastern Europe (10) 8.5 -0.5 Central & Eastern Europe (8) 3.3 -0.4 Western Europe (7) 2.0 -0.7 Hong Kong (10) 1.3 -0.1 Hong Kong (10) 0.8 -0.6 Malaysia (5) 0.0 -0.612 Middle East - 8.5 - Mexico (15) 2.0 0.6 Brazil (12) 1.3 -0.3 Indonesia (12) 1.3 0.3 Singapore (9) 0.8 -0.8 Indonesia (11) 0.0 -0.213 Singapore (12) 8.0 -0.2 Brazil (12) 2.0 -0.3 Hong Kong (14) 1.0 0.0 Taiwan (9) 1.0 -0.6 Central & Eastern Europe (15) 0.8 0.4 Philippines (15) 0.0 0.014 Malaysia (14) 7.0 1.7 Hong Kong (12) 1.8 -0.5 Middle East - 1.0 - Brazil (12) 1.0 0.0 Mexico (17) 0.5 0.3 Vietnam (5) 0.0 -0.615 Hong Kong (10) 6.0 -3.0 Middle East - 1.5 - Singapore (14) 0.8 -0.2 Russia & CIS (12) 0.8 -0.2 Russia & CIS (12) 0.5 -0.3 India (4) 0.0 -0.816 Indonesia (15) 5.8 0.7 Russia & CIS (14) 1.3 -0.3 Mexico (14) 0.8 -0.2 Singapore (15) 0.5 -0.1 Middle East - 0.5 - Canada (11) 0.0 -0.217 Mexico (17) 2.5 1.1 Singapore (15) 1.0 -0.4 Russia & CIS (14) 0.8 -0.2 Middle East - 0.5 - Indonesia (10) 0.3 -1.1 Mexico (15) 0.0 0.018 Canada (16) 1.8 -0.9 Philippines (15) 0.5 -0.9 Philippines (13) 0.3 -0.9 Philippines (18) 0.3 0.1 Philippines (18) 0.0 0.0 Brazil (15) 0.0 0.019 Philippines (18) 0.5 -0.7 Canada (18) 0.5 -0.5 Canada (18) 0.3 -0.3 Canada (17) 0.0 -0.4 Canada (15) 0.0 -0.4 Russia & CIS (11) 0.0 -0.2
R&D (new product development) Regional (localization)FY 2007
rankFY 2008survey
Change fromFY 2007
FY 2007rank
FY 2008survey
Change fromFY 2007
FY 2007rank
FY 2008survey
Change fromFY 2007
FY 2007rank
FY 2008survey
Change fromFY 2007
FY 2007rank
FY 2008survey
Change fromFY 2007
1 China (1) 11.3 -4.1 China (1) 5.0 -2.4 China (1) 9.0 -2.9 Western Europe (2) 4.0 -2.0 China (1) 8.3 -0.12 United States (2) 5.3 -1.3 United States (3) 3.0 -0.5 Thailand (3) 4.0 -0.5 China (1) 3.8 -2.6 Western Europe (2) 4.0 -0.53 Thailand (4) 5.0 -0.1 Western Europe (2) 2.3 -1.8 United States (2) 3.5 -1.8 United States (3) 3.8 -0.3 Hong Kong (4) 3.0 0.74 Western Europe (3) 4.0 -2.4 Thailand (4) 2.0 -0.1 Western Europe (4) 2.5 -1.6 Singapore (4) 2.0 -1.1 United States (3) 3.0 -0.95 India (6) 2.3 -0.2 Republic of Korea (5) 1.5 0.1 India (6) 1.5 -0.3 Thailand (5) 1.8 -0.5 Thailand (4) 2.0 -0.36 Republic of Korea (5) 2.0 -0.9 Malaysia (11) 1.0 0.6 Vietnam (8) 1.3 -0.1 Hong Kong (6) 1.3 0.1 Singapore (4) 1.5 -0.87 Vietnam (8) 1.8 0.2 India (6) 1.0 0.2 Taiwan (7) 1.0 -0.6 India (7) 1.3 0.3 Malaysia (9) 1.5 0.78 Malaysia (14) 1.5 1.1 Hong Kong (8) 0.8 0.2 Republic of Korea (5) 1.0 -1.1 Taiwan (11) 0.8 0.4 Central & Eastern Europe (14) 1.5 1.19 Taiwan (7) 1.3 -0.5 Vietnam (11) 0.8 0.4 Malaysia (15) 0.8 0.6 Brazil (11) 0.8 0.4 Taiwan (10) 1.0 0.4
10 Brazil (12) 1.0 0.2 Brazil (11) 0.8 0.4 Brazil (13) 0.8 0.2 Central & Eastern Europe (11) 0.5 0.1 Republic of Korea (10) 0.8 0.211 Hong Kong (10) 0.8 -0.4 Taiwan (6) 0.5 -0.3 Hong Kong (11) 0.5 -0.5 Republic of Korea (8) 0.3 -0.3 Indonesia (10) 0.8 0.212 Singapore (9) 0.8 -0.6 Central & Eastern Europe (15) 0.5 0.3 Singapore (9) 0.5 -0.7 Malaysia (11) 0.3 -0.1 Vietnam (8) 0.8 -0.413 Central & Eastern Europe (14) 0.8 0.4 Russia & CIS (11) 0.5 0.1 Mexico (17) 0.5 0.5 Vietnam (8) 0.3 -0.3 India (4) 0.8 -1.514 Mexico (17) 0.5 0.3 Singapore (8) 0.3 -0.3 Central & Eastern Europe (15) 0.5 0.3 Canada (17) 0.3 0.3 Mexico (14) 0.5 0.115 Russia & CIS (12) 0.5 -0.3 Indonesia (8) 0.3 -0.3 Russia & CIS (12) 0.5 -0.3 Russia & CIS (8) 0.3 -0.3 Russia & CIS (10) 0.5 -0.116 Middle East - 0.5 - Middle East - 0.3 - Indonesia (9) 0.3 -0.9 Middle East - 0.3 - Brazil (16) 0.3 0.117 Indonesia (10) 0.3 -0.9 Philippines (18) 0.0 0.0 Middle East - 0.3 - Indonesia (15) 0.0 -0.2 Philippines (16) 0.0 -0.218 Philippines (18) 0.0 0.0 Canada (15) 0.0 -0.2 Philippines (17) 0.0 0.0 Philippines (17) 0.0 0.0 Canada (16) 0.0 -0.219 Canada (14) 0.0 -0.4 Mexico (15) 0.0 -0.2 Canada (14) 0.0 -0.4 Mexico (15) 0.0 -0.2 Middle East - 0.0 -
Note 1: The number of respondents (n) planning to expand their overseas businesses in the future was 399 in the FY 2008 survey and 487 in the FY 2007 survey. Note 2: The Middle East was added beginning from the FY 2008 survey. Therefore there are no figures indicating change from the previous survey or rank.
R&D (primary research) Production (mid to low-end products)
RankRegional HQ Distribution
RankProduction (high-end products)
R&D (new product development,localization)
Production (mid to low-end products,high-end products)
R&D (primary research, new productdevelopment, localization)
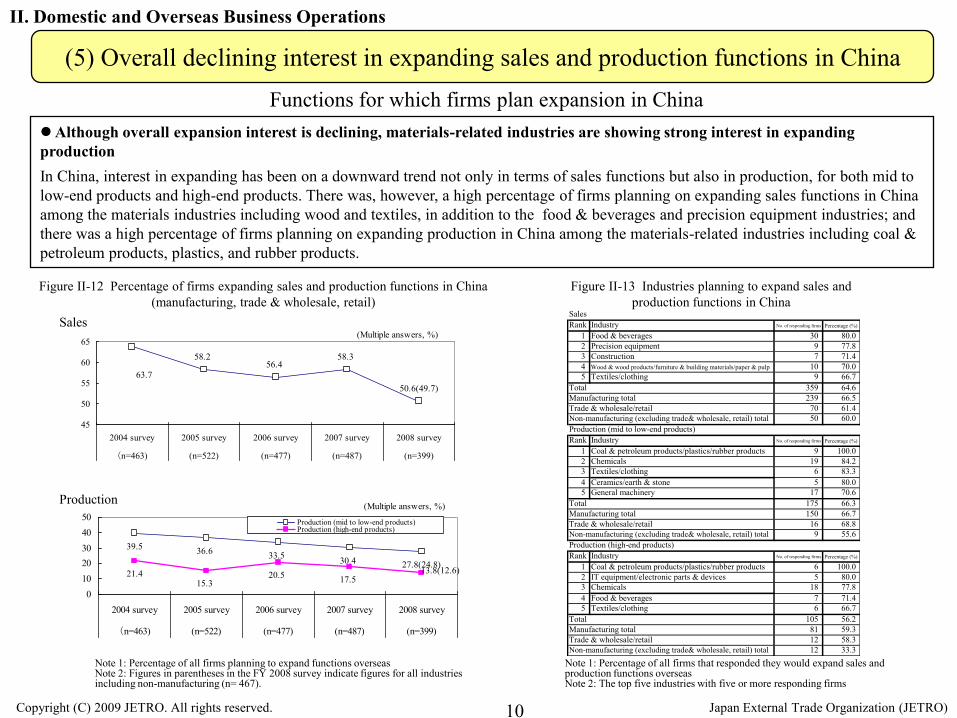
Functions for which firms plan expansion in China Although overall expansion interest is declining, materials-related industries are showing strong interest in expanding productionIn China, interest in expanding has been on a downward trend not only in terms of sales functions but also in production, for both mid to low-end products and high-end products. There was, however, a high percentage of firms planning on expanding sales functions in Chinaamong the materials industries including wood and textiles, in addition to the food & beverages and precision equipment industries; and there was a high percentage of firms planning on expanding production in China among the materials-related industries including coal & petroleum products, plastics, and rubber products.
Figure II-12 Percentage of firms expanding sales and production functions in China (manufacturing, trade & wholesale, retail)
II. Domestic and Overseas Business Operations
10
Note 1: Percentage of all firms that responded they would expand sales and production functions overseas Note 2: The top five industries with five or more responding firms
Figure II-13 Industries planning to expand sales and production functions in China
Note 1: Percentage of all firms planning to expand functions overseas Note 2: Figures in parentheses in the FY 2008 survey indicate figures for all industries including non-manufacturing (n= 467).
Japan External Trade Organization (JETRO)Copyright (C) 2009 JETRO. All rights reserved.
(5) Overall declining interest in expanding sales and production functions in China
58.256.4
58.3
63.750.6(49.7)
45
50
55
60
65
2004 survey 2005 survey 2006 survey 2007 survey 2008 survey
(n=463) (n=522) (n=477) (n=487) (n=399)
(Multiple answers, %)
39.5 36.6 33.5 30.421.4
15.320.5 17.5
27.8(24.8)13.8(12.6)
01020304050
2004 survey 2005 survey 2006 survey 2007 survey 2008 survey
(n=463) (n=522) (n=477) (n=487) (n=399)
Production (mid to low-end products) Production (high-end products)
(Multiple answers, %)
Sales
Production
SalesRank Industry No. of responding firms Percentage (%)
1 Food & beverages 30 80.02 Precision equipment 9 77.83 Construction 7 71.44 Wood & wood products/furniture & building materials/paper & pulp 10 70.05 Textiles/clothing 9 66.7
359 64.6239 66.570 61.450 60.0
Production (mid to low-end products)Rank Industry No. of responding firms Percentage (%)
1 Coal & petroleum products/plastics/rubber products 9 100.02 Chemicals 19 84.23 Textiles/clothing 6 83.34 Ceramics/earth & stone 5 80.05 General machinery 17 70.6
175 66.3150 66.716 68.89 55.6
Production (high-end products)Rank Industry No. of responding firms Percentage (%)
1 Coal & petroleum products/plastics/rubber products 6 100.02 IT equipment/electronic parts & devices 5 80.03 Chemicals 18 77.84 Food & beverages 7 71.45 Textiles/clothing 6 66.7
105 56.281 59.312 58.312 33.3
Non-manufacturing (excluding trade& wholesale, retail) total
TotalManufacturing totalTrade & wholesale/retailNon-manufacturing (excluding trade& wholesale, retail) total
TotalManufacturing totalTrade & wholesale/retailNon-manufacturing (excluding trade& wholesale, retail) total
TotalManufacturing totalTrade & wholesale/retail
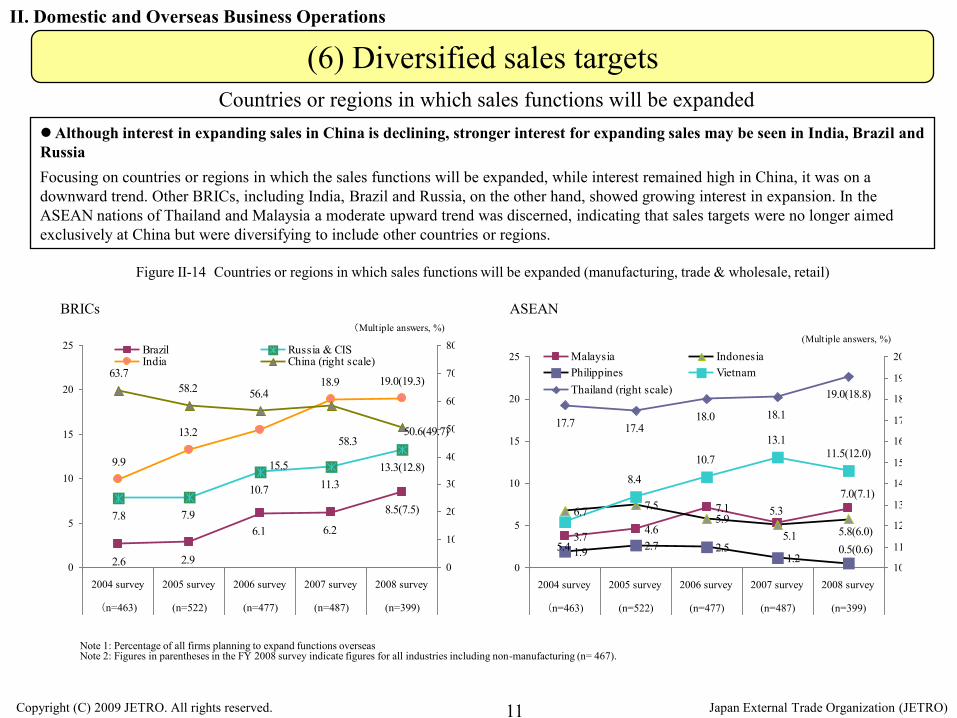
Figure II-14 Countries or regions in which sales functions will be expanded (manufacturing, trade & wholesale, retail)
Although interest in expanding sales in China is declining, stronger interest for expanding sales may be seen in India, Brazil and RussiaFocusing on countries or regions in which the sales functions will be expanded, while interest remained high in China, it was on a downward trend. Other BRICs, including India, Brazil and Russia, on the other hand, showed growing interest in expansion. In theASEAN nations of Thailand and Malaysia a moderate upward trend was discerned, indicating that sales targets were no longer aimedexclusively at China but were diversifying to include other countries or regions.
BRICs
II. Domestic and Overseas Business Operations
Countries or regions in which sales functions will be expanded
11
ASEAN
Note 1: Percentage of all firms planning to expand functions overseas Note 2: Figures in parentheses in the FY 2008 survey indicate figures for all industries including non-manufacturing (n= 467).
Japan External Trade Organization (JETRO)Copyright (C) 2009 JETRO. All rights reserved.
(6) Diversified sales targets
2.6 2.9
6.1 6.27.8 7.9
10.7 11.3
9.9
13.2
18.9
8.5(7.5)
13.3(12.8)15.5
19.0(19.3)63.7
58.2 56.4
58.350.6(49.7)
0
5
10
15
20
25
2004 survey 2005 survey 2006 survey 2007 survey 2008 survey
(n=463) (n=522) (n=477) (n=487) (n=399)
0
10
20
30
40
50
60
70
80Brazil Russia & CISIndia China (right scale)
(Multiple answers, %)
3.7 4.6
7.16.7 7.55.9
1.9 2.7 2.51.2
8.4
10.7
13.1
5.37.0(7.1)
5.1 5.8(6.0)0.5(0.6)5.4
11.5(12.0)
17.7 17.418.0 18.1
19.0(18.8)
0
5
10
15
20
25
2004 survey 2005 survey 2006 survey 2007 survey 2008 survey
(n=463) (n=522) (n=477) (n=487) (n=399)
10
11
12
13
14
15
16
17
18
19
20Malaysia IndonesiaPhilippines VietnamThailand (right scale)
(Multiple answers, %)
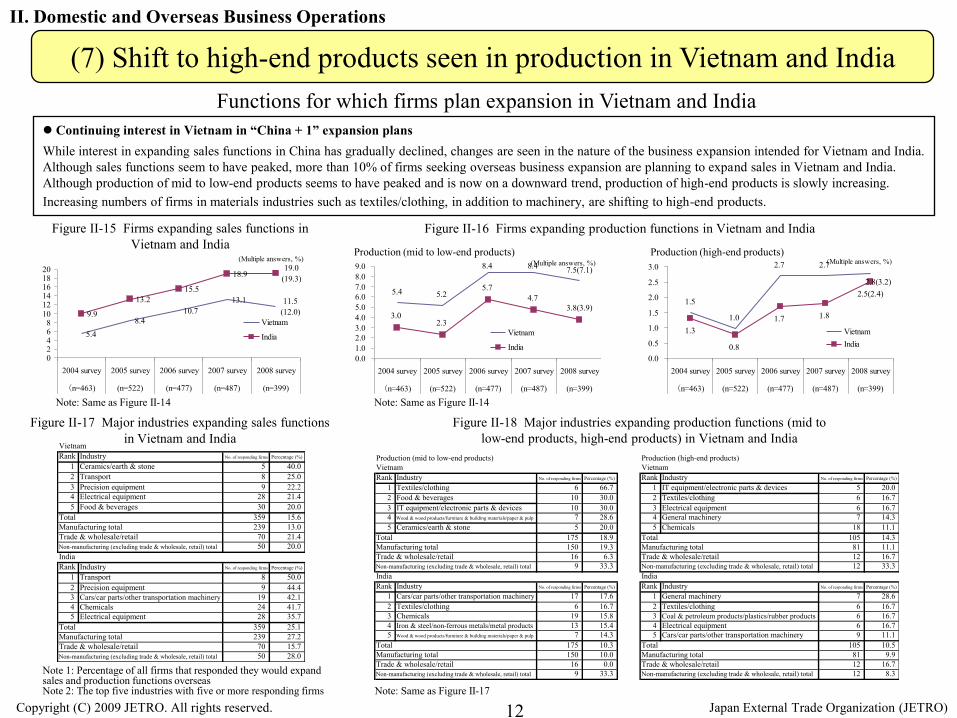
Continuing interest in Vietnam in “China + 1” expansion plans While interest in expanding sales functions in China has gradually declined, changes are seen in the nature of the business expansion intended for Vietnam and India. Although sales functions seem to have peaked, more than 10% of firms seeking overseas business expansion are planning to expand sales in Vietnam and India. Although production of mid to low-end products seems to have peaked and is now on a downward trend, production of high-end products is slowly increasing. Increasing numbers of firms in materials industries such as textiles/clothing, in addition to machinery, are shifting to high-end products.
II. Domestic and Overseas Business Operations
Functions for which firms plan expansion in Vietnam and India
12
Figure II-18 Major industries expanding production functions (mid to low-end products, high-end products) in Vietnam and India
Note 1: Percentage of all firms that responded they would expand sales and production functions overseas Note 2: The top five industries with five or more responding firms Note: Same as Figure II-17
Japan External Trade Organization (JETRO)Copyright (C) 2009 JETRO. All rights reserved.
(7) Shift to high-end products seen in production in Vietnam and India
5.48.4
10.713.1
9.9
13.215.5
18.9
11.5(12.0)
19.0(19.3)
02468
101214161820
2004 survey 2005 survey 2006 survey 2007 survey 2008 survey
(n=463) (n=522) (n=477) (n=487) (n=399)
Vietnam
India
(Multiple answers, %)
5.4 5.2
8.4 8.4
3.02.3
5.74.7
7.5(7.1)
3.8(3.9)
0.01.02.03.04.05.06.07.08.09.0
2004 survey 2005 survey 2006 survey 2007 survey 2008 survey
(n=463) (n=522) (n=477) (n=487) (n=399)
Vietnam
India
(Multiple answers, %)
1.5
1.0
2.7 2.7
1.3
0.8
1.7 1.8
2.8(3.2)2.5(2.4)
0.0
0.5
1.0
1.5
2.0
2.5
3.0
2004 survey 2005 survey 2006 survey 2007 survey 2008 survey
(n=463) (n=522) (n=477) (n=487) (n=399)
VietnamIndia
(Multiple answers, %)
Figure II-16 Firms expanding production functions in Vietnam and India
Production (mid to low-end products) Production (high-end products)
Figure II-15 Firms expanding sales functions in Vietnam and India
Figure II-17 Major industries expanding sales functions in Vietnam and India
Note: Same as Figure II-14 Note: Same as Figure II-14
VietnamRank Industry No. of responding firms Percentage (%)
1 Ceramics/earth & stone 5 40.02 Transport 8 25.03 Precision equipment 9 22.24 Electrical equipment 28 21.45 Food & beverages 30 20.0
359 15.6239 13.070 21.450 20.0
IndiaRank Industry No. of responding firms Percentage (%)
1 Transport 8 50.02 Precision equipment 9 44.43 Cars/car parts/other transportation machinery 19 42.14 Chemicals 24 41.75 Electrical equipment 28 35.7
359 25.1239 27.270 15.750 28.0
TotalManufacturing totalTrade & wholesale/retailNon-manufacturing (excluding trade & wholesale, retail) total
Trade & wholesale/retailNon-manufacturing (excluding trade & wholesale, retail) total
TotalManufacturing total
Production (mid to low-end products) Production (high-end products) Vietnam VietnamRank Industry No. of responding firms Percentage (%) Rank Industry No. of responding firms Percentage (%)
1 Textiles/clothing 6 66.7 1 IT equipment/electronic parts & devices 5 20.02 Food & beverages 10 30.0 2 Textiles/clothing 6 16.73 IT equipment/electronic parts & devices 10 30.0 3 Electrical equipment 6 16.74 Wood & wood products/furniture & building materials/paper & pulp 7 28.6 4 General machinery 7 14.35 Ceramics/earth & stone 5 20.0 5 Chemicals 18 11.1
175 18.9 105 14.3150 19.3 81 11.116 6.3 12 16.79 33.3 12 33.3
India IndiaRank Industry No. of responding firms Percentage (%) Rank Industry No. of responding firms Percentage (%)
1 Cars/car parts/other transportation machinery 17 17.6 1 General machinery 7 28.62 Textiles/clothing 6 16.7 2 Textiles/clothing 6 16.73 Chemicals 19 15.8 3 Coal & petroleum products/plastics/rubber products 6 16.74 Iron & steel/non-ferrous metals/metal products 13 15.4 4 Electrical equipment 6 16.75 Wood & wood products/furniture & building materials/paper & pulp 7 14.3 5 Cars/car parts/other transportation machinery 9 11.1
175 10.3 105 10.5150 10.0 81 9.916 0.0 12 16.79 33.3 12 8.3Non-manufacturing (excluding trade & wholesale, retail) total
TotalManufacturing totalTrade & wholesale/retailNon-manufacturing (excluding trade & wholesale, retail) total
TotalManufacturing totalTrade & wholesale/retailNon-manufacturing (excluding trade & wholesale, retail) total
Trade & wholesale/retail
Trade & wholesale/retail
Non-manufacturing (excluding trade & wholesale, retail) total
Total
TotalManufacturing total
Manufacturing total
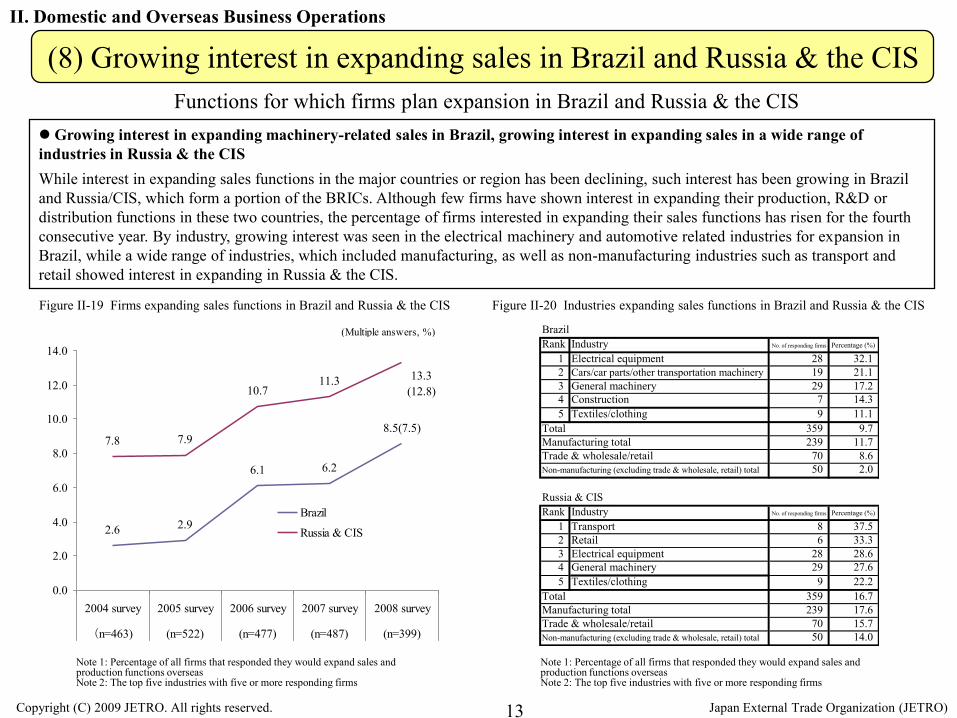
Figure II-19 Firms expanding sales functions in Brazil and Russia & the CIS
Growing interest in expanding machinery-related sales in Brazil, growing interest in expanding sales in a wide range of industries in Russia & the CISWhile interest in expanding sales functions in the major countries or region has been declining, such interest has been growing in Brazil and Russia/CIS, which form a portion of the BRICs. Although few firms have shown interest in expanding their production, R&D or distribution functions in these two countries, the percentage of firms interested in expanding their sales functions has risen for the fourth consecutive year. By industry, growing interest was seen in the electrical machinery and automotive related industries for expansion in Brazil, while a wide range of industries, which included manufacturing, as well as non-manufacturing industries such as transport and retail showed interest in expanding in Russia & the CIS.
Figure II-20 Industries expanding sales functions in Brazil and Russia & the CIS
II. Domestic and Overseas Business Operations
Functions for which firms plan expansion in Brazil and Russia & the CIS
13 Japan External Trade Organization (JETRO)Copyright (C) 2009 JETRO. All rights reserved.
(8) Growing interest in expanding sales in Brazil and Russia & the CIS
Note 1: Percentage of all firms that responded they would expand sales and production functions overseasNote 2: The top five industries with five or more responding firms
2.6 2.9
6.1 6.2
7.8 7.9
10.711.3
8.5(7.5)
13.3(12.8)
0.0
2.0
4.0
6.0
8.0
10.0
12.0
14.0
2004 survey 2005 survey 2006 survey 2007 survey 2008 survey
(n=463) (n=522) (n=477) (n=487) (n=399)
Brazil
Russia & CIS
(Multiple answers, %)
Note 1: Percentage of all firms that responded they would expand sales and production functions overseas Note 2: The top five industries with five or more responding firms
BrazilRank Industry No. of responding firms Percentage (%)
1 Electrical equipment 28 32.12 Cars/car parts/other transportation machinery 19 21.13 General machinery 29 17.24 Construction 7 14.35 Textiles/clothing 9 11.1
359 9.7239 11.770 8.650 2.0
Russia & CISRank Industry No. of responding firms Percentage (%)
1 Transport 8 37.52 Retail 6 33.33 Electrical equipment 28 28.64 General machinery 29 27.65 Textiles/clothing 9 22.2
359 16.7239 17.670 15.750 14.0
Trade & wholesale/retailNon-manufacturing (excluding trade & wholesale, retail) total
TotalManufacturing totalTrade & wholesale/retailNon-manufacturing (excluding trade & wholesale, retail) total
TotalManufacturing total
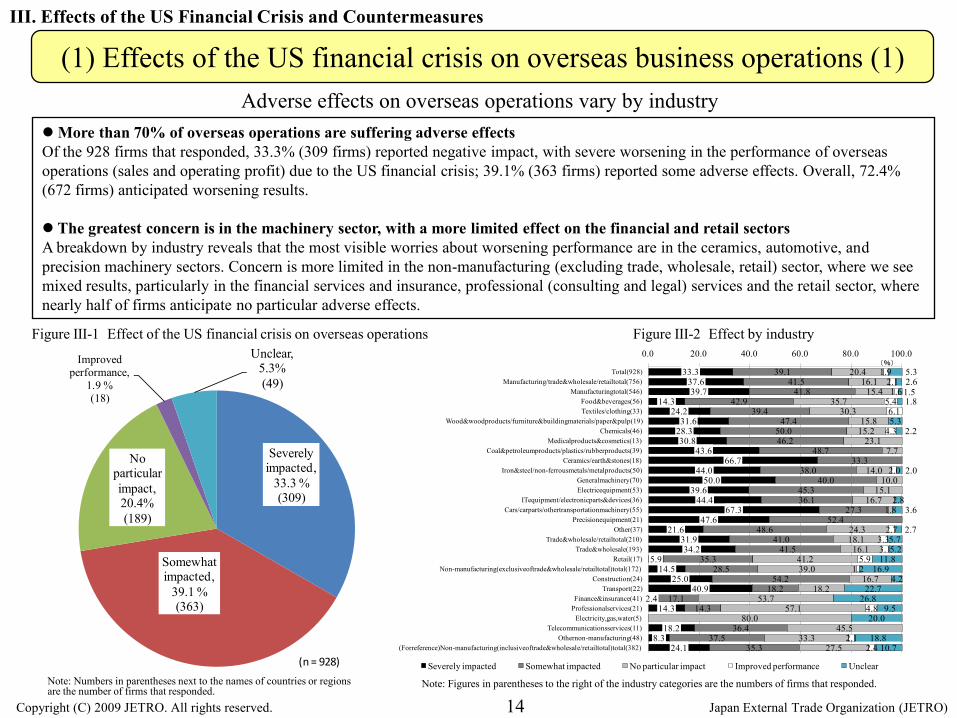
Adverse effects on overseas operations vary by industryMore than 70% of overseas operations are suffering adverse effectsOf the 928 firms that responded, 33.3% (309 firms) reported negative impact, with severe worsening in the performance of overseas operations (sales and operating profit) due to the US financial crisis; 39.1% (363 firms) reported some adverse effects. Overall, 72.4% (672 firms) anticipated worsening results.
The greatest concern is in the machinery sector, with a more limited effect on the financial and retail sectors A breakdown by industry reveals that the most visible worries about worsening performance are in the ceramics, automotive, and precision machinery sectors. Concern is more limited in the non-manufacturing (excluding trade, wholesale, retail) sector, where we see mixed results, particularly in the financial services and insurance, professional (consulting and legal) services and the retail sector, where nearly half of firms anticipate no particular adverse effects.
14Note: Figures in parentheses to the right of the industry categories are the numbers of firms that responded.
Severely impacted,
33.3 % (309)
Somewhat impacted,
39.1 %(363)
No particular impact, 20.4%(189)
Improved performance,
1.9 %(18)
Unclear, 5.3% (49)
(n = 928)
Note: Numbers in parentheses next to the names of countries or regions are the number of firms that responded.
Japan External Trade Organization (JETRO)Copyright (C) 2009 JETRO. All rights reserved.
III. Effects of the US Financial Crisis and Countermeasures
(1) Effects of the US financial crisis on overseas business operations (1)
33.3 37.6 39.7
14.3 24.2
31.6 28.3 30.8
43.6 66.7
44.0 50.0
39.6 44.4
67.3 47.6
21.6 31.9 34.2
5.9 14.5
25.0 40.9
2.4 14.3
18.2 8.3
24.1
39.1 41.5
41.8 42.9
39.4 47.4
50.0 46.2
48.7 33.3
38.0 40.0
45.3 36.1
27.3 52.4
48.6 41.0
41.5 35.3
28.5 54.2
18.2 17.1
14.3
36.4 37.5
35.3
20.4 16.1
15.4 35.7
30.3 15.8
15.2 23.1
7.7
14.0 10.0
15.1 16.7
1.8
24.3 18.1 16.1
41.2 39.0
16.7 18.2
53.7 57.1
80.0 45.5
33.3 27.5
1.9 2.1 1.6
5.4 6.1
4.3
2.0
2.7 3.3 3.1
5.9 1.2
4.8
2.1 2.4
5.3 2.6 1.5 1.8
5.3 2.2
2.0
2.8 3.6
2.7 5.7 5.2
11.8 16.9
4.2 22.7
26.8 9.5
20.0
18.8 10.7
0.0 20.0 40.0 60.0 80.0 100.0
Total(928)Manufacturing/trade&wholesale/retailtotal(756)
Manufacturingtotal(546)Food&beverages(56)Textiles/clothing(33)
Wood&woodproducts/furniture&buildingmaterials/paper&pulp(19)Chemicals(46)
Medicalproducts&cosmetics(13)Coal&petroleumproducts/plastics/rubberproducts(39)
Ceramics/earth&stones(18)Iron&steel/non-ferrousmetals/metalproducts(50)
Generalmachinery(70)Electricequipment(53)
ITequipment/electronicparts&devices(36)Cars/carparts/othertransportationmachinery(55)
Precisionequipment(21)Other(37)
Trade&wholesale/retailtotal(210)Trade&wholesale(193)
Retail(17)Non-manufacturing(exclusiveoftrade&wholesale/retailtotal)total(172)
Construction(24)Transport(22)
Finance&insurance(41)Professionalservices(21)
Electricity,gas,water(5)Telecommunicationsservices(11)
Othernon-manufacturing(48)(Forreference)Non-manufacturing(inclusiveoftrade&wholesale/retailtotal)total(382)
Severely impacted Somewhat impacted No particular impact Improved performance Unclear
(%)
Figure III-1 Effect of the US financial crisis on overseas operations Figure III-2 Effect by industry

69.6 66.0
63.8 58.7
57.5 54.5 54.2 54.0
53.1 53.0
51.6 51.5 50.9
49.1 48.9
48.0 46.7 46.2
43.8 38.2
28.6 30.0
32.8 37.0 39.7
41.8 39.6
36.0 31.3
42.6 39.7
38.1 43.1
43.4 45.2
42.7 45.4
38.7 44.4
42.9
2.0 1.7
2.2 1.4 1.8
4.2 8.0
9.4 2.6
7.6 8.6
5.2 6.9
3.7 7.6 6.6
14.0 10.7
14.8
3.1
0.5 0.4
1.5 0.4 0.7
1.1
1.8
1.8 2.0 1.7 2.2 1.4
1.8 2.1 2.0 3.1 1.7 0.5 1.5 0.9 0.6 0.7
1.3 0.7
1.2 2.2
0.0 20.0 40.0 60.0 80.0 100.0
Central & Eastern Europe(56)Canada(50)Mexico(58)
India(92)Philippines(73)
Brazil(55)Russia & CIS(48)
Middle East(50)Other(32)
Malaysia(115)Western Europe(184)
USA(268)Indonesia(116)
Taiwan(173)Republic of Korea(135)
Thailand(225)Singapore(152)
Vietnam(93)Hong Kong(169)
China(445)
Severely impacted Somewhat impacted No particular impact Improved Unclear
(%)
Concern about adverse effects is strongest in Central and Eastern Europe and the Americas; the impact on Asia is relatively limitedIf we look at the effects of the US financial crisis on overseas business operations by country or region, we find the strongest concern about adverse effects in countries with operations in Central and Eastern Europe. Nearly 70% of firms with operations in these regions express strong concern. If we add those that express some concern, the total rises to almost 100%, reflecting the sudden and severe worsening of these region’s economies. Next in line are Canada and Mexico, where concern on the part of firms linked with theautomotive industry is also becoming stronger. In contrast, firms are less concerned about operations in China, Hong Kong, and Vietnam. For China and Vietnam in particular, nearly 15% of firms report no impact.
15
Effects by country or region
Figure III-3 Impact by the country or region in which firms have bases
Japan External Trade Organization (JETRO)Copyright (C) 2009 JETRO. All rights reserved.
III. Effects of the US Financial Crisis and Countermeasures
(1) Effects of the US financial crisis on overseas business operations (2)
Note 1: Numbers in parentheses next to the names of countries or regions are the number of firms responding. Note 2: Percentage of total firms with operations in the country or region responding to multiple answer questions

77.2
51.2
18.7
16.8
14.3
10.3
7.8
7.2
4.3
1.4
0.9
0.4
2.0
4.8
0.0 20.0 40.0 60.0 80.0
Lower sales due to worsening economy 533
Lower price competitiveness due to strong yen 353
Lower unit prices due to worsening economy 129
Negative impact of credit crunch on trading partners 116
Rising purchase and other costs due to weaker local currency 99
Higher price competitiveness due to weaker local currency 71
Lower costs due to strong yen 54
Lower price competitiveness due to stronger local currency 50
Lower costs due to decline in raw materials costs and commodity market 30
Lower costs due to stronger local currency 10
Negative impact of credit crunch on our company 6
Positive affect of improved credit of our company 3
Other 14
Unclear 33
(Multiple answers, n = 690)
(%)
Worsening performance due to lower demand and rising costs as overseas economies slump Slumping overseas economies and stronger yen affecting performance
• Among the specific answers to multiple answer questions provided by the 690 firms whose performance has been adversely affected by the US financial crisis, an overwhelming majority (80.7%, 557 firms) cite falling demand for products or services. The next most common answer is rising costs (25.7%, 177 firms). In both the manufacturing and non-manufacturing sectors, numerous firms also mention forex losses due to the strengthening of the yen.
• The most frequently cited cause of adverse effects mentioned in response to multiple answer questions was lower sales due to worsening economic conditions in the countries or regions to which the firm exports or in which it does business (77.2%, 533 firms). Next came lower price competitiveness for products or services due to the strengthening of the yen (51.2%, 353 firms) and falling unit prices due to the worsening economy in the country or region in which it is operating (18.7%, 129 firms). Over 10% reported being impacted by the credit crunch because the firms with which they do business are having difficulty securing credit. Most firms cited either worsening economic conditions or the negative effects of exchange rates. Some importers did, however, benefit from the stronger yen.
16
Figure III-4 Specific effects Figure III-5 Specific causes
Note: Figures in parentheses are the numbers of firms that responded.Note: Figures in parentheses are the numbers of firms that responded.
80.7
25.7
2.6
1.0
8.6
1.4
0.0 10.0 20.0 30.0 40.0 50.0 60.0 70.0 80.0 90.0
Demand for its products or services fell (557)
Costs rose (177)
Costs fell (18)
Demand for its products or services rose (7)
Other (59)
Unclear (10) (Multiple answers, n = 690)
(%)
Japan External Trade Organization (JETRO)Copyright (C) 2009 JETRO. All rights reserved.
III. Effects of the US Financial Crisis and Countermeasures
(2) Specific effects and causes

Japanese firms are strengthening and expanding overseas operations Steps are clearly being taken to strengthen and expand overseas operations despite severe economic conditions
• When asked how they are responding to the effects of the crisis (multiple answers, including steps being considered), many firms replied that they are reinforcing their overseas operations, either expanding existing overseas operations (23.0%, 159 firms) or initiating new ones (22.8%, 157 firms). Fewer are halting or delaying development of overseas business (14.9%, 103 firms) or shrinking the scale of their overseas operations (9.1%, 63 firms). Just over 10% reported that they are cutting the workforce in their overseas divisions. Of the 467 firms planning to expand their overseas operations in the next 3 years or so, 76.9% (359 firms) are expanding sales operations, taking vigorous steps to develop overseas markets despite the economic crisis.
• If we look at overseas business development plans broken down by industry, we find that firms planning to strengthen overseas operations span a wide range that includes telecommunications services, trade and wholesale, logistics, professional services, finance and insurance, as well as electric equipment, food and beverage, and pharmaceuticals and cosmetics. Sectors in which moves to shrink overseas operations are growing stronger include construction, cars/car parts/other transportation, and retail.
17Note: Figures in parentheses are the numbers of firms that responded.
23.0
22.8
14.9
14.9
10.4
9.1
8.8
8.1
7.5
6.1
4.9
4.2
2.9
2.0
1.3
7.5
11.0
0.0 5.0 10.0 15.0 20.0 25.0
Expand existing overseas operations (159)
Start new overseas operations(157)
Suspend or delay new overseas operations (103)
Lower export prices(103)
Unclear(76)
Cut staff at overseas operations(72)
Shrink overseas operations(63)
Raise export prices(61)
Cut export volume(56)
Change site of overseas operations(52)
Other(52)
Increase import volume(42)
Increase export volume(34)
Change overseas suppliers(29)
Cut import volume(20)
Buy overseas firms in same industry(14)
Change overseas customers(9)
(Multiple answers, n = 690)
(%)-15
-15
-17
-9
-9
-7
-21
0
-11
-22
-17
-18
-9
-24
-35
-24
-11
-8
-7
-25
-17
-37
-15
0
-14
-17
-9
-11
-9
-9
-8
-6
-13
-7
-3
-10
-17
-11
-12
-8
0
-10
-8
-19
-4
-9
-9
-25
-13
-16
-23
-13
-14
-17
-4
-11
23
23
20
14
22
13
29
30
19
17
21
13
24
17
14
29
26
31
32
13
24
16
15
13
29
33
35
29
23
23
25
40
13
27
26
20
8
22
31
14
38
45
12
33
37
16
16
25
21
39
13
14
50
22
19
-60 -40 -20 0 20 40 60 80 100
All respondents (690)Manufacturing/trade & wholesale/retail total (614)
Manufacturing total (454) Food & beverages (35) Textiles/clothing (23)
Wood & wood products/furniture & building materials/paper & pulp (15) Chemicals (38)
Medical products & cosmetics (10) Coal & petroleum products/plastics/rubber products (36)
Ceramics/earth & stones (18) Iron & steel/non-ferrous metals/metal products (42)
General machinery(63) Electrical equipment (45)
IT equipment/electronic parts & devices (29) Cars/car parts/other transportation machinery (52)
Precision equipment (21) Other manufacturing (27)
Trade & wholesale/retail total(160) Trade & wholesale (152)
Retail (8)Non-manufacturing (exclusive of trade & wholesale/retail total) total (76)
Construction (19) Transport (13)
Finance & insurance (8) Professional services (7)
Telecommunications services (6) Other nonmanufacturing (23)
(For reference) Non-manufacturing (inclusive of trade & wholesale/retail total) totals (236)
Suspend or delay new overseas operations Shrink overseas operationsStart new overseas operations Expand existing overseas operations
(%)
(Multiple answers, n = 690)
Japan External Trade Organization (JETRO)Copyright (C) 2009 JETRO. All rights reserved.
III. Effects of the US Financial Crisis and Countermeasures
(3) Countermeasures
Note 1: Figures in parentheses are the numbers of firms that responded.Note 2: Percentages of firms that responded they would “suspend or delay new overseas operations” and “shrink overseas operations” are shown as negative figures.
Figure III-6 Steps taken after financial crisis Figure III-7 Future directions for overseas business development (by industry)

Some see the crisis lasting between one and two years Review costs, production and employment systemsMany of the free answers concerning future steps mention increasing overseas procurement to lower costs. Other common answers include rethinking or reducing production or reducing working hours or workforce both inside and outside Japan. In contrast, in addition to several replies that mention expanding export markets (developing new business) or developing new products, there are also a scattering of firms that plan to focus on domestic business.
Most firms expect the effects of the crisis to last between one and two years; but in some industries there are those who expect the effects to last longerAmong the 690 firms affected by the financial crisis, the largest proportion (47.7%, 329 firms) expect its effects to last between one and two years. Next are those that expect the effects to last between six months and a year (28.7%, 198 firms) or more than two years (13.6%, 94 firms). Only 3.3% (23 firms) expect the crisis to last less than six months. In the construction and automotive sectors, however, 31.6% (6 of 19 firms) , 23.1% (12 of 52 firms) anticipate effects lasting more than two years respectively.
18
Figure III-9 Expected duration of the crisisFigure III-8 Steps in response to the crisis (free answers)
3.3
28.7
47.7
13.6
6.7
3.5
29.1
48.2
13.9
5.3 3.8
17.3
51.9
23.1
3.8 3.8
31.9
48.8
10.6
5.0
1.3
19.7
42.1
18.4 18.4
0.0
5.3
42.1
31.6
21.1
0.0
10.0
20.0
30.0
40.0
50.0
60.0
About 5 months 6 months - 1 year 1-2 years Over 2 years Unclear
All respondents (690)Manufacturing (total) (454)Cars/car parts/other transportation machinery (52) Trade & wholesale/retail (total) (160)
(%)
(n= 690)
Cut costs, expand overseas sourcing ・ Cut costs, delay or change price reduction plans(Food & Beverages, Plastics, Iron & Steel, Transport, etc.)
・ Begin procurement overseas or raise local purchasing ratio (or consider doing so)(Electrical equipment, precision equipment, trading, wholesaling, etc.)
Review production system and employment ・Review and revise production system(Textiles, general machinery, etc.)
・ Alter schedule for planned overseas expansion (rubber products, etc.) ・ Review and revise employment system
Develop new markets and products ・ Develop new customers(Medical products & cosmetics, plastics, general machinery,trading, wholesaling, etc.)
・ Develop new products (plastics)
Other ・ Stay as is (plastics, car parts, professional services, etc.) ・ Upgrade information gathering (or consider doing so) ・ No clear countermeasures ・ Reinforce domestic operations (general machinery, trading, wholesaling, etc.) ・Overhaul risk management (construction) ・ Reinforce support for financing, reinforcing capacity to provide information
and make proposals (finance) ・ Upgrade training at agencies (trading and wholesaling)
Japan External Trade Organization (JETRO)Copyright (C) 2009 JETRO. All rights reserved.
III. Effects of the US Financial Crisis and Countermeasures
(4) Duration of the crisis
Note: Figures in parentheses are the numbers of firms that responded.

19
Plans for future business development in China and plan details Drastic drop in firms planning to expand existing operations or start new businessesWhen asked about business development in China over the next 3 years or so, including trade, direct investment, outsourcing and technical tie-ups, firms in the manufacturing, trade & wholesale, and retail industries, planning to expand existing operations or start new businesses declined by 12.9 percentage points (to 50.1%), marking the lowest percentage in the 5 years that this survey has been conducted. By contrast, those planning to maintain their current scale of operations rose 10.7 percentage points, while the percentage of those planning to scale down their existing operations or close business, rose, although marginally, by 1.5 percentage points. Further decreasing trend seen in firms planning to expand or establish production bases in ChinaAmong the 379 firms planning to expand existing operations or start new businesses in China, those planning to increase imports dropped 11.3 percentage points to 41.7% and those planning to establish or expand production bases dropped 8.6 percentage points to 24.5%, which are indications of a general decreasing trend and provide further proof that interest in expanding business in China is waning overall.
Figure IV-1 Business plans for China (all industries) Figure IV-2 Details of business expansion plans for China (all industries)
IV. Business Development in China
Figure IV-1 Business plans for China (manufacturing, trade & wholesale, retail)
Figure IV-2 Details of business expansion plans for China(manufacturing, trade & wholesale, retail)
Japan External Trade Organization (JETRO)
(1) Slowdown in the expansion trend and more firms maintaining the status quo
Copyright (C) 2009 JETRO. All rights reserved.
Establish or expandoperations 47.2% (438)
Maintain current scale30.7% (285)
Scale down or closebusiness 3.2% (30)
No operations planned inChina 14.5% (135)
No answer 4.4% (40)
0% 20% 40% 60% 80% 100%
39.732.6
22.816.4
8.2 4.8
01020304050
Increase exports Establish or expand salesbase
Establish or expandproduction base
Increase imports Outsourcing Technical tie-ups
(%)
3.7
6.1
17.2
24.5
30.1
41.7
6.9
6.9
23.6
33.1
37.9
53.0
6.5
10.3
30.5
34.9
39.5
50.2
5.0
11.5
32.9
39.9
44.4
54.3
8.9
9.3
38.3
39.8
46.2
60.8
0 10 20 30 40 50 60 70
Technical tie-ups
Outsourcing
Increase imports
Establish or expandproduction base
Establish or expandsales base
Increase exports
2008 survey (n=379) 2007 survey (n=462) 2006 survey (n=478)2005 survey (n=556) 2004 survey (n=548)
(Multiple answers, %)
50.1
63.0
65.6
69.8
76.8
33.1
22.4
18.2
17.8
12.2
3.4
1.9
1.5
0.9
0.1
11.2
9.8
11.1
8.0
7.1
2.1
2.9
3.6
3.4
3.8
0% 10% 20% 30% 40% 50% 60% 70% 80% 90% 100%
2008 survey(n=756)
2007 survey(n=733)
2006 survey(n=729)
2005 survey(n=796)
2004 survey(n=714)
Establish or expand operations Maintain current scale
Scale down or close business No operations planned in China
No answer

4.9
4.2
14.3
9.1
17.4
15.1
16.7
9.5
16.1
21.6
9.1
29.4
28.6
27.5
15.8
26.0
24.2
54.5
25.6
25.0
44.4
7.3
20.0
16.7
23.8
31.8
23.9
30.2
29.2
38.1
32.1
27.0
41.8
23.5
31.4
35.2
47.4
38.0
42.4
18.2
48.7
50.0
38.9
61.5
14.6
20.0
25.0
19.0
31.8
39.1
34.0
4.2
33.3
21.4
21.6
20.0
17.6
24.3
15.5
10.5
14.0
12.1
12.8
11.1
16.7
23.1
4.9
10.4
14.3
4.5
6.5
7.5
4.2
8.9
8.1
10.9
5.9
2.9
2.6
5.3
8.0
6.1
5.1
15.4
68.3
60.0
43.8
28.6
22.7
13.0
13.2
45.8
19.0
21.4
21.6
18.2
23.5
12.9
19.2
21.1
14.0
15.2
27.3
7.7
13.9
0% 20% 40% 60% 80% 100%
Medical products & cosmetics (13)
Finance & insurance (41)
Electricity, gas and water (5)
Other nonmanufacturing (48)
Professional services (21)
Transport (22)
Chemicals (46)
Electrical equipment (53)
Construction (24)
Precision equipment (21)
Food & beverages (56)
Other manufacturing (37)
Cars/car parts/other transportation machinery (55)
Retail (17)
General machinery (70)
Trade & wholesale (193)
Wood & wood products/furniture and building …
Iron & steel/non-ferrous metals/metal products (50)
Textiles/clothing (33)
Telecommunications services (11)
Coal & petroleum products/plastics/rubber products (39)
IT equipment/electronic parts & devices (36)
Ceramics/earth & stone (18)
Depressed demand Temporary adjustment Slower but steady growth Continued strong growth No answer
20
Changes in demand for products and services since the end of the Beijing Olympics 22.4% replied with “depressed demand” after the Olympics Compared with the demand outlook anticipated for their firms’ products and services after the Beijing Olympics, which was expressed in the survey held before the Olympics (November–December, 2007), a market slowdown in demand is becoming evident. Firms in the manufacturing, trade & wholesale, and retail industries replying with “demand will continue to grow at a high level” and “demand will continue to grow, but at a slower pace” only added up to 26.2%, which is roughly half of those voicing similar outlooks prior to the Olympics (55.5%). By contrast, those replying “temporary adjustments are in the offing” and “depressed demand” totaled 57.6%, representing a two-fold increase compared to the pre-Olympics outlook (28.2%). In particular, replies pointing out depressed demand rose dramatically to 22.4%.
By industry, the ceramics/earth & stone and the telecommunication services industries expressed harsh outlooksFirms in the ceramics/earth & stone industry voicing a pessimistic outlook of either “depressed demand” or “temporary adjustments” totaled 83.3%, indicating that the downturn in business confidence, which had been anticipated to follow after the construction demand from the Olympics had come full circle was becoming a reality. Replies expressing “depressed demand” were the most numerous in the telecommunications services industry with 54.5%, followed by the retail industry (29.4%), general machinery (28.6%) and trade & wholesale (27.5%). In terms of industries expressing both “depressed demand” and “temporary adjustments,” the IT equipment/electronic parts & devices industry was also noteworthy with a total of 75.0% of such replies, followed by the coal & petroleum products/plastics/rubber products industry with 74.3%, all of which were indications that the lackluster domestic demand in China was impacting a wide range of industries.
Japan External Trade Organization (JETRO)Copyright (C) 2009 JETRO. All rights reserved.
IV. Business Development in China
(2) Marked slowdown in demand in the domestic market after the Olympics
Continued stronggrowth 5.7% (53)
Slower but steadygrowth 20.3% (188)
Temporaryadjustment 32.2%
(299)
Depressed demand20.3% (188)
No answer 21.6% (200)
0% 10% 20% 30% 40% 50% 60% 70% 80% 90% 100%
5.4
17.2
20.8
38.3
35.2
25.2 16.2
22.4
3.0
16.3
0% 10% 20% 30% 40% 50% 60% 70% 80% 90% 100%
2008 survey(n=756)
2007 survey(n=733)
Continued strong growth Slower but steady growthTemporary adjustment Depressed demand
No answer
Figure IV-3 Change in demand after the Beijing Olympics (all industries) Figure IV-4 Change in demand after the Beijing Olympics (by industry) (number of firms in parentheses)
Figure IV-3 Change in demand after the Beijing Olympics (manufacturing, trade & wholesale, retail)
Note: In descending order of the total percentage of the firms expressing “depressed demand” and “temporary adjustments”
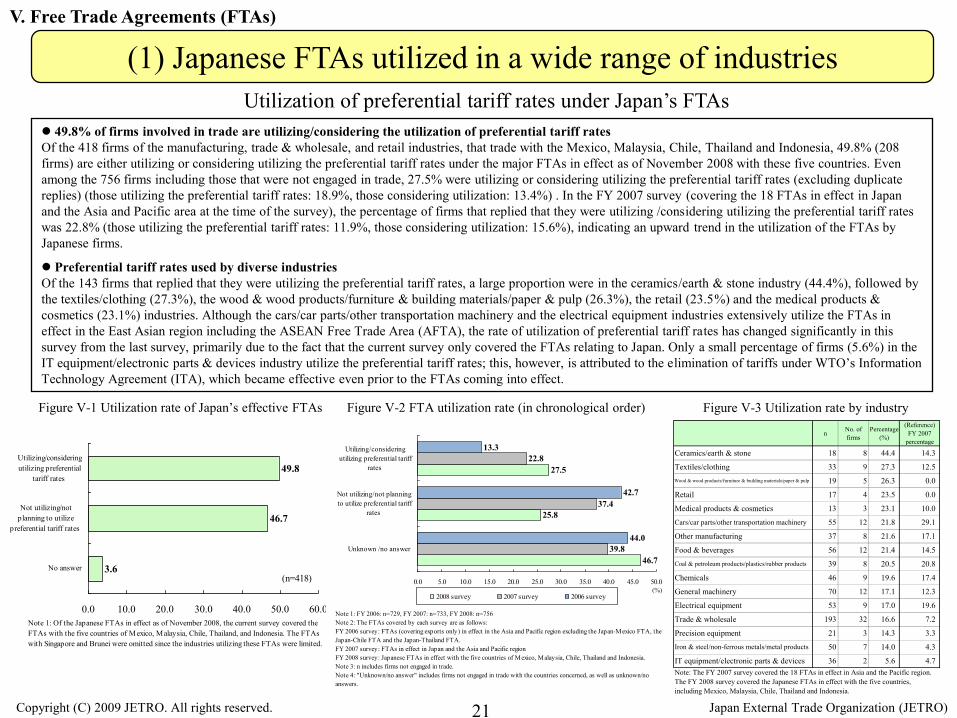
Utilization of preferential tariff rates under Japan’s FTAs 49.8% of firms involved in trade are utilizing/considering the utilization of preferential tariff ratesOf the 418 firms of the manufacturing, trade & wholesale, and retail industries, that trade with the Mexico, Malaysia, Chile, Thailand and Indonesia, 49.8% (208 firms) are either utilizing or considering utilizing the preferential tariff rates under the major FTAs in effect as of November 2008 with these five countries. Even among the 756 firms including those that were not engaged in trade, 27.5% were utilizing or considering utilizing the preferential tariff rates (excluding duplicate replies) (those utilizing the preferential tariff rates: 18.9%, those considering utilization: 13.4%) . In the FY 2007 survey (covering the 18 FTAs in effect in Japan and the Asia and Pacific area at the time of the survey), the percentage of firms that replied that they were utilizing /considering utilizing the preferential tariff rates was 22.8% (those utilizing the preferential tariff rates: 11.9%, those considering utilization: 15.6%), indicating an upward trend in the utilization of the FTAs by Japanese firms.
Preferential tariff rates used by diverse industriesOf the 143 firms that replied that they were utilizing the preferential tariff rates, a large proportion were in the ceramics/earth & stone industry (44.4%), followed by the textiles/clothing (27.3%), the wood & wood products/furniture & building materials/paper & pulp (26.3%), the retail (23.5%) and the medical products & cosmetics (23.1%) industries. Although the cars/car parts/other transportation machinery and the electrical equipment industries extensively utilize the FTAs in effect in the East Asian region including the ASEAN Free Trade Area (AFTA), the rate of utilization of preferential tariff rates has changed significantly in this survey from the last survey, primarily due to the fact that the current survey only covered the FTAs relating to Japan. Only a small percentage of firms (5.6%) in the IT equipment/electronic parts & devices industry utilize the preferential tariff rates; this, however, is attributed to the elimination of tariffs under WTO’s Information Technology Agreement (ITA), which became effective even prior to the FTAs coming into effect.
Figure V-1 Utilization rate of Japan’s effective FTAs Figure V-3 Utilization rate by industry
V. Free Trade Agreements (FTAs)
Figure V-2 FTA utilization rate (in chronological order)
Japan External Trade Organization (JETRO)Copyright (C) 2009 JETRO. All rights reserved.
(1) Japanese FTAs utilized in a wide range of industries
3.6
46.7
49.8
0.0 10.0 20.0 30.0 40.0 50.0 60.0
No answer
Not utilizing/notplanning to utilize
preferential tariff rates
Utilizing/consideringutilizing preferential
tariff rates
(n=418)
Note 1: Of the Japanese FTAs in effect as of November 2008, the current survey covered theFTAs with the five countries of Mexico, Malaysia, Chile, Thailand, and Indonesia. The FTAswith Singapore and Brunei were omitted since the industries utilizing these FTAs were limited.
21
n No. offirms
Percentage(%)
(Reference)FY 2007
percentage
Ceramics/earth & stone 18 8 44.4 14.3
Textiles/clothing 33 9 27.3 12.5Wood & wood products/furniture & building materials/paper & pulp 19 5 26.3 0.0
Retail 17 4 23.5 0.0
Medical products & cosmetics 13 3 23.1 10.0
Cars/car parts/other transportation machinery 55 12 21.8 29.1
Other manufacturing 37 8 21.6 17.1
Food & beverages 56 12 21.4 14.5Coal & petroleum products/plastics/rubber products 39 8 20.5 20.8
Chemicals 46 9 19.6 17.4
General machinery 70 12 17.1 12.3
Electrical equipment 53 9 17.0 19.6
Trade & wholesale 193 32 16.6 7.2
Precision equipment 21 3 14.3 3.3
Iron & steel/non-ferrous metals/metal products 50 7 14.0 4.3
IT equipment/electronic parts & devices 36 2 5.6 4.7Note: The FY 2007 survey covered the 18 FTAs in effect in Asia and the Pacific region.The FY 2008 survey covered the Japanese FTAs in effect with the five countries,including Mexico, Malaysia, Chile, Thailand and Indonesia.
46.7
25.8
27.5
39.8
37.4
22.8
44.0
42.7
13.3
0.0 5.0 10.0 15.0 20.0 25.0 30.0 35.0 40.0 45.0 50.0
Unknown /no answer
Not utilizing/not planningto utilize preferential tariff
rates
Utilizing/consideringutilizing preferential tariff
rates
2008 survey 2007 survey 2006 survey
Note 1: FY 2006: n=729, FY 2007: n=733, FY 2008: n=756Note 2: The FTAs covered by each survey are as follows:FY 2006 survey: FTAs (covering exports only) in effect in the Asia and Pacific region excluding the Japan-Mexico FTA, theJapan-Chile FTA and the Japan-Thailand FTA.FY 2007 survey: FTAs in effect in Japan and the Asia and Pacific regionFY 2008 survey: Japanese FTAs in effect with the five countries of Mexico, Malaysia, Chile, Thailand and Indonesia.Note 3: n includes firms not engaged in trade.Note 4: "Unknown/no answer" includes firms not engaged in trade with the countries concerned, as well as unknown/noanswers.
(%)

22
Status of utilization/consideration of utilization of each FTA The Japan-Thailand FTA is used by the greatest number of firms; the Japan-Chile FTA has the highest utilization rateFocusing on the utilization status of each FTA by export and import, the utilization rate of FTAs by exporting firms was highest for the Japan-Mexico FTA (37 out of 101 firms or 36.6%), followed by the Japan-Chile FTA (20 out of 57 firms or 35.1%). If firms considering the utilization of FTAs were included, approximately 50% of exporting firms were utilizing or considering utilizing the Japan-Chile, Japan-Mexico and Japan-Thailand FTAs. In terms of the FTA utilization rate of importing firms, the Japan-Chile FTA was the highest with 47.1% (8 out of 17 firms). The utilization rate of the Japan-Thailand FTA was also high at 38.7% (41 out of 106 firms) and if firms considering the utilization of FTAs were included, the percentage of firms utilizing or considering utilizing the Japan-Thailand FTA rose to 59.4%. In terms of the totals for the five FTAs covered by the current survey, 45.2% of exporters and 49.4% of importers replied that they were utilizing/considering utilizing the FTAs (excluding duplicate replies). The utilization rates of each FTA by import/export and by industry show that in terms of exports, FTAs are being extensively used primarily by manufacturers such as machinery manufacturers, while in terms of imports, FTA utilization seems to be concentrated in the specific industries of trade & wholesale, retail, chemicals, textiles/clothing and food & beverages, among others.
Two-thirds of firms engaged in trade say that they would consider using FTAs if the difference in tariff rates were less than 7% For most firms (26.0%) a difference in the tariff rate of 3–5% would convince them in favor of utilizing FTAs, followed by those considering a 5–7% difference to be the deciding factor (19.2%). Overall, 66.3% of the firms replied that they would utilize the FTAs for a difference of less than 7%. The margin of preference for deciding in favor of utilizing the FTA, which was derived using the weighted average of each reply, was 4.8%.
Japan External Trade Organization (JETRO)Copyright (C) 2009 JETRO. All rights reserved.
V. Free Trade Agreements (FTAs)
(2) Increasing FTA utilization in both imports and exports
35.1 36.625.3
17.1 17.2
17.5 12.923.1
23.5 19.7
0.0
10.0
20.0
30.0
40.0
50.0
60.0
Chilen=57
Mexicon=101
Thailandn=277
Indonesian=217
Malaysian=203
Utilizing FTA Considering utilizing FTA
(%)
47.1 38.7 30.7 30.4 26.9
17.620.8
24.0 21.715.4
0.0
10.0
20.0
30.0
40.0
50.0
60.0
70.0
Chilen=17
Thailandn=106
Indonesian=75
Mexicon=23
Malaysian=52
Utilizing FTA Considering utilizing FTA
(%)
Figure V-5 FTAs (preferential tariff rates) used by importers
Figure V-7 Margin of preference that would be decisive in utilizing preferential tariff rates
Figure V-6 Industries with high utilization rates of FTAs in imports/exports
Figure V-4 FTAs (preferential tariff rates) used by exporters
No answer(18.8%)
Over 10%(10.1%)
9% to less than10% (3.4%)
7% to less than9% (1.4%) 5% to less than
7% (19.2%)
3% to less than5% (26.0%)
1% to less than3% (10.6%)
Less than 1%(10.6%)
(n=208)
Rank Rank Rank Rank Rank1 Precision equipment (2) 100.0 1 Textiles/clothing (4) 100.0 1 Textiles/clothing (4) 100.0 1 Textiles/clothing (5) 40.0 1 Ceramics/earth & stone (8) 50.02 General machinery (10) 50.0 2 Coal & petroleum products/plastics/rubber products (5) 80.0 2 Food & beverages (15) 40.0 2 Coal & petroleum products/plastics/rubber products (10) 30.0 2 Cars/car parts/other transportation machinery (20) 30.03 Electrical equipment (11) 36.4 3 Trade & wholesale (14) 42.9 3 Trade & wholesale (57) 35.1 3 Chemicals (14) 28.6 3 Coal & petroleum products/plastics/rubber products (9) 22.24 Cars/car parts/other transportation machinery (6) 33.3 4 Cars/car parts/other transportation machinery (15) 40.0 4 Coal & petroleum products/plastics/rubber products (15) 33.3 4 Trade & wholesale (42) 23.8 4 Precision equipment (10) 20.05 Trade & wholesale (6) 30.0 5 General machinery (14), Electrical equipment (14) 28.6 4 Wood & wood products/furniture & building materials/paper & pulp (6) 33.3 5 Ceramics/earth & stone (12) 16.7 5 Trade & wholesale (41) 19.5
Rank Rank Rank Rank Rank1 Trade & wholesale (9) 55.6 1 Electrical equipment (2) 100.0 1 Textiles/clothing (3) 100.0 1 Textiles/clothing (4) 100.0 1 Chemicals (3) 66.72 - - 2 - - 2 Chemicals (3) 66.7 2 Chemicals (4) 75.0 2 Retail (3) 66.73 - - 3 - - 3 Retail (5) 60.0 3 Retail (5) 60.0 3 Trade & wholesale (17) 42.94 - - 4 - - 4 Food & beverages (12) 50.0 4 Trade & wholesale (21) 33.3 4 - -5 - - 5 - - 5 Trade & wholesale (26) 42.3 5 - - 5 - -
Note: n indicates the number of exporting companies or importing companies. Numbers in parentheses indicate the number of companies within each industry. Cases have been omitted where only one company within theindustry concerned is utilizing the FTA, since the company may be identified.
Japan-Indonesia (n=217)
Japan-Indonesia (n=75)
Japan-Malaysia (n=203)
Japan-Malaysia (n=52)
Japan Thailand (n=277)
Japan-Thailand (n=106)
Japan-Mexico (n=101)
Japan-Mexico (n=23)
Expo
rtIm
port
Japan-Chile (n=57)
Japan-Chile (n=17)

23
Business environment of major Asian countries (by risk) High forex risk responses rising in almost all countriesConsiderable changes have taken place from the previous survey in the rankings of major Asian countries (China, Thailand, Indonesia, Malaysia, Philippines, Singapore, Vietnam and India) cited for high forex risk. The percentage of firms reporting high forex risk as a risk factor for doing business in Indonesia nearly doubled from the previous year by rising 16.5 percentage points to 32.0%. Similar dramatic rises were also seen in Thailand (23.7%), Vietnam (20.4%) and India (19.2%). This is mainly attributable to the concerns over the credibility of the currencies of the emerging countries since the financial crisis. China, on the other hand, was the only country among the eight nations whose response rate to this item declined from the previous year.
Signs of improvements in India and Vietnam in terms of “lack of clustering or development of related industries,” recognition of improvements in China’s infrastructureUnder the item “lack of clustering or development of related industries,” Vietnam showed improvement by going down 6.3 percentage points to 26.2% and India by 1.9 percentage points to 16.4, compared to the previous year. Although their relative rankings remain high, Vietnam and India are being recognized as somewhat improving the development of their supporting industries. Responses citing China’s “inadequate infrastructure” have also been decreasing (FY 2006: 21.6% → FY 2007: 19.1% → FY 2008: 16.6%), which may be attributable to the accelerated construction of infrastructure precipitated by the Olympics and the World Expos.
Figure VI-1 Risks or issues in doing business in major Asian countries (manufacturing, trade & wholesale, retail)
VI. Asian Business Environment
Japan External Trade Organization (JETRO)Copyright (C) 2009 JETRO. All rights reserved.
(1) Overall growing concern over foreign exchange risks
(Multiple answers, %)
FY 2008 FY 2007 FY 2006 FY 2008 FY 2007 FY 2006 FY 2008 FY 2007 FY 2006 FY 2008 FY 2007 FY 2006
1 (3) Indonesia 32.0 15.5 23.5 (1) India 56.4 53.5 57.2 (1) China 55.3 54.0 59.9 (1) Vietnam 26.2 32.5 31.42 (2) Thailand 23.7 19.5 9.1 (2) Vietnam 55.8 50.3 47.9 (2) Vietnam 31.9 27.4 32.2 (3) Philippines 18.1 17.5 20.93 (6) Vietnam 20.4 6.8 8.5 (4) Indonesia 28.4 23.9 29.8 (4) India 28.4 19.0 35.3 (2) India 16.4 18.3 18.44 (4) India 19.2 8.4 6.5 (3) Philippines 26.9 25.3 32.2 (3) Indonesia 20.9 22.7 28.2 (4) Indonesia 11.5 13.3 15.15 (1) China 17.1 22.8 20.5 (5) China 16.6 19.1 21.6 (5) Philippines 14.5 9.8 13.0 (5) Malaysia 8.3 9.5 12.76 (7) Malaysia 13.3 4.5 5.3 (6) Thailand 9.0 8.4 7.4 (6) Thailand 9.0 9.6 5.9 (6) Thailand 8.2 7.4 6.27 (5) Philippines 12.4 7.2 7.9 (7) Malaysia 5.7 7.6 7.8 (7) Malaysia 7.2 3.4 6.5 (7) China 4.2 4.3 4.78 (8) Singapore 8.5 4.5 3.3 (8) Singapore 2.2 1.4 0.0 (8) Singapore 1.5 1.4 0.0 (8) Singapore 3.3 3.5 3.7
FY 2008 FY 2007 FY 2006 FY 2008 FY 2007 FY 2006 FY 2008 FY 2007 FY 2006 FY 2008 FY 2007 FY 2006
1 (1) China 56.8 53.9 59.2 (1) China 43.4 41.3 28.4 (1) China 29.4 28.9 33.2 (1) China 32.3 29.9 -2 (3) India 14.4 10.3 13.9 (2) Singapore 32.8 33.9 39.3 (2) India 19.6 12.5 17.9 (2) India 18.8 15.8 -3 (2) Vietnam 10.0 12.0 11.9 (3) Thailand 18.4 15.7 20.4 (4) Indonesia 10.4 8.0 15.5 (4) Vietnam 15.8 8.9 -4 (4) Philippines 7.8 9.8 9.0 (5) Vietnam 16.2 8.6 5.1 (3) Vietnam 10.0 8.2 10.2 (3) Indonesia 11.9 9.1 -5 (5) Indonesia 6.5 8.0 9.2 (4) Malaysia 13.6 14.0 13.9 (8) Philippines 7.8 1.0 7.3 (7) Malaysia 7.6 4.5 -6 (6) Thailand 6.4 6.1 6.2 (6) India 10.4 7.3 3.5 (5) Thailand 6.4 6.6 7.6 (5) Philippines 6.7 5.7 -7 (7) Malaysia 5.7 4.5 4.1 (7) Indonesia 8.3 6.1 5.5 (6) Malaysia 5.3 3.4 6.5 (6) Thailand 6.6 5.3 -8 (8) Singapore 1.1 1.0 1.6 (8) Philippines 4.7 3.6 4.0 (7) Singapore 1.8 1.0 2.0 (8) Singapore 3.0 1.4 -
Rank
Rank
n in FY 2006: China 596, Thailand 353, Indonesia 238, Malaysia 245, Philippines 117, Singapore 244, Vietnam 236, India 201.n in FY 2007: China 622, Thailand 394, Indonesia 264, Malaysia 264, Philippines 194 Singapore 286, Vietnam 292, India 273.n in FY 2008: China 595, Thailand 376, Indonesia 278, Malaysia 264, Philippines 193, Singapore 271, Vietnam 260, India 250.Note 1: n indicates firms with business relationships or those considering new businesses.Note 2: "Labor issues" was added as new category in FY 2007.Note 3: Numbers in parentheses indicate rank in FY 2007.
Lack of clustering or development ofrelated industriesHigh forex risk Underdeveloped legal system, problems
with legal operationInadequate infrastructure
Labor issuesTax-related risks or issuesLabor costs are high or risingProblems with protection of intellectualproperty rights

24
Figure VI-2 Business risk ranking by country (all industries)
Japan External Trade Organization (JETRO)Copyright (C) 2009 JETRO. All rights reserved.
VI. Asian Business Environment
(2) Risks in doing business in major Asian countries (country ranking)
Figure VI-3 Chronological comparison of business risk ranking by country (manufacturing, trade & wholesale, retail)
(Multiple answers, %)
FY 2008 FY 2008 FY 2008 FY 2008
1 Underdeveloped legal system, problems with legal operation 55.7 High forex risk 23.1 High forex risk 32.6 Labor costs are high or rising 14.12 Problems with protection of intellectual property rights 55.7 Labor costs are high or rising 18.8 Inadequate infrastructure 29.9 High forex risk 13.43 Labor costs are high or rising 42.4 Inadequate infrastructure 10.3 Underdeveloped legal system, problems with legal operation 22.6 Underdeveloped legal system, problems with legal operation 8.54 Labor issues 32.6 Underdeveloped legal system, problems with legal operation 10.1 Labor issues 12.0 Lack of clustering or development of related industries 8.15 Tax-related risks or issues 30.6 Labor issues 7.9 Tax-related risks or issues 11.3 Labor issues 8.16 Inadequate infrastructure 16.8 Lack of clustering or development of related industries 7.7 Lack of clustering or development of related industries 10.6 Problems with protection of intellectual property rights 6.07 High forex risk 16.6 Tax-related risks or issues 7.5 Labor costs are high or rising 8.6 Inadequate infrastructure 5.68 Lack of clustering or development of related industries 4.0 Problems with protection of intellectual property rights 6.5 Problems with protection of intellectual property rights 6.6 Tax-related risks or issues 5.6
FY 2008 FY 2008 FY 2008 FY 2008
1 Inadequate infrastructure 28.0 Labor costs are high or rising 35.0 Inadequate infrastructure 55.7 Inadequate infrastructure 58.72 Lack of clustering or development of related industries 17.1 High forex risk 9.2 Underdeveloped legal system, problems with legal operation 33.8 Underdeveloped legal system, problems with legal operation 30.63 Underdeveloped legal system, problems with legal operation 15.2 Labor issues 3.3 Lack of clustering or development of related industries 24.3 Tax-related risks or issues 21.04 High forex risk 12.3 Lack of clustering or development of related industries 3.0 High forex risk 21.3 Labor issues 19.25 Tax-related risks or issues 8.5 Inadequate infrastructure 2.3 Labor costs are high or rising 17.2 High forex risk 18.56 Problems with protection of intellectual property rights 7.6 Tax-related risks or issues 1.7 Labor issues 15.9 Lack of clustering or development of related industries 15.77 Labor issues 7.6 Underdeveloped legal system, problems with legal operation 1.3 Tax-related risks or issues 11.5 Problems with protection of intellectual property rights 14.98 Labor costs are high or rising 4.3 Problems with protection of intellectual property rights 1.3 Problems with protection of intellectual property rights 10.8 Labor costs are high or rising 10.7
India
Rank
Rank
n in FY 2008: China 680, Thailand 416, Indonesia 301, Malaysia 284, Philippines 211, Singapore 303, Vietnam 296, India 281.Note: n indicates firms with business relationships or those considering new businesses.
China
Philippines
Thailand
Singapore
Indonesia
Vietnam
Malaysia
( Multiple answers, %)
FY 2008 FY 2007 FY 2006 FY 2008 FY 2007 FY 2006 FY 2008 FY 2007 FY 2006 FY 2008 FY 2007 FY 2006
1 Problems with protection of intellectual property rights 56.8 53.9 59.2 High forex risk 23.7 19.5 9.1 High forex risk 32.0 15.5 23.5 Labor costs are high or rising 13.6 14.0 13.92 Underdeveloped legal system, problems with legal operation 55.3 54.0 59.9 Labor costs are high or rising 18.4 15.7 20.4 Inadequate infrastructure 28.4 23.9 29.8 High forex risk 13.3 4.5 5.33 Labor costs are high or rising 43.4 41.3 28.4 Underdeveloped legal system, problems with legal operation 9.0 9.6 5.9 Underdeveloped legal system, problems with legal operation 20.9 22.7 28.2 Lack of clustering or development of related industries 8.3 9.5 12.74 Labor issues 32.3 29.9 - Inadequate infrastructure 9.0 8.4 7.4 Labor issues 11.9 9.1 - Labor issues 7.6 4.5 -5 Tax-related risks or issues 29.4 28.9 33.2 Lack of clustering or development of related industries 8.2 7.4 6.2 Lack of clustering or development of related industries 11.5 13.3 15.1 Underdeveloped legal system, problems with legal operation 7.2 3.4 6.56 High forex risk 17.1 22.8 20.5 Labor issues 6.6 5.3 - Tax-related risks or issues 10.4 8.0 15.5 Inadequate infrastructure 5.7 7.6 7.87 Inadequate infrastructure 16.6 19.1 21.6 Tax-related risks or issues 6.4 6.6 7.6 Labor costs are high or rising 8.3 6.1 5.5 Problems with protection of intellectual property rights 5.7 4.5 4.18 Lack of clustering or development of related industries 4.2 4.3 4.7 Problems with protection of intellectual property rights 6.4 6.1 6.2 Problems with protection of intellectual property rights 6.5 8.0 9.2 Tax-related risks or issues 5.3 3.4 6.5
FY 2008 FY 2007 FY 2006 FY 2008 FY 2007 FY 2006 FY 2008 FY 2007 FY 2006 FY 2008 FY 2007 FY 2006
1 Inadequate infrastructure 26.9 25.3 32.2 Labor costs are high or rising 32.8 33.9 39.3 Inadequate infrastructure 55.8 50.3 47.9 Inadequate infrastructure 56.4 53.5 57.22 Lack of clustering or development of related industries 18.1 17.5 20.9 High forex risk 8.5 4.5 3.3 Underdeveloped legal system, problems with legal operation 31.9 27.4 32.2 Underdeveloped legal system, problems with legal operation 28.4 19.0 35.33 Underdeveloped legal system, problems with legal operation 14.5 9.8 13.0 Lack of clustering or development of related industries 3.3 3.5 3.7 Lack of clustering or development of related industries 26.2 32.5 31.4 Tax-related risks or issues 19.6 12.5 17.94 High forex risk 12.4 7.2 7.9 Labor issues 3.0 1.4 - High forex risk 20.4 6.8 8.5 High forex risk 19.2 8.4 6.55 Problems with protection of intellectual property rights 7.8 9.8 9.0 Inadequate infrastructure 2.2 1.4 0.0 Labor costs are high or rising 16.2 8.6 5.1 Labor issues 18.8 15.8 -6 Tax-related risks or issues 7.8 1.0 7.3 Tax-related risks or issues 1.8 1.0 2.0 Labor issues 15.8 8.9 - Lack of clustering or development of related industries 16.4 18.3 18.47 Labor issues 6.7 5.7 - Underdeveloped legal system, problems with legal operation 1.5 1.4 0.0 Problems with protection of intellectual property rights 10.0 12.0 11.9 Problems with protection of intellectual property rights 14.4 10.3 13.98 Labor costs are high or rising 4.7 3.6 4.0 Problems with protection of intellectual property rights 1.1 1.0 1.6 Tax-related risks or issues 10.0 8.2 10.2 Labor costs are high or rising 10.4 7.3 3.5
Rank
Rank
n in FY 2006: China 596, Thailand 353, Indonesia 238, Malaysia 245, Philippines 117, Singapore 244, Vietnam 236, India 201.n in FY 2007: China 622, Thailand 394, Indonesia 264, Malaysia 264, Philippines 194 Singapore 286, Vietnam 292, India 273.n in FY 2008: China 595, Thailand 376, Indonesia 278, Malaysia 264, Philippines 193, Singapore 271, Vietnam 260, India 250.Note 1: n indicates firms with business relationships or those considering new businesses.Note 2: "Labor issues" was added as new category in FY 2007.
China
Philippines
Thailand
Singapore
Indonesia
Vietnam
Malaysia
India