survey of people who purchase their own insurance - report
TRANSCRIPT

June 2010
Survey of People Who Purchase Their Own Insurance
Kaiser Family Foundation
Survey Report
1
Kaiser Family Foundation Survey of People Who Purchase Their Own Insurance
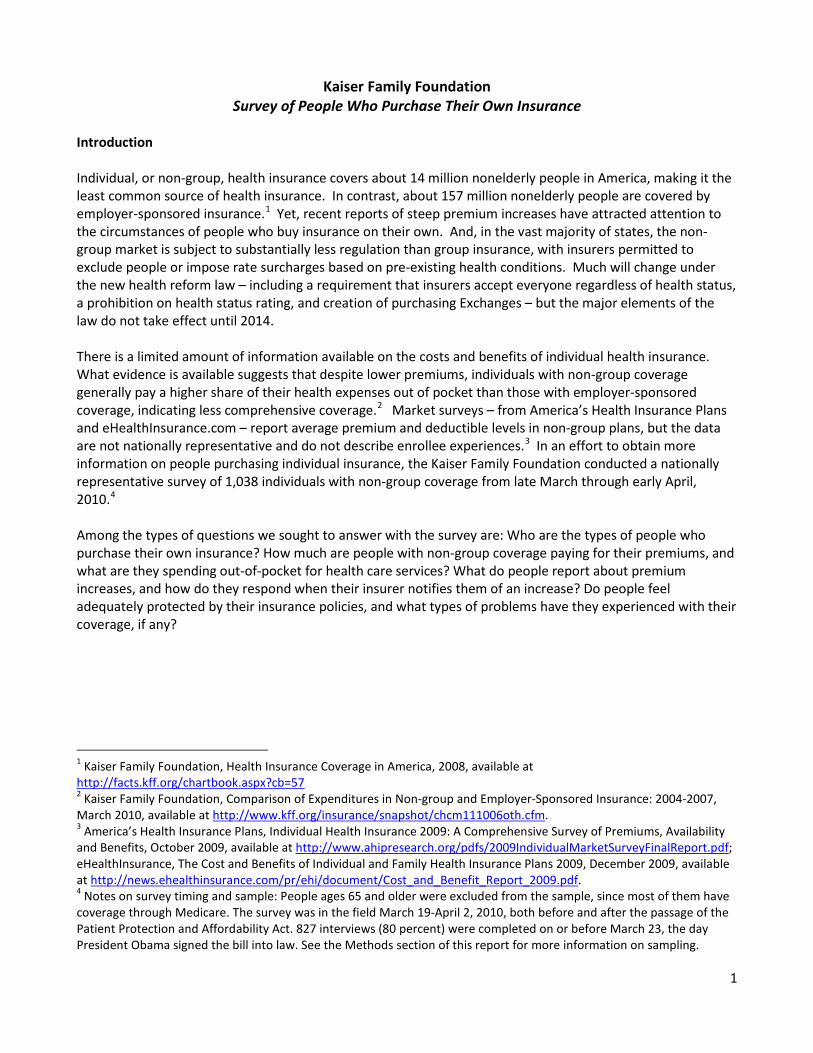
Introduction Individual, or non-group, health insurance covers about 14 million nonelderly people in America, making it the least common source of health insurance. In contrast, about 157 million nonelderly people are covered by employer-sponsored insurance.1
There is a limited amount of information available on the costs and benefits of individual health insurance. What evidence is available suggests that despite lower premiums, individuals with non-group coverage generally pay a higher share of their health expenses out of pocket than those with employer-sponsored coverage, indicating less comprehensive coverage.
Yet, recent reports of steep premium increases have attracted attention to the circumstances of people who buy insurance on their own. And, in the vast majority of states, the non-group market is subject to substantially less regulation than group insurance, with insurers permitted to exclude people or impose rate surcharges based on pre-existing health conditions. Much will change under the new health reform law – including a requirement that insurers accept everyone regardless of health status, a prohibition on health status rating, and creation of purchasing Exchanges – but the major elements of the law do not take effect until 2014.
2 Market surveys – from America’s Health Insurance Plans and eHealthInsurance.com – report average premium and deductible levels in non-group plans, but the data are not nationally representative and do not describe enrollee experiences.3 In an effort to obtain more information on people purchasing individual insurance, the Kaiser Family Foundation conducted a nationally representative survey of 1,038 individuals with non-group coverage from late March through early April, 2010.4
1 Kaiser Family Foundation, Health Insurance Coverage in America, 2008, available at
Among the types of questions we sought to answer with the survey are: Who are the types of people who purchase their own insurance? How much are people with non-group coverage paying for their premiums, and what are they spending out-of-pocket for health care services? What do people report about premium increases, and how do they respond when their insurer notifies them of an increase? Do people feel adequately protected by their insurance policies, and what types of problems have they experienced with their coverage, if any?
http://facts.kff.org/chartbook.aspx?cb=57 2 Kaiser Family Foundation, Comparison of Expenditures in Non-group and Employer-Sponsored Insurance: 2004-2007, March 2010, available at http://www.kff.org/insurance/snapshot/chcm111006oth.cfm. 3 America’s Health Insurance Plans, Individual Health Insurance 2009: A Comprehensive Survey of Premiums, Availability and Benefits, October 2009, available at http://www.ahipresearch.org/pdfs/2009IndividualMarketSurveyFinalReport.pdf; eHealthInsurance, The Cost and Benefits of Individual and Family Health Insurance Plans 2009, December 2009, available at http://news.ehealthinsurance.com/pr/ehi/document/Cost_and_Benefit_Report_2009.pdf. 4 Notes on survey timing and sample: People ages 65 and older were excluded from the sample, since most of them have coverage through Medicare. The survey was in the field March 19-April 2, 2010, both before and after the passage of the Patient Protection and Affordability Act. 827 interviews (80 percent) were completed on or before March 23, the day President Obama signed the bill into law. See the Methods section of this report for more information on sampling.
2
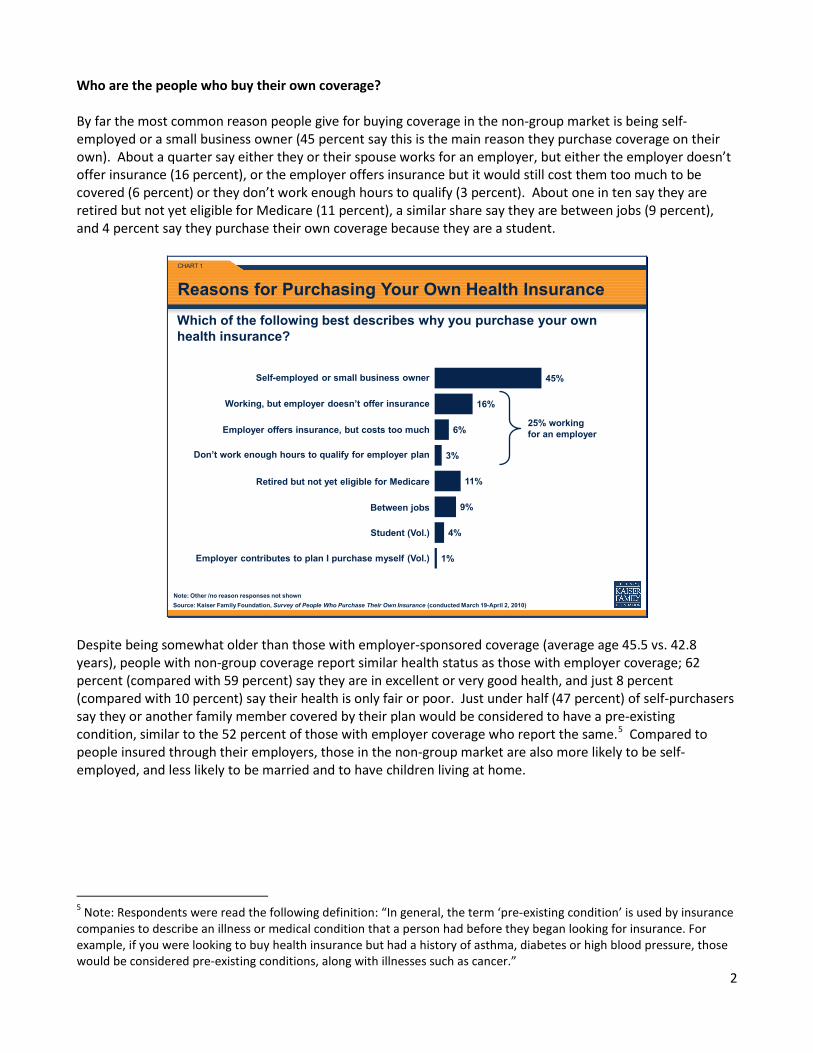
Who are the people who buy their own coverage? By far the most common reason people give for buying coverage in the non-group market is being self-employed or a small business owner (45 percent say this is the main reason they purchase coverage on their own). About a quarter say either they or their spouse works for an employer, but either the employer doesn’t offer insurance (16 percent), or the employer offers insurance but it would still cost them too much to be covered (6 percent) or they don’t work enough hours to qualify (3 percent). About one in ten say they are retired but not yet eligible for Medicare (11 percent), a similar share say they are between jobs (9 percent), and 4 percent say they purchase their own coverage because they are a student.
CHART 1
Source: Kaiser Family Foundation, Survey of People Who Purchase Their Own Insurance (conducted March 19-April 2, 2010)
1%
4%
9%
11%
3%
6%
16%
45%Self-employed or small business owner
Reasons for Purchasing Your Own Health InsuranceWhich of the following best describes why you purchase your own health insurance?
Working, but employer doesn’t offer insurance
Don’t work enough hours to qualify for employer plan
Between jobs
Student (Vol.)
Employer offers insurance, but costs too much
Retired but not yet eligible for Medicare
25% working for an employer
Employer contributes to plan I purchase myself (Vol.)
Note: Other /no reason responses not shown
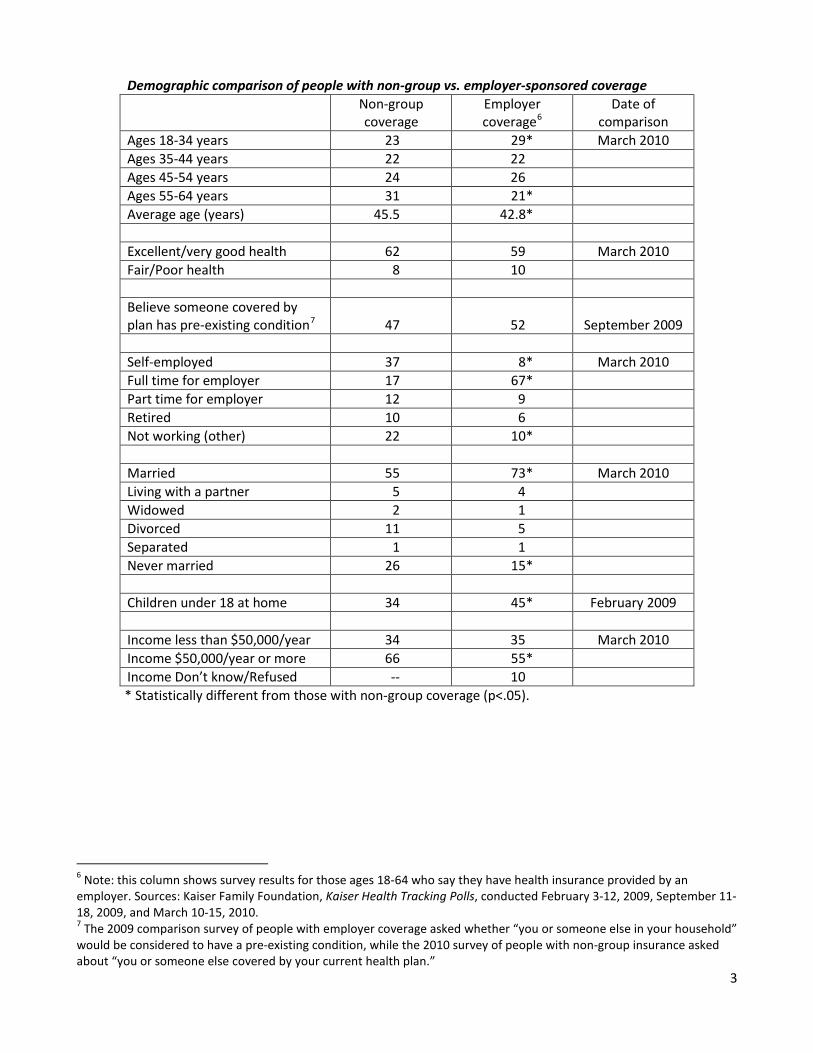
Despite being somewhat older than those with employer-sponsored coverage (average age 45.5 vs. 42.8 years), people with non-group coverage report similar health status as those with employer coverage; 62 percent (compared with 59 percent) say they are in excellent or very good health, and just 8 percent (compared with 10 percent) say their health is only fair or poor. Just under half (47 percent) of self-purchasers say they or another family member covered by their plan would be considered to have a pre-existing condition, similar to the 52 percent of those with employer coverage who report the same.5
5 Note: Respondents were read the following definition: “In general, the term ‘pre-existing condition’ is used by insurance companies to describe an illness or medical condition that a person had before they began looking for insurance. For example, if you were looking to buy health insurance but had a history of asthma, diabetes or high blood pressure, those would be considered pre-existing conditions, along with illnesses such as cancer.”
Compared to people insured through their employers, those in the non-group market are also more likely to be self-employed, and less likely to be married and to have children living at home.
3
Demographic comparison of people with non-group vs. employer-sponsored coverage
Non-group coverage
Employer coverage6
Date of comparison
Ages 18-34 years 23 29* March 2010 Ages 35-44 years 22 22 Ages 45-54 years 24 26 Ages 55-64 years 31 21* Average age (years) 45.5 42.8* Excellent/very good health 62 59 March 2010 Fair/Poor health 8 10 Believe someone covered by plan has pre-existing condition7 47 52 September 2009 Self-employed 37 8* March 2010 Full time for employer 17 67* Part time for employer 12 9 Retired 10 6 Not working (other) 22 10* Married 55 73* March 2010 Living with a partner 5 4 Widowed 2 1 Divorced 11 5 Separated 1 1 Never married 26 15* Children under 18 at home 34 45* February 2009 Income less than $50,000/year 34 35 March 2010 Income $50,000/year or more 66 55* Income Don’t know/Refused -- 10 * Statistically different from those with non-group coverage (p<.05).
6 Note: this column shows survey results for those ages 18-64 who say they have health insurance provided by an employer. Sources: Kaiser Family Foundation, Kaiser Health Tracking Polls, conducted February 3-12, 2009, September 11-18, 2009, and March 10-15, 2010. 7 The 2009 comparison survey of people with employer coverage asked whether “you or someone else in your household” would be considered to have a pre-existing condition, while the 2010 survey of people with non-group insurance asked about “you or someone else covered by your current health plan.”

4
Premiums, deductibles, and out-of-pocket spending There are two main types of policies among those who purchase their own insurance: individual policies, which cover only one person, and family policies, which cover the individual plus other members of his or her family, which may or may not include children. Among those with individual coverage (who make up 57 percent of all self-purchasers), the average annual premium reported is $3,606. Those with family policies (who make up 43 percent of the total) report an average premium of $7,102.8
Average reported annual premiums by coverage type and age
In general, older people report paying higher premiums than younger people, both for individual policies and for family policies.
Individual Coverage Family Coverage All 18-34 years9 -- -- $2,630 35-49 years $2,843 $6,864 $5,337 50-64 years $4,822 $8,667 $6,192 All $3,606 $7,102 $5,131
In addition to their premiums, people report spending an average of $1,690 on health expenses out of their own pockets in the past year, including $924 for people with individual coverage, and $2,688 for people with family coverage. Eleven percent say they have spent $5,000 or more on top of their premiums.
CHART 2
Source: Kaiser Family Foundation, Survey of People Who Purchase Their Own Insurance (conducted March 19-April 2, 2010)
3%
2%
9%
14%
14%
15%
11%
18%
14%
Reported Out of Pocket CostsApproximately how much have you paid for health care costs, such as co-pays, deductibles, and any other expenses not covered by your insurance, out of your own pocket in the past 12 months?
$250 - $499
$1,000 - $1,999
$5,000 - $9,999
No answer
$0
$500 - $999
$2,000 - $4,999
$10,000 or more
$1 - $249
Average out-of-pocket spending in past 12 months excluding
insurance premiums
$1,690
8 See Appendix 2 for comparisons of reported non-group premiums to those of employer plans. 9 Note: Cell sizes too small to show reliable breakdowns for individual and family coverage for ages 18-34.

5
Many people also report being in plans with fairly high deductibles. More than a quarter (26 percent) report an annual deductible of $5,000 or more, and 6 percent say they have a deductible of $10,000 or more. On the other end of the spectrum, 7 percent say they don’t have a deductible. The average deductible reported for individual coverage is $2,498.10 Those with family coverage whose deductibles must be met on a per-person basis report an average deductible of $2,959, while those with a family deductible (a total spending amount which must be met by the entire family before coverage kicks in) report an average of $5,149.11
Given these costs, it may not be surprising that many of those who purchase their own coverage report that paying for their insurance and care is a burden. Six in ten (61 percent) say it is very or somewhat difficult for them to afford the cost of health care and insurance, nearly twice as many as the 33 percent of those with employer-sponsored coverage who said it was difficult for them to afford the cost of care and insurance in 2008.
12
CHART 3
Source: Kaiser Family Foundation, Survey of People Who Purchase Their Own Insurance (conducted March 19-April 2, 2010)
24%
37%
30%
7%
How difficult is it for you to pay for your health care costs, including health insurance premiums and all other out-of-pocket costs?
No answer 1%
Not at all difficult
Very difficult
Not too difficult
Somewhat difficult
12%
21%
30%
36%
Not at all difficult
Very difficult
Not too difficult
Somewhat difficult
Self-purchasers 2010 Employer coverage 2008*
Reported Difficulties Paying for Health Care
*Note: Results shown for those ages 18-64 who say they have health insurance provided by an employer. Source: NPR/Kaiser Family Foundation/Harvard School of Public Health, The Public on Requiring Individuals to Have Health Insurance (conducted Feb. 4-14, 2008)
10 Average deductibles exclude those individuals with no deductible. 11 See Appendix 2 for comparisons of reported non-group premiums to those of employer plans. 12 Source: NPR/Kaiser Family Foundation/Harvard School of Public Health, The Public on Requiring Individuals to Have Health Insurance (conducted Feb. 4-14, 2008)
6
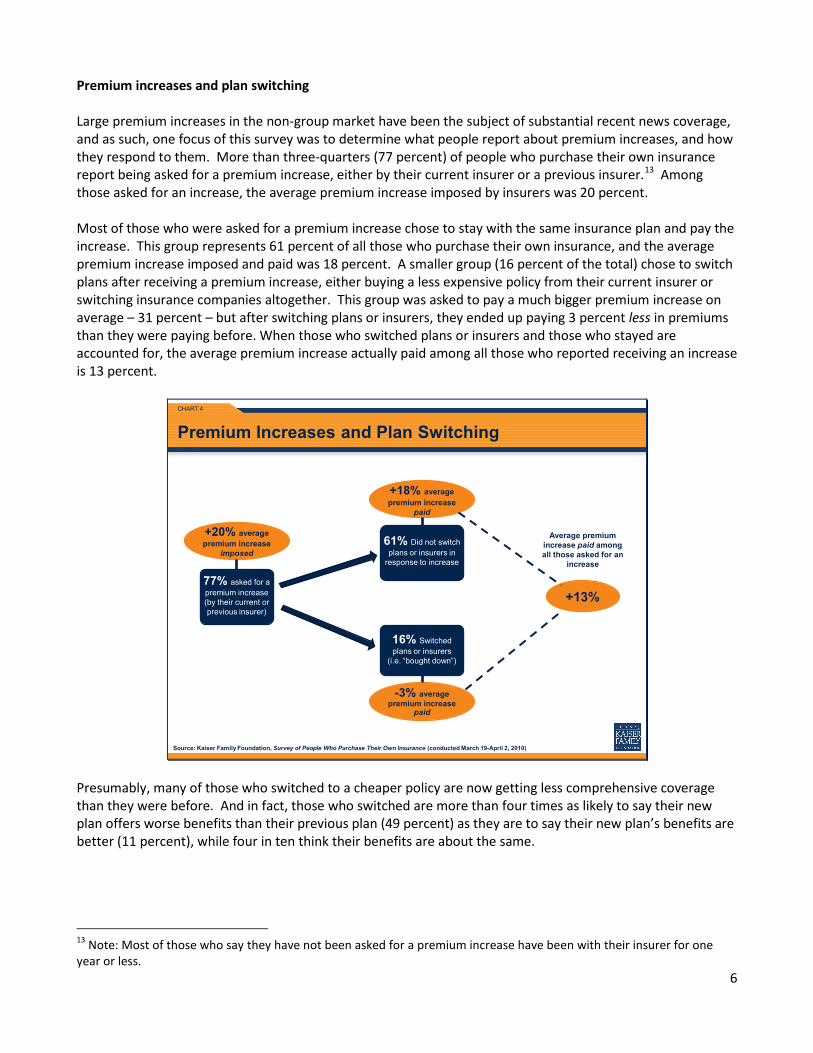
Premium increases and plan switching Large premium increases in the non-group market have been the subject of substantial recent news coverage, and as such, one focus of this survey was to determine what people report about premium increases, and how they respond to them. More than three-quarters (77 percent) of people who purchase their own insurance report being asked for a premium increase, either by their current insurer or a previous insurer.13
CHART 4
Source: Kaiser Family Foundation, Survey of People Who Purchase Their Own Insurance (conducted March 19-April 2, 2010)
Premium Increases and Plan Switching
Average premium increase paid among all those asked for an
increase
+13%77% asked for a premium increase (by their current or previous insurer)
+20% average premium increase
imposed61% Did not switch
plans or insurers in response to increase
16% Switched plans or insurers
(i.e. “bought down”)
+18% average premium increase
paid
-3% average premium increase
paid
Among those asked for an increase, the average premium increase imposed by insurers was 20 percent. Most of those who were asked for a premium increase chose to stay with the same insurance plan and pay the increase. This group represents 61 percent of all those who purchase their own insurance, and the average premium increase imposed and paid was 18 percent. A smaller group (16 percent of the total) chose to switch plans after receiving a premium increase, either buying a less expensive policy from their current insurer or switching insurance companies altogether. This group was asked to pay a much bigger premium increase on average – 31 percent – but after switching plans or insurers, they ended up paying 3 percent less in premiums than they were paying before. When those who switched plans or insurers and those who stayed are accounted for, the average premium increase actually paid among all those who reported receiving an increase is 13 percent.
Presumably, many of those who switched to a cheaper policy are now getting less comprehensive coverage than they were before. And in fact, those who switched are more than four times as likely to say their new plan offers worse benefits than their previous plan (49 percent) as they are to say their new plan’s benefits are better (11 percent), while four in ten think their benefits are about the same.
13 Note: Most of those who say they have not been asked for a premium increase have been with their insurer for one year or less.

7
Perceptions of adequacy of coverage, problems paying bills, worries for the future
Those who purchase their own coverage are split pretty much down the middle in terms of how much protection they feel their plan delivers; just over half (51 percent) say they feel vulnerable to high medical bills, while 48% say they feel well-protected by their plan. While most (59 percent) say they are confident that they have enough money or insurance to pay for their family’s usual medical costs, fewer than half (47 percent) are as confident about their ability to pay for a major illness. Both of these are significantly lower than the shares of people with employer coverage who expressed confidence on these measures in a recent survey. How confident are you that you have enough money or health insurance to pay for…
… the usual medical costs that you (and your family) require
...a major illness, such as a heart attack, cancer, or a serious injury that required hospitalization
Non-group coverage
Employer coverage14
Non-group coverage
Employer coverage14
Very confident 17 36 14 34 Somewhat confident 42 45 33 39 Not too confident 22 13 29 16 Not at all confident 18 6 22 10 For many, this lack of confidence in their ability to pay for care may reflect real problems they have experienced. More than one in five (22 percent) say there was a time over the past year when they or another family member covered by their plan did not get medical care they needed because of the cost, and a similar share (20 percent) say they skipped filling a prescription for cost reasons. Nearly four in ten (38 percent) report some type of problem getting their insurance company to pay a bill, either that their plan paid less than they expected for a given bill (31 percent), their plan would not pay anything for care they thought was covered (22 percent), or that they reached the limit of what their plan would pay for a specific illness or injury (7 percent).
CHART 5
Source: Kaiser Family Foundation, Survey of People Who Purchase Their Own Insurance (conducted March 19-April 2, 2010)
Skipping Care and Problems Getting Bills Paid
Percent reporting the following problems in the past 12 months*:
Plan paid less than you expected for a bill
Reached limit of what insurance would pay for treatment of a specific illness or injury
Report any of the 3 above problems
Were surprised to find plan would not pay anything for care you thought was covered
38%
7%
22%
31%
20%
22%
Percent reporting the following problems with their current health insurance plan:
You or someone covered by plan did not fill a prescription for a medicine because of the cost
You or someone covered by plan needed medical care, but did not get it because of the cost
*Note: those who have been with current plan less than 12 months were asked about “since you began purchasing insurance from your current insurer”
14 Based on those ages 18-64 who say they have health insurance provided by an employer. Source: Kaiser Family Foundation, Kaiser Health Tracking Poll, conducted May 11-16, 2010.
8
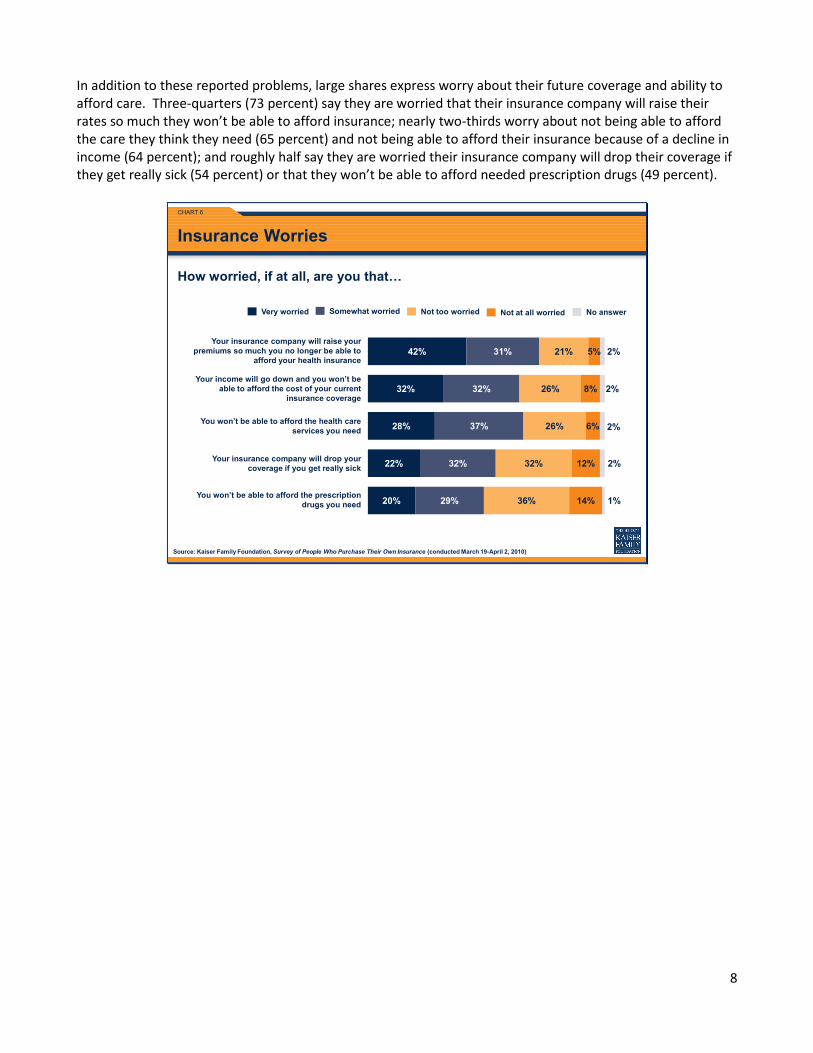
In addition to these reported problems, large shares express worry about their future coverage and ability to afford care. Three-quarters (73 percent) say they are worried that their insurance company will raise their rates so much they won’t be able to afford insurance; nearly two-thirds worry about not being able to afford the care they think they need (65 percent) and not being able to afford their insurance because of a decline in income (64 percent); and roughly half say they are worried their insurance company will drop their coverage if they get really sick (54 percent) or that they won’t be able to afford needed prescription drugs (49 percent).
CHART 6
Source: Kaiser Family Foundation, Survey of People Who Purchase Their Own Insurance (conducted March 19-April 2, 2010)
20%
22%
28%
32%
42%
29%
32%
37%
32%
31%
36%
32%
26%
26%
21%
14%
12%
6%
8%
5%
1%
2%
2%
2%
2%
Insurance Worries
How worried, if at all, are you that…
Somewhat worried Not too worried Not at all worried No answerVery worried
Your insurance company will raise your premiums so much you no longer be able to
afford your health insurance
Your income will go down and you won’t be able to afford the cost of your current
insurance coverage
You won’t be able to afford the health care services you need
Your insurance company will drop your coverage if you get really sick
You won’t be able to afford the prescription drugs you need
9
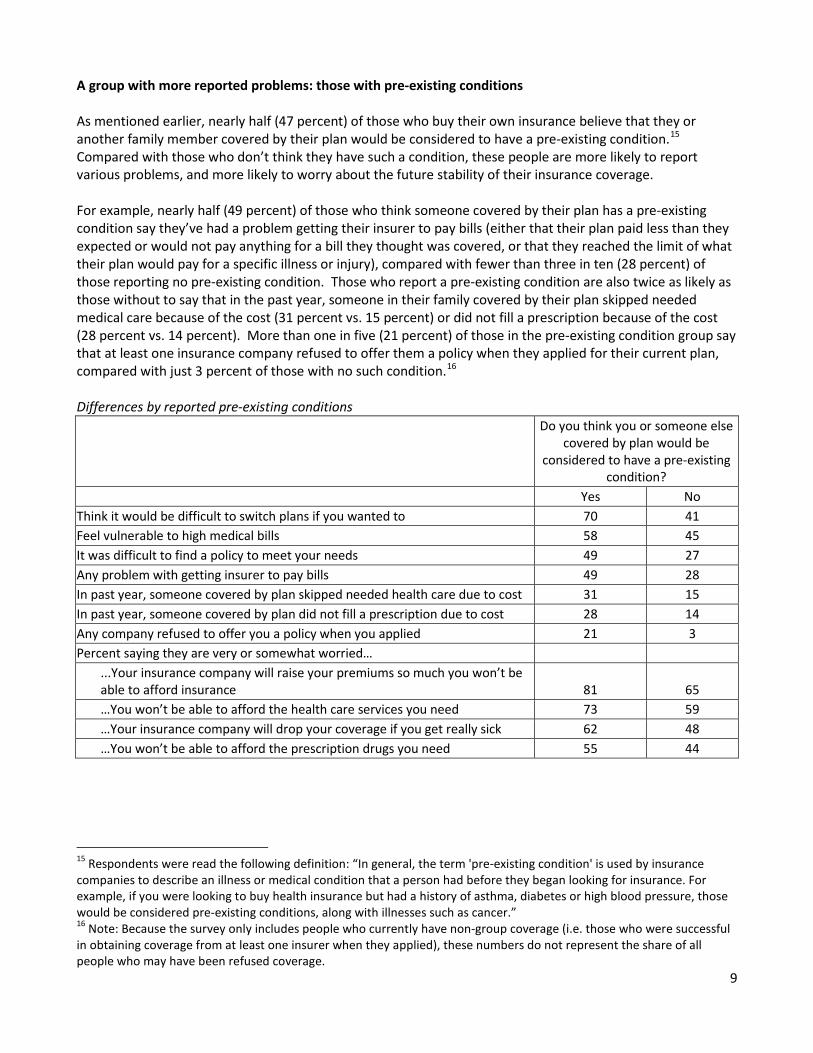
A group with more reported problems: those with pre-existing conditions As mentioned earlier, nearly half (47 percent) of those who buy their own insurance believe that they or another family member covered by their plan would be considered to have a pre-existing condition.15
For example, nearly half (49 percent) of those who think someone covered by their plan has a pre-existing condition say they’ve had a problem getting their insurer to pay bills (either that their plan paid less than they expected or would not pay anything for a bill they thought was covered, or that they reached the limit of what their plan would pay for a specific illness or injury), compared with fewer than three in ten (28 percent) of those reporting no pre-existing condition. Those who report a pre-existing condition are also twice as likely as those without to say that in the past year, someone in their family covered by their plan skipped needed medical care because of the cost (31 percent vs. 15 percent) or did not fill a prescription because of the cost (28 percent vs. 14 percent). More than one in five (21 percent) of those in the pre-existing condition group say that at least one insurance company refused to offer them a policy when they applied for their current plan, compared with just 3 percent of those with no such condition.
Compared with those who don’t think they have such a condition, these people are more likely to report various problems, and more likely to worry about the future stability of their insurance coverage.
16
Differences by reported pre-existing conditions
Do you think you or someone else covered by plan would be
considered to have a pre-existing condition?
Yes No Think it would be difficult to switch plans if you wanted to 70 41 Feel vulnerable to high medical bills 58 45 It was difficult to find a policy to meet your needs 49 27 Any problem with getting insurer to pay bills 49 28 In past year, someone covered by plan skipped needed health care due to cost 31 15 In past year, someone covered by plan did not fill a prescription due to cost 28 14 Any company refused to offer you a policy when you applied 21 3 Percent saying they are very or somewhat worried… ...Your insurance company will raise your premiums so much you won’t be
able to afford insurance 81 65 …You won’t be able to afford the health care services you need 73 59 …Your insurance company will drop your coverage if you get really sick 62 48 …You won’t be able to afford the prescription drugs you need 55 44
15 Respondents were read the following definition: “In general, the term 'pre-existing condition' is used by insurance companies to describe an illness or medical condition that a person had before they began looking for insurance. For example, if you were looking to buy health insurance but had a history of asthma, diabetes or high blood pressure, those would be considered pre-existing conditions, along with illnesses such as cancer.” 16 Note: Because the survey only includes people who currently have non-group coverage (i.e. those who were successful in obtaining coverage from at least one insurer when they applied), these numbers do not represent the share of all people who may have been refused coverage.
10
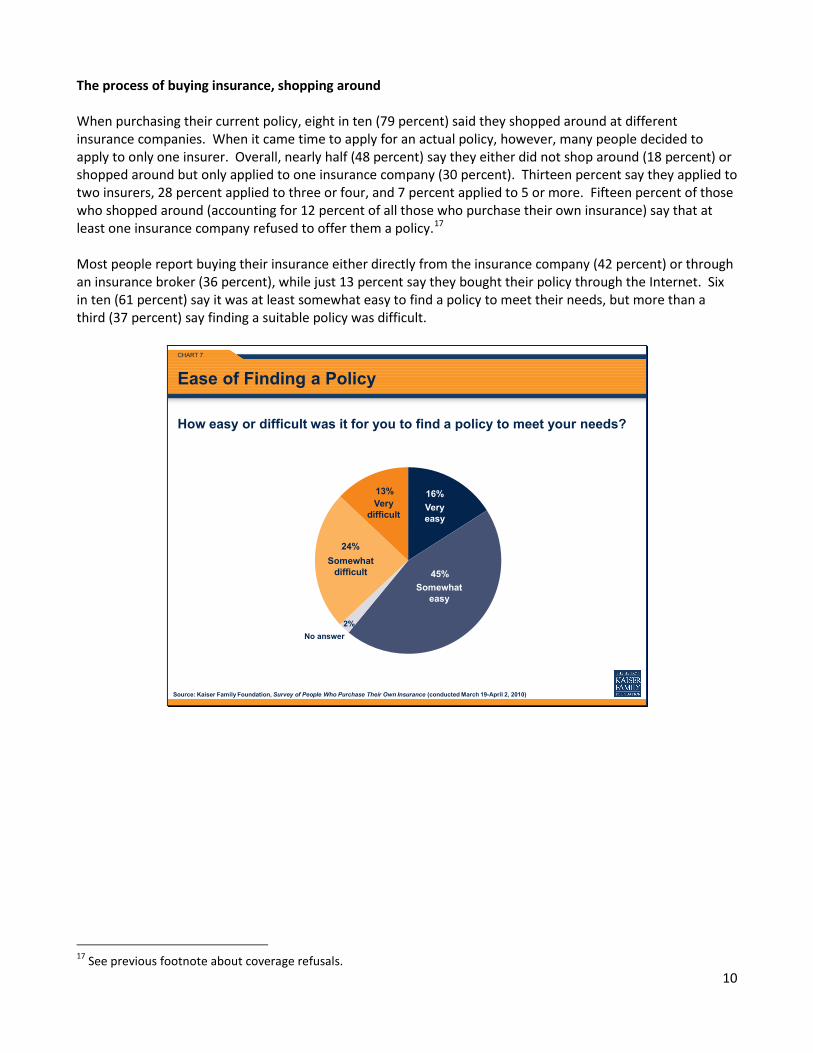
The process of buying insurance, shopping around When purchasing their current policy, eight in ten (79 percent) said they shopped around at different insurance companies. When it came time to apply for an actual policy, however, many people decided to apply to only one insurer. Overall, nearly half (48 percent) say they either did not shop around (18 percent) or shopped around but only applied to one insurance company (30 percent). Thirteen percent say they applied to two insurers, 28 percent applied to three or four, and 7 percent applied to 5 or more. Fifteen percent of those who shopped around (accounting for 12 percent of all those who purchase their own insurance) say that at least one insurance company refused to offer them a policy.17
CHART 7
Source: Kaiser Family Foundation, Survey of People Who Purchase Their Own Insurance (conducted March 19-April 2, 2010)
16%
45%
2%
24%
13%
Ease of Finding a Policy
How easy or difficult was it for you to find a policy to meet your needs?
Very difficult
Very easy
No answer
Somewhat easy
Somewhat difficult
Most people report buying their insurance either directly from the insurance company (42 percent) or through an insurance broker (36 percent), while just 13 percent say they bought their policy through the Internet. Six in ten (61 percent) say it was at least somewhat easy to find a policy to meet their needs, but more than a third (37 percent) say finding a suitable policy was difficult.
17 See previous footnote about coverage refusals.
11
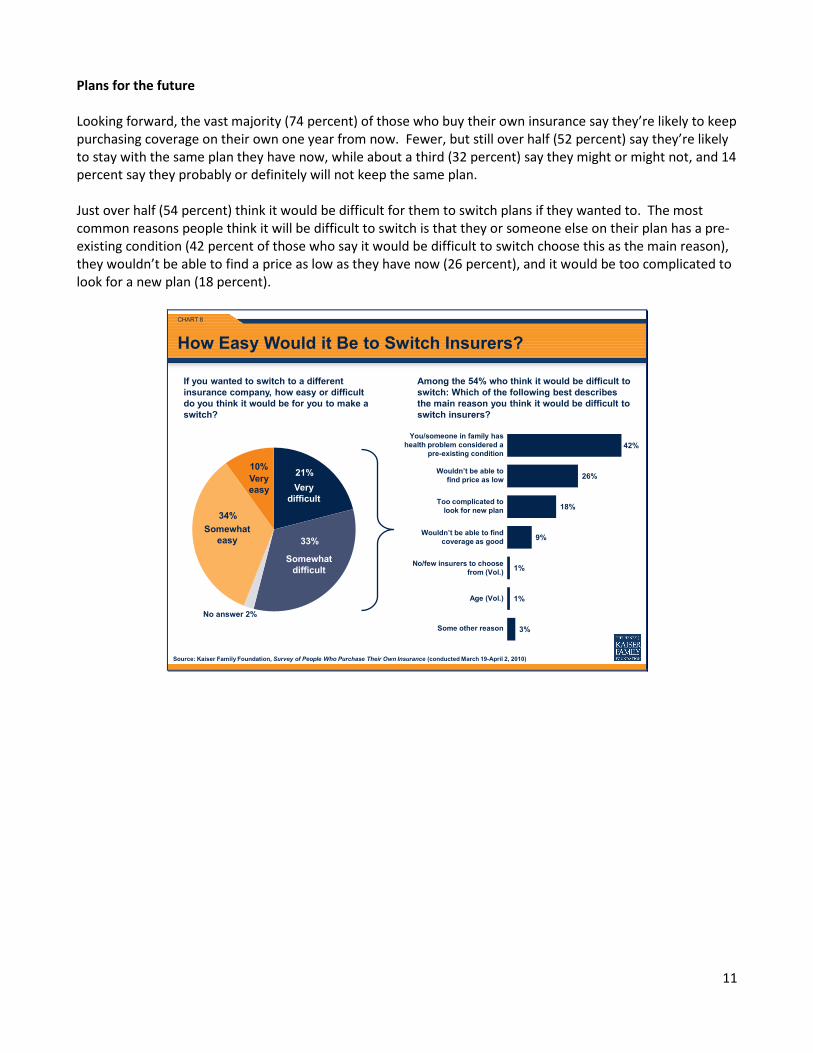
Plans for the future Looking forward, the vast majority (74 percent) of those who buy their own insurance say they’re likely to keep purchasing coverage on their own one year from now. Fewer, but still over half (52 percent) say they’re likely to stay with the same plan they have now, while about a third (32 percent) say they might or might not, and 14 percent say they probably or definitely will not keep the same plan. Just over half (54 percent) think it would be difficult for them to switch plans if they wanted to. The most common reasons people think it will be difficult to switch is that they or someone else on their plan has a pre-existing condition (42 percent of those who say it would be difficult to switch choose this as the main reason), they wouldn’t be able to find a price as low as they have now (26 percent), and it would be too complicated to look for a new plan (18 percent).
CHART 8
Source: Kaiser Family Foundation, Survey of People Who Purchase Their Own Insurance (conducted March 19-April 2, 2010)
21%
33%
34%
10%
3%
1%
1%
9%
18%
26%
42%
How Easy Would it Be to Switch Insurers?
Somewhat easy
Verydifficult
Among the 54% who think it would be difficult to switch: Which of the following best describes the main reason you think it would be difficult to switch insurers?
If you wanted to switch to a different insurance company, how easy or difficult do you think it would be for you to make a switch?
Somewhat difficult
No answer 2%
Very easy
Wouldn’t be able to find coverage as good
Wouldn’t be able to find price as low
Too complicated tolook for new plan
You/someone in family has health problem considered a
pre-existing condition
Age (Vol.)
Some other reason
No/few insurers to choose from (Vol.)
12
Discussion and Conclusions The survey results shed light on the experiences and opinions of people purchasing their own insurance in the non-group market. These people report spending thousands of dollars on premiums and out-of-pocket health care expenses, and not surprisingly, more than half say it is difficult for them to afford these costs. The survey also indicates that the vast majority of people in the non-group market have faced premium increases – their insurers imposed premium increases of 20 percent on average – and that while most have chosen to pay the increase, many switched to less expensive plans, which may have less comprehensive coverage. This group also reports problems with paying for health care, feeling vulnerable to medical costs, and worrying about affording insurance and medical care in the future. It remains to be seen how the recently passed Affordable Care Act will ultimately impact the experiences and opinions of people such as those we surveyed.18
18 While interviews for the survey were conducted both before and after the law was signed on March 23, 2010, none of the provisions of the law were in effect during the time of the survey.
The new law reforms many aspects of the health insurance market, and specifically restricts current practices that are common in the individual market. For example, as of January 2014, insurers will no longer be able to deny coverage due to health status or rescind policies, and premiums may vary only based on age by 3 to 1, geographic location, family size, and tobacco use, and may not vary based on health status. More immediately, insurers will have to report premium increases and justify increases deemed excessive. These market reforms, the development of health insurance exchanges where people can more easily compare and purchase coverage, and subsidies for purchasing health insurance are likely to make insurance more accessible, particularly for those with lower incomes or poor health status, and could potentially alleviate some of the problems that individuals reported in this survey. However, many people in the non-group market may not see changes for many years to come, as most of the provisions in the law don’t take effect until 2014.
13
Appendix 1: Survey Methodology The Survey of People Who Purchase Their Own Insurance was designed, analyzed, and conducted by researchers at the Kaiser Family Foundation, led by Mollyann Brodie, Ph.D. and Gary Claxton, and including Liz Hamel, Bianca DiJulio, Larry Levitt, and Sarah Cho. In order to identify people who purchase their own insurance, we completed screening interviews with a nationally representative sample of 8,499 people ages 18-64, including 4,165 who had previously been identified as purchasing their own insurance, as well as 4,334 who had not previously answered questions about their health insurance status. Of these, 1,038 met the following criteria:
• Currently covered by health insurance that they purchase directly • Not covered by health insurance through an employer, COBRA, Medicare, Medicaid or any other state
government program, or the U.S. military or VA • If covered by any other source of insurance, the insurance they purchase themselves is their main
source of coverage, not supplemental to another source • Did not purchase their insurance from a state, local, or other government agency • If purchase insurance from a college or university, the insurance covers health services received both
within and outside the university setting • If a small business owner, the health insurance they purchase is only for themselves and/or their
family, and does not cover non-related employees of their business A web-based survey among the 1,038 randomly selected individuals was conducted between March 19 and April 2, 2010. Fieldwork was conducted by Knowledge Networks. Respondents are members of the Knowledge Networks Panel, a large, randomly drawn, representative national panel of households. The panel members are randomly recruited by telephone and by self-administered mail and web surveys. Households are provided with access to the Internet and hardware if needed. Unlike other Internet research that covers only individuals with Internet access who volunteer for research, Knowledge Networks surveys are based on a dual sampling frame that includes both listed and unlisted phone numbers, telephone and non-telephone households, and cell-phone-only households. All data were weighted to adjust for demographic differences between the Knowledge Networks panel and national Census estimates. The margin of sampling error for results based on the full sample is plus or minus 4 percentage points. For results based on smaller subsets of respondents, the margin of sampling error may be higher. Sampling error is only one of many potential sources of error in this or any other public opinion poll. Please note:
• “Vol.” indicates that a response was volunteered by a respondent, not an explicitly offered choice. • Due to rounding, percentages may not always add up to 100 percent.

14
Appendix 2: Comparison of Non-group and Employer-Sponsored Health Insurance Premiums and Deductibles Average annual premiums by coverage type Non-group Health Insurance Employer-Sponsored Health Insurance Individual Coverage $3,606 $4,824*
Family Coverage $7,102
(Two or More Family Members) $13,375*
(Family of Four) *Statistically different from average for non-group coverage (p<.05). Note: Individuals with non-group insurance pay the full premium out of pocket, whereas individuals with employer-sponsored coverage pay a portion of the premium because employers often contribute to the cost of coverage. The average percentage of the premium paid by the employer is 83% for single coverage and 73% for family coverage. The Kaiser/HRET survey asks about the cost of coverage for a family of four. Sources: Kaiser Family Foundation, Survey of People Who Purchase Their Own Insurance, April 2010 and Kaiser/HRET Employer Health Benefits Survey, 2009. Average annual deductibles by coverage type
Non-group Health
Insurance
Employer-Sponsored Health Insurance (PPO Coverage)
Employer-Sponsored Health Insurance
(HDHP/SO Coverage) Individual Coverage $2,498 $634* $1,838* Family Coverage, Aggregate $5,149 $1,488* $3,626* Family Coverage, Per-Person Amount $2,959 $633* $2,091* *Statistically different from average for non-group coverage (p<.05). Note: PPO coverage is the most common type of employer-sponsored coverage. In 2009, 60% percent of covered workers were enrolled in PPO plans and 8% of covered workers were enrolled in High-Deductible Plans with a Savings Option (HDHP/SO). Sources: Kaiser Family Foundation, Survey of People Who Purchase Their Own Insurance, April 2010 and Kaiser/HRET Employer Health Benefits Survey, 2009.
The Henry J. Kaiser Family Foundation
Headquarters
2400 Sand Hill Road Menlo Park, CA 94025
Phone: (650) 854-9400 Fax: (650) 854-4800
Washington Offices and Barbara Jordan Conference Center
1330 G Street, NW Washington, DC 20005
Phone: (202) 347-5270 Fax: (202) 347-5274
www.kff.org
This publication (#8077-R) is available on the Kaiser Family Foundation website at www.kff.org.
The Kaiser Family Foundation is a non-profit private operating foundation, based in Menlo Park, California, dedicated to producing and communicating the best possible analysis and information on health issues.