survey of hispanic dairy workers in new york state...
TRANSCRIPT

December 2016 EB 2016-12
Survey of Hispanic Dairy Workers in New York State 2016
Thomas Maloney
Libby Eiholzer
Brooke Ryan
Charles H. Dyson School of Applied Economics and Management
College of Agriculture and Life Sciences
Cornell University Ithaca, New York 14853-7801

It is the policy of Cornell University actively to support equality of educational and employment opportunity. No person shall be denied admission to any educational program or activity or be denied employment on the basis of any legally prohibited discrimination involving, but not limited to, such factors as race, color, creed, religion, national or ethnic origin, sex, age or handicap. The University is committed to the maintenance of affirmative action programs which will assure the continuation of such equality of opportunity.

3
Authors
Thomas Maloney is a Senior Extension Associate in the Charles H. Dyson School of Applied Economics and Management at Cornell University. Libby Eiholzer is a Bilingual Dairy Extension Specialist on the Northwest New York Dairy, Livestock and Field Crops Team. Brooke Ryan is a student at Cornell University, class of 2017 and was a Cornell Cooperative Extension Summer Intern in 2016.
Acknowledgements
The authors wish to acknowledge those individuals and organizations that helped to make this research project a success. A sincere thank you goes to the 36 farm managers and the 205 dairy workers who agreed to be interviewed and gave generously of their time. We express our sincere appreciation to Yasamin Miller from the Yasamin Miller Group, Ithaca, N.Y. for her capable assistance with survey development, data analysis and report development. We thank the Wayne County Growers and Processors and Cornell Cooperative Extension for providing funding for this project. We thank Professor Emeritus Nelson Bills for providing census data cited in this report. The authors also thank Meg Gaige for her careful proof reading and editing of the final manuscript.

4
Abstract
Since the mid-1990s New York dairy farm employers have relied heavily on Hispanic workers (mostly from Mexico and Guatemala) to fill labor-intensive dairy positions. This study is a partial replication of a 2005 survey when 111 Hispanic workers and 60 dairy managers in New York State were interviewed (Maloney and Grusenmeyer 2005). The purpose of this survey is to update parts of the 2005 survey, to examine the demographic characteristics of New York Hispanic dairy workers and gain insight into their attitudes toward their jobs. The information was collected in on-farm personal interviews of 205 Hispanic workers and 36 dairy managers during the summer of 2016.
The average age of Hispanic workers on these farms is 30 years old. Far fewer workers (16.6%) are between 16-21 years of age compared to the 2005 report where 39% were in this age group. The majority of those surveyed (95.6%) were male. Most workers (80%) come from Mexico, with the remainder coming from Guatemala. One out of two (52%) have completed between 9-12 years of education. More than half (55.6%) report that they do not speak English well, while 37.6% say they speak some English. The average number of years working in the United States is 12.5. The majority (60%) have worked for one or two employers, while 28.8% have worked for three to five employers.
Almost two-thirds of employees (60.5%) plan to work here for a time and then eventually return to their home country, while two out of five (39.5%) said they would like to stay in the United States long term. Two-thirds have a spouse in their home country.
The majority of Hispanic employees work 12 hours a day (58.8%), and 6 days a week (88.8%). Most (64.9%) milk cows, but nearly half push cows and help with calvings (49%). Employees report performing many other job duties as well.
On average, employers report a starting hourly wage for milkers as $9.34/hour. The highest average hourly pay rate for milkers was $11.05. (See Table 1.) The average hourly wage for the highest paid Hispanic employee in any position on the farm was $12.94 and the highest wage for any Hispanic employee was $26.00.
Both employers and employees were asked about the benefits that workers receive. Nearly 80% receive employer-paid housing and utilities. More than four out of five employers also offer cable TV, Internet, garden space, and a bonus program. Many employees report receiving paid vacation as well.
Responses to four open-ended questions revealed that employees are generally quite satisfied with their jobs. The majority said that nothing was difficult, and that they liked everything about their job. Other responses were that communication is the hardest part of their job, and that they like milking or pushing cows the best. Most employees said that their boss couldn’t do anything to make their job better, while a few said higher pay or more opportunities to learn new tasks would be helpful. When asked what they liked the most about their boss, more than half said that their boss is a good person.

5
Table of Contents
Section Page
Introduction ...................................................................................................... 8
Study Approach ............................................................................................... 9
Results ............................................................................................................ 10
Farms.................................................................................................. 10
Hispanic Dairy Farm Employees ....................................................... 15
Reasons for Coming to the Farm ....................................................... 25
Farm Duties ........................................................................................ 26
Compensation .................................................................................... 31
Benefits .............................................................................................. 33
Job Satisfaction .................................................................................. 36
Future Plans ....................................................................................... 37
Discussion and Implications .......................................................................... 39
Importance of Hispanic Employees to New York Dairies................. 39
Importance of Family and Social Networks ...................................... 40
Language and Communications ......................................................... 41
Job Responsibilities ........................................................................... 41
Compensation .................................................................................... 42
Worker Retention ............................................................................... 42
Hispanic Workforce Trends ............................................................... 42
Suggested Areas for Further Study ................................................................ 43
References ...................................................................................................... 44
Appendix ........................................................................................................ 45
Survey for Employers of Hispanic Workers ...................................... 45
Hispanic Worker Survey .................................................................... 47

6
List of Figures
Figure 1: Distribution of Farm Herd Size ..................................................... 10
Figure 2: Number of Farms Surveyed by County ......................................... 12
Figure 3: Number of Employees ................................................................... 13
Figure 4: Farm Workforce Composition ....................................................... 14
Figure 5: Age Distribution ............................................................................ 15
Figure 6: Education Distribution .................................................................. 17
Figure 7: How Well Workers Speak English ................................................ 18
Figure 8: Status of Spouse ............................................................................ 19
Figure 9: Status of Children .......................................................................... 20
Figure 10: Distribution of Years Working in the U.S. .................................. 21
Figure 11: Number of Employers in the U.S. ............................................... 23
Figure 12: Worker’s Reasons for Leaving Last Job ..................................... 24
Figure 13: Worker’s Reasons for Coming to Work on This Farm ............... 25
Figure 14: Distribution of Hours Worked Per Week .................................... 28
Figure 15: Job Activities Performed as Reported by Workers ..................... 29
Figure 16: Job Activities Performed as Reported by Employers .................. 30
Figure 17: Extra Benefits Provided to Worker (Worker Reported) .............. 34
Figure 18: Extra Benefits Provided to Worker (Employer Reported) .......... 35
Figure 19: Plans for the Future ..................................................................... 37
Figure 20: Plans for the Future by Marital Status ......................................... 38

7
List of Tables
Table 1: Distribution of Farms and Workers by County .............................. 11
Table 2: Distribution of Country and State of Origin of Workers ................ 16
Table 3: Average Age by Number of Years Working in the U.S. ................ 22
Table 4: Length of the Daily Work Shift ...................................................... 26
Table 5: Length of Time of Milking Shifts ................................................... 27
Table 6: Distribution of Number of Days Working Per Week ..................... 27
Table 7: Quartiles of Hourly Wage Earned Reported by Workers ............... 31
Table 8: Quartiles of Hourly Wage Earned for Milkers as Reported by Employers ....................................................................................... 31
Table 9: Quartiles of Highest Hourly Wage for Hispanic Workers as Reported by Employers ................................................................... 32

8
Introduction New York dairy farmers as well as other dairy employers across the United States have been hiring Hispanic workers for nearly 20 years. This employment relationship has proven to have positive benefits for both employers and employees. Dairy employers report that their Hispanic employees work extremely hard, are dependable and willing to learn new things. The workers express gratitude for the opportunity to work in the United States and are very motivated to support their immediate families and extended families. Numerous studies of Hispanic dairy workers were conducted about a decade ago, however, little follow-up data on Hispanic dairy workers has been reported in recent years. The primary objective of this study is to provide up-to-date information on demographic characteristics, wages, benefits and working conditions. Working conditions on New York dairies have changed since the 2005 Hispanic dairy worker study and this survey attempts to identify changes over the last 11 years. It is expected that survey results will be used in several ways. First, farm managers will use them to compare their situation with other farms. Second, agribusiness professionals will use them to better understand how workforce changes impact their business. Third, elected officials and policy makers will use it to inform immigration and other policy discussions. It is ironic that Hispanic workers make a significant contribution to the New York dairy industry, yet most of them likely are undocumented. Dairy managers who employ Hispanic workers strongly support an immigration reform policy that would provide a legalized status for current undocumented workers and provide a guest worker program for dairy workers. The future of Hispanic workers in the U.S. dairy industry is likely to be significantly impacted by future immigration policies.

9
Study Approach
The survey instrument was modeled after the 2005 Cornell Hispanic dairy worker survey. The 2016 survey included fewer questions in order to minimize the workers’ time required to respond and to allow more surveys to be conducted. The survey instrument was developed in English and then translated into Spanish by the Bilingual Dairy Extension Specialist.
A high level of trust is required to conduct a survey of this nature. The farm employers surveyed were those who tended to have larger farms, had been long-term collaborators with Cooperative Extension and when asked by the Extension Dairy Specialist, expressed a willingness to be part of this project. As a result of the trust relationship with Cooperative Extension, dairy farm employers allowed the Cornell Cooperative Extension summer intern to interview them and their employees. Contacts with individual farms were arranged by the Extension Dairy Specialist. Almost all of the on-farm interviews were conducted by the Cornell Cooperative Extension Summer Intern.
Due to concerns about literacy of the survey target audience, their willingness to complete and return a written survey and the distribution of Hispanic dairy workers in farming communities; the survey was conducted via personal interviews of workers on the farms. Targeted workers were asked and volunteered to participate, each was given the choice to be involved or not and they had the choice to withdraw from the survey at any time during the interview. The second part of the survey was directed at farm employers and conducted in personal interviews on the farm. Survey data from both employee and employer surveys were initially coded into a spreadsheet, checked for completeness and accuracy, and later exported to a SAS file for data analysis. Text responses to open-ended questions were entered, word for word, into a text file and manually analyzed, consolidated and summarized. Two hundred and five surveys of dairy farm workers were conducted across thirty-six New York dairy farms. As the survey results are presented in this report, not all responses add to 205 workers or 36 farms. In some cases, respondents failed to answer certain questions on the worker survey. Presented in this report are frequencies of responses by question. Response categories were combined in some instances for logical reporting. As a result of the selection process used for this study, the size distribution of surveyed farms is considerably different from the New York dairy sector as a whole. Statewide only 242 farms were classified as dairy farms with more than 500 lactating cows in 2012. These farms represent less than 6% of all New York dairy farms according to the census data (USDA, 2012). By comparison, the farms surveyed were substantially larger. Those with 500 cows or more represented 89% of all farms in the study. The average herd size for dairies surveyed was 1160 lactating cows. The total cows represented by surveyed farms was approximately 42,000 or almost 7% of the number of all lactating cows statewide. (USDA 2012.)

10
RESULTS Farms
A total of 36 farms in New York State were included in this study, with the sizes ranging from a minimum of 200 cows to a maximum of 2,650 cows in the herd. Almost two out of three (58.3%) of these farms had 1000 or more cows (compared to only 27% of the farms that were surveyed in 2005). Slightly fewer than one-third (30.6%) have herd sizes between 500-999 cows, and one out of ten (11.1%) have fewer than 500 cows. (See Figure 1.) The average herd size was 1160 cows.
Less than 500 cows11.1 %
500-999 cows30.6 %
1000-1999 cows47.2 %
2000 + cows11.1 %
Figure 1: Distribution of Farm Herd SizeN=36 farms

11
A total of 205 Hispanic workers were surveyed from 36 farms located across nine counties in the western region of New York State. (See Table 1 and Figure 2.)
Table 1: Distribution of Farms and Workers by County
County
Farms (N=36) Workers (N=205) Number Percent Number Percent
Cayuga 1 2.8% 3 1.5% Cortland 3 8.3% 15 7.3% Genesee 6 16.7% 25 12.2% Livingston 4 11.1% 22 10.7% Niagara 3 8.3% 25 12.2% Ontario 9 25.0% 54 26.3% Tompkins 1 2.8% 6 2.9% Wayne 1 2.8% 6 2.9% Wyoming 8 22.2% 49 23.9%

12
Figure 2: Number of Farms Surveyed by County

13
These farms employed a minimum of four and a maximum of 40 full-time workers. (This includes both local and immigrant workers). Two out of five farms (37.1%) employ 21-40 workers, another two out of four farms (45.7%) employ 11-20 workers, and the minority of farms (17.1%) employ 1-10 workers. (See Figure 3.)
Referring once more to recent Census data, dairy farms employed nearly 13,000 workers during the 2012 Census year (USDA 2012).
Figure 3: Number of Employees
N=35 farms
1-10 employees17.1%
11-20 employees45.7%
21-30 employees25.7 %
31-40 employees11.4 %

14
For seven out of ten farms (69.4%) Hispanic workers constitute between 50-100% of their total workers. In another one out of four (25%) farms, Hispanic workers constitute 25-49% of their workers, and the minority of farms (5.6%) have less than 25% of their workers who are Hispanic. (See Figure 4.)
3/4 or more Hispanic workers, 22.2%
1/2 to 3/4 Hispanic workers, 47.2%
1/4 to 1/2 Hispanic workers, 25%
Less than 1/4 Hispanic
workers,5.6%
Figure 4. Farm Workforce CompositionN=36 farms

15
Hispanic Dairy Farm Employees
The Hispanic workers ranged in age from 16 years old up to 77 years old, with a median age of 28 and an average age of 31 years old. One out of two (48.8%) of the Hispanic workers are between the ages of 22-30 years old. One out of five (21%) are between the ages of 31-40 years and another 13.6% are 41-77 years of age. (See Figure 5.)
16-21 years old16.6%
22-30 years old48.8%
31-40 years old21.0%%
41-48 years old6.3%
49-77 years old7.3%
Figure 5: Age Distribution
N = 205 workers

16
The majority, 95.6% of the Hispanic workers interviewed are male. The majority of these workers are from Mexico (80%) and the remaining 20% are from Guatemala. Those from Guatemala reported that they came from four departments, with the majority coming from two departments: Huehuetenango (61%) and San Marcos (26.8%). Conversely, those workers who are from Mexico are coming from a divergent number of states (14 in total), with one out of four (24%) coming from Oaxaca and another one out of four (27%) coming from Veracruz. There is another cluster of workers coming from Chiapas (12%) and Guerrero (15%), with the rest coming from the other 10 states. (See Table 2.)
Table 2: Distribution of Country and State of Origin of Workers N=205 workers Country # of Workers Percent Guatemala 41 20% Mexico 164 80%
Guatemala Department # of Workers Percent Huehuetenango 25 61% Quetzaltenango 4 9.8% Quiché 1 2.4% San Marcos 11 26.8%
Mexico
State # of Workers Percent Baja California 1 1% Chiapas 20 12% Guerrero 24 15% Hidalgo 7 4% México 3 2% Mexico City 1 1% Michoacán 1 1% Morelos 7 4% Nuevo León 1 1% Oaxaca 40 24% Puebla 11 7% Tabasco 2 1% Tamaulipas 1 1% Veracruz 45 27%

17
Workers were asked how many years of education they have completed. The minority (2.4%) reported they had zero years of education. One out of eight workers have up to five years of education, another one out of three (31.2%) have completed between 6-8 years of education, and one out of two (52.2%) have completed between 9-12 years of education. Few, 4.4%, reported that they had completed between 13-19 years of education. (See Figure 6.)
12.2
31.2
52.2
4.4
0 10 20 30 40 50 60
0-5
6-8
9-12
13-19
Percent
Figure 6: Education Distribution
N = 205 workers

18
Workers were asked how well they speak English, with the response options being “not very well,” “can speak some English,” and “very well.” More than one half (55.6%) of those surveyed reported that they do not speak English very well. A little more than one-third (37.6%) can speak some English, but only 6.8% said they speak English very well. (See Figure 7.)
1-Not very well55.6%
2-Can speak some English37.6%
3- Very well6.8%
Figure 7: How Well Workers Speak English
N = 205 workers

19
The workers were then asked if they had a spouse or not, and if so, where their spouse currently resides. One out of three (34.6%) of the workers do not have a spouse. Two out of three workers (65.4%) reported having a spouse. The plurality of the workers (43.4%) reported that they have a spouse who resides in their home country. Only one out of five (22%) of the workers have a spouse in the US. (See Figure 8.)
No Spouse34.6%
Spouse in home country43.4%
Spouse in US22.0%
Figure 8: Status of Spouse
N = 205 workers

20
The workers were asked if they had children, and again, if they did they were asked where their children were currently living. There were 75 workers (out of 204 who responded to this question) who have no children (or 36.8% of the workers have no children). Of those who did report having at least one child, almost three out of four (72.9%) reported that their child/children reside in their home country. Only one out of three (32.6%) had their child/children living in the US. (See Figure 9.)
72.9
32.6
0
10
20
30
40
50
60
70
80
Children in home country Children in US
Perc
ent
Figure 9: Status of Children
N = 129 workers

21
This survey asked the workers how many years they have been working in the United States. Fewer than one out of six (15.2%) of the workers are new to the United States, having worked here one year or less. The majority of the workers have been working in the United States between 2 to 10 years, with approximately one out of three (35.3%) reporting a work tenure of between 2-5 years and another approximately one out of three (30.9%) reporting a work tenure between 6-10 years. Almost one out of five (18%) of the workers have worked in the United States more than 10 years. (See Figure 10.) The average years working in the United States is 6.5 years.
15.2
35.3
30.9
11.2
6.9
0
10
20
30
40
1 year 2-5 years 6-10 years 11-15 years 16-30 years
Perc
ent
Figure 10: Distribution of Years Working in the U.S.
N = 204 workers

22
The trend appears to be that the workers are coming to the United States in their early 20’s, and then stay working in the United States. The average age of those who have been working in the United States a year or less is 23.7, and as illustrated in Table 3 below, there is an incremental increase in age that is in line with the incremental increase of years working in the United States. So those who have been working 2-5 years have an average age of 26.4 years, those working 6-10 years have an average age of 32.8 years, and those working 16-30 years have an average age of 43.2 years. This indicates that once the workers arrive in the United States in their early 20’s, they continue working, rather than coming to the United States at an older age to start working.
Table 3: Average Age by Number of Years Working in the U.S. N=204 workers
Number of Years
Working in US
Number of Workers
Average Age (years)
Standard Deviation
0-1 31 23.70 6.10 2-5 72 26.40 6.80
6-10 63 32.80 10.30 11-15 24 35.50 8.00 16-30 14 43.20 10.90

23
The workers were asked how many employers they have worked for in the United States. The majority, two out of three (60%) have worked for only one or two employers. A little more than one out of four (28.8%) have worked for three to five employers, and the minority, one out of ten (9.8%) have worked for six to nine employers. Very few (2%) have worked for more than 10 employers. For surveyed workers, changing employers is done very infrequently, with the median number of employers being only two. (See Figure 11.)
1-2 Employers, 60.0%
3-5 Employers, 28.8%
6-9 Employers, 9.8%10-20 Employers, 2.0%
Figure 11: Number of Employers in the U.S.
N = 205 workers

24
Those who indicated that this was not their first job were asked the reason they left their last job. The question allowed the worker to provide an open-ended response. Of the 158 workers who indicated this was not their first job the reasons provided were varied with no major common theme. The most frequent reason offered by almost one out of five (18.4%) of the workers was for more pay somewhere else. One out of ten said they left their last job because they were not getting enough hours to work (10.8%) and they were experiencing problems with their boss (10.1%). Very few, one out of twenty or 5.1%, said they left their last job to work with their family or friends. (See Figure 12.)
There were 104 other unprompted responses, including that they left to return home to Mexico or Guatemala by choice or by deportation (14%), that there were too many hours or too much work (10%) or that they simply wanted the experience of working elsewhere (10.6%).
18.4
10.8
10.1
7.6
5.1
66.5
0 10 20 30 40 50 60 70 80
More pay somewhere else
Not enough working hours
Problems with boss
Problems with employees
To work withfamily/friends
Other
Percent
Figure 12: Worker's Reasons for Leaving Last Job(Note: Multiple responses allowed)
N = 158 workers

25
Reasons for Coming to the Farm All workers were then asked why they came to the particular farm where they were currently working, and again were allowed to offer an open-ended response. One out of three (34.2%) of the workers stated that they came to this farm to work with friends and/or family. One out of five (21%) of the workers noted that a higher hourly wage attracted them to the farm. One out of twelve of the workers said that they could get more hours to work at this farm (7.8%), and also the reputation of the boss (7.3%) was a reason for coming to the farm. Very few (2.4%) said that they came to this farm because they had problems at their last job. (See Figure 13.) Of the 106 workers that reported a different reason for coming to the farm to work, 19% said simply that they were given a job opportunity at the farm, 8% said that they wanted to escape poverty and help their family, and 8% said that they needed to work in order to earn money.
34.2
21
7.8
7.3
2.4
58.5
0 10 20 30 40 50 60 70
To work withfamily/friends
Higher hourly wage
More hours
Reputation of boss
Problem at last job
Other
Percent
Figure 13: Worker's Reasons for Coming to Work on This Farm(Note: Multiple responses allowed)
N = 205 workers

26
Farm Duties The survey then went on to ask about the duties of the employees. In particular, how many hours is in their typical daily work shift and how many days a week they work. The length of a worker’s daily work shift ranged from a minimum of 6 hours to a maximum of 15 hours, with the majority (55.6%) working a 12-hour day. The average daily work shift is 11.3 hours. (See Table 4.)
Table 4: Length of the Daily Work Shift (hours) N=205 workers
Length of Shift
(Hours) Number of Workers
Percent
6 1 0.5% 7 2 1.0% 8 1 0.5% 9 11 5.4% 10 27 13.1% 11 41 20.0% 12 114 55.6% 13 7 3.4% 15 1 0.5%
27
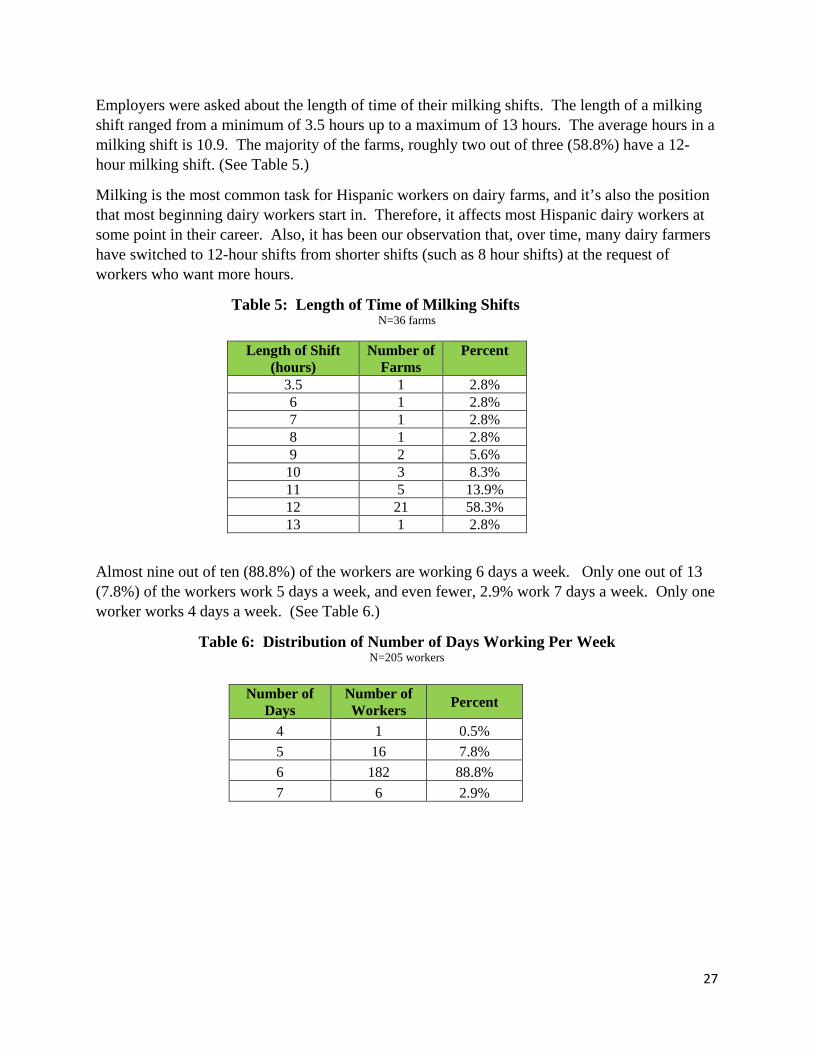
Employers were asked about the length of time of their milking shifts. The length of a milking shift ranged from a minimum of 3.5 hours up to a maximum of 13 hours. The average hours in a milking shift is 10.9. The majority of the farms, roughly two out of three (58.8%) have a 12-hour milking shift. (See Table 5.)
Milking is the most common task for Hispanic workers on dairy farms, and it’s also the position that most beginning dairy workers start in. Therefore, it affects most Hispanic dairy workers at some point in their career. Also, it has been our observation that, over time, many dairy farmers have switched to 12-hour shifts from shorter shifts (such as 8 hour shifts) at the request of workers who want more hours.
Table 5: Length of Time of Milking Shifts N=36 farms
Length of Shift
(hours) Number of
Farms Percent
3.5 1 2.8% 6 1 2.8% 7 1 2.8% 8 1 2.8% 9 2 5.6%
10 3 8.3% 11 5 13.9% 12 21 58.3% 13 1 2.8%
Almost nine out of ten (88.8%) of the workers are working 6 days a week. Only one out of 13 (7.8%) of the workers work 5 days a week, and even fewer, 2.9% work 7 days a week. Only one worker works 4 days a week. (See Table 6.)
Table 6: Distribution of Number of Days Working Per Week N=205 workers
Number of
Days Number of Workers Percent
4 1 0.5% 5 16 7.8% 6 182 88.8% 7 6 2.9%

28
The workers were asked three questions about hours worked per week: 1) how much they actually worked, 2) how much they would like to work, and 3) the minimum hours they need to work in order to keep them from looking for another job. On average, workers insisted on working at least 57 hours per week, are actually working 67.2 hours per week, and would like to work 67.6 hours per week. So the employees are actually working the number of hours they would like to work. Very few employees (1%) are working 40 hours or less. The majority of the workers are either working 61-70 hours per week (37.6%) or are working 71+ hours per week (39%). One out of five (21.5%) of the workers reported that they are working between 51-60 hours per week. (See Figure 14.)
1 1
21.5
37.6 39
1.54.4
20
32.2
42
17.122
26.3
1915.6
0
10
20
30
40
50
60
70
80
90
100
40 hours or less 41-50 hours 51-60 hours 61-70 hours 71+ hours
Perc
ent
Figure 14: Distribution of Hours Worked Per Week(employee-reported, N = 205 workers)
Reported (%) Would Like to Work (%) Insist on working (%)
Mean = 67.2 hours 67.6 hours 57 hours

29
Workers were presented with a list of eight specific job tasks and asked which jobs they currently performed. The majority (64.9%) of the workers perform milking as part of their current job activities. One out of two are cow pushers (49.8%), and help with calving (48.8%). Approximately one out of three (36.1%) feed calves and manage the youngstock. Almost one out of four (23.4%) are herdsmen, and one out of eight (12.8%) feed cows. Very few (5.9%) are breeders or hoof trimmers. (See Figure 15.)
64.9
49.8 48.8
36.1
23.4
12.85.9 5.9
22.9
0
10
20
30
40
50
60
70
80
90
100
Perc
ent
Figure 15: Job Activities Performed as Reported by Workers(Note: Multiple responses allowed)
N = 204-205 workers

30
The employers were asked if they had Hispanic workers working in positions with advanced responsibilities other than milkers. The majority reported that their Hispanic workers are responsible for the maternity pen (94.4%), as well as being herdsmen (86.1%) and feeding calves (77.8%). Approximately one out of three farms have their Hispanic workers also feeding cows (36.1%) and breeding (33.3%). One out of six farms (16.1%) also have their Hispanic workers working as hoof trimmers. (See Figure 16.)
A total of 19 employers also provided responses for other job duties; of these 37% reported having workers cleaning stalls and barns, 16% reported adding bedding material, and 11% reported bunker silo packing.
36.1
77.8
33.3
16.1
94.486.1
61.1
0102030405060708090
100
Perc
ent
Figure 16: Job Activities Performed as Reported by Employers(N=36 farms)

31
Compensation Data regarding workers’ hourly wages were reported by both workers and employers. When asked of the workers what they are currently paid per hour, they reported an average hourly wage of $10.30 (which is between the lowest and highest average hourly wage reported by the employers). The survey showed the first/lowest quartile earning $8.50-$9.44/hour, the second quartile earning $9.50-$9.74/hour, the third quartile earning $9.75-$10.99/hour and the fourth quartile/highest paid workers earning $11.00-$18.00/hour. At least one worker reported a pay rate under the 2016 State minimum of $9.00 per hour. However, the actual rate could be higher when allowances or deductions are taken into account. (See Table 7.)
Table 7: Quartiles of Hourly Wage Earned as Reported by Workers
N=205 workers
Hourly Wage 1st Quartile $8.50-$9.44 2nd Quartile $9.50-$9.74 3rd Quartile $9.75-$10.99 4th Quartile $11.00-$18.00
Mean $10.30 Standard Deviation $1.42
Employers were asked about the starting hourly pay rate and the highest hourly pay rate for milkers only. On average, these workers’ starting hourly wage was nearly $9.34 per hour (which is above the $9.00 per hour minimum wage), with the first/lowest quartile earning $9.00/hour, the second quartile earning $9.01-$9.24/hour, the third quartile earning $9.25-$9.49/hour and the fourth quartile/highest paid workers earning $9.50-$11.00/hour. Similarly, on average, the highest hourly pay rate for milkers was $11.05, with the first/lowest quartile earning $9.00-$9.99/hour, the second quartile earning $10.00-$10.49/hour, the third quartile earning $10.50-$11.74/hour and the fourth quartile/highest paid workers earning $11.75-$15.75/hour. (See Table 8.)
Table 8: Quartiles of Hourly Wage Earned for Milkers as Reported by Employers N=36 farms
Starting Hourly
Wage Highest Hourly Wage 1st Quartile $9.00 $9.00-$9.99 2nd Quartile $9.01-$9.24 $10.00-$10.49 3rd Quartile $9.25-$9.49 $10.50-$11.74 4th Quartile $9.50-$11.00 $11.75-$15.75 Mean $9.34 $11.05 Standard Deviation $0.44 $1.44

32
The employers were also asked what the highest hourly pay rate is for any Hispanic employee on their farm. The average hourly rate for the highest paid Hispanic employee on their farms was $12.94. The first/lowest quartile earning $9.50-$10.75/hour, the second quartile earning $10.76-$12.14/hour, the third quartile earning $12.15-$13.00/hour and the fourth quartile/highest paid Hispanic workers earning $13.01-$26.00/hour. (See Table 9.)
Table 9: Quartiles of Highest Hourly Wage for Hispanic Workers as Reported by Employers
N=36 farms
Hourly Wage 1st Quartile $9.50-$10.75 2nd Quartile $10.76-$12.14 3rd Quartile $12.15-$13.00 4th Quartile $13.01-$26.00 Mean $12.94 Standard Deviation $3.26

33
Benefits Workers were asked to identify, out of a list of eight “extra benefits,” which ones were provided by their employer and either paid by their employer, paid by them, or the cost is shared, and which were not applicable to them/or they did not receive. They were also given an opportunity to list any other benefits that were not included on this list. Eight out of ten (79%) of the workers reported that they received employer-paid housing, another one out of ten share the cost of housing with their employer, and one out of eight (12.2%) pay for their own housing. Other additional benefits available to at least nine out of ten workers include utilities (81% have it paid by their employer, 13.2% pay for it themselves, and 5.9% share the cost), cable/TV (48.3% have it paid by their employer, 40.5% pay for it themselves, and 1% share the cost), and Wi-Fi/ Internet (39% have it paid by their employer, 28.8% pay for it themselves, and 32.2% share the cost). Two out of three employees (64.9%) receive employer-paid bonuses. More than half (58%) have garden space (46.8% have it paid by their employer and 11.2% pay for it themselves). Roughly one out of three receive employer-paid beef (33.3%) and transportation (35.6%). Another one out of five employees have transportation that they pay for themselves. Approximately one out of five (18.1%) also reported receiving other forms of employer-paid benefits. (See Figure 17.)
Forty-two workers said that they received benefits other than the ones listed. The most commonly reported other benefit was vacation or paid vacation (64%). Another 7% reported receiving extra holiday pay.

34
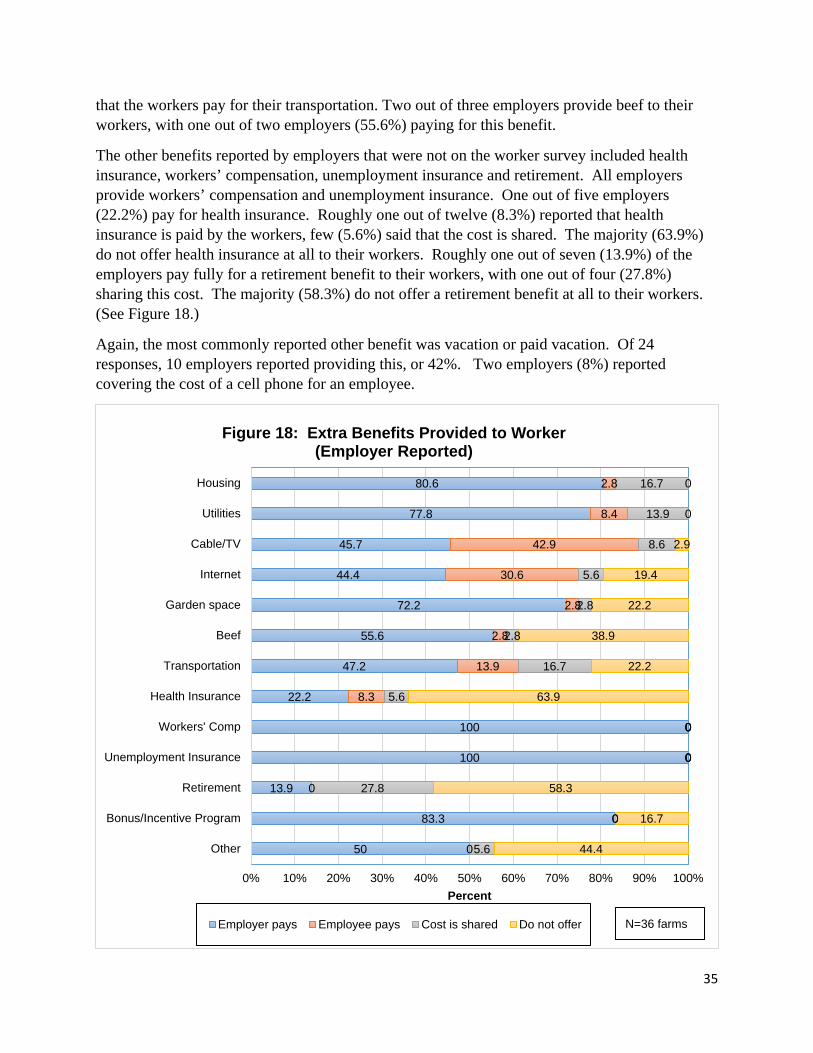
The employers were asked a similar question: to list any additional benefits their employees receive. They were provided a list of 12 “additional benefits” and asked if they provided it, and if so, if they (the employer) paid for it, their employee paid for it, or they shared the cost. Eight of the 12 benefits were the same as what was asked on the worker survey to allow for a comparison. They were also given an opportunity to list any other benefits that were not included on this list. Consistent with what the workers noted, eight out of ten of the employers reported that they offer paid housing to their workers (80.6%) and utilities (77.8%). The cost of housing is shared by 16.7% of the employers and for utilities by 13.9% of the employers. Only 2.8% of the workers’ pay for their own housing and 8.4% pay for their own utilities. More than four out of five employers also offer cable/TV, Internet, garden space, transportation, and a bonus/ incentive program. Broken down further, one out of two employers pay for cable/TV (45.7%) and Internet (44.4%), with 42.9% saying their workers pay for their cable/TV and 30.6% saying their workers pay for their Internet. Four out of five employers (83.3%) pay for a bonus or incentive program. Three out of four employers (72.2%) provide for garden space for their workers. One out of two employers pay for transportation, with one out of six (16.7%) sharing the cost of transportation with their workers, and one out of seven (13.9%) of employers stating
79
81
48.3
39
46.8
33.3
35.6
64.9
18.1
12.2
13.2
40.5
28.8
11.2
1.5
19.5
0
0
8.8
5.9
1
32.2
1
0.5
3.4
0
0.5
0
0
10.2
0
41
64.7
41.5
35.1
81.5
0% 10% 20% 30% 40% 50% 60% 70% 80% 90% 100%
Housing
Utilities
Cable/TV
Wifi/Internet
Garden space
Beef
Transportation
Bonus
Other
Percent
Figure 17: Extra Benefits Provided to Worker (Worker Reported)
Employer pays Employee Pays Cost is Shared Do Not Receive N = 204-205 workers
35
that the workers pay for their transportation. Two out of three employers provide beef to their workers, with one out of two employers (55.6%) paying for this benefit.
The other benefits reported by employers that were not on the worker survey included health insurance, workers’ compensation, unemployment insurance and retirement. All employers provide workers’ compensation and unemployment insurance. One out of five employers (22.2%) pay for health insurance. Roughly one out of twelve (8.3%) reported that health insurance is paid by the workers, few (5.6%) said that the cost is shared. The majority (63.9%) do not offer health insurance at all to their workers. Roughly one out of seven (13.9%) of the employers pay fully for a retirement benefit to their workers, with one out of four (27.8%) sharing this cost. The majority (58.3%) do not offer a retirement benefit at all to their workers. (See Figure 18.)
Again, the most commonly reported other benefit was vacation or paid vacation. Of 24 responses, 10 employers reported providing this, or 42%. Two employers (8%) reported covering the cost of a cell phone for an employee.
50
83.3
13.9
100
100
22.2
47.2
55.6
72.2
44.4
45.7
77.8
80.6
0
0
0
0
0
8.3
13.9
2.8
2.8
30.6
42.9
8.4
2.8
5.6
0
27.8
0
0
5.6
16.7
2.8
2.8
5.6
8.6
13.9
16.7
44.4
16.7
58.3
0
0
63.9
22.2
38.9
22.2
19.4
2.9
0
0
0% 10% 20% 30% 40% 50% 60% 70% 80% 90% 100%
Other
Bonus/Incentive Program
Retirement
Unemployment Insurance
Workers' Comp
Health Insurance
Transportation
Beef
Garden space
Internet
Cable/TV
Utilities
Housing
Percent
Figure 18: Extra Benefits Provided to Worker (Employer Reported)
Employer pays Employee pays Cost is shared Do not offer N=36 farms

36
Job Satisfaction The workers were then asked a series of open-ended about their job satisfaction. Some respondents gave more than one answer for each question. All 205 workers responded to the following job satisfaction questions:
What are the most difficult things about your job?
The plurality of workers (44%) said that nothing was difficult or that everything was good. Another 8% stated that communication in general and especially understanding English and communicating with Americans was the most difficult. Understandably, 7% reported that assisting during calvings was difficult, especially when there were many cows giving birth at the same time. A few, 5%, stated that milking was the most difficult part of their job, some bringing up the long shift and others citing the difficulty of training young cows to milk the first time they entered the milking parlor. Another common response (5%) was that taking care of calves, and specifically sick calves, was the most difficult part of their job.
What things do you like the most about your job?
The plurality of workers (37%) said that they liked everything, or almost everything about their job. The next most common response reported by one out of five (21%) workers was that they enjoyed milking. Pushing cows (9%) was a repeated answer, along with taking care of calves (6%), and treating sick cows (4%).
What could your employer do to make your job better?
The most common response from workers (42%) was that their boss couldn’t do anything to improve their job, or that everything was good. The next most common responses were that the boss could improve things by paying more (9%), or by teaching them new things like how to drive a tractor or treat sick cows (8%). Another 3% reported that they didn’t know, or that they were too new to the job to know.
What do you like about your boss?
The majority (53%) said that their boss is a good person. For example, “he’s friendly,” “treats us well,” “has a good heart.” Another prevalent answer from 8% of the workers was that “he’s always available,” “attentive,” or “helpful to workers.” Also a prevailing response (7%) was that the boss is understanding or supportive. Interestingly, the next two most common responses pointed out things that they appreciated that their boss did not do. A few, 5%, liked best that the boss doesn’t fight, yell, scold or get mad, and another 5% liked that he behaves like a boss and doesn’t fool around.

37
Future Plans When asked about their plans for the future, two-thirds (60.5%) of the workers surveyed said that they plan to work here for a time and then eventually return to their home country. Two out of five (39.5%) of the workers would like to stay in the United States long term. (See Figure 19.)
Looking at the responses broken down by marital status, workers with a spouse in the United States are four and a half times more likely to plan to stay long term (86.7% vs. 19.1% planning to return home). The majority (80.9%) who left a spouse behind, plan to return to their home country. Of those who are not married, two-thirds (64.8%) plan to return home. (See Figure 20.)
Live in US long term
39.5%
Work for a time and return home
60.5%
Figure 19: Plans for the Future
N = 205 workers

38
35.2
19.1
86.7
64.8
80.9
13.3
0
10
20
30
40
50
60
70
80
90
100
No spouseSpouse in home countrySpouse in US
Perc
ent
Figure 20: Plans for the Future by Marital Status
Live in US Long Term Work for a while and return home
N = 205 workers

39
Discussion & Implications
For almost two decades Hispanic workers, mostly from Mexico and Guatemala, have been a valued part of the dairy workforce in New York State. A 2009 Cornell study estimated that there were 2600 dairy workers in New York State (Maloney and Bills 2011). The number of Hispanic workers in New York is likely higher than that today. The employment relationship between Hispanic dairy workers and their dairy employers is highly valued by both parties. Workers often come from rural villages in Mexico and Guatemala and have little opportunity to find a high-paying job. A dairy job in New York allows the workers to make far more money than they would in their home country and provide valuable support to their extended family at home. Likewise, dairy farm employers in New York benefit by having the opportunity to employ productive, dedicated workers. Over time, dairy employers have come to rely heavily on Hispanic workers and speak highly of their hard work and dedication. For example, in a University of Wisconsin study the dairy farmer was quoted as follows: “I have not been able to hire an American citizen since 1997. The way I see it if we didn't have Hispanics to rely on as a workforce I don't think I could continue farming." (Harrison and Lloyd 2009)
Importance of Hispanic Employees to New York Dairies
Hispanic dairy workers are typically employed in the most physically demanding jobs on the farm, particularly milking and working with the dairy herd. There are increasing anecdotal reports from dairy producers that local U.S. workers are either unwilling or unable to meet the performance standards of these dairy farm jobs. One significant finding in this survey was the extent that the dairy employers surveyed rely on Hispanic workers over domestic workers. On almost two thirds of the farms surveyed, Hispanic workers comprised more than 50% of the workforce. This is important because in recent years fewer Mexican and Guatemalan workers have migrated to the United States, making it harder to hire Hispanic workers today. More importantly, many of the Hispanic workers currently working on U.S. dairies are likely undocumented. As a result, if employers were to lose most or all of their Hispanic workers at one time it would be difficult if not impossible to complete all the job responsibilities on the farm in a timely manner. The second factor related to Hispanic worker availability is the aging of the Hispanic workforce. For example, the 2005 Hispanic dairy workers study indicated that 39% of the workers were between the ages of 16 and 21 compared to this survey where only 16.6% rate in this age group. As workers age it is likely that they will be less able and willing to do labor-intensive jobs like milking.
Clearly Hispanic workers are the workforce of choice on many U.S. dairies yet there are no guarantees that this workforce will be available in the future to the extent that it has been in the last 20 years. U.S. immigration policy will have a lot to do with creating future opportunities for Hispanic workers to continue to work on U.S. dairies. The dairy industry nationally is united in its desire to see immigration reform with two key parts; an opportunity for undocumented workers who are currently here to attain legalized status and a guest worker program that would

40
include dairy workers. The current H-2A program is for seasonal workers only with no opportunity for dairy farm employers to participate.
Importance of Family and Social Networks
The high level of importance placed on relationships with family and close friends in Latino cultures is well-documented. Most Hispanic dairy workers in New York come to the United States to make as much money as possible and they send a significant portion of their earnings to family members in their home country. Many of the workers surveyed have spouses and children, some in the United States, some in their home country. It is common in Latino cultures for men to leave home for a job to support their immediate family as well as the extended family.
The desire to support family members at home often drives the number of hours per week that Hispanic workers are willing to work. When asked about hours worked, survey participants reported that they worked an average of 67.2 hours per week. They also reported that on average they wanted to work 67.6 hours per week. Further, they indicated that if they did not have the opportunity to work at least 57 hours a week that they would look for another job. The overwhelming majority (88.8%) reported working six days per week.
In addition to hours per week, survey participants were also asked about the length of milking shifts. Twelve-hour milking shifts are common with 55.6% of the workers reporting that they worked a 12-hour shift. Again, it is likely that the workers desire and ask for long work shifts to maximize the amount of their weekly pay check and send more of their paycheck to family members in their home country.
In the U.S. national discussion on immigration reform, the issue of uniting immigrant family members is often raised. This study indicates that some of the survey participants are separated from their family members who remained at home. Ohers had family members with them here in the United States. Sixty-five percent of the workers surveyed reported having a spouse, with 43% reporting they have a spouse in their home country and 22% having a spouse in the United States. Almost two thirds of the workers reported having children. Of those reporting children 72.9% indicated the children were in their own country and 32.6% indicated that they had at least one child in the United States.
Another indicator of strong social networks is the concentration of workers that come from specific areas in Mexico and Guatemala. For example, there were four states in Mexico and one state in Guatemala which 20 or more workers call home. Very likely one important reason for high concentrations from one state in the sending country is networking between workers. When one Hispanic worker has a job very often he will help another family member or friend find a job on the same farm or a nearby farm. When the Hispanic workers in the survey were asked why they came to work on this farm 34% responded that they came to work with family members or friends.

41
Language and Communication
A language barrier exists on many of the farms studied. Workers participating in this survey were asked how well they speak English. More than half of the workers reported that they did not speak English very well. Only 6.8% reported that they speak English very well.
This lack of adequate language skills has implications for Hispanic workers and dairy employers. The most obvious implication is that it leaves the door open for workplace mistakes because the employee did not understand important information related to the job. For the workers, lack of English skills may limit their job responsibilities and their ability to be trained for more advanced positions within the business. It also means that they are reliant on a bilingual coworker or manager to interpret for them. For dairy employers who do not speak Spanish, lack of English skills among the workers means a considerable commitment to providing workplace instructions and information in Spanish through interpreters, or consultants who translate important job-related information into Spanish. It may also mean that hired interpreters are utilized during critical workplace conversations such as training, performance review and problem solving.
Ultimately, the decision and motivation to learn English rests with the worker and his/her desire to put forth the effort required to learn another language. Employers can encourage their workers to learn English by offering to pay for instructional materials or English classes and providing transportation to classes off the farm. Employers who encourage their Spanish-speaking employees to learn English often are rewarded with employees who are more effective at communicating in the workplace. Likewise, workers who learn English are rewarded with opportunities for advancement with their current employer as well as potential future employers.
Job Responsibilities
Hispanic workers employed on dairy farms often perform the most physically demanding jobs in the business and some are assuming management-related tasks. Hispanic workers in this survey reported that the top five positions they performed were milker (64.9%), cow pusher (49.8%), help with calving (48.8%), calf feeder/young stock manager (36.1%), and herdsman/assistant herdsman (23.4%). Employers were asked if they had Hispanic employees working in positions with advanced responsibilities other than milking. All employers indicated that they did have advanced responsibilities. They included cow feeder, calf feeder, breeder, hoof trimmer, maternity pen worker, herdsman or assistant herdsman. This advancement to management responsibilities likely reflects two things. First, it reflects the fact that nearly 50% have been working on some dairy farm for more than six years. Second, in previous surveys Hispanic workers have indicated a desire for job advancement and this survey indicates that many have assumed advanced job responsibilities and likely earned higher pay.

42
Compensation
Dairy farm employee wages are heavily impacted by two factors: pay rates of neighboring employers (both farm and nonfarm) and required minimum wage rates. Minimum wage rates are important in New York because they have gone up incrementally each year since 2013. As of December 31, 2015 minimum wage rate was $9.00 per hour. As a result of new legislation in 2016 the minimum wage will go up incrementally each year to $12.50 (for Upstate NY workers) by 2020. These increases will undoubtedly push up the average wages for dairy workers in the years ahead as well as increase total labor costs on New York dairies.
The survey indicated that the average wage rate for Hispanic milkers was $9.24 per hour and the average of the highest hourly wage rate for this category was $11.05. When the hourly wages of all Hispanic workers in this survey were totaled, the average wage was $10.30 per hour, while the average of the highest hourly wage for this category was $12.94.
The New York dairy farm employers surveyed provided a range of benefits depending upon the farm. The most commonly provided benefits were housing, utilities, cable TV, Internet, garden space, and a cash bonus.
Nearly 80% of the workers reported that they received housing as a benefit. This is significant because even though dairy workers may not make as much as workers in non-farm jobs, having housing provided by the employer often adds substantially to the value of the workers’ wages and benefits.
Worker Retention
The Hispanic workers currently on the farms studied tended to be older than the workers in the 2005 study (Maloney and Grusenmeyer, 2005). For example, those 16-21 years of age represented 39% of the workers surveyed in 2005 compared to only 17% of the workers surveyed in 2016. Almost half of the workers surveyed have been working in the United States for six or more years with 60% of the workers reporting only one or two employers. The implication is that these workers are staying in the United States longer and staying with their employer longer. This demonstrates the importance the workers place on having a job in the United States and many are very loyal to their current employer.
Hispanic Workforce Trends
The 2016 Hispanic worker survey reported here was modeled after and included some of the same questions as the 2005 Hispanic dairy workers survey (Maloney and Grusenmeyer 2005).
There are noticeable differences between the 2016 and 2005 surveys. In 2016, 58.3% of the farms had 1000 or more cows compared to only 27% of the farms that were surveyed in 2005. In 2005 44% of workers reported not having a spouse, compared to 34.6% in 2016. In 2005 41% of the workers reported leaving their previous job for better pay, compared to only 18.4% in 2016. Workers in the 2016 survey were noticeably older. For example, in 2016 16.6% were between the ages of 16 and 21 and in 2005, 39% are between the ages of 16 and 21.

43
Suggested Areas for Further Study
1. Increased Responsibility and Job Advancement
In this study workers expressed interest in learning new tasks on the farm. Figure 15 shows that while 64.9% of employees are milkers, there are currently many workers employed in higher skilled positions such as breeder, cow feeder, calf feeder, hoof trimmer and herdsman. How can we encourage these workers to continue to grow within the dairy industry? What are the barriers that keep Hispanic workers from advancement and how can we overcome them?
2. Retention
How do we retain the skilled workforce that we have? Employee retention is an issue today, and is likely to become an even greater issue if future immigration policy allows for the current undocumented dairy workers to achieve legal status. If current dairy workers were granted legal status, would they continue employment on dairy farms, or look for employment elsewhere?
3. Recruitment
Current recruitment methods are informal, frustrating, and often fail to provide farms with an adequate supply of legal and qualified workers. How will foreign-born agricultural workers be recruited in the future? How should a guest worker program be structured to fit the needs of both agricultural workers and their employers?
4. Compensation
Farm managers will be increasingly challenged to provide competitive wages and benefits in order to retain productive, satisfied workers. What is the cost of a competitive wage and benefit package, and how do dairy employers structure their businesses in order to compete in a competitive labor market?
5. Language For Hispanic workers, inability to speak English can limit their potential in two ways. First, it may limit their day-to-day performance if the language barrier is not properly addressed. Second, it may limit opportunities for job advancement. Managers and workers need to continue to find ways to address the language barrier.

44
References
Harrison, J., S. Lloyd, and T. O’Kane. 2009. Briefing no. 1: Overview of Immigrant Workers on Wisconsin Dairy Farms. Changing Hands: Hired Labor on Wisconsin Dairy Farms, University of Wisconsin – Madison, February. Maloney, T. and N. Bills. 2011. Survey of New York Dairy Farm Employers 2009. RB 2011-01, Dyson School of Applied Economics and Management, Cornell University, February. Maloney, T. and D. Grusenmeyer. 2005. Survey of Hispanic Dairy Workers in New York State, RB 2005-02, Department of Applied Economics and Management, Cornell University, February. U.S. Department of Agriculture. 2012 Census of Agriculture.

45
APPENDIX
Survey for Employer of Hispanic Workers ID: |___|___|
Farm Name Individual Surveyed: County Cell#:
1. Number of milking cows at this location: |___|___|___|___|
2. On average, how many employees do you have at this location? |___|___|
3. On average, how many of those employees are Hispanic? |___|___|
4. What is your starting hourly pay rate for milkers? $ |___|___|.|___|___| per hour
5. What is the hourly pay rate for your highest paid milker? $ |___|___|.|___|___| per hour
6. What is the length of time of your milking shifts? |___|___| hours
7. Other than milkers, do you have Hispanic employees working in positions with advanced responsibilities? (Circle one response for each position.)
Position: Yes No a. Cow Feeder 1 0 b. Calf Feeder/Youngstock Manager 1 0 c. Breeder 1 0 d. Hoof Trimmer 1 0 e. Help with Calving 1 0 f. Herdsman/Assistant Herdsman 1 0 g. Other 1 0
If answered NO to ALL questions in 7 above, go to question 9.
8. What is the highest hourly pay rate for any Hispanic employee on your farm?
$ |___|___|.|___|___| per hour

46
9. Do your employees receive any additional benefits? (Circle one response for each
benefit.)
Benefit Employer Pays Employee Pays Cost is Shared Do Not Offer
a. Housing 1 2 3 8 b. Utilities 1 2 3 8 c. Cable/TV 1 2 3 8 d. Internet 1 2 3 8 e. Garden space 1 2 3 8 f. Beef 1 2 3 8 g. Transportation 1 2 3 8 h. Health Insurance 1 2 3 8 i. Worker’s Comp 1 2 3 8 j. Unemployment Insurance
1 2 3 8
k. Retirement 1 2 3 8 l. Bonus/Incentive Program 1 2 3 8 m. Other:______________ 1 2 3 8

47
Encuesta de Trabajadores Hispanos Hispanic Worker Survey
ID: |___|___|___|
Farm Name First Name of Worker: County
Part I Demográficos / Demographics
1. El número de vacas en leche en este rancho. Number of milking cows at this location:
|___|___|___|___| [Interviewer: if worker does not know, please find out from another source and enter here]
2.¿Cuántos años tiene usted? What is your age? |___|___| Años / years
3. ¿De dónde es usted? Where are you from?
País / Country: ____________________ Estado / Departamento / State / Department: ____________________ Pueblo / Village: _____________________
4.Sexo (Hacer un círculo alrededor de un número) Sex (circle one number)
1-Masculino / Male 2-Femenino / Female
5.¿Cuántos años de educación ha cumplido usted? (Hacer un círculo alrededor de un número.)
How many years of schooling have you completed? (Enter number of years.)
|___|___| Años / years

48
6.a. ¿Tiene usted esposo/a? (Hacer un círculo alrededor de un número.)
Do you have a spouse? (Circle one number.):
1- Si /Yes 0 – No- vaya a la pregunta 6b. /No – go to question 6b.
¿Dónde está su esposo/a? (Hacer un círculo alrededor de una respuesta para cada uno.) Where is your spouse? (circle one response for each):
Sí / Yes No
a. En su país/In your home country 1 0 b. Aquí en EEUU/Here in the U.S 1 0 c. No sé dónde está mi esposo/a. I do not know
where my spouse is 1 0
b. ¿Usted tiene hijos? (Hacer un círculo alrededor de un número.)
Do you have children? (Circle one number.):
1- Si /Yes 0 – No- vaya a la pregunta 7. /No – go to question 7.
¿Dónde están sus hijos? (Hacer un círculo alrededor de una respuesta para cada uno.) Where is/are your children? (circle one response for each):
Sí / Yes
No
a. En su país/In your home country 1 0 b. Aquí en EEUU/Here in the U.S 1 0
7.¿Cuántos años lleva usted trabajando en los EEUU? (Si menos que 1 año, apunte 1)
How many years have you been working in the United States? (If less than 1 year, please enter 1).
|___|___| Años / years
8.¿Para cuántos patrones ha trabajado en los EEUU?
How many employers have you worked for in the U.S.? |___|___|
9.¿Por qué dejó usted su trabajo anterior? (Hacer un círculo alrededor de una respuesta para cada razón.)
Why did you leave your last job? (Circle one response for each reason.)
El razón que dejó su trabajo anterior / Reason for leaving last job Sí / Yes No a. Problemas con el patrón / Problems with boss 1 0 b. Problemas con otros empleados / Problems with employees 1 0 c. Más pago en otro lugar / More pay somewhere else 1 0 d. Para trabajar con familia/amigos / To work with family/friends 1 0 e. No habían bastantes horas de trabajo / Not working enough hours 1 0 f. Otro- explicar: / Other – specify:___________________________ 1 0

49
10.¿Por qué vino usted a esta finca para trabajar? (Hacer un círculo alrededor de una respuesta para cada razón.) Why did you come to this farm to work? (Circle one response for each reason.)
El razón que vino a éste rancho / Reason to come to this farm Sí / Yes
No
a. Para trabajar con familia y amigos / To work with family and friends 1 0 b. Más pago por hora / Higher hourly wage 1 0 c. Más horas de trabajo / More hours 1 0 d. La reputación del patrón / Reputation of boss 1 0 e. Problemas en su lugar de trabajo / Problem at last job 1 0 f. Otro- explicar: / Other-specify: 1 0
11.¿Cuánto inglés habla usted? (Hacer un círculo sobre el número de la respuesta correcta.)
How much English do you speak? (Circle the number of the appropriate response.)
No muy bien / Not very well
Puedo hablar inglés un poco de ñol / Can speak some English
Muy bien / Very well
1 2 3
12. Planes para el futuro. Marque la opción que usted espera hacer.
Plans for the future. Circle the number of the option you hope to do.
1. Vivir en EEUU por el largo plazo. / Live in the United States long term. 2. Trabajar aquí un tiempo y regresar a su casa. / Work here for a time and return home.
13.¿Cuántas horas trabaja al día?
How long is your daily work shift? |___|___| horas / hours
14.¿Cuánto está ganando por hora?
How much are you being paid per hour? $ |___|___|.|___|___| por hora / per hour

50
15.¿Recibe algún beneficio extra? (Hacer un círculo alrededor de una respuesta para cada beneficio).
Do you receive any extra benefits? (Circle one response for each benefit.) Beneficio / Benefit Empleador
lo paga Employer
Pays
Empleado lo paga
Employee Pays
El costo es compartido
Cost is Shared
No lo Recibe Do Not Receive
a.Casa / Housing
1 2 3 8
b.Luz y Calificación / Utilities
1 2 3 8
c.Televisión / Cable/TV
1 2 3 8
d. Internet/ Wifi / Internet
1 2 3 8
e.Espacio para un huerto / Garden space
1 2 3 8
f. Carne / Beef
1 2 3 8
g. Transporte / Transportation
1 2 3 8
h.Bono/ Bonus __________________
1 2 3 8
i. Otro- explicar: / Other-specify:________________
1 2 3 8
16¿Cuál es su trabajo ahora? (Marque todos que le apliquen).
What is your current job? (Circle one response for each position.)
Puesto / Position Sí Yes
No
a.Ordeñador / Milker 1 0 b.Arreador/Puchador / Cow pusher 1 0 c.Alimentar Vacas / Cow feeder 1 0 d. Alimentar/Cuidar Becerras/Vaquillas / Calf feeder/Youngstock Manager 1 0 e.Inseminar – Breeder 1 0 f. Casquero/Patero / Hoof Trimmer 1 0 g.Ayudar con los Partos / Help with Calving 1 0 h.Encargado del Hato/Ayudante al Encargado / Herdsman/Assistant Herdsman 1 0 i.Otro/ Other 1 0

51
17. ¿Cuántos días trabaja en una semana regular? Typically, how many days a weeks do you work? |___| días/semana days/week 18. ¿Cuántas horas trabaja por semana?
How many hours a week do you work? |___|___|___| horas/semana hours/week
19, ¿Cuántas horas por semana le gustaría trabajar?
How many hours a week would you like to work? |___|___|___| horas/semana hours/week
20. ¿Cuál es el mínimo número de horas que necesita usted trabajar antes de buscar otro trabajo?
What is the minimum number of hours you need to work before you look for another job?
|___|___|___| horas/semana hours/week
Parte II Satisfacción Laboral/ Part II Job Satisfaction
21.¿Qué son las cosas más difíciles de su trabajo?
What are the most difficult things about your job?
22.¿Qué son las cosas que le gusta más de su trabajo?
What things do you like the most about your job?

52
23.¿Qué puede hacer el patrón para hacer mejor su trabajo?
What could your employer do to make your job better?
24.¿Qué le gusta de su patrón?
What do you like about your boss?
¡Gracias por completar la encuesta! Thank you for completing this survey!

EB No Title Author(s)
OTHER A.E.M. EXTENSION BULLETINSFee
(if applicable)
Dairy Farm Business Summary, New York DairyFarms, 300 Cows or Fewer, 2015
Knoblauch, W., Dymond, C., Karszes, J.2016-11
Cost of Loading, Mixing, & Delivering FeedNew York State, 2014-2015
Karszes, J. and Howlett, A.2016-10
The Economic Contributions of Agriculture inNew York State (2014)
Schit, Todd M.2016-09
Dairy Farm Business Summary, Northern NewYork Region, 2015
Knoblauch, W., Dymond, C., Karszes,J., Howland, B., Murray, P., Manning, J.and Kimmich, R.
2016-08 ($16.00)
Dairy Farm Business Sumarry, Hudson andCentral New York Region, 2015
Knoblauch, W., Dymond, C., Karszes,J., Howland, B., Buxton, S., Kiraly, M.,Kimmich, R., Shoen, K., and Overton, R.
2016-07 ($16.00)
An Analysis of Opportunities For Food HubDevelopment In Northern New York
Severson, R., Schmit, T., and Shin, P.2016-06
Business Transfer Guide for the JuniorGeneration
Richards, S., Shipman, L., Welch, D.and Leubner, E.
2016-05
Dairy Farm Business Summary, Western NewYork Region, 2015
Knoblauch, W., Dymond, C., Karszes,J., Howland, B., Hanchar, J., Petzen, J.,Overton, R., and Kimmich, R.
2016-04 ($16.00)
Dairy Farm Business Summary, New YorkLarge Herd Farms, 300 Cows or Larger, 2015
Karszes, J., Knoblauch, W. andDymond, C.
2016-03 ($20.00)
Potential Impacts of Minimum Wage Increaseson New York Dairy Farms
Ifft, J. and Karszes, J.2016-02
Cost of Establishment and Production of ColdHardy Grapes in the Chautauqua Region ofNew York - 2015
Oh, D., Kananizadeh, S., Gomez, M.,Martin, K.
2016-01
Workforce Issues: Profiles of Specialty CropFarms in New York State
Maloney, T., Smith, M., Saputo, R. andB. Rickard
2015-13
Paper copies are being replaced by electronic Portable Document Files (PDFs). To request PDFs of AEM publications, write to (be sure toinclude your e-mail address): Publications, Department of Applied Economics and Management, Warren Hall, Cornell University, Ithaca,NY 14853-7801. If a fee is indicated, please include a check or money order made payable to Cornell University for the amount of yourpurchase. Visit our Web site (http://dyson.cornell.edu/outreach/#bulletins) for a more complete list of recent bulletins.

EB No Title Author(s)
OTHER A.E.M. EXTENSION BULLETINS
Fee(if applicable)
Dairy Farm Business Summary, New York DairyFarms, 300 Cows or Fewer, 2015
Knoblauch, W., Dymond, C., Karszes, J.2016-11
Cost of Loading, Mixing, & Delivering FeedNew York State, 2014-2015
Karszes, J. and Howlett, A.2016-10
The Economic Contributions of Agriculture inNew York State (2014)
Schit, Todd M.2016-09
Dairy Farm Business Summary, Northern NewYork Region, 2015
Knoblauch, W., Dymond, C., Karszes,J., Howland, B., Murray, P., Manning, J.and Kimmich, R.
2016-08 ($16.00)
Dairy Farm Business Sumarry, Hudson andCentral New York Region, 2015
Knoblauch, W., Dymond, C., Karszes,J., Howland, B., Buxton, S., Kiraly, M.,Kimmich, R., Shoen, K., and Overton, R.
2016-07 ($16.00)
An Analysis of Opportunities For Food HubDevelopment In Northern New York
Severson, R., Schmit, T., and Shin, P.2016-06
Business Transfer Guide for the JuniorGeneration
Richards, S., Shipman, L., Welch, D.and Leubner, E.
2016-05
Dairy Farm Business Summary, Western NewYork Region, 2015
Knoblauch, W., Dymond, C., Karszes,J., Howland, B., Hanchar, J., Petzen, J.,Overton, R., and Kimmich, R.
2016-04 ($16.00)
Dairy Farm Business Summary, New YorkLarge Herd Farms, 300 Cows or Larger, 2015
Karszes, J., Knoblauch, W. andDymond, C.
2016-03 ($20.00)
Potential Impacts of Minimum Wage Increaseson New York Dairy Farms
Ifft, J. and Karszes, J.2016-02
Cost of Establishment and Production of ColdHardy Grapes in the Chautauqua Region ofNew York - 2015
Oh, D., Kananizadeh, S., Gomez, M.,Martin, K.
2016-01
Workforce Issues: Profiles of Specialty CropFarms in New York State
Maloney, T., Smith, M., Saputo, R. andB. Rickard
2015-13
Paper copies are being replaced by electronic Portable Document Files (PDFs). To request PDFs of AEM publications, write to (be sure toinclude your e-mail address): Publications, Department of Applied Economics and Management, Warren Hall, Cornell University, Ithaca,NY 14853-7801. If a fee is indicated, please include a check or money order made payable to Cornell University for the amount of yourpurchase. Visit our Web site (http://dyson.cornell.edu/outreach/#bulletins) for a more complete list of recent bulletins.