survey of greensand properties of member foundries mary ... · survey of greensand properties of...
TRANSCRIPT
Ductile Iron Society RESEARCH PROJECT No. 40
Survey of Greensand Properties of Member Foundries
Mary Beth Krysiak Sand Technology Co. LLC, New Hudson MI
Dr. Hathibelagal Roshan
K & S Data Services LLC, Fox Point WI
DUCTILE IRON SOCIETY
Issued by the Ductile Iron Society for the use of its Member Companies – Not for General Distribution
DUCTILE IRON SOCIETY 15400 Pearl Road, Suite 234
Strongsville, Ohio 44136 (440) 665-3686
SEPTEMBER 2007

Research Report
Project #40 2007
Survey of Greensand Properties of Member Foundries
A Cooperative Project of Ductile Iron Society
And Member Foundries
Reported by
Mary Beth Krysiak Dr. Hathibelagal Roshan
Ductile Iron Society
Issued by the Ductile Iron Society
Located at 15400 Pearl Road, Suite 234; Strongsville, Ohio 44136
Contents
1, Executive Summary - pdf 2. Survey report Part A - pdf 3. Survey report Part B pdf 4. Correlations - pdf 5. Sand data sheet for collecting info - pdf 6. Sand grain photos - pdf 7. Test data - XL 8. Sand tests and guide to controls – chart - pdf 9. Sand tests and guide to controls – chart - Word

Sand Survey Report Executive Summary
1. The sand tests were done in one laboratory known to have many years of
expertise in sand testing. During transport, regardless of how well samples are sealed, the samples age and while moisture content remains fairly stable, compactability drops as the moisture is absorbed further into the clay. In addition, the sands cool from the temperature at which they were in use at foundry. While the cooling effect could not be negated on a practical level, the sands were retempered or conditioned, prior to testing, to the reported target compactability at the foundry. This was done in a low energy mixer, so the water could be distributed with a minimum energy input into the sand in order to avoid altering the strength properties.
2. Because of the aging (temperature and compactability loss) and retempering, some of the green properties as measured may not match the values determined at the foundry. The tests affected include all tests run in the green state: green compression, green shear, permeability, dry compression, friability, cone jolt toughness, and Rowell flowability. These properties should be fairly close, however, the values in the foundry. If there are large differences, the reasons for the difference should be investigated.
3. All compositional tests performed on dried sand samples including MB clay, 25 micron and adjusted clay, AFS GFN, LOI, volatiles and the Silica Program sand composition data will be unaffected by aging and reconditioning and can be compared directly. Differences on these tests may be due to equipment or procedural differences between laboratories.
4. Standard AFS Handbook procedures were used for all work in the study. General Observations
5. In many sand systems, there were significant differences in composition between the two samples provided. This may be due to and not limited to:
a. Large differences in sand to metal ratio of jobs run at that times b. Running a single mold line, with differences in core sand, new sand and
metal poured per unit time c. Differences in number of molds per unit time (down time); new sand may
be added even when molds are not shaken out. Unpoured molds also add variation
d. Differences in dust collection due to operational variations e. Addition of materials in random fashion, slugging of spilled sand, dust
collector fines etc. f. Changing bond and new sand addition drastically (on and off and in big
steps) 6. There are wide variations between sand systems in many of the operating
variables such as, MB clay, fines, LOI, moisture, AFS GFN, permeability etc. 7. At extremes of these values there may be problems either in mold making and or
quality of the castings.
8. Even though the compactability is controlled at the muller, the compactability at the point of use is critical for good quality molds and castings.
9. It is a good idea to know the compactability change between the muller discharge and the point of use. When this difference changes, the causes of the change should be understood.
10. It must be kept in mind that, because this is data from 31 different foundries, all with different base sands, preblends, and sand system engineering, certain relationships or correlations may be different than what they are when viewing data from a single sand system.
Property Relationships
11. At the clay levels foundry sand systems are operating, the green strength does not correlate to MB clay level. This is due to the fact that most of the systems in this study were high clay sands. Heine and Green have shown that at high clay levels, green strength does not increase further as clay is increased. In addition the sands were all tested in a narrow compactability range close to 40%.Bulk density (pounds per c.ft) decreases as. compactability (at the mold line) increases. Compactability is actually a measure of bulk density and is inversely related to it. Bulk density also correlated with specimen weight in this study.
12. Compacted density is influenced mainly by silica level, LOI, and ooltics. As compacted density increases, the rate of heat extraction would increase.
13. Metallics was also shown to correlate with compacted density. It must be understood, however, that whenever correlations are studied “correlation is not necessarily causation”. This is a good example. The metallics content of a molding sand is too low to truly influence compacted density. Yet the two correlate because sands with high compacted densities tend to be clean, high silica level sands. Sands with high levels of contamination (including inert fines, oolitic material and metallic contamination) generally have lower silica levels and lower compacted densities.
14. Permeability is affected by grain fineness but not to a great extent by clay level 15. Specimen weight is mainly affected by the ratio of the heavier component of
silica to the light components (LOI level/carbonaceous material, and fluxing material as inert fines and oolitics). As the clay level rises it takes comparatively less moisture to reach a certain compactability, due to limited mulling of the sand. This is due to the fact that mulling cycles are short, and the moisture moistens the surface of the clay first. So the compactability can be reached even though the subsurface clay is drier. As the sand travels to the molding machine, the moisture has time to be further absorbed into the subsurface clay.
16. Inert fines are shown to strongly correlate with dead clay (the difference between Adjusted clay and MB clay). Sieve fines (200, 270 and pan material) correlated very strongly with AFS GFN. So, as expected, sieve fines mainly consist of fine particles of silica, and inert subsieve fines consist of dead clay or other non silica components.
17. Permeability related mainly to AFS GFN in this multi-system study

18. Dry compression correlated with average shakeout time. As the shakeout time increased, dry compression decreased. This is most likely due to a greater reduction in interlayer water with longer exposure to heat. The more interlayer water that is removed, the more difficult it is to re-hydrate the interlayer.
19. There were no strong linear correlations with Flowability, Friability and Cone Jolt Toughness and any other single factor, indicating that these properties are affected by more than one parameter. These properties and inter-relationships between multiple variables need to be better understood because there was a very wide range in the various sands in this study. Flowability ranged from 49% to 92%. Friability ranged from about 1% to 11%. Cone Jolt Toughness ranged from 36 jolts to 593 jolts. Complex inter-relationships of moisture, clay, and other properties control the toughness, friability, and flowability of the sand, and these inter-relationships are not, as yet, well understood. Changes in these sand characteristics, which we do not yet understand how to control, may contribute to sand control problems and casting defects in foundries. Further work, possibly including multiple linear regression studies, need to be undertaken so that foundries can understand how to control toughness, friability, and flowability.
20. Volatiles correlated inversely with Moisture Volatiles Ratio. The volatiles test is performed on a dried sample, so this most like reflects that sands with high volatiles also have higher LOI levels, and therefore higher moisture requirements. Since moisture is volatile and fresh carbons are volatile, pinholes become a problem at high moisture combined with high volatiles. This is particularly true if the moisture is high in relation to the volatiles, because this changes the mold atmosphere to oxidizing instead of reducing.
21. Volatiles correlated inversely with flowability. This most likely a reflection of the fact that sands with high volatiles tend to have high LOI, and therefore high moisture levels which reduce flowability..
22. Metallics showed an inverse correlation with silica level. Again, this is due to the fact that cleaner/high silica level sands generally have lower levels of contaminants.
23. High moisture, low silica, low specimen weight sands tended to have lower mulling efficiencies. This is due to the fact that cleaner, low clay, low moisture sands hydrate more easily due to a lower moisture requirement. (Conversely, they may also dry out faster).
24. In terms of Heine Green Parameters, most of the sands in this study fell into the clay rich – moisture starved condition.
25. The Heine-Green Mulling Efficiency directly correlates to the easily calculated compactability to moisture ratio and inversely to Adjusted Clay. Again this is due to the fact that high clay sands have higher moisture requirements which are more difficult to satisfy.
26. The easily calculated MB to moisture ratio correlates inversely to Heine-Green Green Strength Efficiency.
27. The active clay ratio correlates inversely with inert fines. The higher the dead clay, the higher the subsieve inert fines.
Performance relationships
28. Variations in bulk density or compactability will lead to variations in mold density as the mold boxes are filled by volume
29. To maintain the same size molds (cake size, mold height) a larger volume of sand is needed to fill the chambers, if the bulk density/compactability is lower. As the volume of the chambers is fixed in a molding system, bulk density/compactability should be maintained above a minimum value to get adequate mold thickness and uniform mold density. If it falls too low due to the sand being too wet, cake size/mold heights are reduced and free water can produce gas defects.
30. As the specimen weight decreases, (due to fines, clay level, oolitics) lower mold density, lower refractoriness, and slower heat extraction may be the result and may lead to penetration, shrink, and dimensional variations.
31. To get good surface finish sand grain distribution is very important and increasing fines does not necessarily result in a finer casting surface.
32. To maintain adequate moisture level and to absorb excess moisture during mold filling, a certain amount of fines and oolitics may be necessary along with active clay.
33. Even though the green strength is not much affected by MB clay level above 6%, extra clay is needed in the sand system, as a buffer, for many reasons:
a. When there are large amounts of new materials are added b. When there are great variations in new materials added c. When sand to metal ratio is very low d. If the silo runs low e. If sand temperature is high
34. It is important to maintain a full level in the return sand silo. Depending on the design condition of the sand system, dust collection leakages etc, it may take as little as 100 pounds of new and core sand to more than 300 pounds to maintain the return sand silo full.
35. It is not necessary to control the fines and oolitics by addition of new materials only. Judicious selection of clay level, control of dust collection, and recycling of fines will enable one to maintain proper control of a sand system
36. If the compactability to moisture ratio is too low for the MB clay present, the castings maybe susceptible to gas defects and pin holes
37. If the compactability to moisture ratio is too high for the MB clay present, then the Mold is prone to drying and will result in friable edges and sand inclusions
38. The percentage bond in the preblends in the various iron foundries averaged 75% and ran from a minimum of 68% to a maximum of 85%.
39. Bond usage, in lbs of bond as a percent of the batch weight (correcting for percent clay in the preblend) ranged from about 0.4% to 3.6%.
40. Higher return sand temperature correlated with high discharge sand temperature. This is despite the fact that this is a multi-system study, with many different sand systems and types of sand coolers.
41. High return sand temperature and low sand to metal ratio correlated with higher bond usage. Bond usage ranged from about 0.4% of the batch weight at a

temperature of 100F and a sand to metal ratio of 11, to about 3.6% of the batch weight at a temperature of about 145F and a sand to metal ratio of about 6.
Conclusion The testing performed provides excellent data for benchmarking a particular foundry sand against other similar sands. The data also provides a good history for each foundry to compare to in the future should problems arise. By having data from an outside laboratory to compare to, if test results are questionable or scrap and re-work increase due to sand related defects, changes can be identified. If in-house laboratory.data changes, or is suspect in terms of errors, it can also be compared. Tests that are not part of the usual testing regiment in most foundries (such as friability, cone jolt toughness, Rowell flowability, dry compression, fluxing material as inert fines and ooltics, metallics, and silica level) were determined for each foundry in this work. Individual test reports were sent to each participating foundry to provide an in depth analysis of their particular sand, including recommendations. Important correlations and relationships have been identified that will be useful to sand system control and reduction of sand related casting defects. At the end of the correlations section, a sand properties chart is provided that lists the various tests, the ranges observed for those tests, and based on the data, a recommended range for each property. This chart, which takes into consideration different property requirements for vertical versus horizontal molding is particularly useful for benchmarking.

1
Sand Technology Co. LLC K&S Data Services LLC Mary Beth Krysiak 59764 Barkley Drive, New Hudson MI 48165 Ph: 248 739 9474, Fax: 248 446 2933 e-mail: [email protected] website: www.sandtechco.com Dr.Hathibelagal Roshan, 7363 N Mohawk Road Fox Point WI 53217 414-333-4134
e-mail: [email protected]
May 4, 2007 Ductile Iron Society 28938 Lorain Road Suite 202 North Olmsted OH, 44070 Attn: Mr. Jack Hall Test Report No. T- 06010 Subject: Thirty one sets of molding sand samples from various members of the Ductile Iron Society.
Investigation: A complete Silica Program Test Series was performed on each molding sand (62 samples
total). Individual reports were provided for each member foundry. This report represents the final and overall results of the greensand study.
Description of Tests Performed Green Properties Tests The molding sand samples were first tested for green properties. All test equipment was calibrated prior to testing. Before testing for green properties, the molding sand samples were tempered to the target compactability level used in the foundry. This was necessary since the compactability of molding sand samples decreases during shipment, even if the plastic bags or containers are sealed tightly. This phenomenon cannot be prevented – the fee moisture will migrate deeper into the clay as it is more fully absorbed during shipment. When tempering the sands, a Hobart mixer was used. This type of mixer uses a slowly rotating blade to mix the sample and the slight amount of added water. Very little energy is put into the sample as it mixes with this type of mixer, and that is desirable as it is important not to change the properties of the sand, but only to temper back to the target compactability level. The target compactability level was taken from a datasheet supplied with each sample. This datasheet provided pertinent and comprehensive information for each sand system including type of muller, type of molding machine, sand temperatures, core, mold, and metal weights, etc. See Datasheet in Appendix A . After tempering the molding sand, the molding sand was sealed into a plastic container, which was re-sealed after opening between each test to prevent moisture loss. The sands were tested for:

2
Green Properties:
• Moisture • Compactability • Specimen weight • Bulk Density (calculated) • Compacted Density (calculated) • Permeability • Green Compressive Strength / Green Compression • Shear Strength • Dry Compressive Strength / Dry Compression • Rowell Flowbility • Friability • Cone Jolt Toughness
See Appendix B for Green Properties Test Procedures Structural Properties Tests Following completion of the Green Properties tests, the structural properties tests were performed. The structural properties tests performed included:
• 25 Micron Clay • AFS Grain Fineness and Distribution • Loss on Ignition at 1800F • Loss on Ignition After Wash (LOI in the Sand Fraction) • LOI in the clay fraction (calculated) • Volatiles at 900F
See Appendix C for Structural Properties Test Procedures Silica Program Test Series The Silica Program Test Series was performed next. The Silica Program, originally developed by Hofmann, Dietert, Graham and Praski 1, allows determination of the following:
• Methylene Blue Clay • Carbonaceous Material • Fluxing Material
o As Inert Fines o As Oolitic Material
• Metallics • Silica Content (or other base aggregate) • Cleanliness Factor
A slightly modified version of the original Silica Program Test Series was used. See Appendix D for Silica Program Test Procedures

3
1. Introduction
Consistency in the quality of molding sand mixtures used in green sand molding process is essential to ensure consistent quality of castings. This is especially important in the case of high production green sand molding plants. It is not adequate to depend only on the mechanical properties of molding sand mixtures determined routinely on a daily or weekly basis as is commonly done in many foundries. It is necessary to develop a reliable technology to assess the health of molding sand mixtures by identifying the parameters relatable to the casting quality and monitor these parameters periodically say once in three months or six months to determine whether any changes have taken place in the composition of sand mixtures. Equipment malfunction, operational error, variation in the amount of core sand entering into the system and the changes in the effective sand to metal ratio all contribute to the changes in the composition of sand. In order to take a proper corrective action and maintain a stable condition, we should identify and measure the composition of sand based on the relevant parameters on a regular basis. Sand related defects constitute a significant proportion of the total defects and monitory losses to the foundries. Any attempts to understand and develop suitable procedures to control the quality of molding sand mixtures will be of economic value to the foundry industry. Although, extensive research has been carried out for the past 50 years in the area of sand technology, it is of the opinion of the principal investigators, that there is a scope for improvement in the clear understanding of the sand control by the personnel involved in maintaining the consistency of the quality of molding sand mixtures in the foundries. Conventional physical and mechanical properties of molding sand mixtures determined by the foundries on a routine basis do not account for the inconsistencies in the quality of castings produced. In general, the molding sand mixtures used in green sand molding process are very forgiving for minor changes in the composition, which makes the foundrymen to be complacent and not to care much until it is too late. Also, there is a certain amount of special technical skill involved in testing in addition to understanding of the intricacies of the sand technology. Dietert and GF testing equipment are utilized to determine the composition and properties of molding sand mixtures.
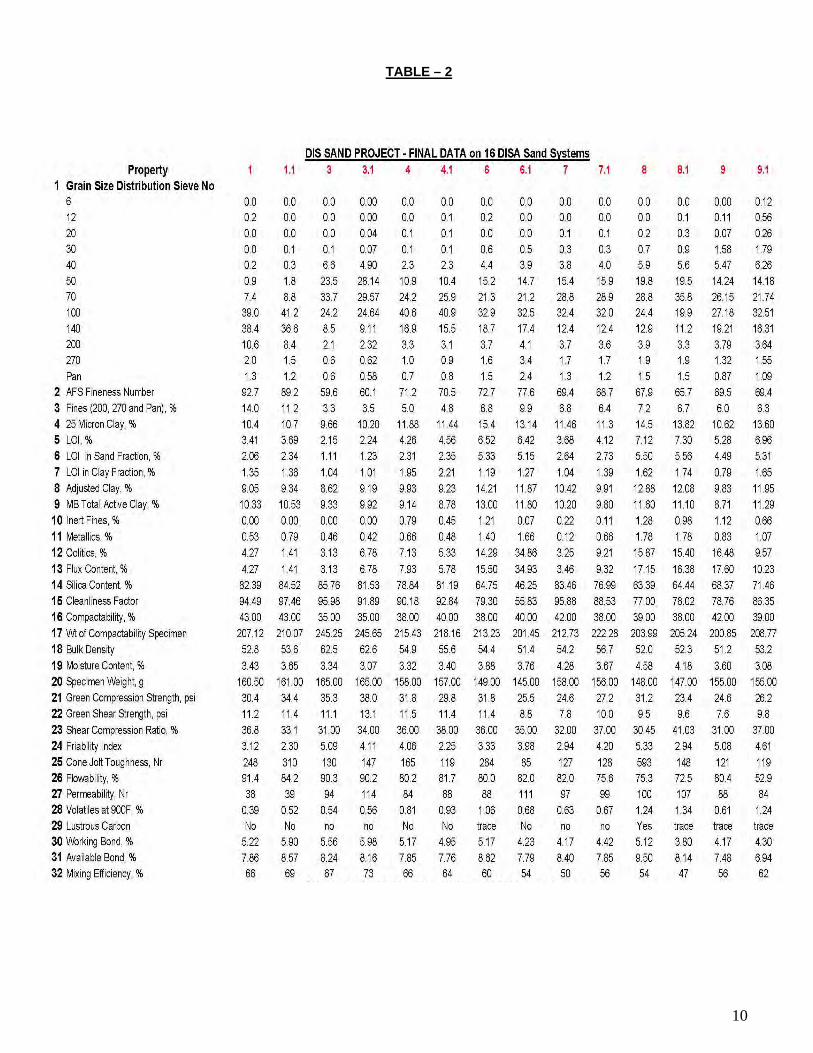
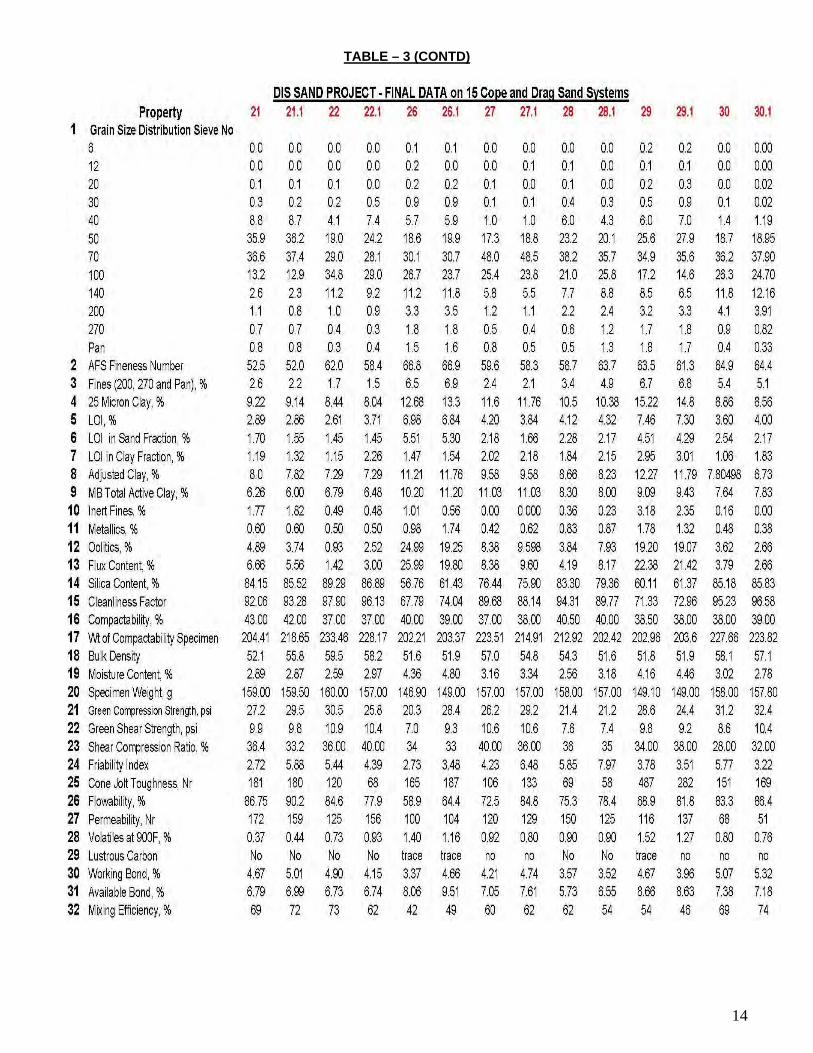
2. Sand Samples 31 different samples were studied in this investigation. Of these 16 were from DISA machines and the balance
were from the other molding machines which included Hunter machines, Sinto, SPO, and other Cope and Drag Machines. We shall call these other molding machines as Cope and Drag machines.
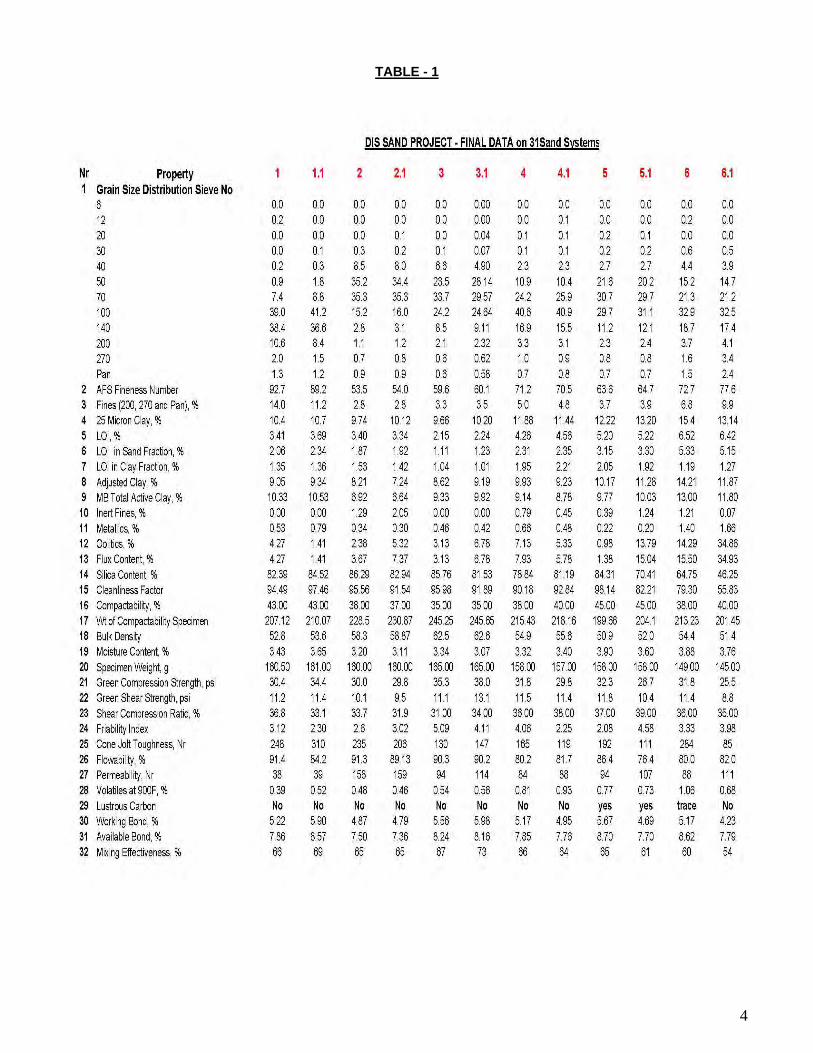
The results of the investigation are given in Table 1. This table gives the results of all the 31 samples. Table 2 indicates the results on sand samples from DISA molding machines and Table 3 indicates the results of sand
4
TABLE - 1

5
TABLE – 1 (CONTD)

6
TABLE – 1 (CONTD)

7
TABLE – 1 (CONTD)

8
TABLE – 1 (CONTD)

9
TABLE – 1 (CONTD)
10
TABLE – 2

11
TABLE – 2 (CONTD)

12
TABLE – 2 (CONTD)

13
TABLE - 3
14
TABLE – 3 (CONTD)

15
3. Grain Size Distribution:
Foundries decide on the use of a particular grain size of sand for molds or cores depending on the type and size of castings made in their foundries. Some foundries use same grain size of sand for both molds and cores and others use different size of sand for molds and cores. If the foundries use different grain size distributions for molds and cores, during the recirculation of sand in the foundry the distribution of sand that enters the mold box will be a function of the amount of core sand entering into the system and also the amount of new sand that is added to each batch of sand mix. Grain size distribution governs to a large extent the surface quality of castings in addition to its contribution to the permeability of the mold. Grain size and distribution also govern the packing density of the mold, which in turn control the dimensional integrity of the castings produced. By collecting the data on the sand samples, it would be valuable to correlate the sand distribution and the type of castings produced in different foundries. In general, if a component, such as a core sand of a different fineness than the new sand, is added to a molding sand system, after a number of cycles the system contains only the added component. The prerequisite in this case is that the amount of added component is the same as that removed from the sand in order to keep the volume of the system sand constant. If two or more components are added in each cycle, the proportion of the various components during the cycle will remain the same as that of the input or inflow. With bentonites and carbons, however, the proportions can change as material burns out. For new sand/core sand input in general about 300 lbs of new sand per ton of metal poured (plus bond and carbons to coat the new/core sand) is adequate to recondition a system sand for iron. It is desirable to have the sand grains distributed over 4 different sieves. It is also desirable to have at least 10% retained on the 140 screen.
The grain distributions for the various molding sands are shown above. The DISA sands tend to peak more often on the 70 and 100 mesh sieve. The Cope and Drag sands peaked more often on the 50 and 70 sieves. Note the wide distributions in both cases, which is desirable. To see relationship of permeability to AFS GFN, see permeability section. Grain distribution also affects the molding sand’s resistance to mechanical metal penetration and the quality of the casting’s surface finish. Many foundries set a target for material retained on the 140 sieve to prevent mechanical penetration. The 140 mesh material fits nicely into the interstices between 50 and 70 mesh grains. The 140 mesh data and fine (200, 270 and pan material) is shown in the charts below. None of the foundries with the peak values

16
in either category reported gas defects. None of the foundries with the lowest values in either category reported penetration problems. So, again, this illustrates how different foundries have different sand requirements. (The other possibility is, as mentioned earlier, some foundries may not have been willing to disclose defects that they were experiencing).
3. AFS Fineness Number:
AFS Fineness and distribution is a useful parameter for controlling the grain size of the sand, which governs the quality of surface finish of castings, without compromising on the other quality characteristics. A coarse sand promotes good venting, but can lead to mechanical penetration. A fine sand with a wide distribution promotes better packing of sand grains and provides a good finish on the castings. If too low, however, gas defects can result. Average Grain Size: There is no specific average grain size requirements concerning sand for the molding machines. However, the probability of metal penetration between the sand grains increases with the increasing average grain size. Please refer to the Figure 4.1
Figure 4.1
Figure 4.1 shows the tendency for metal penetration as a function of the metallostatic pressure height and average grain size for the different molding machines. It is seen that the metal penetration tendency increases with the increase in the metallostatic pressure head and the increasing grain size.
17
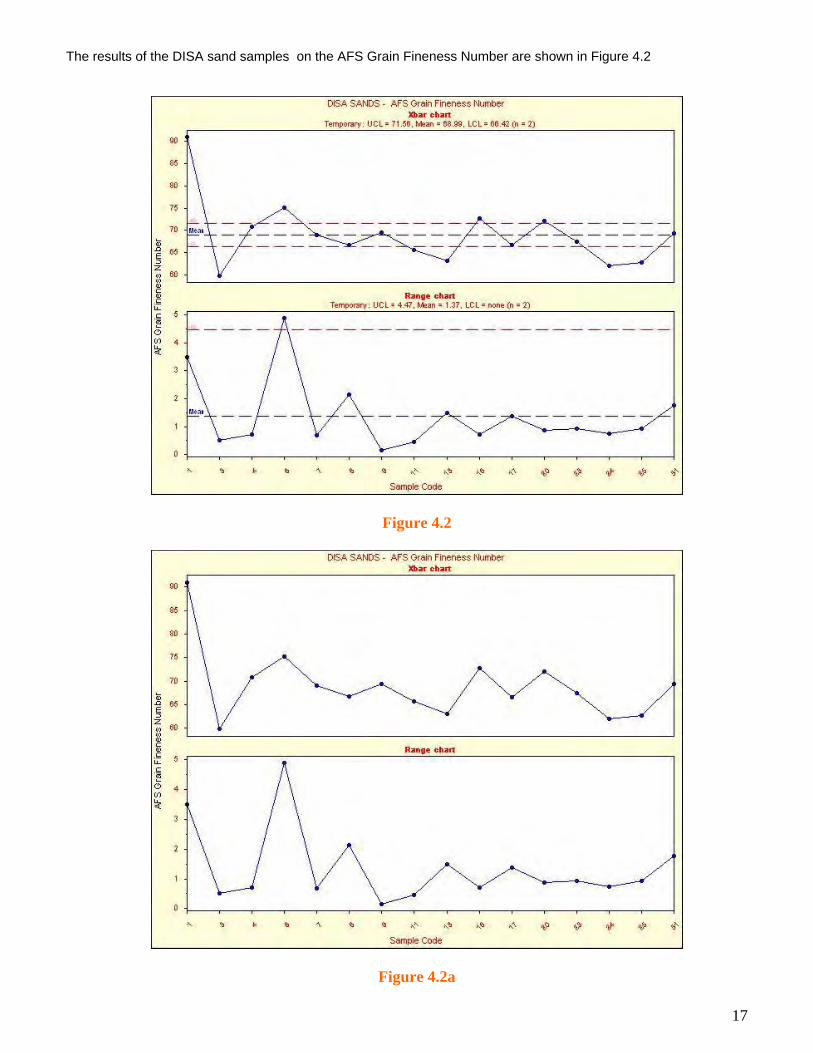
The results of the DISA sand samples on the AFS Grain Fineness Number are shown in Figure 4.2
Figure 4.2
Figure 4.2a
18
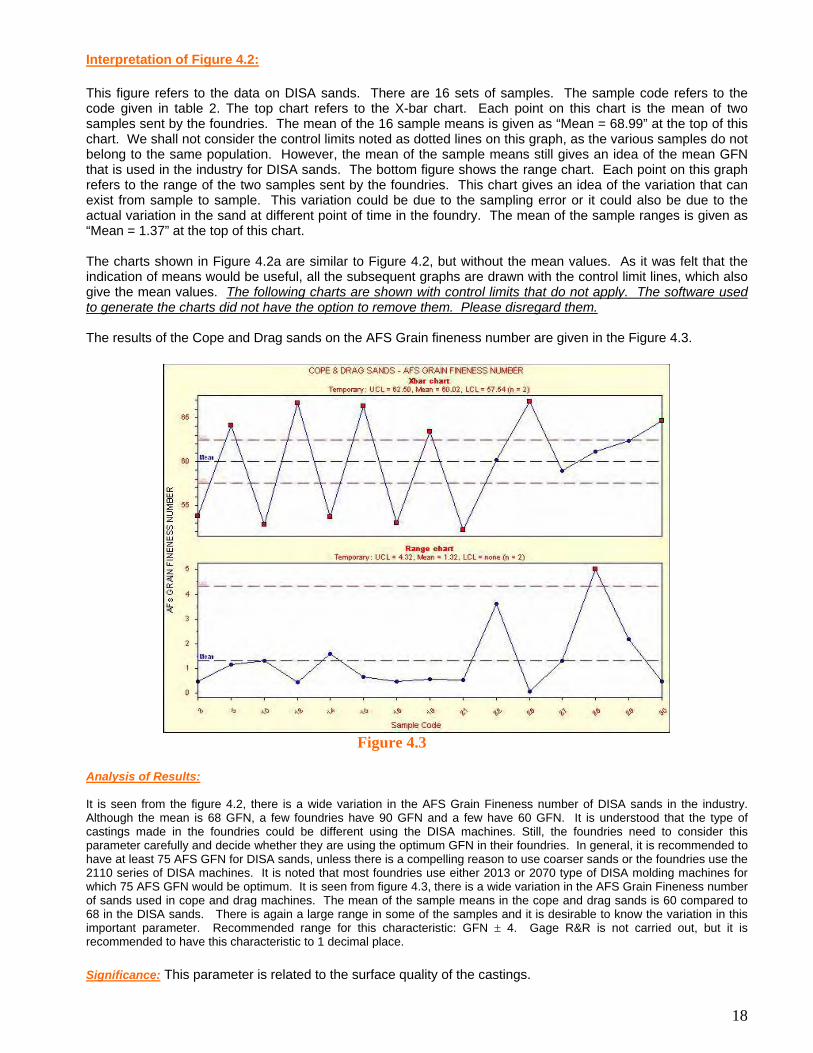
Interpretation of Figure 4.2: This figure refers to the data on DISA sands. There are 16 sets of samples. The sample code refers to the code given in table 2. The top chart refers to the X-bar chart. Each point on this chart is the mean of two samples sent by the foundries. The mean of the 16 sample means is given as “Mean = 68.99” at the top of this chart. We shall not consider the control limits noted as dotted lines on this graph, as the various samples do not belong to the same population. However, the mean of the sample means still gives an idea of the mean GFN that is used in the industry for DISA sands. The bottom figure shows the range chart. Each point on this graph refers to the range of the two samples sent by the foundries. This chart gives an idea of the variation that can exist from sample to sample. This variation could be due to the sampling error or it could also be due to the actual variation in the sand at different point of time in the foundry. The mean of the sample ranges is given as “Mean = 1.37” at the top of this chart. The charts shown in Figure 4.2a are similar to Figure 4.2, but without the mean values. As it was felt that the indication of means would be useful, all the subsequent graphs are drawn with the control limit lines, which also give the mean values. The following charts are shown with control limits that do not apply. The software used to generate the charts did not have the option to remove them. Please disregard them. The results of the Cope and Drag sands on the AFS Grain fineness number are given in the Figure 4.3.
Figure 4.3 Analysis of Results: It is seen from the figure 4.2, there is a wide variation in the AFS Grain Fineness number of DISA sands in the industry. Although the mean is 68 GFN, a few foundries have 90 GFN and a few have 60 GFN. It is understood that the type of castings made in the foundries could be different using the DISA machines. Still, the foundries need to consider this parameter carefully and decide whether they are using the optimum GFN in their foundries. In general, it is recommended to have at least 75 AFS GFN for DISA sands, unless there is a compelling reason to use coarser sands or the foundries use the 2110 series of DISA machines. It is noted that most foundries use either 2013 or 2070 type of DISA molding machines for which 75 AFS GFN would be optimum. It is seen from figure 4.3, there is a wide variation in the AFS Grain Fineness number of sands used in cope and drag machines. The mean of the sample means in the cope and drag sands is 60 compared to 68 in the DISA sands. There is again a large range in some of the samples and it is desirable to know the variation in this important parameter. Recommended range for this characteristic: GFN ! 4. Gage R&R is not carried out, but it is recommended to have this characteristic to 1 decimal place. Significance: This parameter is related to the surface quality of the castings.

19
As mentioned under permeability, but worth repeating: Foundries should use the finest sand that will produce good castings. Often, coarser sand is used for cores to reduce surface area and binder requirement. But as this sand influxes into the greensand, the greensand will become coarser. The surface finish achievable with coarse sand is not as good as that achievable with fine sand. If gas defects are a concern, it should be remembered that mechanical venting is much more effective at venting core and mold gases than coarse sand is. The use of finer sand in cores should be considered, but with care taken to adequately vent the cores and molds mechanically. It should also be noted that it may not be always possible to vent mechanically.
5. Fines (200, 270, and Pan), % Fines content, along with AFS grain fineness data, is a good indicator of the ability of the sand to provide good finish on the castings. It should not be too high or problems with low permeability such as gas defects may result. Fines also increase the moisture content of the sand and can negatively affect flowability. A lack of fines on the other hand, especially on the 140 sieve for finenesses typical of those used for iron system sands, may produce a rough surface finish and mechanical penetration. The results of the DISA sand samples on the Fines Content are shown in Figure 5.1
Figure 5.1
20
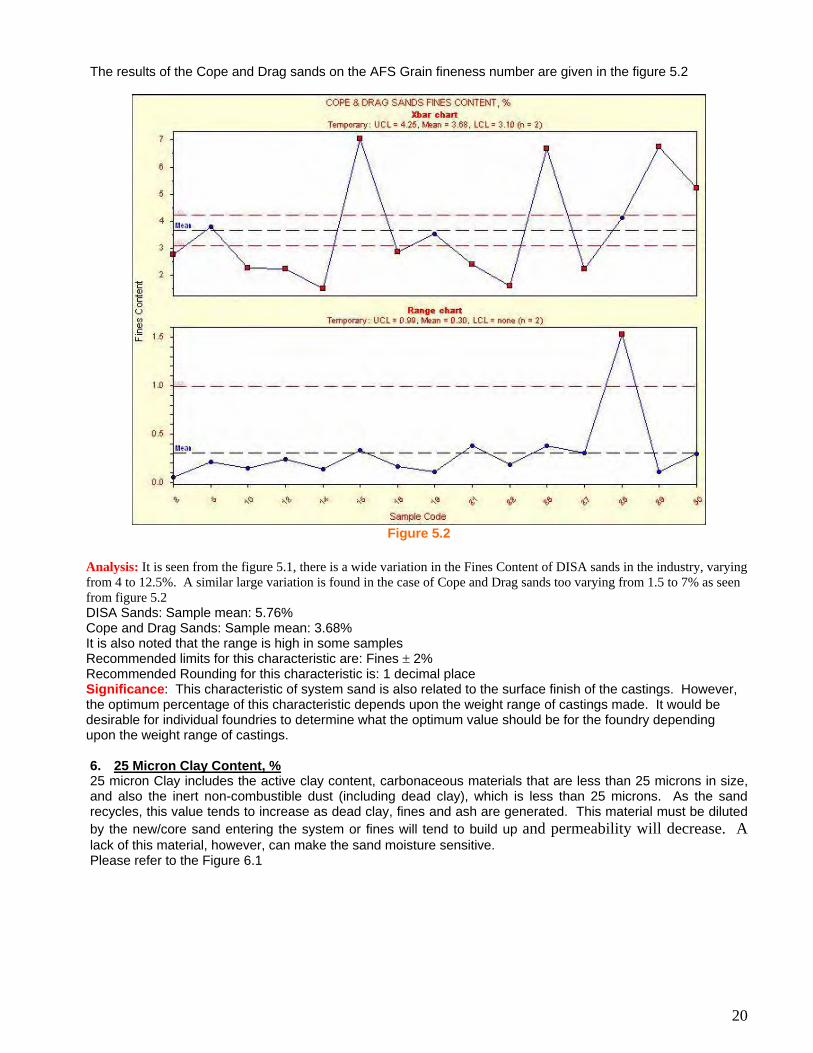
The results of the Cope and Drag sands on the AFS Grain fineness number are given in the figure 5.2
Figure 5.2
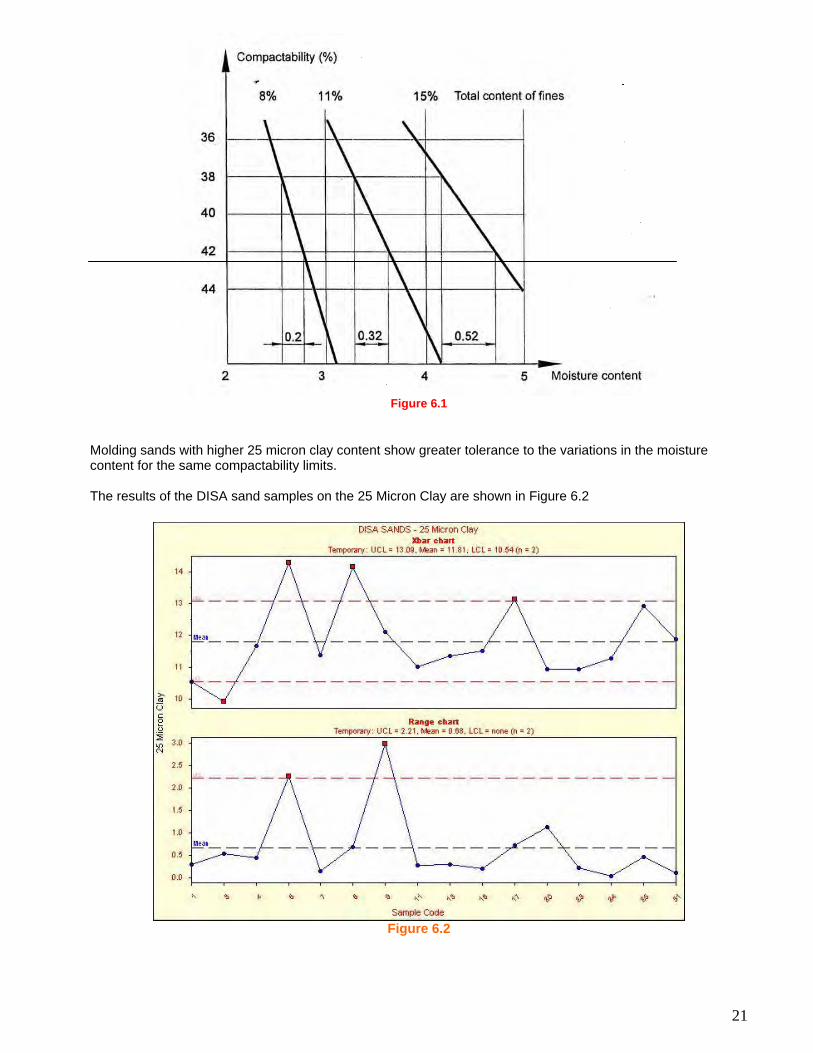
Analysis: It is seen from the figure 5.1, there is a wide variation in the Fines Content of DISA sands in the industry, varying from 4 to 12.5%. A similar large variation is found in the case of Cope and Drag sands too varying from 1.5 to 7% as seen from figure 5.2 DISA Sands: Sample mean: 5.76% Cope and Drag Sands: Sample mean: 3.68% It is also noted that the range is high in some samples Recommended limits for this characteristic are: Fines ! 2% Recommended Rounding for this characteristic is: 1 decimal place Significance: This characteristic of system sand is also related to the surface finish of the castings. However, the optimum percentage of this characteristic depends upon the weight range of castings made. It would be desirable for individual foundries to determine what the optimum value should be for the foundry depending upon the weight range of castings. 6. 25 Micron Clay Content, % 25 micron Clay includes the active clay content, carbonaceous materials that are less than 25 microns in size, and also the inert non-combustible dust (including dead clay), which is less than 25 microns. As the sand recycles, this value tends to increase as dead clay, fines and ash are generated. This material must be diluted by the new/core sand entering the system or fines will tend to build up and permeability will decrease. A lack of this material, however, can make the sand moisture sensitive. Please refer to the Figure 6.1
21
Figure 6.1
Molding sands with higher 25 micron clay content show greater tolerance to the variations in the moisture content for the same compactability limits. The results of the DISA sand samples on the 25 Micron Clay are shown in Figure 6.2
Figure 6.2
22
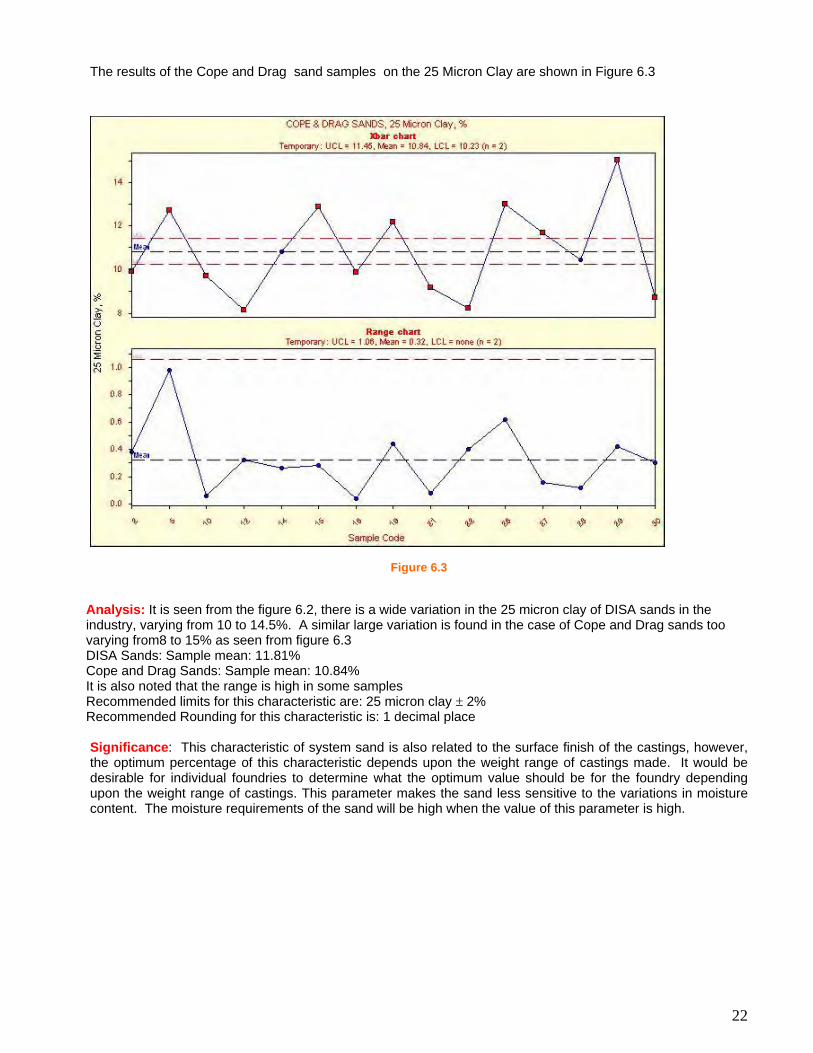
The results of the Cope and Drag sand samples on the 25 Micron Clay are shown in Figure 6.3
Figure 6.3
Analysis: It is seen from the figure 6.2, there is a wide variation in the 25 micron clay of DISA sands in the industry, varying from 10 to 14.5%. A similar large variation is found in the case of Cope and Drag sands too varying from8 to 15% as seen from figure 6.3 DISA Sands: Sample mean: 11.81% Cope and Drag Sands: Sample mean: 10.84% It is also noted that the range is high in some samples Recommended limits for this characteristic are: 25 micron clay ! 2% Recommended Rounding for this characteristic is: 1 decimal place Significance: This characteristic of system sand is also related to the surface finish of the castings, however, the optimum percentage of this characteristic depends upon the weight range of castings made. It would be desirable for individual foundries to determine what the optimum value should be for the foundry depending upon the weight range of castings. This parameter makes the sand less sensitive to the variations in moisture content. The moisture requirements of the sand will be high when the value of this parameter is high.
23
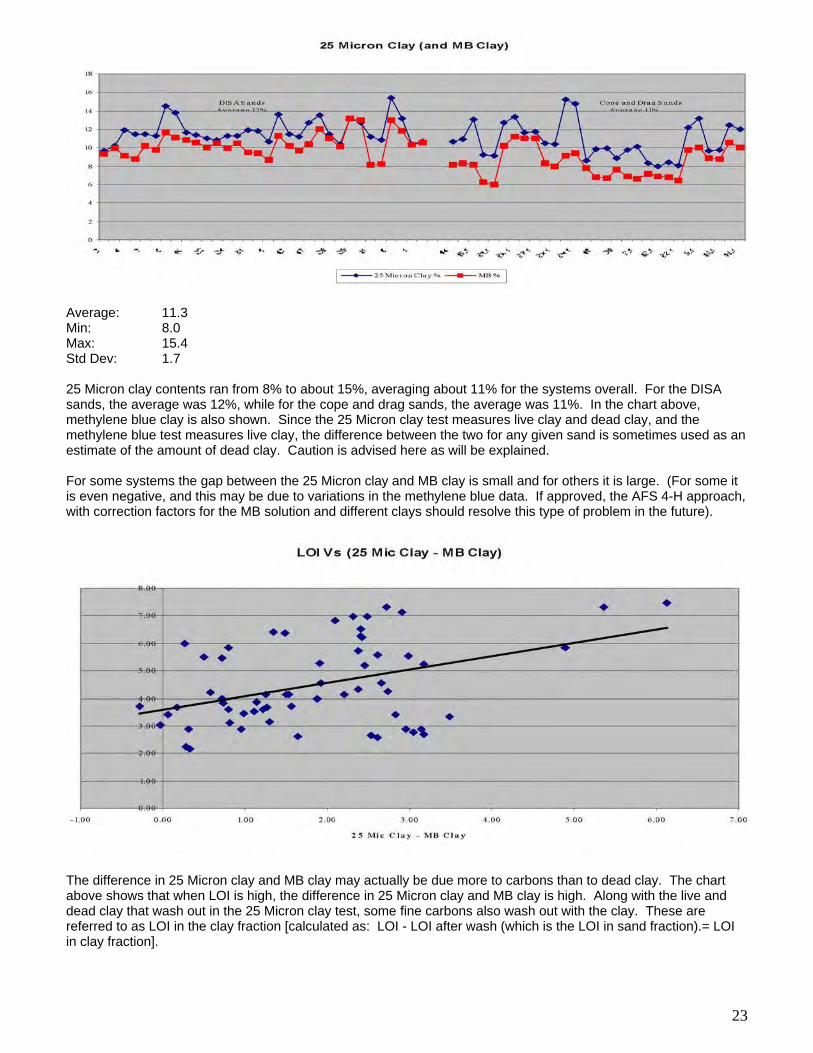
Average: 11.3 Min: 8.0 Max: 15.4 Std Dev: 1.7 25 Micron clay contents ran from 8% to about 15%, averaging about 11% for the systems overall. For the DISA sands, the average was 12%, while for the cope and drag sands, the average was 11%. In the chart above, methylene blue clay is also shown. Since the 25 Micron clay test measures live clay and dead clay, and the methylene blue test measures live clay, the difference between the two for any given sand is sometimes used as an estimate of the amount of dead clay. Caution is advised here as will be explained. For some systems the gap between the 25 Micron clay and MB clay is small and for others it is large. (For some it is even negative, and this may be due to variations in the methylene blue data. If approved, the AFS 4-H approach, with correction factors for the MB solution and different clays should resolve this type of problem in the future).
The difference in 25 Micron clay and MB clay may actually be due more to carbons than to dead clay. The chart above shows that when LOI is high, the difference in 25 Micron clay and MB clay is high. Along with the live and dead clay that wash out in the 25 Micron clay test, some fine carbons also wash out with the clay. These are referred to as LOI in the clay fraction [calculated as: LOI - LOI after wash (which is the LOI in sand fraction).= LOI in clay fraction].
24
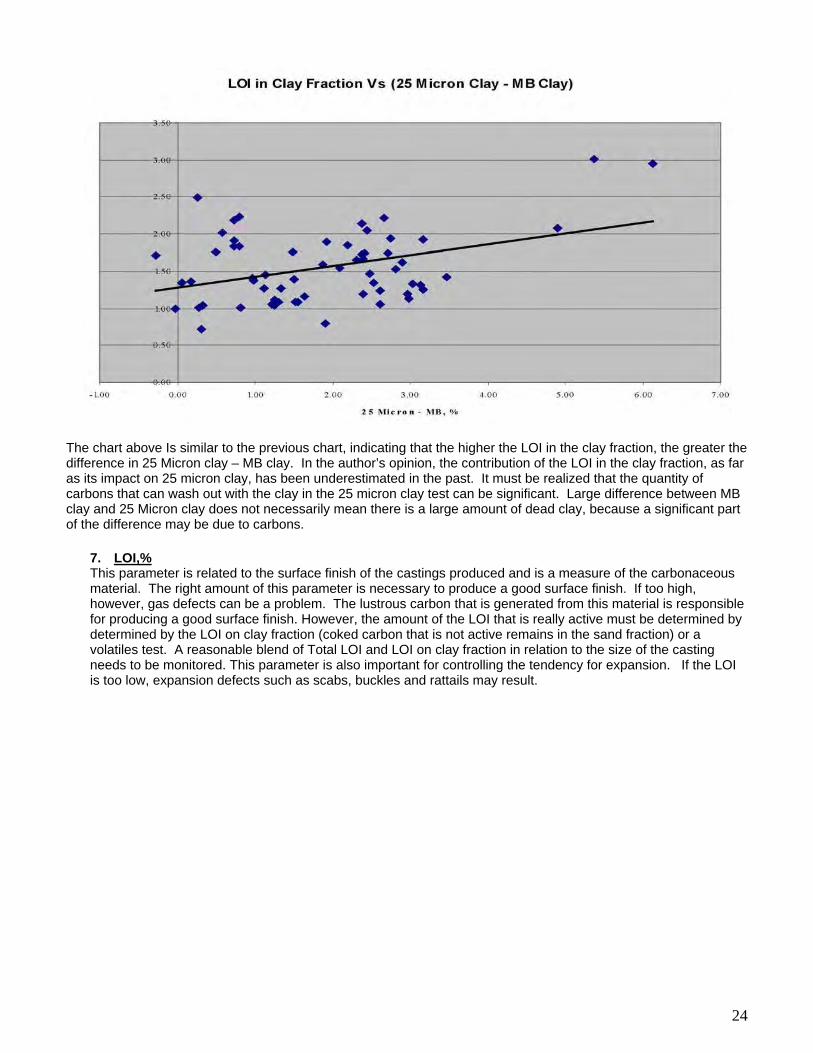
The chart above Is similar to the previous chart, indicating that the higher the LOI in the clay fraction, the greater the difference in 25 Micron clay – MB clay. In the author’s opinion, the contribution of the LOI in the clay fraction, as far as its impact on 25 micron clay, has been underestimated in the past. It must be realized that the quantity of carbons that can wash out with the clay in the 25 micron clay test can be significant. Large difference between MB clay and 25 Micron clay does not necessarily mean there is a large amount of dead clay, because a significant part of the difference may be due to carbons.
7. LOI,% This parameter is related to the surface finish of the castings produced and is a measure of the carbonaceous material. The right amount of this parameter is necessary to produce a good surface finish. If too high, however, gas defects can be a problem. The lustrous carbon that is generated from this material is responsible for producing a good surface finish. However, the amount of the LOI that is really active must be determined by determined by the LOI on clay fraction (coked carbon that is not active remains in the sand fraction) or a volatiles test. A reasonable blend of Total LOI and LOI on clay fraction in relation to the size of the casting needs to be monitored. This parameter is also important for controlling the tendency for expansion. If the LOI is too low, expansion defects such as scabs, buckles and rattails may result.

25
The results of the DISA sand samples for Loss on Ignition (LOI) are shown in Figure 7.1
Figure 7.1
The results of the Cope and Drag sand samples for Loss on Ignition (LOI) are shown in Figure 7.2
Figure 7.2

26
Analysis: It is seen from the figure 7.1, there is a wide variation in the LOI of DISA sands in the industry, varying from 2% to 7.5%%. A similar large variation is found in the case of Cope and Drag sands too varying from 2 to 7.5% as seen from figure 7.2 DISA Sands: Sample mean: 4.8% Cope and Drag Sands: Sample mean: 4.23% It is also noted that the range is high in some samples Recommended limits for this characteristic are: LOI ! 1% Recommended Rounding for this characteristic is: 1 decimal place Significance: This characteristic of system sand is also related to the surface finish of the castings, however, the optimum percentage of this characteristic depends upon the weight range of castings made. It would be desirable for individual foundries to determine what the optimum value should be for the foundry depending upon the weight range of castings. 8. LOI in Sand Fraction, % The LOI portion of the sand fraction determined by the LOI of the washed sample gives an indication of the amount of carbonaceous materials that have become coked, and do not necessarily contribute to producing good surface finish, since coked seacoal has lost it's volatile material. Like fines, coked carbons do increase the moisture requirements of sand for a given temper condition and are desirable to a limited extent for making the sand less sensitive to moisture and a tendency for friability development. The results of the DISA sand samples on the LOI in sand fraction are shown in Figure 8.1
Figure 8.1

27
The results of the Cope and Drag sand samples for LOI in sand fraction are shown in Figure 8.2
Figure 8.2
Analysis: It is seen from the figure 8.1, there is a wide variation in the LOI of DISA sands in the industry, varying from 1% to 5.5%%. A similar large variation is found in the case of Cope and Drag sands too varying from 1 to 5.5% as seen from figure 8.2 DISA Sands: Sample mean: 3.36% Cope and Drag Sands: Sample mean: 2.5% It is also noted that the range is high in some samples Recommended limits for this characteristic are: LOI in sand fraction! 1% Recommended Rounding for this characteristic is: 1 decimal place Significance: This characteristic of system sand is also related to the surface finish of the castings. A high value of this characteristic is indicative of the inactive carbonaceous materials that have been converted into coke. 9. LOI in Clay Fraction, % This value is obtained from the LOI minus the LOI in the sand fraction. The LOI portion of the clay fraction is the carbonaceous materials which are, in general, active in producing lustrous carbon and contributing to a good surface finish on castings.
28
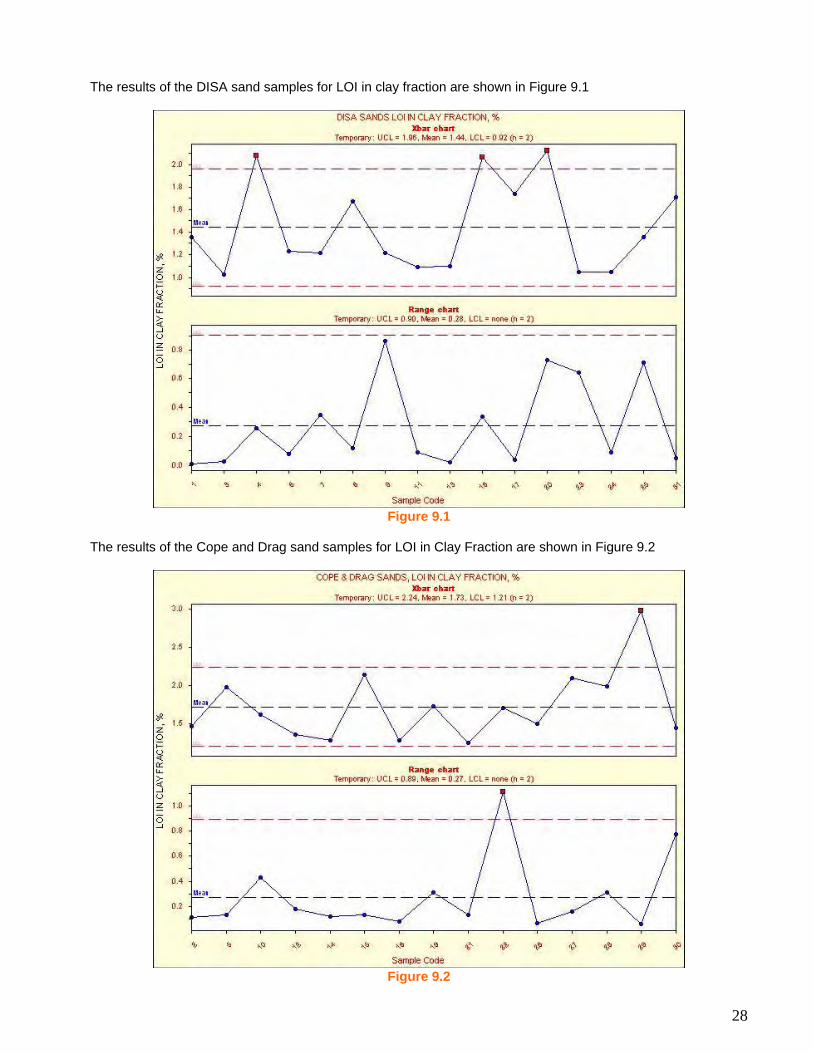
The results of the DISA sand samples for LOI in clay fraction are shown in Figure 9.1
Figure 9.1
The results of the Cope and Drag sand samples for LOI in Clay Fraction are shown in Figure 9.2
Figure 9.2
29
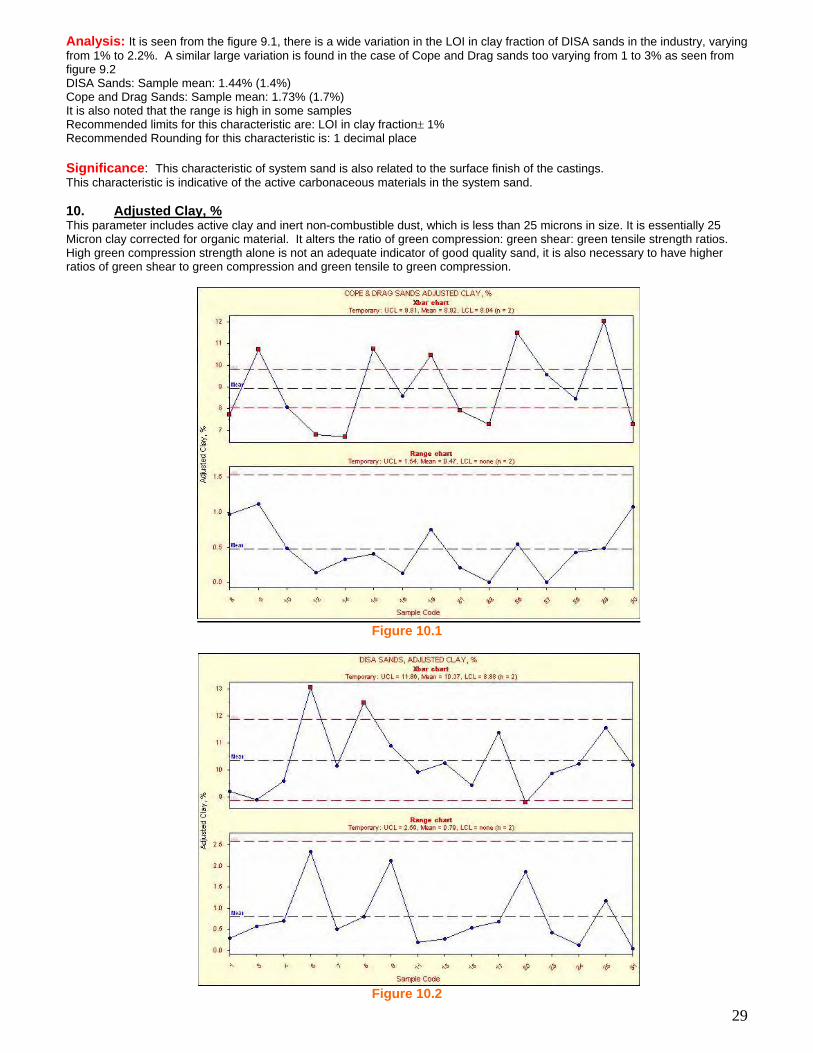
Analysis: It is seen from the figure 9.1, there is a wide variation in the LOI in clay fraction of DISA sands in the industry, varying from 1% to 2.2%. A similar large variation is found in the case of Cope and Drag sands too varying from 1 to 3% as seen from figure 9.2 DISA Sands: Sample mean: 1.44% (1.4%) Cope and Drag Sands: Sample mean: 1.73% (1.7%) It is also noted that the range is high in some samples Recommended limits for this characteristic are: LOI in clay fraction! 1% Recommended Rounding for this characteristic is: 1 decimal place Significance: This characteristic of system sand is also related to the surface finish of the castings. This characteristic is indicative of the active carbonaceous materials in the system sand. 10. Adjusted Clay, % This parameter includes active clay and inert non-combustible dust, which is less than 25 microns in size. It is essentially 25 Micron clay corrected for organic material. It alters the ratio of green compression: green shear: green tensile strength ratios. High green compression strength alone is not an adequate indicator of good quality sand, it is also necessary to have higher ratios of green shear to green compression and green tensile to green compression.
Figure 10.1
Figure 10.2

30
Analysis: It is seen from the figure 10.1, there is a wide variation in the Adjusted Clay of DISA sands in the industry, varying from 9% to 12%. A similar large variation is found in the case of Cope and Drag sands too varying from 7 to 5.5% as seen from figure 10.2 DISA Sands: Sample mean: 10.37% (10.3%) Cope and Drag Sands: Sample mean: 8.92% (8.9%) It is also noted that the range is high in some samples Recommended limits for this characteristic are: Adjusted Clay! 1% Recommended Rounding for this characteristic is: 1 decimal place 11. MB Total Active Clay, % The proper content of active clay in the molding sand is as important as choosing the correct type of bentonite. The active clay is measured by the Methylene Blue Content %. MB Clay % is an indicator of the available active clay present in the sand system that is capable of participating in the bond, provided the muller/mixer is efficient. A relationship between the MB clay and green compression strength is a good indicator of the ability of the mixer/muller to convert the total available active clay into effective clay participating in the bond. It is desirable to have as high active clay content as necessary. The positive effects of having a high active clay are the following: 1. It gives high green compression strength to produce strong molds that do not deform or get damaged
during the mold transportation. 2. It gives high tensile strength in order to avoid tearing during stripping of the molds. Green tensile strength
is about 10% of the green tensile strength. 3. It stabilizes the mold cavity to avoid such defects as shrinkage, casting swells, sand erosion and sand inclusions. The results of the DISA sand samples on the MB Clay are shown in Figure 11.1
Figure 11.1

31
The results of the Cope and drag sand samples on the MB Clay are shown in Figure 11.2
Figure 11.2
Analysis: It is seen from the figure 11.1, there is a wide variation in the MB Clay Content of DISA sands in the industry, varying from 8 to 13%. A similar large variation is found in the case of Cope and Drag sands too varying from 6 to 11% as seen from figure 11.2 DISA Sands: Sample mean: 10.4% Cope and Drag Sands: Sample mean: 8.3% It is also noted that the range is high in some samples Recommended limits for this characteristic are: MB Clay ! 1% Recommended Rounding for this characteristic is: 1 decimal place Significance: This is a very important characteristic of green sand system, which is indicative of the available bond in the sand. However, it also depends upon the type of bentonite used to some extent. It is desirable to have a standard clay sample and determine the properties using a standard raw sand and determine the MB clay value of such a clay sample. Without such reference value, the MB clay values can have misleading results and interpretations. In some of the samples studied in this investigation, it is noted that the MB clay values determined were not indicative of the available bond. Average: 9.4 Min: 6.0 Max: 13.2 Std Dev: 1.7 Methylene blue clay content (live clay content) ran from 6% to 13%, averaging about 9.5%. For the DISA molding sands, the MB clay averaged 10.5% clay, and for the cope & drag sands, the average was 8.5% clay. As with any sand parameter, each foundry needs to determine the proper level that produces good quality molds and castings. The methylene blue test is the best method for accurate determination of clay content. It has it’s shortcomings, however. The test is time consuming, taking about 20 minutes per test. Also, depending on how laboratories calibrate for this test, and whether foundries boil or sonicate for pretreatment of the sample, there can be differences in the results between laboratories. The AFS 4-H Additives Committee is actively considering a new method of calibration, where calibration factors are assigned to the solution and to the clay in order to correct the results to a standard. Preliminary tests with this method seem to indicate better correlation between laboratories with the new calculations. The method is under evaluation but is not approved as yet.
32
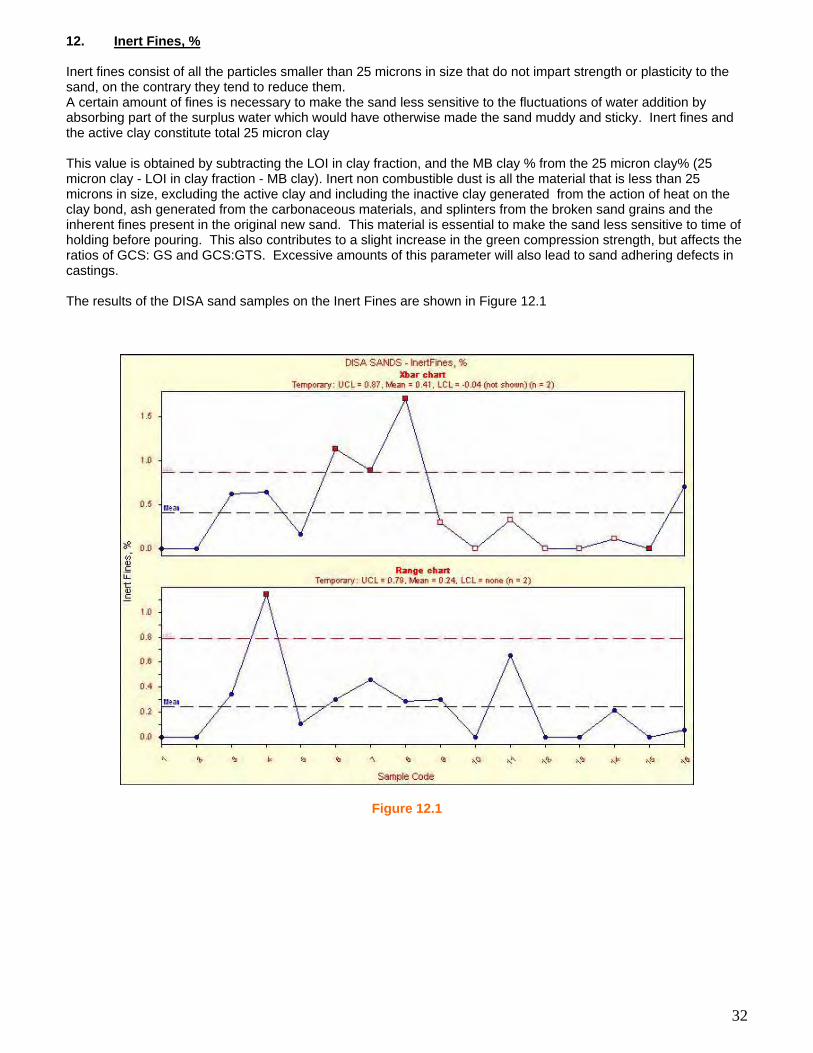
12. Inert Fines, % Inert fines consist of all the particles smaller than 25 microns in size that do not impart strength or plasticity to the sand, on the contrary they tend to reduce them. A certain amount of fines is necessary to make the sand less sensitive to the fluctuations of water addition by absorbing part of the surplus water which would have otherwise made the sand muddy and sticky. Inert fines and the active clay constitute total 25 micron clay This value is obtained by subtracting the LOI in clay fraction, and the MB clay % from the 25 micron clay% (25 micron clay - LOI in clay fraction - MB clay). Inert non combustible dust is all the material that is less than 25 microns in size, excluding the active clay and including the inactive clay generated from the action of heat on the clay bond, ash generated from the carbonaceous materials, and splinters from the broken sand grains and the inherent fines present in the original new sand. This material is essential to make the sand less sensitive to time of holding before pouring. This also contributes to a slight increase in the green compression strength, but affects the ratios of GCS: GS and GCS:GTS. Excessive amounts of this parameter will also lead to sand adhering defects in castings. The results of the DISA sand samples on the Inert Fines are shown in Figure 12.1
Figure 12.1

33
The results of the Cope and Drag sand samples on the Inert Fines are shown in Figure 12.2
Figure 12.2
Analysis: It is seen from the figure 12.1, there is a wide variation in the Fines Content of DISA sands in the industry, varying from 0 to 1.75%. A similar large variation is found in the case of Cope and Drag sands too varying from 0 to 3% as seen from figure 12.2 DISA Sands: Sample mean: 0.41% Cope and Drag Sands: Sample mean: 0.99% It is also noted that the range is high in some samples Recommended limits for this characteristic are: Inert Fines ! 1% Recommended Rounding for this characteristic is: 2 decimal places Significance: A small percentage of inert fines are needed to make the sand less sensitive to the variations in moisture content. However. Large percentages of this characteristic can make the sand brittle.
34
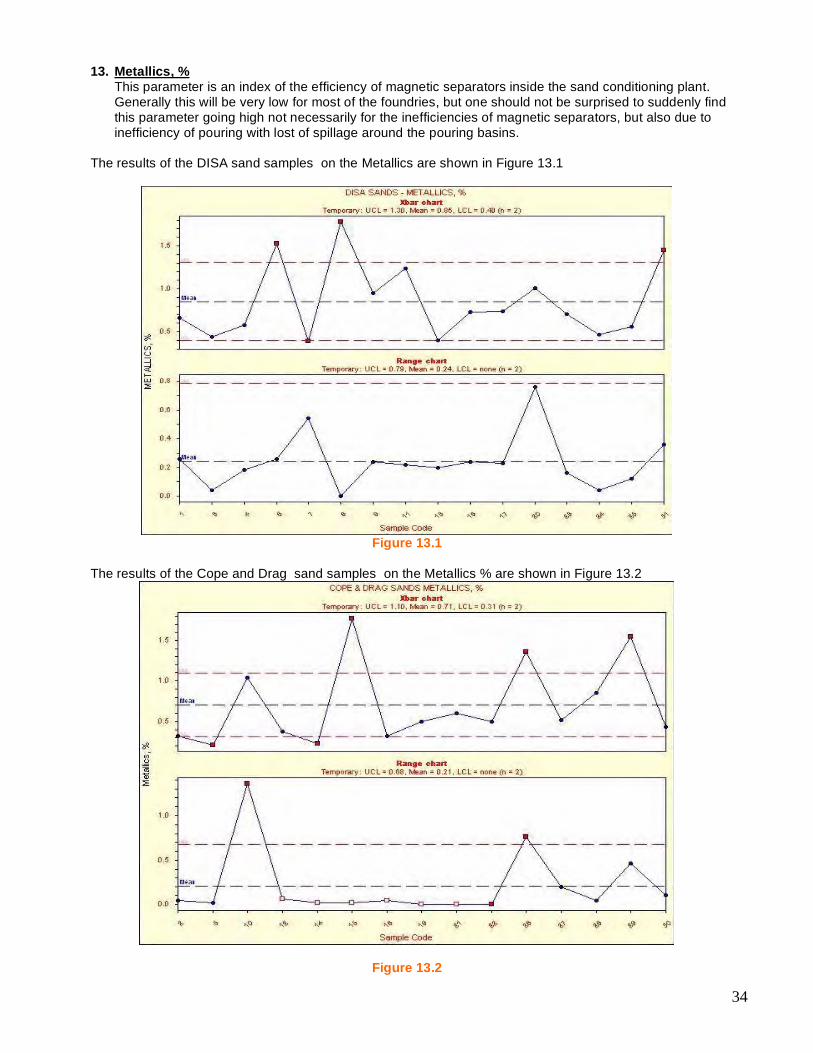
13. Metallics, %
This parameter is an index of the efficiency of magnetic separators inside the sand conditioning plant. Generally this will be very low for most of the foundries, but one should not be surprised to suddenly find this parameter going high not necessarily for the inefficiencies of magnetic separators, but also due to inefficiency of pouring with lost of spillage around the pouring basins.
The results of the DISA sand samples on the Metallics are shown in Figure 13.1
Figure 13.1
The results of the Cope and Drag sand samples on the Metallics % are shown in Figure 13.2
Figure 13.2

35
Analysis: It is seen from the figure 13.1, there is a wide variation in the Metallics content of DISA sands in the industry, varying from 0.25 to 1%. A similar large variation is found in the case of Cope and Drag sands too varying from 0.25 to 1% as seen from figure 13.2 DISA Sands: Sample mean: 0.85% Cope and Drag Sands: Sample mean: 0.71% It is also noted that the range is high in some samples Recommended limits for this characteristic are: Metallics ! 0.2% Recommended Rounding for this characteristic is: 2 decimal places.
14. Oolitics, % % Oolitics refer to the content of dead clay in the sand fraction of the washed sand calcined at 1800 F. Oolitization is not necessarily a negative phenomenon. It explains why systems usually have more favorable properties compared to new molding sands. The process of oolitization shows that some of the dead clay is not present as free dust. It is baked on to the sand grains as hard layers. It is therefore not possible to clean a molding sand by dust extraction. The dead clay present in a sand as oolitic layers replaces a respective volume of quartz in the sand which means that it replaces part of the component responsible for producing sand expansion defects. However, excessive oolitics can result in sand adhering defects such as burn-on or burn-in in the castings as it lowers refractoriness.
The results of the DISA sand samples on the Oolitics are shown in Figure 14.1
Figure 14.1

36
The results of the Cope and Drag sand samples on the Oolitics are shown in Figure 14.2
Figure 14.2
Analysis: It is seen from the figure 14.1, there is a wide variation in the Oolitics Content of DISA sands in the industry, varying from 2 to 25%. A similar large variation is found in the case of Cope and Drag sands too varying from 2 to 25% as seen from figure 14.2 DISA Sands: Sample mean: 9.29% Cope and Drag Sands: Sample mean: 8.0% It is also noted that the range is high in some samples Recommended limits for this characteristic are: Oolitics ! 2% Recommended Rounding for this characteristic is: 1 decimal place Significance: This characteristic of system sand is also related to the surface finish of the castings, however, the optimum percentage of this characteristic depends upon the weight range of castings made. It would be desirable for individual foundries to determine what the optimum value should be for the foundry depending upon the weight range of castings. 15. Flux content, % The flux content in a sand system is defined as the inert noncombustible dust plus the percentage of oolitics in the sand system, The flux material in many sand systems will begin to glaze or sinter at temperatures as low as 2200F. High levels of flux could be detrimental to the quality of castings and it needs to be controlled.
The results of the DISA sand samples on the Flux Content are shown in Figure 15.1
Figure 15.1

37
The results of the Cope and Drag sand samples on the Flux Content are shown in Figure 15.2
Figure 15.2
Analysis: It is seen from the figure 15.1, there is a wide variation in the Flux Content of DISA sands in the industry, varying from 2 to 25%. A similar large variation is found in the case of Cope and Drag sands too varying from 2 to 25% as seen from figure 15.2 DISA Sands: Sample mean: 9.70% Cope and Drag Sands: Sample mean: 8.98% It is also noted that the range is high in some samples Recommended limits for this characteristic are: Flux ! 2% Recommended Rounding for this characteristic is: 1 decimal place Significance: This characteristic of system sand is also related to the surface finish of the castings, however, the optimum percentage of this characteristic depends upon the weight range of castings made. It would be desirable for individual foundries to determine what the optimum value should be for the foundry depending upon the weight range of castings. 16. Silica content, % Silica content refers to the base refractory material content present in the sand mixture. The amount of silica content in a silica base system will be influenced by sand-to-metal ratio, the amount of burned sand entering the system and the amount of new or core sand being added. Low values of this parameter indicate that the sand is prone to defects related to burn-on and burn-in and high values of this parameter indicate the tendency of the sand for expansion defects and also sand inclusions due to the friable sand.
38
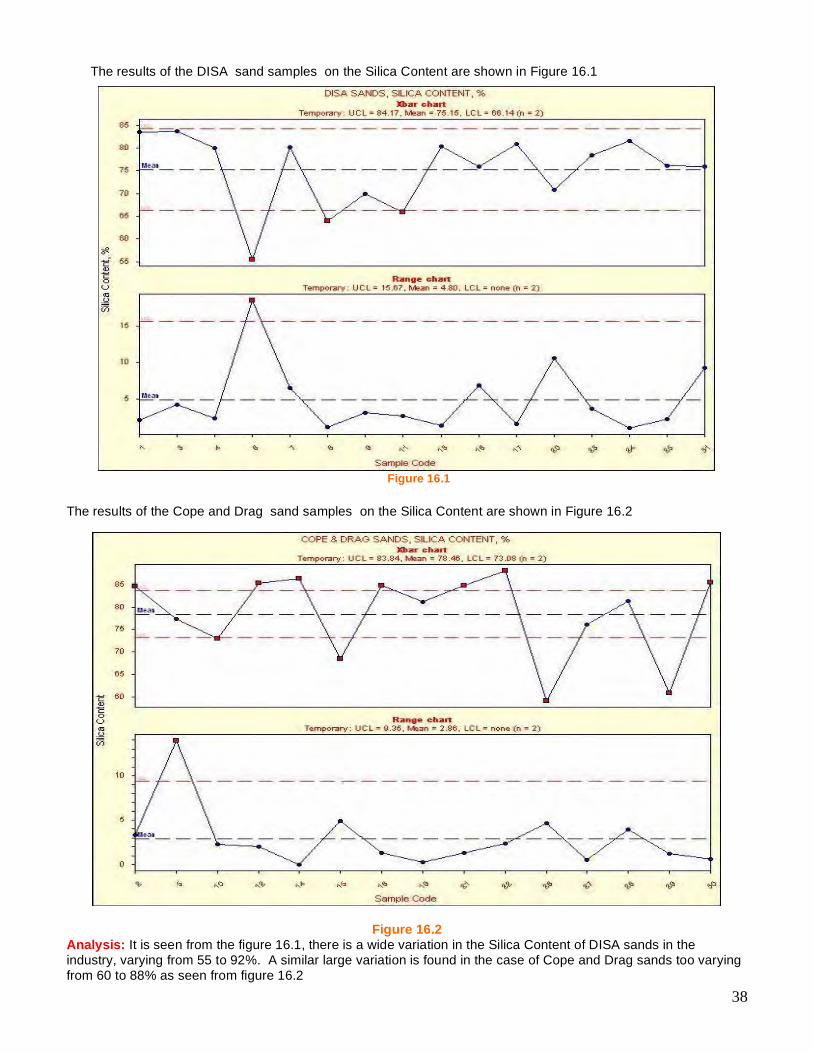
The results of the DISA sand samples on the Silica Content are shown in Figure 16.1
Figure 16.1
The results of the Cope and Drag sand samples on the Silica Content are shown in Figure 16.2
Figure 16.2
Analysis: It is seen from the figure 16.1, there is a wide variation in the Silica Content of DISA sands in the industry, varying from 55 to 92%. A similar large variation is found in the case of Cope and Drag sands too varying from 60 to 88% as seen from figure 16.2

39
DISA Sands: Sample mean: 75.2% Cope and Drag Sands: Sample mean: 78.5% It is also noted that the range is high in some samples Recommended limits for this characteristic are: Silica Content ! 2% Recommended Rounding for this characteristic is: 1 decimal place 17. Cleanliness Factor, % The percentage of silica, flux and metallics are added and the total percentage of these residuals are divided into the percent silica and multiplied by 100 to arrive at the cleanliness factor expressed in percent. This is a useful parameter as any fluctuations in the MB clay and combustible materials due to poor control, could also affect percentage of silica. This can be misleading as the cleanliness and refractoriness of sand grains may have remained constant. High cleanliness factor can lead to expansion defects and low value promotes burn-on and expansion type of defects. 18. % Compactability As mentioned earlier, the samples were tempered to the compactabilities that the foundries reported as their targets at the molding machine. The average compactability was 40, and the range was from 35 to 47. Approximately forty out of the 60 samples tested, ran between 35 and 40%. Only 4 of the samples ran above 43%. So 35% to 43% appears to be the typical compactability target for iron molding sands 1. The behavior of molding sand system on modern high pressure molding machines can be measured using
compactability test. 2. It determines the percentage decrease of the height of the original level loose sand under the influence of
squeeze pressure. 3. Compactability test is a volumetric test and as such independent of the specific gravity of the sand. 4. The drier the sand, the less will be the decrease in height and the less will be the compactability. The wetter the
sand, the more will be the decrease in height and the more will be the compactability. 5. Compactability testing permits an accurate adaptation of a sand to the compaction characteristics of a molding
machine. 6. It offers a good basis of reference when actual moisture content is replaced by compactability for plotting the test
data. The water requirement of sand is considered and can be measured as well the degree of mulling. 7. Compactability testing permits an accurate adaptation of a sand to the compaction characteristics of a molding
machine. It offers a good basis of reference when actual moisture content is replaced by compactability for plotting the test data. The water requirement of sand is considered and can be measured as well degree of mulling.
8. The compctability test eliminates subjectiveness of the old-fashioned ‘handsqueeze-test’ which was mastered
by a few people only, since the compacatability can be measured by any one. Compactability test provides a very accurate, reproducible and objective possibility of determining by means of experiments the degree of moisture or wetness of sand.
9. Compactability has made possible to reproduce a specific degree of moisture independent of the water
requirements. A specific green sand condition means a specific degree of moisture and a specific compactability.

40
The above figure shows that three sand systems having varying amounts of bentonite need to be prepared with different moisture contents to give constant compactability values. It indicates that any variation in moisture at a given compactability is indicative of the change in the composition of sand. It needs review and appropriate corrective action. Compactability control has become an accepted means of stabilizing the response of molding sands to molding operations. As compactability is measured by measuring the decrease in height of the riddled sand in a specimen tube under a specified energy condition, it is most appropriate to the moldmaking in conventional or high pressure molding machines. Any molding machine delivers a certain quantity of aerated sand mixture in to the molding box with a filler box attached to it and squeezes at a specified pressure to arrive at constant height of the sand cake. Delivering sand mixture of a consistent compactability is very essential to the making of consistent quality molds which have the exact height without excessive sand above the mold box or a depression in the mold box. In addition, % compactability indicates the relative temper of the sand and therefore the water-clay ratio. In combination with the green compression strength, this parameter gives an indication of the effective bond in the sand mixture. Sand temperature should be carefully controlled. The sand temperature at the time of entry into the muller and at the time of discharge are very critical. The temperature of the sand at the discharge from the muller should not be more than 110F.

41
1. Hot sand increases the moisture content that is required to maintain the same compactability. 2. Hot sand causes non-uniform properties, specially the strength and permeability. 3. Hot sand causes increased stickiness, due to the high moisture at a given consistency. 4. Hot sand increases the potential for friability and causes sand erosion problems 5. Hot sand shifts the moisture at the temper condition to higher values as shown in the figure 18.1. 6. Hot sand decreases the plasticity of clay thus requiring higher amounts of bentonite to develop a given
strength.
Please refer to Figure 18.1
Figure 18.1
The results of the DISA sand samples on the Compactability are shown in Figure 18.2
Figure 18.2
42
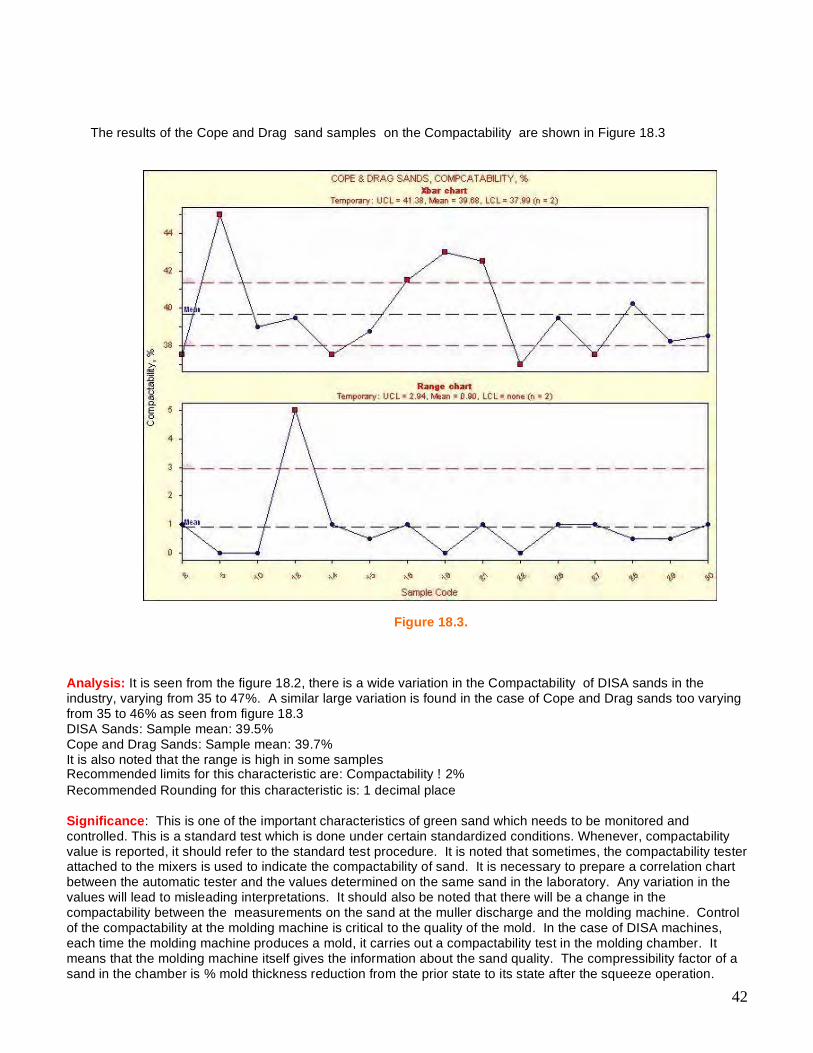
The results of the Cope and Drag sand samples on the Compactability are shown in Figure 18.3
Figure 18.3.
Analysis: It is seen from the figure 18.2, there is a wide variation in the Compactability of DISA sands in the industry, varying from 35 to 47%. A similar large variation is found in the case of Cope and Drag sands too varying from 35 to 46% as seen from figure 18.3 DISA Sands: Sample mean: 39.5% Cope and Drag Sands: Sample mean: 39.7% It is also noted that the range is high in some samples Recommended limits for this characteristic are: Compactability ! 2% Recommended Rounding for this characteristic is: 1 decimal place Significance: This is one of the important characteristics of green sand which needs to be monitored and controlled. This is a standard test which is done under certain standardized conditions. Whenever, compactability value is reported, it should refer to the standard test procedure. It is noted that sometimes, the compactability tester attached to the mixers is used to indicate the compactability of sand. It is necessary to prepare a correlation chart between the automatic tester and the values determined on the same sand in the laboratory. Any variation in the values will lead to misleading interpretations. It should also be noted that there will be a change in the compactability between the measurements on the sand at the muller discharge and the molding machine. Control of the compactability at the molding machine is critical to the quality of the mold. In the case of DISA machines, each time the molding machine produces a mold, it carries out a compactability test in the molding chamber. It means that the molding machine itself gives the information about the sand quality. The compressibility factor of a sand in the chamber is % mold thickness reduction from the prior state to its state after the squeeze operation.

43
Compressibility can be calculated according to the following equation: Compressibility in % = ((True Chamber depth – Mold thickness)/True Chamber depth) x 100 %, where the True Chamber Depth is the actual distance between the faces of the two pattern plates before squeeze operation. The compressibility factor determines whether the available compacting energy of the molding machine is utilized in the best possible manner. In other words, compressibility factor indicates whether the sand condition suits the characteristic of the molding machine. If the sand is in its optimum condition, the compressibility should be 18 to 25% depending upon the type of molding machine and the machine settings such as blow pressure, blow time, squeeze pressure, squeeze time, sand aeration etc. Even in the case of Cope and Drag machines a similar reasoning works. You need to understand the working of the molding machine with regard to the squeeze pressure applied and the machine capability and the operation of the machine. You need to know whether, the machine stops squeezing after the set squeeze pressure is reached, or whether the squeezing takes place for a fixed distance. In either case, the compactability of the sand is the key to produce the consistent quality molds. In the design of green sands, the sands should be tempered to the desired compactability based on the type of molding machine and the moisture that is needed to achieve the desired compactability. Subsequently, any change in the moisture content to achieve the desired compactability is a very good indicator of the changes in the composition of sand and this should be taken advantage of to identify the changes that have taken place.
CORRELATIONS
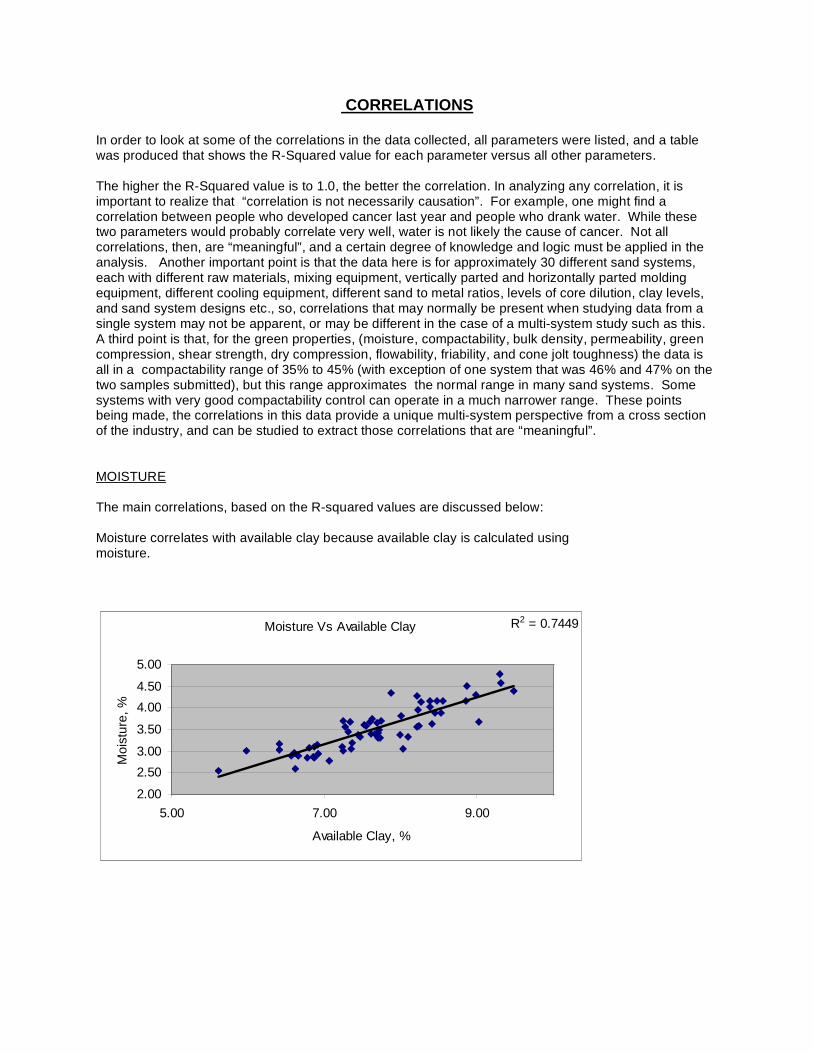
In order to look at some of the correlations in the data collected, all parameters were listed, and a table was produced that shows the R-Squared value for each parameter versus all other parameters. The higher the R-Squared value is to 1.0, the better the correlation. In analyzing any correlation, it is important to realize that “correlation is not necessarily causation”. For example, one might find a correlation between people who developed cancer last year and people who drank water. While these two parameters would probably correlate very well, water is not likely the cause of cancer. Not all correlations, then, are “meaningful”, and a certain degree of knowledge and logic must be applied in the analysis. Another important point is that the data here is for approximately 30 different sand systems, each with different raw materials, mixing equipment, vertically parted and horizontally parted molding equipment, different cooling equipment, different sand to metal ratios, levels of core dilution, clay levels, and sand system designs etc., so, correlations that may normally be present when studying data from a single system may not be apparent, or may be different in the case of a multi-system study such as this. A third point is that, for the green properties, (moisture, compactability, bulk density, permeability, green compression, shear strength, dry compression, flowability, friability, and cone jolt toughness) the data is all in a compactability range of 35% to 45% (with exception of one system that was 46% and 47% on the two samples submitted), but this range approximates the normal range in many sand systems. Some systems with very good compactability control can operate in a much narrower range. These points being made, the correlations in this data provide a unique multi-system perspective from a cross section of the industry, and can be studied to extract those correlations that are “meaningful”. MOISTURE The main correlations, based on the R-squared values are discussed below: Moisture correlates with available clay because available clay is calculated using moisture.
Moisture Vs Available Clay R2 = 0.7449
2.00
2.503.00
3.50
4.004.50
5.00
5.00 7.00 9.00
Available Clay, %
Moi
stur
e, %
Moisture Vs Adusted Clay R2 = 0.5833
2.002.50
3.003.50
4.004.50
5.00
6.0 8.0 10.0 12.0 14.0 16.0
Adjusted Clay, %
Moi
stur
e, %
Moisture Vs 25 Micron Clay R2 = 0.4719
2.00
2.503.00
3.50
4.004.50
5.00
6.0 8.0 10.0 12.0 14.0 16.0
25 Micron Clay, %
Moi
stur
e, %

Moisture Vs Methylene Blue Clay
R2 = 0.334
2.00
2.50
3.003.50
4.00
4.50
5.00
5.00 7.00 9.00 11.00 13.00
Methylene Blue Clay, %
Moi
stur
e, %

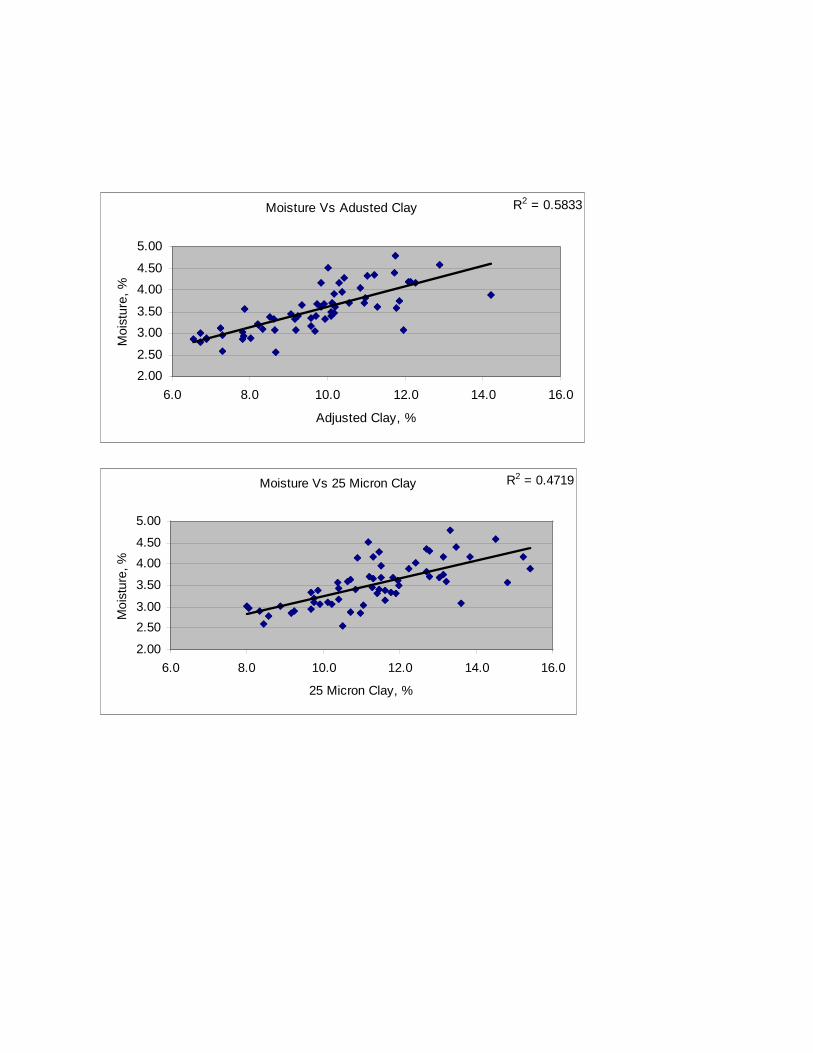
Adjusted Clay, 25 Micron Clay, and Methylene Blue Clay did not correlate as strongly with moisture. Their R-Squared values were 0.58, 0.47 and 0.33 respectively. Again, the main reason Available Clay correlates more strongly with moisture than these other clay values is because moisture is a variable in the Available Clay calculation. Moisture is affected by moisture absorbing material in the sand other than just live (available or methylene blue) clay. Components such as carbons, cellulose, inert fines, and oolitics also absorb moisture. Even the base sand itself has a small moisture requirement that increases with the fineness of the base aggregate. Moisture content also depends on the degree to which the clay is activated with moisture, which depends on how well the sand is tempered. How well the sand is tempered depends not only on clay activation in the muller, but also on the condition and treatment of the sand prior to mulling (how dehydrated the clay was, sand temperature, whether any water was added prior to the silo, and how long the sand was able to condition in the silo if water was added, etc). In some sands, compactability develops on the surface clay, but the deeper clay is dry. This can happen with inadequate pretempering, inadequate or short mulling, hot sand, or from a high degree of dehydration from low sand to metal ratio, a large amount of time between pouring and shakeout, or poor cooling, etc. (Note: It is beneficial to have some clay that is not fully hydrated, so that the sand is not overtempered and weak, and so that there is less chance of free water that can lead to defects such as pinholes, shrinkage and blows). Available clay is a quick calculation that can be done to estimate the live clay present based on the moisture content in the sand, but it is not a precise measure of live clay because there are materials in the sand other than live clay that absorb moisture. One reason for a weaker correlation between methylene blue clay and moisture might be variation in the methylene blue clay test itself. Although the sands in this study were all tested in the same laboratory, with the same methylene blue solution, after calibrating against each foundry’s particular clay. Recent work at the University of Northern Iowa has shown that the methylene blue clay test is very accurate and linear from 0 to 14% clay, if performed carefully. It is the opinion of the author of this section, that the methylene blue clay test is a more accurate measure of clay content than available clay when comparing data from a single laboratory. (Comparing methylene blue data between different laboratories, that use clays with different methylene blue requirements, different procedures or technique, different equipment, different methylene blue solution, and different methods of calibration is another story, and this often leads to comparison problems. Work is currently underway at the University of Northern Iowa as well as Western Michigan University to improve the existing methylene blue clay test and to evaluate alternative methods for measuring live clay in molding sand).

Available clay shows a negative correlation with compactability moisture ratio. The higher the compactability to moisture ratio, the drier the sand is. So, available clay, which is measured by moisture and green strength would be higher when the compactability to moisture ratio is lower. SPECIMEN WEIGHT AND DENSITY
Specimen weight correlates with compacted density because compacted density was calculated from the specimen weight. Sands with high specimen weight have high compacted density due to high silica levels. This is in terms of the weight per unit volume, without reference to how open, or permeable the sand is, which depends on clay level, sand fineness, additives, fines, degree of compaction, and sand temper and conditioning. High compacted density can have implications on heat extraction from the mold, and may affect the tendency for certain defects. Sands with low compacted density may have lower refractoriness, and lower heat conductivity, so may be more prone to burn in type defects or chemical reaction type penetration at the mold metal interface. Sands with high compacted density may be more prone to expansion, and moisture sensitivity, where small changes in moisture cause comparatively high variations in compactability and other sand properties. The best way to control this is by pattern scheduling to avoid wide swings in core sand dilution. If scheduled to even out the core sand
Available Clay Vs Compactability Moisture RatioR2 = 0.6931
5.00
6.00
7.00
8.00
9.00
10.00
8.00 10.00 12.00 14.00 16.00
Compactability : Moisture Ratio
Ava
ilabl
e C
lay,
%
Specimen Weight Vs Compacted Density R2 = 0.9997
144.00
149.00
154.00
159.00
164.00
169.00
87.00 89.00 91.00 93.00 95.00 97.00 99.00 101.00
Compacted Density, lbs/cu. ft.
Spec
imen
Wt,
g
influx as best as possible, the ratio of silica to non-silica components (clay, carbons, ooltics etc) will remain more consistent.
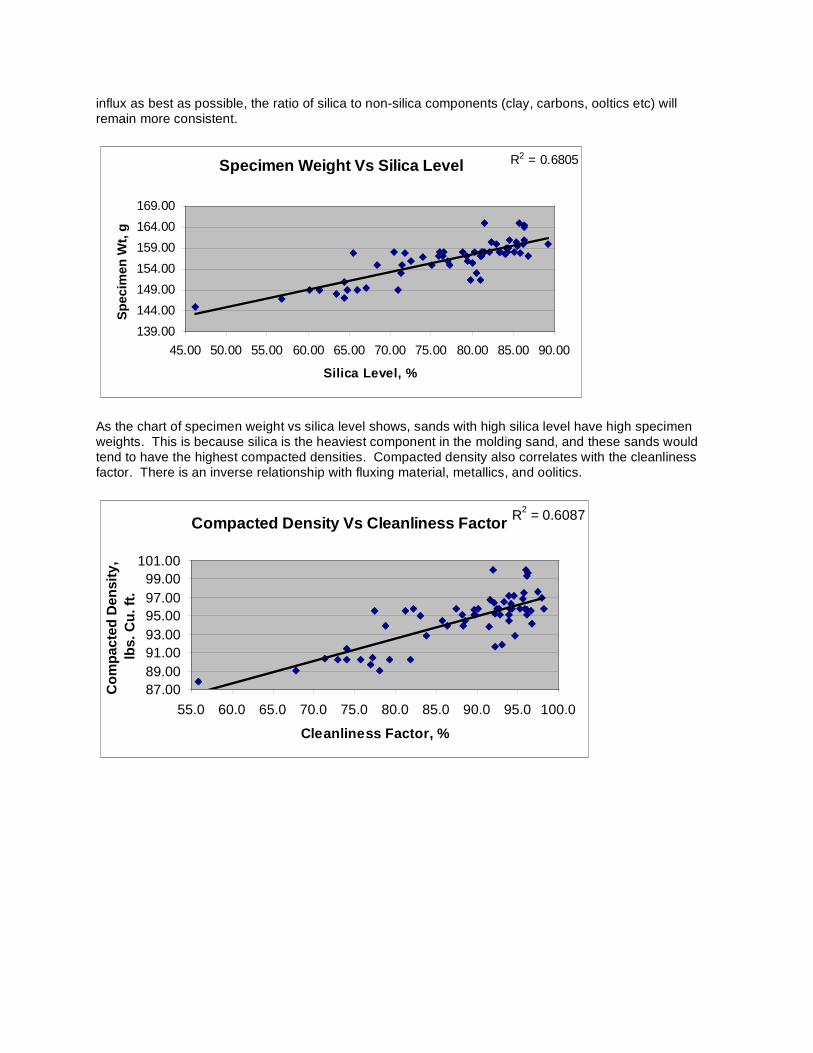
As the chart of specimen weight vs silica level shows, sands with high silica level have high specimen weights. This is because silica is the heaviest component in the molding sand, and these sands would tend to have the highest compacted densities. Compacted density also correlates with the cleanliness factor. There is an inverse relationship with fluxing material, metallics, and oolitics.
Specimen Weight Vs Silica Level R2 = 0.6805
139.00144.00149.00154.00159.00164.00169.00
45.00 50.00 55.00 60.00 65.00 70.00 75.00 80.00 85.00 90.00
Silica Level, %
Spec
imen
Wt,
g
Compacted Density Vs Cleanliness Factor R2 = 0.6087
87.0089.0091.0093.0095.0097.0099.00
101.00
55.0 60.0 65.0 70.0 75.0 80.0 85.0 90.0 95.0 100.0
Cleanliness Factor, %
Com
pact
ed D
ensi
ty,
lbs.
Cu.
ft.

Compacted Density Vs Fluxing Material R2 = 0.5734
87.0089.0091.0093.0095.0097.0099.00
101.00
0.00 5.00 10.00 15.00 20.00 25.00 30.00 35.00
Fluxing Material, %
Com
pact
ed D
ensi
ty, l
bs.
Cu.
ft.
Compacted Density Vs Metallics R2 = 0.5479
87.0089.0091.0093.0095.0097.0099.00
101.00
0.00 0.50 1.00 1.50 2.00
Metallics, %
Com
pact
ed D
ensi
ty,
lbs.
Cu.
ft.
Compacted Density Vs Ooltic Material R2 = 0.5534
87.0089.0091.0093.0095.0097.0099.00
101.00
0.00 5.00 10.00 15.00 20.00 25.00 30.00 35.00
Ooltic Material, %
Com
pact
ed D
ensi
ty,
lbs.
Cu.
ft.

With fluxing material and oolitics, the inverse relationships shown above are due to the fact that these materials are lighter components than silica. With metallics, however, the reason compacted density drops as metallics increase, really has nothing to do with metallics. This is a case of correlation not being causation. It is due to the fact that sands with high metallics are generally sands with low silica levels or or a low amount of core dilution or low new sand input. In systems with low core and/or new sand additions, the sand grains remain in the system longer, so oolitics have a chance to build up, and oolitics are light. In sands that have low core and new sand input, metallics also build up. This is supported by the chart below, which shows metallics vs new + core sand input. It is a weak correlation but it is evident that this is true to a certain extent. There are other factors that also affect metallics contamination, particularly, the care exercised in pouring and efficiency of magnetic separation.
BULK DENSITY
Metallics Vs New + Core Sand Input
R2 = 0.1898
0.00
0.50
1.00
1.50
2.00
0.00 0.02 0.04 0.06 0.08 0.10
Core + New Sand, llbs/lb mold wt
Met
allic
s
Bulk Density Vs CompactabilityR2 = 0.5981 R2 = 0.5981
46.0048.0050.0052.0054.0056.0058.0060.0062.00
34.00 36.00 38.00 40.00 42.00 44.00 46.00 48.00
Compactability, %
Bul
k D
ensi
ty, l
bs./
Cu.
ft.

Bulk density decreases as compactability increases. Compactability is actually an indirect measurement of bulk density. As the clay swells with moisture, the sand fluffs in volume, lowering the bulk density.
Specimen weight increases with bulk density. Sands on the dry side have higher bulk density because the clay is not “fluffed” or swollen with moisture, so more sand grains will fill into a given volume. Therefore, molds made from sand on the dry side will actually be more dense and will have a higher silica to clay ratio than when the sand is on the wet side, and the swollen clay takes up more of the volume.
For the sands in the study, as bulk density increased, compacted density increased. This is due to variations in silica content in this multisystem study. The sands with the highest silica levels had the highest bulk and compacted densities. See below.
Bulk Density Vs Specimen Weight R2 = 0.4326
46.0048.0050.0052.0054.0056.0058.0060.0062.00
139.00 144.00 149.00 154.00 159.00 164.00 169.00
Specimen Weight, g
Bul
k D
ensi
ty, l
bs./
Cu.
ft.
Bulk Density Vs Compacted Density R2 = 0.4333
46.0048.0050.0052.0054.0056.0058.0060.0062.00
87.00 89.00 91.00 93.00 95.00 97.00 99.00 101.00
Compacted Density, lbs/cu. ft.
Bul
k D
ensi
ty, l
bs./
Cu.
ft.
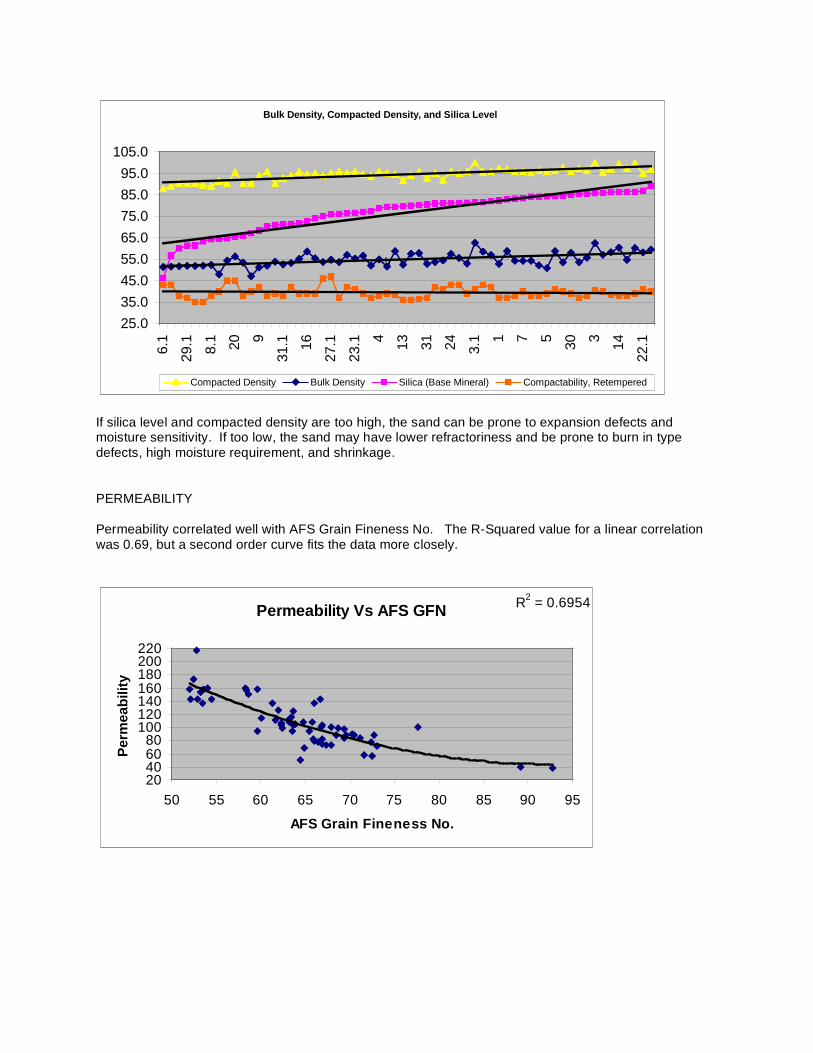
If silica level and compacted density are too high, the sand can be prone to expansion defects and moisture sensitivity. If too low, the sand may have lower refractoriness and be prone to burn in type defects, high moisture requirement, and shrinkage. PERMEABILITY Permeability correlated well with AFS Grain Fineness No. The R-Squared value for a linear correlation was 0.69, but a second order curve fits the data more closely.
Bulk Density, Compacted Density, and Silica Level
25.035.045.055.065.075.085.095.0
105.06.
1
29.1 8.1 20 9
31.1 16
27.1
23.1 4 13 31 24 3.1 1 7 5 30 3 14
22.1
Compacted Density Bulk Density Silica (Base Mineral) Compactability, Retempered
h
Permeability Vs AFS GFN R2 = 0.6954
20406080
100120140160180200220
50 55 60 65 70 75 80 85 90 95
AFS Grain Fineness No.
Perm
eabi
lity

The majority of the molding sands had finenesses in the 60 – 75 AFS GFN range, and the permeabilities of the majority ran from about 60 to 140 permeability. According to the curve, for the molding sands that have AFS grain finenesses of 75 AFS GFN and below, comparatively small changes in fineness cause large differences in permeability. For sands that have finenesses above 75 AFS GFN, there is less difference in permeability as fineness changes.
The relationship between permeability and fines was only about half as strong as with permeability and AFS Grain Fineness. This is good for the reason that a foundry can add fines back to the sand without impacting permeability as much as if going to a finer base sand. It is the authors opinion that foundries should go with as fine a sand as possible, but make up for decreased molding sand permeability by adding mechanical venting (to the pattern, parting line, cope, and venting core prints to the exterior of the mold). This way, surface finish and penetration resistance is optimized by low sand fineness, but the mechanical vents allow the release of core and mold gases. Mechanical venting is very effective at relieving the gas pressure in the mold so that gas defects will not result. GREEN COMPRESSION Green compression correlated very strongly with working bond, because green compression is one of the factors in the equation for working bond. A 1% change in working bond can cause a drop in green strength of about 6 psi
Fines Vs Permeability R2 = 0.2979
20406080
100120140160180200220
0.00 2.00 4.00 6.00 8.00 10.00 12.00 14.00
Fines, %
Perm
eabi
lity

Green strength also correlated with shear strength. Typically, shear strength is about 36% of the green strength. A lower percentage can indicate that the sand is not processed well, which could be for a variety of reasons including a lack of muller maintenance, hot sand, poor return sand reconditioning, or a low level of cumulative mulling.
Green Compression Vs Shear Strength R2 = 0.4808
18
23
28
33
38
7.00 8.00 9.00 10.00 11.00 12.00 13.00 14.00
Shear Strength, psi
Gre
en C
ompr
essi
on,
psi
The charts below further illustrate the relationship between shear strength and how well the sand is processed in terms of green strength efficiency and working bond. When the shear compression ratio drops off, green strength efficiency drops off.
Green Compression Vs Working Bond R2 = 0.9484
3.00
4.00
5.00
6.00
18 20 22 24 26 28 30 32 34 36 38 40
Green Compression, psi
Wor
king
Bon
d, %
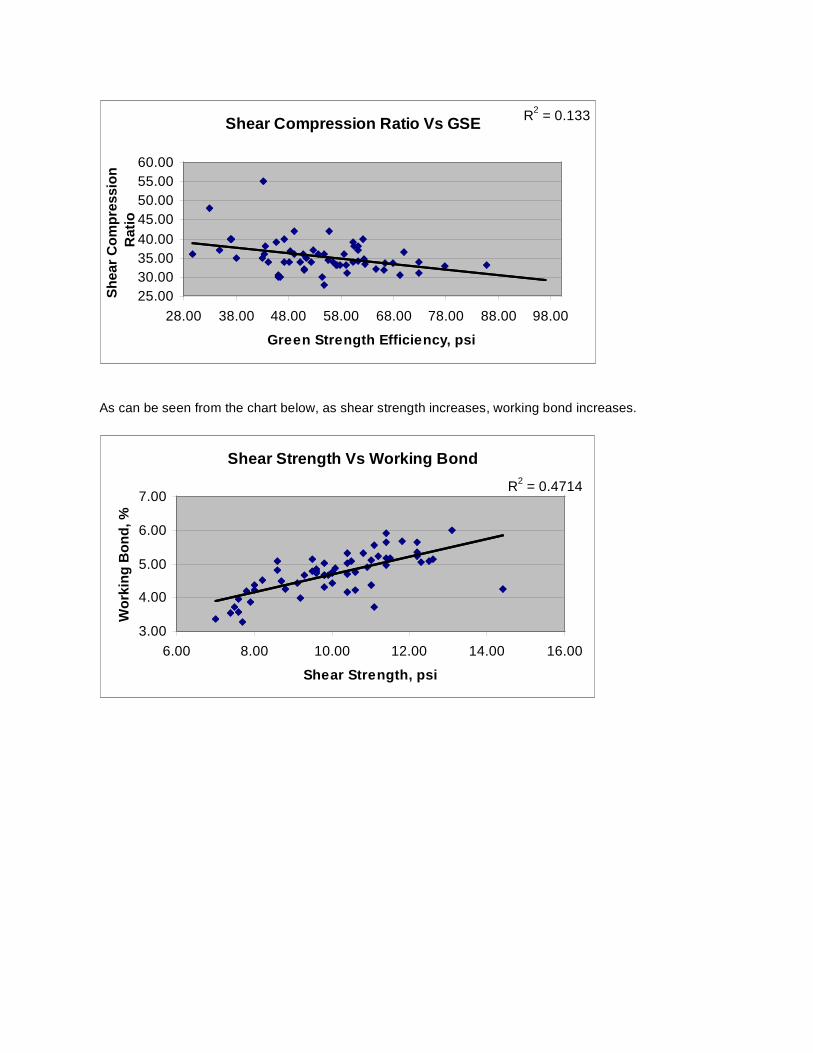
As can be seen from the chart below, as shear strength increases, working bond increases.
Shear Compression Ratio Vs GSE R2 = 0.133
25.0030.0035.0040.0045.0050.0055.0060.00
28.00 38.00 48.00 58.00 68.00 78.00 88.00 98.00
Green Strength Efficiency, psi
Shea
r Com
pres
sion
R
atio
Shear Strength Vs Working Bond
R2 = 0.4714
3.00
4.00
5.00
6.00
7.00
6.00 8.00 10.00 12.00 14.00 16.00
Shear Strength, psi
Wor
king
Bon
d, %

DRY COMPRESSION Dry compression showed a weak correlation with average shakeout time. As shakeout time increased, dry compression decreased. The more time the sand is in contact with heat, the more heat damage and dehydration there will be to the bentonite. Since this is not residual dry compression on return sand, but dry compression on prepared sand tempered in the sand in the laboratory, this suggests that the more dehydrated the sand is, the more difficult it is to temper moisture back into the clay when the sand is in the muller next. Tempering bins, or using a pre-surge bin after cooling, followed by another muller used as a sand preconditioner, just before the return sand silos, is an example of how some foundries prehydrate the clay prior to the main muller/mixer.
FLOWABILITY Flowability correlates weakly with 25 Micron Clay and Methylene Blue Clay. There is a weak negative correlation showing that the higher the 25 Micron Clay and MB Clay, the lower the Flowability. This is as expected, as it is well known that the more clay there is, the less flowable the sand will be.
Dry Compression Vs Average Shakeout TimeR2 = 0.2952
36465666768696
106
0 20 40 60 80 100 120 140
Average Shakeout Time, min
Dry
Com
pres
sion
, psi
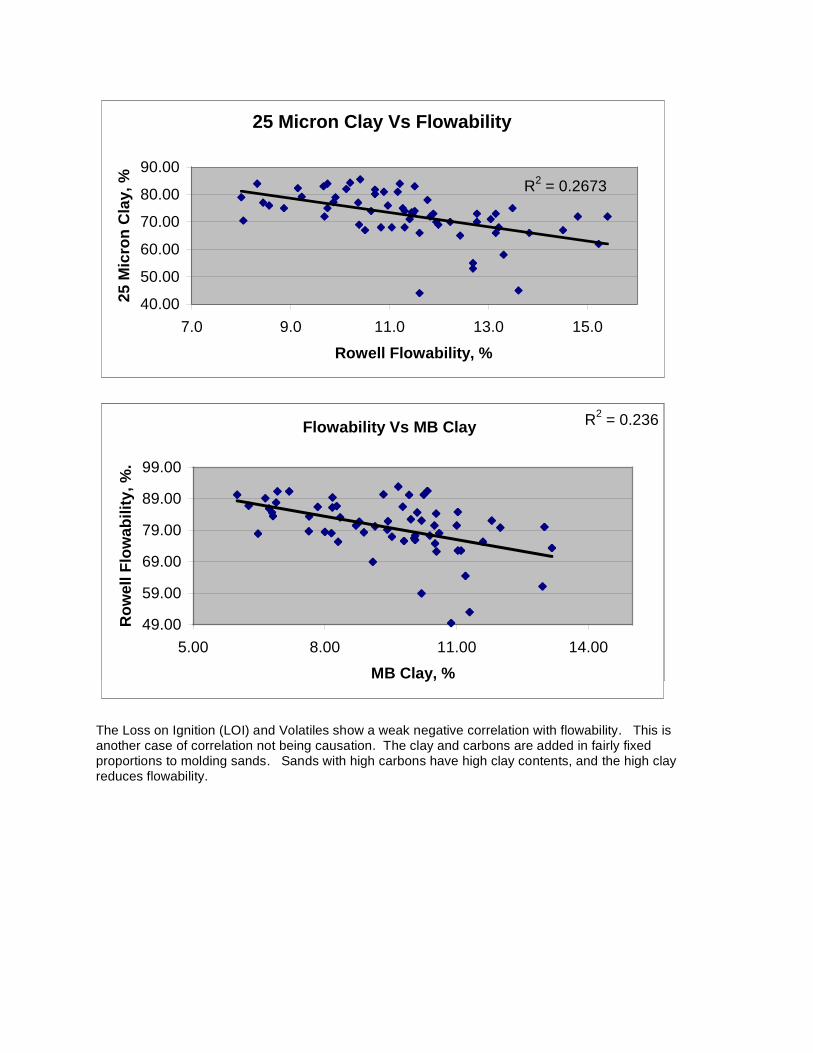
The Loss on Ignition (LOI) and Volatiles show a weak negative correlation with flowability. This is another case of correlation not being causation. The clay and carbons are added in fairly fixed proportions to molding sands. Sands with high carbons have high clay contents, and the high clay reduces flowability.
25 Micron Clay Vs Flowability
R2 = 0.2673
40.00
50.00
60.00
70.00
80.00
90.00
7.0 9.0 11.0 13.0 15.0
Rowell Flowability, %
25 M
icro
n C
lay,
%
Flowability Vs MB Clay R2 = 0.236
49.00
59.00
69.00
79.00
89.00
99.00
5.00 8.00 11.00 14.00
MB Clay, %
Row
ell F
low
abili
ty, %
.
25 Micron Clay Vs Flowability
R2 = 0.2673
40.00
50.00
60.00
70.00
80.00
90.00
7.0 9.0 11.0 13.0 15.0
Rowell Flowability, %
25 M
icro
n C
lay,
%
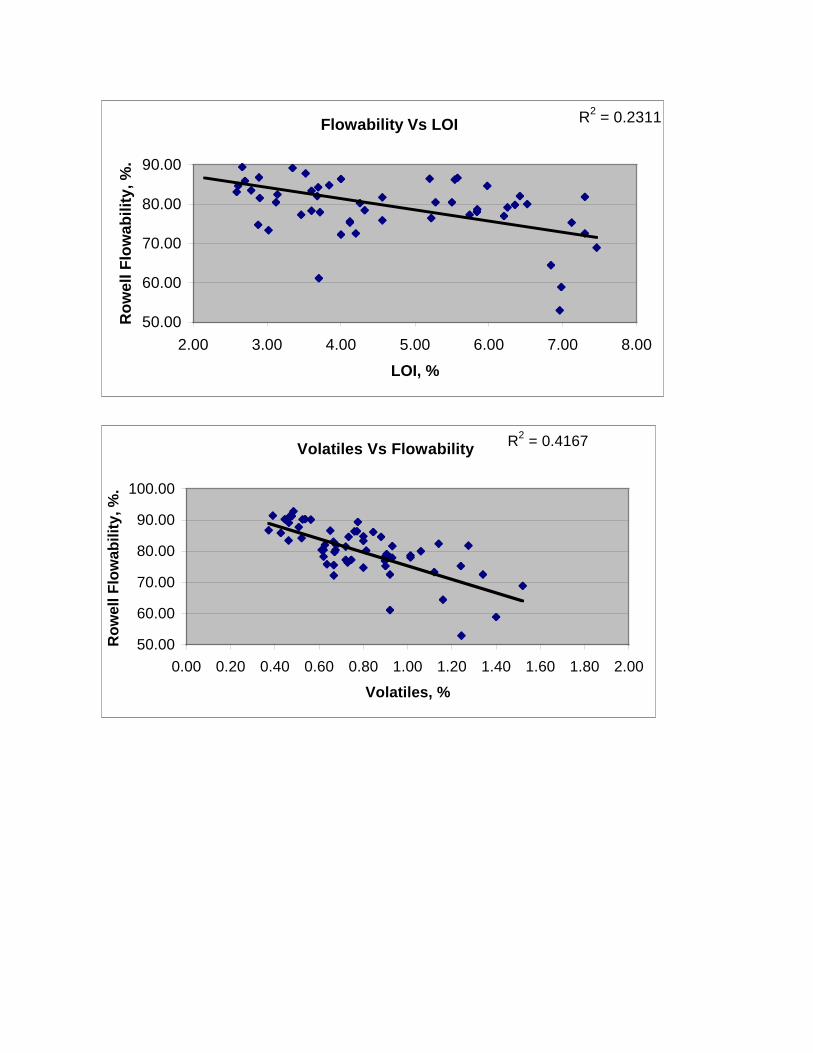
Flowability Vs LOI R2 = 0.2311
50.00
60.00
70.00
80.00
90.00
2.00 3.00 4.00 5.00 6.00 7.00 8.00
LOI, %
Row
ell F
low
abili
ty, %
.
Volatiles Vs Flowability R2 = 0.4167
50.00
60.00
70.00
80.00
90.00
100.00
0.00 0.20 0.40 0.60 0.80 1.00 1.20 1.40 1.60 1.80 2.00
Volatiles, %
Row
ell F
low
abili
ty, %
.
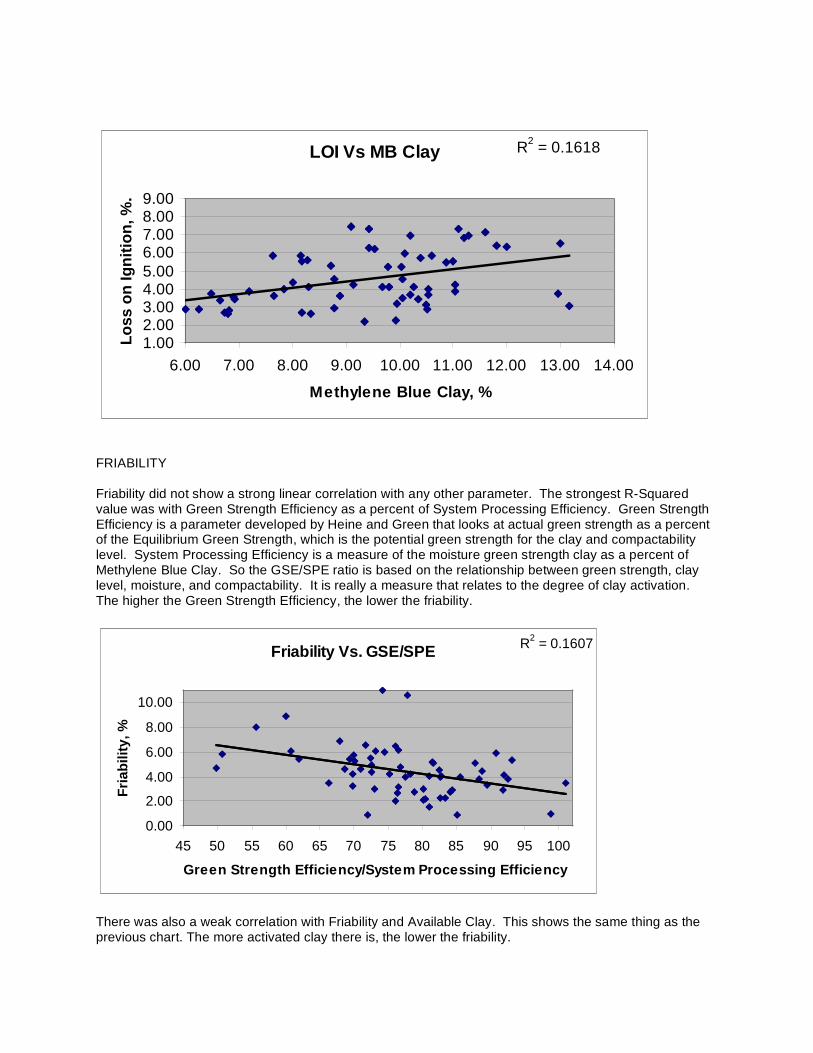
FRIABILITY Friability did not show a strong linear correlation with any other parameter. The strongest R-Squared value was with Green Strength Efficiency as a percent of System Processing Efficiency. Green Strength Efficiency is a parameter developed by Heine and Green that looks at actual green strength as a percent of the Equilibrium Green Strength, which is the potential green strength for the clay and compactability level. System Processing Efficiency is a measure of the moisture green strength clay as a percent of Methylene Blue Clay. So the GSE/SPE ratio is based on the relationship between green strength, clay level, moisture, and compactability. It is really a measure that relates to the degree of clay activation. The higher the Green Strength Efficiency, the lower the friability.
There was also a weak correlation with Friability and Available Clay. This shows the same thing as the previous chart. The more activated clay there is, the lower the friability.
LOI Vs MB Clay R2 = 0.1618
1.002.003.004.005.006.007.008.009.00
6.00 7.00 8.00 9.00 10.00 11.00 12.00 13.00 14.00
Methylene Blue Clay, %
Loss
on
Igni
tion,
%.
Friability Vs. GSE/SPE R2 = 0.1607
0.00
2.00
4.00
6.00
8.00
10.00
45 50 55 60 65 70 75 80 85 90 95 100
Green Strength Efficiency/System Processing Efficiency
Fria
bilit
y, %
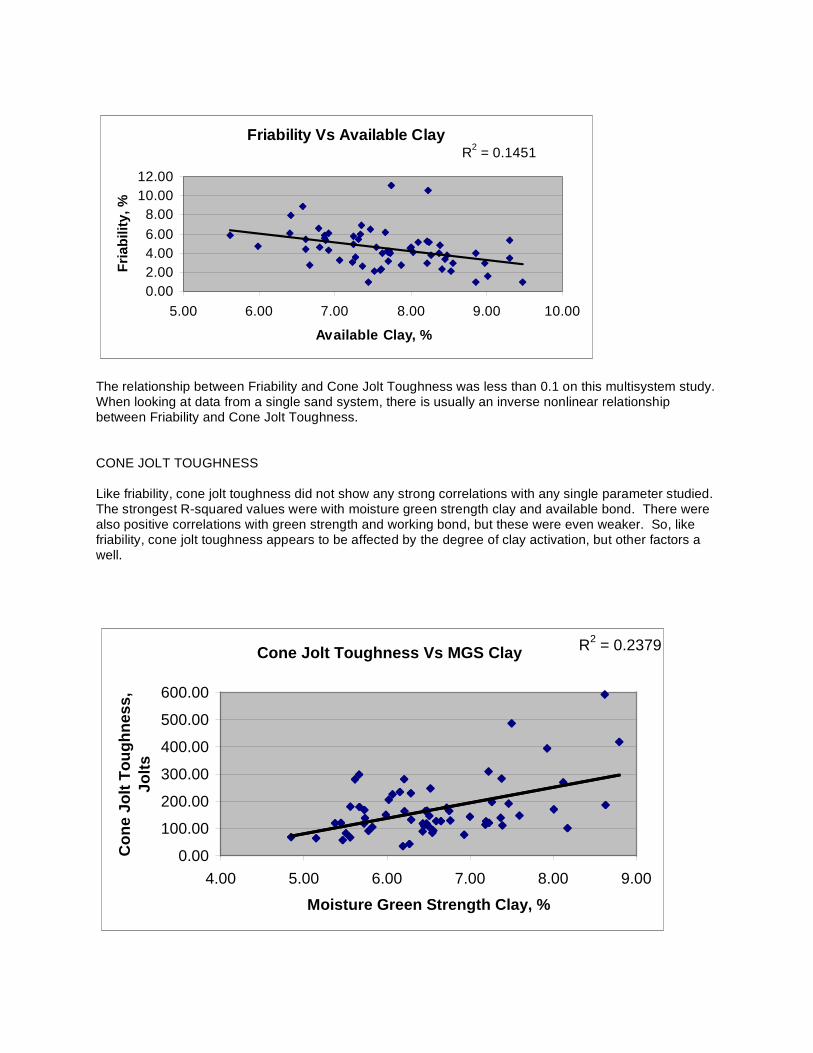
The relationship between Friability and Cone Jolt Toughness was less than 0.1 on this multisystem study. When looking at data from a single sand system, there is usually an inverse nonlinear relationship between Friability and Cone Jolt Toughness. CONE JOLT TOUGHNESS Like friability, cone jolt toughness did not show any strong correlations with any single parameter studied. The strongest R-squared values were with moisture green strength clay and available bond. There were also positive correlations with green strength and working bond, but these were even weaker. So, like friability, cone jolt toughness appears to be affected by the degree of clay activation, but other factors a well.
Friability Vs Available ClayR2 = 0.1451
0.002.004.006.008.00
10.0012.00
5.00 6.00 7.00 8.00 9.00 10.00
Available Clay, %
Fria
bilit
y, %
Cone Jolt Toughness Vs MGS Clay R2 = 0.2379
0.00
100.00
200.00
300.00
400.00
500.00
600.00
4.00 5.00 6.00 7.00 8.00 9.00
Moisture Green Strength Clay, %
Con
e Jo
lt To
ughn
ess,
Jo
lts
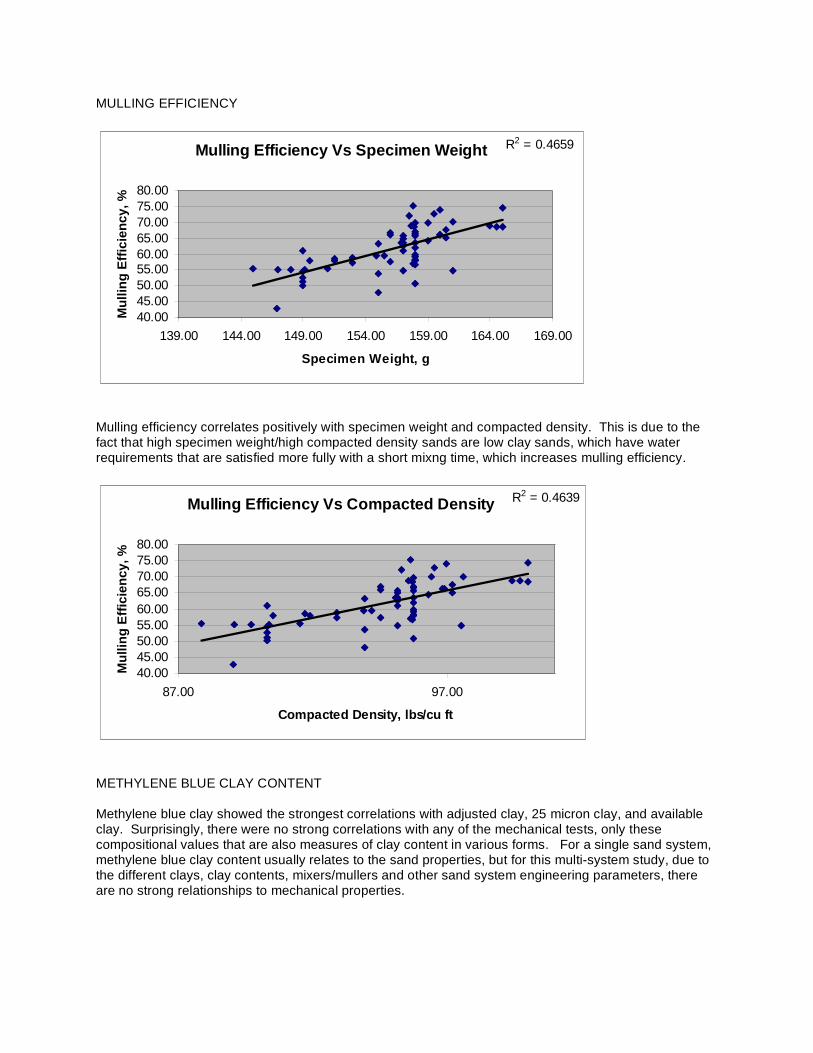
MULLING EFFICIENCY
Mulling efficiency correlates positively with specimen weight and compacted density. This is due to the fact that high specimen weight/high compacted density sands are low clay sands, which have water requirements that are satisfied more fully with a short mixng time, which increases mulling efficiency.
METHYLENE BLUE CLAY CONTENT Methylene blue clay showed the strongest correlations with adjusted clay, 25 micron clay, and available clay. Surprisingly, there were no strong correlations with any of the mechanical tests, only these compositional values that are also measures of clay content in various forms. For a single sand system, methylene blue clay content usually relates to the sand properties, but for this multi-system study, due to the different clays, clay contents, mixers/mullers and other sand system engineering parameters, there are no strong relationships to mechanical properties.
Mulling Efficiency Vs Specimen Weight R2 = 0.4659
40.0045.0050.0055.0060.0065.0070.0075.0080.00
139.00 144.00 149.00 154.00 159.00 164.00 169.00
Specimen Weight, g
Mul
ling
Effic
ienc
y, %
Mulling Efficiency Vs Compacted Density R2 = 0.4639
40.0045.0050.0055.0060.0065.0070.0075.0080.00
87.00 97.00
Compacted Density, lbs/cu ft
Mul
ling
Effic
ienc
y, %

25 MICRON CLAY 25 Micron Clay, like methylene blue clay, correlated with several compositional factors, but did not correlate well, in this multi-system study, with any of the green properties. The strongest correlation was with adjusted clay, as one might expect, since the adjusted clay is the 25 micron clay minus any organic material in the clay fraction. There was also a relationship with MB clay as already shown in the MB Clay section above.
MB Clay Vs 25 Micron Clay R2 = 0.4946
8.0
10.0
12.0
14.0
16.0
6.00 7.00 8.00 9.00 10.00 11.00 12.00 13.00 14.00
Methylene Blue Clay, %
25 M
icro
n C
lay,
%
MB Clay Vs Available Clay R2 = 0.3521
5.00
6.00
7.00
8.00
9.00
10.00
6.00 7.00 8.00 9.00 10.00 11.00 12.00 13.00 14.00
Methylene Blue Clay, %
Ava
ilabl
e C
lay,
%
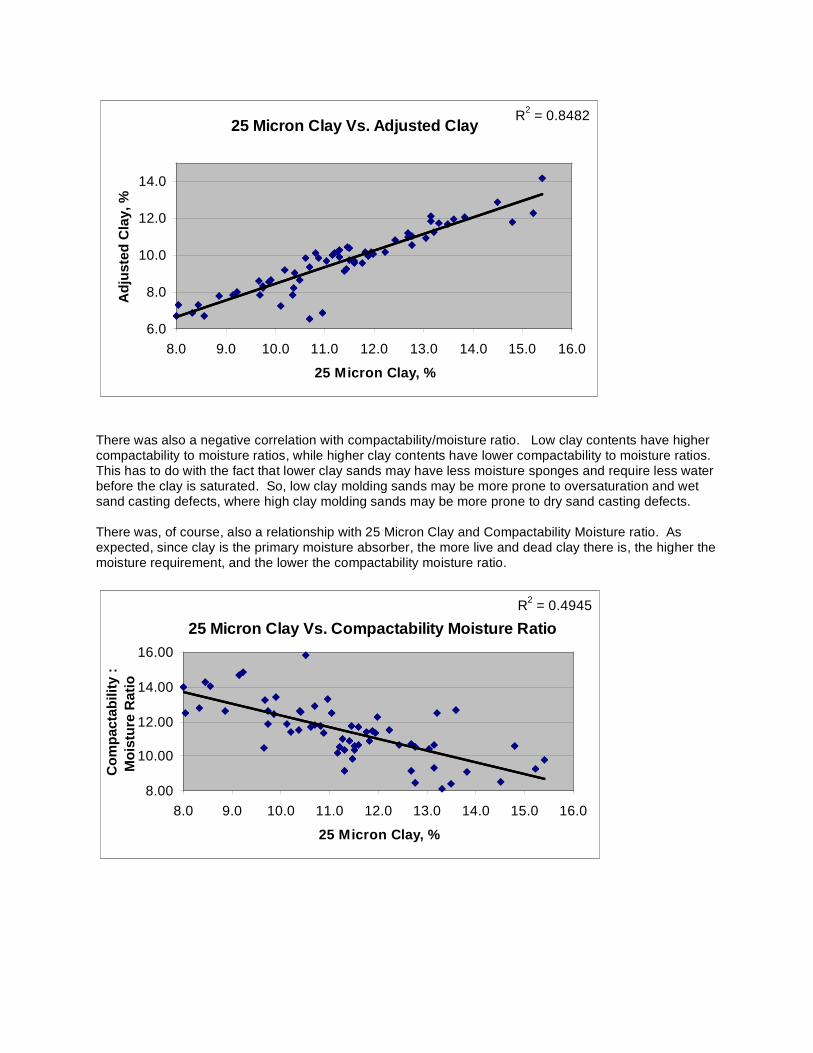
There was also a negative correlation with compactability/moisture ratio. Low clay contents have higher compactability to moisture ratios, while higher clay contents have lower compactability to moisture ratios. This has to do with the fact that lower clay sands may have less moisture sponges and require less water before the clay is saturated. So, low clay molding sands may be more prone to oversaturation and wet sand casting defects, where high clay molding sands may be more prone to dry sand casting defects. There was, of course, also a relationship with 25 Micron Clay and Compactability Moisture ratio. As expected, since clay is the primary moisture absorber, the more live and dead clay there is, the higher the moisture requirement, and the lower the compactability moisture ratio.
25 Micron Clay Vs. Adjusted Clay R2 = 0.8482
6.0
8.0
10.0
12.0
14.0
8.0 9.0 10.0 11.0 12.0 13.0 14.0 15.0 16.0
25 Micron Clay, %
Adj
uste
d C
lay,
%
25 Micron Clay Vs. Compactability Moisture RatioR2 = 0.4945
8.00
10.00
12.00
14.00
16.00
8.0 9.0 10.0 11.0 12.0 13.0 14.0 15.0 16.0
25 Micron Clay, %
Com
pact
abili
ty :
Moi
stur
e R
atio
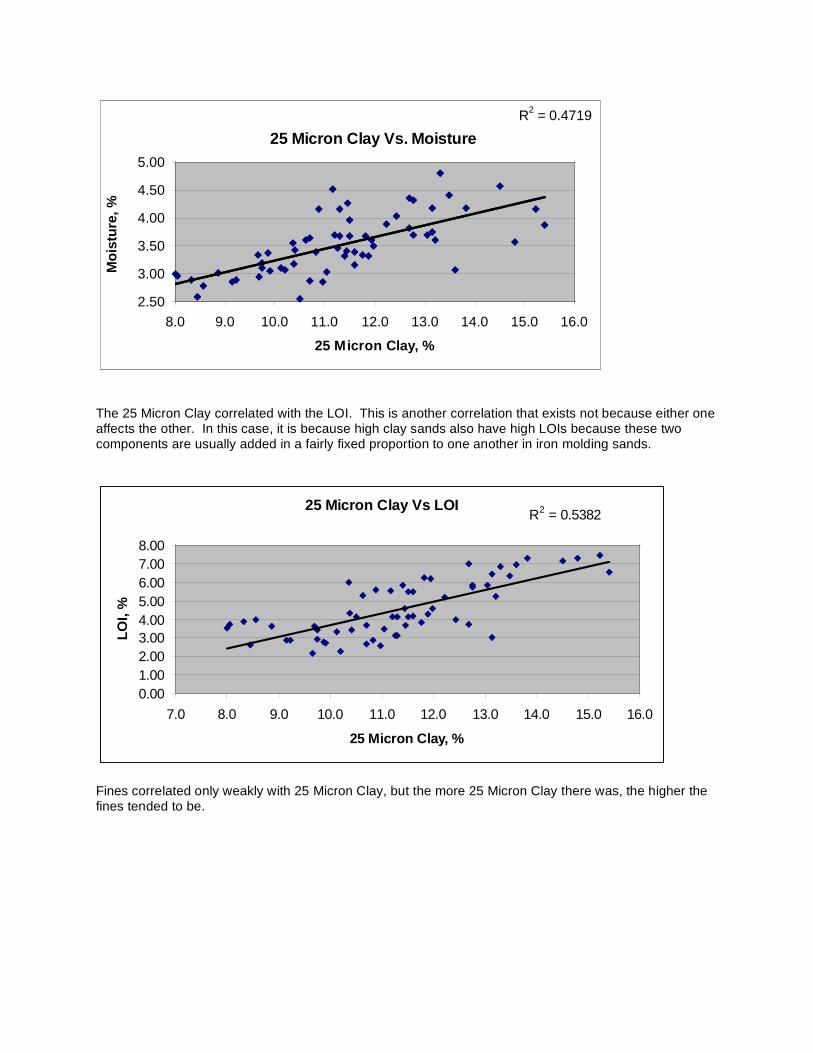
The 25 Micron Clay correlated with the LOI. This is another correlation that exists not because either one affects the other. In this case, it is because high clay sands also have high LOIs because these two components are usually added in a fairly fixed proportion to one another in iron molding sands.
Fines correlated only weakly with 25 Micron Clay, but the more 25 Micron Clay there was, the higher the fines tended to be.
25 Micron Clay Vs. Moisture R2 = 0.4719
2.50
3.00
3.50
4.00
4.50
5.00
8.0 9.0 10.0 11.0 12.0 13.0 14.0 15.0 16.0
25 Micron Clay, %
Moi
stur
e, %
25 Micron Clay Vs LOIR2 = 0.5382
0.001.002.003.004.005.006.007.008.00
7.0 8.0 9.0 10.0 11.0 12.0 13.0 14.0 15.0 16.0
25 Micron Clay, %
LOI,
%

AFS GRAIN FINENESS As expected, there was a strong positive correlation between the AFS grain fineness number and the percent fines.
Fines Vs 25 Micron Clay R2 = 0.2063
0.00
2.00
4.00
6.00
8.00
10.00
12.00
14.00
7.0 8.0 9.0 10.0 11.0 12.0 13.0 14.0 15.0 16.0
25 Micron Clay, %
Fine
s, %
AFS GFN Vs Fines R2 = 0.6968
0.002.004.006.008.00
10.0012.0014.00
51 61 71 81 91
AFS Grain Fineness No.
Fine
s, %

Also, as expected,there were a strong negative correlations between AFS Grain Fineness and fines as they relate to permeability.
LOSS ON IGNITION (LOI) There was a 0.99 R-Squared value for LOI and Carbonaceous Material, because carbonaceous material is the LOI corrected for the interlayer moisture held in the clay. The next strongest correlation with LOI was between LOI and specimen weight. The higher the loss on ignition, the lower the specimen weight. This is because carbons are light. The more carbons there are, the less silica there is. Also, the more carbons there are, the more clay there is because these are added in proportion. So the more clay and carbons there are, the less silica there is, and since silica is the heaviest component, the lower the specimen weight will be.
Fines Vs Permeability R2 = 0.2979
20406080
100120140160180200220
0.00 2.00 4.00 6.00 8.00 10.00 12.00 14.00
Fines, %
Perm
eabi
lity
Permeability Vs AFS GFN R2 = 0.6954
20406080
100120140160180200220
50 55 60 65 70 75 80 85 90 95
AFS Grain Fineness No.
Perm
eabi
lity
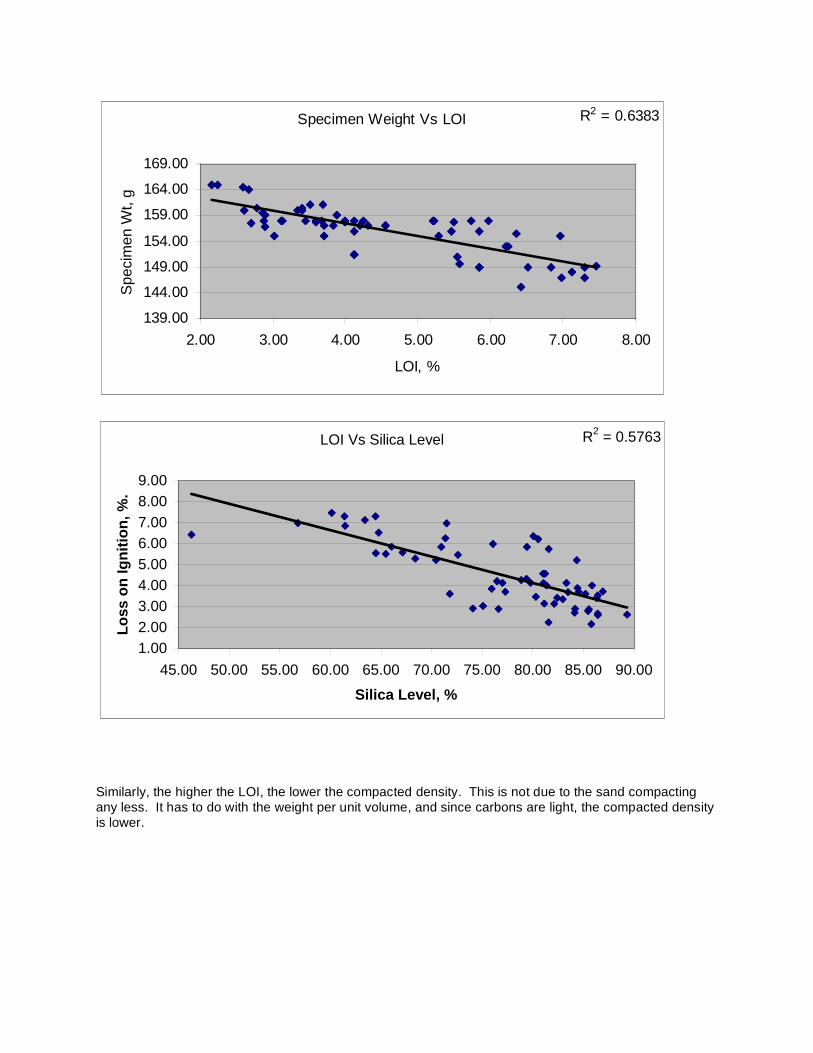
Similarly, the higher the LOI, the lower the compacted density. This is not due to the sand compacting any less. It has to do with the weight per unit volume, and since carbons are light, the compacted density is lower.
Specimen Weight Vs LOI R2 = 0.6383
139.00
144.00
149.00
154.00
159.00
164.00
169.00
2.00 3.00 4.00 5.00 6.00 7.00 8.00
LOI, %
Spe
cim
en W
t, g
LOI Vs Silica Level R2 = 0.5763
1.002.003.004.005.006.007.008.009.00
45.00 50.00 55.00 60.00 65.00 70.00 75.00 80.00 85.00 90.00
Silica Level, %
Loss
on
Igni
tion,
%.

There was a positive correlation with LOI and metallics. This was unexpected and the reasons are not understood. This is probably a case where the two do not influence one another, but they are both linked to some other parameter that when higher, both of these tend to be higher.
25 micron clay also correlated with LOI. Again, this is because clay and carbons are usually in proportion to one another. The chart is shown in the section on 25 Micron Clay.
LOI Vs. Compacted DensityR2 = 0.6344
86.0088.0090.0092.0094.0096.0098.00
100.00102.00
2.00 3.00 4.00 5.00 6.00 7.00 8.00
LOI, %
Com
pact
ed D
ensi
ty,
lbs/
cu ft
.
LOI Vs Metallics R2 = 0.5486
1.002.003.004.005.006.007.008.009.00
0.00 0.25 0.50 0.75 1.00 1.25 1.50 1.75 2.00
Metallics, %
Loss
on
Igni
tion,
%.
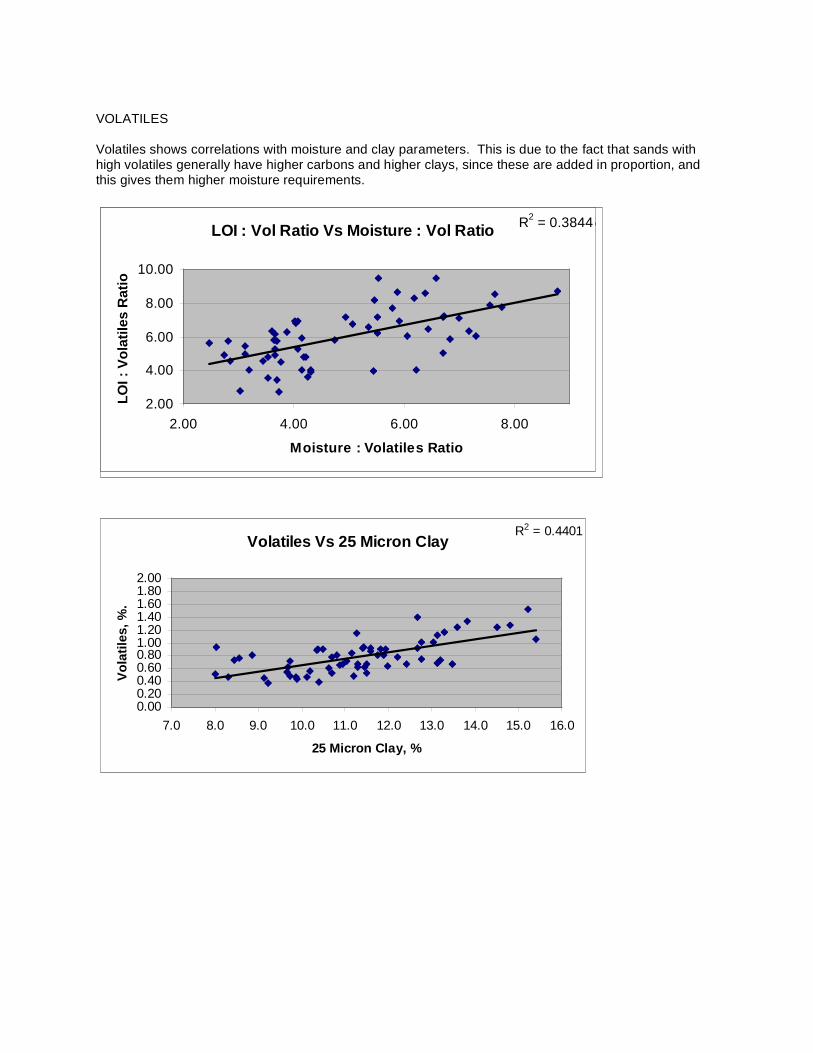
VOLATILES Volatiles shows correlations with moisture and clay parameters. This is due to the fact that sands with high volatiles generally have higher carbons and higher clays, since these are added in proportion, and this gives them higher moisture requirements.
Volatiles Vs. Moisture Volatile RatioR2 = 0.7935
1.00
3.00
5.00
7.00
9.00
0.00 0.20 0.40 0.60 0.80 1.00 1.20 1.40 1.60 1.80 2.00
Volatiles, %
Moi
stur
e Vo
latil
e R
atio
LOI : Vol Ratio Vs Moisture : Vol Ratio R2 = 0.3844
2.00
4.00
6.00
8.00
10.00
2.00 4.00 6.00 8.00
Moisture : Volatiles Ratio
LOI :
Vol
atile
s R
atio
Volatiles Vs 25 Micron ClayR2 = 0.4401
0.000.200.400.600.801.001.201.401.601.802.00
7.0 8.0 9.0 10.0 11.0 12.0 13.0 14.0 15.0 16.0
25 Micron Clay, %
Vola
tiles
, %.

ADJUSTED CLAY Adjusted clay is the 25 micron clay corrected for organic material. This parameter correlated with the same things that 25 micron clay correlated with, but it also had negative correlations with specimen weight, compacted density, and silica level that were stronger than they were with 25 micron clay.
Adjusted Clay Vs Specimen Weight R2 = 0.5013
140.00
145.00
150.00
155.00
160.00
165.00
170.00
6.0 7.0 8.0 9.0 10.0 11.0 12.0 13.0 14.0 15.0
Adjusted Clay, %
Spe
cim
en W
t. G
Adjusted Clay Vs Compacted Density R2 = 0.4983
86.0088.0090.0092.0094.0096.0098.00
100.00102.00
6.0 7.0 8.0 9.0 10.0 11.0 12.0 13.0 14.0 15.0
Adjusted Clay, %
Com
pact
ed D
ensi
ty, l
bs./c
u ft
Adjusted Clay Vs Silica Content R2 = 0.4665
0.00
20.00
40.00
60.00
80.00
100.00
6.0 7.0 8.0 9.0 10.0 11.0 12.0 13.0 14.0 15.0
Adjusted Clay, %
Silic
a C
onte
nt, %

DEAD CLAY (ADJUSTED CLAY – MB CLAY) Adjusted clay minus MB clay is a better estimate of dead clay than 25 micron clay minus MB clay. This is because 25 micron clay does include some organic material that washes out with the clay. The inert fines has a high R-squared value with dead clay, because these are really the same thing, except that inert fines is corrected for metallics.
Volatiles Vs Adjusted Clay R2 = 0.3337
0.000.200.400.600.801.001.201.401.601.802.00
6.0 7.0 8.0 9.0 10.0 11.0 12.0 13.0 14.0 15.0
Adjusted Clay, %
Vola
tiles
, %.
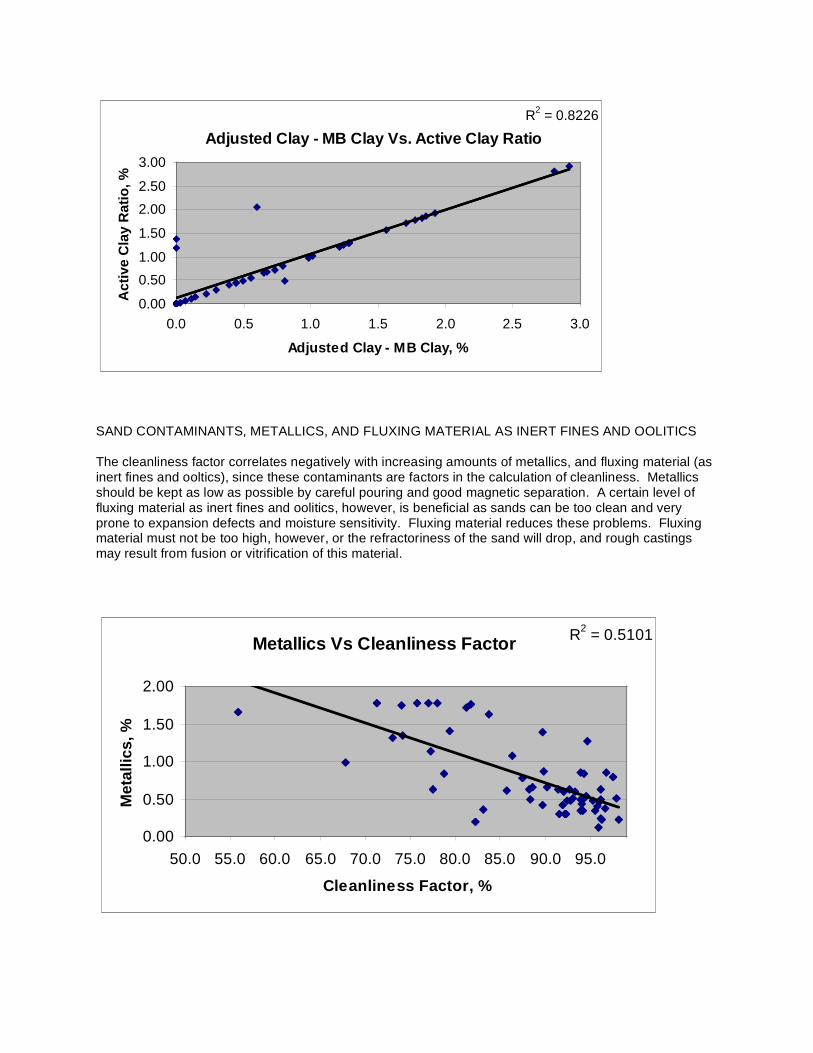
SAND CONTAMINANTS, METALLICS, AND FLUXING MATERIAL AS INERT FINES AND OOLITICS The cleanliness factor correlates negatively with increasing amounts of metallics, and fluxing material (as inert fines and ooltics), since these contaminants are factors in the calculation of cleanliness. Metallics should be kept as low as possible by careful pouring and good magnetic separation. A certain level of fluxing material as inert fines and oolitics, however, is beneficial as sands can be too clean and very prone to expansion defects and moisture sensitivity. Fluxing material reduces these problems. Fluxing material must not be too high, however, or the refractoriness of the sand will drop, and rough castings may result from fusion or vitrification of this material.
Adjusted Clay - MB Clay Vs. Active Clay RatioR2 = 0.8226
0.00
0.501.00
1.50
2.002.50
3.00
0.0 0.5 1.0 1.5 2.0 2.5 3.0
Adjusted Clay - MB Clay, %
Act
ive
Cla
y R
atio
, %
Metallics Vs Cleanliness Factor R2 = 0.5101
0.00
0.50
1.00
1.50
2.00
50.0 55.0 60.0 65.0 70.0 75.0 80.0 85.0 90.0 95.0
Cleanliness Factor, %
Met
allic
s, %

Fluxing Material Vs Cleanliness Factor R2 = 0.9953
50.060.070.080.090.0
100.0
0.00 5.00 10.00 15.00 20.00 25.00 30.00 35.00 40.00
Fluxing Material, %
Cle
anlin
ess
Fact
or,
Inert Fines Vs Active Clay Ratio R2 = 0.8139
0.000.501.001.502.002.503.003.504.00
0.50 0.70 0.90 1.10
Active Clay Ratio, MB/25 Micron Clay
Iner
t Fin
es, %
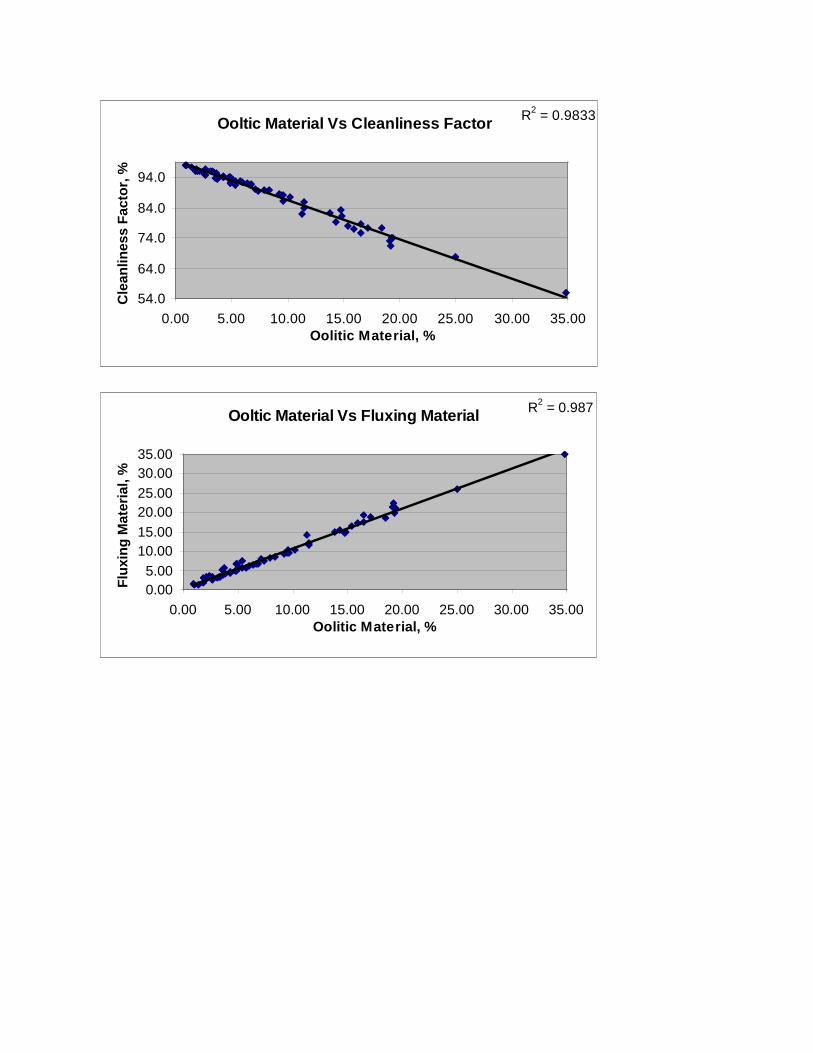
Ooltic Material Vs Cleanliness Factor R2 = 0.9833
54.0
64.0
74.0
84.0
94.0
0.00 5.00 10.00 15.00 20.00 25.00 30.00 35.00Oolitic Material, %
Cle
anlin
ess
Fact
or, %
Ooltic Material Vs Fluxing Material R2 = 0.987
0.005.00
10.0015.0020.0025.0030.0035.00
0.00 5.00 10.00 15.00 20.00 25.00 30.00 35.00Oolitic Material, %
Flux
ing
Mat
eria
l, %

SAND TEMPERATURE Return sand temperature correlates with discharge sand temperature. Despite the fact that there were foundries with no coolers, and foundries with active cooling systems, this relationship was still present. There is new technology available that uses vacuum for cooling in the mixer. With this technology, the discharge temperature is controlled by how deep of vacuum is drawn. The deeper the vacuum, the cooler the sand at discharge, despite incoming sand temperature or ambient conditions of temperature and humidity which affect cooling on conventional systems.
The return sand temperature is shown to affect bond/premix usage as shown in the chart below. The higher the return sand temperature, the higher the bond usage. This is a hydration issue, where hot, dehydrated sands would have degraded properties, and would therefore require more bond to achieve the target strength.
Return Sand Temp Vs Discharge Sand Temp R2 = 0.507
70.00
90.00
110.00
130.00
150.00
70 80 90 100 110 120 130 140 150
Return Sand Temp F
Dis
char
ge S
and
Tem
p
Return Sand Temp Vs Bond/Premix R2 = 0.5015
-100-50
050
100150200250300350
70 80 90 100 110 120 130 140 150
Return Sand Temp, F
Bon
d Pr
emix
, lbs
/bat
ch

SAND TO METAL RATIO There was a weak correlation between sand to metal ratio and inert fines. At low sand to metal ratios, the new material input of new sand and clay is high resulting in lower amount of inert fines.
There was a weak correlation of sand to metal ratio with active clay. Again, at low sand to metal ratio, a large amount of new clay and new sand must be added, and this prevents a build up of dead clay.
There were not many foundries that reported all the information on bond/preblend usage so there are fewer data points for the charts below which show sand to metal ratio vs bond usage (as opposed to premix usage). The charts show that the higher the sand to metal ratio, the lower the bond usage. (These values are lbs/batch. It would be more correct to convert to a batch percentage, but not all of the
Sand to Metal Ratio Vs Inert Fines R2 = 0.3419
-1.00
0.00
1.00
2.00
3.00
4.00
0 1 1 2 2 3 3 4 4 5 5 6 6 7 7 8 8 9 9 10 10 11 11
Sand Metal Ratio
Iner
t Fin
es, %
Sand to Metal Ratio Vs Active Clay Ratio R2 = 0.2995
0.000.250.500.751.001.251.50
0 1 1 2 2 3 3 4 4 5 5 6 6 7 7 8 8 9 9 101011111212
Sand Metal Ratio
Act
ive
Cla
y R
atio

foundries reported mixer capacity).. Using a high sand to metal ratio causes less burn out of the clay and carbons present. More importantly, use of a high sand to metal ratio buffers all changes in sand properties, because the heat of the metal has less impact on the sand as a whole. One way to provide immediate improvement in sand system control is to use a higher sand to metal ratio to reduce the impact of the metal casting process on the sand. It is not a good idea to pack as many castings into a mold as possible, because this makes sand system control more difficult.
Sand to Metal Ratio Vs Bond/Premix Usage R2 = 0.3406
050
100150200250300350
0 1 1 2 2 3 3 4 4 5 5 6 6 7 7 8 8 9 9 101011111212
Sand Metal Ratio
Bon
d-Pr
emix
, lb
s/ba
tch
Sand to Metal Ratio Vs Bond Usage R2 = 0.5135
0.00
1.00
2.00
3.00
4.00
5.00
0 1 1 2 2 3 3 4 4 5 5 6 6 7 7 8 8 9 9 101011111212
Sand Metal Ratio
Bon
d, lb
s/ba
tch

Bond Consumption There was limited data on bond usage supplied by the participating foundries. Even the data supplied were not all based on same parameters. It was difficult to make strong conclusions based on the supplied data. However, even then the following seem to emerge from the information gathered. Factors affecting bond consumption:
1. Sand to metal ratio – When the ratio is small around 5, (mainly Disamatic molding systems) bond addition per batch or per ton of sand mulled was high. This will makes sense as the metal poured in the same amount of sand and new materials added will be higher with lower sand to metal ratio.
2. Sand temperature – the higher the sand temperature the higher the bond addition. This also agrees with the fact that the sand temperature will be higher with lower sand to metal ratio.
3. Cooling systems – active cooling systems such as fluid bed cooling, multi mull or vacuum cooling where there is air flow through the sand mass, there is increased loss of bond hence the usage of bond is higher.
4. Dust collection – Aggressive dust collection at many points such as rotary shakeouts, cooling, transfer points and in the muller increases bond consumption
5. Rate of new material additions – high rate of new materials addition such as core sand, new sand leads to increased bond consumption.
6. MB clay level – Bond consumption is higher when the clay level is maintained high 7. Bond addition is also high when the dust collector fines are not recycled and added back into the
system 8. Bond addition is also high, when the bond is added at the muller, rather than pre blending with
return sand prior to storage silos. 9. Low return sand storage capacity or inefficient us eof return sand silos may also increase bond
consumption.

Compactability/moisture Ratio Moisture requirements in a sand system depends on many factors:
1. Compactability 2. MB clay level 3. Moisture absorbing materials other than clay – fines, cellulose, cereals etc. 4.
Even when the factors listed above are the same, moisture required to control the compactability at the molding machine varies. Some of the factors affecting this:
• State of mulling – moisture requirement is highest when the bond is fully mulled. In actual systems the system sand is not fully mulled and the level mulling varies depending on variables such as sand to metal ratio, new material input, mulling time, and condition of the muller, the location of bond addition, temperature of sand, level of sand in the return sand silos.
One way to monitor the moisture requirement is to monitor the compactability to moisture ratio. For a given sand system, when this ratio is high, the moisture requirement is low and vice versa. Each sand system the range for this ratio should be established and changes to this ratio should be investigated. To control sand system, it is important to pay attention to this factor as this may indicate potential problems in molding and casting quality. When this ratio decreases, moisture requirement has increased which may decrease sand flowability and gas related defects may increase. When the ratio increases, sand will be drier for the same factors listed above, resulting in friable sand and increase in inclusion defects. At a target ratio of MB clay a range for the ratio should be established based on good molding and casting quality. At around 11% MB clay, the ratio of 10 to 12 is commonly used by many. This range shifts up for lower clay level and shifts lower for higher clay levels.
MB Clay Vs Comp to Moisture Ratio
6.00
8.00
10.00
12.00
14.00
16.00
18.00
5.00 6.00 7.00 8.00 9.00 10.00 11.00 12.00 13.00 14.00 15.00
MB Clay
Com
pact
abili
ty to
Moi
stur
e R
atio

CONCLUSIONS The DIS has study has provided valuable comparisons of many different iron molding sands. From the data, a useful chart has been developed that can be used as a guideline for comparison and benchmarking of iron molding sands. This chart shows the various sand properties, recommended levels, for vertically parted versus horizontally parted molding, and problems that may result if the sand properties are either too high or too low.

Test
Min Max Avg Min Max If high If lowSand Temperature, F 80 132 110
Return Sand 80 145 116Discharge Sand 80 132 110
Moisture, % 2.6 4.8 3.5Vertically Parted 3 4.6 3.7 3.2 4.2
Horizontally Parted 2.6 4.2 3.2 2.8 3.6
Compactability, % (At molding machine, not considering extra to compensate for drop in transit to molding machine)
*** *** ***
Vertically Parted *** *** *** 32 36Horizontally Parted *** *** *** 36 42
Compact/Moisture Ratio 8.3 16.6 11.1MB Clay Level 6 to 8 12 15
MB Clay Level 8 to 12 10 12MB Clay Level 12 to 14 8 10
Specimen Weight, g 145 165 156
Vertically Parted 145 165 155
Horizontally Parted 149 165 158Bulk density, lbs/cu ft 47 63 55
Vertically Parted 47 63 55Horizontally Parted 51 60 54
Comp. Density, lbs/cu ft 88 100 95
Vertically Parted 88 100 94
Horizontally Parted 90 100 96
Permeability, AFS 38.1 217 107.5
Vertically Parted 38 114 87 80 110
Horizontally Parted 50 216 131 100 160
Green Comp. St., psi 19.3 38 28.5
Vertically Parted 23 38 30 25 35
Horizontally Parted 19 32 28 20 30Shear strength, psi 7 14 10
Vertically Parted 8 14 11 9 13
Horizontally Parted 7 13 10 8 11 See high green strength Poor draws, drops, erosion, and inclusions
Shear/G Comp ratio 0.28 0.55 0.36Vertically Parted 0.30 0.55 0.36
Horizontally Parted 0.28 0.42 0.35
Rowell Flowability, % 49 93 80
Vertically Parted 49 93 79
Horizontally Parted 69 91 82
70 No Max.
Increased moisture sensitivity - sand too easily fluctuates between the problems shown for both low and high compactability
Lower refractoriness, chemicalreaction type burn-in, high amountsof light non-clay and non-silica (or other base aggregate) components such as carbons and oolitic material
Decreased green and dry strengths, and items listed for low compactability
Poor sand flowability,sand stickiness, high toughness and compaction resistance.
gas (shrinks, pinholes, blows) expansion (scabs, buckles, rattails), swells (oversize or overweight castings), poor dimensional reproducibility, supervoids on mold (poor finish, rough castings, mechanical and oxide penetration, burn-in, difficult shakeout, high compaction resistance, poor flowability,
drops, broken molds - stickers, crush, erosion, sand inclusions (dirt), friable broken edges, cuts & wash, erosion scabs, low dry and hot strength, run outs, penetration if sand is friable and erodes surface sand that was tightly compacted against the pattern exposing less dense area below with large voids
See low compactability See high compactability
90 110
See high specimen weight. Hard mold penetration, water explosion defects, metal spewed out of mold
See problems for lowcompactability
146 161
50 60
92 97 See low specimen weight
See problems for highcompactability
0.30 0.40
Rough surface and mechanical penetration may result. Good for reducing back pressure in mold to preven coldshuts and misruns, hard mold penetration, water explosion, metal spewed out of mold
Good for smooth casting surface but may cause gas defects such as blows and pinholes. If due to tight compaction rather than fine sand, expansion may be a problem with silica based molding sands. Mechanical venting is very effective and allows a finer sand to be used.
Reduced flowability, difficult shakeout, poor dimensionsinal stability, high compaction resistance, swells, high moisture requirement, increased additive cost (use of bond not needed).
Comments and ProblemsDIS Results* Preferred Range**
DIS TESTING AND SAND CONTROL GUIDELINE CHART FOR IRON MOLDING SANDS
Broken or crushed molds / poor draws, drops, erosion and inclusions, run outs, burn-in,
See high green strength Crushing of adjacent molds on against the other, poor draws
Reduced flowability, high toughness, high compaction resistance
General indication of lower mulling efficiency. May be due to high bond additions, or less cumulative mulling
High flowability is desireable for good mold fill, pattern detail, and good mold density.
Soft spots in mold restricted areas on pattern, bridging/sticking in molding machine and hoppers, poor pick up of pattern detail

Sample Code: Name of the Company-XX-mmddyy: Example: Citation-01-102504
Location of sample: Please take the sample at the molding machine.Please provide along with the first shipment a 1lb sample each of base mold and core sandsPlease provide a 1 lb sample of bentonite or preblend that is used in your sand mixturesS.No
1
2
3
4
56789
10
11
1213
14
15
16
17 Average shake out time of molds
18
19
20
21
22
Average temperature of return sand entering the muller/mixer
Average compactability at the muller discharge
Average estimated time between the sand discharge from the muller and the arrival in the molding box for the sand mixture
Average temperature of the sand at the time of discharge from the muller/mixer.
Total weight of the sand in the system in tons
Average target compactability of sand at the molding machine
Type of Muller/Mixer used to prepare the sand mixtureTypical additions to the Muller/Mixer
Sieve analysis of new sand used for making moldsSieve analysis of new sand used for making cores
Average weight of sand per moldAverage weight of core per moldAverage weight of iron poured per moldType of core sand used
Size of mold (box size or cake size if boxless)
Different sizes of mold boxes used on this machineAverage size of mold boxes used on this machine
Type of molding machine/ Number of molds per hour
DATA SHEET TO ACCOMPANY THE SAND SAMPLESDuctile Iron Society Sand Project
Size of the sample: 20 lb sample sealed in two separate plastic bags of 10 lbs each with the same code.
Description Data
23 Bond/Preblend FormulationDetails of Contact Person
Properties of Molding Sand Mixture
Molding problems/casting defects experienced at the time of sampling of sand: Molding problems -stickers, friable edges, soft pockets etc; Casting Defects - surface quality, casting swell, sand erosion, sand inclusions, expansion defects, pinholes etc
Rev.10-25-04

J DIS 1-...
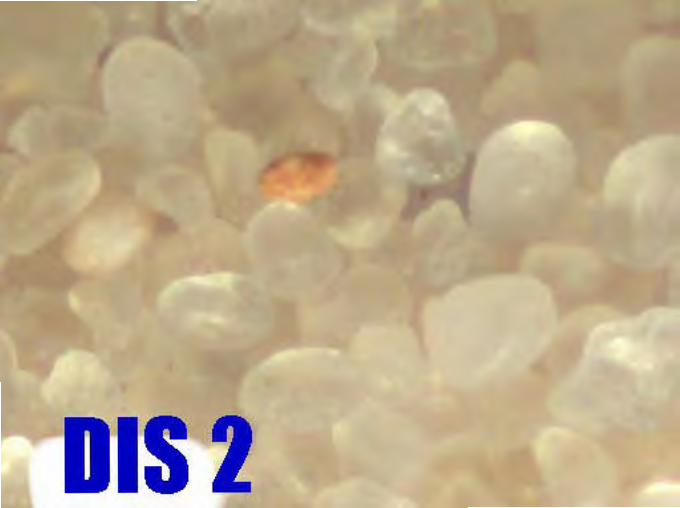
1152

1153

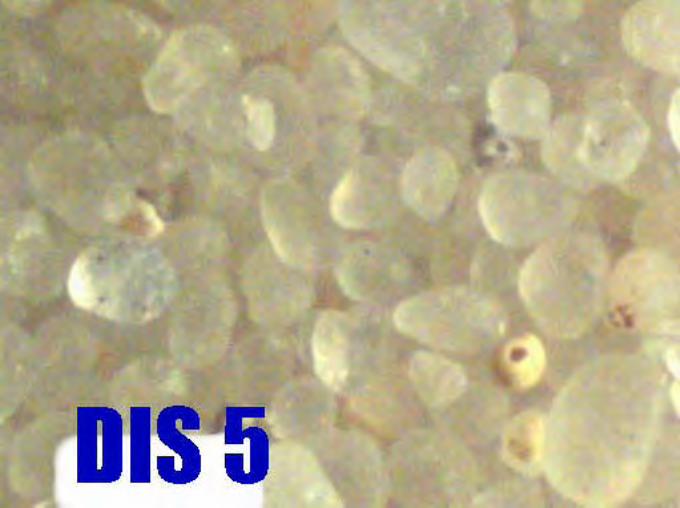
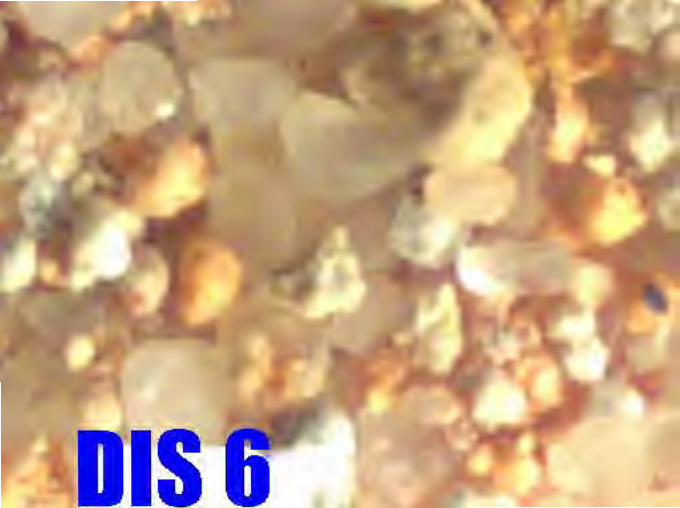
DIS
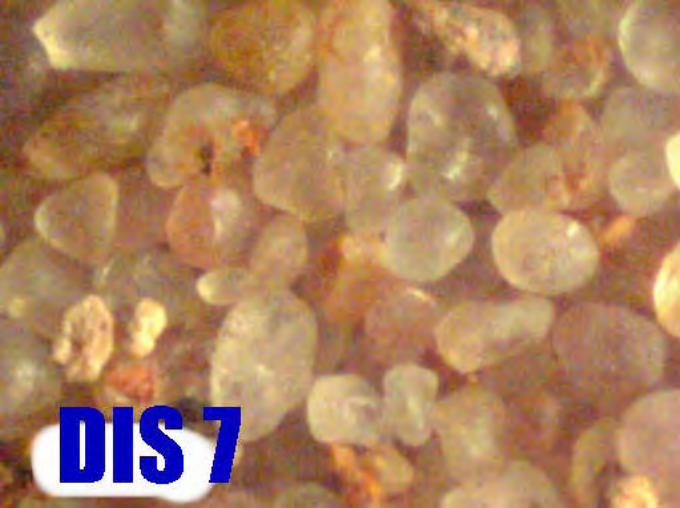

DISB ---
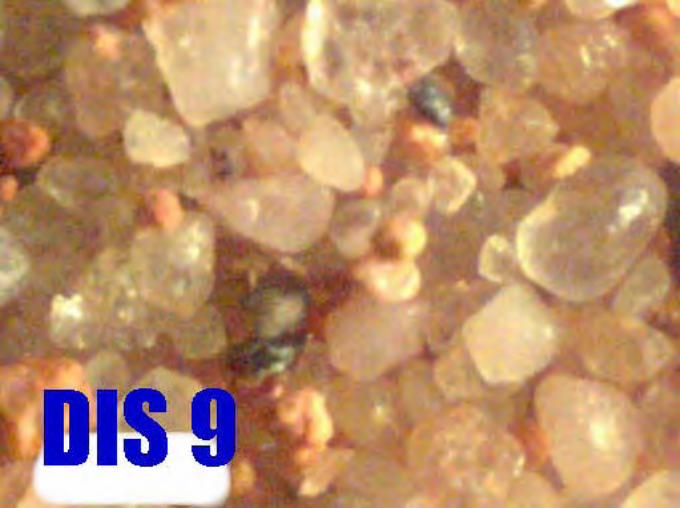


11512

IIS13

11514
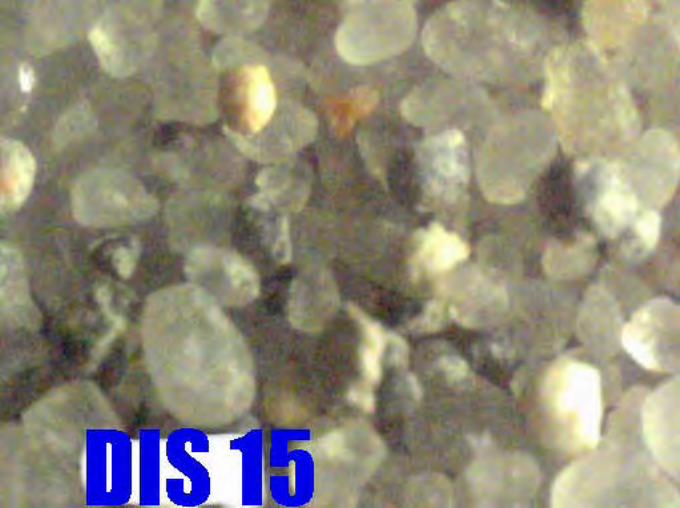
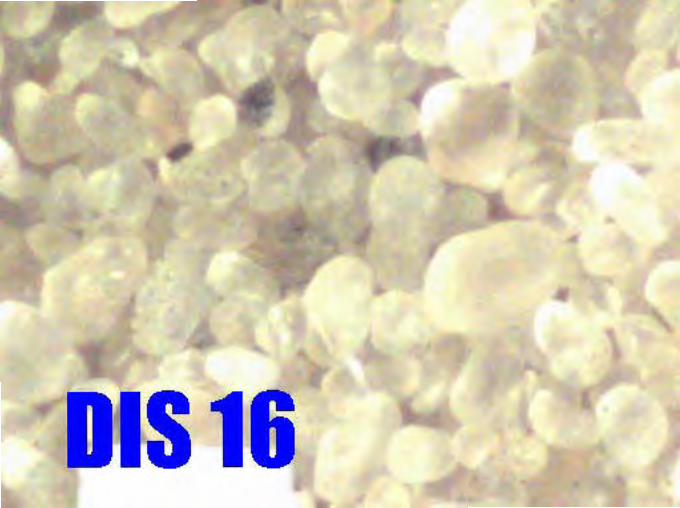
11516
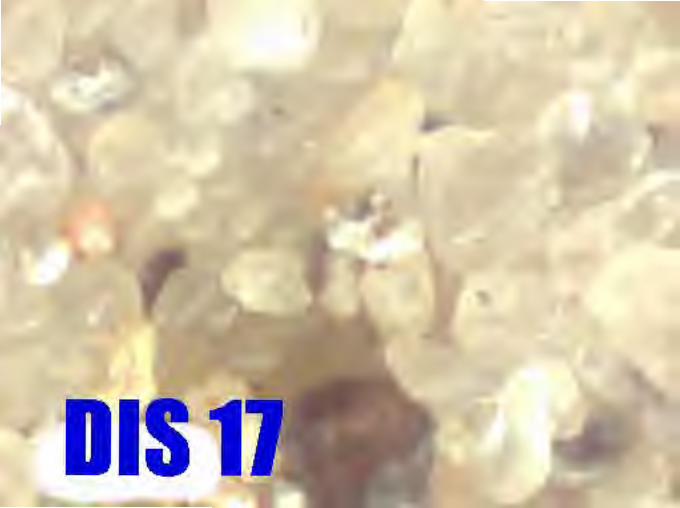
DIS
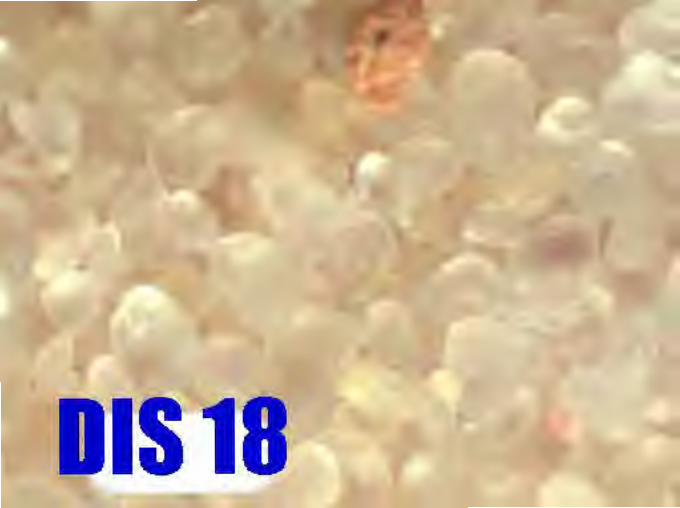
11518
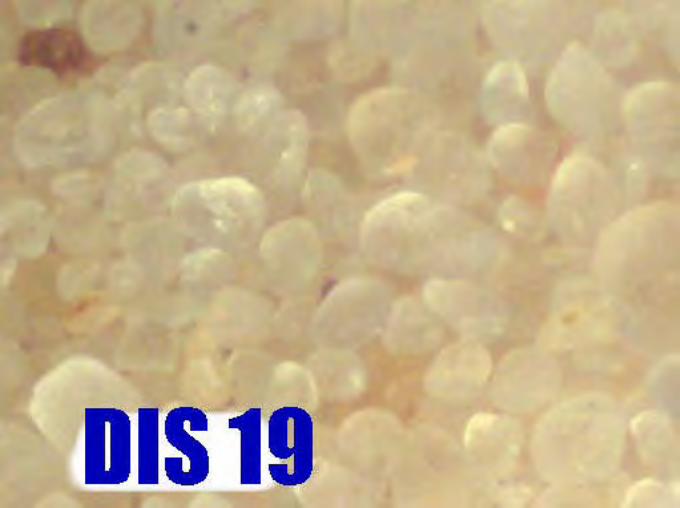
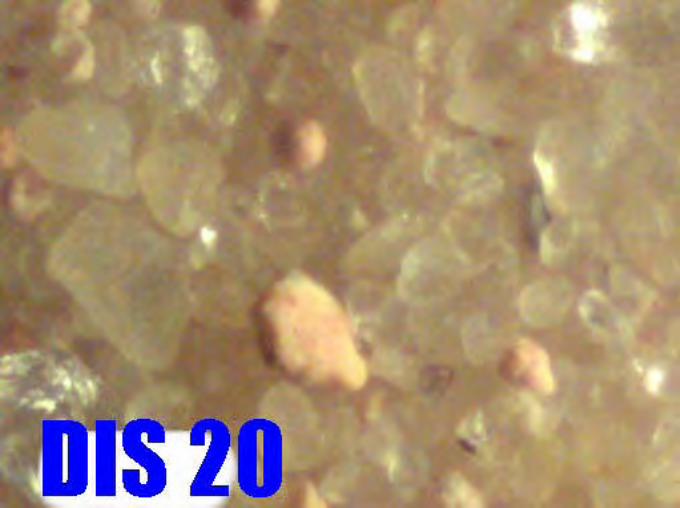

DIS21

11522

11523
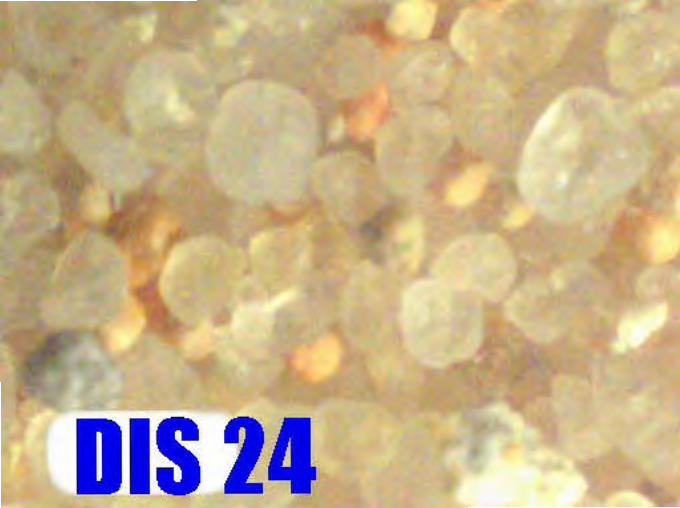
IIS2
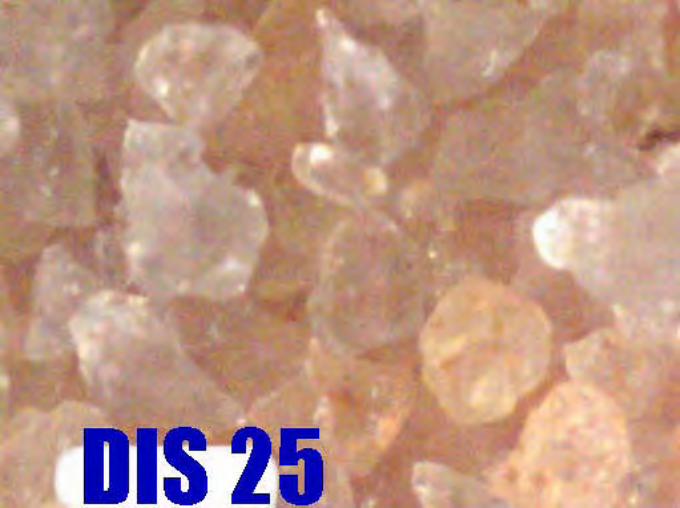

~ DIS 26
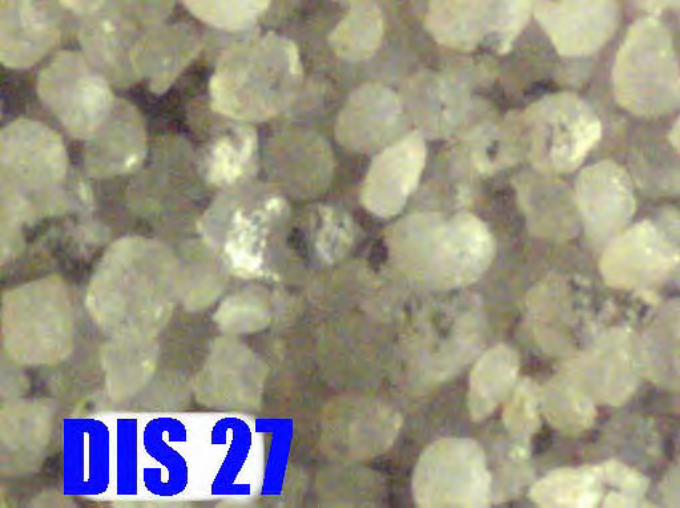
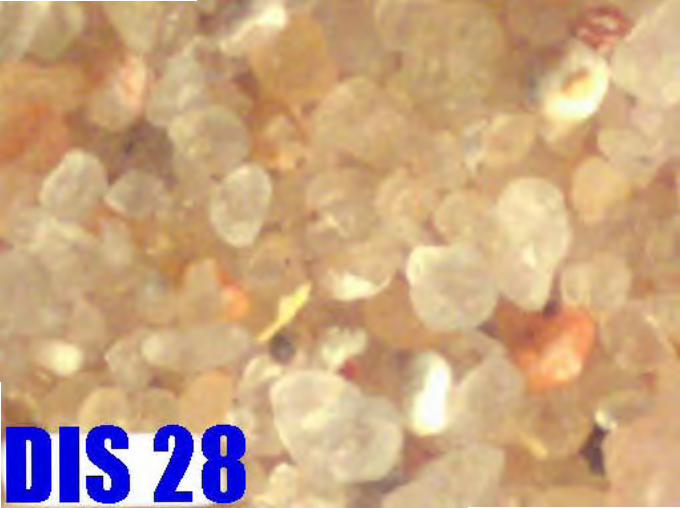
IS28
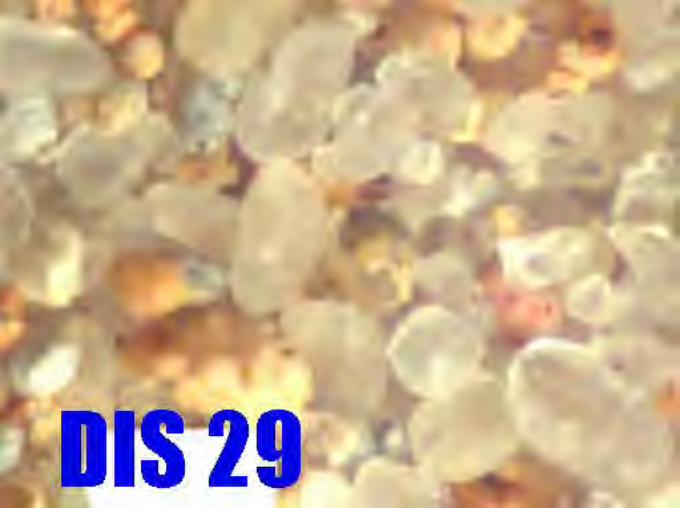

•
•
A
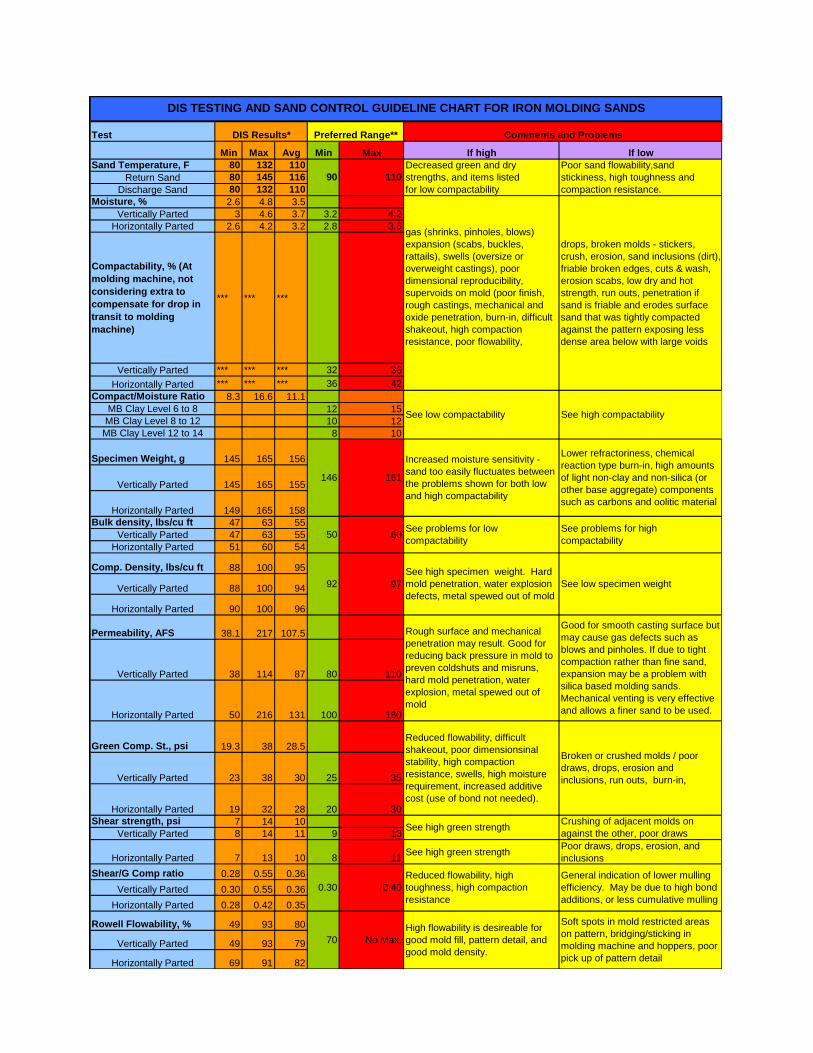
Test
Min Max Avg Min Max If high If lowSand Temperature, F 80 132 110
Return Sand 80 145 116Discharge Sand 80 132 110
Moisture, % 2.6 4.8 3.5Vertically Parted 3 4.6 3.7 3.2 4.2
Horizontally Parted 2.6 4.2 3.2 2.8 3.6
Compactability, % (At molding machine, not considering extra to compensate for drop in transit to molding machine)
*** *** ***
Vertically Parted *** *** *** 32 36Horizontally Parted *** *** *** 36 42
Compact/Moisture Ratio 8.3 16.6 11.1MB Clay Level 6 to 8 12 15
MB Clay Level 8 to 12 10 12MB Clay Level 12 to 14 8 10
Specimen Weight, g 145 165 156
Vertically Parted 145 165 155
Horizontally Parted 149 165 158Bulk density, lbs/cu ft 47 63 55
Vertically Parted 47 63 55Horizontally Parted 51 60 54
Comp. Density, lbs/cu ft 88 100 95
Vertically Parted 88 100 94
Horizontally Parted 90 100 96
Permeability, AFS 38.1 217 107.5
Vertically Parted 38 114 87 80 110
Horizontally Parted 50 216 131 100 160
Green Comp. St., psi 19.3 38 28.5
Vertically Parted 23 38 30 25 35
Horizontally Parted 19 32 28 20 30Shear strength, psi 7 14 10
Vertically Parted 8 14 11 9 13
Horizontally Parted 7 13 10 8 11 See high green strength Poor draws, drops, erosion, and inclusions
Shear/G Comp ratio 0.28 0.55 0.36Vertically Parted 0.30 0.55 0.36
Horizontally Parted 0.28 0.42 0.35
Rowell Flowability, % 49 93 80
Vertically Parted 49 93 79
Horizontally Parted 69 91 82
70 No Max.
Increased moisture sensitivity - sand too easily fluctuates between the problems shown for both low and high compactability
Lower refractoriness, chemicalreaction type burn-in, high amountsof light non-clay and non-silica (or other base aggregate) components such as carbons and oolitic material
Decreased green and dry strengths, and items listed for low compactability
Poor sand flowability,sand stickiness, high toughness and compaction resistance.
gas (shrinks, pinholes, blows) expansion (scabs, buckles, rattails), swells (oversize or overweight castings), poor dimensional reproducibility, supervoids on mold (poor finish, rough castings, mechanical and oxide penetration, burn-in, difficult shakeout, high compaction resistance, poor flowability,
drops, broken molds - stickers, crush, erosion, sand inclusions (dirt), friable broken edges, cuts & wash, erosion scabs, low dry and hot strength, run outs, penetration if sand is friable and erodes surface sand that was tightly compacted against the pattern exposing less dense area below with large voids
See low compactability See high compactability
90 110
See high specimen weight. Hard mold penetration, water explosion defects, metal spewed out of mold
See problems for lowcompactability
146 161
50 60
92 97 See low specimen weight
See problems for highcompactability
0.30 0.40
Rough surface and mechanical penetration may result. Good for reducing back pressure in mold to preven coldshuts and misruns, hard mold penetration, water explosion, metal spewed out of mold
Good for smooth casting surface but may cause gas defects such as blows and pinholes. If due to tight compaction rather than fine sand, expansion may be a problem with silica based molding sands. Mechanical venting is very effective and allows a finer sand to be used.
Reduced flowability, difficult shakeout, poor dimensionsinal stability, high compaction resistance, swells, high moisture requirement, increased additive cost (use of bond not needed).
Comments and ProblemsDIS Results* Preferred Range**
DIS TESTING AND SAND CONTROL GUIDELINE CHART FOR IRON MOLDING SANDS
Broken or crushed molds / poor draws, drops, erosion and inclusions, run outs, burn-in,
See high green strength Crushing of adjacent molds on against the other, poor draws
Reduced flowability, high toughness, high compaction resistance
General indication of lower mulling efficiency. May be due to high bond additions, or less cumulative mulling
High flowability is desireable for good mold fill, pattern detail, and good mold density.
Soft spots in mold restricted areas on pattern, bridging/sticking in molding machine and hoppers, poor pick up of pattern detail

DUCTILE IRON SOCIETY