survey methods & design in psychology lecture 6 reliabilities, composite scores & review of...
TRANSCRIPT

Survey Methods & Design in Psychology
Lecture 6Reliabilities, Composite Scores &
Review of Lectures 1 to 6 (2007)
Lecturer: James Neill

Overview
• Concepts & their measurement• Psychometrics• Reliability• Validity• Composite scores• Writing up a factor analysis• Review of W1-W5
– Student questions

Readings
• Francis – Ch6.1 (Reliability)
• pp.63-65 “Concepts & their Measurement”(e-reserve)
• DeCoster, J. (2005). Scale construction notes. http://www.stat-help.com/notes.html

An Iterative Model of The Scientific Research Process
Need for information/
research Interpretation & reporting
Data analysis (incl.
Psychometrics)
Problem definition
(RQ & Hyps)
Research design
(Operationalise) Sampling (Data collection)

Concepts & Their Measurement

Concepts – Bryman & Cramer
• Concepts form a linchpin in the process of social research
• Concepts express common elements in the world to which we give a name
• Hypotheses contain concepts which are the products of our reflections on the world.

An Iterative Model of The Scientific Research Process
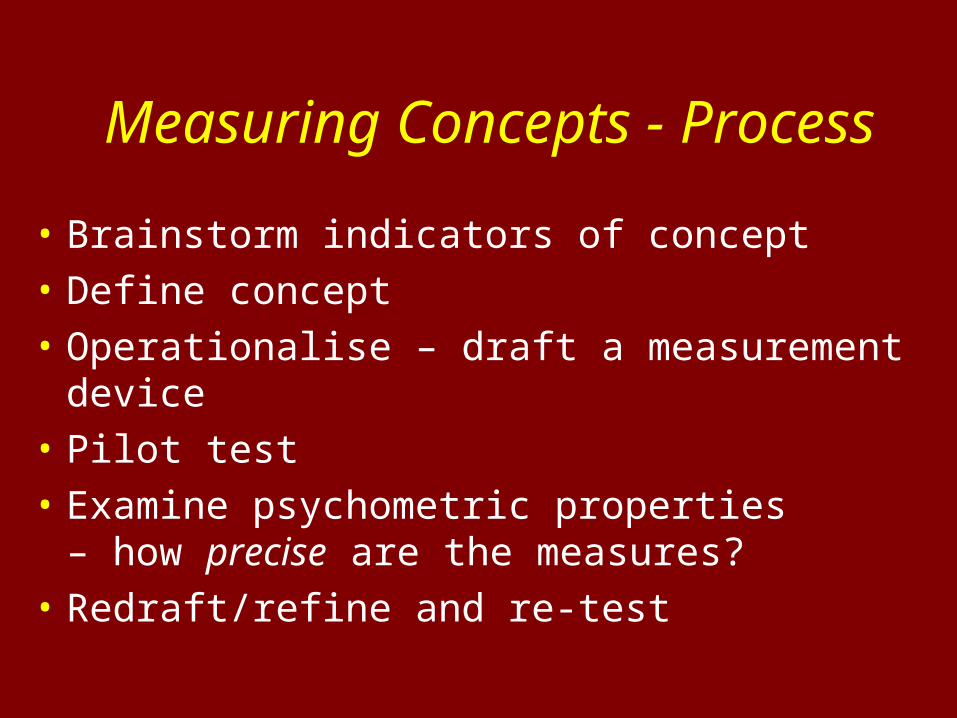
Measuring Concepts - Process
• Brainstorm indicators of concept
• Define concept
• Operationalise – draft a measurement device
• Pilot test
• Examine psychometric properties– how precise are the measures?
• Redraft/refine and re-test

Operationalisation
• Operationalisation is the act of making a fuzzy concept measurable.
• Social sciences often use multi-item measures to assess related but distinct aspects of a fuzzy concept.
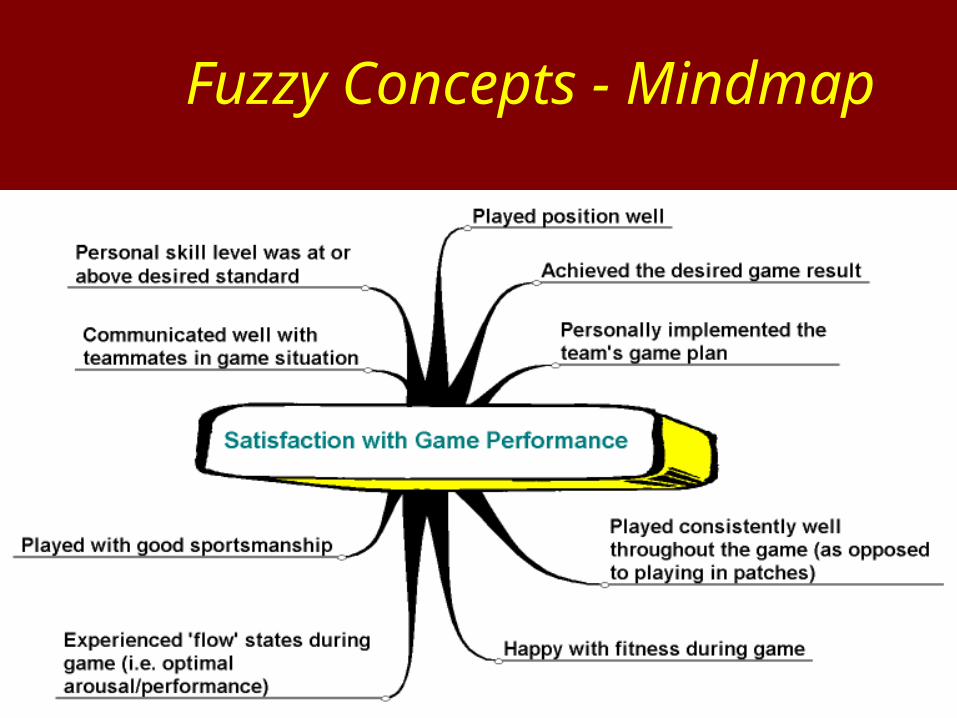
Fuzzy Concepts - Mindmap

Fuzzy Concepts - Mindmap

Factor Analysis Process

Psychometrics - Goal
Goal:
• To validly measure differences b/w individuals and groups in psychosocial qualities such as ability, attitudes, and personality.
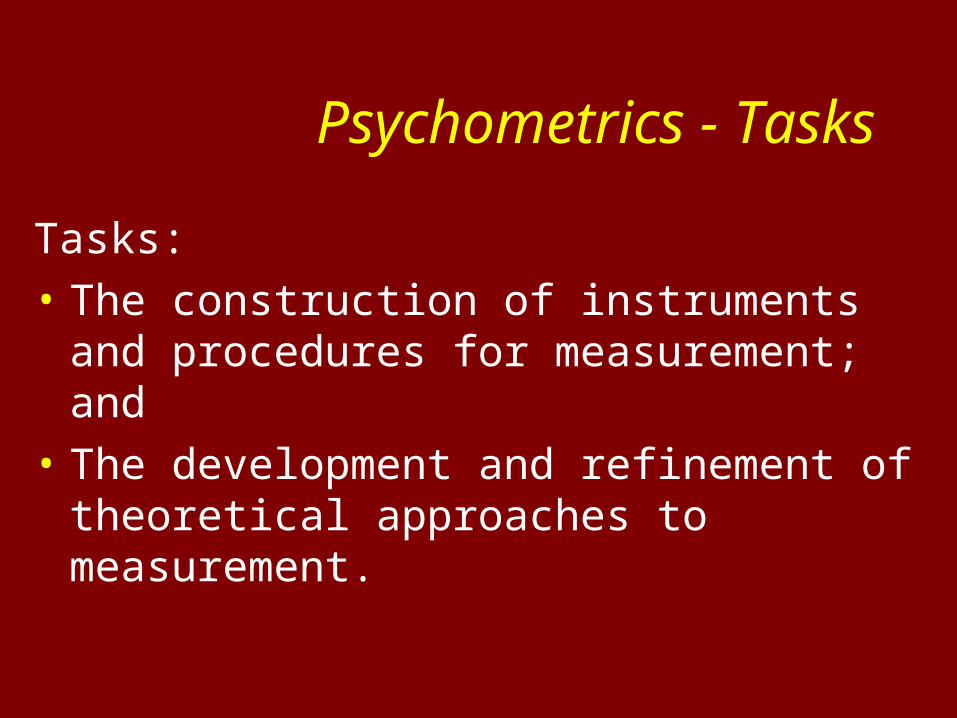
Psychometrics - Tasks
Tasks:
• The construction of instruments and procedures for measurement; and
• The development and refinement of theoretical approaches to measurement.

Psychometric Methods
• Exploratory Factor Analysis
• Classical Test Theory– Reliability– Validity

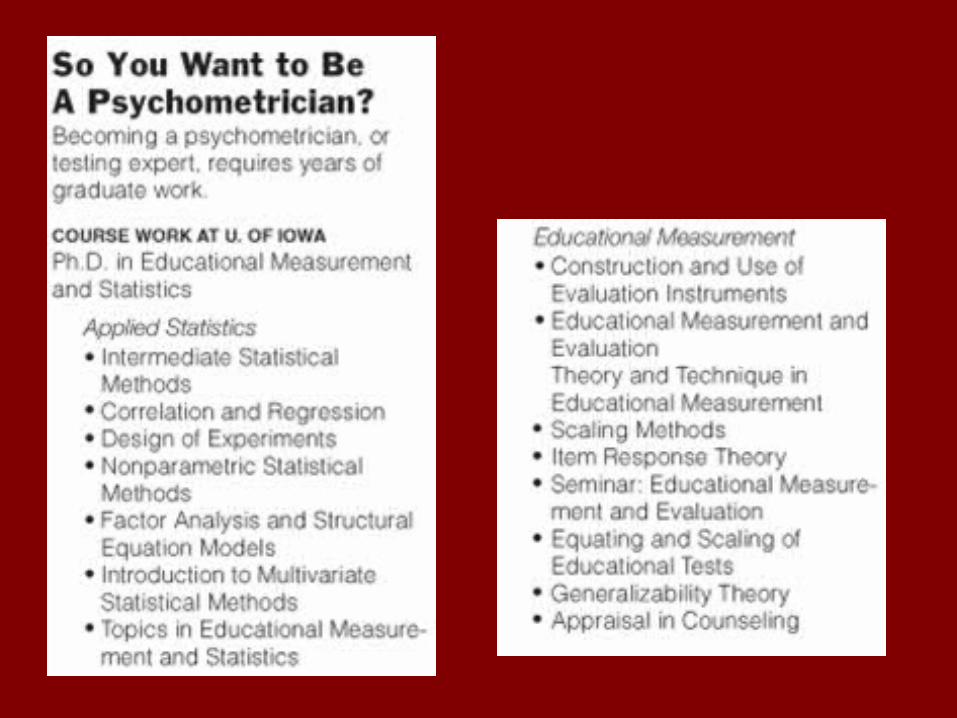
As Test-Taking Grows, Test-Makers Grow Rarer
"Psychometrics, one of the most obscure, esoteric and cerebral professions in America, is now also one of the hottest.”- May 5, 2006, NY Times.

Reliability & Validity

Reliability vs Validity

Reliability
Reproducibility of a measurement
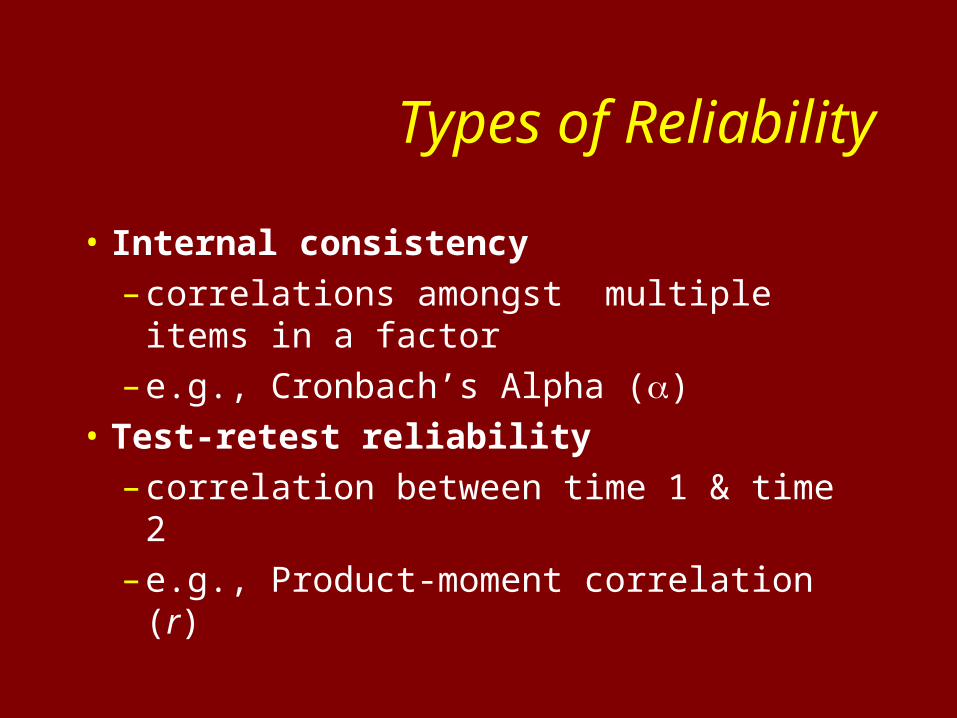
Types of Reliability
• Internal consistency
– correlations amongst multiple items in a factor
– e.g., Cronbach’s Alpha ()
• Test-retest reliability
– correlation between time 1 & time 2
– e.g., Product-moment correlation (r)

Reliability Interpretation
<.6 = not reliable.6 = OK.7 = reasonably reliable.8 = good, strong reliability.9 = excellent, very reliable>.9 = potentially overly reliable or redundant
measurement – this is subjective and whether a scale is overly reliable depends also on the nature what is being measured

Reliability Interpretation

Internal Reliability
• Is a multi-item scale measuring a single concept?
• Are items in scale consistent with one another?

Types of Internal Reliability• Split-half reliability
The first half of the items are summed and then correlated with the sum of the second half of the items.
• Odd-even reliabilityItems 1, 3, 5, etc. are summed and correlated with Items 2, 4, 6, etc..
• Alpha reliability (Cronbach’s Averages all possible split-half reliability coefficients - akin to a single score representing the extent of intercorrelation amongst the items

• More items -> greater reliability(The more items, the more ‘rounded’ the measure)
• Law of diminishing returns• Min. = 3• Max. = unlimited• Typically ~ 4 to 10 is reasonable• Final decision is subjective and
depends on research context
How Many Items per Factor?

Internal Reliability – Quality of Maths Class Example
• 10-item scale measuring students’ assessment of their maths classes
• 4-point Likert scale from:strongly disagree to strongly agree.
• Ensure -ve items are recoded
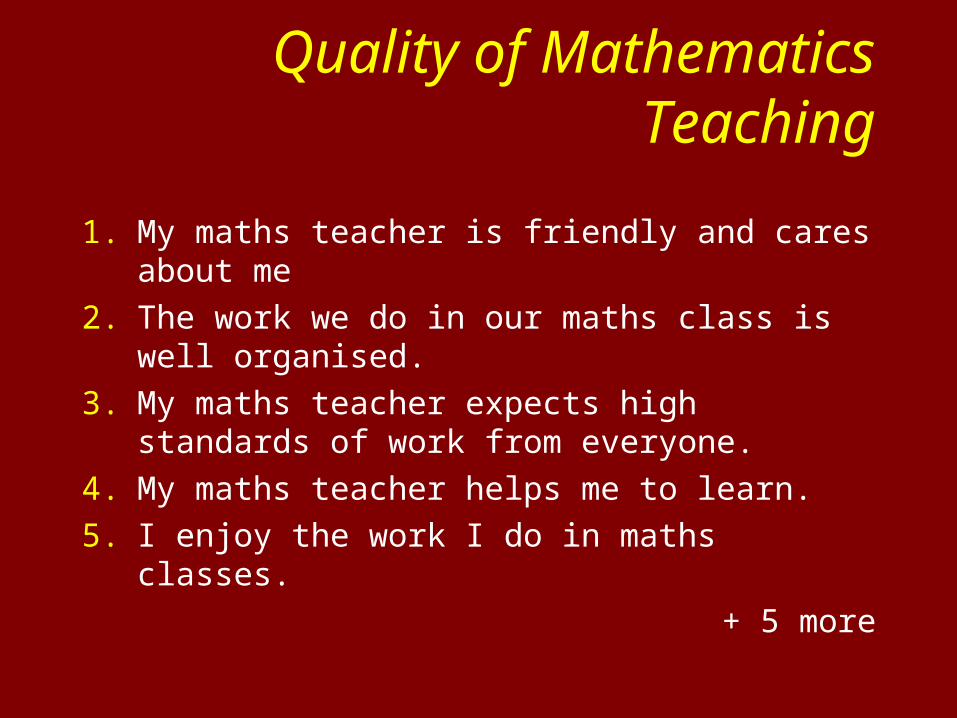
Quality of Mathematics Teaching
1. My maths teacher is friendly and cares about me
2. The work we do in our maths class is well organised.
3. My maths teacher expects high standards of work from everyone.
4. My maths teacher helps me to learn.
5. I enjoy the work I do in maths classes.
+ 5 more

Internal Reliability – Quality of Maths Class Example

SPSS - Corrected Item-Total Correlation
Internal Reliability – Quality of Maths Class Example

SPSS - Cronbach’s Alpha
Internal Reliability – Quality of Maths Class Example

Item-total Statistics
Scale Scale Corrected Mean Variance Item- Alpha if Item if Item Total if Item Deleted Deleted Correlation Deleted
MATHS1 25.2749 25.5752 .6614 .8629MATHS2 25.0333 26.5322 .6235 .8661MATHS3 25.0192 30.5174 .0996 .9021MATHS4 24.9786 25.8671 .7255 .8589MATHS5 25.4664 25.6455 .6707 .8622MATHS6 25.0813 24.9830 .7114 .8587MATHS7 25.0909 26.4215 .6208 .8662MATHS8 25.8699 25.7345 .6513 .8637MATHS9 25.0340 26.1201 .6762 .8623MATHS10 25.4642 25.7578 .6495 .8638
Reliability Coefficients
N of Cases = 1353.0 N of Items = 10
Alpha = .8790
Internal Reliability – Quality of Maths Class Example

Item-total Statistics
Scale Scale Corrected Mean Variance Item- Alpha if Item if Item Total if Item Deleted Deleted Correlation Deleted
MATHS1 22.2694 24.0699 .6821 .8907MATHS2 22.0280 25.2710 .6078 .8961MATHS4 21.9727 24.4372 .7365 .8871MATHS5 22.4605 24.2235 .6801 .8909MATHS6 22.0753 23.5423 .7255 .8873MATHS7 22.0849 25.0777 .6166 .8955MATHS8 22.8642 24.3449 .6562 .8927MATHS9 22.0280 24.5812 .7015 .8895MATHS10 22.4590 24.3859 .6524 .8930
Reliability Coefficients
N of Cases = 1355.0 N of Items = 9
Alpha = .9024

Behav.sav example:
• Factor 1 (Attentiveness) = .94
• Factor 2 (Settledness) = .89
• Factor 3 (Sociability) = .90
Internal Reliabilities for Classroom Behaviour

Reliabilities – LEQ Example

(Construct) Validity
To extent to which an instrument actually measures what it purports to
measure.

Types of Validity
• Construct validity– Translation validity
• Face validity • Content validity
– Criterion-related validity• Predictive validity • Concurrent validity • Convergent validity• Discriminant validity
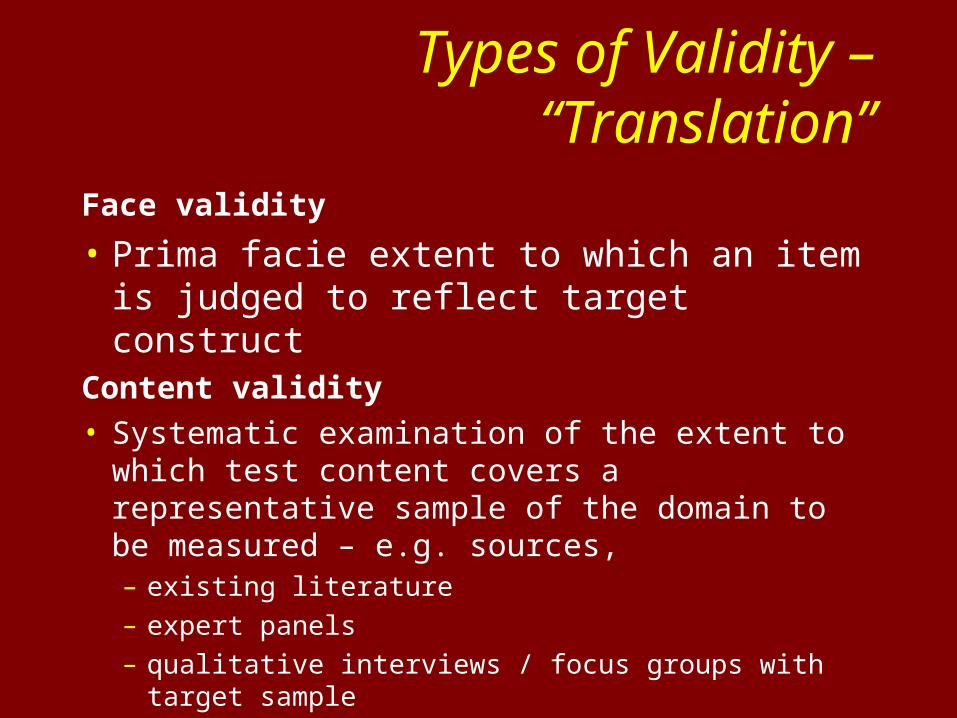
Types of Validity – “Translation”
Face validity
• Prima facie extent to which an item is judged to reflect target construct
Content validity• Systematic examination of the extent to which test
content covers a representative sample of the domain to be measured – e.g. sources, – existing literature
– expert panels
– qualitative interviews / focus groups with target sample

Types of Validity – “Criterion”
Concurrent validity
• Correlation between the measure and other recognised measures of the target construct
Predictive validity
• Extent to which a measure predicts something that it theoretically should be able to predict.
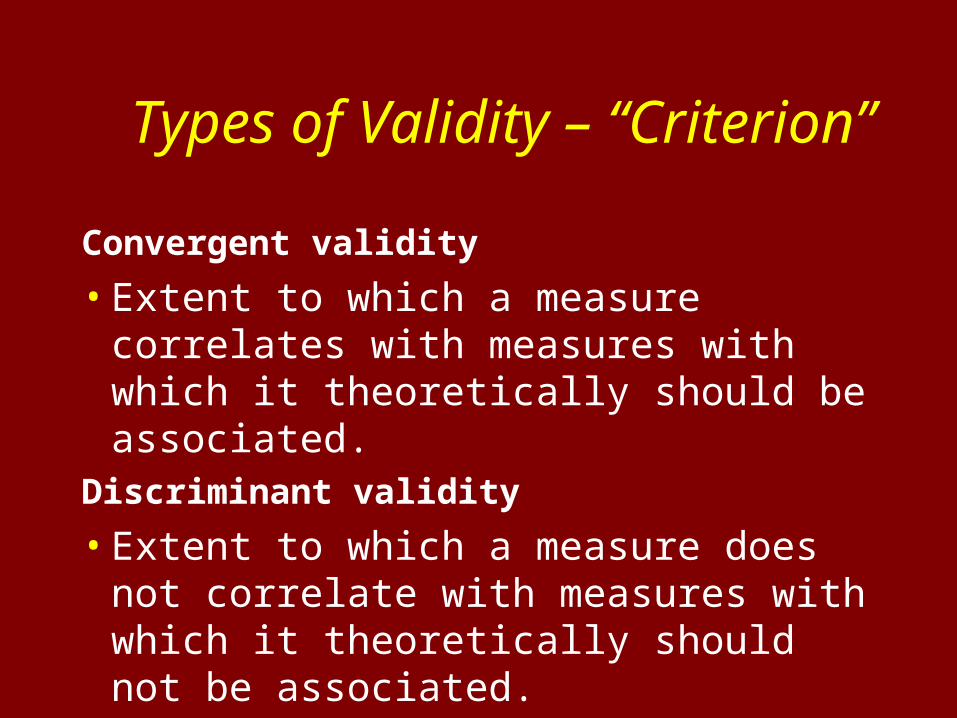
Types of Validity – “Criterion”
Convergent validity
• Extent to which a measure correlates with measures with which it theoretically should be associated.
Discriminant validity
• Extent to which a measure does not correlate with measures with which it theoretically should not be associated.

Composite Scores (Factor Scores)
Used to reliably estimate individual differences in target constructs.
Univariate, continuous-like variables which can be used for:
• Descriptives, screening, testing, feedback• As IVs or DVs in subsequent inferential
analyses

Creating Composite Scores
Two methods:• Unit weighting• Factor score regression weights

Unit Weighting
Unit WeightingAverage or total of all variables in a factor (i.e., each variable is equally weighted).X = mean(y1…yp)
Unit Weighting
.25 .25
.25
.25

Creating Composite Scores – Dealing with Missing Data
It can helpful to maximize sample size by estimating some of the missing values.

Composite Scores – Missing Data
A technique in SPSS for the calculation of composite factor scores which allows for some missing items:
X = mean (v1, v2, v3, v4, v5.v6) X = mean.4 (v1, v2, v3, v4, v5,v6)

Creating Composite Scores – Dealing with Missing Data
How many items is it OK to allow to be missing? A guide:
- 1 item missing OK per 4 to 5 items- 2 items missing OK per 6 to 8 items- 3+ items to be missing for 9+ items

Regression Weighting
Factor Score Regression Weights The contribution of each variable to the total is weighted to reflect some items more than other items.
X = 20*v1 + .19*v2+ .27*v3 + .34*v4
RegressionWeights
.20
.19
.27
.34

Regression Weighting
Two calculation methods:
• Manual (use Compute)
• Automatic (use Factor Analysis – Factor Scores)

Regression Weighting – SPSS Output
Data view
Variable view

Other considerations: Normality of items
Check the item descriptives.
e.g. if two items have similar Factor Loadings and Reliability analysis, consider selecting items which will have the least skew and kurtosis.
The more normally distributed the item scores, the better the distribution of the composite scores.
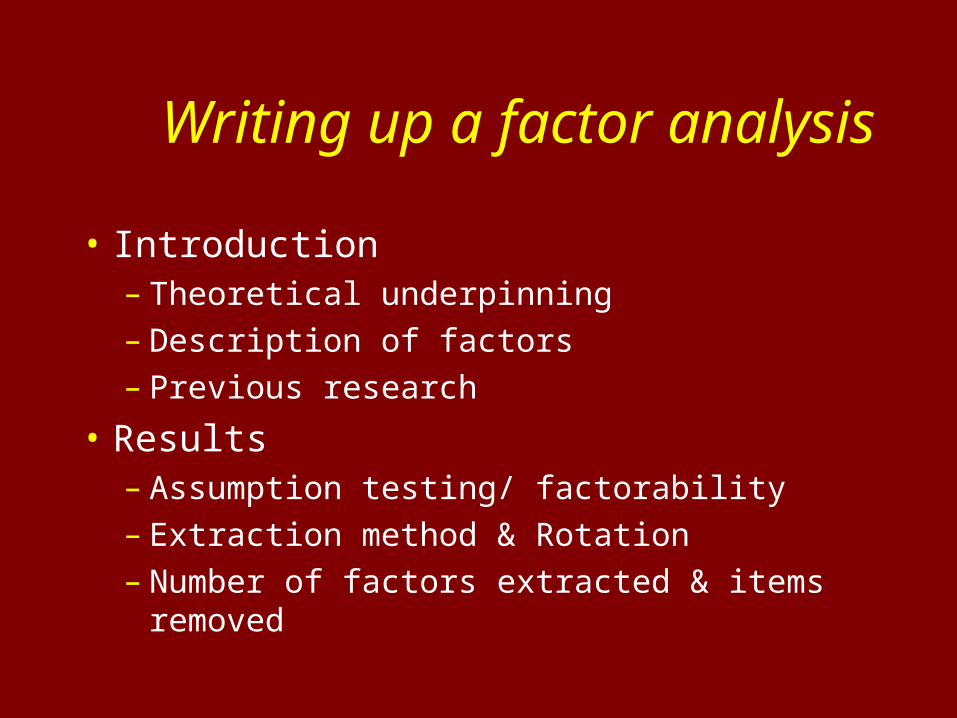
Writing up a factor analysis
• Introduction– Theoretical underpinning– Description of factors – Previous research
• Results– Assumption testing/ factorability– Extraction method & Rotation – Number of factors extracted & items removed

Writing up a factor analysis
• Discussion– Theoretical underpinning – Supported?
Adaptations?– Quality / usefulness of measure– Recommendations for further improvement
• More information– Writing up a factor analysis (.doc)– http://wilderdom.com/courses/surveyresearch/assess
ment/labreport/

Review: Q & A of Week 1 to 6
Add questions into the box.

References
Howitt, D., & Cramer, D. (2005). Chapter 13 Reliability and validity: Evaluating the value of tests and measures. In Introduction to research methods in psychology (pp. 218-231). Essex, UK: Pearson.
Presser, S., Rothgeb, J. J., Couper, M. P., Lessler, J. T., Martin, E., Martin, J., & Singer, E. (Eds.) (2004). Methods for testing and evaluating survey questionnaires. Wiley: Hoboken, NJ.