survey conducted by: national research center, inc. 3005 30 th st. boulder, co 80301 (303) 444-7863 ...
TRANSCRIPT

Survey conducted by: National Research Center, Inc. • 3005 30 th St. • Boulder, CO 80301 • (303) 444-7863 • www.n-r-c.com
The National Citizen Survey™
LOWER PROVIDENCE LOWER PROVIDENCE TOWNSHIP, PATOWNSHIP, PA
Summary of FindingsSummary of FindingsSeptember 2008September 2008

National Research Center, Inc. 2
The National Citizen Survey™
The National Citizen Survey™ (The NCS) Background
ICMA/NRC initiativeTurnkey omnibus citizen survey service Benchmark comparisonsOver 160 participants in The NCS in over 40
statesOver 500 jurisdictions in full database
National Research Center, Inc. 3
The National Citizen Survey™
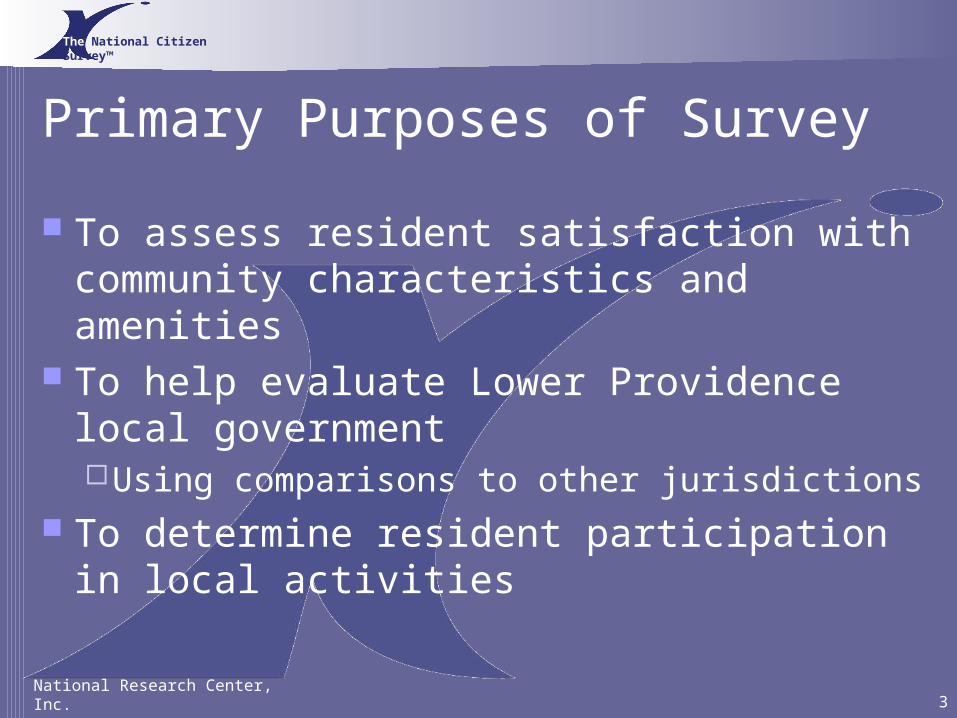
Primary Purposes of Survey
To assess resident satisfaction with community characteristics and amenities
To help evaluate Lower Providence local governmentUsing comparisons to other jurisdictions
To determine resident participation in local activities

National Research Center, Inc. 4
The National Citizen Survey™
Uses of Survey Results
Results can be used to:
Inform Inform budget, land budget, land use, strategic use, strategic
planning planning decisionsdecisions
Measure Measure government government performanceperformance
Benchmark Benchmark service service ratingsratings
Monitor Monitor trends in trends in resident resident opinionopinion
National Research Center, Inc. 5
The National Citizen Survey™
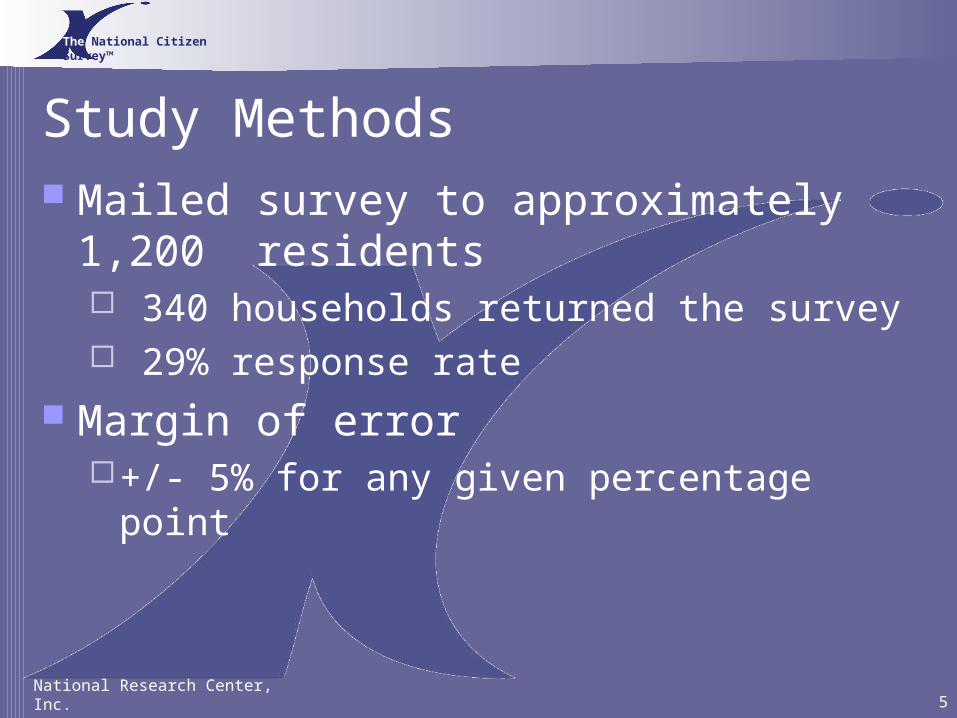
Study Methods Mailed survey to approximately 1,200
residents 340 households returned the survey 29% response rate
Margin of error+/- 5% for any given percentage point

National Research Center, Inc. 6
The National Citizen Survey™
Quality of Community
All Above the National comparison
Populations less than 40,000 in
the East
Similar
Above
Similar26%
36%
22%
63%
51%
61%
0% 25% 50% 75% 100%
Lower Providence as aplace to live
Your neighborhood as aplace to live
The overall quality oflife in Lower Providence
Percent of respondents
Excellent Good
National Research Center, Inc. 7
The National Citizen Survey™
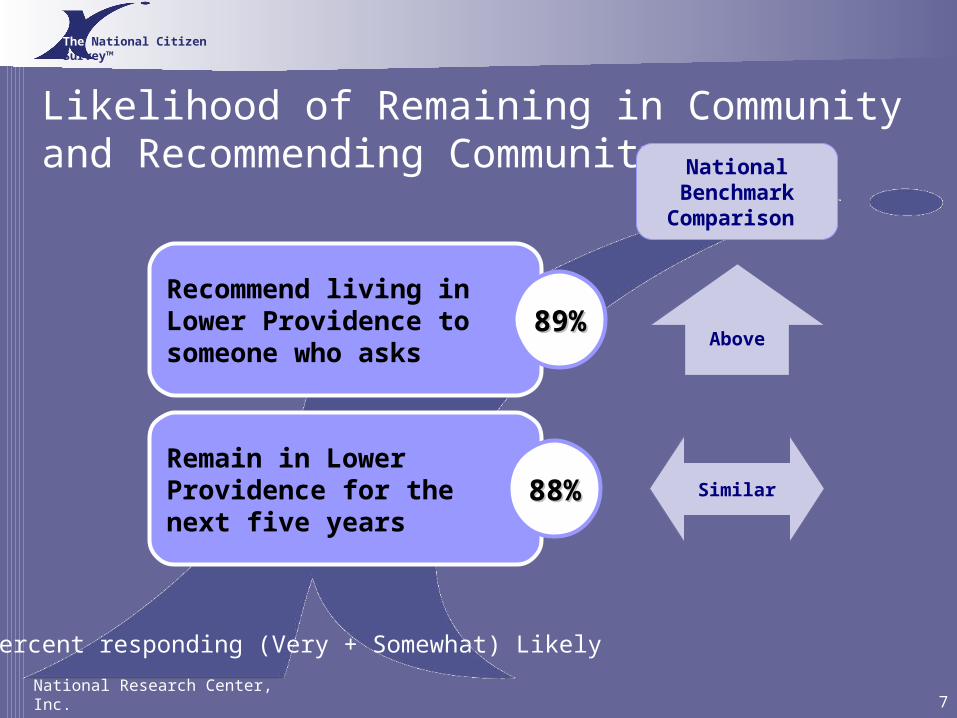
Likelihood of Remaining in Communityand Recommending Community
Percent responding (Very + Somewhat) Likely
Recommend living inLower Providence to someone who asks
89%89%
Remain in Lower Providence for thenext five years
88%88% Similar
Above
National Benchmark
Comparison

National Research Center, Inc. 8
The National Citizen Survey™
Community Characteristics
Percent responding "excellent" or "good"
National Benchmark Comparison
Abovethe
benchmarkAvailability of affordable quality housingAvailability of affordable quality housing 43%
Variety of housing optionsVariety of housing options 64%
Quality of new development in townshipQuality of new development in township 64%
Code enforcement Code enforcement (weeds, abandoned buildings, etc)(weeds, abandoned buildings, etc) 50%
Animal controlAnimal control 69%
Street repair /maintenanceStreet repair /maintenance 60%
Snow RemovalSnow Removal 68%
Also rated above when compared to Populations less that 40,000 in the
east

National Research Center, Inc. 9
The National Citizen Survey™
Place to work 66%66% Above
Above
SimilarOverall quality of business and service establishments in Lower Providence 60%60% Comparison
not available
Employment opportunities 42%42% SimilarAbove
Community Characteristics
Percent responding "excellent" or "good"
National comparison
Populations less than 40,000
in the East
Shopping opportunitiesShopping opportunities 54%54% Above
Above

National Research Center, Inc. 10
The National Citizen Survey™
Township Services
Fireservices
98%
Ambulance/EMS
services
97%
Policeservices
91%
Township parks
88%
Highest Rated
Percent responding "excellent" or "good"= = Populations less than 40,000 in the EastPopulations less than 40,000 in the East
= national benchmark comparison= national benchmark comparison

National Research Center, Inc. 11
The National Citizen Survey™
Township ServicesLowest Rated
Services to low-income
people
38%
Land use, planning and
zoning
40%
Percent responding "excellent" or "good"= = Populations less than 40,000 in the EastPopulations less than 40,000 in the East
= national benchmark comparison= national benchmark comparison
Traffic signal timing
Preservation of natural
areas such as open space,
farmlands, and greenbelts
47%

National Research Center, Inc. 12
The National Citizen Survey™
Government Performance
Percent responding "excellent" or "good"
Overall image or reputation ofOverall image or reputation ofLower ProvidenceLower Providence 70% Similar Similar
National comparison
Populations less than 40,000
in the East
Value of services for the taxesValue of services for the taxespaid to Lower Providencepaid to Lower Providence 50% Below Below
The overall direction that The overall direction that Lower Providence is takingLower Providence is taking 49% Below Below
Job Lower Providence governmentJob Lower Providence governmentdoes at welcoming citizen involvementdoes at welcoming citizen involvement 40% Below Below

National Research Center, Inc. 13
The National Citizen Survey™
Lower Providence Employees
33%
38%
29%
45%
45%
42%
48%
36%
0% 25% 50% 75% 100%
Overall impression
Courtesy
Responsiveness
Knowledge
Percent of respondents
Excellent Good

National Research Center, Inc. 14
The National Citizen Survey™
Ratings of Nuisance Problems
45%21% 30% 5%
0% 20% 40% 60% 80% 100%
To what degree, if at all,are run down buildings,
weed lots or junk vehiclesa problem in Lower
Providence?
Not a problem Minor problem Moderate problem Major problem

National Research Center, Inc. 15
The National Citizen Survey™
From Violent From Violent CrimeCrime 90%
Public SafetyFe
lt “
very
” or
“som
ew
hat”
safe
Felt
“very
” or
“som
ew
hat”
safe
NeighborhoodNeighborhood
97%
DowntownDowntown
Afterdark
77%
87%
95%Duringthe day
64%From From
Environmental Environmental HazardsHazards
From Property From Property CrimeCrime 74%

National Research Center, Inc. 16
The National Citizen Survey™
Community’s Natural Environment
9%
10%
13%
46%
37%
52%
57%
13%
0% 25% 50% 75% 100%
Air quality
Preservation of natural areas such as openspace, farmlands and greenbelts
Quality of overall natural environment inLower Providence
Cleanliness of Lower Providence
Percent of respondents
Excellent Good

National Research Center, Inc. 17
The National Citizen Survey™
Support for Funding:
Programs for teens 97%
Programs for seniors 96%
Preserving open space 95%
"Growing greener" initiative (such as alternative fuel vehicles and renewable energy) 93%
Building projects for Parks and Recreation 92%
Acquiring open space 89%
Percent Responding “Strongly” or “Somewhat” Support

National Research Center, Inc. 18
The National Citizen Survey™
Support for Raising Taxes to Fund:
Percent Responding “Strongly” or “Somewhat” Support
Preserving open space 69%
Programs for teens 68%
Building projects for Parks and Recreation 66%
"Growing greener" initiative (such as alternative fuel vehicles and renewable energy) 66%
Programs for seniors 64%
Acquiring open space 51%
National Research Center, Inc. 19
The National Citizen Survey™
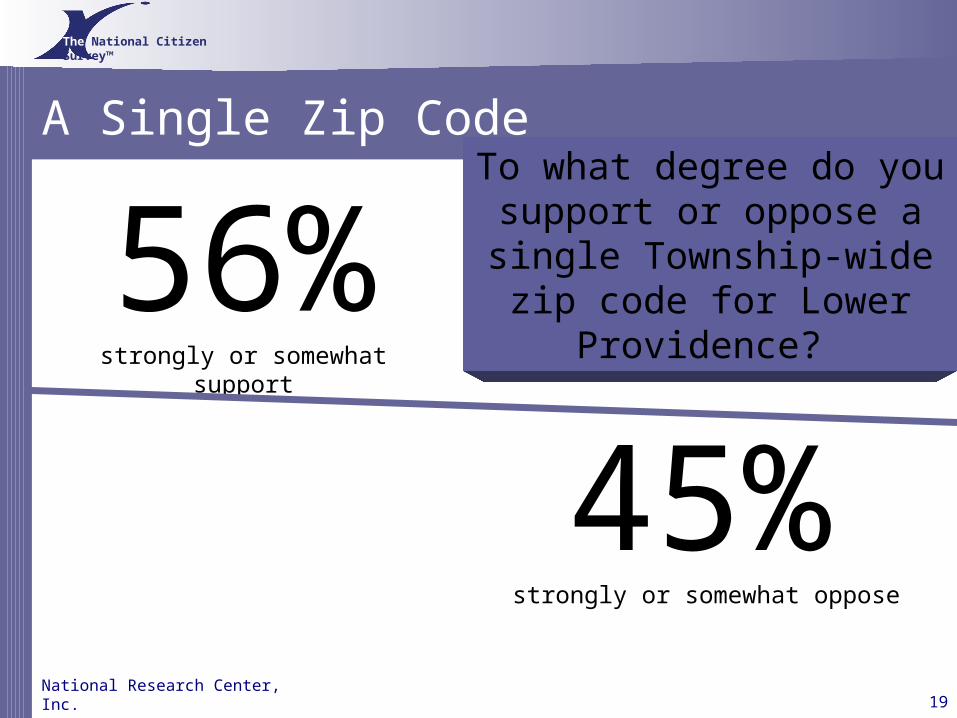
To what degree do you support or oppose a single Township-wide zip code for
Lower Providence?
A Single Zip Code
56%
strongly or somewhat support
45%
strongly or somewhat oppose
National Research Center, Inc. 20
The National Citizen Survey™
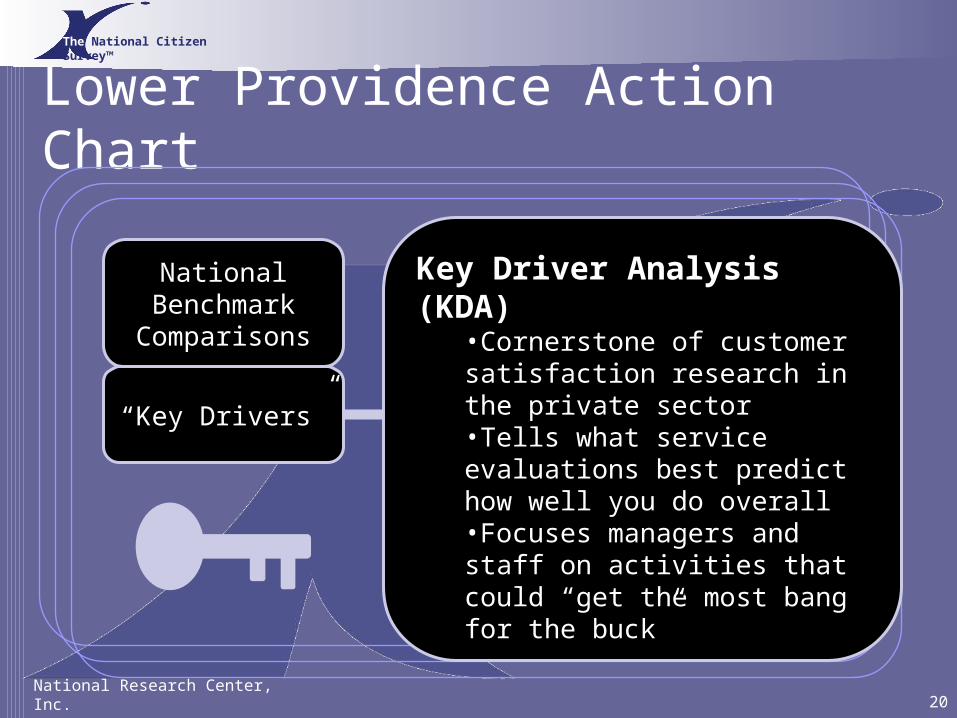
Lower Providence Action Chart
NationalNationalBenchmarkBenchmark
ComparisonsComparisons
““Key Drivers”Key Drivers”
Key Driver Analysis (KDA) Key Driver Analysis (KDA) •Cornerstone of customer Cornerstone of customer satisfaction research in the satisfaction research in the private sectorprivate sector•Tells what service evaluations Tells what service evaluations best predict how well you do best predict how well you do overalloverall•Focuses managers and staff on Focuses managers and staff on activities that could “get the most activities that could “get the most bang for the buck”bang for the buck”

National Research Center, Inc. 21
The National Citizen Survey™
Action Chart
Overa
ll Qu
ality
of L
ow
er P
rovid
en
ce
Tow
nsh
ip S
erv
ices
Legend
Above Benchmark
Similar to Benchmark
Below Benchmark
Key Driver
Recreation and Wellness
Township parks
Recreationprograms
Library
Civic Engagement
Public information
Public Safety
Traffic enforcement
Fire services
Policeservices
EMS
Emergency preparedness
Environmental SustainabilityPreservation
of natural areas
Sewer services
Storm drainage
Garbagecollection
Recycling
Community Design
Streetrepair
Economic development
Animal control
Code enforcement
Planningand zoning
Snowremoval
Streetlighting
Street cleaning
Traffic signal timing

National Research Center, Inc. 22
The National Citizen Survey™
ConclusionsStrengths
Overall service provision
Community quality
Civic engagement
Challenges
TransportationPublic TrustEconomic
Sustainability

National Research Center, Inc. 23
The National Citizen Survey™
Possible Next Steps
Policy Policy exploration exploration
surveysurvey
Focus Focus groupsgroups
Staff Staff workshopworkshop

Survey conducted by: National Research Center, Inc. • 3005 30 th St. • Boulder, CO 80301 • (303) 444-7863 • www.n-r-c.com
The National Citizen Survey™
Questions
Thank You!