surveillance of surgical site infections in nhs …...surveillance of surgical site infections in...
TRANSCRIPT

Surveillance of surgical site infections in NHS hospitals in England 2015/16

Surveillance of surgical site infections in NHS hospitals in England, 2015/16
2
About Public Health England
Public Health England exists to protect and improve the nation’s health and wellbeing,
and reduce health inequalities. We do this through world-class science, knowledge
and intelligence, advocacy, partnerships and the delivery of specialist public health
services. We are an executive agency of the Department of Health, and are a distinct
delivery organisation with operational autonomy to advise and support government,
local authorities and the NHS in a professionally independent manner.
Public Health England
133-155 Waterloo Road
Wellington House
London SE1 8UG
Tel: 020 7654 8000
http://www.gov.uk/phe
Twitter: @PHE_uk
Facebook: www.facebook.com/PublicHealthEngland
Suggested citation: Public Health England. Surveillance of surgical site infections in
NHS hospitals in England, 2015/16. London: Public Health England, December 2016.
Available from: www.gov.uk/phe
Prepared by: S Elgohari with the assistance of C Wloch, A Saei, A Charlett, P
Harrington and T Lamagni. We extend thanks to Professor A Johnson, head of the
Department of Healthcare Associated Infections and Antimicrobial Resistance for
comments. We are also grateful to the administrative staff at PHE’s Surgical Site
Infection Surveillance Service, staff within the PHE Software Development Unit and the
considerable contribution made by NHS trusts in England who have devoted time and
effort in collecting these data. Finally, many thanks to hospitals who shared their
experience of the SSI surveillance for inclusion in this report.
© Crown copyright 2016
You may re-use this information (excluding logos) free of charge in any format or medium,
under the terms of the Open Government Licence v3.0. To view this licence, visit OGL or
email [email protected]. Where we have identified any third party copyright
information you will need to obtain permission from the copyright holders concerned. Any
enquiries regarding this publication should be sent to: [email protected]
Published: December 2016
PHE gateway number: 2016506

Surveillance of surgical site infections in NHS hospitals in England, 2015/16
3
Contents
Main points 4
Section 1. Introduction and surveillance methods 5
1.1 Introduction 5
1.2 Data collection and feedback 5 1.3 Definitions 6 1.4 Participation in international surveillance 6 1.5 Analyses presented in this report 7
Section 2. Overview 8
2.1 Hospital participation and surgical volumes 8 2.2 Continuous surveillance 8 2.3 Data quality 9
Section 3. Cumulative incidence (%) of SSI 14
3.1 Incidence (%) of inpatient and readmission SSI by surgical category 14 3.2 Risk factors for SSI 18
Section 4. Trends in the incidence of SSI 21
4.1 Orthopaedic categories 21
4.2 Non-orthopaedic categories 22
Section 5. Characteristics of surgical site infections 26
5.1 Type of SSI 26
5.2 Causative micro-organisms 28
Section 6. Variation in SSI incidence between NHS hospitals 35
6.1 Box and whisker plots 35
6.2 Funnel plots 36
Section 7. Hospital perspectives 38
Section 8. Conclusions 40
8.1 Summary of findings in 2015/16 40 8.2 Variation in the SSI rate between participating hospitals 41
8.3 Optional post-discharge surveillance 41 8.4 Microbial aetiology 42
8.5 Future directions 43
Section 9. Glossary 44
Section 10. References 46

Surveillance of surgical site infections in NHS hospitals in England, 2015/16
4
Main points in 2015/16, data on 136,872 procedures and 1,632 surgical site infections (SSIs)
detected during the inpatient stay or on readmission following the initial operation were
collected by 198 NHS hospitals and seven independent sector NHS treatment centres
for 17 surgical categories under surveillance
data completion for age, patient sex and duration of operation was high in 2015/16
(≥95% of submitted records) in the majority of surgical categories. Data completion for
ASA score (standardised pre-operative health score) and BMI continued to vary between
categories. BMI data completion of ≥50% was achieved in nine surgical categories in
2015/16 compared to six in 2014/15
the cumulative SSI incidence (data from April 2011 to March 2016) ranged from 9.8% in
large bowel surgery to <1% in hip and knee prosthesis depending on the inherent wound
contamination
a significant decrease in the SSI incidence occurred for repair of neck of femur from
1.7% in 2008/9 to 1.0% in 2015/16
the SSI incidence remained low for hip and knee prosthesis (<1%) with decreasing
trends observed for hip prosthesis in the last three successive years
nine NHS trusts were identified as high outliers for the mandatory orthopaedic categories
in 2015/16 with an SSI incidence higher than expected. Eight NHS trusts and an
additional NHS treatment centre were identified as low outliers. All 18 providers have
been contacted and asked to investigate possible reasons
trends in SSIs for the other categories (from 2008/9 to 2015/16) identified a significant
increase for spinal surgery from 1.4% in 2008/9 to 1.8% in 2015/16
a significantly decreasing SSI trend occurred in bile duct/liver/pancreatic surgery, from
9.6% in 2008/9 to 5.2% in 2015/16. In gastric and large bowel surgery decreasing trends
were identified in recent years (3.1% and 8.5%, respectively, in 2015/16)
Enterobacteriaceae continued to increase, accounting for 28% of SSIs in 2015/16, the
highest to date. Staphylococcus aureus accounted for 13% of inpatient-detected SSIs in
2015/16 whilst the methicillin-resistant form (MRSA) accounted for 4%, both decreasing
since 2006/7. Small, steady decreases in methicillin-susceptible S. aureus (MSSA) were
observed since 2013/14, reaching 9% of SSIs in 2015/16
S. aureus predominated in orthopaedic and spinal surgery accounting for ≥35% of SSI
cases. Coagulase-negative staphylococci and Enterobacteriaceae predominated in
coronary artery bypass graft and large bowel surgery SSIs, respectively
in primary total hip prosthesis, the proportion of SSIs due to S. aureus was highest in the
uncemented (46%) compared to the cemented (37%) and hybrid fixation (31%) groups

Surveillance of surgical site infections in NHS hospitals in England, 2015/16
5
Section 1. Introduction and surveillance
methods
1.1 Introduction
This report is a summary of data on surgical site infections (SSIs) collected by NHS
hospitals and independent sector (IS) NHS treatment centres in England participating in
one of 17 surgical categories of surveillance between April 2004 and March 2015. The
results include orthopaedic data submitted by hospitals following the mandatory
surveillance requirement introduced by the Department of Health in April 2004 [1]. This
requires all NHS trusts undertaking orthopaedic surgical procedures to carry out a
minimum of three months’ surveillance in each financial year in at least one of four
categories (hip prosthesis, knee prosthesis, repair of neck of femur or reduction of long
bone fracture). Trusts with very small volumes are exempt from the mandatory
surveillance but are expected to undertake surveillance in a category that reflects the
largest component of their surgical activity.
In response to the Competitions and Market Authority (CMA) order in 2014, all
independent sector hospitals have been required to provide specified patient outcome
data including SSIs from September 2016 and to publish results from April 2017 [2].
1.2 Data collection and feedback
To participate in PHE’s national SSI surveillance programme, hospitals must first attend
training at the national co-ordinating centre in London. Once trained, all participating
hospitals are required to follow the surveillance protocol outlining the case definitions
and follow-up methods [3]. Surveillance data are collected prospectively on all eligible
patients in a given surgical category on a quarterly basis (three months). Patients are
followed-up to identify SSIs for 30 days after surgery for non-implant procedures and
one year for prosthetic implant procedures. A set of demographic and operation-related
data are collected for each eligible procedure and submitted via a secure web-based
application.
Since July 2008, hospitals are required to have systems in place to identify patients who
are included in the surveillance and later readmitted to hospital with an SSI. SSIs
identified on readmission are assigned to the hospital where the original operation took
place. Other post-discharge surveillance methods were introduced in 2008 but remain
optional. They are: a) systematic review of patients attending outpatient clinics or at
home by clinical staff trained to apply the case definitions and b) wound healing
questionnaires completed by patients 30 days after the operation [3]. Data derived from

Surveillance of surgical site infections in NHS hospitals in England, 2015/16
6
these optional methods are not currently included in the national benchmarks or used
for outlier assessment.
After each completed quarter, participating hospitals can download automated
confidential reports accessed securely from the SSI web application for dissemination
within their trust. These reports provide the hospitals’ crude SSI incidence and the
corresponding national benchmark from the same surgical category. A range of reports
are available from the web application providing stratified rates for key risk factors and
data quality indicators.
PHE analyses the submitted data at quarterly intervals to identify hospitals whose SSI
incidence falls above the 90th or below the 10th percentiles nationally for a given
surgical category. PHE alerts these hospitals of their outlier status and encourages
them to investigate possible reasons. Additional support is provided to hospitals who
request advice or in-depth epidemiological analysis to assist with investigating
persistent SSI problems. On-site visits are offered by PHE as a vehicle for sharing in-
depth analyses and further surveillance advice to multi-disciplinary teams.
1.3 Definitions
SSIs are defined according to a standard set of clinical criteria for infections that affect the
superficial tissues (skin and subcutaneous layer) of the incision and those that affect the
deeper tissues (deep incisional or organ-space). These are based on the definitions
established by the US Centers for Disease Control and Prevention (CDC) [4] with a minor
modification, involving the requirement for pus cells in addition to a positive culture from wound
samples (for all SSI types) and the need for at least two symptoms to accompany a clinical
diagnosis (superficial SSIs only).
A range of risk factors are captured through the surveillance including the ASA score. This is
the patient’s pre-operative physical status on a scale from one to five, a classification system
developed by the American Society of Anesthesiologists (ASA), with higher scores indicating
severe systemic disease. This along with the category-specific T-time (duration of surgery
exceeding the >75th percentile rounded to the nearest hour) and the degree of wound
contamination constitute the three components of the CDC National Healthcare Safety Network
(NHSN) Risk Index [5]. There are four wound contamination classes (clean, clean-
contaminated, contaminated and dirty) each with accepted standard definitions [3;4;6]
1.4 Participation in international surveillance
PHE shares anonymised SSI surveillance data with the European Centre for Disease
Prevention and Control (ECDC) HAI-Net on an annual basis using ECDC’s protocol,
also based on CDC definitions [6]. As data are anonymised, they cannot be traced back
to individual patients, surgeons or named hospitals. ECDC collates SSI data from other

Surveillance of surgical site infections in NHS hospitals in England, 2015/16
7
European member states and publishes comparative analyses including trends. These
provide an opportunity to examine variation in the SSI incidence between European
countries and to improve understanding of how these infections may be prevented.
Inter-country variation, however, may be affected by differences in surveillance
methodology and/or risk factors. A recent comparison of SSI data between England and
Norway identified differences in the SSI incidence for selected surgical categories due
to differences in surveillance methodology and risk factors [7].
1.5 Analyses presented in this report
Data on surgical procedures carried out between April 2004 and March 2016 collected
by NHS hospitals and independent sector NHS treatment centres were extracted on 17
October 2016 for this report. The SSIs included in this report are based on cases
detected during the inpatient stay or on readmission to the same or other hospitals
following the initial operation. Data from 2004 were used for showing secular trends in
inpatient-detected SSI incidence for illustrative purposes. SSI trends from July 2008
were evaluated as this was when readmission surveillance became a requirement for all
participating hospitals (readmission surveillance was optional prior to July 2008).
For benchmarking purposes, cumulative five-year data were used (April 2011 to March
2016).
The cumulative SSI incidence (%) presented in this report was based on SSIs detected
during hospital stay combined with SSIs identified on readmission following the initial
operation. Where appropriate, inpatient SSIs were analysed separately for meaningful
interpretation. To take into account the variation in the length of follow-up, the incidence
density (ID) was calculated using the number of cases in the numerator and the total
number of days of patient follow-up (from inpatient surveillance) in the denominator
giving the number of SSIs per 1,000 patient days of follow-up. The exact binomial 95%
confidence interval (CI) for proportions and Poisson CI for the ID are given in this report.
Orthopaedic data from participating hospitals are aggregated to trust level for public
reporting purposes. Funnel plots were constructed for each orthopaedic category using
the inpatient/readmission cumulative SSI incidence per NHS trust in 2015/16. Each plot
identifies trusts with estimates falling within the expected variation and outliers falling
beyond the upper or lower 95% control limits (significantly higher or lower than expected
respectively). Independent sector NHS treatment centres are also included in these
plots. An additional supplement to this report presents the cumulative SSI estimate by
NHS trust in 2015/16 for the mandatory orthopaedic surveillance:
https://www.gov.uk/government/publications/surgical-site-infections-ssi-surveillance-nhs-
hospitals-in-england

Surveillance of surgical site infections in NHS hospitals in England, 2015/16
8
Section 2. Overview
2.1 Hospital participation and surgical volumes
Overall, a total of 198 NHS hospitals representing 142 NHS trusts and an additional
seven IS NHS treatment centres participated in 2015/16, contributing data on 136,872
procedures and 1,632 inpatient/readmission SSIs for 17 surgical categories. This
compares with 130,321 procedures and 1,533 inpatient/readmission SSIs in 2014/15
collected by 200 NHS hospitals representing 143 trusts and an additional eight IS NHS
treatment centres.
Figure 1 shows trends in hospital participation and surgical volume in the national SSI
surveillance scheme split by the mandatory orthopaedic and the voluntary non-
orthopaedic modules. In 2015/16, 184 NHS hospitals representing 138 NHS trusts
participated in the mandatory orthopaedic categories along with seven IS NHS
treatment centres, the combined total (n=191) being one less than in 2014/15 (n=192).
A marginal increase (1%) in surgical volume submitted was seen in 2015/16
(n=103,838) compared to 2014/15 (n=102,501). Two eligible NHS trusts did not
participate in the orthopaedic surveillance in 2015/16. Of the remaining 138 NHS trusts,
85% (n=118) fulfilled more than the minimum requirement (one surveillance category for
a minimum of three months) for the mandatory surveillance.
For the voluntary non-orthopaedic categories, total surgical volume increased by 19%
between 2014/15 (n=27,820) and 2015/16 (n=33,034). The number of participating
hospitals also increased slightly from 70 to 72 hospitals.
2.2 Continuous surveillance
After excluding five of 17 surgical categories that had a small number of participating
hospitals in 2015/16 (<10), the remaining categories showed considerable variation in
the proportion of hospitals undertaking continuous surveillance. This was highest in
knee prosthesis and spinal surgery (60% each), followed by hip prosthesis (59%),
reduction of long bone fracture (47%), small bowel and cardiac (non-CABG) surgery
(46% each), large bowel surgery and repair of neck of femur (45% each). Coronary
artery bypass graft (CABG) and breast surgery had the lowest proportions (40% and
23%, respectively).
Among the orthopaedic categories only knee prosthesis showed an increase in
continuous surveillance in 2015/16 compared to 2014/15 (56%). Hip prosthesis
remained comparable to 2014/15 (also 59%). In the non-orthopaedic categories, trends

Surveillance of surgical site infections in NHS hospitals in England, 2015/16
9
in continuous surveillance varied between years although for spinal surgery continuous
surveillance in 2014/15 (60%) was sustained in 2015/16. Figure 1: Trends in the number of NHS hospitals participating in the SSI Surveillance Service and procedures submitted, England
-30
20
70
120
170
220
0
20,000
40,000
60,000
80,000
100,000
120,000
Nu
um
be
r o
f h
os
pit
als
Nu
mb
er
of
op
era
tio
ns
operations - non-orthopaedic data operations - orthopaedic data
hospitals - non-orthopaedic data hospitals - orthopaedic data
2.3 Data quality
Data completion for key SSI risk factors is essential for risk stratification purposes,
enabling hospitals to investigate factors underpinning unusual deviations from the SSI
national benchmark or from previous local trends. Table 1 shows the proportion of
records submitted with completed fields for key data items by surgical category during
2015/16.
Nationally, data completion for age, patient sex, date of admission and procedure code
remained at 100% for records submitted in 2015/16 across all surgical categories. For
the risk factors used in the NHSN risk index (see section 1), data completion was very
high (≥99%) for wound class and duration of surgery across most surgical categories
although for ASA score there was more variation, ranging between 63% for cardiac
(non-CABG) surgery and 97% for gastric, hip prosthesis and knee prosthesis.

Surveillance of surgical site infections in NHS hospitals in England, 2015/16
10
Data completeness was considerably lower for height and weight used to calculate body
mass index (BMI), ranging from 21% in reduction of long bone fracture to 80% for
CABG surgery. In 2015/16, there were nine categories where BMI data completion was
50% or more of submitted records (bile duct/liver/pancreatic, breast, cholecystectomy,
cardiac (non-CABG), CABG, cranial, hip prosthesis, knee prosthesis and large bowel
surgery). In 2015/16, BMI data completion increased in 12 surgical categories
compared to 2014/15, with the biggest increase in cranial surgery (increasing from 35%
in 2014/15 to 61% in 2015/16) followed by gastric surgery (from 9% in 2013/14 to 33%
in 2015/16). BMI data completion for knee prosthesis was 60% in 2015/16 and in
2014/15. For the remaining four surgical categories, BMI data completion decreased
compared to 2014/15. Six surgical categories had BMI data completion of ≥50% in
2015/16 and in 2014/15: cardiac non-CABG, cholecystectomy, CABG, hip prosthesis,
knee prosthesis and large bowel surgery. Table 1: Percentage of submitted surveillance records with complete data for key data items, NHS hospitals in England, 2015/16
* patients aged ≥16 years
Optional post-discharge surveillance methods are available to participating hospitals
and these are: patient post-discharge questionnaires (PDQs) filled in at 30 days after
the operation and outpatient review clinics. These two surveillance methods are
particularly important for surgical categories with short length of hospital stay. Of these
two methods, PDQ surveillance is the most commonly used by hospitals and offers a
comprehensive system of monitoring to identify infections that occur after discharge and
N = 136,872
Total No.
operations Age
ASA
score
Duration of
operation
Wound
class BMI*
Patient
sex
Date of
admission
OPCS
code
Abdominal hysterectomy 589 100 91 100 86 41 100 100 99
Bile duct, liver or pancreatic surgery 479 100 96 100 98 53 100 100 100
Breast surgery 5,337 100 95 100 100 51 100 100 100
Cardiac (non-CABG) 3,143 100 63 100 100 79 100 100 100
Cholecystectomy 943 100 97 100 100 52 100 100 100
Coronary artery bypas graft 5,116 100 75 100 97 80 100 100 100
Cranial surgery 1,531 100 87 99 100 61 100 100 100
Gastric 653 100 97 100 100 33 100 100 100
Hip replacement 40,125 100 97 100 100 55 100 100 100
Knee replacement 42,243 100 97 100 100 60 100 100 100
Large bowel surgery 4,607 100 96 100 100 58 100 100 100
Limb amputation 492 100 81 100 83 22 100 100 100
Reduction long bone fracture 2,273 100 94 100 100 21 100 100 100
Repair of neck of femur 19,197 100 95 100 100 22 100 100 100
Small bowel surgery 1,004 100 95 100 100 45 100 100 100
Spinal surgery 7,938 100 94 95 99 30 100 100 100
Vascular surgery 1,202 100 95 100 100 44 100 100 100

Surveillance of surgical site infections in NHS hospitals in England, 2015/16
11
are treated in the community. Overall, the proportion of procedures where PDQs were
given to patients increased from 39% in 2010/11 to 50% in 2015/16 (Figure 2 showing
proportions of PDQ given and PDQ completed based on number of operations). The
patient response rate based on PDQs completed increased from 69% of questionnaires
given in 2010/11 to 77% in 2015/16. PDQ use was highest at >70% for abdominal
hysterectomy, bile duct liver and pancreatic, cholecystectomy, cranial and breast
surgery and lowest at <40% for cardiac surgery, coronary artery bypass graft (CABG),
repair of neck of femur (RNoF) and vascular surgery. Although lower, collection of data
from outpatient review surveillance has increased, from 21% of procedures in 2010/11
to 26% in 2015/16 (not shown). Figure 2: Trends in the proportion of procedures with post-discharge questionnaire given and completed, NHS hospitals in England, April 2010 to March 2016
2.4 Patient and operation-related characteristics
Patient and operation-related characteristics derived from surveillance records for
patients undergoing surgery in 2015/16 are shown in Tables 2 and 3.
The median age varied by surgical category (Table 2) being lowest in abdominal
hysterectomy (50 years) and highest in repair of neck of femur (85 years). Duration of
operation was highest in both cardiac categories (CABG and cardiac non-CABG), each
0
10
20
30
40
50
60
70
% o
f o
pe
rati
on
s
PDQ given (%)
PDQ completed (%)

Surveillance of surgical site infections in NHS hospitals in England, 2015/16
12
having median duration in excess of 200 minutes. The categories of surgery with the
highest proportion of patients with an ASA score ≥3 were in CABG and cardiac
categories (>90% each) and in limb amputation surgery (78%). Small bowel, limb
amputation and large bowel surgery had the highest proportion of procedures with a
wound classified as contaminated or dirty (47%, 25% and 16%, respectively).
Of nine surgical categories with BMI data completion of 50% or more (see Table 1),
knee prosthesis and cholecystectomy had the highest proportion of patients (55% and
45% respectively) classed as obese (BMI ≥ 30kg/m2). Five of these nine categories also
had BMI data completion of 50% or more in 2014/15 and within these, the proportion of
patients that were obese in 2015/16 remained similar to the previous year.
The proportion of operations performed on an emergency basis (defined as procedures
that are immediate, unplanned and life-saving or those that are performed immediately
after resuscitation) was most common for vascular and large bowel surgery (6% each).
Although repair of neck of femur patients are usually admitted on an emergency basis,
the proportion classified as emergency procedures based on the PHE surveillance
definitions was 1.2%.
The proportion of patients receiving surgical antimicrobial prophylaxis was high (≥95%)
in 11 surgical categories including the orthopaedic categories, reflecting the current
recommendations aimed at defined surgical groups [8;9]. The lowest proportion
observed was in cholecystectomy (61%).
The proportion of patients where discontinuation of inpatient surveillance was due to
death was highest in repair of neck of femur and limb amputation surgery (6% and 4%,
respectively). These should be interpreted with caution as these data only capture
deaths within the inpatient stay.
Table 3 shows primary indication for surgery in patients undergoing hip prosthesis, knee
prosthesis and repair of neck of femur. In hip and knee prosthesis, osteoarthritis
accounted for the majority of procedures (82% and 92%, respectively) and the second
most common indication was revision (10% and 6%, respectively). For repair of neck of
femur, the most common primary indication was trauma (99%).

Surveillance of Surgical Site Infections in NHS hospitals in England 2015/16
13
Table 2: Patient and operation-related characteristics by surgical category, NHS hospitals, England, 2015/16
*patients aged ≥16 years
Table 3: Primary indication for surgery, orthopaedic procedures, NHS hospitals, England, 2015/16
Abdominal hysterectomy 50 (44-60) 101 (77-134) 3 (2-4) 13.3 0.0 42.4 N/A 0.5 N/A 96.9 0.0 0.0
Bile duct, liver or pancreatic 62 (51-72 170 (82-306) 6 (1-10) 29.2 2.8 37.1 46.6 0.4 1.3 96.8 1.9 1.3
Breast surgery 58 (48-68) 60 (40-90) 1 (1-1) 9.1 0.1 31.1 1.7 0.6 1.6 72.5 12.5 0.1
Cardiac surgery 68 (52-76) 235 (185-290) 8 (6-12) 90.1 0.3 29.3 62.4 1.9 3.4 98.4 89.7 3.0
Cholecystectomy 52 (37-65) 60 (40-80) 1 (1-1) 10.1 0.7 45.2 28.3 0.1 N/A 60.7 0.1 0.3
Coronary artery bypass graft 69 (61-75) 230 (190-270) 6 (5-9) 94.3 0.0 34.4 80.2 1.1 0.2 99.1 84.4 1.8
Cranial surgery 59 (46-71 104 (60-175) 5 (3-10) 43.4 1.6 25.5 53.6 2.8 0.0 98.8 48.5 2.4
Gastric surgery 58 (44-69) 145 (80-265) 4 (2-10) 28.2 5.2 49.8 51.5 1.2 2.6 87.1 3.7 1.1
Hip replacement 71 (62-78) 84 (65-105) 4 (3-6) 22.8 0.1 38.5 39.6 0.1 9.7 99.1 100 0.2
Knee replacement 70 (63-77) 78 (62-98) 4 (3-5) 21.2 0.0 55.3 43.0 0.0 5.7 99.4 100 0.1
Large bowel surgery 69 (57-78) 173 (125-235) 8 (5-13) 39.9 16.4 25.0 51.1 6.0 N/A 96.2 2.5 2.8
Limb amputation 68 (57-76) 49 (28-72) 8 (1-19) 78.2 24.5 28.2 71.1 3.9 N/A 84.5 1.0 4.1
Reduction of long bone fracture 64 (42-80) 88 (60-120) 5 (1-13) 39.5 2.4 18.7 38.5 1.5 N/A 99.4 98.8 2.4
Repair of neck of femur 85 (78-90) 65 (51-87) 12 (7-20) 71.7 0.0 10.5 30.3 1.2 0.3 96.5 100 5.9
Small bowel surgery 63 (45-73) 120 (73-184) 8 (5-15) 42.2 46.5 18.1 50.8 4.7 0.7 93.0 2.7 2.9
Spinal surgery 54 (39-69) 126 (85-188) 3 (1-7) 21.9 0.3 33.7 47.3 0.2 35.7 98.7 49.8 0.4
Vascular surgery 73 (65-79) 175 (122-231) 4 (2-8) 72.0 0.4 24.5 73.3 6.1 0.1 92.7 59.7 2.5
Discontinuation of
inpatient surveillance
due to death (%)
Antibiotic
prophylaxis
(%)
Implant
(%)
Male
(%)
Emergency
(%)
Revision
(%)
BMI ≥ 30
(%)*
Median length
hospital stay
in days (IQR)
Median age
in years
(IQR)
Median duration
operation in
minutes (IQR)
ASA ≥ 3
(%)
Contaminated/
dirty incision
(%)
Hip replacement 39,417 32,324 (82.0) 251 (0.6) 292 (0.7) 1,883 (4.8) 755 (1.9) 423 (1.1) 368 (0.9) 2,876 (7.3) 245 (0.6) 3,912 (9.9)
Knee replacement 41,665 38,202 (91.7) 318 (0.8) 27 (0.1) 81 (0.2) 629 (1.5) 86 (0.2) 384 (0.9) 1,746 (4.2) 192 (0.5) 2,408 (5.8)
Repair of neck of femur 19,125 60 (0.3) 2 (<0.1) 0 (0.0) 18,963 (99.2) 47 (0.2) 16 (0.1) 8 (<0.1) 21 (0.1) 8 (<0.1) 53 (0.3)
No.
operations
Osteoarthritis
No. (%)
Inflammatory joint
disease No. (%)
Avascular
necrosis No. (%)
Trauma
No. (%)
Other
No. (%)Unknown
No. (%)
All
No. (%)
Fracture
No. (%)
Infection
No. (%)
Other
No. (%)
Revision

Surveillance of Surgical Site Infections in NHS hospitals in England 2015/16
14
Section 3. Cumulative incidence (%) of SSI
3.1 Incidence (%) of inpatient and readmission SSI by surgical category
Table 4 shows the volume of surgical procedures, the number of SSI cases and the
cumulative SSI incidence (%) by surgical category for surgery undertaken between April
2011 and March 2016. Five-year aggregated data were used to give a robust measure
of the national average for benchmarking purposes. Over this period, data for a total of
611,700 procedures across 17 surgical categories were submitted by 218 participating
hospitals representing 147 NHS trusts. An additional nine NHS treatment centres
participated in the surveillance.
The cumulative incidence (%) of SSI varied by surgical category (Figure 3; Table 4)
depending largely on the inherent likelihood of microbial contamination at the operative
site associated with that type of surgery. The highest incidence (risk) was observed in
large bowel surgery at 9.8% over this five-year period. The lowest incidence was
observed in hip and knee prosthesis surgery (0.6% each).
SSIs detected through readmission accounted for a relatively high proportion of
inpatient and readmission cases in surgical categories with a relatively short length of
hospital stay such as breast surgery (89%), knee prosthesis (72%), abdominal
hysterectomy (68%), and hip prosthesis (64%). In categories with longer length of
hospital stay (gastro-intestinal, repair of neck of femur, cardiac and limb amputation
surgeries), readmission SSIs accounted for ≤35% of SSIs detected.
To take into account the variation in the length of patient follow-up during hospital stay,
the incidence density was estimated. This metric takes into account the length of
inpatient follow-up, defining SSI incidence per 1,000 days of inpatient follow-up. Using
this metric, the variation between surgical categories was less pronounced when
compared to the inpatient-based cumulative incidence. However, large bowel surgery
remains as having the highest SSI incidence density (7.8) and hip and knee surgery as
the lowest (<0.5) (Table 4).
Table 5 and Table 6 present the five-year benchmarks (April 2011 to March 2016) for
three orthopaedic categories stratified by primary and revision procedures. This analysis
excluded procedures with three-character OPCS codes (as it was not possible to
distinguish between primary and revision procedures based on standard definitions
[10]). Records with missing OPCS codes were also excluded. The total excluded was
1.4% of hip procedures (2,678/193,589); 1.7% of knee procedures (3,338/200,435) and
4.5% of repair of neck of femur procedures (4,204/92,532). The SSI incidence for
revision procedures was higher compared to primary surgery for all three procedures.
Repair of neck of femur had the highest cumulative incidence of SSI for both the

Surveillance of Surgical Site Infections in NHS hospitals in England 2015/16
15
primary and revision subsets (1.2% and 4.7%, respectively). For repair of neck of femur,
time to onset of infection appeared more rapid for revision compared to primary
procedures (9 days and 15 days, respectively). However, the reverse was observed for
knee prosthesis, where time to onset of infection was longer for revision compared to
primary procedures (21 days and 18 days respectively). For hip prosthesis, time to
onset of SSI differed by a marginal amount. Figure 3: Cumulative SSI incidence (%) with 95% CIs (inpatient and readmission) by surgical category, NHS hospitals in England, April 2011 to March 2016

Surveillance of Surgical Site Infections in NHS hospitals in England 2015/16
16
Table 4: Cumulative SSI incidence (%) by surgical category, NHS hospitals in England, April 2011 to March 2016
Surgical Site Infections
No. operations
No. hospitals
No. Inpatient
No. inpatient & readmission
Inpatient & readmisson % 95% CIs
Median time to infection
(days)*
Incidence density/1,000
inpatient
days† 95% CI
Abdominal hysterectomy 3,249 20 13 41 1.3% 0.9% - 1.7% 10 1.1 0.6 - 1.9
Bile duct, liver or pancreatic surgery 2,546 7 125 142 5.6% 4.7% - 6.5% 8 4.8 4.0 - 5.7
Breast 15,656 34 14 130 0.8% 0.7% - 1.0% 14 0.6 0.3 - 1.0
Cholecystectomy 1,761 7 37 53 3.0% 2.3% - 3.9% 7 4.6 3.3 - 6.4
Coronary artery bypass graft 28,335 20 731 1,081 3.8% 3.6% - 4.0% 12 2.7 2.6 - 3.0
Cardiac (non-CABG) 13,851 17 113 172 1.2% 1.1% - 1.4% 14 0.7 0.6 - 0.8
Cranial 7,159 8 45 108 1.5% 1.2%- 1.8% 19 0.7 0.5 - 1.0
Gastric 1,517 8 32 37 2.4% 1.7% - 3.3% 8 2.5 1.7 - 3.6
Hip prosthesis 193,589 192 450 1,248 0.6% 0.6% - 0.7% 17 0.4 0.4 - 0.4
Knee prosthesis 200,435 183 325 1,169 0.6% 0.6% - 0.6% 18 0.3 0.3 - 0.4
Large bowel 19,228 52 1,599 1,890 9.8% 9.4% - 10.3% 8 7.8 7.4 - 8.2
Limb amputation 2,036 15 42 60 2.9% 2.3% - 3.8% 13 1.6 1.1 - 2.1
Reduction of long bone fracture 13,420 34 77 148 1.1% 0.9% - 1.3% 17 0.7 0.5 - 0.8
Repair of neck of femur 92,532 120 829 1,129 1.2% 1.2% - 1.3% 15 0.5 0.5 - 0.6
Small bowel 4,163 20 266 300 7.2% 6.4% - 8.0% 8 5.3 4.7 - 6.0
Spinal 35,648 26 216 482 1.4% 1.2% - 1.5% 14 1.0 0.9 - 1.2
Vascular 6,137 21 109 172 2.8% 2.4% - 3.2% 12 2.1 1.7 - 2.6
Total 641,262 227 5,023 8,362
*six records excluded due to missing operation data or hospital discharge date or negative values for follow-up time

Surveillance of Surgical Site Infections in NHS hospitals in England 2015/16
17
Table 5: Cumulative SSI incidence (%) in primary procedures, orthopaedic categories, NHS hospitals in England, April 2011 to March 2016
Table 6: Cumulative SSI incidence (%) in revision procedures, orthopaedic categories, NHS hospitals in England, April 2011 to March 2016
No.
operations
No.
hospitals
No.
Inpatient
No. inpatient &
readmission
Inpatient &
readmisson % 95% CIs
Median time
to infection
(days)
Incidence
density/1,000
inpatient days 95% CIs
Hip prosthesis 169,249 192 284 927 0.5% 0.5% - 0.6% 17 0.3 0.3 - 0.4
Knee prosthesis 184,948 181 242 964 0.5% 0.5% - 0.6% 18 0.3 0.2 - 0.3
Repair of neck of femur 88,031 120 769 1,055 1.2% 1.1% - 1.3% 15 0.5 0.5 - 0.6
Surgical Site Infections
No.
operations
No.
hospitals
No.
Inpatient
No. inpatient &
readmission
Inpatient &
readmisson % 95% CIs
Median time
to infection
(days)
Incidence
density/1,000
inpatient days 95% CIs
Hip prosthesis 21,662 181 155 299 1.4% 1.2% - 1.5% 16 0.8 0.6 - 0.9
Knee prosthesis 12,149 173 68 179 1.5% 1.3% - 1.7% 21 0.7 0.5 - 0.9
Repair of neck of femur 297 72 14 14 4.7% 2.6% - 7.8% 9 2.2 1.2 - 3.7
Surgical Site Infections

Surveillance of Surgical Site Infections in NHS hospitals in England 2015/16
18
3.2 Risk factors for SSI
Figure 4 shows the cumulative incidence of SSI for selected risk factors by surgical
category based on data for 2015/16. The selected risk factors presented are age, ASA
score, ‘T-time’ (duration of operation in minutes dichotomised into two groups – see
Section 1.3), and BMI. The BMI analysis was restricted to surgical categories where
BMI data completion was ≥50% of submitted records.
Differences in the SSI incidence between the youngest (<45 years) and oldest patients
(≥65 years) were observed in some surgical categories in 2015/16. The SSI incidence
was highest among patients aged ≥65 years undergoing bile duct/liver/pancreatic,
cholecystectomy, CABG, limb amputation and spinal surgery. Conversely, the SSI
incidence was highest in the youngest patients undergoing cranial, knee prosthesis or
large bowel surgery.
Patients with an ASA score of ≥3 typically had an increased SSI incidence except in
cardiac (non-CABG), cholecystectomy and gastric surgery where the reverse pattern
was observed. Duration of operation greater than the NHSN 75th percentile for that
category had an increased risk of SSI compared to procedures below this threshold
across all surgical categories with the exception of cholecystectomy and cranial surgery
where the opposite was observed. Excess incidence for longer duration of procedures
was most marked in breast and large bowel surgery.
The risk of SSI increased among patients who were obese (BMI ≥30kg/m2) in the
majority of surgical categories examined with the exception of bile duct/liver/pancreatic
and cholecystectomy surgery, where the reverse pattern was observed. For knee
prosthesis, the SSI risk was equivalent in both groups.
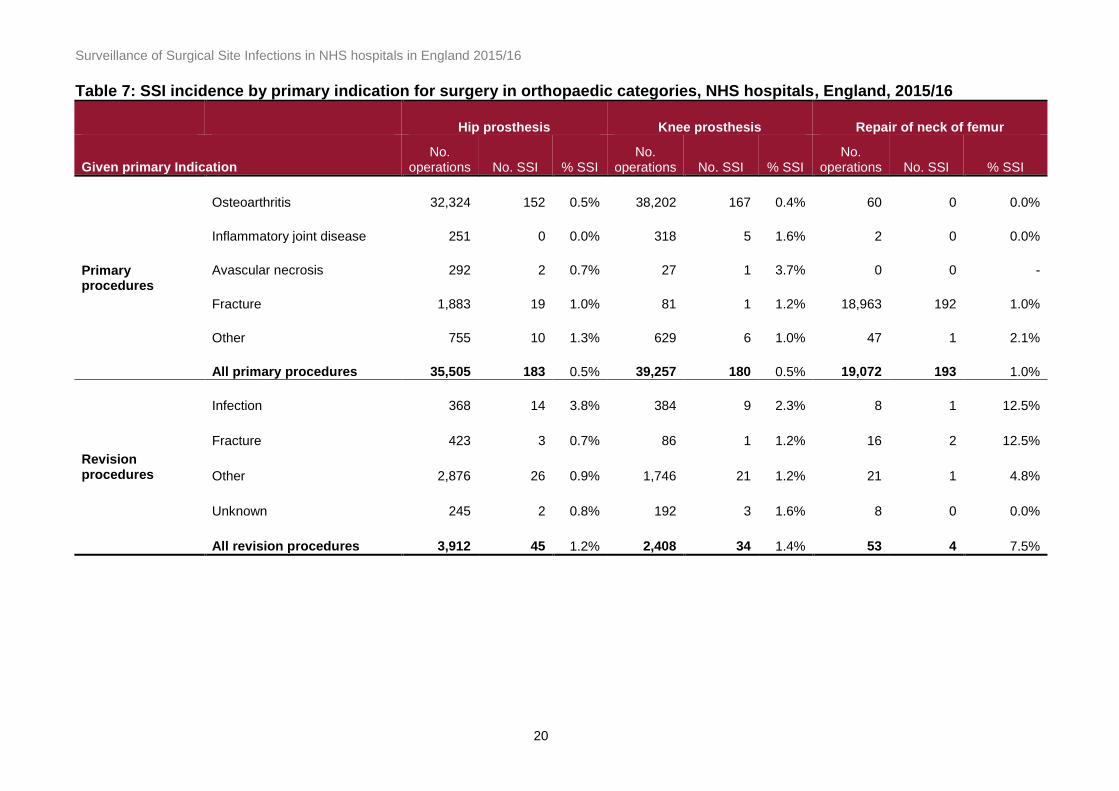
Table 7 shows the SSI incidence by primary indication for hip prosthesis, knee
prosthesis and repair of neck of femur in 2015/16. For hip prosthesis, the risk of SSI
was highest for surgery undertaken for revision due to a previous infection (3.8%). In
knee prosthesis, the SSI incidence was highest for avascular necrosis (3.7%) although
this was based on a very small sample size (n=27). The next highest incidence within
the knee category was for revision due to a previous infection (2.3%). For repair of neck
of femur, small sample sizes for the majority of indications affected the precision of
estimates although aggregated data for revision (all reasons) carried the highest SSI
risk at 7.5%.

Surveillance of Surgical Site Infections in NHS hospitals in England 2015/16
19
Figure 4: Stratification of the inpatient/readmission SSI incidence, selected risk factors, by surgical category, NHS
hospitals, England 2015/16
0%
2%
4%
6%
8%
10%
12%
14%
SS
I in
cid
en
ce (
%)
<45y 45-64y ≥65y
0%
2%
4%
6%
8%
10%
12%
14%ASA <3 ASA ≥3
0%
2%
4%
6%
8%
10%
12%
14%<T time ≥T-time
0%
2%
4%
6%
8%
10%
12%
14%
SS
I ic
iden
ce (
%)
BMI <30 BMI ≥30
The BMI analysis is based on surgical categories where the BMI data completion was ≥50%
Surveillance of Surgical Site Infections in NHS hospitals in England 2015/16
20
Table 7: SSI incidence by primary indication for surgery in orthopaedic categories, NHS hospitals, England, 2015/16
Hip prosthesis Knee prosthesis Repair of neck of femur
Given primary Indication No.
operations No. SSI % SSI No.
operations No. SSI % SSI No.
operations No. SSI % SSI
Primary procedures
Osteoarthritis 32,324 152 0.5% 38,202 167 0.4% 60 0 0.0%
Inflammatory joint disease 251 0 0.0% 318 5 1.6% 2 0 0.0%
Avascular necrosis 292 2 0.7% 27 1 3.7% 0 0 -
Fracture 1,883 19 1.0% 81 1 1.2% 18,963 192 1.0%
Other 755 10 1.3% 629 6 1.0% 47 1 2.1%
All primary procedures 35,505 183 0.5% 39,257 180 0.5% 19,072 193 1.0%
Revision procedures
Infection 368 14 3.8% 384 9 2.3% 8 1 12.5%
Fracture 423 3 0.7% 86 1 1.2% 16 2 12.5%
Other 2,876 26 0.9% 1,746 21 1.2% 21 1 4.8%
Unknown 245 2 0.8% 192 3 1.6% 8 0 0.0%
All revision procedures 3,912 45 1.2% 2,408 34 1.4% 53 4 7.5%

Surveillance of Surgical Site Infections in NHS hospitals in England 2015/16
21
Section 4. Trends in the incidence of SSI
4.1 Orthopaedic categories
Figure 5 shows trends in the crude cumulative incidence of SSI in the mandatory
orthopaedic categories between 2004/5 and 2015/16. Three types of trends are shown:
inpatient-detected, readmission-detected and combined inpatient and readmission SSIs.
To estimate the average annual change in SSI, a univariable logistic regression model
was used. Trends based on inpatient and readmission SSIs during the eight-year period
from July 2008 to March 2016 were evaluated. Since some categories exhibited
variation in the annual crude incidence, the independent-year effects model (with
2008/9 as the baseline year) was compared against a linear trends model using a
likelihood ratio test (LRT). The test determined whether model fit improved or not
compared to the linear model. The odds ratio (OR) with 95% CIs are computed from
each model and reported as appropriate.
For hip prosthesis, the observed crude incidence peaked in 2008/9 at 0.9% reducing to
0.6% in 2015/16. Although over this eight-year period, no clear trends were evident
initially (from 2008/9 to 2012/13), small yet steady decreases were discernible in the
most recent three years (from 2013/14 to 2015/16). Comparison of the two models
indicated that there was evidence of non-linearity in the SSI trends (LRT p=0.0078) with
a significant decrease compared to the baseline in the last three successive years
(2013/14, 2014/15 and 2014/15), of which 2015/16 exhibited the largest decrease (OR:
0.64, 95% CI: 0.53 – 0.78, p <0.001).
For knee prosthesis the observed incidence increased after 2008/9 peaking in 2011/12
(0.7%) but returned to baseline levels (0.5%) by 2013/14 and remained at this level in
2015/16. As in hip prosthesis, there was evidence of non-linearity in the SSI trends
(LRT p=0.0004). No evidence of change in the odds of SSI in the last three years was
found compared to the baseline in 2008/9.
For repair of neck of femur, a downward trend in the crude SSI incidence was observed
from 1.7% in 2008/9 to 1.0% in 2015/16. The incidence in 2015/16 was similar to that
observed in 2014/15. There was no evidence against linearity (LRT p=0.3969) in the
SSI trends with an average decrease of 8% per year identified in the linear model (OR:
0.92; 95% CI: 0.90 – 0.94; p<0.001).
For reduction of long bone fracture, the incidence peaked in 2009/10 at 1.5% with a
subsequent decline until 2014/15 at which point the crude risk increased to 1.4%. The
incidence subsequently decreased to 1.2% in 2015/16. Although there was no evidence

Surveillance of Surgical Site Infections in NHS hospitals in England 2015/16
22
against linearity (p=0.3806), the overall average annual decrease was not significant in
this category (0.97; 95% CI: 0.92 – 1.03; p=0.363).
Figure 5: Trends in the annual cumulative incidence of SSI (%) in orthopaedic surveillance categories, with lower and upper 95% CIs, NHS hospitals in England
4.2 Non-orthopaedic categories
Figures 6-8 show the trends in the crude inpatient, readmission and the combined
inpatient and readmission SSI incidence for the voluntary non-orthopaedic categories.
Surgical categories introduced after July 2008 are presented last.
For most of the 13 voluntary surgical categories, the observed crude SSI incidence
varied substantially between years. The linear and year-effects models were compared
to evaluate trends based on inpatient readmission SSIs from July 2008 to March 2016.
Of 13 categories examined, only two categories showed linear trends: bile duct, liver or
pancreatic and spinal surgery.
Inpatient/Readmission Inpatient Readmission

Surveillance of Surgical Site Infections in NHS hospitals in England 2015/16
23
Bile duct, liver or pancreatic surgery showed evidence of a decreasing trend in the
crude incidence, from 9.6% in 2008/9 to 5.2% in 2015/16, despite small fluctuations in
the intervening period (Figure 6). Modelled data showed there was no evidence against
linearity (although borderline) (LRT p=0.0588) indicating that model fit was improved by
the linear model. The average annual decrease in the odds of SSI was 6% (OR: 0.94;
95% CI: 0.88 – 1.00; p=0.048).
Spinal surgery showed evidence of an increasing trend in the crude incidence albeit
small from 1.4% in 2008/9 to 1.8% in 2015/16 with small fluctuations in the intervening
period (Figure 8). There was no evidence against linearity (LRT p=0.1844) indicating
that model fit was improved by the linear model. The average annual increase in the
odds of SSI was 11% (OR: 1.11; 95% CI: 1.06 – 1.15; p<0.001).
In the remaining 11 surgical categories, there was evidence for non-linearity in the
trends. However, seven of these surgical categories did not show evidence of change in
the trends over time in either model: abdominal hysterectomy, breast surgery, cardiac
(non-CABG), cranial surgery, limb amputation, small bowel surgery and vascular
surgery (Figures 6-8).
The remaining four surgical categories showed evidence of a decrease in some years
compared to the baseline 2008/9. Of these four categories, only gastric and large bowel
surgery (Figure 6) showed a significant decrease in 2015/16 compared to 2008/9. In
gastric surgery a significant decrease in the last four successive years was observed; in
particular, the crude SSI incidence was 3.1% in 2015/16 compared to 8.6% in 2008/9
(OR: 0.66; 95% CI: 0.14 – 0.78; p=0.012). In large bowel surgery, a decrease in the last
three successive years was observed of which 2015/16 exhibited the largest decrease;
the crude SSI incidence was 8.5% in 2015/16 and 11.8% in 2008/9 (OR: 0.69; 95% CI:
0.58 – 0.8; p<0.001).

Surveillance of Surgical Site Infections in NHS hospitals in England 2015/16
24
Figure 6: Trends in the annual cumulative incidence of SSI (%) in gastro-intestinal surveillance categories with lower and upper 95% CIs, NHS hospitals in England
Inpatient/Readmission Inpatient Readmission

Surveillance of Surgical Site Infections in NHS hospitals in England 2015/16
25
Figure 7: Trends in the annual cumulative incidence of SSI (%) in cardiac and vascular surveillance categories with lower and upper 95% CIs, NHS hospitals in England
Figure 8: Trends in the annual cumulative incidence of SSI (%) in other voluntary surveillance categories with lower and upper 95% CIs, NHS hospitals in England
Inpatient/Readmission Inpatient Readmission

Surveillance of Surgical Site Infections in NHS hospitals in England 2015/16
26
Section 5. Characteristics of surgical site
infections
5.1 Type of SSI
Figures 9 and 10 show the distribution of SSI type for inpatient cases in 2015/16
compared to inpatient and re-admission cases combined by surgical category.
Information on SSI type was available for all 1,632 SSIs detected through inpatient or
readmission surveillance in 2015/16 (all surgical categories). SSI type data from seven
surgical categories with ≥45 inpatient and readmission SSIs were analysed (n=1,390).
In 2015/16, the proportion of inpatient-detected SSIs that were superficial incisional
infections varied by surgical category, ranging from 32.8% in spinal surgery to 68.8% in
knee prosthesis. The observed proportions were affected by differences in the length of
post-operative hospital stay between surgical categories.
As readmission-detected SSIs will involve more serious wound complications, inclusion
of these cases tended to increase the proportion of deep SSIs particularly in surgical
categories where the median length of hospital stay was relatively short. For example,
in hip and knee prosthesis surgery, the proportion of inpatient and readmission-detected
cases that were deep increased to 45.7% and 41.1%, respectively, compared with the
proportions based on inpatient-detected cases alone (34.8% and 22.9%, respectively).
A similar pattern was observed for the organ-space SSIs although inclusion of
readmission cases did not alter the proportion that were organ-space for hip prosthesis
(23% for inpatient-detected alone or those including readmission-detected cases).
In most other voluntary categories included in this analysis, the median length of
hospital stay was longer than that for hip or knee prosthesis. However, typically, the
proportion of inpatient and readmission SSIs that were deep or organ-space was
broadly similar to the corresponding proportion for inpatient-detected SSIs.

Surveillance of Surgical Site Infections in NHS hospitals in England 2015/16
27
Figure 9: Distribution of SSI type in inpatient cases compared to combined inpatient and readmission cases, orthopaedic surgery, NHS hospitals in England, 2015/16
Figure 10: Distribution of SSI type in inpatient cases compared to combined cases, non-orthopaedic surgery, NHS hospitals in England, 2015/16
31.8
38.9
37.9
68.8
31.3
42.0
52.0
47.2
41.1
22.9
45.7
34.8
16.2
13.9
21.0
8.3
23.0
23.2
0 20 40 60 80 100
Inpat/Readm (n=198)
Inpatient (n=144)
Inpat/Readm (n=214)
Inpatient (n=48)
Inpat/Readm (n=230)
Inpatient (n=69)
% of total SSI type
Superficial Deep Organ-space
Hip
prosthesis
Knee
prosthesis
Repair of neck
of femur
27.5
32.8
60.5
62.5
55.2
56.9
58.3
59.8
66.9
59.0
27.6
26.6
24.3
24.5
34.5
30.5
5.6
8.2
11.8
10.9
20.5
18.6
7.2
9.8
0 20 40 60 80 100
Inpat/Readm (n=142)
Inpatient (n=61)
Inpat/Readm (n=76)
Inpatient (n=64)
Inpat/Readm (n=391)
Inpatient (n=318)
Inpat/Readm (n=139)
Inpatient (n=82)
% of total SSI type
Coronary artery bypass graft
Large bowel
Spinal
Small bowel

Surveillance of Surgical Site Infections in NHS hospitals in England 2015/16
28
5.2 Causative micro-organisms
Figure 11 shows trends in organisms reported as causing inpatient SSIs from 2004/5 to
2015/16 based on data from all surgical categories except breast, cardiac (non-CABG),
cranial and spinal surgery as these modules were introduced more recently (April 2010).
Only inpatient SSIs were analysed to remove the effect of readmission surveillance
introduced in July 2008. Overall, of 11,547 inpatient SSIs detected over this 12-year
period, 67% (7,751/11,547) had data on microbial aetiology reported as causing SSI.
Staphylococcus aureus accounted for 13% of inpatient cases in 2015/16, with no
change from 2014/15. This follows a decreasing trend since 2006/7 where S. aureus
accounted for 39% of inpatient cases. The decreases in S. aureus has been driven by
decreasing trends in methicillin-resistant S. aureus (MRSA) first appearing in 2006/7
(25% of inpatient cases), reaching 4% by 2015/16. Although this proportion was slightly
higher than that observed in 2014/15 (3%) these proportions were based on a small
number of MRSA cases (n=20 2015/16 and n=15 in 2014/15).
Methicillin-susceptible S. aureus (MSSA) did not exhibit any discernible trends until
small decreases emerged over the last three successive years: 2013/14 (12%), 2014/15
(10%) and 2015/16 (9%). Coagulase-negative staphylococci (CoNS) exhibited marginal
increases. Enterobacteriaceae accounted for 28% of cases in 2015/16, the highest to
date since their increases emerged in 2008/9.
Table 8 shows the distribution of organisms reported to cause inpatient and readmission
SSIs for all SSI types by surgical category based on aggregate three-year data from
April 2013 to March 2016. Categories with organism data on ≥200 SSI cases were
analysed to maximise statistical precision. Repair of neck of femur and spinal surgery
had the highest proportion of SSI cases with microbiology data at 81% each (503/619
and 280/345, respectively). Large bowel surgery had the lowest proportion of SSI cases
with microbiology data at 52% (549/1,066). Polymicrobial SSIs (cases with more than
one organism reported as causing SSI) were most frequent in CABG surgery at 39%
(157/405) of cases and lowest in knee prosthesis surgery at 22% (101/450).
Among monomicrobial SSIs (one organism reported as causing SSI), those reported as
having MRSA aetiology was highest in repair of neck of femur, accounting for 13%
(44/330). This may reflect the emergency nature of hip fracture admissions, which may
prevent pre-admission screening and eradication of MRSA. The lowest MRSA
proportion was in spinal surgery at 1% (3/205). S. aureus aetiology was highest in repair
of neck of femur accounting for 44% (146/330) of monomicrobial SSIs followed by knee
prosthesis at 42% (147/349). SSIs reported as having Enterobacteriaceae aetiology
were highest in large bowel surgery at 53% (187/350) followed by CABG surgery at
24% (272/248). Organisms reported as ‘coliforms’ accounted for 23% (111/482) of all
monomicrobial Enterobacteriaceae SSIs for the studied categories in 2015/16 hence an

Surveillance of Surgical Site Infections in NHS hospitals in England 2015/16
29
analysis of the leading species could not be undertaken. CoNS were highest in CABG
surgery at 29% (64/248). Mycobacteria were not reported as causing SSIs in any of the
17 surgical categories under survey in this period (April 2013 to March 2016).
Among polymicrobial infections, Gram-positive and Gram-negative combinations were
the most frequent type in all surgical categories examined (range: 41% - 50%).
Table 9 shows the distribution of organisms causing deep/organ-space SSIs detected
during inpatient stay or on readmission for the same selected categories and time
period (April 2013 to March 2016). The distribution of monomicrobial organisms was
broadly similar to that for all SSI types with two exceptions. In CABG surgery, the
proportion of deep/organ-space SSIs reported to be caused by MSSA was elevated at
30% (33/111) compared to 22% based on all SSI types. In large bowel surgery, the
proportion due to Enterobacteriaceae was elevated at 61% (62/101) compared to 53%
for all SSI types. In the polymicrobial subset, the distribution of organisms was broadly
similar to the corresponding data for all SSI types except that the proportion of purely
Gram-positive combinations was elevated in all categories except in large bowel
surgery which remained comparable. The burden of certain organisms identified in this
subset of serious infections warrants closer vigilance.
Figure 12 shows the distribution of organisms (counts) by SSI anatomical site collected
only for organ-space SSIs. Data for selected surgical categories are presented. This
analysis was expanded to five years from April 2011 to March 2016 to maximise
statistical precision for this very small subset of infections. Reporting of SSI site was
100% in CABG, hip prosthesis and spinal surgery and 99.6% in knee prosthesis.
Organism data were available for 78%, 87%, 84% and 85% of infections with SSI site
data in these categories, respectively. The final samples available for analysis for these
categories were n=66, n=261, n=32 and n=206, respectively, although small in some.
Joint bursa was the most frequent organ-space SSI in hip and knee prosthesis, (n=246
and n=203, respectively). Among joint bursa SSIs with monomicrobial aetiology,
staphylococci followed by Enterobacteriaceae were the most common causes although
for hip prosthesis, Enterobacteriaceae were relatively more frequent compared to those
in knee prosthesis. Osteomyelitis was an infrequent organ-site SSI in these orthopaedic
categories but predominantly caused by staphylococci (S. aureus and CoNs combined).
In CABG surgery, mediastinum was the most frequent organ-space SSI overall (n=39).
Among mediastinum SSIs with monomicrobial aetiology, staphylococci were the
predominant causes followed by Enterobacteriaceae. Among endocardial SSIs with
monomicrobial aetiology, the predominant causes were staphylococci, particularly
CoNS. Spinal abscess (without meningitis) was the most frequent organ-space SSI
(n=16) in spinal surgery. Among spinal abscess SSIs with monomicrobial aetiology,
staphylococci followed by Enterobacteriaceae were the predominant causes.

Surveillance of Surgical Site Infections in NHS hospitals in England 2015/16
30
Figure 11: Trends in micro-organisms reported as causing inpatient SSIs, proportions with lower and upper 95% CIs, all surgical categories*, NHS hospitals, England
*excludes breast, cardiac (non-CABG), cranial, and spinal surgery
*excludes breast, cardiac (non-CABG), cranial and spinal surgery
0
5
10
15
20
25
30
35
40
45
50
% o
f in
pati
en
t S
SI c
as
es
Enterobacteriaceae
S. aureus
MRSA
MSSA
CoNS
Enterococcus
Pseudomonas spp.
spp.

Surveillance of Surgical Site Infections in NHS hospitals in England 2015/16
31
Table 8: Distribution of micro-organisms reported as causing SSI (inpatient/readmission), all SSI types, by surgical category, NHS hospitals, England, April 2013 to March 2016
*a combination that include 'anaerobic bacilli' 'anaerobic cocci' ,‘other bacteria’ or fungi
Reported causative organism No. % No. % No. % No. % No. % No. %
Monomicrobial Methicillin-sensitive S. aureus 121 29.7% 133 38.1% 102 30.9% 54 21.8% 19 5.4% 78 38.0%
Methicillin-resistant S. aureus 20 4.9% 14 4.0% 44 13.3% 11 4.4% 10 2.9% 3 1.5%
Coagulase-negative staphylococci 100 24.6% 99 28.4% 55 16.7% 73 29.4% 6 1.7% 55 26.8%
Enterobacteriaceae 79 19.4% 39 11.2% 75 22.7% 64 25.8% 187 53.4% 38 18.5%
Pseudomonas spp. 15 3.7% 8 2.3% 12 3.6% 22 8.9% 32 9.1% 11 5.4%
Streptococcus spp. 23 5.7% 24 6.9% 8 2.4% 3 1.2% 18 5.1% 4 2.0%
Enterococcus spp. 29 7.1% 12 3.4% 19 5.8% 5 2.0% 17 4.9% 4 2.0%
Other bacteria 19 4.7% 19 5.4% 10 3.0% 15 6.0% 47 13.4% 12 5.9%
Fungi including Candida spp. 1 0.2% 1 0.3% 5 1.5% 1 0.4% 14 4.0% 0 0.0%
Total monomicrobial 407 100% 349 100% 330 100% 248 100% 350 100% 205 100%
Polymicrobial Gram-positive combinations only 70 40.5% 37 36.6% 39 22.5% 32 20.4% 6 3.0% 37 49.3%
Gram-negative combinations only 26 15.0% 12 11.9% 31 17.9% 36 22.9% 38 19.1% 9 12.0%
Gram-positive and Gram-negative combinations 71 41.0% 46 45.5% 87 50.3% 73 46.5% 108 54.3% 26 34.7%
Other combinations* 6 3.5% 6 5.9% 16 9.2% 16 10.2% 47 23.6% 3 4.0%
Total polymicrobial 173 100% 101 100% 173 100% 157 100% 199 100% 75 100%
Total cases with microbiology data (% of total SSI cases) 580 79.3% 450 68.3% 503 81.3% 405 65.1% 549 51.5% 280 81.2%
151 20.7% 209 31.7% 116 18.7% 217 34.9% 517 48.5% 65 65.0%
731 100% 659 100% 619 100% 622 100% 1,066 100% 345 146%Total cases
SpinalHip Prosthesis Knee Prosthesis CABG Large bowelRepair of neck of femur
Total cases with unknown microbial aetiology (% of total SSI cases)

Surveillance of Surgical Site Infections in NHS hospitals in England 2015/16
32
Table 9: Distribution of micro-organisms reported as causing deep/organ-space SSI (inpatient/readmission), by surgical category, NHS hospitals, England, April 2013 to March 2016
*a combination that include 'anaerobic bacilli' 'anaerobic cocci' ,‘other bacteria’ or fungi
Reported causative organism No. % No. % No. % No. % No. % No. %
Monomicrobial Methicillin-sensitive S. aureus 93 30.1% 103 38.4% 59 27.8% 33 29.7% 3 3.0% 49 34.0%
Methicillin-resistant S. aureus 15 4.9% 10 3.7% 25 11.8% 3 2.7% 2 2.0% 3 2.1%
Coagulase-negative staphylococci 79 25.6% 74 27.6% 39 18.4% 29 26.1% 3 3.0% 38 26.4%
Enterobacteriaceae 61 19.7% 29 10.8% 52 24.5% 30 27.0% 62 61.4% 31 21.5%
Pseudomonas spp. 8 2.6% 6 2.2% 6 2.8% 8 7.2% 4 4.0% 8 5.6%
Streptococcus spp. 20 6.5% 20 7.5% 6 2.8% 1 0.9% 5 5.0% 3 2.1%
Enterococcus spp. 19 6.1% 9 3.4% 15 7.1% 2 1.8% 4 4.0% 4 2.8%
Other bacteria 13 4.2% 16 6.0% 8 3.8% 5 4.5% 15 14.9% 8 5.6%
Fungi including Candida spp. 1 0.3% 1 0.4% 2 0.9% 0 0.0% 3 3.0% 0 0.0%
Total monomicrobial 309 100% 268 100% 212 100% 111 100% 101 100% 144 100%
Polymicrobial Gram-positive combinations only 58 42.3% 32 41.6% 32 23.9% 21 21.6% 2 2.2% 29 55.8%
Gram-negative combinations only 18 13.1% 7 9.1% 25 18.7% 26 26.8% 16 17.2% 6 11.5%
Gram-positive and Gram-negative combinations 56 40.9% 34 44.2% 68 50.7% 36 37.1% 48 51.6% 14 26.9%
Other combinations* 5 3.6% 4 5.2% 9 6.7% 14 14.4% 27 29.0% 3 5.8%
Total polymicrobial 137 100% 77 100% 134 100% 97 100% 93 100% 52 100%
Total cases with microbiology data (% of total SSI cases) 446 87.3% 345 85.4% 346 89.4% 208 80.6% 194 43.5% 196 87.5%
65 12.7% 59 14.6% 41 10.6% 50 19.4% 252 56.5% 28 12.5%
511 100% 404 100% 387 100% 258 100% 446 100% 224 100%
Large bowel Spinal
Total cases with unknown microbial aetiology (% of total SSI cases)
Total cases
Hip Prosthesis Knee Prosthesis Repair of neck of femur CABG

Surveillance of Surgical Site Infections in NHS hospitals in England 2015/16
33
Figure 12: Distribution of organisms by site of organ-space SSIs (inpatient/readmission), NHS hospitals, England,
April 2011 to March 2016
0
5
10
15
20
MS
SA
MR
SA
Co
NS
Ente
robacte
riaceae
Pse
udo
mon
as s
pp.
Str
epto
co
ccus s
pp
.
Ente
roco
ccus s
pp.
Oth
er
bacte
ria
Fun
gi in
clu
din
g C
and
ida s
pp.
Gra
m+
ive
co
mbin
atio
ns
Gra
m-i
ve
co
mb
ina
tio
ns
Gra
m+
ive
and
Gra
m-ive
Oth
er
co
mbin
atio
ns*
Coronary artery bypass graftArterial/venous
Bone (osteomyelitis)
Endocardium
Mediastinum
Pericardiuam/Myocardium
0
10
20
30
40
50
60
MS
SA
MR
SA
Co
NS
Ente
robacte
riaceae
Pse
udo
mon
as s
pp.
Str
epto
co
ccus s
pp
.
Ente
roco
ccus s
pp.
Oth
er
bacte
ria
Fun
gi in
clu
din
g C
and
ida s
pp.
Gra
m+
ive
co
mbin
atio
ns
Gra
m-i
ve
co
mb
ina
tio
ns
Gra
m+
ive
and
Gra
m-ive
Oth
er
co
mbin
atio
ns*
No
of
org
an
-sp
ace S
SIs
(in
pati
en
t/re
ad
mis
sio
n
Hip prosthesis Bone (osteomyelitis)
Joint/bursa
0
10
20
30
40
50
60
MS
SA
MR
SA
Co
NS
Ente
robacte
riaceae
Pse
udo
mon
as s
pp.
Str
epto
co
ccus s
pp
.
Ente
roco
ccus s
pp.
Oth
er
bacte
ria
Fun
gi in
clu
din
g C
and
ida s
pp.
Gra
m+
ive
co
mbin
atio
ns
Gra
m-i
ve
co
mb
ina
tio
ns
Gra
m+
ive
and
Gra
m-ive
Oth
er
co
mbin
atio
ns*
Knee prosthesis Bone (osteomyelitis)
Joint/bursa
0
5
10
15
20
MS
SA
MR
SA
Co
NS
Ente
robacte
riaceae
Pse
udo
mon
as s
pp.
Str
epto
co
ccus s
pp
.
Ente
roco
ccus s
pp.
Oth
er
bacte
ria
Fun
gi in
clu
din
g C
and
ida s
pp.
Gra
m+
ive
co
mbin
atio
ns
Gra
m-i
ve
co
mb
ina
tio
ns
Gra
m+
ive
and
Gra
m-ive
Oth
er
co
mbin
atio
ns*
No
of
org
an
-sap
ce S
SIs
(in
pati
en
t/re
ad
mis
sio
n) Spinal surgery Bone (osteomyelitis)
Joint/bursa
Meningitis
Spinal abscess (without meningitis)
Vertebral disc space
PolymicrobialMonomicrobialPolymicrobialMonomicrobial

Surveillance of Surgical Site Infections in NHS hospitals in England 2015/16
34
Figure 13 shows the distribution of organisms in primary total hip prosthesis infections (inpatient and readmission) by fixation type. The analysis was based on infections of monomicrobial aetiology. The data were expanded to five years from April 2011 to March 2016 to maximise statistical precision given that this is a small subset of infections. Procedures under the ‘Other’ group (OPCS codes W39, W54 and W58) were excluded as these do not distinguish between fixation types. The analysis showed that of three fixation groups, the uncemented group had the highest proportion of infections due to S. aureus at 46% (89/192) compared to 37% (92/251) for the cemented group
and 31% (17/55) for the hybrid group. The cemented group had the highest proportion due to Enterobacteriaceae (20%) compared to the other two fixation groups.
Figure 13: Distribution of SSI organisms (inpatient/readmission) in primary total hip prosthesis by fixation group, NHS hospitals, England, April 2011 to March 2016
33.5
3.2
26.7
20.3
5.2
5.6
3.2
2.4
0.0
40.1
6.3
21.4
15.1
1.6
4.7
5.7
5.2
0.0
29.1
1.8
27.3
16.4
3.6
9.1
10.9
0.0
1.8
0
5
10
15
20
25
30
35
40
45
% o
f in
pa
tie
nt/
rea
dm
iso
n S
SIs
Cemented (n=251)
Uncemented (n=192)
Hybrid (n=55)

Surveillance of Surgical Site Infections in NHS hospitals in England 2015/16
35
Section 6. Variation in SSI incidence
between NHS hospitals
6.1 Box and whisker plots
Figure 14 is a box and whisker plot showing the distribution of individual hospital SSI
estimates (%) against five percentiles (10th, 25th, 50th, 75th and 90th) by surgical
category. Each percentile represents a value below which a proportion of the total
observations lie. The box plots show inter-hospital variation within each surgical
category as well as inter-category variation. SSI estimates that lie at extreme ends
(above the 90th percentile or below the 10th percentile) may be indicative of a problem
(either excess infections or failure to detect SSIs, respectively).
Figure 14: Distribution of the cumulative SSI incidence (%) at hospital level* by surgical category, NHS hospitals in England, April 2011 to March 2016
* hospitals with <95 operations in hip, knee or abdominal hysterectomy surgery are excluded; in the remaining categories, hospitals with <45
operations are excluded. For categories with <10 hospital participants, the distribution without a box plot is presented only.
hospital

Surveillance of Surgical Site Infections in NHS hospitals in England 2015/16
36
6.2 Funnel plots
In 2015/16, data on 97,174 orthopaedic procedures and 657 inpatient/readmission SSIs
was submitted by 184 NHS hospitals representing 138 NHS trusts. An additional seven
independent sector NHS treatment centres contributed data on 6,664 orthopaedic
procedures and 13 SSIs. Two NHS trusts performing orthopaedic surgery did not
contribute orthopaedic data in 2015/6.
Figure 15 shows funnel plots displaying variation in the trust SSI incidence in 2015/16
by orthopaedic category. The cumulative incidence of SSI per 100 operations is plotted
against the number of procedures for each participating NHS site. The upper and lower
95% control limits (dashed black lines) define the ‘limits’ of expected variation. Trusts
lying outside these limits are considered to be outliers. Outlier status should be used as
a trigger for further investigation as the results are indicative not confirmatory. The
margin of error associated with 95% control limits is 5%. The 99% control limits (solid
red lines) are also presented for information. The funnel plots do not adjust for case-mix
so the results should be interpreted with caution.
The funnel plots identified 18 providers that were statistical outliers in 2015/16 with SSI
estimates falling beyond the 95% CLs. Of these, nine NHS trusts were high outliers and
nine (eight NHS trusts and one NHS treatment centre) were identified as low outliers.
Overall, four of 18 outliers were outliers in more than one orthopaedic surgical category.
Seven of these NHS trusts and one NHS treatment centre were also outliers in the
previous year.
Although a low outlier may reflect a high standard of infection control practice and
surgical skill, other factors should be considered to eliminate methodological bias. For
example failure to implement a systematic readmission alert system may miss SSI
cases. All high and low outlier trusts have been contacted to make them aware of their
outlier status and encouraged to review their practices including their surveillance
methodology.
The inpatient/readmission SSI incidence for individual NHS trusts (and participating
NHS treatment centres), are published separately as part of this report:
https://www.gov.uk/government/publications/surgical-site-infections-ssi-surveillance-nhs-
hospitals-in-england

Surveillance of Surgical Site Infections in NHS hospitals in England 2015/16
37
Figure 15: Cumulative incidence of inpatient/readmission SSI plotted against the number of operations by NHS trust and mandatory orthopaedic surgical category, England, 2015/16

Surveillance of Surgical Site Infections in NHS hospitals in England 2015/16
38
Section 7. Hospital perspectives
In September 2016, PHE emailed all participating hospitals offering them an opportunity
to submit a short piece describing their experience of SSI surveillance including how
they used surveillance to change practice. This chapter presents a selection of
examples contributed by hospitals where they describe their own experiences with SSI
surveillance and initiatives undertaken to prevent or reduce the SSI incidence at local
level.
Royal Devon & Exeter NHS Foundation Trust
PHE commentary
The trust has described using a
range of surveillance activities to
change clinical practice and
improve its SSI incidence
particularly for spinal surgery.
These include continuous
surveillance and timely feedback of
data. Ongoing review of local
trends has been found to be
particularly useful as is a multi-
disciplinary approach to developing
prevention strategies.
At the RD&E hospital we have committed to continuous voluntary surveillance in the hip, knee and spinal categories for the last 8 years. The short bursts of surveillance that we perform, such as breast surgery, have been useful drivers for effecting change. We have been able to demonstrate the impact of these short bursts of surveillance in driving infection rates down. As a trust, however, we find that the true value of surveillance lies in doing it continuously.
Continuous voluntary surveillance provides real time information on incidence, hotspots and trends of infection over periods of time which can be used to reduce, prevent and manage infection before, during and after the operation. Whilst benchmarks are a valuable resource for comparison, the real value for us is being able to compare ourselves against ourselves. This is coupled with continuous review and feedback. Recent experience of a sudden rise in the spinal SSI rate allowed us to implement various SSI care bundle improvement strategies, based on multi-disciplinary action planning. This was supplemented with additional in-depth PHE data analysis. Ongoing surveillance and timely feedback has led to us being able to submit our first quarter of surveillance data with no spinal SSI in 2 years. Melanie Thornton, infection surveillance specialist nurse

Surveillance of Surgical Site Infections in NHS hospitals in England 2015/16
39
PHE commentary This trust targeted readmission SSIs as an area for quality improvement. The trust then developed a novel, low-cost technique to reduce the incidence of readmission SSI cases using a photo at discharge scheme. The benefits reported include a decrease in the incidence of readmission SSIs and a strengthened multi-disciplinary team, working across the acute and community sectors.
Our hospital used Public Health England (PHE) analysis to determine that the average date of onset is day 10 for superficial SSI (interquartile range: 7-15 days), and day 14 for deep incisional SSI (interquartile range: 9-26 days) for our coronary artery bypass graft (CABG) patient group. These patients are typically discharged between day 5-7, suggesting many wound concerns arise post-discharge.
provides patients and their families with important infection prevention advice, and a photo of their wound to monitor their wound healing. Patient feedback on the initiative suggests patients find the photo reassuring and useful. This approach also improves the link between acute and community care, as district nurses or GPs can use PaD to assess whether the wound is improving or deteriorating. PaD is associated with a fourfold reduction in readmissions for SSI and associated savings between £5-15K per readmission for incisional SSI prevented [11]. Staff engagement has been crucial in the success of the program; the Harefield Hospital nursing staff and discharge team ensure >95% of cardiac surgical patients receive PaD at discharge. Melissa Rochon, clinical nurse specialist in surveillance
In 2014, the surveillance team implemented a quality improvement approach to reduce the risk of readmission for SSI. The Photo at Discharge (PaD) scheme
Royal Brompton & Harefield NHS Foundation
Trust

Surveillance of Surgical Site Infections in NHS hospitals in England 2015/16
40
Section 8. Conclusions
8.1 Summary of findings in 2015/16
Overall, a total of 198 NHS hospitals representing 142 NHS trusts and an additional
seven NHS treatment centres participated in SSI surveillance in 2015/16 (all surgical
categories). There was a 1% and 19% increase in the number of procedures submitted
for orthopaedic and non-orthopaedic categories, respectively, compared to 2014/15.
The increased focus on non-orthopaedic surgery is an encouraging development and in
line with new NICE quality standards for HCAI surveillance, emphasising the importance
of assessing and tackling infections in non-mandatory categories [12].
Data quality was high for most of the key data items in 2015/16 although further
improvements in the completion of ASA score and BMI data would enhance the
interpretative value of the data. In 2015/16, BMI data completion of 50% or more of
submitted records was observed in nine surgical categories. The proportion of patients
that were obese was high in a number of surgical categories surveyed. If obesity levels
in the population continue to rise this will increase the propensity for diseases such as
osteoarthritis or coronary heart disease, increasing the need for surgery. This will
increasingly contribute to the total burden of SSI given the impact of elevated BMI on
risk of patients developing an SSI [13;14].
Trends in the SSI incidence showed a variable picture between surgical categories. The
incidence of SSI following hip and knee prosthesis remained low in 2015/16 (<1%) and
comparable with other European estimates [15]. Despite the low incidence observed in
England, it was encouraging to see decreasing trends in hip prosthesis in the last three
successive years. It remains to be seen whether this trend will continue or remain at this
level. The decreasing trend in SSI rates following repair of neck of femur continued in
2015/16 whereas no discernible trends in SSI could be determined for patients
undergoing reduction of long bone fracture. Among the voluntary-based surgical
categories, spanning gastrointestinal, cardiac, vascular, obstetrics and gynaecology,
neurology and other general surgery procedures, inter-year variations in the SSI
incidence were observed. Of these categories, an increasing trend was identified for
spinal surgery and a decreasing trend for bile duct, liver or pancreatic surgery. In gastric
and large bowel surgery decreasing trends were identified only over the most recent
successive years. It remains to be seen whether these trends will continue. Further
investigations are needed to explain the trends seen in these categories.

Surveillance of Surgical Site Infections in NHS hospitals in England 2015/16
41
8.2 Variation in the SSI rate between participating hospitals
Analysis of data continues to show inter-hospital variation in the SSI incidence for some
surgical categories. This suggests that more can be done to reduce this variation by
implementing a range of interventions described by some hospitals earlier in this report.
Variation in the SSI incidence between hospitals or within hospitals provides a trigger
for investigating possible causes and identifying ways of reducing infection rates. PHE
undertakes quarterly outlier detection to ensure hospitals are aware of their elevated
infection rates and works in partnership with high outlier hospitals to assist them with
further investigations. Hospitals identified as low outliers are also alerted so that they
can investigate their case ascertainment methods. The use of reports available from the
web-based application allows hospitals to risk-stratify elevated SSI rates to determine
whether differences in case-mix or operation-related factors can explain some of the
variation. Auditing clinical practice against NICE’s quality standards for SSI, comprising
a simple evidence-based checklist of pre, peri-operative and post-operative
interventions, provides an opportunity for hospitals to optimise clinical practices as a
means of reducing or preventing SSIs [16]. The quality standards, based on the NICE
SSI prevention guidelines, cover glucose control, normothermia, skin asepsis and
surgical antibiotic prophylaxis (choice, timing of agent, frequency and dose) [8]. The
guidelines on surgical antimicrobial prophylaxis are an additional resource with similar
recommendations based on a review of the evidence [9]. New WHO guidelines on the
prevention of SSI are also available providing a global standardised approach to pre,
peri and post-operative measures whilst addressing previous gaps in knowledge
[16;17]. The experience shared by the hospitals in Chapter 7 provides an opportunity for
other hospitals to learn what interventions have worked for others in preventing SSIs.
8.3 Optional post-discharge surveillance
In addition to readmission surveillance, which all hospitals are required to undertake,
optional post-discharge surveillance methods using patient post-discharge
questionnaires (PDQ) or surveillance in outpatient settings can provide hospitals with
valuable additional post-discharge data on SSIs for internal comparison of hospital
trends, providing consistent response rates are achieved by hospitals over time. Post-
discharge surveillance is particularly important for surgical categories with a short length
of hospital stay.
The proportion of procedures followed up using optional post-discharge surveillance
methods has been increasing steadily over the last few years, although there remains
some variation in completion rates between hospitals. Such variation has a significant
effect on the overall SSI incidence [18], precluding its use for national benchmarking.

Surveillance of Surgical Site Infections in NHS hospitals in England 2015/16
42
8.4 Microbial aetiology
A markedly decreasing trend in S. aureus as a reported cause of SSI has been
occurring since 2006/7. These trends have continued into 2015/16 although the
proportion of SSIs caused by S. aureus in 2015 was 13%, similar to that observed in
2014/15. The decreasing trend in S. aureus SSIs is likely to be explained by the marked
reductions in MRSA SSIs, also occurring since 2006/7. In 2015/16, MRSA accounted
for 4% of SSIs and, although slightly higher than that observed in 2014/15 (3%), this
effect may have been due to random error resulting from decreasing sample sizes over
time for this pathogen although it remains to be seen whether this trend will persist. The
reduction in MRSA is likely to reflect the impact of infection control initiatives directed at
controlling MRSA of which pre-admission screening and decolonisation of carriers
represents an important component [19].
MSSA decreased over the last three successive years reaching 9% of cases in
2015/16. It remains to be seen whether the trend will also persist. Nevertheless, dual
reductions in the methicillin resistant and susceptible forms of S. aureus are
encouraging as these contribute to reductions in overall S. aureus. Enterobacteriaceae
as reported causes of SSIs had been increasing since 2008/9, accounting for 28% of
SSIs by 2015/16, the highest to date.
The trends in MRSA and Enterobacteriaceae SSIs have been modelled and found to be
significant, with the increase in Enterobacteriaceae raising particular concern in the
context of increased antibiotic resistance in these pathogens [20]. Initiatives to reduce
Gram-negative infections are now a major focus of national activity [21].
At surgical-category level, data for 2015/16 showed that among monomicrobial
infections, S. aureus was the predominant organism in orthopaedic surgery and spinal
surgery, accounting for between 35% and 44% of SSI cases. Coagulase–negative
staphylococci were the predominant organisms in CABG surgery and these may reflect
the use of implants. Enterobacteriaceae were the predominant organisms in large bowel
surgery, reflecting the expected organisms at the operative site.
Among polymicrobial infections, Gram-positive and Gram-negative combinations were
the most frequent type of infections in all surgical categories examined. Although this
combination affected a small set of patients, this may have implications for choice of
surgical antimicrobial prophylaxis at local level.
The organism distribution by SSI site collected only for organ-space SSIs identified
staphylococci and Enterobacteriaceae as generally the most frequent pathogens.
However, data quality needs further improvement in terms of collection of organism data
in all specialities examined to enhance interpretive value in this subset of infections.

Surveillance of Surgical Site Infections in NHS hospitals in England 2015/16
43
The organism distribution among primary total hip prosthesis infections by fixation group
is a novel analysis and provides further useful insights. The burden of S. aureus was
found to be highest in the uncemented group compared to the cemented and hybrid
fixation groups. The cemented group had the highest proportion due to
Enterobacteriaceae compared to the other two fixation groups.
Due to recent concern over severe Mycobacterium chimaera infections associated with
heater-cooler units in cardiothoracic surgery [22-24], guidance has been published by
PHE to assist hospitals undertaking cardiac surgery in managing this risk [24]. Hospitals
are also asked to report possible M. chimaera infections or other members of the
Mycobacteria avium complex (MAC) isolated from clinically significant specimens in
patients with a history of cardiopulmonary bypass surgery or extracorporeal membrane
oxygenation to their local PHE Health Protection Teams [25]. M. chimaera is a slow
growing atypical mycobacterium and most infections associated with heater coolers
have arisen more than one year after surgery, beyond the follow-up period within the
SSISS programme [24]. However, monitoring SSI levels in cardiac patients, especially
those undergoing valve repair or replacement, will provide a means to assess risk in
these patients from a range of pathogens that could be acquired during surgery. 8.5 Future directions
The SSI web-based application is currently undergoing development to enhance the
user experience of data by improving navigation and streamlining the in-built quality
assurance process. The new web-application will be launched during 2017 with
upgraded functionality and response speed.
PDQs are the most commonly used of the optional post-discharge methods and offer a
comprehensive way of collecting data. However, before PDQ data can be included in a
benchmark an effective means to improve uptake by hospitals and completion by
patients is needed. To support continuous improvement in SSI surveillance, including
reducing the hospital resources needed to run the surveillance, PHE are in the process
of developing an electronic PDQ system as an extension to the existing SSISS system.
This should enhance the ease of data collection, both for patients and healthcare
workers, as well as improving the quality and timeliness of data collection by boosting
PDQ return rates. In turn, these more consistent data could be used to derive a national
benchmark.
Surveillance of Surgical Site Infections in NHS hospitals in England 2015/16
44
Section 9. Glossary
ASA score
Patient’s pre-operative physical status scored by the anaesthetist according to the
American Society of Anesthesiologitsts’ classification of physical status. There are five
ASA scores from A1 denoting normally healthy patient to A5 denoting moribund patient
with little chance of survival.
Wound Class
This describes the degree of wound contamination at the time of the operation, based
on an intenational standard classification system. The classification ranges from W1
denoting a clean uninfected wound outside the respiratory, alimentary, genital or urinary
tract to W4 denoting dirty or infected wounds and include operations in which acute
inflammation with pus is encountered or in which perforated viscera are found.
Cumulative incidence
The total number of SSIs as a proportion of the total number of patients undergoing a
procedure in the same category of surgery per 100 procedures (%).
Incidence density
The total number of SSIs (identified through inpatient surveillance) divided by the total
number of days of inpatient follow-up expressed as the number of SSIs per 1,000 days
of patient follow-up.
Confidence interval and control limits
The 95% confidence interval (exact binomial for proportions and exact Poisson for the
incidence density) provides a guide to the precision of the estimate based on the
number of procedures (or days of follow-up) surveyed from participating hospitals. The
calculation does not take into account patient clustering within hospitals. Given the level
of confidence, the interval indicates that the ‘true’ incidence’ could lie anywhere
between the lower and higher confidence limits. Control limits (CL) used in funnel plots
are equivalent to exact binomial confidence limits at 95% (warning) and 99% (action).
These define the limits of expected variation. The probability of a cumulative incidence
lying above the 95% CL by chance alone is less than 5% (there is a 1 in 20 chance that
the observed estimate is due to chance alone in a defined period); if above the 99%
CLs, this is less than 1%. The 99% control limits also define the limits of expected
variation and are computed based on the same ‘sample size; the confidence range is
wider but this is offset with a lower margin of error (1%). The 99% control limits are
presented for information since the conventional level of significance is 5%.

Surveillance of Surgical Site Infections in NHS hospitals in England 2015/16
45
P-value
This measures the probability of an estimate (e.g. a risk) being as or more extreme than
that observed in a study population occurring by chance alone if the null hypothesis is
true (the assumption that there is no difference between different groups). The
significance level for the P-value is conventionally set at ≤0.05. This means that we are
prepared to accept no more than a 5% chance of being wrong in claiming that our
observed result is true. If the p-value around an estimate is >0.05, this indicates that the
data do not provide sufficient evidence to reject the null hypothesis.
Odds ratio
This is the odds or likelihood of an event, for example, an infection in an ‘exposed’
group of subjects compared to another group (‘non-exposed’). An odds ratio (OR) of 1
indicates that there is no difference in the odds of developing an SSI between the two
groups. An odds ratio of >1 indicates that the odds or likelihood of developing an SSI is
greater in the ‘exposed’ group compared to the ‘non-exposed’. An OR of <1 indicates
that the odds or likelihood of developing an SSI is higher in the ‘non-exposed’ group.

Surveillance of Surgical Site Infections in NHS hospitals in England 2015/16
46
Section 10. References
[1] Chief Medical Officer. Surveillance of Healthcare Associated Infections PL CMO 2003(4).
Department of Health. 2003. Available at
http://webarchive.nationalarchives.gov.uk/20130107105354/http://www.dh.gov.uk/en/Publicationsa
ndstatistics/Lettersandcirculars/Professionalletters/Chiefmedicalofficerletters/DH_4003782
[2] Competition and Markets Authority(2016). CMA publishes final report on private healthcare
remittal. Available at:
https://www.gov.uk/government/news/cma-publishes-final-report-on-private-healthcare-remittal
[3] Public Health England. Protocol for the surveillance of surgical site infection. Version 6 June 2013.
Public Health England. 2013. Available at
https://www.gov.uk/government/uploads/system/uploads/attachment_data/file/364412/Protocol_for
_surveillance_of_surgical_site_infection_June_2013.pdf
[4] Horan TC, Gaynes RP, Martone WJ et al. CDC definitions of nosocomial surgical site infections,
1992: a modification of CDC definitions of surgical wound infections. Am J Infect Control 1992;
20:271-274.
[5] Culver DH, Horan TC, Gaynes RP et al. Surgical wound infection rates by wound class, operative
procedure, and patient risk index. National Nosocomial Infections Surveillance System. Am J Med
1991; 91:152S-157S.
[6] European Centre for Diseased Prevention and Control. Surveillance of surgical site infections in
European hospitals - HAISSI Protocol. Version 1.02. Stockholm: ECDC; 2012.
[7] Meijerink H, Lamagni T, Eriksen HM et al. Is valid to compare surgical site infections rates between
countries? Insights from a study of English and Norwegian surveillance systems Infect Control
Hosp Epidemiol 2016; doi 10.1017/ice.2016.253
[8] National Collaborating Centre for Women's and Children's Health. Surgical site infection -
prevention and treatment of surgical site infection. Clinical Guideline. NICE. 2008. Available at
http://www.nice.org.uk/nicemedia/pdf/CG74FullGuideline.pdf
[9] Scottish Intercollegiate Guidelines Network. Antibiotic prophylaxis in surgery: A National Clinical
Guideline. Scottish Intercollegiate Guidelines Network. 2008. Available at
http://www.sign.ac.uk/pdf/sign104.pdf
[10] National Joint Registry. OPCS codes relevant to proecdures recorded in the NJR Version 3.
December 2013. Available at:
http://www.njrcentre.org.uk/
[11] Rochon M, Makhecha S, Morais C et al. Quality Improvement approach to reducing readmission
for surgical site infection. Wounds UK 2016; 12(2): 26-31
[12] National Institute for Health and Care Excellence. Healthcare-associated infections Quality
Standard, QS113. 2016. London, National Institute for Health and Care Excellence. Available at:
https://www.nice.org.uk/guidance/QS113/chapter/Quality-statement-1-Surveillance
[13] Thelwall S, Harrington P, Sheridan E et al. Impact of obesity on the risk of wound infection
following surgery: results from a nationwide prospective multicentre cohort study in England. Clin
Microbiol Infect 2015 21(11):1008.e1-1008.e8.

Surveillance of Surgical Site Infections in NHS hospitals in England 2015/16
47
[14] Lamagni, T, Elgohari, S, Harrington P. Trends in surgical site infections following orthopaedic
surgery in England. Curr Opin Infect Dis 2015 28(2):125-32.
[15] European Centre for Disease Prevention and Control. Surveillance of surgical site infections in
Europe, 2010-2011. European Centre for Disease Prevention and Control 2013. Available at:
http://ecdc.europa.eu/en/publications/Publications/SSI-in-europe-2010-2011.pdf
[16] National Institute for Health and Care Excellence. Surgical Site Infection Quality Standards, QS49.
2013. London, National Institute for Health and Care Excellence. Available at:
https://www.nice.org.uk/guidance/qs49
[16] Allegranzi B, Bischoff P, de Jonge S et al. New WHO recommendations on preoperative measures
for surgical site infection prevention: an evidence-based global perspective. Lancet Infec Dis 2016;
published online Nov 2
http://www.thelancet.com/pdfs/journals/laninf/PIIS1473-3099(16)30398-X.pdf
[17] Allegranzi B, Zayed B, Bischoff P et al. New WHO recommendations onintraoperative and
ostoperative measures for surgical site infection prevention: an evidence-based global perspective.
Lancet Infec Dis 2016; published online Nov 2
http://www.thelancet.com/pdfs/journals/laninf/PIIS1473-3099(16)30402-9.pdf
[18] Wilson J, Wloch C, Saei A et al. Inter-hospital comparison of rates of surgical site infection
following caesarean section delivery: evaluation of a multicentre surveillance study. J Hosp Infect
2013; 84:44-51
[19] Department of Health. Screening for Meticillin-resistant Staphylococcus aureus (MRSA)
colonisation - a strategy for NHS trusts: a summary of best practice. 2006. London: Department of
Health.
[20] Elgohari S, Wilson J, Saei A, et al. Impact of national policies on the microbial aetiology of surgical
site infections: analysis of trends between 2000 and 2013 using multi-centre prospective cohort
data Epidemiol Infect [Accepted November 2016]
[21] Public Health England (2016). Health Protection Report 10(39): news (11 November). Extenstion of
surveillance and infection control measures for Gram-negative infections. Available at:
https://www.gov.uk/government/publications/health-protection-report-volume-10-2016
[22] Streulens MJ, Plachouras D Mycobacterium chimaera infection associated with heater-cooler units
(HCU): closing another loophole in patient safety. Euro Surveill 2016 Nov 17; 21(46)
[23] Perkins KM, Lawsin A, Hasan NA et al. Notes from the field: Mycobacterium chimaera
contamination of heater-cooler devices used in cardiac surgery - Unites States. MMWR Morb
Mortal Wkly Rep 2016; 65:1117–1118
[24] Chand M, Lamagni T, Kranzer K et al. Insidious risk of severe Mycobacteraium chimaera infection in cardiac
surgery patients. Clin Infect Dis 2016; doi:10.1093/cid/ciw754
[25] Public Health England (2015). Mycobacterial infections associated with heater cooler units.
Guidance and updates concerning the risk of mycobacterial infections associted wih heater cooler
units used in cardopthoracic surgery. Available at:
https://www.gov.uk/government/collections/mycobacterial-infections-associated-with-heater-cooler-
units