surveillance of six priority food- and waterborne diseases...
TRANSCRIPT

SURVEILLANCE REPORT
Surveillance of six priority food- and waterborne diseases
in the EU/EEA
2006–2009
www.ecdc.europa.eu
SURVEILLANCE REPORT
Surveillance of six priority food- and waterborne diseases in the EU/EEA 2006–2009

ECDC SURVEILLANCE REPORT
Surveillance of six priority food- and waterborne diseases in the EU/EEA
2006 – 2009

ii
This report of the European Centre for Disease Prevention and Control (ECDC) was produced and coordinated by Taina Niskanen and Johanna Takkinen.
Contributing authors (data analysis): Alastair Donachie
This report was sent for consultation and review to the disease experts in the Food- and Waterborne Diseases and Zoonoses network (FWD-Net). We would like to acknowledge the contribution and dedication of the experts in the Member States in reporting the data used for the production of this report.
Suggested citation: European Centre for Disease Prevention and Control. Surveillance of food- and waterborne diseases in the EU/EEA – 2006–2009. Stockholm: ECDC; 2013.
Stockholm, September 2013
ISBN 978-92-9193-465-2
doi 10.2900/81069
Catalogue number TQ-01-13-109-EN-N
© European Centre for Disease Prevention and Control, 2013
Reproduction is authorised, provided the source is acknowledged
Erratum. The following corrections were made on 1 October 2013:Page 47, paragraph 1: '5 989 STEC/VTEC infections' was changed to '5 898 STEC/VTEC infections'.

SURVEILLANCE REPORT Surveillance of food- and waterborne diseases in the EU/EEA
iii
Contents
Abbreviations ..............................................................................................................................................viii Summary ...................................................................................................................................................... 1 Introduction .................................................................................................................................................. 3 Data collection and analyses ........................................................................................................................... 4
Reporting to the European Surveillance System (TESSy) .............................................................................. 4 EU case definitions .................................................................................................................................... 5 General objectives for food- and waterborne diseases and zoonoses surveillance ........................................... 5 Data analysis ............................................................................................................................................ 5 Trend analyses ......................................................................................................................................... 5 Notification rates ...................................................................................................................................... 6 Age groups .............................................................................................................................................. 6
1 Non-typhoidal salmonellosis in the EU/EEA, 2006–09 ...................................................................................... 7 Salmonellosis............................................................................................................................................ 8 Surveillance of non-typhoidal salmonellosis in the EU/EEA in 2006–09 ........................................................... 8 National surveillance systems for salmonellosis ............................................................................................ 9 Epidemiological situation in 2006–09 ........................................................................................................ 10
Major findings .................................................................................................................................... 10 Overview of trends ............................................................................................................................. 10 Age and gender .................................................................................................................................. 12 Salmonella serovars ............................................................................................................................ 14 Seasonality ........................................................................................................................................ 16 Travel-related (non-typhoidal) salmonellosis ......................................................................................... 17 Severity ............................................................................................................................................. 18
Discussion .............................................................................................................................................. 19 References ............................................................................................................................................. 21
2 Campylobacteriosis in the EU/EEA, 2006–09 ................................................................................................ 22 Campylobacteriosis ................................................................................................................................. 22 Surveillance of campylobacteriosis in the EU/EEA in 2006–09 ...................................................................... 22 National surveillance systems for campylobacteriosis.................................................................................. 23 Epidemiological situation in 2006–09 ........................................................................................................ 24
Major findings .................................................................................................................................... 24 Overview of trends ............................................................................................................................. 24 Age and gender .................................................................................................................................. 27 Campylobacter species ........................................................................................................................ 28 Species by age groups ........................................................................................................................ 28 Seasonality ........................................................................................................................................ 29 Travel-related campylobacteriosis......................................................................................................... 30 Severity ............................................................................................................................................. 31
Discussion .............................................................................................................................................. 31 References ............................................................................................................................................. 32
3 STEC/VTEC infections in the EU/EEA, 2006–09 ............................................................................................ 34 Shiga toxin/verotoxin-producing Escherichia coli (STEC/VTEC) infection ....................................................... 34 Surveillance of STEC/VTEC in the EU/EEA in 2006–09 ................................................................................ 34 National surveillance systems for STEC/VTEC ............................................................................................ 35 Epidemiological situation in 2006–09 ........................................................................................................ 36
Major findings .................................................................................................................................... 36 Overview of trends ............................................................................................................................. 36 Age and gender .................................................................................................................................. 39 STEC/VTEC serotypes ......................................................................................................................... 41 Serotypes by age groups ..................................................................................................................... 45 Seasonality ........................................................................................................................................ 46 Travel-related STEC/VTEC infection ...................................................................................................... 47 Severity ............................................................................................................................................. 47
Discussion .............................................................................................................................................. 48 References ............................................................................................................................................. 50
4 Listeriosis in the EU/EEA, 2006–09.............................................................................................................. 51 Listeriosis ............................................................................................................................................... 51 Surveillance of listeriosis in the EU/EEA in 2006–09.................................................................................... 51 National surveillance systems for listeriosis................................................................................................ 52 Epidemiological situation in 2006–09 ........................................................................................................ 52

Surveillance of food- and waterborne diseases in the EU/EEA SURVEILLANCE REPORT
iv
Major findings .................................................................................................................................... 52 Overview of trends ............................................................................................................................. 53 Age and gender .................................................................................................................................. 55 Listeria monocytogenes serotypes ........................................................................................................ 57 Serotypes by age groups ..................................................................................................................... 58 Seasonality ........................................................................................................................................ 59 Travel-related listeriosis ...................................................................................................................... 59 Severity ............................................................................................................................................. 59
Discussion .............................................................................................................................................. 60 References ............................................................................................................................................. 62
5 Yersiniosis in the EU/EEA, 2006–09 ............................................................................................................. 63 Yersiniosis .............................................................................................................................................. 63 Surveillance of yersiniosis in the EU/EEA in 2006–09 .................................................................................. 63 National surveillance systems for yersiniosis .............................................................................................. 64 Epidemiological situation in 2006–09 ........................................................................................................ 64
Major findings .................................................................................................................................... 64 Overview of trends ............................................................................................................................. 65 Age and gender .................................................................................................................................. 67 Yersinia species .................................................................................................................................. 69 Seasonality ........................................................................................................................................ 69 Yersinia serotypes............................................................................................................................... 70 Serotypes by age groups ..................................................................................................................... 71 Travel-related yersiniosis ..................................................................................................................... 71 Severity ............................................................................................................................................. 71
Discussion .............................................................................................................................................. 72 References ............................................................................................................................................. 74
6 Shigellosis in the EU/EEA, 2006–09 ............................................................................................................. 75 Shigellosis .............................................................................................................................................. 75 Surveillance of shigellosis the EU and EEA in 2006–09 ................................................................................ 75 National surveillance systems for shigellosis .............................................................................................. 76 Epidemiological situation in 2006–09 ........................................................................................................ 76
Major findings .................................................................................................................................... 76 Overview of trends ............................................................................................................................. 77 Age and gender .................................................................................................................................. 79 Shigella species .................................................................................................................................. 80 Species by age groups ........................................................................................................................ 81 Seasonality ........................................................................................................................................ 81 Travel-related shigellosis ..................................................................................................................... 82
Discussion .............................................................................................................................................. 83 References ............................................................................................................................................. 85
7 Typhoid and paratyphoid fever in the EU/EEA, 2006–09 ............................................................................... 86 Typhoid and paratyphoid fever ................................................................................................................. 86 Surveillance of typhoid and paratyphoid fever in the EU/EEA in 2006–09 ..................................................... 86 National surveillance systems for typhoid and paratyphoid fever ................................................................. 87 Epidemiological situation in 2007–09 ........................................................................................................ 88
Major findings .................................................................................................................................... 88 Overview of trends ............................................................................................................................. 88 Age and gender .................................................................................................................................. 90 Seasonality ........................................................................................................................................ 93 Travel-related typhoid and paratyphoid fever ........................................................................................ 94 Severity ............................................................................................................................................. 95 Antimicrobial resistance ....................................................................................................................... 96
Discussion .............................................................................................................................................. 97 References ............................................................................................................................................. 98
Annex. Case definitions ................................................................................................................................ 99 Campylobacteriosis (Campylobacter spp.) EU case definition ....................................................................... 99 Listeriosis (Listeria monocytogenes) EU case definition ............................................................................. 100 Salmonellosis (Salmonella spp. other than S. Typhi and S. Paratyphi) EU case definition ............................. 101 Shiga toxin/verotoxin-producing Escherichia coli infection (STEC/VTEC) EU case definition .......................... 102 Shigellosis (Shigella spp.) EU case definition ............................................................................................ 103 Typhoid/Paratyphoid fever (Salmonella Typhi/Paratyphi) EU case definition ............................................... 104 Yersiniosis (Yersinia enterocolitica, Yersinia pseudotuberculosis) EU case definition .................................... 105

SURVEILLANCE REPORT Surveillance of food- and waterborne diseases in the EU/EEA
v
Figures
Figure 1-1. Trend in notification rates of confirmed non-typhoidal salmonellosis cases in EU/EEA countries, 2006–09 .............................................................................................................................................................. 10 Figure 1-2. Trends in notification rates of confirmed non-typhoidal salmonellosis cases in grouped EU and EEA countries, 2006–09 ...................................................................................................................................... 12 Figure 1-3. Notification rates of confirmed non-typhoidal salmonellosis cases by age group and gender, EU/EEA, 2009 (N=90 789) ......................................................................................................................................... 13 Figure 1-4. Semi-logarithmic graph showing notification rates of confirmed non-typhoidal salmonellosis cases by age groups and gender in EU/EEA countries, 2007–09 .................................................................................... 14 Figure 1-5. Semi-logarithmic graph showing trends of confirmed cases for five selected Salmonella serotypes in EU/EEA countries, 2007–09 .......................................................................................................................... 15 Figure 1-6a and b. Relative distribution of selected non-typhoidal Salmonella serovars by age groups, EU/EEA, 2007–09 ..................................................................................................................................................... 16 Figure 1-7. Number of the six most commonly reported non-typhoidal Salmonella serovars by month, EU/EEA,
2007–09 ..................................................................................................................................................... 17 Figure 1-8. Origin of travel-related non-typhoidal salmonellosis cases as reported by EU/EEA countries, 2007–09 (cumulative N=33 392) ................................................................................................................................ 18 Figure 2-1. Trend in notification rates of confirmed campylobacteriosis cases, EU/EEA, 2006–09 ......................... 24 Figure 2-2. Trends in notification rates of confirmed campylobacteriosis cases in grouped EU/EEA countries, 2006–09 .............................................................................................................................................................. 25 Figure 2-3. Notification rates of confirmed campylobacteriosis cases by age group and gender in EU/EEA countries, 2009 (N=197 928) ....................................................................................................................................... 27 Figure 2-4. Trends in notification rates of confirmed campylobacteriosis cases by age groups and gender, EU/EEA, 2007–09 ..................................................................................................................................................... 28 Figure 2-5. Cumulative proportions of Campylobacter species by age groups, EU/EEA countries, 2007–09 ........... 29 Figure 2-6. Number of reported Campylobacter jejuni (N=226 257) and Campylobacter coli (N=13 722) cases by month, EU/EEA countries, 2007–09 ............................................................................................................... 30 Figure 2-7. Confirmed campylobacteriosis cases per 100 000 population by month, EU/EEA countries, 2009 ........ 30 Figure 2-8. Origin of travel-related campylobacteriosis cases in the EU/EEA, 2007–09 (cumulative N=37 310) ..... 30 Figure 3-1. Trend in notification rates of confirmed STEC/VTEC cases, EU/EEA, 2006–09 ................................... 37 Figure 3-2. Trends in notification rates of confirmed STEC/VTEC cases in grouped EU/EEA countries, 2006–09 .... 38 Figure 3-3. Notification rates of confirmed STEC/VTEC cases by age group and gender, EU/EEA (N=3 675), 2009 40 Figure 3-4. Trends in notification rates of confirmed STEC/VTEC cases by age groups and gender, EU/EEA, 2007–09 .............................................................................................................................................................. 41 Figure 3-5. Selected STEC/VTEC serotypes by age groups, EU/EEA, 2007–09 (N=875)....................................... 46 Figure 3-6. Seasonality of the four most commonly reported STEC/VTEC serotypes (O157:H7, O157:H-, O103:H2, and O26:H11), EU/EEA, 2007–09 .................................................................................................................. 46 Figure 3-7. Origin of travel-related STEC/VTEC cases as reported by EU/EEA countries, 2007–09 (cumulative N=1127) ..................................................................................................................................................... 47 Figure 4-1. Trend in notification rates of confirmed listeriosis cases, EU/EEA, 2006–09 ....................................... 53 Figure 4-2. Trends in notification rates of confirmed listeriosis cases in grouped EU/EEA countries, 2006–09 ........ 54 Figure 4-3. Notification rates of confirmed listeriosis cases by age group and gender, EU/EEA, 2009 (N=1 657) ... 56 Figure 4-4. Trends in notification rates of confirmed listeriosis cases by age groups and gender, EU/EEA, 2007–09 .................................................................................................................................................................. 57 Figure 4-5. Distribution of the most frequently reported human Listeria monocytogenes serotypes in EU/EEA countries, 2007–09 (N=1971) ....................................................................................................................... 58 Figure 4-6. Most commonly reported Listeria monocytogenes serotypes by age groups, EU/EEA, 2007–09 (N=1965) .................................................................................................................................................................. 58 Figure 5-1. Trend in notification rates of confirmed yersiniosis cases, EU/EEA, 2006–09 ..................................... 65 Figure 5-2. Trends in notification rates of confirmed yersiniosis cases in grouped EU/EEA countries, 2006–09 ...... 66 Figure 5-3. Notification rates of confirmed yersiniosis cases by age group and gender, EU/EEA, 2009 (N=6896) .. 68 Figure 5-4. Semi-logarithmic graph showing notification rates of confirmed yersiniosis cases by age group and gender, EU/EEA, 2007–09............................................................................................................................. 68 Figure 5-5. Semi-logarithmic graph showing number of confirmed yersiniosis cases by species and age groups, EU/EEA, 2007–09 (N=21 394) ....................................................................................................................... 69 Figure 5-6. Number of reported Yersinia enterocolitica (N=19820) and Yersinia pseudotuberculosis (N=294) cases by month, EU/EEA, 2007–09 ......................................................................................................................... 70 Figure 5-7. Semi-logarithmic graph showing trends of the four most common Yersinia enterocolitica serotypes in six EU countries, 2007–09 ................................................................................................................................. 70 Figure 5-8. Distribution of the four most common Yersinia enterocolitica serotypes by age groups, EU/EEA, 2007–09 (pooled data, N=12 233) ......................................................................................................................... 71

Surveillance of food- and waterborne diseases in the EU/EEA SURVEILLANCE REPORT
vi
Figure 5-9. Origin of travel-related yersiniosis cases as reported by EU and EEA countries, 2007–09 (cumulative
N=685) ....................................................................................................................................................... 71 Figure 6-1. Notification rates of confirmed shigellosis cases, EU/EEA, 2006–09 .................................................. 77 Figure 6-2. Trends in notification rates of confirmed shigellosis cases in grouped EU/EEA countries, 2006–09 ...... 78 Figure 6-3. Notification rates of confirmed shigellosis cases by age group and gender, EU/EEA, 2009 (N=6 287) .. 79 Figure 6-4. Trends in notification rates of confirmed shigellosis cases by age group and gender, EU/EEA, 2007–09 .................................................................................................................................................................. 80 Figure 6-5. Cumulative relative distribution of Shigella species by age groups, EU/EEA, 2008–09 (N=9093) ......... 81 Figure 6-6. Confirmed shigellosis cases by Shigella species and month, EU/EEA, 2009 (N=5064) ........................ 82 Figure 6-7. Seasonality of Shigella sonnei cases by age groups, EU/EEA, 2009 (N=3019) ................................... 82 Figure 6-8. Origin of travel-related shigellosis cases as reported by EU/EEA countries, 2008–09 (cumulative N=2660) ..................................................................................................................................................... 83 Figure 7-1. Notification rates of confirmed Salmonella Typhi cases by age group and gender, EU/EEA, 2009 (N=435) ..................................................................................................................................................... 91 Figure 7-2. Notification rates of confirmed paratyphoid fever cases by age group and gender in EU in 2009 (N=462) ..................................................................................................................................................... 92 Figure 7-3. Distribution of Salmonella Typhi and S. Paratyphi serovars by age groups, EU/EEA, 2007–09 (N=2 252) .................................................................................................................................................................. 93 Figure 7-4. Number of reported Salmonella Typhi and Salmonella Paratyphi serovars by month, EU/EEA, 2007–09 .................................................................................................................................................................. 93 Figure 7-5. Origin of travel-related typhoid and paratyphoid fever cases as reported by EU and EEA countries, 2007–09 (cumulative N=878) ....................................................................................................................... 94 Figure 7-6. Five most commonly reported non-EU countries in travel-related Salmonella Typhi and Salmonella Paratyphi infections, EU, 2007–09 (N=868) .................................................................................................... 95
Tables
Table 1-1. TESSy definition of common variables for priority diseases (campylobacteriosis, listeriosis, salmonellosis, STEC/VTEC infection, shigellosis and yersiniosis) .............................................................................................. 4 Table 1-2. Enhanced epidemiological dataset Shiga toxin/verotoxin collected for non-typhoidal salmonellosis cases,
EU/EEA, 2006–09 ........................................................................................................................................... 8 Table 1-3. Notification systems for human salmonellosis cases in EU/EEA countries, 2009 .................................... 9 Table 1-4. Confirmed non-typhoidal salmonellosis cases and notification rates (per 100 000 population) by country in the EU and EEA, 2006–09 ......................................................................................................................... 11 Table 1-5. Number of confirmed non-typhoidal salmonellosis cases and notification rate by age group and gender, EU/EEA, 2009 .............................................................................................................................................. 13 Table 1-6. Top 30 Salmonella serovars in confirmed non-typhoidal salmonellosis cases in EU/EEA countries, 2007–09 .............................................................................................................................................................. 14 Table 1-7. Number of deaths due to non-typhoidal Salmonella infection and respective case-fatality rate by age groups in EU/EEA countries, 2007–09 ............................................................................................................ 18 Table 2-1. Enhanced epidemiological dataset Shiga toxin/verotoxin, collected for campylobacteriosis cases, EU/EEA, 2006–09 ..................................................................................................................................................... 22 Table 2-2. Notification systems for human campylobacteriosis cases, EU/EEA, 2009 ........................................... 23 Table 2-2. Confirmed cases of campylobacteriosis and notification rates (per 100 000 population) by country, EU/EEA, 2006–09 ......................................................................................................................................... 24 Table 2-3. Number of confirmed campylobacteriosis cases and notification rate (per 100 000 population) by age group and gender, EU/EEA countries, 2009 .................................................................................................... 27 Table 2-4. Campylobacter species in confirmed campylobacteriosis cases in EU/EEA countries, 2007–09 .............. 28 Table 2-5. Hospitalisation of confirmed campylobacteriosis cases in EU/EEA countries, 2007–09 ......................... 31 Table 2-6. Outcome of confirmed campylobacteriosis cases in the EU and EEA, 2007–09.................................... 31 Table 3-1. Enhanced dataset collected for STEC/VTEC cases, EU/EEA, 2006–09 ................................................ 34 Table 3-2. Notification systems for human STEC/VTEC cases in EU/EEA countries, 2009 ..................................... 35 Table 3-3. Confirmed STEC/VTEC cases and notification rates (per 100 000 population) by country and year, EU/EEA, 2006–09 ......................................................................................................................................... 37 Table 3-4. Number of confirmed STEC/VTEC cases by age group and gender, EU/EEA, 2009 .............................. 40 Table 3-5. The 20 most commonly reported STEC/VTEC O serogroups in confirmed cases, EU/EEA, 2007–09 ...... 41 Table 3-6. The 20 most commonly reported STEC/VTEC flagellar H antigens in confirmed cases, EU/EEA, 2007–09 .................................................................................................................................................................. 42 Table 3-7. The 20 most commonly reported STEC/VTEC serotypes in confirmed cases, EU/EEA, 2007–09 ............ 43 Table 3-8. Shiga toxin genes of STEC/VTEC serotypes by intimin (eae) subtypes, EU/EEA countries in 2007–09 ... 43 Table 3-9. Shiga toxin genes of STEC/VTEC serotypes by HUS syndrome, EU/EEA, 2007–09 ............................... 44 Table 3-10. Sorbitol-fermenting ability of STEC/VTEC serogroup O157 by HUS syndrome, EU/EEA, 2007–09 ........ 45

SURVEILLANCE REPORT Surveillance of food- and waterborne diseases in the EU/EEA
vii
Table 3-11. HUS syndrome among reported STEC/VTEC cases, EU/EEA, 2007–09 ............................................. 48 Table 3-12. Symptoms reported for STEC/VTEC-related HUS and non-HUS cases, EU/EEA, 2007–09 ................... 48 Table 3-13. Reporting of outcome for confirmed STEC/VTEC cases, EU/EEA, 2007–09 ....................................... 48 Table 4-1. Enhanced dataset collected for listeriosis cases, EU/EEA, 2006–09 .................................................... 51 Table 4-2. Notification systems for human listeriosis cases in EU/EEA, 2009 ...................................................... 52 Table 4-3. Confirmed cases of listeriosis and notification rates (per 100 000 population) by country, EU/EEA, 2006–09 .............................................................................................................................................................. 53 Table 4-4. Number of confirmed listeriosis cases and notification rate (per 100 000 population) by age group and gender, EU/EEA, 2009 .................................................................................................................................. 56 Table 4-5. Listeria monocytogenes serotypes reported in EU/EEA countries, 2007–09 ........................................ 57 Table 4-6. Hospitalisation of confirmed listeriosis cases, EU/EEA, 2009 ............................................................. 59 Table 4-7. Number of cases and proportion of deaths due to Listeria monocytogenes infection by age group, EU/EEA, 2007–09 ......................................................................................................................................... 60 Table 4-8. Pregnancy-associated Listeria monocytogenes infections, EU/EEA, 2009............................................ 60 Table 5-1. Enhanced dataset collected for yersinosis cases, EU/EEA, 2006–09 ................................................... 63 Table 5-2. Notification system of human yersiniosis cases in EU/EEA countries, 2009 ......................................... 64 Table 5-3. Confirmed cases of yersiniosis and notification rates (per 100 000 population) by country, EU/EEA, 2006–09 ..................................................................................................................................................... 65 Table 5-4. Number of confirmed yersiniosis cases and notification rate (per 100 000 population) by age group and gender, EU/EEA, 2009 .................................................................................................................................. 68 Table 5-5. Yersinia species in confirmed yersiniosis cases, EU/EEA, 2007–09 ..................................................... 69 Table 5-6. Reported serotypes in confirmed Yersinia enterocolitica cases, EU/EEA, 2007–09 ............................... 70 Table 5-7. Hospitalisation of confirmed yersiniosis cases, EU/EEA, 2007–09 ...................................................... 72 Table 5-8. Outcome of confirmed yersiniosis cases, EU/EEA, 2007–09 .............................................................. 72 Table 6-1. Enhanced dataset collected for Shigella cases, EU/EEA, 2006–09 ...................................................... 75 Table 6-2. Notification systems for human shigellosis cases in EU/EEA countries, 2009 ...................................... 76 Table 6-3. Confirmed cases of shigellosis and notification rates (per 100 000 population) by country, EU/EEA, 2006–09 ..................................................................................................................................................... 77 Table 6-4. Number of confirmed shigellosis cases and notification rate (per 100 000 population) by age group and gender, EU/EEA, 2009 .................................................................................................................................. 80 Table 6-5. Shigella species in confirmed shigellosis cases, EU/EEA, 2008–09 ..................................................... 80 Table 7-1. Enhanced dataset collected for Salmonella infections, EU/EEA, 2006–09 ........................................... 86 Table 7-2. Notification systems for typhoid and paratyphoid fever cases in EU/EEA countries, 2009..................... 87 Table 7-3. Confirmed cases of Salmonella Typhi and S. Paratyphi and notification rates (per 100 000 population), EU/EEA, 2007–09 ......................................................................................................................................... 88 Table 7-4. Confirmed Salmonella Typhi cases and notification rates (per 1 million population) by country, EU/EEA, 2007–09 (as of 22 March 2013) .................................................................................................................... 89 Table 7-5. Confirmed Salmonella Paratyphi cases and notification rates (per 1 million population) by country and year, EU/EEA, 2007–09 (as of 22 March 2013) ............................................................................................... 89 Table 7-6. Number of confirmed Salmonella Typhi cases and notification rates by age group and gender, EU/EEA, 2009 ........................................................................................................................................................... 91 Table 7-7. Confirmed paratyphoid fever cases and notification rates by age group and gender in the EU, 2009 .... 92 Table 7-8. Hospitalisation of confirmed typhoid and paratyphoid fever cases, EU/EEA, 2009 ............................... 95 Table 7-9. Outcome of confirmed typhoid and paratyphoid fever cases, EU/EEA, 2007–09 .................................. 95 Table 7-10. Isolations of Salmonella Typhi and Salmonella Paratyphi serovars in human specimens, EU/EEA, 2007–09 .............................................................................................................................................................. 96 Table 7-11. Resistance of Salmonella Typhi isolates to antimicrobials, EU, 2007–09 ........................................... 96 Table 7-12. Resistance of Salmonella Paratyphi serovars (S. Paratyphi, S. Paratyphi A, S. Paratyphi B and S. Paratyphi C) to antimicrobials in the EU, 2007–09 ........................................................................................... 96

Surveillance of food- and waterborne diseases in the EU/EEA SURVEILLANCE REPORT
viii
Abbreviations
AER Annual epidemiological report
DSN Dedicated surveillance network
ECDC European Centre for Disease Prevention and Control
EEA European Economic Area
EFSA European Food Safety Authority
EPIS Epidemic Intelligence Information System
EU European Union
EUSR European Union Summary Report on Trends and Sources of Zoonoses, Zoonotic Agents and Foodborne Outbreaks
FWD Food- and waterborne diseases and zoonoses
HUS Haemolytic-uraemic syndrome
RTE Ready-to-eat (processed) food
STEC/VTEC Shiga toxin/verotoxin-producing Escherichia coli
TESSy The European Surveillance System

SURVEILLANCE REPORT Surveillance of food- and waterborne diseases in the EU/EEA
1
Summary
The European Centre for Disease Prevention and Control (ECDC) is an EU agency [1] with a mandate to operate surveillance networks and to identify, assess, and communicate current and emerging threats to human health from communicable diseases. The agency became operational in 2005. Initially, data were collected for 49 diseases (2008), with three more added in 2012. All data are entered in ECDC’s database system, known as The European Surveillance System (TESSy). Epidemiological overviews of all diseases are provided in the ECDC’s Annual Epidemiological Report.
The surveillance of salmonellosis, campylobacteriosis and Shiga toxin/verotoxin-producing Escherichia coli (STEC/VTEC) infection was carried out until 2007 by an EU-funded dedicated surveillance network, Enter-net, which was hosted by the Health Protection Agency in the United Kingdom. In October 2007, the coordination of Enter-net was transferred to ECDC and Enter-net is now under the auspices of the Programme of Food- and Waterborne Diseases and Zoonoses (FWD). After the transfer, the scope was broadened to also cover listeriosis, yersiniosis and shigellosis. For the six priority diseases, surveillance was developed further in close collaboration with nominated disease experts, epidemiologists and microbiologists.
This report is the first dedicated epidemiological report on these six diseases, offering a detailed analysis for the years 2006 to 2009. The intended readership includes public health and food safety professionals, policymakers, scientists, and the general public.
Between 2006 and 2009 the following trends could be observed in the EU/EEA:
Campylobacteriosis and STEC/VTEC infection showed an increasing trend over the four-year surveillance period. Reporting of campylobacteriosis increased by 13%, with over 201 605 cases reported in the EU/EEA in 2009, representing a notification rate of 47 per 100 000 population. The majority (90%) of Campylobacter infections were acquired in EU/EEA countries.
For STEC/VTEC infection, the increase was 9%, with 3 698 cases (0.77 cases per 100 000 population) reported in 2009. Between 2007 and 2009, most (79%) of the STEC/VTEC infections were of domestic origin.
Three diseases – salmonellosis, shigellosis and yersiniosis – showed a declining trend between 2006 and 2007 and in 2009.
Salmonellosis cases dropped by 53 854 between 2006 and 2009, representing a reduction of 33%, with 109 893 cases reported in 2009 (notification rate: 24.3 cases per 100 000 population). The decrease was particularly noticeable in cases with Salmonella Enteritidis infection, which dropped by 44% during the four-year period. Despite the decreasing trend, several foodborne outbreaks due to Salmonella infection were detected and investigated. Salmonella infections were mostly acquired in the EU/EEA (86% of all cases), suggesting a continued circulation of Salmonella bacteria in EU/EEA countries.
Shigellosis cases dropped by 13% between 2007 and 2009, with 1119 fewer cases reported in 2009 compared with 2007. The notification rate of shigellosis cases was 1.63 per 100 000 population, with 7621 reported cases in 2009. Shigellosis is not endemic in the EU/EEA countries, and two thirds of the reported cases between 2007 and 2009 were imported from countries outside the EU/EEA.
Yersiniosis reports decreased by 16%, and 1 433 fewer cases were reported in 2009 compared with 2006. The notification rate was 1.77 cases per 100 000 population, with 7638 cases reported in the EU/EEA in 2009. Yersinia infections are almost entirely of domestic origin, with 97% of cases reported as domestically acquired. The most
common serotype in human infections between 2007 and 2009 was O:3 (over 90%).
The trend of listeriosis remained stable in the EU/EEA during the four-year-period covered in this surveillance report. In 2009, 1 638 listeriosis cases were reported, representing a rate 0.38 cases per 100 000 population. Listeriosis is a true foodborne disease and almost solely acquired domestically. Fewer than 2% of the listeriosis cases were imported, most often from another EU country. Reported human listeriosis cases in 2007–09 were most frequently associated with serotypes 4b, 1/2a, and 1/2b. The most dominant serotypes in all age groups were 4b and 1/2a.
Reporting of typhoid fever cases stabilised between 2008 and 2009, with a 2009 notification rate of 1.5 cases per one million (630 reported cases). The same was observed for paratyphoid fever, although slightly fewer cases (N=586) were reported in 2009 compared with 2008 (N=620). Typhoid and paratyphoid fever are diseases largely (> 80%) related to travels to countries outside the EU/EEA. The highest antimicrobial resistance levels were detected to nalidixic acid in typhoid (74%) and paratyphoid (74%) fever infections.
Previously, age group 0–4 years has presented with the highest rate of reported infections for most of the six priority food- and waterborne diseases. For this report, the trends in notification rates for children in the age group

Surveillance of food- and waterborne diseases in the EU/EEA SURVEILLANCE REPORT
2
below one year were analysed separately to see if there was any difference between this age group and the group
of 1–4-year-olds.
Non-typhoidal Salmonella infections, Campylobacter and STEC/VTEC infections showed only little variation between children below one year of age and children between one and four years of age. The most marked difference among children below five years of age was observed for typhoid fever, which was reported five times more often in the age group of 1–4-year-olds compared with children below one year. Between 2007 and 2009, the trend in the rate of listeriosis decreased in the youngest age group (below one year).
Age group intervals of 10 years for listeriosis cases above 65 years of age were introduced to facilitate analysis. The trend of listeriosis cases increased sharply among the elderly, particularly in men over 85 years of age.
For most of the priority diseases, the case-fatality rate was below 1%, except for listeriosis, for which the case-fatality rate ranged from 17% to 20% between 2007 and 2009.
Of special concern are Listeria infections among the elderly. Hospital-related outbreaks remain a significant patient safety concern and they underscore the high infection risk related to processed, ready-to-eat (RTE) foods in settings where vulnerable population groups are served, for example in hospitals and homes for the elderly.
Awareness should be increased about the listeriosis risk connected to certain RTE foods in risk groups. EU regulations for L. monocytogenes should be strictly followed in an attempt to keep L. monocytogenes at an acceptable level.

SURVEILLANCE REPORT Surveillance of food- and waterborne diseases in the EU/EEA
3
Introduction
The European Centre for Disease Prevention and Control (ECDC) is an EU agency [2] with a mandate to operate surveillance networks and to identify, assess, and communicate current and emerging threats to human health from communicable diseases.
Since 1994, the European Union has operated dedicated surveillance networks for enteric pathogens. Surveillance started as a laboratory network (Salm-Net), focusing on harmonised Salmonella phage-typing for human strains. From 1998 to 2007, the network broadened its scope and continued as a dedicated surveillance network (DSN) for enteric pathogens – Salmonella, E. coli and Campylobacter (the last one added in 2003) – under the name Enter-net. Enter-net has published two annual reports (2004 and 2005), which are available on ECDC website [3]. The network was financed by the European Commission until October 2006 and has been funded by ECDC since October 2007, when the coordination of Enter-net was transferred to ECDC. The network was evaluated and assessed in 2007 by an international team of experts [4]. The network has added value to public health by identifying and ascertaining Salmonella and VTEC (verotoxin-producing E. coli) outbreaks that can and do affect several Member States.
After the transfer of Enter-net to ECDC, the scope of enhanced surveillance was broadened to cover three additional bacterial enteric diseases: listeriosis, yersiniosis, and shigellosis. A new network for six priority diseases was established: the ECDC Food- and Waterborne Diseases Network (FWD-Net). It recruited qualified epidemiologists and laboratory experts – many previously engaged in Enter-net – and thus ensured continuity with Enter-net. Efforts to identify multinational foodborne outbreaks included the creation of an information exchange platform called EPIS (Epidemiological Information Sharing), which is available to network members and other key experts working with food- and waterborne diseases in all EU/EEA and some non-EU countries.
ECDC produces annually an epidemiological report (AER) on all diseases that are to be covered by EU-wide surveillance [5] as per Commission Decisions 2119/98/EC, 2000/96/EC and their amendments. In addition, ECDC analyses human data for several zoonoses. The results are combined with food and animal data into an annual European Union summary report on trends and sources of zoonoses, zoonotic agents and food-borne outbreaks, published jointly with the European Food Safety Authority (EFSA) [6]. ECDC and EFSA also publish an EU summary report on antimicrobial resistance in zoonotic and indicator bacteria obtained from humans, animals and food [7]; ECDC provides the analyses of human data with regard to antimicrobial resistance of Campylobacter and non-typhoidal Salmonella.
This is the first ECDC surveillance report covering enhanced surveillance of food- and waterborne diseases. It provides an in-depth epidemiological overview of trends in six priority foodborne enteric diseases: campylobacteriosis, listeriosis, salmonellosis, Shiga toxin/verotoxin-producing E. coli (STEC/VTEC) infections, shigellosis, and yersiniosis in EU/EEA countries, as defined in the strategy (2010–13) for ECDC’s FWD programme [8]. The report is produced within the framework of an approved long-term surveillance strategy (2008–13) [9].
The report’s intended readership includes public health and food safety professionals, policymakers, scientists, the general public and other interested audiences. The content of the report will be regularly reviewed by ECDC’s network of nominated experts on food- and waterborne diseases and zoonoses (FWD network) to allow continuous improvement. The report also focuses on findings that provide useful information for public health experts in actions in the EU/EEA countries who need to prepare short- and long-term prevention and control activities as well as other public health.

Surveillance of food- and waterborne diseases in the EU/EEA SURVEILLANCE REPORT
4
Data collection and analyses
Reporting to the European Surveillance System (TESSy)
Data on food- and waterborne diseases (FWD) is reported to ECDC’s database system, The European Surveillance System (TESSy), by all Member States and three EEA countries (Iceland, Liechtenstein and Norway). This report focuses on the analyses of disease-specific variables collected that were collected in addition to a dataset of 18 variables common to all diseases, which are used in ECDC’s Annual Epidemiological Report.
Table 1 presents the variables common for the six priority diseases. All additional disease-specific variables and their descriptions are provided in the respective disease-specific chapters. The aim of this report was to summarise additional descriptive information in tables and graphs not previously published in other ECDC publications. In general, the case numbers have been checked to be compatible with published data but slight variations may occur due to different time stamps in data collection and validation. Unless stated otherwise, the TESSy data analysis in this report was conducted on 9 December 2010.
Table 1-1. TESSy definition of common variables for priority diseases (campylobacteriosis, listeriosis, salmonellosis, STEC/VTEC infection, shigellosis and yersiniosis)
Variable Definition in TESSy
Age Age of patient as reported in the national system
Classification Case classification according to EU case definition
Clinical criteria The criteria for a clinical picture of the disease are met
DataSource The data source (surveillance system) from which the record originates
DateOfDiagnosis First date of clinical or lab diagnosis. In case DateofOnset is missing, this timestamp is used.
DateOfNotification Date when the case report is notified the first time to the place of notification
DateOfOnset Date of onset of disease. Not applicable (N/A) in asymptomatic cases. If not applicable, please use 'Unk'
DateUsedForStatistics The reference date used for standard reports that is compared with the reporting period. The date used for statistics can be any date that the reporting country finds applicable, e.g. date of notification, date of diagnosis, or any other date. Accepted formats for this record type: yyyy, yyyy-Qq, yyyy-mm, yyyy-ww, yyyy-mm-dd.
EpiLinked The criteria for an epidemiological diagnosis of the disease are met
Gender Gender of the infected person
Laboratory result Laboratory criteria used to classify a case as confirmed or probable
Outcome Information if the case is alive or deceased. The death should be due to the reported disease
RecordId Unique identifier for each record within and across the national surveillance system – Member State-selected and -generated
RecordType Structure and format of the data (case-based reporting and aggregate reporting)
RecordTypeVersion There may be more than one version of a recordType. This element indicates which version the sender uses when generating the message. Required when no metadata set is provided at upload.
ReportingCountry The country reporting the record
Status Status of reporting NEW/UPDATE or DELETE (inactivate)
Subject Disease to report
Data are reported as a case-based data or in an aggregated form. Countries report the data mainly from the
National Surveillance Centres. For some diseases, additional laboratory data are reported from national reference laboratories (e.g. data on antimicrobial resistance). An overall description of national surveillance systems is provided in disease-specific chapters.
Due to a wide variation in underlying factors that affect surveillance systems, no comparisons between notification rates by countries should be made. National surveillance systems vary by Member States and one should take into account such factors as the transition time to implement EU case definitions, variations in the countries’ capacity to capture the requested information in their national systems, variations in population coverage, and obligations to report data to national bodies. The establishment of a surveillance system at the EU level takes several years, and the completeness of reported disease data cannot be guaranteed during the first years. Consequently, data show considerable variation before consolidation sets in.
The data call for the surveillance report is made every year in May to ensure that the same validated data are used for EFSA’s EU summary reports and ECDC’s FWD surveillance reports. Further streamlining with the AER production is expected. In supplementing the annual data call, countries are invited to report data on salmonellosis and STEC/VTEC infections on a quarterly basis to provide the other Member States with a more timely feedback on newly emerging trends or recent changes in epidemiology.

SURVEILLANCE REPORT Surveillance of food- and waterborne diseases in the EU/EEA
5
EU case definitions
New EU case definitions for all 49 diseases were published on 28 April 2008 [10] (Commission Decision 2002/253/EC) and amended 8 August 2012 [11] (Commission Decision 2012/506/EU) countries have been encouraged to adapt their reporting to TESSy accordingly. The year 2009 was a transition period and EU case definitions are expected to be used starting on 1 January 2010. However, it is acknowledged that adapting national surveillance systems to EU case definitions will require more time. In addition, the case definitions were reviewed and are subject to minor changes in the near future.
General objectives for food- and waterborne diseases and zoonoses surveillance
The following general objectives have been agreed for the surveillance of FWD and zoonoses at the EU level:
Strengthen the integration of (laboratory) surveillance in humans, food and animals. Support identification of appropriate laboratory methods/techniques to enhance detection of international
clusters and outbreaks due to international food trade. Strengthen capacity in the Member States to improve the laboratory detection of new and emerging FWD,
including support for quality assessment and training in the methods. Facilitate early international outbreak detection and investigation of enteric pathogens through the rapid
exchange of information on causative strains. Disseminate information on food- and waterborne outbreaks to support prevention and control actions and
recommendations in the Member States. Strengthen the (inter)national collaboration between public health, food and veterinary sectors to support
prevention and control of (inter)national FWD outbreaks.
Data analysis
Data are presented and analysed for confirmed cases only. The summary table of reported confirmed cases cover the data for 2006–09. In 2007, TESSy reporting had reached a stable level; therefore detailed analyses were only
performed for case-based data from 2007 to 2009. Aggregated data were excluded from the detailed analyses due to a lack of stratified data.
Reported or notified FWD cases represent only a small proportion of the total amount of FWD cases in a population. In addition, some countries have no surveillance system, while others have a full nationwide mandatory surveillance system in place. In the latter case, some countries provide estimated population coverage for some diseases, where sentinel or partial surveillance covers a subset of the population. Percentages for the estimated population coverage were used for the Netherlands in all analyses; for Spain, age and gender could be analysed for a subset of the population (see details below).
In this report, antimicrobial resistance data were analysed for typhoidal Salmonella (S. Typhi and S. Paratyphi) to complete the antimicrobial resistance data previously reported for other Salmonella serovars (non-typhoidal Salmonella).
All analyses were conducted using STATA/SE 10.0.
Trend analyses
Four-year trends (2006–09) for EU/EEA countries were analysed with log-linear Poisson regression, using a 99% level of confidence. Incidence rate ratios were calculated and adjusted for clustering within countries, taking into account the underlying population or subset of a population. The EU/EEA trend and the trends in the countries were reported as significant if the 99% confidence interval for incidence rate ratios did not include number one. A 99% confidence interval below 1 indicated a significant decreasing trend; a confidence interval above one suggested an increasing four-year trend. As the trend calculation is relatively sensitive, it may detect trends that are a reflection of noteworthy changes in the national surveillance system or it may be influenced by nationwide outbreaks. Therefore, it is important to consider any significant changes in the national surveillance systems that may have had an impact on trend analyses. Data (number of confirmed cases and total or subset of population) at the country level were only included in the trend analysis when human cases were reported throughout the period 2006 to 2009.
The following country-specific estimated subsets of populations were used in the trend analyses:
The Netherlands: 64% population coverage for non-typhoidal salmonellosis
52% population coverage for campylobacteriosis

Surveillance of food- and waterborne diseases in the EU/EEA SURVEILLANCE REPORT
6
Spain: Was not included in the trend analyses (25% population coverage for
campylobacteriosis, listeriosis, salmonellosis and yersiniosis)
Notification rates The notification rate for each year is calculated as the ratio between the number of confirmed cases per 100 000 inhabitants (per 1 million for Salmonella Typhi and Salmonella Paratyphi) in the population as of 1 January for the respective year. Population data were extracted from the Eurostat database in December 2010. Notification rates for Spain were not analysed due to low population coverage.
Age groups In previously published ECDC Annual Epidemiological Reports, the notification rates for five of the six priority diseases (campylobacteriosis, salmonellosis, STEC/VTEC shigellosis and yersiniosis infection) were constantly and significantly higher for children below five years of age than for the other age groups. Therefore, a new age group was created, covering children under one year.
Age group intervals of 10 years for listeriosis cases above 65 years of age were introduced to facilitate analysis. This is due to the fact that listeriosis cases increased sharply among the elderly, particularly in men over 85 years of age.
The Netherlands: 64% population coverage for non-typhoidal salmonellosis
52% population coverage for campylobacteriosis
Spain: 25% population coverage for, campylobacteriosis, listeriosis, salmonellosis and yersiniosis in the age-group specific rate calculations

SURVEILLANCE REPORT Surveillance of food- and waterborne diseases in the EU/EEA
7
References
1. Regulation (EC) No 851/2004 of the European Parliament and of the Council of 21 April 2004 establishing a European centre for disease prevention and control
2. European Centre for Disease Prevention and Control. Mission. [homepage on the Internet]. 2013 [cited 2013 Apr 11]. Available from: http://ecdc.europa.eu/en/aboutus/Mission/Pages/Mission.aspx
3. European Centre for Disease Prevention and Control. Enter-net. [homepage on the Internet]. 2013 [cited 2013 Apr 11]. Available from: http://ecdc.europa.eu/en/activities/surveillance/pages/enter-net.aspx
4. ECDC Surveillance Unit. Summary of the Enter-net network evaluation and assessment. Stockholm: ECDC; 2009. Available from: http://ecdc.europa.eu/en/activities/surveillance/Documents/0909_Enternet_Summary_of_the_Enternet_network_evaluation_and_assessment.pdf
5. European Centre for Disease Prevention and Control. Annual Epidemiological Report on Communicable Diseases in Europe 2009. Stockholm: ECDC; 2010.
6. European Food Safety Authority, European Centre for Disease Prevention and Control. European Union summary report on trends and sources of zoonoses, zoonotic agents and food-borne outbreaks. Parma: EFSA; 2013.
7. European Food Safety Authority. EFSA scientific reports. [homepage on the Internet]. 2013 [cited 2013 Apr 11]. Available from: http://www.efsa.europa.eu/en/efsajournal/pub/2598.htm
8. European Centre for Disease Prevention and Control. Strategies for disease-specific programmes 2010–2013. Stockholm: European Centre for Disease Prevention and Control; 2010.
9. European Centre for Disease Prevention and Control. Surveillance of communicable diseases in the European Union – A long-term strategy: 2008–2013. Stockholm: European Centre for Disease Prevention and Control; 2008.
10. Commission Decision of 28/IV/2008 amending Decision 2002/253/EC laying down case definitions for reporting communicable diseases to the Community network under Decision No 2119/98/EC of the European Parliament and of the Council
11. Commission Implementing Decision of 8 August 2012 amending Decision 2002/253/EC laying down case definitions for reporting communicable diseases to the Community network under Decision No 2119/98/EC of the European Parliament and of the Council
12. European Food Safety Authority, European Centre for Disease Prevention and Control. The European Union summary report on trends and sources of zoonoses, zoonotic agents and food-borne outbreaks in 2010. EFSA Journal 2012; 10(3):2598.

Surveillance of food- and waterborne diseases in the EU/EEA SURVEILLANCE REPORT
8
1 Non-typhoidal salmonellosis in the EU/EEA, 2006–09
Salmonellosis
Salmonellosis is an infection caused by Salmonella (S. enterica) bacteria. Salmonella species are divided into more than 2 500 serovars. The two most common Salmonella serovars causing human infections in the EU are S. Enteritidis and S. Typhimurium. Salmonellosis is the most frequently reported cause of foodborne outbreaks and the second most commonly reported enteric infection in the EU. However, a statistically significant decrease of the cases has been observed across the EU/EEA in recent years.
Non-typhoidal Salmonella (Salmonella spp. other than S. Typhi and S. Paratyphi) are important foodborne pathogens that cause gastroenteritis. Symptoms in Salmonella infection include diarrhoea (sometimes bloody), fever, abdominal cramps and vomiting. Symptoms are often mild and most infections are self-limiting. However,
sometimes, the infection may lead to septicaemia or more severe diarrhoea with associated dehydration that can be life-threatening. The elderly, infants, and those with impaired immune systems are more likely to develop severe illness. Salmonellosis can also be associated with long-term and sometimes chronic post infectious symptoms, e.g. reactive arthritis. Some infected people can be asymptomatic carriers and excrete Salmonella bacteria in their faeces for several months.
Main reservoirs are domestic and wild animals, which often carry Salmonella bacteria without any clinical symptoms. Eggs and egg products are the most common source of foodborne Salmonella outbreaks in the EU. A wide variety of food products of animal and plant origin are reported as the vehicles or sources of infections. Direct contact with infected animals or persons may also transmit the infection.
More information on salmonellosis can be found at the ECDC website: http://ecdc.europa.eu/en/healthtopics/Salmonellosis/Pages/index.aspx
Surveillance of non-typhoidal salmonellosis in the EU/EEA in 2006–09 Since 2008, ECDC has been coordinating the European surveillance of salmonellosis, in close collaboration with a network of nominated experts, epidemiologists and microbiologists from EU/EEA countries and as part of the Food- and Waterborne Diseases and Zoonoses (FWD) network.
The scope of salmonellosis surveillance is defined by the general surveillance objectives for food- and waterborne diseases (see Introduction) and the EU case definition for non-typhoidal salmonellosis (see Annex).
A list of suggested specific surveillance objectives for Salmonella infections in humans has been discussed with the Food- and Waterborne Diseases and Zoonoses Network. Surveillance objectives are to:
monitor travel-related cases from non-EU countries; improve the detection and verification of dispersed clusters and outbreaks of non-typhoidal salmonellosis by
setting up real-time molecular surveillance for human cases and link up and harmonise these typing methods with food, feed, and animal strains;
monitor the severity of disease (hospitalisation, blood stream infections); and monitor antimicrobial resistance (AMR) development, particularly for ciprofloxacin and cefotaxime (under
revision; a separate monitoring protocol will be developed in 2012–13).
The reporting of salmonellosis to The European Surveillance System (TESSy) currently features the standard reporting of cases, including data on serotypes. In 2006–09, the reporting of salmonellosis covered 43 variables, 18 of which were common variables for all diseases, while 26 were specific for Salmonella. The common variables are presented in the first table of the chapter on ‘Data collection and analyses’. Additional Salmonella-specific variables are presented below in Table 1-2.
Table 1-2. Enhanced epidemiological dataset Shiga toxin/verotoxin collected for non-typhoidal salmonellosis cases, EU/EEA, 2006–09
Variable Description in TESSy
AntigenH1 Flagellar (H) antigen – phase 1 – of the antigenic formula of the pathogen which is the cause of the reported disease.
AntigenH2 Flagellar (H) antigen – phase 2 – of the antigenic formula of the pathogen which is the cause of the reported disease.

SURVEILLANCE REPORT Surveillance of food- and waterborne diseases in the EU/EEA
9
Variable Description in TESSy
AntigenO Somatic (O) antigen of the antigenic formula of the pathogen which is the cause of the reported disease.
DateOfReceiptReferenceLab Date of receipt in reference laboratory.
DateOfReceiptSourceLab Date (YYYY-MM-DD or YYYY-ww or YYYY-MM or YYYY-Qq or YYYY), UNK.
Hospitalisationa Hospitalisation of a case due to the cause of the disease.
Imported Having been outside the country of notification during the incubation period of the reported disease.
IsolateReferenceNumber The reference number currently used by the reference laboratory.
Pathogen Species or genus of the pathogen which is the cause of the reported disease.
Phagetype Name/number of phage type of the pathogen which is the cause of the reported disease.
Probable country of infection If Imported=Yes: one entry for each country/region visited during the incubation period of the disease. The variable is repeatable in case several countries/regions were visited.
Serotype Serotype of the pathogen which is the cause of the reported disease.
SIR_AMP, SIR_CHL, SIR_CIP, SIR_CTX, SIR_GEN, SIR_KAN, SIR_NAL, SIR_SSS, SIR_STR, SIR_SXT, SIR_TCY
Susceptibility to 11 different antibiotics (ampicillin, chloramphenicol, ciprofloxacin, cefotaxime, gentamicin, kanamycin, nalidixic acid, sulphonamides, streptomycin, trimethoprim (co-trimoxazole), tetracyclines).
Specimen The relevant specimen type used for diagnosis of the case.
Suspected vehicle Suspected vehicle or source of infection.
Transmission Suspected main mode of transmission.
a Variable was added in 2010 for 2009 reporting.
National surveillance systems for salmonellosis
Table 1-3. Notification systems for human salmonellosis cases in EU/EEA countries, 2009
Country Notifiable
since Legal
charactera Case based/ aggregatedb
National coveragec Changes in
surveillance system in 2006–09
Austria 1947 Cp C Y 2009: introduction of the electronic Epidemic Reporting System (EMS)
Belgium 1999 V C Y -d
Bulgaria Yes Cp A Y -
Cyprus Yes Cp C Y -
Czech Republic
Yes Cp C Y -
Denmark 1979 Cp C Y -
Estonia 1958 Cp C Y -
Finland 1995 Cp C Y -
France 1986 V C Y In mid-2008, a large laboratory joined the surveillance network and now sends strains to
the NRC Salmonella.
Germany 2001 Cp C Y -
Greece Yes Cp C Y -
Hungary 1959 Cp C Y -
Ireland 1948 Cp C Y -
Italy 1990 Cp C Y No changes
Latvia 1959 Cp C Y -
Lithuania 1962 Cp C Y
Luxembourg 2004 Cp+V C Y Since 2009, reported cases have included laboratory data (voluntary), in addition to cases
reported by physicians (compulsory)
Malta Yes Cp C Y -
Netherlands No V C N Non-typhoidal salmonellosis
Netherlands - Cp C Y Typhi and Paratyphi: mandatory reporting
Poland 1961 Cp C Y -
Portugal Yes Cp C Y -
Romania Yes Cp C Y -
Slovakia 1958 Cp C Y No changes

Surveillance of food- and waterborne diseases in the EU/EEA SURVEILLANCE REPORT
10
Country Notifiable
since Legal
charactera Case based/ aggregatedb
National coveragec Changes in
surveillance system in 2006–09
Slovenia 1949 Cp C Y -
Spain 1982 V C N The increase in the number of cases notified in 2009 does not constitute an actual increase in
incidence as it is due to notifications from laboratories reporting for the first time.
Sweden 1969 Cp C Y -
United Kingdom
No O C Y -
Iceland Yes Cp C Y -
Liechtenstein Yes - - - -
Norway 1975 Cp C Y -
a Legal character, Cp=compulsory, V=voluntary, O=other
b C=case based, A=aggregated
c National coverage Y=yes, N=no
d No data provided
Epidemiological situation in 2006–09
Major findings
Salmonellosis showed a significant decreasing trend between 2006 and 2009. More than 40% of the countries reported a significantly declining four-year trend. The number of reported non-typhoidal salmonellosis cases decreased by 33%, with a reduction of over 53 000 cases between 2006 and 2009; infections caused by S. Enteritidis decreased by 44% in 2007–09.
Most salmonellosis cases were of domestic origin or acquired in another EU country. The highest notification rate was detected in 1–4-year-old children, followed by the age group <1 year. Between 2007 and 2009, notification rates decreased in all age groups, especially in children 1–14 years.
Salmonellosis has a low case-fatality rate (below 0.1%) but the risk for death increased five to nine times after the age of 65 years compared with the 45–64-year age group.
Overview of trends
The number of reported cases of salmonellosis has significantly decreased in the EU/EEA during the four-year period, from 163 747 confirmed cases in 2006 to 109 893 cases in 2009 (Figure 1-1). At the same time, the notification rate declined from 36.5 cases per 100 000 population per year to 24.3 (Table 1-4). A decreasing trend was reported in 63% of the countries during the four-year surveillance period.
Figure 1-1. Trend in notification rates of confirmed non-typhoidal salmonellosis cases in EU/EEA countries, 2006–09
Source: Austria, Belgium, Bulgaria, Cyprus, Czech Republic, Denmark, Estonia, Finland, France, Germany, Greece, Hungary, Ireland, Italy, Latvia, Luxembourg, Malta, the Netherlands, Poland, Portugal, Romania, Slovakia, Sweden, United Kingdom; non-EU countries: Iceland and Norway
All EU and EEA countries have reported confirmed salmonellosis cases since 2007. Of the 27 EU/EEA countries that reported data for the whole four-year period (cumulative total N=565 878), the highest number of salmonellosis
0.0
5.0
10.0
15.0
20.0
25.0
30.0
35.0
40.0
2006 2007 2008 2009
Co
nfi
rme
d c
ase
s/1
00
00
0
Year

SURVEILLANCE REPORT Surveillance of food- and waterborne diseases in the EU/EEA
11
cases was reported in Germany (cumulative N=182 254), accounting for 32% of all confirmed cases, followed by
the Czech Republic with 11% (cumulative N=63 028), the United Kingdom with 9% (cumulative N=49 671), and Poland with 7% of all confirmed cases (cumulative N=41 335) (Table 1-4). The highest notification rates – although declining – during the four-year period were reported in 2009 from the Czech Republic (100.1 cases per 100 000 population) and Slovakia (77.3 cases per 100 000 population) (Table 1-4).
Table 1-4. Confirmed non-typhoidal salmonellosis cases and notification rates (per 100 000 population) by country in the EU and EEA, 2006–09
Country
Year
2006 2007 2008 2009
Cases Rate/100 000 Cases Rate/100 000 Cases Rate/100 000 Cases Rate/100 000
Austria 4787 58.0 3386 40.9 2312 27.8 2775 33.2
Belgium 3630 34.5 3915 37.0 3831 35.9 3113 29.2
Bulgaria 1056 13.7 1136 14.8 1516 19.8 1247 16.4
Cyprus 99 12.9 158 20.3 169 21.4 134 16.8
Czech Republic 24186 235.9 17655 171.6 10707 103.1 10480 100.1
Denmark 1662 30.6 1648 30.3 3669 67.0 2130 38.6
Estonia 453 33.7 428 31.9 647 48.2 261 19.5
Finland 2575 49.0 2738 51.9 3126 59.0 2329 43.7
France 6008 9.5 5313 8.4 7186 11.2 7153 11.1
Germany 52575 63.8 55399 67.3 42885 52.2 31395 38.3
Greece 890 8.0 706 6.3 795 7.1 403 3.6
Hungary 9389 93.2 6578 65.3 6637 66.1 5873 58.5
Ireland 420 10.0 440 10.2 447 10.2 335 7.5
Italy 6272 10.7 6731 11.4 6662 11.2 4156 6.9
Latvia 781 34.0 619 27.1 1229 54.1 795 35.2
Lithuania - - 2270 67.1 3308 98.3 2063 61.6
Luxembourg 308 65.7 163 34.2 153 31.6 162 32.8
Malta 63 15.6 85 20.8 161 39.2 126 30.5
Netherlandsa 1644 10.1 1224 11.7 1627 15.5 1205 11.4
Poland 12502 32.8 11155 29.3 9149 24.0 8529 22.4
Portugal 387 3.7 438 4.1 332 3.1 220 2.1
Romania 645 3.0 620 2.9 624 2.9 1105 5.1
Slovakia 8191 152.0 8367 155.1 6849 126.8 4182 77.3
Slovenia - - 1336 66.5 1033 51.4 616 30.3
Spainb 5117 - 3842 - 3833 - 4304 -
Sweden 4056 44.8 3930 43.1 4185 45.6 3054 33.0
United Kingdom 14124 23.4 13557 22.3 11511 18.8 10479 17.1
Total EU 161820 36.4 153837 34.6 134583 30.1 108624 24.3
Iceland 114 38.0 93 30.2 134 42.5 35 11.0
Liechtenstein - - 1 2.8 - - - -
Norway 1813 39.1 1649 35.2 1941 41.0 1235 25.7
Total EU/EEA 163747 36.5 155580 34.6 136658 30.3 109894 24.3
a Population coverage of 64% used in rate calculations
b Population coverage 25%
Altogether, 11 EU countries (41%) reported a significant decrease over the four-year reporting period (Figures 1-2a, b, c) and there is a considerable amount of variation in trends and notification rates between the different countries.
Twelve countries experienced a peak in notification rates in 2008 (Bulgaria, Cyprus, Denmark, Estonia, Finland, Greece, Latvia, the Netherlands, Malta, Sweden, Iceland and Norway) (Figure 1-2).
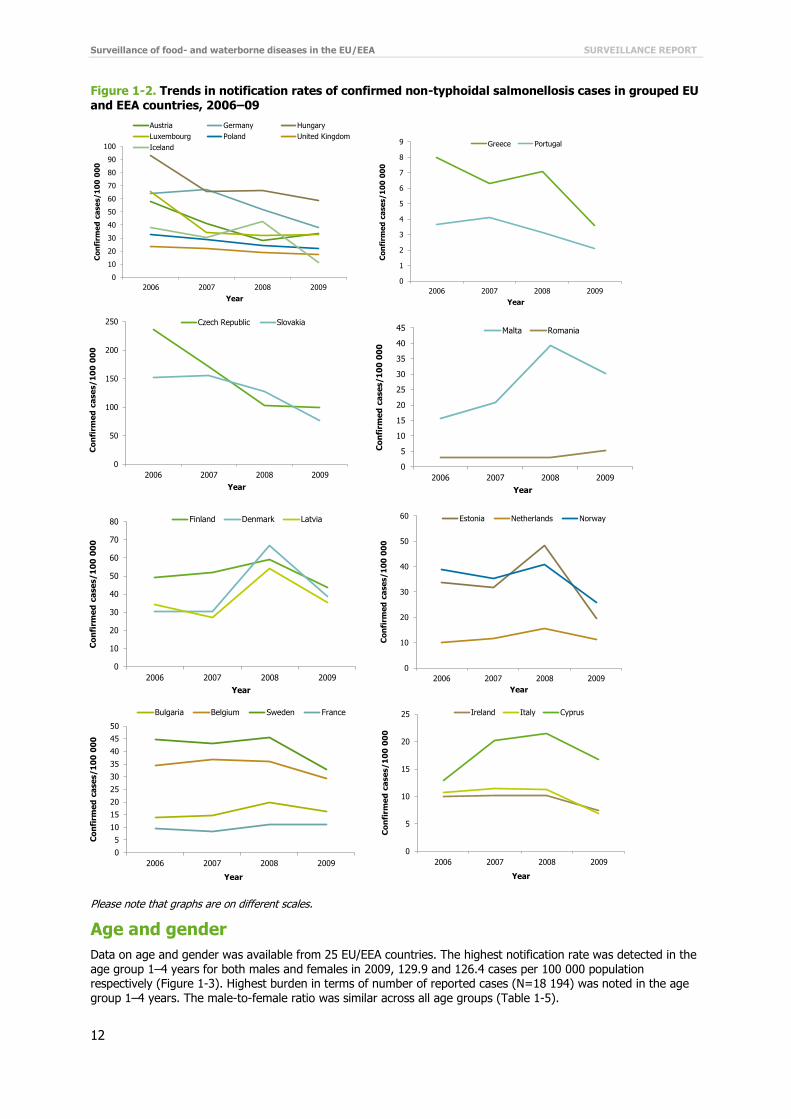
Surveillance of food- and waterborne diseases in the EU/EEA SURVEILLANCE REPORT
12
Figure 1-2. Trends in notification rates of confirmed non-typhoidal salmonellosis cases in grouped EU
and EEA countries, 2006–09
Please note that graphs are on different scales.
Age and gender
Data on age and gender was available from 25 EU/EEA countries. The highest notification rate was detected in the age group 1–4 years for both males and females in 2009, 129.9 and 126.4 cases per 100 000 population respectively (Figure 1-3). Highest burden in terms of number of reported cases (N=18 194) was noted in the age group 1–4 years. The male-to-female ratio was similar across all age groups (Table 1-5).
0
10
20
30
40
50
60
70
80
90
100
2006 2007 2008 2009
Co
nfi
rme
d c
ase
s/1
00
00
0
Year
Austria Germany Hungary
Luxembourg Poland United Kingdom
Iceland
0
1
2
3
4
5
6
7
8
9
2006 2007 2008 2009
Co
nfi
rme
d c
ase
s/1
00
00
0
Year
Greece Portugal
0
50
100
150
200
250
2006 2007 2008 2009
Co
nfi
rme
d c
ase
s/1
00
00
0
Year
Czech Republic Slovakia
0
5
10
15
20
25
30
35
40
45
2006 2007 2008 2009
Co
nfi
rme
d c
ase
s/1
00
00
0
Year
Malta Romania
0
10
20
30
40
50
60
70
80
2006 2007 2008 2009
Co
nfi
rme
d c
ase
s/1
00
00
0
Year
Finland Denmark Latvia
0
10
20
30
40
50
60
2006 2007 2008 2009
Co
nfi
rme
d c
ase
s/1
00
00
0
Year
Estonia Netherlands Norway
0
5
10
15
20
25
30
35
40
45
50
2006 2007 2008 2009
Co
nfi
rme
d c
ase
s/1
00
00
0
Year
Bulgaria Belgium Sweden France
0
5
10
15
20
25
2006 2007 2008 2009
Co
nfi
rme
d c
ase
s/1
00
00
0
Year
Ireland Italy Cyprus

SURVEILLANCE REPORT Surveillance of food- and waterborne diseases in the EU/EEA
13
Figure 1-3. Notification rates of confirmed non-typhoidal salmonellosis cases by age group and
gender, EU/EEA, 2009 (N=90 789)
Source: Austria, Belgium, Cyprus, Czech Republic, Denmark, Estonia, Finland, Germany, Greece, Hungary, Ireland, Italy, Lithuania, Luxembourg, Malta, the Netherlands, Portugal, Romania, Slovakia, Slovenia, Spain, Sweden, United Kingdom; non-EU countries: Iceland and Norway
Table 1-5. Number of confirmed non-typhoidal salmonellosis cases and notification rate by age group and gender, EU/EEA, 2009
2009
Age group Female Male Total
Cases Rate/100 000 Cases Rate/100 000 Cases Rate/100 000
<1 1 799 101.1 2 081 110.9 3 880 106.1
1–4 8 734 126.4 9 460 129.9 18 194 128.2
5–14 7 185 40.9 8 441 45.7 15 626 43.4
15–24 4 792 23.1 5 054 23.3 9 846 23.2
25–44 7 914 15.9 7 625 14.9 15 539 15.4
45–64 8 261 17.7 7 252 16.0 15 513 16.9
≥65 6 774 18.7 5 417 20.6 12 191 19.5
Total 45 459 25.3 45 330 26.4 90 789 25.8
Source: Austria, Belgium, Cyprus, Czech Republic, Denmark, Estonia, Finland, Germany, Greece, Hungary, Ireland, Italy, Lithuania, Luxembourg, Malta, the Netherlands, Portugal, Romania, Slovakia, Slovenia, Spain, Sweden, United Kingdom; non-EU countries: Iceland and Norway
<1 1–4 5–14 15–24 25–44 45–64 ≥65
Male 110.9 129.9 45.7 23.3 14.9 16.0 20.6
Female 101.1 126.4 40.9 23.1 15.9 17.7 18.7
0
20
40
60
80
100
120
140
Co
nfi
rme
d c
ase
s/1
00
00
0
Male
Female

Surveillance of food- and waterborne diseases in the EU/EEA SURVEILLANCE REPORT
14
Figure 1-4. Semi-logarithmic graph showing notification rates of confirmed non-typhoidal
salmonellosis cases by age groups and gender in EU/EEA countries, 2007–09
Source: Austria, Belgium, Cyprus, Czech Republic, Denmark, Estonia, Finland, Germany, Greece, Hungary, Ireland, Italy, Luxembourg, Malta, the Netherlands, Portugal, Slovakia, Slovenia, Spain, Sweden, United Kingdom; non-EU countries: Iceland and Norway
A total of 23 EU/EEA countries provided data on age and gender for the period 2007–09. A decreasing three-year trend was detected in all age groups and for both genders (Figure 1-4).
Salmonella serovars
The 30 most commonly reported Salmonella serovars in EU/EEA countries in 2007–09 are listed in Table 1-6. The three Salmonella serovars at the top of the list through the three-year period from 2007 to 2009 were S. Enteritidis,
S. Typhimurium and S. Infantis (Table 1-6). The two serovars; S. Enteritidis and S. Typhimurium accounted for about 80% of all the reported serovars, with S. Enteritidis amounting to over 50% of the known serovars. The number of S. Enteritidis decreased by 44% whereas S. Infantis cases increased by 10% in 2007–09. The number of reported S. Typhimurium increased by 13% in 2008, but declined in 2009 to the same level as in 2007 (Table 1-6).
S. Virchow, S. Newport and S. Hadar were among the six most commonly reported serovars, responsible for roughly less than 1% of the reported cases each.
Table 1-6. Top 30 Salmonella serovars in confirmed non-typhoidal salmonellosis casesa in EU/EEA countries, 2007–09
2007 2008 2009
Serovar N % Serovar N % Serovar N %
Enteritidis 83 294 65.2 Enteritidis 63 432 56.8 Enteritidis 46 544 51.6
Typhimurium 23 537 18.4 Typhimurium 26 543 23.8 Typhimurium 23 257 25.8
Infantis 1 481 1.2 Infantis 1 378 1.2 Infantis 1 632 1.8
Virchow 1 178 0.9 Virchow 935 0.8 Newport 788 0.9
Newport 833 0.7 Newport 838 0.7 Virchow 774 0.9
Stanley 673 0.5 Agona 688 0.6 Derby 675 0.7
Derby 597 0.5 Derby 662 0.6 Hadar 513 0.6
Hadar 579 0.5 Stanley 619 0.6 Saintpaul 473 0.5
Agona 444 0.3 Hadar 545 0.5 Kentucky 469 0.5
Kentucky 443 0.3 Kentucky 518 0.5 Stanley 456 0.5
Java 396 0.3 Bovismorbificans 512 0.5 Bovismorbificans 440 0.5
Saintpaul 395 0.3 Saintpaul 444 0.4 Agona 385 0.4
Braenderup 394 0.3 Corvallis 400 0.4 Corvallis 360 0.4
Montevideo 392 0.3 Anatum 379 0.3 Goldcoast 314 0.3
Schwarzengrund 348 0.3 Brandenburg 358 0.3 Napoli 297 0.3
Anatum 305 0.2 Montevideo 326 0.3 Brandenburg 285 0.3
Bovismorbificans 291 0.2 Panama 324 0.3 Rissen 268 0.3
1
10
100
2007 2008 2009
Co
nfi
rme
d c
ase
s/1
00
00
0
Year
Males (N=159 823)
<1
1–4
5–14
15–24
25–44
45–64
≥65
1
10
100
2007 2008 2009
Co
nfi
rme
d c
ase
s/1
00
00
0
Year
Females (N=196 986)
<1
1–4
5–14
15–24
25–44
45–64
≥65
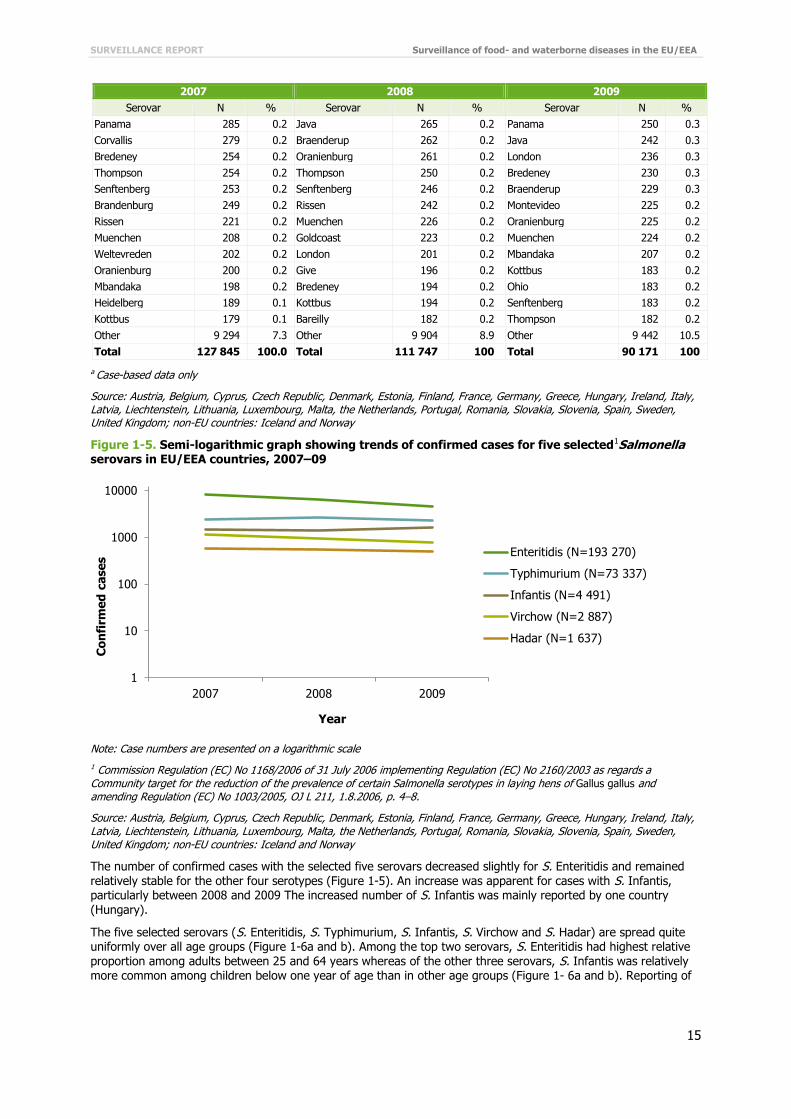
SURVEILLANCE REPORT Surveillance of food- and waterborne diseases in the EU/EEA
15
2007 2008 2009
Serovar N % Serovar N % Serovar N %
Panama 285 0.2 Java 265 0.2 Panama 250 0.3
Corvallis 279 0.2 Braenderup 262 0.2 Java 242 0.3
Bredeney 254 0.2 Oranienburg 261 0.2 London 236 0.3
Thompson 254 0.2 Thompson 250 0.2 Bredeney 230 0.3
Senftenberg 253 0.2 Senftenberg 246 0.2 Braenderup 229 0.3
Brandenburg 249 0.2 Rissen 242 0.2 Montevideo 225 0.2
Rissen 221 0.2 Muenchen 226 0.2 Oranienburg 225 0.2
Muenchen 208 0.2 Goldcoast 223 0.2 Muenchen 224 0.2
Weltevreden 202 0.2 London 201 0.2 Mbandaka 207 0.2
Oranienburg 200 0.2 Give 196 0.2 Kottbus 183 0.2
Mbandaka 198 0.2 Bredeney 194 0.2 Ohio 183 0.2
Heidelberg 189 0.1 Kottbus 194 0.2 Senftenberg 183 0.2
Kottbus 179 0.1 Bareilly 182 0.2 Thompson 182 0.2
Other 9 294 7.3 Other 9 904 8.9 Other 9 442 10.5
Total 127 845 100.0 Total 111 747 100 Total 90 171 100
a Case-based data only
Source: Austria, Belgium, Cyprus, Czech Republic, Denmark, Estonia, Finland, France, Germany, Greece, Hungary, Ireland, Italy, Latvia, Liechtenstein, Lithuania, Luxembourg, Malta, the Netherlands, Portugal, Romania, Slovakia, Slovenia, Spain, Sweden, United Kingdom; non-EU countries: Iceland and Norway
Figure 1-5. Semi-logarithmic graph showing trends of confirmed cases for five selected1Salmonella serovars in EU/EEA countries, 2007–09
Note: Case numbers are presented on a logarithmic scale
1 Commission Regulation (EC) No 1168/2006 of 31 July 2006 implementing Regulation (EC) No 2160/2003 as regards a Community target for the reduction of the prevalence of certain Salmonella serotypes in laying hens of Gallus gallus and amending Regulation (EC) No 1003/2005, OJ L 211, 1.8.2006, p. 4–8.
Source: Austria, Belgium, Cyprus, Czech Republic, Denmark, Estonia, Finland, France, Germany, Greece, Hungary, Ireland, Italy, Latvia, Liechtenstein, Lithuania, Luxembourg, Malta, the Netherlands, Portugal, Romania, Slovakia, Slovenia, Spain, Sweden, United Kingdom; non-EU countries: Iceland and Norway
The number of confirmed cases with the selected five serovars decreased slightly for S. Enteritidis and remained relatively stable for the other four serotypes (Figure 1-5). An increase was apparent for cases with S. Infantis, particularly between 2008 and 2009 The increased number of S. Infantis was mainly reported by one country (Hungary).
The five selected serovars (S. Enteritidis, S. Typhimurium, S. Infantis, S. Virchow and S. Hadar) are spread quite uniformly over all age groups (Figure 1-6a and b). Among the top two serovars, S. Enteritidis had highest relative proportion among adults between 25 and 64 years whereas of the other three serovars, S. Infantis was relatively more common among children below one year of age than in other age groups (Figure 1- 6a and b). Reporting of
1
10
100
1000
10000
2007 2008 2009
Co
nfi
rme
d c
ase
s
Year
Enteritidis (N=193 270)
Typhimurium (N=73 337)
Infantis (N=4 491)
Virchow (N=2 887)
Hadar (N=1 637)

Surveillance of food- and waterborne diseases in the EU/EEA SURVEILLANCE REPORT
16
different serovars is considerable complete and the proportion of unknown serovars was low, less than 7%, for
Salmonella.
Figure 1-6a and b. Relative distribution of selected non-typhoidal Salmonella serovars by age groups, EU/EEA, 2007–09
Source: Austria, Belgium, Cyprus, Czech Republic, Denmark, Estonia, Finland, Germany, Greece, Hungary, Ireland, Italy, Latvia, Lithuania, Luxembourg, Malta, the Netherlands, Portugal, Romania, Slovakia, Slovenia, Spain, Sweden, United Kingdom; non-EU countries: Iceland and Norway
Seasonality
Seasonality was analysed for the six most common serovars: S. Enteritidis, S. Typhimurium, S. Infantis, S. Virchow, S. Newport and S. Hadar (Figure 1-7). The serovars of S. Enteritidis, S. Typhimurium, and S. Infantis showed some seasonality, with an increase in reported cases starting between May and June and lasting to September/October. S. Newport showed a clear peak in reported numbers in October. Cases of S. Hadar were more balanced throughout the year, with only two minor peaks in spring and late summer (Figure 1-7).
0%
20%
40%
60%
80%
100%
<1 1–4 5–14 15–24 25–44 45–64 ≥65
Age group
N=(9 008) (54 269) (48 039) (26 325) (42 617) (41 208) (32 627)
Enteritidis (N=188 525) Typhimurium (N=65 559)
0%
20%
40%
60%
80%
100%
<1 1–4 5–14 15–24 25–44 45–64 ≥65
Age group
N=(616) (996) (577) (993) (1 952) (1 651) (1 145)
Infantis (N=4 087) Virchow (N=2 624) Hadar (N=1 219)

SURVEILLANCE REPORT Surveillance of food- and waterborne diseases in the EU/EEA
17
Figure 1-7. Number of the six most commonly reported non-typhoidal Salmonella serovars by month,
EU/EEA, 2007–09
Source: Austria, Belgium, Cyprus, Czech Republic, Denmark, Estonia, Finland, France, Germany, Greece, Hungary, Iceland, Ireland, Italy, Latvia, Lithuania, Luxembourg, Malta, the Netherlands, Norway, Portugal, Romania, Slovakia, Slovenia, Spain, Sweden, United Kingdom; non-EU countries: Iceland, Liechtenstein, and Norway.
Travel-related (non-typhoidal) salmonellosis
Within the three-year period 2007–09, 38 510 cases were reported as imported from other countries, representing 14% of cases with known history of travelling (N=275 825, pooled data). Between 2007 and 2009, the probable country of infection of travel-related salmonellosis was indicated for 33 392 cases, of which 73% (23 853 cases) were acquired in non-EU countries and 27% (9 539 cases) originated from another EU/EEA country (Figure 1-8).
0
2000
4000
6000
8000
10000
12000
14000
Jan Feb Mar Apr May June Jul Aug Sep Oct Nov Dec
Co
nfi
rme
d c
ase
s
Month
Enteritidis (N=185 897)
Min Median Max
0
500
1000
1500
2000
2500
3000
Jan Feb Mar Apr May Jun Jul Aug Sep Oct Nov Dec
Co
nfi
rme
d c
ase
s
Month
Typhimurium (N=69 500)
Min Median Max
0
50
100
150
200
250
Jan Feb Mar Apr May Jun Jul Aug Sep Oct Nov Dec
Co
nfi
rme
d c
ase
s
Month
Infantis (N=4 372)
Min Median Max
0
20
40
60
80
100
120
140
160
Jan Feb Mar Apr May Jun Jul Aug Sep Oct Nov Dec
Co
nfi
rme
d c
ase
s
Month
Virchow (N=2 842)
Min Median Max
0
20
40
60
80
100
120
140
Jan Feb Mar Apr May Jun Jul Aug Sep Oct Nov Dec
Co
nfi
rme
d c
ase
s
Month
Newport (N=2 413)
Min Median Max
0
20
40
60
80
Jan Feb Mar Apr May Jun Jul Aug Sep Oct Nov Dec
Co
nfi
rme
d c
ase
s
Month
Hadar (N=1 608)
Min Median Max

Surveillance of food- and waterborne diseases in the EU/EEA SURVEILLANCE REPORT
18
Figure 1-8. Origin of travel-related non-typhoidal salmonellosis cases as reported by EU/EEA
countries, 2007–09 (cumulative N=33 392)
Source: Austria, Cyprus, Czech Republic, Denmark, Estonia, Finland, Germany, Greece, Hungary, Ireland, Latvia, Luxembourg, Malta, the Netherlands, Portugal, Slovakia, Spain, Sweden, United Kingdom; non-EU countries: Iceland and Norway
Thailand (N=6 380), Turkey (N=3 692) and Egypt (N=2 701) were the most commonly reported non-EU countries of origin for Salmonella infections, accounting for 38% of all imported cases with known travel destination in 2007–09.
Severity
The severity of salmonellosis was evaluated by looking at the incidence of hospitalisation and the case-fatality rate. Hospitalisation data were included in the EU-level salmonellosis surveillance for the first time in 2009. The unknown proportion was high for the first year; data were only available for about 7% of all cases reported in the EU/EEA in 2009. Seven countries (Estonia, Hungary, Ireland, the Netherlands, Portugal, United Kingdom and Norway) reported hospitalisation data in 2009, and the proportion of known data ranged from 33% to 100%. Hungary, Norway and Portugal provided hospitalisation data for over 95% of the cases; 38% of the cases with non-typhoidal salmonellosis infection (N=2 751/7 328) were hospitalised.
Table 1-7. Number of deaths due to non-typhoidal Salmonella infection and respective case-fatality rate by age groups in EU/EEA countries, 2007–09
2007 2008 2009
Age group Cases Number of
deaths Case
fatality Cases Number of
deaths Case
fatality Cases Number
of deaths Case
fatality
<1 34 85 0 0.00% 2 637 3 0.11% 2 299 1 0.04%
1–24 45 989 3 0.01% 35 178 2 0.01% 26 562 1 0.00%
25–44 16 175 2 0.01% 12 105 0 0.00% 8 593 3 0.03%
45–64 14 663 13 0.09% 11 541 7 0.06% 8 783 4 0.05%
≥65 12 717 62 0.49% 10 387 54 0.52% 7 750 35 0.45%
Total 93 029 80 0.09% 71 848 67 0.09% 53 987 44 0.08%
Source: Austria, Cyprus, Czech Republic, Estonia, Germany, Hungary, Ireland, Latvia, Liechtenstein, Malta, the Netherlands, Portugal, Romania, Slovakia, United Kingdom; non-EU countries: Iceland, Norway.
Sixteen countries provided data on outcome. The proportion of unknown data (including missing data) ranged from 34% in 2007 to 46% in 2009. Based on known data only, the proportion of deaths is very small among salmonellosis cases (< 0.1%) (Table 1-7).
Case fatality by age groups showed low percentages (below 0.1%) but the case fatality in the elderly group (over 65 years) was five to nine times higher than in adults between 45 and 64 years (Table 1-7).
27%
73%
EU/EEA countries (N=9 539)
Non-EU/EEA countries (N=23 853)

SURVEILLANCE REPORT Surveillance of food- and waterborne diseases in the EU/EEA
19
Discussion
Salmonellosis showed a significant, steadily decreasing four-year trend in the EU/EEA countries from 2006 to 2009. More than 40% of the countries reported significantly declining four-year trend, suggesting a positive public health impact due to various EU-level prevention and control measures. The reduction in salmonellosis was most evident among cases of S. Enteritidis. In 2007, Member States were obliged for the first time to implement new Salmonella control programmes in poultry farming to meet new reduction targets (less than 1% for the five most important Salmonella serovars, i.e. S. Enteritidis, S. Typhimurium, S. Infantis, S. Virchow and S. Hadar). The data suggest that the Salmonella control programmes in poultry had a positive impact on public health by reducing the number of human salmonellosis cases, especially infections caused by S. Enteritidis serovar, whose main reservoirs are eggs and poultry products. Between 2007 and 2009, the serotype S. Enteritidis declined by 44% (over 35 000 cases).
As in previously reported surveillance data, the highest notification rate was detected in children between 1 and 4 years of age, followed by newborns (<1 year). This is most likely due to the fact that parents are more likely to seek medical attention if young children show gastrointestinal symptoms and paediatricians are more likely to submit a sample for culture. The highest burden of notified cases was reported in the age group 1–4 years.
However, the notification rate decreased in all age groups, especially for children aged 1–14 years and newborns.
S. Enteritidis, S. Typhimurium and S. Infantis were the three most commonly reported Salmonella serotypes. S. Enteritidis alone accounted for about 50% of all reported cases; S. Typhimurium and S. Enteritidis made up over 80% of all reported serovars. In order to find out which S. Typhimurium and other serotypes are monophasic Salmonella enterica 1,4,[5],12:i:-, the full antigenic formula needs to be considered. Before a separate serotype code for monophasic S. Typhimurium was introduced in 2010 to harmonise reporting, the antigenic formula was provided for only 12% of all reported Salmonella serotypes (S. Typhimurium: 15%). Because of the low number of reported cases with known data, the antigenic formula was not analysed separately for this report. The three most common serovars, S. Enteritidis, S. Typhimurium and S. Infantis were spread across all age groups, but in children less than one year of age, S. Infantis had the highest notification rate. Salmonella showed clear seasonality, with a noticeable increase of reported cases in the summer months.
The three-year pooled data (2007–09) suggests that salmonellosis is mainly acquired domestically, as only 14% of cases were reported as travel related. Among travellers, the infection is mostly contracted in non-EU countries. About 40% of salmonellosis cases with known data required hospital care and 27% of all cases occurred in children between 1 and 4 years. However, data were reported only by a limited number of countries, and due to the extremely high proportion of cases with unknown data (>93%), the interpretation of the hospitalised proportion of salmonellosis is not reliable. Non-typhoidal salmonellosis had a low case-fatality rate (<0.1% in the three-year period 2007–09), but the risk of death increased noticeably after the age of 65 years.
Despite the continuous decrease of salmonellosis in the EU/EEA, Salmonella was the most frequently detected cause of foodborne outbreaks in 2006–09, both nationally and internationally [1-4]. Each year, almost all Member States (over 80%) reported Salmonella outbreaks. The four most commonly reported food vehicles in Salmonella outbreaks from 2006 to 2009 were eggs and egg products (41%), bakery products (12%), mixed or buffet meals (6%) and pork meat or products thereof (6%) [1-4].
In 2006, 3 131 outbreaks with 22 705 cases were reported in the EU/EEA countries [1]. This represents over 50% of all the reported foodborne outbreaks in 2006. All Member States except Cyprus, Luxembourg and Malta reported Salmonella outbreaks. The largest and most severe Salmonella outbreak was reported in Hungary and caused by S. Enteritidis from a layer cake. In this outbreak, 418 people were affected, of whom 25% were hospitalised; four persons died [1]. Large outbreaks were also reported in Germany, Belgium, Sweden, Latvia, United Kingdom,
Switzerland and Norway [1].
In 2007, 2 201 Salmonella outbreaks were reported in the EU. Of these, 590 were verified outbreaks (EFSA definition) with a total if 8 922 cases, which constituted about 40% of all cases from reported foodborne outbreaks [2]. In 2007, Salmonella cases peaked in Cyprus and Portugal and increased in Belgium and Germany. Several Salmonella outbreaks were reported in Germany [2].
In 2007, the largest outbreak due to S. Enteritidis was reported from Slovenia in a home for the elderly, where 420 of 580 inhabitants were infected (attack rate 72%); 39 were hospitalised and five people died [2]. The implicated foodstuff was a salad of string beans, probably cross-contaminated from meat. The Netherlands reported a large outbreak caused by S. Typhimurium; 225 human cases were identified, of which 62 were hospitalised [2]. A cheese produced at a local farm was confirmed as the source of infection. Three Nordic countries, Denmark, Finland and Norway, were affected by an outbreak with S. Weltevreden [5]; a total of 45 people became infected: 27 in Norway, 19 in Denmark, and eight in Finland. The outbreak was traced back to alfalfa sprouts. In Sweden, 179 Salmonella cases were reported from baby spinach [2]. An outbreak of S. Senftenberg affecting the United Kingdom (England and Wales), Scotland, Denmark, the Netherlands and the United States, occurred in 2007, and

Surveillance of food- and waterborne diseases in the EU/EEA SURVEILLANCE REPORT
20
was associated with contaminated pre-packaged, fresh basil [6]. A total of 41 cases was reported, most of them
(61%; 25 cases) in the UK.
In 2008, 1 888 Salmonella outbreaks (490 verified outbreaks with a total of 7 724 cases) were reported in EU/EEA countries [3]. This represents about 35% of all reported outbreaks in 2008. Compared with the previous year, the number of outbreaks decreased, most notably Salmonella outbreaks in Austria, Germany, Hungary, and Poland. Twelve countries experienced a peak in notification rates in 2008 (Bulgaria, Cyprus, Denmark, Estonia, Finland, Greece, Latvia, the Netherlands, Malta, Sweden, Iceland and Norway). In Denmark, the largest salmonellosis outbreak ever occurred in 2008, with S Typhimurium PT U292 [7]. A total of 1 054 Danish cases were linked to the outbreak; a few cases were also identified in other countries in people returning from Denmark. The source was not established, but the main hypothesis was that the outbreak originated from a pig reservoir in a series of different foodstuffs. This outbreak accounts for about 50 per cent of the increase of S. Typhimurium in 2008. In the same year, a large outbreak of S. Agona occurred, with over 160 cases affecting mainly Ireland and the UK, including one confirmed case in Finland. The outbreak was associated with contaminated cooked meat products exported to several European countries [8]. In Switzerland, a nationwide outbreak was caused by S. Typhimurium [9]. In total, 150 cases were infected. Pork or pork products were probably responsible for the infections. The Czech Republic reported a foodborne outbreak of S. Enteritidis in a residential home for people with disabilities,
affecting 102 people, of whom 16 were hospitalised and one died. The implicated foodstuff was eggs [3].
In 2009, altogether 1 434 outbreaks, and of these 324 verified with 4 500 cases, were reported by the EU/EEA countries [4]. This represents about 31% of all reported outbreaks in 2009. The notification rate peaked in Spain and Romania in 2009. An extensive outbreak of S. Goldcoast involved six EU/EEA countries (Denmark, Hungary, Italy, Spain, United Kingdom and Norway) with a total of 148 cases [10, 11]. The outbreak evolved into two branches – one travel-related and one possibly linked to pig trade through a variety of pork products. Another large multinational outbreak with S. Typhimurium DT191a was identified in 2009, with over 200 cases in the UK and more than 30 cases in the US, where the outbreak continued into 2010 [12]. The source was frozen feeder mice for reptiles imported from the US.
The lower numbers of salmonellosis cases in humans seems to be mainly related to successful Salmonella control programmes in poultry populations. The number of reported foodborne outbreaks caused by Salmonella in the EU/EEA also decreased. This decline was particularly noticeable in the lower number of outbreaks caused by egg and egg products, bakery products, mixed food and different types of meats [1-4].

SURVEILLANCE REPORT Surveillance of food- and waterborne diseases in the EU/EEA
21
References
1. European Food Safety Authority (EFSA) and European Centre for Disease Prevention and Control (ECDC). The community summary report on trends and sources of zoonoses, zoonotic agents, antimicrobial resistance and foodborne outbreaks in the European Union in 2006. EFSA Journal 2007;130,2-352.
2. European Food Safety Authority (EFSA) and European Centre for Disease Prevention and Control (ECDC). The community summary report on food-borne outbreaks in the European Union in 2007. EFSA Journal 2009; 271,129 pp.
3. European Food Safety Authority (EFSA) and European Centre for Disease Prevention and Control (ECDC). The community summary report on trends and sources of zoonoses, zoonotic agents and food-borne outbreaks in the European Union in 2008. EFSA Journal 2010; 8(1),410 pp.
4. European Food Safety Authority (EFSA) and European Centre for Disease Prevention and Control (ECDC). The European Union summary report on trends and sources of zoonoses, zoonotic agents and food-borne outbreaks in 2009. EFSA Journal 2011;9(3),378 pp.
5. Emberland KE, Ethelberg S, Kuusi M, Vold L, Jensvoll L, Lindstedt BA, et al. Outbreak of Salmonella Weltevreden infections in Norway, Denmark and Finland associated with alfalfa sprouts, July-October 2007. Euro Surveill. 2007 Nov;12(11):E071129 4.
6. Pezzoli L, Elson R, Little CL, Yip H, Fisher I, Yishai R, et al. Packed with Salmonella – investigation of an international outbreak of Salmonella Senftenberg infection linked to contamination of pre-packed basil in 2007. Foodborne Pathog Dis. 2008 Oct;5(5):661-8.
7. Ethelberg S, Wingstrand A, Jensen T, Sorensen G, Muller L, Lisby M, et al. Large outbreaks of Salmonella Typhimurium infection in Denmark in 2008. Euro Surveill. 2008 Oct 30;13(44):pii: 19023.
8. O'Flanagan D, Cormican M, McKeown P, Nicolay N, Cowden J, Mason B, et al. A multi-country outbreak of Salmonella Agona, February - August 2008. Euro Surveill. 2008 Aug 14;13(33).
9. Schmid H, Hachler H, Stephan R, Baumgartner A, Boubaker K. Outbreak of Salmonella enterica serovar Typhimurium in Switzerland, May–June 2008, implications for production and control of meat preparations. Euro Surveill. 2008 Oct 30;13(44):pii: 19020.
10. European Centre for Disease Prevention and Control (ECDC). Surveillance Report – Annual Threat Report 2009 ECDC 2009; 32 pp.
11. Ethelberg S, Muller L, Torpdahl M, Møller-Nielsen E, Lenglet A, Gossner C, et al. European investigation into unusual multi-state increase of Salmonella Goldcoast infections, 2009 Poster Session ESCAIDE 2010 [Abstract]. 2010.
12. Harker KS, Lane C, E DEP, Adak GK. An outbreak of Salmonella Typhimurium DT191a associated with reptile feeder mice. Epidemiol Infect. 2010 Oct 14:1-8.

Surveillance of food- and waterborne diseases in the EU/EEA SURVEILLANCE REPORT
22
2 Campylobacteriosis in the EU/EEA, 2006–09
Campylobacteriosis
Campylobacteriosis is a diarrhoeal disease caused by bacteria of the genus Campylobacter. It is the leading cause of reported gastrointestinal infections in the EU. In foodborne infections, the most commonly reported species are C. jejuni , followed by C. coli and C. lari. Adults are the most affected group, but the highest notification rate is seen in young children. Most infections are reported in the summer.
The symptoms of campylobacteriosis usually develop after an incubation period of 2–5 days and are manifested by severe abdominal pain, watery or bloody diarrhoea, and fever. Symptoms last from a few days up to two weeks, and the illness is usually self-limiting. Occasionally, symptoms may persist and require hospital care. Infection has been associated with complications such as joint inflammation (5–10% of cases) and, on rare occasions, Guillain–
Barré syndrome, a temporary but severe paralysis that may result in death.
The infective dose of bacteria is very small and the infection is most commonly acquired through the consumption of contaminated food (especially raw or undercooked poultry, raw milk) or contaminated drinking water. Other risk factors include swimming in natural surface waters and direct contact with farm animals and infected pets.
More information on campylobacteriosis can be found at the ECDC website: http://ecdc.europa.eu/en/healthtopics/Campylobacteriosis/Pages/index.aspx
Surveillance of campylobacteriosis in the EU/EEA in 2006–09
Since 2008, ECDC has been coordinating the European surveillance of campylobacteriosis, in close collaboration with a network of nominated experts, epidemiologists and microbiologists from EU/EEA countries and as part of the Food- and Waterborne Diseases and Zoonoses (FWD) network.
The scope of campylobacteriosis surveillance is determined by the general surveillance objectives for food- and waterborne diseases (see Introduction), in combination with the EU case definition for campylobacteriosis (see Annex).
After discussions with the European Food- and Waterborne Diseases and Zoonoses Network it was decided to strengthen campylobacteriosis surveillance by:
reviewing the laboratory culture and identification methods in the EU; and reviewing data reporting and analysis.
The surveillance of campylobacteriosis through The European Surveillance System (TESSy) currently features the standard reporting of cases and includes data on species. The next step will be to harmonise the monitoring of antimicrobial resistance in human Campylobacter strains, in line with the EU-level monitoring of resistance in isolates from animal and food.
In 2009, the reporting of campylobacteriosis covered 33 variables, 18 of which were common variables for all diseases, 15 were specific to Campylobacter. The common variables are presented in Table 1; Campylobacter-specific variables are presented below in Table 2-1.
Table 2-1. Enhanced epidemiological dataset Shiga toxin/verotoxin, collected for campylobacteriosis cases, EU/EEA, 2006–09
Variable Description in TESSy
DateOfReceiptReferenceLab Date of receipt in reference laboratory
DateOfReceiptSourceLab Date (YYYY-MM-DD or YYYY-Www or YYYY-MM or YYYY-Qq or YYYY), UNK.
Hospitalisationa Hospitalisation of a case due to the cause of the disease
Imported Having been outside the country of notification during the incubation period of the reported disease
Pathogen Species or genus of the pathogen which is the cause of the reported disease
Probable country of infection If Imported=Yes: one entry for each country/region visited during the incubation period of the disease. The variable is repeatable in case several countries/regions were visited.

SURVEILLANCE REPORT Surveillance of food- and waterborne diseases in the EU/EEA
23
Variable Description in TESSy
SIR_AMC, SIR_AMP, SIR_CIP, SIR_ERY, SIR_GEN, SIR_NAL, SIR_TCY
Susceptibility to seven different antibiotics (amoxicillin/clavulanic acid, ampicillin, ciprofloxacin, erythromycin, gentamicin, nalidixic acid, tetracyclines)
Suspected vehicle Suspected vehicle or source of infection
Transmission Suspected main mode of transmission
a Variable added in 2010 for 2009 reporting
National surveillance systems for campylobacteriosis
Table 2-2. Notification systems for human campylobacteriosis cases, EU/EEA, 2009
Country Notifiable since Legal
charactera Case based/ aggregatedb
National coveragec
Changes in surveillance system in 2006–09
Austria 1947 Cp C Y 2009: introduction of the electronic Epidemic Reporting System (EMS)
Belgium 2000 V C Y -d
Bulgaria Yes Cp A Y -
Cyprus 2005 Cp C Y -
Czech Republic Yes Cp C Y -
Denmark 1979 Cp C Y -
Estonia 1988 Cp C Y -
Finland 1995 Cp C Y -
France 2002 V C N -
Germany 2001 Cp C Y -
Greece - - - - -
Hungary 1998 Cp C Y -
Ireland 2004 Cp C Y -
Italy 1990 V C - No changes
Latvia 1999 Cp C Y -
Lithuania 1990 Cp C Y -
Luxembourg 2004 Cp+V C Y Since 2009, reported cases have included laboratory data (voluntary), in addition to cases reported by physicians
(compulsory)
Malta Yes Cp C Y -
Netherlands Yes V C N -
Poland 2004 Cp C Y -
Portugal - - - - -
Romania Yes Cp C Y -
Slovakia 1980 Cp C Y No changes
Slovenia 1987 Cp C Y -
Spain 1989 V C N -
Sweden 1978 Cp C Y -
United Kingdom No O C Y -
Iceland Yes Cp C Y -
Liechtenstein Yes - - - -
Norway 1991 Cp C Y -
a Legal character: Cp=compulsory, V=voluntary, O=other
b C=case based, A=aggregated
c National coverage Y=yes, N=no
d No data provided
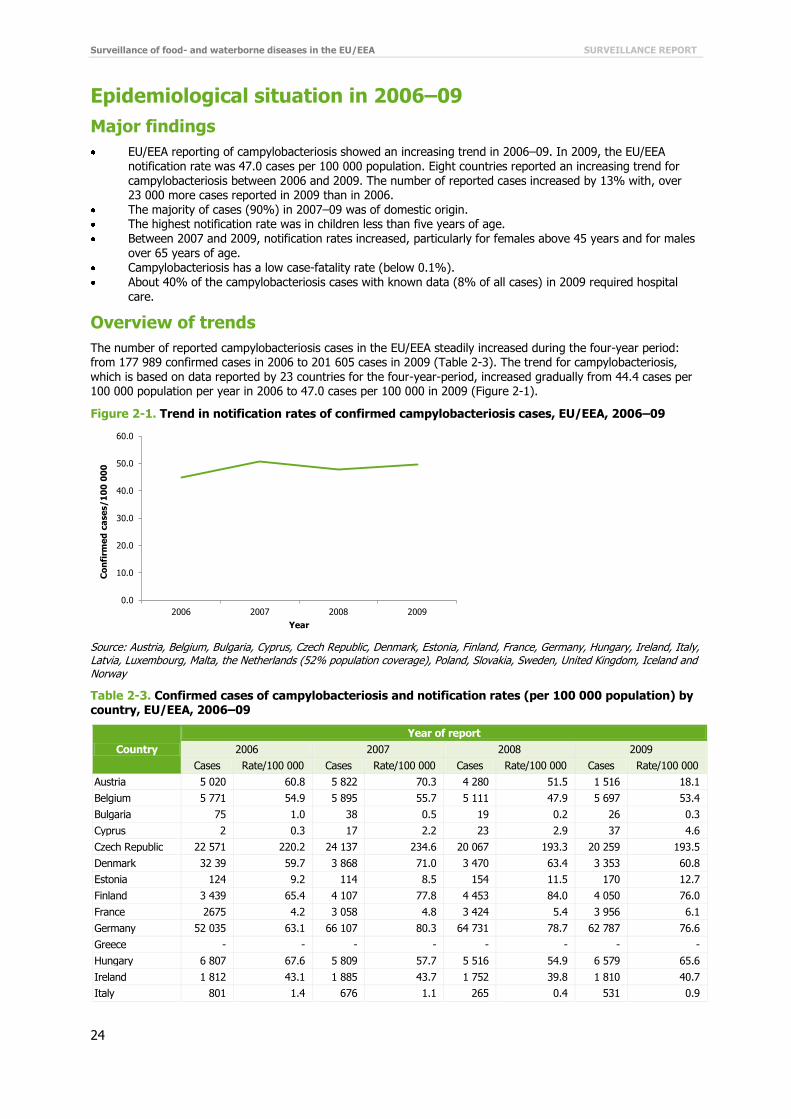
Surveillance of food- and waterborne diseases in the EU/EEA SURVEILLANCE REPORT
24
Epidemiological situation in 2006–09
Major findings
EU/EEA reporting of campylobacteriosis showed an increasing trend in 2006–09. In 2009, the EU/EEA notification rate was 47.0 cases per 100 000 population. Eight countries reported an increasing trend for campylobacteriosis between 2006 and 2009. The number of reported cases increased by 13% with, over 23 000 more cases reported in 2009 than in 2006.
The majority of cases (90%) in 2007–09 was of domestic origin. The highest notification rate was in children less than five years of age. Between 2007 and 2009, notification rates increased, particularly for females above 45 years and for males
over 65 years of age. Campylobacteriosis has a low case-fatality rate (below 0.1%). About 40% of the campylobacteriosis cases with known data (8% of all cases) in 2009 required hospital
care.
Overview of trends
The number of reported campylobacteriosis cases in the EU/EEA steadily increased during the four-year period: from 177 989 confirmed cases in 2006 to 201 605 cases in 2009 (Table 2-3). The trend for campylobacteriosis, which is based on data reported by 23 countries for the four-year-period, increased gradually from 44.4 cases per 100 000 population per year in 2006 to 47.0 cases per 100 000 in 2009 (Figure 2-1).
Figure 2-1. Trend in notification rates of confirmed campylobacteriosis cases, EU/EEA, 2006–09
Source: Austria, Belgium, Bulgaria, Cyprus, Czech Republic, Denmark, Estonia, Finland, France, Germany, Hungary, Ireland, Italy, Latvia, Luxembourg, Malta, the Netherlands (52% population coverage), Poland, Slovakia, Sweden, United Kingdom, Iceland and Norway
Table 2-3. Confirmed cases of campylobacteriosis and notification rates (per 100 000 population) by country, EU/EEA, 2006–09
Country
Year of report
2006 2007 2008 2009
Cases Rate/100 000 Cases Rate/100 000 Cases Rate/100 000 Cases Rate/100 000
Austria 5 020 60.8 5 822 70.3 4 280 51.5 1 516 18.1
Belgium 5 771 54.9 5 895 55.7 5 111 47.9 5 697 53.4
Bulgaria 75 1.0 38 0.5 19 0.2 26 0.3
Cyprus 2 0.3 17 2.2 23 2.9 37 4.6
Czech Republic 22 571 220.2 24 137 234.6 20 067 193.3 20 259 193.5
Denmark 32 39 59.7 3 868 71.0 3 470 63.4 3 353 60.8
Estonia 124 9.2 114 8.5 154 11.5 170 12.7
Finland 3 439 65.4 4 107 77.8 4 453 84.0 4 050 76.0
France 2675 4.2 3 058 4.8 3 424 5.4 3 956 6.1
Germany 52 035 63.1 66 107 80.3 64 731 78.7 62 787 76.6
Greece - - - - - - - -
Hungary 6 807 67.6 5 809 57.7 5 516 54.9 6 579 65.6
Ireland 1 812 43.1 1 885 43.7 1 752 39.8 1 810 40.7
Italy 801 1.4 676 1.1 265 0.4 531 0.9
0.0
10.0
20.0
30.0
40.0
50.0
60.0
2006 2007 2008 2009
Co
nfi
rme
d c
ase
s/1
00
00
0
Year

SURVEILLANCE REPORT Surveillance of food- and waterborne diseases in the EU/EEA
25
Country
Year of report
2006 2007 2008 2009
Cases Rate/100 000 Cases Rate/100 000 Cases Rate/100 000 Cases Rate/100 000
Latvia 0 0.0 0 0.0 0 0.0 0 0.0
Lithuania 0 0.0 564 16.7 762 22.6 812 24.2
Luxembourg 285 60.8 345 72.5 439 90.7 523 106.0
Malta 54 13.3 91 22.3 77 18.8 132 31.9
Netherlandsa 3 186 19.5 3 289 20.1 3 341 20.4 3 739 22.7
Poland 156 0.4 192 0.5 270 0.7 360 0.9
Portugal - - - - - - - -
Romania - - 0 0.0 2 0.0 254 1.2
Slovakia 2 728 50.6 3 380 62.7 3 064 56.7 3 813 70.5
Slovenia - - 1 127 56.1 898 44.7 952 46.8
Spainb 5 883 13.4 5 331 12.0 5 160 11.4 5 106 11.1
Sweden 6 078 67.2 7 106 78.0 7 692 83.8 7178 77.5
United Kingdom 52 543 87.0 57 849 95.2 55 609 90.9 65 043 106.3
Iceland 117 39.0 93 30.2 98 31.1 74 23.2
Liechtenstein - - 0 0.0 2 5.7 - -
Norway 2 588 55.8 2 836 60.6 2 875 60.7 2 848 59.3
Total EU/EEA 177 989 44.7 202 045 50.6 191 890 47.9 199 587 49.7
a Population coverage of 52% used for rate calculations
b Population coverage is 25%
Of the 26 EU and two EEA countries, the highest burden of campylobacteriosis cases in 2006–09 was recorded in Germany (cumulative N=245 660), accounting for 32% of all reported cases (N=776 884), followed by the United Kingdom with 30% (cumulative N=231 044) and the Czech Republic with 11% (cumulative N=87 034) of all cases. The highest notification rates were reported by the Czech Republic, where the notification rate peaked to 234.6 cases per 100 000 in 2007 and decreased to 193.5 cases per 100 000 in 2009.
Figure 2-2. Trends in notification rates of confirmed campylobacteriosis cases in grouped EU/EEA countries, 2006–09
0
50
100
150
200
250
2006 2007 2008 2009
Co
nfi
rme
d c
ase
s/1
00
00
0
Year
Czech Republic
0
5
10
15
20
25
30
35
2006 2007 2008 2009
Co
nfi
rme
d c
ase
s/1
00
00
0
Year
Malta Netherlands

Surveillance of food- and waterborne diseases in the EU/EEA SURVEILLANCE REPORT
26
Please note that graphs are on different scales.
0
10
20
30
40
50
60
70
80
90
2006 2007 2008 2009
Co
nfi
rm
ed
ca
se
s/1
00
00
0
Year
Finland Belgium
0
5
10
15
20
25
30
35
40
45
50
2006 2007 2008 2009
Co
nfi
rme
d c
ase
s/1
00
00
0
Year
Ireland Iceland Bulgaria
0
0.5
1
1.5
2
2.5
3
3.5
4
4.5
5
2006 2007 2008 2009
Co
nfi
rme
d c
ase
s/1
00
00
0
Year
Cyprus Poland
0
10
20
30
40
50
60
70
80
2006 2007 2008 2009
Co
nfi
rme
d c
ase
s/1
00
00
0
Year
Austria Estonia
0
20
40
60
80
100
120
2006 2007 2008 2009
Co
nfi
rme
d c
ase
s/1
00
00
0
Year
United Kingdom Luxembourg Slovakia
0
10
20
30
40
50
60
70
80
90
2006 2007 2008 2009
Co
nfi
rme
d c
ase
s/1
00
00
0
Year
Sweden Hungary Denmark
0
1
2
3
4
5
6
7
2006 2007 2008 2009
Co
nfi
rm
ed
ca
se
s/1
00
00
0
Year
France Italy
0
10
20
30
40
50
60
70
80
90
2006 2007 2008 2009
Co
nfi
rme
d c
ase
s/1
00
00
0
Year
Germany Norway

SURVEILLANCE REPORT Surveillance of food- and waterborne diseases in the EU/EEA
27
Eight countries (Cyprus, France, Luxembourg, Malta, the Netherlands, Poland, Slovakia and the United Kingdom)
showed a significant increasing four-year trend, whereas Bulgaria, the Czech Republic, Ireland and Iceland showed a significant decreasing trend (Figure 2-2).
Please note that in a country with a small population even low numbers of reported cases can lead to a relative overrepresentation.
Age and gender
In 2009, the highest notification rate of campylobacteriosis was detected in the age group 1–4 years (126.9 cases per 100 000), followed by the children < 1 years of age (122.1 cases per 100 000). In the older age groups the notification rate was substantially lower varying from 38.3 cases per 100 000 in the age group >65 years to 54.2 cases per 100 000 in the age group 15–24 years. Highest burden in terms of number of reported cases (N=52 130) was noted in the age group 25–44 years (Table 2-4).
Data on age and gender were available from 23 EU/EEA countries. The male-to-female ratio was 1.1:1 in general with constantly higher risk for males than females in almost all age groups (Figure 2-3).
Figure 2-3. Notification rates of confirmed campylobacteriosis cases by age group and gender in EU/EEA countries, 2009 (N=197 928)
Source: Austria, Belgium, Cyprus, Czech Republic, Denmark, Estonia, Finland, France, Germany, Hungary, Ireland, Italy, Lithuania, Luxembourg, Malta, the Netherlands, Poland, Romania, Slovakia, Slovenia, Spain, Sweden, United Kingdom, Iceland and Norway
Table 2-4. Number of confirmed campylobacteriosis cases and notification rate (per 100 000 population) by age group and gender, EU/EEA, 2009
2009
Age group Female Male Total
Cases Rate/100 000 Cases Rate/100 000 Cases Rate/100 000
<1 2 344 108.6 3 063 134.9 5 407 122.1
1–4 9 319 112.4 12 287 140.8 21 606 126.9
5–14 7 355 34.8 10 552 47.5 17 907 41.3
15–24 13 609 54.2 14 199 54.2 27 808 54.2
25–44 25 707 44.7 26 423 45.3 52 130 45.0
45–64 21 618 39.5 24 387 46.2 46 005 42.8
≥65 13 732 33.2 13 333 45.4 27 065 38.3
Total 93 684 44.6 104 244 52.1 197 928 48.2
Source: Austria, Belgium, Cyprus, Czech Republic, Denmark, Estonia, Finland, France, Germany, Hungary, Ireland, Italy, Lithuania, Luxembourg, Malta, the Netherlands, Poland, Romania, Slovakia, Slovenia, Spain, Sweden, United Kingdom, Iceland and Norway
There was a notable difference in notification rates between genders. In children, a male predominance can be seen in the group below 15 years of age. The highest male-to-female ratio (1.4:1) was noted for the age group 5–14 years.
<1 1–4 5–14 15–24 25–44 45–64 ≥65
Male 134.9 140.8 47.5 54.2 45.3 46.2 45.4
Female 108.6 112.4 34.8 54.2 44.7 39.5 33.2
0.0
20.0
40.0
60.0
80.0
100.0
120.0
140.0
160.0
Co
nfi
rme
d c
ase
s/1
00
00
0 Male
Female

Surveillance of food- and waterborne diseases in the EU/EEA SURVEILLANCE REPORT
28
Figure 2-4. Trends in notification rates of confirmed campylobacteriosis cases by age groups and
gender, EU/EEA, 2007–09
Source: Austria, Belgium, Cyprus, Czech Republic, Denmark, Estonia, Finland, France, Germany, Hungary, Ireland, Luxembourg, Malta, the Netherlands, Poland, Slovakia, Spain, Sweden, United Kingdom, Iceland and Norway
Due to the differences in notification rates between age groups in males and females, three-year trends were analysed by gender. Three-year trends (2007–09) were very similar for both genders (Figure 2-4). The notification rate was nearly stable in almost all age groups but showed a slight increase for females above 45 years and males over 65 years of age.
Campylobacter species
In the three-year period from 2007 to 2009, C. jejuni, C. coli and C. lari were the most commonly reported species in EU/EEA countries (Table 2-5). It is noteworthy that 6–10% of species were reported as ‘other’.
Table 2-5. Campylobacter species in confirmed campylobacteriosis cases in EU/EEA countries, 2007–09
Species 2007 2008 2009
Cases % Cases % Cases %
C. jejuni 86 669 45.0 77 427 41.2 74 220 37.8
C. coli 5 267 2.7 4 549 2.4 4 936 2.5
C. lari 649 0.3 493 0.3 371 0.2
C. upsaliensis 7 0.0 21 0.0 13 0.0
Campylobacter spp. 87 053 45.2 88 189 46.9 97 087 49.5
Campylobacter – other 12 872 6.7 17 476 9.3 19 594 10.0
Total 192 517 100.0 188 155 100.0 196 221 100.0
Source: Austria, Belgium, Cyprus, Czech Republic, Denmark, Estonia, Finland, France, Germany, Hungary, Ireland, Italy, Lithuania, Luxembourg, Malta, the Netherlands, Poland, Romania, Slovakia, Slovenia, Spain, Sweden, United Kingdom; non-EU countries: Iceland, Liechtenstein, and Norway
The most commonly reported species in 2007–09, C. jejuni, accounted for 93–94% of all cases with known data on species (Table 2-5). More than half of the cases were reported as ‘Campylobacter spp.’ or ‘Campylobacter – other’. The proportion of Campylobacter cases without speciation increased gradually from 52% in 2007 to 60% in 2009.
Species by age groups
The most common species (C. jejuni and C. coli) are spread over all age groups (Figure 2-5). The risk of infection by C. jejuni was highest in children 1–4 years (57%) and 5–14 years (54%). C. coli is evenly distributed in all age groups. The relative proportion of ‘Campylobacter spp.’ and ‘Campylobacter other’ increased with increasing age
(Figure 2-5). The proportion of unknown data was only 0.8%.
0
20
40
60
80
100
120
140
160
180
200
2007 2008 2009
Co
nfi
rme
d c
ase
s/1
00
00
0
Year
Males (N=309 422)
<1
1–4
5–14
15–24
25–44
45–64
≥65
0
20
40
60
80
100
120
140
160
180
200
2007 2008 2009
Co
nfi
rme
d c
ase
s/1
00
00
0Year
Females (N=279 312)
<1
1–4
5–14
15–24
25–44
45–64
≥65

SURVEILLANCE REPORT Surveillance of food- and waterborne diseases in the EU/EEA
29
Figure 2-5. Cumulative proportions of Campylobacter species by age groups, EU/EEA countries,
2007–09
Source: Austria, Belgium, Cyprus, Czech Republic, Denmark, Estonia, Finland, France, Germany, Hungary, Ireland, Italy, Lithuania, Luxembourg, Malta, the Netherlands, Poland, Romania, Slovakia, Slovenia, Spain, Sweden, United Kingdom; non-EU countries: Iceland, Liechtenstein, and Norway
Seasonality
Seasonality was analysed for the two most common serotypes, C. jejuni and C. coli. Both species show clear seasonality, with the highest number of reported cases in summer and early autumn (Figure 2-6). The number of
reported cases of both species started a steep increase in April, with a pronounced peak in July/August. The lowest number of cases was notified in February (Figure 2-6).
0%
10%
20%
30%
40%
50%
60%
70%
80%
90%
100%
<1 1–4 5–14 15–24 25–44 45–64 ≥65
Age group
N=(14 678) (60 379) (51 335) (82 876) (157 991) (131 284) (74 215)
Campylobacter spp. (N=269 078)
Other C. spp. (N=49 701)
C. upsaliensis (N=41)
C. lari (N=1 513)
C. coli (N=14 698)
C. jejuni (N=237 727)

Surveillance of food- and waterborne diseases in the EU/EEA SURVEILLANCE REPORT
30
Figure 2-6. Number of reported Campylobacter jejuni (N=226 257) and Campylobacter coli (N=13 722) cases by month, EU/EEA countries, 2007–09
Source: Austria, Cyprus, Czech Republic, Estonia, Finland, France, Germany, Hungary, Ireland, Italy, Lithuania, Luxembourg, Malta, the Netherlands, Poland, Romania, Slovakia, Slovenia, Spain, Sweden, United Kingdom; non-EU countries: Iceland, Liechtenstein, and Norway
Figure 2-7. Confirmed campylobacteriosis cases per 100 000 population by month, EU/EEA countries, 2009
Source: Austria, Belgium, Cyprus, Czech Republic, Denmark, Estonia, Finland, France, Germany, Hungary, Ireland, Italy, Lithuania, Luxembourg, Malta, the Netherlands, Poland, Slovakia, Slovenia, Spain, Sweden, United Kingdom; non-EU countries: Iceland, Norway
The distribution of cases by age showed similar seasonality in all age groups but with different magnitudes. Case
numbers increased in early April, peaked in August and gradually declined towards December. However, in the age group 1–4 years, the increase was more pronounced than in the other age groups (Figure 2-7).
Travel-related campylobacteriosis
Within the three-year period from 2007–09 (N=583 370, pooled data), data for origin of infection were available for 68% (N=398 399) of all cases. Among these, 90% of infections were reported as domestically acquired. For the remaining travel-related cases, data on suspected country of infection were available for 93% (N=37 310) cases. Most travel-related infections (61%) were acquired in non-EU countries (Figure 2-8).
Figure 2-8. Origin of travel-related campylobacteriosis cases in the EU/EEA, 2007–09 (cumulative N=37 310)
0
2000
4000
6000
8000
10000
12000
Jan Feb Mar Apr May Jun Jul Aug Sep Oct Nov Dec
Co
nfi
rme
d c
ase
s
Month
Min Median Max
C. jejuni (N= 226 257)
0
100
200
300
400
500
600
700
Jan Feb Mar Apr May Jun Jul Aug Sep Oct Nov Dec
Co
nfi
rme
d c
ase
s
Month
Min Median Max
C. coli (N=13 722)
0
2
4
6
8
10
12
14
16
18
Jan Feb Mar Apr May Jun Jul Aug Sep Oct Nov Dec
Co
nfi
rme
d c
ase
s/1
00
00
0
Month
<1 (N=5 276)
1–4 (N=21 022)
5–14 (N=17 068)
15–24 (N=25 944)
25–44 (N=48 543)
45–64 (N=43 231)
≥65 (N=25 462)

SURVEILLANCE REPORT Surveillance of food- and waterborne diseases in the EU/EEA
31
Source: Austria, Belgium, Cyprus, Czech Republic, Denmark, Estonia, Finland, France, Germany, Hungary, Ireland, Italy, Lithuania, Luxembourg, Malta, the Netherlands, Poland, Romania, Slovakia, Slovenia, Spain, Sweden, United Kingdom; non-EU countries: Iceland, Liechtenstein, and Norway.
Severity
The severity of campylobacteriosis was evaluated by looking at the incidence of hospitalisation and the case-fatality rate. Hospitalisation data were included in the data collection for the first time in 2009 As expected the unknown proportion was quite high for the first reporting year. The number of cases with known information on hospitalisation represented 8% of all the confirmed campylobacteriosis cases in 2009 Six countries provided data on hospitalisation. In addition, Poland provided historical data for years 2007 and 2008. In 2009, 42% of cases with known data were hospitalised (Table 2-6).
Table 2-6. Hospitalisation of confirmed campylobacteriosis cases in EU/EEA countries, 2007–09
Hospitalised 2007 2008 2009
Cases % Cases % Cases %
Yes 121 63.0 153 56.7 6 609 8.6
No 71 37.0 117 43.3 9 216 12.0
Unknown 0 0.0 0 0.0 60 985 79.4
Total 192 100.0 270 100.0 76 810 100.0
Source: Poland: 2007–08 data; Estonia, Hungary, Ireland, Norway, Poland, United Kingdom: all 2009 data
Table 2-7. Outcome of confirmed campylobacteriosis cases in the EU and EEA, 2007–09
Outcome 2007 2008 2009
Cases % Cases % Cases %
Alive 116 936 99.99 109 640 99.97 109 698 99.98
Dead 17 0.01 31 0.03 21 0.02
Total 116 953 100.00 109 671 100.00 109 719 100.00
Source: Austria, Cyprus, Czech Republic, Estonia, Germany, Hungary, Ireland, Luxembourg, Malta, Poland, Romania, Slovakia, Slovenia, United Kingdom; non-EU countries: Liechtenstein, Norway
Sixteen countries provided data on outcome (14 Member States, Liechtenstein and Norway). Between 2007 and 2009, the proportion of unknown data per year (including missing data) varied between 42 and 46%. Based on known data only, the proportion of deaths associated with campylobacteriosis cases was low: less than 0.1% in the three-year period (Table 2-7).
Discussion
Campylobacter has been the most frequently reported cause of human gastrointestinal disease in Europe since 2005 [4]. Overall, campylobacteriosis showed an increasing trend in the EU/EEA in 2006–09. The trends, however, were not consistent: six countries suggested a constantly decreasing trend whereas an opposite trend was detected in eight countries. As campylobacteriosis is the most commonly reported food- and waterborne disease, the increasing trend in the EU/EEA warrants preventive actions at EU level.
The highest risk for Campylobacter infection was detected in children under the age of five. This finding is consistent with previous years [13]. Notification rates remained quite stable in all age groups in 2007–09, showing a slight increase in the age groups over 45 years.
C. jejuni (93%) and C. coli (6%) were the two most dominant species reported throughout the three-year period 2007–09. Both species showed a distinct seasonality, with an increase of reported cases in early April; the highest number of cases was reported in summer and early autumn. The decreasing proportion of speciation with
increasing age may indicate that more thorough investigations are performed in child patients.
39%
61%
EU/EEA countries (N=14 499)
Non-EU/EEA countries (N=22 811)

Surveillance of food- and waterborne diseases in the EU/EEA SURVEILLANCE REPORT
32
Campylobacteriosis is mainly acquired domestically, with less than 10% of the cases reported as travel-related. In
about two thirds of all imported infections, non-EU countries were reported as the probable country of infection.
Every year, several Campylobacter outbreaks were reported in the EU/EEA. However, verified foodborne outbreaks due to Campylobacter were not commonly recorded [1-4]. Outbreaks explain only about 1% of the total annual number of reported human Campylobacter cases. Fresh poultry meat and products thereof are the most important suggested foodborne sources of Campylobacter. EFSA’s Biohazard Panel estimated that about 20–30% of human Campylobacter infections are caused through the handling and consumption of contaminated broiler meat [14]. Campylobacter is also prone to cause waterborne outbreaks, and water seems to play an important role in the transmission chain.
In 2006, Denmark reported a Campylobacter outbreak with 23 cases [1]. A relish served with fish and chips was the source of infection. Raw pieces of chicken were stored in the refrigerator on the top of the relish, and meat juice had dropped into the relish. In France, a Campylobacter outbreak linked to a restaurant affected 42 persons in 2006. Again, poultry was identified as the source of infection [1]. In Belgium, a Campylobacter outbreak involving 40 persons occurred in a group of camping people, of whom eight were hospitalised. Epidemiological investigation pointed to turkey meat as the likely source of infection [1]. In 2006, an outbreak of Campylobacter infection occurred in Scotland, affecting 48 people [15]. All cases ate chicken liver pâté at a restaurant. The restaurant had used a new method of cooking the pâté, which led to the production of several undercooked batches. In England and Wales, the number of Campylobacter outbreaks linked to the consumption of poultry liver pâté dishes increased significantly in 2007 [16]. In the Netherlands, 18 people became infected with C. jejuni after consumption of unpasteurised milk during the visit to a dairy farm in 2007 [2]. In 2009, there were two outbreaks caused by beef, one in the Netherlands and one in France [4].
In 2007, Denmark reported one outbreak related to contaminated drinking water, involving 140 cases [17]. Several pathogens were detected, among them Campylobacter (C. jejuni, C. coli and C. lari). In Finland, an outbreak in 2007 involved over 6 500 people that were estimated to have fallen ill with gastroenteritis as a consequence of drinking water contamination [18]. Almost 200 Campylobacter-associated cases were confirmed in this outbreak, which is about 200 times more than the mean monthly number (n=1) for Campylobacter cases during the 24 pre-outbreak months in the affected town. In Norway, a large waterborne outbreak took place in 2007, in which over 1000 people were infected with C. jejuni [2].
1n 2009, a large waterborne outbreak with approximately 500 involved cases was reported in Denmark [4]. A total
of 39 cases of C. jejuni were laboratory confirmed. The likely cause of the contamination was identified as a malfunctioning water pipe installation which became contaminated after a heavy rainfall.
References
1. European Food Safety Authority (EFSA) and European Centre for Disease Prevention and Control (ECDC). The European Union Summary Report on Trends and Sources of Zoonoses, Zoonotic Agents and Food-borne Outbreaks in 2009 EFSA Journal 2011;9(3),378 pp.
2. European Centre for Disease Prevention and Control. Annual Epidemiological Report on Communicable Diseases in Europe 2010. Stockholm: ECDC; 2010
3. European Food Safety Authority (EFSA) and European Centre for Disease Prevention and Control (ECDC). The Community Summary Report on Trends and Sources of Zoonoses, Zoonotic Agents, Antimicrobial Resistance and Foodborne Outbreaks in the European Union in 2006. EFSA Journal 2007;130,2-352.
4. European Food Safety Authority (EFSA) and European Centre for Disease Prevention and Control (ECDC). The Community Summary Report on Food-Borne Outbreaks in The European Union in 2007. EFSA Journal 2009; 271,129 pp.
5. European Food Safety Authority (EFSA) and European Centre for Disease Prevention and Control (ECDC). The Community Summary Report on Trends and Sources of Zoonoses, Zoonotic Agents and Food-borne Outbreaks in the European Union in 2008. EFSA Journal 2010; 8(1),410 pp.
6. EFSA Panel on Biological Hazards. Scientific Opinion on Campylobacter in broiler meat production: control options and performance objectives and/or targets at different stages of the food chain. EFSA Journal 2011;9(4):141.
7. O'Leary MC, Harding O, Fisher L, Cowden J. A continuous common-source outbreak of campylobacteriosis associated with changes to the preparation of chicken liver pate. Epidemiology and Infection. 2009;137(3):383-8.
8. Little CL, Gormley FJ, Rawal N, Richardson JF. A recipe for disaster: outbreaks of campylobacteriosis
associated with poultry liver pate in England and Wales. Epidemiol Infect. 2010 Dec;138(12):1691–4.

SURVEILLANCE REPORT Surveillance of food- and waterborne diseases in the EU/EEA
33
9. Vestergaard LS, Olsen KE, Stensvold R, Bottiger BE, Adelhardt M, Lisby M, et al. Outbreak of severe
gastroenteritis with multiple aetiologies caused by contaminated drinking water in Denmark, January 2007. Euro Surveill. 2007 Mar;12(3):E070329 1.
10. Laine J, Huovinen E, Virtanen MJ, Snellman M, Lumio J, Ruutu P, et al. An extensive gastroenteritis outbreak after drinking-water contamination by sewage effluent, Finland. Epidemiol Infect. 2010 Sep 15:1-9.

Surveillance of food- and waterborne diseases in the EU/EEA SURVEILLANCE REPORT
34
3 STEC/VTEC infections in the EU/EEA, 2006–09
Shiga toxin/verotoxin-producing Escherichia coli (STEC/VTEC) infection
E. coli is a common bacterium in the gastrointestinal tract and part of the normal bacterial flora. A large number of serogroups of E. coli have been recognised as Shiga toxin/verotoxin producers. STEC/VTEC infections are most often associated with serogroup O157 in the EU.
In STEC/VTEC infection, gastrointestinal symptoms range from mild to severe bloody diarrhoea, mostly without fever. Young children are most commonly affected. Children under five years of age and the elderly are the most susceptible age groups for STEC/VTEC infection. About 10% of patients may develop haemolytic-uraemic
syndrome (HUS), characterised by acute kidney failure, among other symptoms. Antibiotic therapy is controversial and its value for treating HUS cases is debated. According to published literature, the mortality rate for HUS cases is about 3–5%.
STEC/VTEC infections are acquired by consuming contaminated food or water, but illness can also result from direct contact with infected or colonised (farm) animals or environments contaminated by animal faecal matter. Human-to-human transmission or swimming in contaminated surface waters has also been described as a source of infection. Cattle, sheep, and goats are the primary carriers of E. coli O157. The most commonly reported sources of contaminated food are undercooked meat, unpasteurised dairy products, lettuce and other vegetables.
More information on STEC/VTEC can be found at the ECDC website: http://ecdc.europa.eu/en/healthtopics/escherichia_coli/basic_facts/Pages/basic_facts.aspx
Surveillance of STEC/VTEC in the EU/EEA in 2006–09
Since 2008, ECDC has been coordinating the European surveillance of Shiga toxin/verotoxin-producing Escherichia coli (STEC/VTEC) infection, in close collaboration with a network of nominated experts, epidemiologists and microbiologists from EU/EEA countries and as part of the Food- and Waterborne Diseases and Zoonoses (FWD) network.
The scope of surveillance is defined by the general surveillance objectives for food- and waterborne diseases (see Introduction) and the EU case definition for Shiga toxin/verotoxin-producing Escherichia coli (STEC/VTEC) infection (see Annex).
The aims and purposes of the disease-specific surveillance were discussed with the European Food- and Waterborne Diseases and Zoonoses network. For STEC/VTEC, the suggested specific surveillance objectives are to:
improve detection of international clusters and outbreaks of STEC/VTEC infections by setting up real-time molecular surveillance for human cases and connect/harmonise the typing methods with food, feed, and animal strains;
monitor the most virulent types of STEC/VTEC, i.e. those causing HUS, at the EU level; monitor the incidence of cases of bloody diarrhoea caused by STEC/VTEC in selected European countries;
monitor severity of disease (hospitalisation, outcome, specimen, clinical manifestation); monitor antimicrobial resistance development, particularly for ciprofloxacin and cefotaxime (under revision;
a separate monitoring protocol will be developed in 2012–13).
The European Surveillance System (TESSy) allows the standard reporting of cases of STEC/VTEC infections with an agreed set of variables, including data on serotypes. In 2009, the reporting of STEC/VTEC covered 56 variables, including 38 diseases-specific variables for STEC/VTEC. The common variables are presented in the first table of the chapter on ‘Data collection and analyses’. Additional STEC/VTEC-specific variables are presented below in Table 3-1.
Table 3-1. Enhanced dataset collected for STEC/VTEC cases, EU/EEA, 2006–09
Variable Description in TESSy
AntigenH Flagellar (H) antigen of the antigenic formula of the pathogen which is the cause of the reported disease
AntigenO Only somatic (O) antigen of the antigenic formula of the pathogen which is the cause of the reported disease
BetaGlucoronidaseActivity Beta glucoronidase activity

SURVEILLANCE REPORT Surveillance of food- and waterborne diseases in the EU/EEA
35
Variable Description in TESSy
ClinicalManifestation Clinical manifestation other than HUS
DateOfReceiptReferenceLab Date of receipt in reference laboratory
DateOfReceiptSourceLab Date (YYYY-MM-DD or YYYY-Www or YYYY-MM or YYYY-Qq or YYYY), UNK
Enterohaemolysis Enterohaemolysis
Hospitalisationa Hospitalisation of a case due to the cause of the disease
HUS Haemolytic-uraemic syndrome
Imported Having been outside the country of notification during the incubation period of the reported disease
IntiminEaeGene Presence of intimin (eae) gene
IsolateReferenceNumber The reference number currently used by the reference laboratory
Pathogen Species or genus of the pathogen which is the cause of the reported disease
PhageType Name/number of phage type of the pathogen which is the cause of the reported disease
Probable country of infection If Imported=Yes: one entry for each country/region visited during the incubation period of the disease. The variable is repeatable in case several countries/regions were visited
SIR_AMP, SIR_CHL, SIR_CIP, SIR_CTX, SIR_GEN, SIR_KAN, SIR_NAL, SIR_SSS, SIR_STR, SIR_SXT, SIR_TCY
Susceptibility to 11 different antibiotics (ampicillin, chloramphenicol, ciprofloxacin, cefotaxime, gentamicin, kanamycin, nalidixic acid, sulphonamides, streptomycin, trimethoprim (co-trimoxazole), tetracyclines)
SorbitolFermenting Ferments sorbitol
Specimen The relevant specimen type used for diagnosis of the case
SpecificAntibodyResponsea Specific antibody response for E. coli serogroups. (Only to be filled in for HUS cases.)
Suspected vehicle Suspected vehicle or source of infection
Transmission Suspected main mode of transmission
TestMethoda Laboratory method(s) used for diagnosis or further characterisation of the disease
Verotoxin1 Presence of verotoxin 1 genes (VT1)
Verotoxin1Subtypea Designation of verotoxin 1 sub-type
Verotoxin2 Presence of verotoxin 2 genes (VT2)
Verotoxin2Subtype Designation of verotoxin 2 sub-type
VerotoxinGenes Presence of verotoxin genes
VerotoxinProduction Confirmation of production of verotoxin
a Variable added in 2010 for 2009 reporting
National surveillance systems for STEC/VTEC
Table 3-2. Notification systems for human STEC/VTEC cases in EU/EEA countries, 2009
Country Notifiable
since Legal
charactera Case based/ aggregatedb
National coveragec
Changes in surveillance system in 2006–09
Austria 1947 Cp C Y 2009: introduction of the electronic Epidemic Reporting System (EMS)
Belgium < 1999 V C Y -d
Bulgaria Yes Cp A Y -
Cyprus 2005 Cp C Y -
Czech Republic
Yes - - - -
Denmark 2000 Cp C Y -
Estonia 1958 Cp C Y No changes
Finland 1998 Cp C Y -
France 1996 V C N -
Germany 2001 Cp C Y -
Greece Yes Cp C Y -
Hungary 1998 Cp C Y -
Ireland 2004 Cp C Y -
Italy 1990 V C - No changes
Latvia 1999 Cp C Y -
Lithuania 2004 Cp C Y -
Surveillance of food- and waterborne diseases in the EU/EEA SURVEILLANCE REPORT
36
Country Notifiable
since Legal
charactera Case based/ aggregatedb
National coveragec
Changes in surveillance system in 2006–09
Luxembourg 2004 Cp+V C Y Since 2009, reported cases have included laboratory data (voluntary), in addition to cases reported by
physicians (compulsory).
Malta Yes Cp C Y -
Netherlands Yes Cp C Y -
Poland 2004 Cp C Y -
Portugal - - - - -
Romania Yes Cp C Y -
Slovakia 1990 Cp C Y No changes
Slovenia 1995 Cp C Y -
Spain 1989 V C N -
Sweden 2004 Cp C Y No changes
United Kingdom
No O C Y -
Iceland Yes Cp C Y -
Liechtenstein - - - - -
Norway 1995 Cp C Y -
a Legal character: Cp=compulsory, V=voluntary, O=other
b C=case based, A=aggregated
c National coverage: Y=yes, N=no
d No data provided
Epidemiological situation in 2006–09
Major findings
STEC/VTEC showed a slightly increasing EU/EEA trend from 2006 to 2009. Several countries showed a continuous increasing trend, and only two countries observed a steady decreasing four-year trend. The notification rate was 0.75 per 100 000 population in the EU/EEA in 2009. The number of reported cases increased by 9%, with 290 more cases reported in 2009 compared with 2006.
The majority of the reported cases (79%) were of domestic origin. For both genders, the highest notification rates in 2009 were detected in children aged between one and
four years, ranging from 6.5/100 000 in females to 7.6/100 000 in males. Notification rates increased in all age groups but especially for children 1–4 years between 2007 and 2009 Despite the severity of STEC/VTEC infections, very few fatal cases (N=10) were reported from 2007 to 2009.
Haemolytic-uraemic syndrome (HUS) was reported in about 11% of cases, and almost half of the STEC/VTEC cases with known data required hospital care.
Overview of trends
The number of reported cases of STEC/VTEC increased slightly in the EU/EEA during the four-year period, from 3 406 confirmed cases in 2006 to 3 698 cases in 2009 (Table 3-3). The notification rate was 0.76 cases per 100 000 population in 2006 but declined to 0.61 cases in 2007. In 2009, the notification rate rose to 0.77 cases per 100 000 population.

SURVEILLANCE REPORT Surveillance of food- and waterborne diseases in the EU/EEA
37
Figure 3-1. Trend in notification rates of confirmed STEC/VTEC cases, EU/EEA, 2006–09
Source: Austria, Belgium, Denmark, Estonia, Finland, France, Germany, Greece, Hungary, Ireland, Italy, Latvia, Lithuania, Luxembourg, Malta, the Netherlands, Poland, Slovakia, Slovenia, Spain, Sweden, United Kingdom; non-EU countries: Iceland and Norway
Of 28 EU/EEA countries reporting data in 2006–09 (cumulative total N=13 242), the highest number of reported STEC/VTEC was reported in the United Kingdom (cumulative N=4 946), accounting for 37% of all reported cases, followed by Germany with 29% (cumulative N=3 816), and Sweden with 8% (cumulative N=1 059) of all reported cases (Table 3-3). The highest notification rate was reported in Ireland, where the notification rate peaked from 3.6 in 2006 to 5.3 cases per 100 000 in 2009 (Table 3-2).
Table 3-3. Confirmed STEC/VTEC cases and notification rates (per 100 000 population) by country and year, EU/EEA, 2006–09
Country
Year of report
2006 2007 2008 2009
Cases Rate/100 000 Cases Rate/100 000 Cases Rate/100 000 Cases Rate/100 000
Austria 41 0.50 82 0.99 69 0.83 91 1.09
Belgium 46 0.44 47 0.44 103 0.97 96 0.90
Bulgaria - - 0 0.00 0 0.00 0 0.00
Cyprus - - 0 0.00 2 0.25 0 0.00
Czech Republic - - - - - - - -
Denmark 146 2.69 156 2.86 161 2.94 160 2.90
Estonia 8 0.59 3 0.22 3 0.22 4 0.30
Finland 14 0.27 12 0.23 8 0.15 29 0.54
France 67 0.11 58 0.09 85 0.13 93 0.14
Germany 1 183 1.44 870 1.06 876 1.07 887 1.08
Greece 1 0.01 1 0.01 0 0.00 0 0.00
Hungary 3 0.03 1 0.01 0 0.00 1 0.01
Ireland 153 3.64 115 2.67 213 4.84 237 5.33
Italy 17 0.03 27 0.05 26 0.04 51 0.08
Latvia 0 0.00 0 0.00 0 0.00 0 0.00
Lithuania 0 0.00 0 0.00 0 0.00 0 0.00
Luxembourg 2 0.43 1 0.21 4 0.83 5 1.01
Malta 21 5.19 4 0.98 8 1.95 8 1.93
Netherlands 41 0.25 88 0.54 92 0.56 313 1.90
Poland 4 0.01 2 0.01 3 0.01 0 0.00
Portugal - - - - - - - -
Romania - - 0 0.00 4 0.02 0 0.00
Slovakia 8 0.15 6 0.11 8 0.15 14 0.26
Slovenia 30 1.50 4 0.20 7 0.35 12 0.59
Spain 13 0.03 19 0.04 24 0.05 14 0.03
Sweden 265 2.93 262 2.87 304 3.31 228 2.46
United Kingdom 1 294 2.14 1 149 1.89 1 164 1.90 1 339 2.19
Total EU 3 357 0.76 2 907 0.61 3 164 0.66 3582 0.80
Iceland 1 0.33 13 4.23 4 1.27 8 2.50
0
0.2
0.4
0.6
0.8
1
2006 2007 2008 2009
Co
nfi
rme
d c
ase
s/1
00
00
0
Year
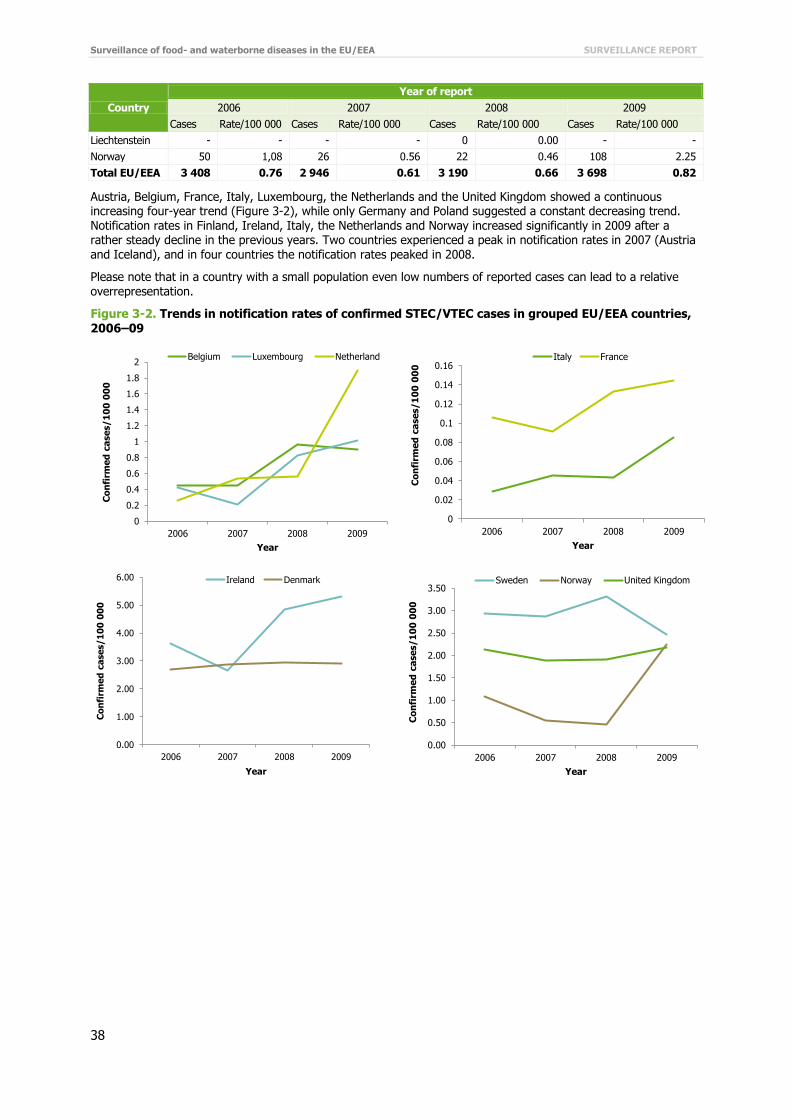
Surveillance of food- and waterborne diseases in the EU/EEA SURVEILLANCE REPORT
38
Country
Year of report
2006 2007 2008 2009
Cases Rate/100 000 Cases Rate/100 000 Cases Rate/100 000 Cases Rate/100 000
Liechtenstein - - - - 0 0.00 - -
Norway 50 1,08 26 0.56 22 0.46 108 2.25
Total EU/EEA 3 408 0.76 2 946 0.61 3 190 0.66 3 698 0.82
Austria, Belgium, France, Italy, Luxembourg, the Netherlands and the United Kingdom showed a continuous increasing four-year trend (Figure 3-2), while only Germany and Poland suggested a constant decreasing trend. Notification rates in Finland, Ireland, Italy, the Netherlands and Norway increased significantly in 2009 after a rather steady decline in the previous years. Two countries experienced a peak in notification rates in 2007 (Austria and Iceland), and in four countries the notification rates peaked in 2008.
Please note that in a country with a small population even low numbers of reported cases can lead to a relative overrepresentation.
Figure 3-2. Trends in notification rates of confirmed STEC/VTEC cases in grouped EU/EEA countries,
2006–09
0
0.2
0.4
0.6
0.8
1
1.2
1.4
1.6
1.8
2
2006 2007 2008 2009
Co
nfi
rme
d c
ase
s/1
00
00
0
Year
Belgium Luxembourg Netherland
0
0.02
0.04
0.06
0.08
0.1
0.12
0.14
0.16
2006 2007 2008 2009
Co
nfi
rme
d c
ase
s/1
00
00
0
Year
Italy France
0.00
1.00
2.00
3.00
4.00
5.00
6.00
2006 2007 2008 2009
Co
nfi
rme
d c
ase
s/1
00
00
0
Year
Ireland Denmark
0.00
0.50
1.00
1.50
2.00
2.50
3.00
3.50
2006 2007 2008 2009
Co
nfi
rme
d c
ase
s/1
00
00
0
Year
Sweden Norway United Kingdom

SURVEILLANCE REPORT Surveillance of food- and waterborne diseases in the EU/EEA
39
Please note that graphs are on different scales.
Age and gender
In 2009, the highest notification rate was detected in children in the age group 1–4 years (6.5 and 7.6 cases per 100 000 for females and males, respectively), followed by children below one year of age (4.4 and 5.3 cases per 100 000 for females and males, respectively) (Figure 3-3). With regard to notification rates, the female-to-male ratio was identical in the age groups 5–14 years and ≥65 years and varied only moderately in all other age groups (Figure 3-3). The gender ratio was slightly higher (1.2:1) for males in the age groups <1 year and 1–4 years, whereas it was higher in females in the older age groups from 15 to 64 years (Figure 3-3).
0.00
0.20
0.40
0.60
0.80
1.00
1.20
1.40
1.60
2006 2007 2008 2009
Co
nfi
rme
d c
ase
s/1
00
00
0
Year
Austria Germany Slovenia
0.00
0.10
0.20
0.30
0.40
0.50
0.60
0.70
2006 2007 2008 2009
Co
nfi
rme
d c
ase
s/1
00
00
0
Year
Finland Estonia Slovakia
0.00
0.01
0.01
0.02
0.02
0.03
0.03
0.04
2006 2007 2008 2009
Co
nfi
rme
d c
ase
s/1
00
00
0
Year
Hungary Poland
0.00
1.00
2.00
3.00
4.00
5.00
6.00
2006 2007 2008 2009
Co
nfi
rme
d c
ase
s/1
00
00
0
Year
Iceland Malta

Surveillance of food- and waterborne diseases in the EU/EEA SURVEILLANCE REPORT
40
Figure 3-3. Notification rates of confirmed STEC/VTEC cases by age group and gender, EU/EEA (N=3
675), 2009
Source: Austria, Belgium, Denmark, Estonia, Finland, France, Germany, Hungary, Ireland, Italy, Luxembourg, Malta, the Netherlands, Slovakia, Slovenia, Spain, Sweden, United Kingdom; non-EU countries: Iceland, Norway
STEC/VTEC places a heavy burden on children. Of the reported cases with known data for gender and age, 51% were reported in children below 15 years; in this age group, 57% were in the age group 1–4 years (Table 3-4).
Three-year trends in notification rates were analysed separately for each age group and by gender (Figure 3-5), showing a steady increase across all age groups and both genders, except for males in the age groups below one year and between 25 and 44 years.
Table 3-4. Number of confirmed STEC/VTEC cases by age group and gender, EU/EEA, 2009
2009
Age group Female Male Total
Cases Rate/100 000 Cases Rate/100 000 Cases Rate/100 000
<1 82 4.40 107 5.30 189 4.87
1–4 482 6.52 598 7.61 1 080 7.08
5–14 303 1.58 308 1.54 611 1.56
15–24 179 0.83 156 0.70 335 0.76
25–44 344 0.67 207 0.40 551 0.54
45–64 282 0.60 197 0.42 479 0.51
≥65 255 0.69 175 0.64 430 0.67
Total 1927 1.04 1748 0.98 3675 1.01
Source: Austria, Belgium, Denmark, Estonia, Finland, France, Germany, Hungary, Ireland, Italy, Luxembourg, Malta, the Netherlands, Slovakia, Slovenia, Spain, Sweden, United Kingdom; non-EU countries: Iceland and Norway
<1 1–4 5–14 15–24 25–44 45–64 ≥65
Male 5.3 7.6 1.5 0.7 0.4 0.4 0.6
Female 4.4 6.5 1.6 0.8 0.7 0.6 0.7
0.0
2.0
4.0
6.0
8.0
Co
nfi
rme
d c
ase
s/1
00
00
0 Male
Female

SURVEILLANCE REPORT Surveillance of food- and waterborne diseases in the EU/EEA
41
Figure 3-4. Trends in notification rates of confirmed STEC/VTEC cases by age groups and gender,
EU/EEA, 2007–09
Source: Austria, Belgium, Denmark, Estonia, Finland, France, Germany, Ireland, Italy, Luxembourg, Malta, the Netherlands, Slovakia, Slovenia, Spain, Sweden, United Kingdom; non-EU countries: Iceland and Norway
STEC/VTEC serotypes
The three most commonly reported STEC/VTEC serogroups through the three-year period from 2007 to 2009 were O157, O26, and O103 (Table 3-5). The proportion of non-typeable or not typed (NT) is relatively high, almost 30% for the period between 2007 and 2009.E. coli O157 accounted for more than 50% (76% if NT excluded) of all the reported serogroups alone; within the three most common serogroups, O157 accounted for 62% (87% if NT excluded). The 20 most commonly reported STEC/VTEC serogroups in EU/EEA countries in 2007–09 are listed in Table 3-5. Altogether, 24 countries (22 EU countries plus Iceland and Norway) provided data on STEC/VTEC serogroups.
Table 3-5. The 20 most commonly reported STEC/VTEC O serogroups in confirmed cases, EU/EEA, 2007–09
O serogroup 2007 2008 2009 Total 2007–09
Cases % Cases % Cases % Cases %
O157 1 571 54.8 1 687 54.9 1 888 53.1 5 146 54.2
NT* 863 30.1 824 26.8 1 028 28.9 2 715 28.6
O26 146 5.1 168 5.5 200 5.6 514 5.4
O103 78 2.7 90 2.9 100 2.8 268 2.8
O145 35 1.2 50 1.6 70 2.0 155 1.6
O91 43 1.5 50 1.6 50 1.4 143 1.5
O111 23 0.8 43 1.4 26 0.7 92 1.0
O128 23 0.8 28 0.9 26 0.7 77 0.8
O146 15 0.5 26 0.8 33 0.9 74 0.8
O117 9 0.3 22 0.7 18 0.5 49 0.5
O113 16 0.6 9 0.3 23 0.6 48 0.5
O121 10 0.3 10 0.3 22 0.6 42 0.4
Rough 7 0.2 14 0.5 17 0.5 38 0.4
0.00
1.00
2.00
3.00
4.00
5.00
6.00
7.00
8.00
9.00
2007 2008 2009
Co
nfi
rme
d c
ase
s/1
00
00
0
Year
<1
1–4
5–14
Females (N=2 301)
0.00
1.00
2.00
3.00
4.00
5.00
6.00
7.00
8.00
9.00
2007 2008 2009
Co
nfi
rm
ed
ca
se
s/1
00
00
0
Year
<1
1–4
5–14
Males (N=2 665)
0.00
0.10
0.20
0.30
0.40
0.50
0.60
0.70
0.80
0.90
1.00
2007 2008 2009
Co
nfi
rme
d c
ase
s/1
00
00
0
Year
15–24
25–44
45–64
≥65
Females (N=2 712)
0.00
0.10
0.20
0.30
0.40
0.50
0.60
0.70
0.80
0.90
1.00
2007 2008 2009
Co
nfi
rm
ed
ca
se
s/1
00
00
0
Year
15–24
25–44
45–64
≥65
Males (N=1 901)
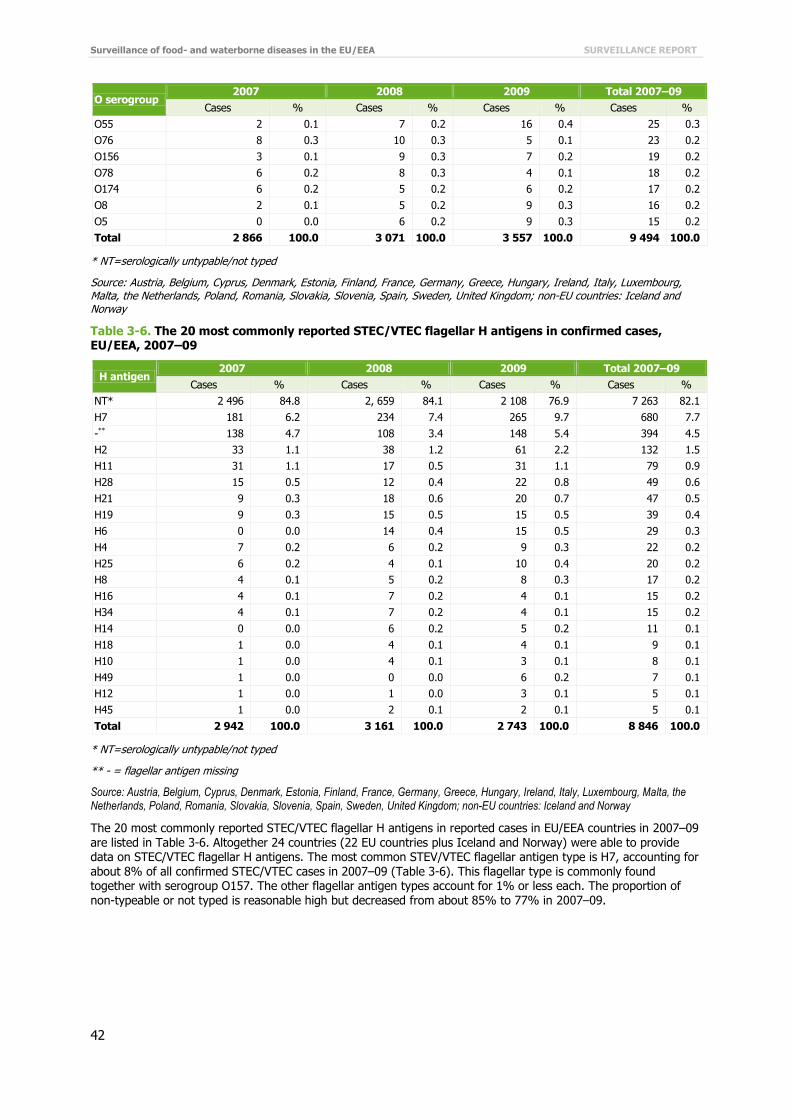
Surveillance of food- and waterborne diseases in the EU/EEA SURVEILLANCE REPORT
42
O serogroup 2007 2008 2009 Total 2007–09
Cases % Cases % Cases % Cases %
O55 2 0.1 7 0.2 16 0.4 25 0.3
O76 8 0.3 10 0.3 5 0.1 23 0.2
O156 3 0.1 9 0.3 7 0.2 19 0.2
O78 6 0.2 8 0.3 4 0.1 18 0.2
O174 6 0.2 5 0.2 6 0.2 17 0.2
O8 2 0.1 5 0.2 9 0.3 16 0.2
O5 0 0.0 6 0.2 9 0.3 15 0.2
Total 2 866 100.0 3 071 100.0 3 557 100.0 9 494 100.0
* NT=serologically untypable/not typed
Source: Austria, Belgium, Cyprus, Denmark, Estonia, Finland, France, Germany, Greece, Hungary, Ireland, Italy, Luxembourg, Malta, the Netherlands, Poland, Romania, Slovakia, Slovenia, Spain, Sweden, United Kingdom; non-EU countries: Iceland and Norway
Table 3-6. The 20 most commonly reported STEC/VTEC flagellar H antigens in confirmed cases, EU/EEA, 2007–09
H antigen 2007 2008 2009 Total 2007–09
Cases % Cases % Cases % Cases %
NT* 2 496 84.8 2, 659 84.1 2 108 76.9 7 263 82.1
H7 181 6.2 234 7.4 265 9.7 680 7.7
-** 138 4.7 108 3.4 148 5.4 394 4.5
H2 33 1.1 38 1.2 61 2.2 132 1.5
H11 31 1.1 17 0.5 31 1.1 79 0.9
H28 15 0.5 12 0.4 22 0.8 49 0.6
H21 9 0.3 18 0.6 20 0.7 47 0.5
H19 9 0.3 15 0.5 15 0.5 39 0.4
H6 0 0.0 14 0.4 15 0.5 29 0.3
H4 7 0.2 6 0.2 9 0.3 22 0.2
H25 6 0.2 4 0.1 10 0.4 20 0.2
H8 4 0.1 5 0.2 8 0.3 17 0.2
H16 4 0.1 7 0.2 4 0.1 15 0.2
H34 4 0.1 7 0.2 4 0.1 15 0.2
H14 0 0.0 6 0.2 5 0.2 11 0.1
H18 1 0.0 4 0.1 4 0.1 9 0.1
H10 1 0.0 4 0.1 3 0.1 8 0.1
H49 1 0.0 0 0.0 6 0.2 7 0.1
H12 1 0.0 1 0.0 3 0.1 5 0.1
H45 1 0.0 2 0.1 2 0.1 5 0.1
Total 2 942 100.0 3 161 100.0 2 743 100.0 8 846 100.0
* NT=serologically untypable/not typed
** - = flagellar antigen missing
Source: Austria, Belgium, Cyprus, Denmark, Estonia, Finland, France, Germany, Greece, Hungary, Ireland, Italy, Luxembourg, Malta, the Netherlands, Poland, Romania, Slovakia, Slovenia, Spain, Sweden, United Kingdom; non-EU countries: Iceland and Norway
The 20 most commonly reported STEC/VTEC flagellar H antigens in reported cases in EU/EEA countries in 2007–09 are listed in Table 3-6. Altogether 24 countries (22 EU countries plus Iceland and Norway) were able to provide data on STEC/VTEC flagellar H antigens. The most common STEV/VTEC flagellar antigen type is H7, accounting for about 8% of all confirmed STEC/VTEC cases in 2007–09 (Table 3-6). This flagellar type is commonly found together with serogroup O157. The other flagellar antigen types account for 1% or less each. The proportion of non-typeable or not typed is reasonable high but decreased from about 85% to 77% in 2007–09.

SURVEILLANCE REPORT Surveillance of food- and waterborne diseases in the EU/EEA
43
Table 3-7. The 20 most commonly reported STEC/VTEC serotypes in confirmed cases, EU/EEA, 2007–
09
Serotype 2007 2008 2009 Total 2007–09
Cases % Cases % Cases % Cases %
O157:H7 166 43.0 208 53.7 238 46.8 612 47.7
O157:H- 96 24.9 51 13.2 73 14.3 220 17.2
O103:H2 21 5.4 22 5.7 46 9.0 89 6.9
O26:H11 31 8.0 15 3.9 29 5.7 75 5.9
O117:H7 6 1.6 14 3.6 14 2.8 34 2.7
O91:H- 9 2.3 9 2.3 11 2.2 29 2.3
O111:H- 6 1.6 9 2.3 9 1.8 24 1.9
O146:H21 6 1.6 6 1.6 11 2.2 23 1.8
O145:H- 8 2.1 7 1.8 7 1.4 22 1.7
O128:H2 8 2.1 9 2.3 3 0.6 20 1.6
O145:H28 3 0.8 0 0.0 15 2.9 18 1.4
O121:H19 3 0.8 5 1.3 10 2.0 18 1.4
O146:H28 6 1.6 5 1.3 5 1.0 16 1.2
rough:H- 2 0.5 4 1.0 9 1.8 15 1.2
O113:H4 4 1.0 1 0.3 8 1.6 13 1.0
O145:H34 3 0.8 7 1.8 3 0.6 13 1.0
O26:H- 4 1.0 1 0.3 6 1.2 11 0.9
O76:H19 4 1.0 5 1.3 2 0.4 11 0.9
O156:H7 0 0.0 5 1.3 5 1.0 10 0.8
O91:H14 0 0.0 4 1.0 5 1.0 9 0.7
Total 386 100.0 387 100.0 509 100.0 1 282 100.0
Source: Austria, Belgium, Denmark, France, Germany, Greece, Ireland, Luxembourg, Malta, the Netherlands, Poland, Romania, Spain, Sweden; non-EU country: Norway
The 20 most commonly reported STEC/VTEC serotypes in EU/EEA countries in 2007–09 are listed in the Table 3-7. Altogether, 15 countries (14 EU countries plus Norway) provided data on STEC/VTEC serotypes. The four most commonly reported STEC/VTEC serotypes in the three-year period from 2007 to 2009 were O157:H7, O157:H-, O103:H2 and O26:H11 (Table 3-7). Serotype O157:H7 accounted for almost 50% of all reported cases; in combination with serotype O157:H-, it accounted for 65% of all cases in 2007–09. The proportion ofE. coli O157:H7 among the 20 most commonly reported serotypes remained relatively unchanged during the three-year period (Figure 3-6). However, reporting of serotype O157:H- declined almost 10% from 2007 to 2009. Serotype O26:H11 decreased slightly from about 8% to 6% in three years, whereas serotypes O103:H2 (from 5% to 9%) and O145:H28 (0.8% to 3%) increased markedly in 2007–09. The proportional changes must be interpreted with caution as the actual numbers are relatively small.
Table 3-8. Shiga toxin genes of STEC/VTEC serotypes by intimin (eae) subtypes, EU/EEA countries in 2007–09
Intimin (eae) positive
Serotype stx1 positive stx2 positive stx1 and stx2 positive Total
Cases % Cases % Cases % Cases %
O157:H7 6 1.5 312 78.6 79 19.9 397 100.0
O157:H- 2 1.1 40 22.0 140 76.9 182 100.0
O103:H2 83 100.0 0 0.0 0 0.0 83 100.0
O26:H11 64 100.0 0 0.0 0 0.0 64 100.0
O111:H- 13 61.9 2 9.5 6 28.6 21 100.0
O145:H28 16 100.0 0 0.0 0 0.0 16 100.0
O145:H- 1 7.7 12 92.3 0 0.0 13 100.0
O117:H7 1 50.0 0 0.0 1 50.0 2 100.0
O146:H21 0 0.0 0 0.0 1 100.0 1 100.0

Surveillance of food- and waterborne diseases in the EU/EEA SURVEILLANCE REPORT
44
Intimin (eae) positive
Serotype stx1 positive stx2 positive stx1 and stx2 positive Total
Cases % Cases % Cases % Cases %
O91:H- 15 35.7 14 33.3 13 31.0 42 100.0
O146:H21 3 9.7 16 51.6 12 38.7 31 100.0
O128:H2 2 6.7 17 56.7 11 36.7 30 100.0
O117:H7 27 100.0 0 0.0 0 0.0 27 100.0
O157:H7 1 20.0 2 40.0 2 40.0 5 100.0
O157:H- 0 0.0 3 75.0 1 25.0 4 100.0
O111:H- 0 0.0 1 50.0 1 50.0 2 100.0
O26:H11 1 100.0 0 0.0 0 0.0 1 100.0
Source: Austria, Belgium, Denmark, France, Germany, Greece, Ireland, Luxembourg, Malta, the Netherlands, Poland, Romania, Spain, Sweden; non-EU country: Norway
The 11 most commonly reported STEC/VTEC serotypes in EU/EEA countries in 2007–09 are listed in the Table 3-8 by intimin (eae) subtypes and Shiga toxin genes (stx1 and stx2). Altogether, 15 countries (14 EU countries plus Norway) provided data on STEC/VTEC serotypes and virulence genes (Table 3-8).
Most (85%) of the reported STEC/VTEC serotypes (n=921 pooled data in 2007–09) were intimin gene (eae)-positive (Table 3-8). The four most commonly reported STEC/VTEC serotypes O157:H7, O157:H-, O103:H2 and O26:H11 were overwhelmingly eae positive (99%) between 2007 and 2009. Serotype O157:H7 accounted for more than 50% of all reported eae-positive serotypes; in combination with serotype O157:H- it accounted for 79% of all reported eae-positive serotypes. Almost 80% of STEC/VTEC serotypes O157:H7 were Shiga toxin gene 2 (stx2)-positive and 80% of STEC/VTEC serotypes O157:H- were Shiga toxin gene stx1- and stx2-positive . All eae-positive O103:H2, O26:H11 and O145:H28 serotypes were only stx1 positive (Table 3-8).
The eae-negative STEC/VTEC serotypes accounted for 15% of the reported serotypes with known data (Table 3-8). The four most commonly reported eae-negative serotypes were O91:H-, O146:H21, O128:H2, and O117:H7, together accounting for 92% of the reported eae-negative serotypes in the three-year period from 2007 to 2009 (n= 142, pooled data). Serotypes O146:H21 and O128:H2 were more often stx2 or stx1 and stx2 positive (over 90%) than stx1 positive (less than 10%), whereas all O117:H7 serotypes were stx1 positive (Table 3-8).
Table 3-9. Shiga toxin genes of STEC/VTEC serotypes by HUS syndrome, EU/EEA, 2007–09
HUS positive
Serotype stx1 positive stx2 positive stx1 and stx2 positive Total
Cases % Cases % Cases % Cases %
O157:H7 0 0.0 47 95.9 2 4.1 49 100.0
O157:H- 0 0.0 13 81.3 3 18.8 16 100.0
O111:H- 0 0.0 0 0.0 2 100.0 2 100.0
O26:H11 1 50.0 1 50.0 0 0.0 2 100.0
O145:H28 0 0.0 2 100.0 0 0.0 2 100.0
O145:H- 0 0.0 2 100.0 0 0.0 2 100.0
HUS negative
Serotype stx1 positive stx2 positive stx1 and stx2 positive Total
Cases % Cases % Cases % Cases %
O157:H7 2 1.0 167 82.3 34 16.7 203 100.0
O157:H- 2 1.2 30 18.2 133 80.6 165 100.0
O103:H2 84 100.0 0 0.0 0 0.0 84 100.0
O26:H11 62 92.5 5 7.5 0 0.0 67 100.0
O91:H- 15 55.6 1 3.7 11 40.7 27 100.0
O146:H21 4 19.0 5 23.8 12 57.1 21 100.0
O128:H2 2 10.5 6 31.6 11 57.9 19 100.0
O111:H- 13 65.0 2 10.0 5 25.0 20 100.0
O117:H7 24 100.0 0 0.0 0 0.0 24 100.0
O145:H- 1 9.1 10 90.9 0 0.0 11 100.0
O145:H28 10 100.0 0 0.0 0 0.0 10 100.0
Source: Austria, Belgium, Denmark, France, Germany, Greece, Ireland, the Netherlands, Poland, Romania, Sweden; non-EU country: Norway

SURVEILLANCE REPORT Surveillance of food- and waterborne diseases in the EU/EEA
45
The 11 most commonly reported STEC/VTEC serotypes in EU/EEA countries in 2007–09 are listed in Table 3-9 by
HUS syndrome and Shiga toxin genes stx1 and stx2. Altogether, 12 countries (11 EU countries plus Norway) provided data on HUS cases (STEC/VTEC serotype, Shiga toxin genes), accounting for about 15% of all reported HUS cases in the three-year period (Table 3-9).
Serotypes O157:H7 and O157:H- were the two most commonly reported serotypes in both groups, together accounting for 89% and 57% of HUS and non-HUS cases, respectively. The proportion of these two serotypes in HUS cases/non-HUS cases was 67%/31% for serotype O157:H7 and 22%/25% for O157:H- (Table 3-9). The next commonly reported STEC/VTEC serotypes O103:H2 and O26:H11 were mainly HUS negative and stx1 positive. Stx2, or stx1 and stx2 together, were reported in 99% of all HUS-positive cases (Table 3-9). In HUS-negative cases, stx1, stx2, or stx1 and stx2 together, each accounted for about one third of the reported cases, but the proportions varied by serotype. Serotype O157:H7 and O157:H- were overwhelmingly (99%) stx2 positive (or stx1 and stx2 positive), even in HUS-negative cases.
Serogroup O157 was separately analysed for sorbitol fermenting (SF) ability in HUS-positive and HUS-negative cases (Table 3-10). Altogether, nine countries (eight EU countries plus Norway) were able to provide data, accounting for about 6% of all reported HUS cases in the three-year period (Table 3-9). HUS-positive cases accounted for 14% (36 cases), HUS-negative cases for 86% (264) of all reported cases (N=308). Most of the HUS cases (over 91%) were caused by non-sorbitol-fermenting (NSF) serogroup O157, whereas sorbitol-fermenting (SF) serogroup O157 caused about 8% of the reported HUS cases. In the SF group, serotype O157:H- (non-motile) caused all HUS cases, whereas in the NSF group, about 91% of all cases were caused by serotype O157:H7 (Table 3-10).
Table 3-10. Sorbitol-fermenting ability of STEC/VTEC serogroup O157 by HUS syndrome, EU/EEA, 2007–09
HUS positive
Serotype Sorbitol fermenting (SF) Non-sorbitol fermenting (NSF)
Cases % Cases %
O157:H7 0 0.0 32 91.4
O157:H- 9 100.0 3 8.6
Total 9 100.0 35 100.0
HUS negative
Serotype Sorbitol fermenting (SF) Non-sorbitol fermenting (NSF)
Cases % Cases %
O157:H7 1 5.9 141 57.1
O157:H- 16 94.1 106 42.9
Total 17 100.0 247 100.0
Source: Austria, Belgium, Ireland, the Netherlands, Poland, Romania, Spain, Sweden; non-EU country: Norway
Serotypes by age groups
The most common serotype O157:H7 is spread across all age groups, accounting for about 50% of the serotypes of all reported cases (Figure 3-5). The highest relative proportion is in the age group 5–14 years, where it accounts for about 70% of all reported cases; in combination with serotype O157:H-, this percentage climbs to 90% of all cases (N=683, pooled data 2007–09). In the age groups 15–24 years and ≥65 years, serotype O157:H7 and O157:H- together represented about 85% of all cases. Among infants, serotype O103:H2 covered 25% of all cases (12/89, pooled data 2007–09). Serotype O26:H11 had the highest relative proportion in the age group 1–4 years, with about 20% of the known serotypes, whereas the O117:H7 had the highest relative proportion (76%, 22/29) in adults between 25 and 64 years (Figure 3-5).
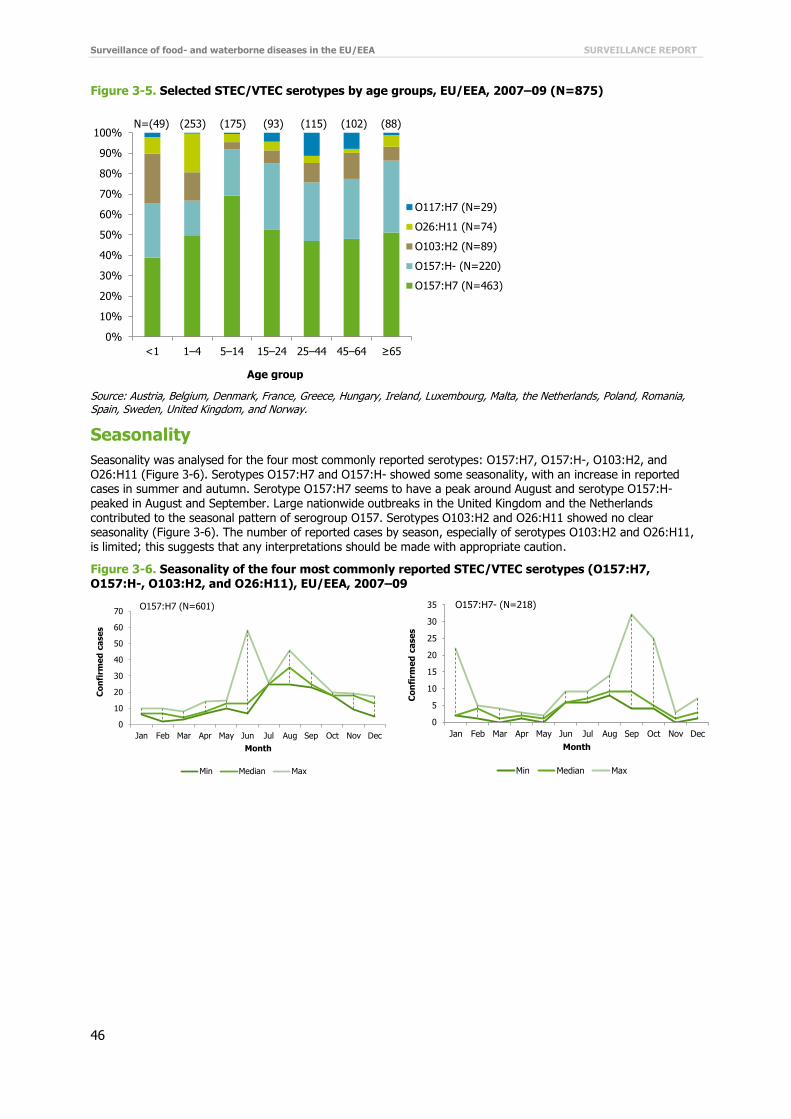
Surveillance of food- and waterborne diseases in the EU/EEA SURVEILLANCE REPORT
46
Figure 3-5. Selected STEC/VTEC serotypes by age groups, EU/EEA, 2007–09 (N=875)
Source: Austria, Belgium, Denmark, France, Greece, Hungary, Ireland, Luxembourg, Malta, the Netherlands, Poland, Romania, Spain, Sweden, United Kingdom, and Norway.
Seasonality
Seasonality was analysed for the four most commonly reported serotypes: O157:H7, O157:H-, O103:H2, and O26:H11 (Figure 3-6). Serotypes O157:H7 and O157:H- showed some seasonality, with an increase in reported cases in summer and autumn. Serotype O157:H7 seems to have a peak around August and serotype O157:H- peaked in August and September. Large nationwide outbreaks in the United Kingdom and the Netherlands contributed to the seasonal pattern of serogroup O157. Serotypes O103:H2 and O26:H11 showed no clear seasonality (Figure 3-6). The number of reported cases by season, especially of serotypes O103:H2 and O26:H11,
is limited; this suggests that any interpretations should be made with appropriate caution.
Figure 3-6. Seasonality of the four most commonly reported STEC/VTEC serotypes (O157:H7, O157:H-, O103:H2, and O26:H11), EU/EEA, 2007–09
0%
10%
20%
30%
40%
50%
60%
70%
80%
90%
100%
<1 1–4 5–14 15–24 25–44 45–64 ≥65
Age group
O117:H7 (N=29)
O26:H11 (N=74)
O103:H2 (N=89)
O157:H- (N=220)
O157:H7 (N=463)
N=(49) (253) (175) (93) (115) (102) (88)
0
10
20
30
40
50
60
70
Jan Feb Mar Apr May Jun Jul Aug Sep Oct Nov Dec
Co
nfi
rme
d c
ase
s
Month
Min Median Max
O157:H7 (N=601)
0
5
10
15
20
25
30
35
Jan Feb Mar Apr May Jun Jul Aug Sep Oct Nov Dec
Co
nfi
rme
d c
ase
s
Month
Min Median Max
O157:H7- (N=218)

SURVEILLANCE REPORT Surveillance of food- and waterborne diseases in the EU/EEA
47
Source: Austria, Belgium, Denmark, France, Greece, Hungary, Ireland, Luxembourg, Malta, the Netherlands, Poland, Romania, Spain, Sweden, United Kingdom; non-EU country: Norway
Travel-related STEC/VTEC infection
Of the 5 898 STEC/VTEC infections cases with known travel status (44% of the total), 4674 (79%) were acquired domestically. A total of 1224 (21%) STEC/VTEC cases with known travel status were reported as travel-related during the period 2007–09. The majority of these cases (71%) were acquired in non-EU countries (Figure 3-7). The top-five non-EU countries reported as a probable country of infection were Turkey (231 cases), Egypt (144), Thailand (58), Morocco (34) and India (25), covering 62% of the non-EU travel-related cases.
Figure 3-7. Origin of travel-related STEC/VTEC cases as reported by EU/EEA countries, 2007–09 (cumulative N=1127)
Source: Austria, Belgium, Denmark, Estonia, Finland, Germany, Ireland, Italy, the Netherlands, Slovenia, Sweden, United Kingdom; non-EU countries: Iceland and Norway
Severity
The severity of STEC/VTEC was evaluated by looking at the incidence of hospitalisation, the proportion of HUS cases, the symptoms in HUS cases, and the proportion of deaths due to STEC/VTEC infection.
Hospitalisation data were first added to EU-level surveillance for STEC/VTEC in 2009. Hospitalisation data were available for 10% of total cases in the EU/EEA in 2009. Seven countries (Belgium, Estonia, Hungary, Ireland, United Kingdom, Iceland, and Norway) provided data on hospitalisation status for 2009. Almost half of the cases (153/363, 42%) with known data were hospitalised.
0
2
4
6
8
10
12
Jan Feb Mar Apr May Jun Jul Aug Sep Oct Nov Dec
Co
nfi
rme
d c
ase
s
Month
Min Median Max
O103:H2 (N=89)
0
2
4
6
8
10
12
Jan Feb Mar Apr May Jun Jul Aug Sep Oct Nov Dec
Co
nfi
rme
d c
ase
s
Month
Min Median Max
O26:H11 (N=75)
29%
71%
EU/EEA countries (N=327)
Non-EU/EEA countries (N=800)

Surveillance of food- and waterborne diseases in the EU/EEA SURVEILLANCE REPORT
48
Table 3-11. HUS syndrome among reported STEC/VTEC cases, EU/EEA, 2007–09
HUS 2007 2008 2009 Total
Cases % Cases % Cases % Cases %
Yes 144 10.9 147 9.2 257 11.8 548 10.8
No 1 183 89.1 1 444 90.8 1 914 88.2 4 541 89.2
Total 1 327 100.0 1 591 100.0 2 171 100.0 5 089 100.0
Source: Austria, Belgium, Denmark, France, Germany, Greece, Hungary, Ireland, Italy, Malta, the Netherlands, Poland, Romania, Slovakia, Slovenia, Sweden, United Kingdom; non-EU countries: Iceland and Norway
Altogether, 19 countries (17 EU countries plus Iceland and Norway) provided data on HUS among STEC cases. HUS information was available for 52% of the total cases in 2007–09. HUS syndrome was reported in about 11% of the cases with known data in 2007–09. The proportion of HUS cases among reported STEC/VTEC cases remained relatively unchanged between 2007 and 2009 (Table 3-11).
Fourteen countries reported data on symptoms in HUS and non-HUS cases. The proportion of cases with bloody diarrhoea is two times higher in HUS than non-HUS cases (Table 3-12).
Table 3-12. Symptoms reported for STEC/VTEC-related HUS and non-HUS cases, EU/EEA, 2007–09
HUS
Symptom Yes % No % Total %
Bloody diarrhoea 120 60.3 757 26.3 877 28.5
Diarrhoea 79 39.7 2 122 73.7 2 201 71.5
Total 199 100.0 2 879 100.0 3 078 100.0
Source: Austria, Belgium, Denmark, Germany, Hungary, Ireland, Italy, Malta, the Netherlands, Poland, Slovenia, United Kingdom; non-EU countries: Iceland and Norway
Table 3-13. Reporting of outcome for confirmed STEC/VTEC cases, EU/EEA, 2007–09
Outcome 2007 2008 2009
Cases % Cases % Cases %
Alive 1 341 99.9 1 365 99.9 1 694 99.6
Dead 2 0.1 2 0.1 6 0.4
Total EU/EEA 1 343 100.0 1 367 100.0 1 700 100.0
Source: Austria, Cyprus, Denmark, Estonia, Germany, Hungary, Ireland, Italy, Malta, the Netherlands, Poland, Romania, Slovakia, Slovenia, Iceland and Norway.
Sixteen countries (14 EU countries plus Iceland and Norway) reported data on outcome in 2007–09 (Table 3-13). The proportion of unknown data (including missing data) varied between 54% and 57% during this period. Based on known data only, the proportion of deaths due to STEC/VTEC infection was low: ten deaths (<0.4%) were reported in the three-year period of surveillance (Table 3-13).
Discussion
The EU/EEA trend in STEC/VTEC infections increased slightly between 2006 and 2009. Several countries showed a continuous upward four-year trend, and only two countries followed a constant downward trend. More than half of STEC/VTEC cases (51%) were reported in children below 15 years. An increase in notification rates was detected in all age groups, particularly in children 1–4 years of age. Interestingly, between 2007 and 2009 no increase in notification rates was detected for males in the age groups below one year and 25–44 years.
The reported STEC/VTEC cases were most commonly of serotypes O157:H7, O157:H-, O103:H2, and O26:H11. Serotype O157:H7 accounted for almost 50% of all reported cases, and in combination with serotype O157:H-, about the percentage was 65%, making O157:H7/O157:H- the most dominant serotypes across all age groups in 2007–09. This is mainly due to procedures that focus on the detection of serogroup O157.
Serotypes O157:H7 and O157:H- showed some seasonality, with an increase of reported cases in summer and autumn.
STEC/VTEC was mainly of domestic origin, and only every fifth case was related to travel. Most of the imported cases could be traced to non-EU countries as the probable country of infection, mostly Mediterranean non-EU countries. Almost half of the STEC/VTEC cases for which hospitalisation data were known, required hospital care in 2007–09. This may be because STEC/VTEC poses a particular burden on children and severe cases from children are more likely to undergo laboratory investigation than other diarrhoeal cases.

SURVEILLANCE REPORT Surveillance of food- and waterborne diseases in the EU/EEA
49
Haemolytic-uraemic syndrome (HUS) was reported in about 11% of cases. HUS as a clinical manifestation was
more common in cases with bloody diarrhoea compared with cases without blood in their faeces. The case fatality was low, with ten STEC/VTEC-related deaths reported in the EU/EEA in the three-year period.
Several small foodborne outbreaks of STEC/VTEC (fewer than 10 cases) were reported in the EU/EEA in 2006–09 [1-4]. The number of confirmed cases in these outbreaks varied from 4% to 22% of all STEC/VTEC cases reported annually, with the majority of the cases being sporadic. In the outbreaks, VTEC O157 was the most commonly reported causative agent [1-4].
In 2006, at least three separate outbreaks of VTEC O157 infections occurred in Scotland and England, with 13, three and four confirmed cases, respectively. Three cases in one of the outbreaks were linked to a local butcher’s shop [19]. In Norway, a severe outbreak of VTEC O103:H25 involved 17 persons, of which 10 developed HUS; one child died. The source of infection was a traditional Norwegian sausage (morrpølse) made from lamb [1].
In 2007, Belgium reported an outbreak with VTEC O145 in association with VTEC O26. Five cases (2–11 years of age) developed HUS, and seven cases suffered from severe diarrhoea. Ice cream made from pasteurised milk and most likely contaminated by the food handler was the source of the infection [2]. In Denmark, an outbreak with VTEC O26:H11 occurred (20 confirmed cases). The source of the outbreak was organic cured beef sausage [2].
In 2008, notification rates peaked in Belgium and Sweden. Sweden did not report any VTEC outbreaks. Belgium reported an outbreak of VTEC O157:H7 with four hospitalised patients; two of them developed HUS. The source of the outbreak was raw minced meat [3]. In Ireland, numbers of VTEC increased in 2008 when a cluster of 22 VTEC cases was notified. The exposure to private well drinking water was the primary risk factor for most of the cases. VTEC was detected in three of the wells which had been contaminated by extensive flooding after exceptionally heavy rainfall [20].
In 2009, notification rates increased in Austria, Finland, France, Ireland, the Netherlands, Norway and the UK. Of 18 reported and verified foodborne VTEC outbreaks in the EU/EEA, seven (39%) were reported by Romania, with all together 228 cases, including the largest verified foodborne VTEC outbreak in 2009, involving 72 human cases, of which 32 were hospitalised. The food vehicle was red meat and meat products eaten in a camp picnic [4]. France reported two small VTEC outbreaks, a family outbreak caused by rare serotype O123:H- with two cases associated with ingestion of undercooked ground beef [21]. Several VTEC outbreaks were detected in the UK and the Netherlands [22, 23]. In the Netherlands, 20 confirmed cases were linked to the consumption of contaminated steak tartare (beef) which was contaminated with VTEC O157. In the United Kingdom, one of the largest VTEC
O157 outbreaks was linked to an open farm/petting zoo. The resulting 36 cases were mostly under 10 years of age [23]. The children got infected after petting and feeding the animals. Twelve children needed hospital treatment. Ireland reported four VTEC O157 waterborne outbreaks, involving eight cases of which three were hospitalised [4]. In Norway, six outbreaks contributed to the high number of cases in 2009. Contact with farm animals purportedly caused a local outbreak (16 cases, serogroup O145) in a kindergarten. Another local outbreak with three cases was suspected to be caused by using unpasteurised milk. VTEC serotype was not defined in these cases. Three outbreaks with unknown source were caused by serotype 0145 (three cases, one HUS), serotype O121 (three cases) and serotype O103 (seven cases). The largest, nationwide outbreak with 13 cases and nine HUS cases in children was caused by sorbitol-fermenting (SF) VTEC O157. The source was not confirmed or linked to any specific food products [24]. No verified VTEC outbreaks were reported in Austria and Finland.

Surveillance of food- and waterborne diseases in the EU/EEA SURVEILLANCE REPORT
50
References
1. European Food Safety Authority (EFSA) and European Centre for Disease Prevention and Control (ECDC). The European Union Summary Report on Trends and Sources of Zoonoses, Zoonotic Agents and Food-borne Outbreaks in 2009. EFSA Journal 2011;9(3),378 pp.
2. European Food Safety Authority (EFSA) and European Centre for Disease Prevention and Control (ECDC). The Community Summary Report on Trends and Sources of Zoonoses, Zoonotic Agents, Antimicrobial Resistance and Foodborne Outbreaks in the European Union in 2006. EFSA Journal 2007;130,2-352.
3. European Food Safety Authority (EFSA) and European Centre for Disease Prevention and Control (ECDC). The Community Summary Report on Food-Borne Outbreaks in The European Union in 2007. EFSA Journal 2009; 271,129 pp.
4. European Food Safety Authority (EFSA) and European Centre for Disease Prevention and Control (ECDC). The Community Summary Report on Trends and Sources of Zoonoses, Zoonotic Agents and Food-borne Outbreaks in the European Union in 2008. EFSA Journal 2010; 8(1),410 pp.
5. [No authors listed.] E. coli O157 infections in the UK. Euro Surveill. 2006;11(6):E060601 2.
6. O'Sullivan MB, Garvey P, O'Riordan M, Coughlan H, McKeown P, Brennan A, et al. Increase in VTEC cases in the south of Ireland: link to private wells? Euro Surveill. 2008 Sep 25;13(39).
7. King LA, Filliol-Toutain I, Mariani-Kurkidjian P, Vaillant V, Vernozy-Rozand C, Ganet S, et al. Family outbreak of Shiga toxin-producing Escherichia coli O123:H-, France, 2009 Emerg Infect Dis. 2010 Sep;16(9):1491-3.
8. Greenland K, de Jager C, Heuvelink A, van der Zwaluw K, Heck M, Notermans D, et al. Nationwide outbreak of STEC O157 infection in the Netherlands, December 2008–January 2009: continuous risk of consuming raw beef products. Euro Surveill. 2009 Feb 26;14(8).
9. Wise J. Outbreak of E. coli O157 is linked to Surrey open farm. BMJ. 2009 Sep 15;339:b3795.
10. Folkehelseinstituttet. Matbårne infeksjoner og utbrudd i 2009 Årsrapport. Folkehelseinstituttet: Oslo; 2010.

SURVEILLANCE REPORT Surveillance of food- and waterborne diseases in the EU/EEA
51
4 Listeriosis in the EU/EEA, 2006–09
Listeriosis
Listeriosis is a disease caused by an infection with the bacterium Listeria monocytogenes. It is a relatively rare infection, which may result in severe symptoms, primarily in elderly people, immunocompromised individuals, pregnant women and newborns. In healthy individuals, the infection can be asymptomatic or might present as a mild febrile illness or mild diarrhoea. In high-risk groups, the most common clinical presentations include septicaemia, meningitis, and pregnancy-associated infections. Maternal infection with L. monocytogenes may result in infection of foetus and subsequent spontaneous abortion, stillbirth or meningitis in a newborn.
Listeria infection is mostly acquired through consumption of contaminated food. Direct contact with infected animals or persons is another possible transmission route, as is vertical mother-to-foetus transmission. The incubation period usually lasts about three weeks but may range from 2 to 88 days.
Listeriosis is one of the leading causes of death among foodborne infections and remains a public health concern
because of its high case-fatality (15–30%) and hospitalisation rate (93.6%). Changes in food production, distribution and storage have increased the risk of diffuse and widespread outbreaks, involving several countries through contaminated food products. Foodborne Listeria infection is primarily acquired from ready-to-eat processed food.
More information on listeriosis can be found at the ECDC website: http://ecdc.europa.eu/en/healthtopics/listeriosis/Pages/index.aspx
Surveillance of listeriosis in the EU/EEA in 2006–09
Since 2008, ECDC has been coordinating the European surveillance of listeriosis infection, in close collaboration with a network of nominated experts, epidemiologists and microbiologists from EU/EEA countries and as part of the Food- and Waterborne Diseases and Zoonoses (FWD) network.
The surveillance of listeriosis at the EU level differs from other food- and waterborne diseases in that it focuses
merely on invasive infections resulting in severe symptoms or outcomes, such as meningitis, septicaemia or abortion. The scope of the surveillance is defined by the general surveillance objectives for food- and waterborne diseases (see Introduction) and the EU case definition for listeriosis (see Annex).
The aims and purposes of the disease-specific surveillance were discussed with the European Food- and Waterborne Diseases and Zoonoses network. For listeriosis, the suggested specific surveillance objectives are to:
improve the detection of dispersed clusters and outbreaks of listeriosis by setting up real-time molecular surveillance for human cases and connect/harmonise the typing methods with food, feed and animal strains; and
monitor the severity of disease (hospitalisation, outcome, specimen, pregnancy association).
Listeriosis surveillance through The European Surveillance System (TESSy) consists of standard reporting of cases and the collection of data on serotypes. Clusters and outbreaks are managed through the EPIS platform. Planned improvements for 2012–13 will broaden the scope of TESSy by adding standardised collection methods for molecular typing data.
In 2009, the reporting of listeriosis covered 25 variables, seven of which were seven specific to Listeria surveillance. The common variables are presented in the first table of the chapter on ‘Data collection and analyses’. Additional Listeria-specific variables are presented below in Table 4-1.
Table 4-1. Enhanced dataset collected for listeriosis cases, EU/EEA, 2006–09
Variable Description in TESSy
Hospitalisationa Hospitalisation of a case due to the cause of the disease
Imported Having been outside the country of notification during the incubation period of the reported disease
PregnancyAssociateda Abortion or miscarriage associated with confirmation of Listeria infection in the foetus, stillborn or newborn child up to one week of age
ProbableCountryOfInfection If Imported=Yes: one entry for each country/region visited during the incubation period of the disease. The variable is repeatable in case several countries/regions were visited.
Serotype Serotype of the pathogen which is the cause of the reported disease
SuspectedVehicle Suspected vehicle or source of infection
Transmission Suspected main mode of transmission
a Variable added in 2010 for 2009 reporting

Surveillance of food- and waterborne diseases in the EU/EEA SURVEILLANCE REPORT
52
National surveillance systems for listeriosis
Table 4-2. Notification systems for human listeriosis cases in EU/EEA, 2009
Country Notifiable
since Legal
charactera Case based/ aggregatedb
National coveragec
Changes in surveillance system in 2006–09
Austria 1947 Cp C Y 2009: introduction of the electronic Epidemic Reporting System (EMS)
Belgium < 1999 V C Y -d
Bulgaria Yes Cp A Y -
Cyprus 2005 Cp C Y -
Czech Republic Yes Cp C Y -
Denmark 1993 Cp C Y -
Estonia 2004 Cp C Y -
Finland 1995 Cp C Y -
France 1998 Cp C Y No changes
Germany 2001 Cp C Y -
Greece Yes Cp C Y -
Hungary 1998 Cp C Y -
Ireland 2004 Cp C Y -
Italy 1990 Cp C Y No changes
Latvia 1997 Cp C Y -
Lithuania 1998 Cp C Y -
Luxembourg 2004 CP+V - Y Since 2009, reported cases have included laboratory data
(voluntary), in addition to cases reported by physicians
(compulsory)
Malta Yes Cp C Y -
Netherlands 2008 Cp C Y -
Poland 1966 Cp C Y -
Portugal - - - - -
Romania Yes Cp C Y -
Slovakia 1985 Cp C Y No changes
Slovenia 1977 Cp C Y -
Spain 1982 V C N -
Sweden 1969 Cp C Y -
United Kingdom Yes V C Y -
Iceland Yes Cp C Y -
Liechtenstein Yes - - - -
Norway 1975 Cp C Y -
a Legal character: Cp=compulsory, V=voluntary
b C=case based, A=aggregated
c National coverage: Y=yes, N=no
d No data provided
Epidemiological situation in 2006–09
Major findings
The overall EU/EEA trend in listeriosis remained stable in 2006–09 but there are marked variations between countries. Many countries experienced an increase in 2009, and only very few countries experienced a decreasing trend.
The majority of L. monocytogenes infections were of domestic origin or acquired in an EU country. Most of the cases with available data were hospitalised; the proportion of cases with unknown data was
high in 2006. The high hospitalisation rate is due to a focus on invasive cases (as described in the EU case definition).

SURVEILLANCE REPORT Surveillance of food- and waterborne diseases in the EU/EEA
53
Listeriosis has a high case-fatality rate; it is one of the leading causes of death among foodborne infections.
In 2009, the overall case-fatality rate in the EU/EEA was 17%. Listeriosis notification rates dropped in infants (children under one year of age). Listeriosis notification rates in 2009 increased among the elderly (older than 65 years of age), particularly in
males over 85 years of age.
Overview of trends
The trends in reported listeriosis cases remained stable in the EU/EEA during the four-year period from 2006 to 2009 (Figure 4-1). The number of reported cases increased slightly, from 1 628 confirmed cases in 2006 to 1 685 cases in 2009 (Table 4-3). The average notification rate in 2006–07 was 0.37 cases per 100 000 population, dropped slightly in 2008 (0.33 cases per 100 000), and rose to 0.38 cases per 100 000 in 2009 (Table 4-3). In 2009, the highest notification rate and relative increase was reported in Denmark, where the notification rate increased from 0.93 cases in 2008 to 1.76 cases per 100 000 (Table 4-3).
Figure 4-1. Trend in notification rates of confirmed listeriosis cases, EU/EEA, 2006–09
Source: Austria, Belgium, Bulgaria, Czech Republic, Denmark, Estonia, Finland, France, Germany, Greece, Hungary, Ireland, Italy, Latvia, Lithuania, Luxembourg, Malta, the Netherlands, Poland, Slovakia, Slovenia, Sweden, United Kingdom; non-EU countries: Iceland and Norway
Table 4-3. Confirmed cases of listeriosis and notification rates (per 100 000 population) by country, EU/EEA, 2006–09
Country
Year of report
2006 2007 2008 2009
Cases Rate/100 000 Cases Rate/100 000 Cases Rate/100 000 Cases Rate/100 000
Austria 10 0.12 20 0.24 31 0.37 46 0.55
Belgium 67 0.64 57 0.54 64 0.60 58 0.54
Bulgaria 6 0.08 11 0.14 5 0.07 5 0.07
Cyprus 1 0.13 0 0.00 0 0.00 0 0.00
Czech Republic 78 0.76 51 0.50 37 0.36 32 0.31
Denmark 56 1.03 58 1.06 51 0.93 97 1.76
Estonia 1 0.07 3 0.22 8 0.60 3 0.22
Finland 46 0.88 40 0.76 40 0.75 34 0.64
France 290 0.46 319 0.50 276 0.43 328 0.51
Germany 508 0.62 356 0.43 306 0.37 394 0.48
Greece 7 0.06 10 0.09 1 0.01 4 0.04
Hungary 14 0.14 9 0.09 19 0.19 16 0.16
Ireland 7 0.17 21 0.49 13 0.30 10 0.22
Italy 59 0.10 89 0.15 118 0.20 88 0.15
Latvia 2 0.09 5 0.22 5 0.22 4 0.18
Lithuania 4 0.12 4 0.12 7 0.21 5 0.15
Luxembourg 4 0.85 6 1.26 1 0.21 3 0.61
Malta 0 0.00 0 0.00 0 0.00 0 0.00
Netherlands 64 0.39 68 0.42 45 0.27 0 0.27
Poland 28 0.07 43 0.11 33 0.09 32 0.08
Portugal - - - - - - - -
0.00
0.05
0.10
0.15
0.20
0.25
0.30
0.35
0.40
2006 2007 2008 2009
Co
nfi
rme
d c
ase
s/1
00
00
0
Year

Surveillance of food- and waterborne diseases in the EU/EEA SURVEILLANCE REPORT
54
Country
Year of report
2006 2007 2008 2009
Cases Rate/100 000 Cases Rate/100 000 Cases Rate/100 000 Cases Rate/100 000
Romania - - 0 0.00 0 0.00 6 0.03
Slovakia 12 0.22 9 0.17 8 0.15 10 0.18
Slovenia 7 0.35 4 0.20 3 0.15 6 0.30
Spaina 79 - 82 - 88 - 121 -
Sweden 42 0.46 56 0.61 60 0.65 73 0.79
United Kingdom 209 0.35 260 0.43 206 0.34 235 0.38
Total EU 1601 0.38 1581 0.36 1425 0.32 1654 0.37
Iceland 0 0.00 4 1.30 0 0.00 0 0.00
Liechtenstein - - - - - - - -
Norway 27 0.58 49 1.05 34 0.72 31 0.65
Total EU/EEA 1628 0.39 1634 0.37 1459 0.33 1685 0.38
a Population coverage is 25%
Of 28 EU/EEA countries reporting data for 2006–09 (cumulative total N=6 406), the highest number of listeriosis cases was reported from Germany (cumulative N=1 564), accounting for 25% of all reported cases, followed by France with 19% (cumulative N=1 213) and the United Kingdom with 14% (cumulative N=910) of all reported cases (Table 4-3).
Trends varied considerably between countries. Austria and Sweden showed an increasing four-year trend, whereas data for three countries (the Netherlands, Finland, and the Czech Republic) suggested a significant decreasing trend (Figure 4-2). All other countries in Figure 4-2 were grouped according to the magnitude of the notification rate reported by each country. As a result, any trend comparison between the countries in the graphs should be made with caution.
Seven countries experienced a peak in notification rates in 2007 (Poland, Bulgaria, Greece, Norway, Luxembourg, Iceland, Ireland) and in five countries the notification rates peaked in 2008 (Hungary, Lithuania, Italy, Latvia, and Estonia). Notification rates in Denmark and Germany changed significantly in 2009 after a steady decline in the previous three years (Figure 4-2).
Please note that in a country with a small population even low numbers of reported cases can lead to a relative overrepresentation.
Figure 4-2. Trends in notification rates of confirmed listeriosis cases in grouped EU/EEA countries, 2006–09
0.00
0.20
0.40
0.60
0.80
1.00
1.20
2006 2007 2008 2009
Co
nfi
rme
d c
ase
s/1
00
00
0
Year
Finland Czech Republic Netherlands
0.00
0.10
0.20
0.30
0.40
0.50
0.60
0.70
0.80
0.90
2006 2007 2008 2009
Co
nfi
rme
d c
ase
s/1
00
00
0
Year
Austria Sweden
0.00
0.20
0.40
0.60
0.80
1.00
1.20
1.40
1.60
1.80
2.00
2006 2007 2008 2009
Co
nfi
rme
d c
ase
s/1
00
00
0
Year
Denmark Luxembourg
0.00
0.10
0.20
0.30
0.40
0.50
0.60
0.70
2006 2007 2008 2009
Co
nfi
rme
d c
ase
s/1
00
00
0
Year
Germany Slovenia Slovakia

SURVEILLANCE REPORT Surveillance of food- and waterborne diseases in the EU/EEA
55
Please note that graphs are on different scales.
Age and gender
In 2009, the highest notification rate was observed in the age group ≥85 years (1.9 cases per 100 000), followed by the age group 75–84 years (1.5 cases per 100 000). An increased incidence in the elderly can already be observed in the group of over-65-year-olds: compared with the age group 45–64 years, notification rates are three to six times higher in 65–74-years-olds and 10 to 29 times higher in the oldest age group (Table 4-4). High notification rates were also observed in children below one year of age (1.4 cases per 100 000). In this age group, 41% of the cases with known data in 2009 were reported as related to transmission during pregnancy.
The male-to-female ratio was only balanced among infants (Figure 4-3). In other age groups, the gender ratio varied remarkably, from 1:2 in the age group 1–24 years (notification rate two times higher in women) to 2:1 (notification rate two times higher in males) in the age groups over 45 years (Figure 4-3, Table 4-4). In the age group 15–44 years, 38% of cases with known data (N=118) were associated with pregnancy.
0.00
0.10
0.20
0.30
0.40
0.50
0.60
0.70
2006 2007 2008 2009
Co
nfi
rme
d c
ase
s/1
00
00
0
Year
France United Kingdom BELGIUM Latvia
0.00
0.02
0.04
0.06
0.08
0.10
0.12
0.14
0.16
2006 2007 2008 2009
Co
nfi
rme
d c
ase
s/1
00
00
0
Year
Poland Bulgaria Greece
0.00
0.10
0.20
0.30
0.40
0.50
0.60
0.70
2006 2007 2008 2009
Co
nfi
rme
d c
ase
s/1
00
00
0
Year
Estonia Hungary Lithuania Italy
0.00
0.20
0.40
0.60
0.80
1.00
1.20
1.40
2006 2007 2008 2009
Co
nfi
rme
d c
ase
s/1
00
00
0
Year
Norway Ireland Iceland

Surveillance of food- and waterborne diseases in the EU/EEA SURVEILLANCE REPORT
56
Figure 4-3. Notification rates of confirmed listeriosis cases by age group and gender, EU/EEA, 2009
(N=1 657)
Source: Austria, Belgium, Czech Republic, Denmark, Estonia, Finland, France, Germany, Greece, Hungary, Ireland, Italy, Latvia, Luxembourg, the Netherlands, Poland, Romania, Slovakia, Slovenia, Spain, Sweden, United Kingdom; non-EU countries: Iceland and Norway
Table 4-4. Number of confirmed listeriosis cases and notification rate (per 100 000 population) by age group and gender, EU/EEA, 2009
2009
Age group Female Male Total
Cases Rate/100 000 Cases Rate/100 000 Cases Rate/100 000
<1 32 1.4 37 1.5 69 1.4
1–24 38 0.0 9 0.0 47 0.0
25–44 126 0.2 50 0.1 176 0.1
45–64 138 0.2 250 0.4 388 0.3
65–74 148 0.7 254 1.4 402 1.0
75–84 178 1.1 228 2.1 406 1.5
≥85 92 1.5 77 2.9 169 1.9
Total 752 0.3 905 0.4 1 657 0.4
Source: Austria, Belgium, Czech Republic, Denmark, Estonia, Finland, France, Germany, Greece, Hungary, Ireland, Italy, Latvia, Luxembourg, the Netherlands, Poland, Romania, Slovakia, Slovenia, Spain, Sweden, United Kingdom; non-EU countries: Iceland and Norway
Three-year trends in notification rates were analysed separately for each age group and by gender (Figure 4-4). The trend was decreasing in newborns of both genders. A sharp increase in notification rates in 2009 was observed in men over 85 years of age (Figure 4-4). A moderate increase was also noted in women over 85 years.
<1 1–24 25–44 45–64 65–74 75–84 ≥85
Male 1.5 0.0 0.1 0.4 1.4 2.1 2.9
Female 1.4 0.1 0.2 0.2 0.7 1.1 1.5
0.0
0.5
1.0
1.5
2.0
2.5
3.0
3.5
Co
nfi
rme
d c
ase
s/1
00
00
0
MaleFemale

SURVEILLANCE REPORT Surveillance of food- and waterborne diseases in the EU/EEA
57
Figure 4-4. Trends in notification rates of confirmed listeriosis cases by age groups and gender,
EU/EEA, 2007–09
Source: Austria, Belgium, Czech Republic, Estonia, Finland, France, Germany, Greece, Hungary, Ireland, Italy, Latvia, Luxembourg, the Netherlands, Poland, Slovakia, Slovenia, Spain, Sweden, United Kingdom; non-EU countries: Iceland and Norway
Listeria monocytogenes serotypes
The four most commonly reported L. monocytogenes serotypes in the EU/EEA in the three-year period 2007–09 were 4b, 1/2a, 1/2b and 1/2c (Table 4-5). Serotype 4b and 1/2a accounted for 40% and 27% of all reported serotypes in this period. The reporting of serotypes has improved over time: the proportion of serotypes reported as unknown steadily decreased from 71% in 2007 to 47% in 2009. Incomplete serotyping data (serogroup 1/2 and 4) were reported in about 20% of the cases.
The presented serotype data are mainly based on the classic commercial agglutination tests, dividing L. monocytogenes strains into 13 different serotypes. Some countries may have also reported PCR-based serotype/serogroup results. The distribution of the reported serotypes remained relatively stable during the three-year period 2007–09 (Figure 4-5).
Table 4-5. Listeria monocytogenes serotypes reported in EU/EEA countries, 2007–09
Serotype 2007 2008 2009
Cases % Cases % Cases %
4b 193 42.0 291 42.6 316 36.8
1/2a 106 23.1 203 29.7 241 28.1
1/2* 92 20.0 60 8.8 136 15.8
1/2b 26 5.7 51 7.5 89 10.4
4* 21 4.6 37 5.4 43 5.0
1/2c 19 4.1 15 2.2 32 3.7
Other 2 0.4 26 3.8 2 0.2
Total 459 100.0 683 100.0 859 100.0
* Incomplete reporting of serotypes
Source: Austria, Denmark, France, Germany, Ireland, Italy, Latvia, Luxembourg, the Netherlands, Poland, Romania, Slovakia, Sweden; non-EU countries: United Kingdom, Norway
0.00
0.50
1.00
1.50
2.00
2.50
3.00
2007 2008 2009
Co
nfi
rme
d c
ase
s/1
00
00
0
Year
<1
1–24
25–44
45–64
65–74
75–84
≥85
Males (N=2 474)
0.00
0.50
1.00
1.50
2.00
2.50
3.00
2007 2008 2009
Co
nfi
rme
d c
ase
s/1
00
00
0
Year
<1
1–24
25–44
45–64
65–74
75–84
≥85
Females (N=2 020)

Surveillance of food- and waterborne diseases in the EU/EEA SURVEILLANCE REPORT
58
Figure 4-5. Distribution of the most frequently reported human Listeria monocytogenes serotypes in
EU/EEA countries, 2007–09 (N=1971)
* Incomplete reporting of serotypes
Source: Austria, Denmark, France, Germany, Ireland, Italy, Latvia, Luxembourg, the Netherlands, Poland, Romania, Slovakia, Sweden, United Kingdom; non-EU country: Norway
Serotypes by age groups
Serotype 4b is distributed equally across all age groups (Figure 4-6). Serotype 4b accounted for 67% of reported serotypes in infants under one year of age (N=88, pooled data 2007–09). In this age group, serotype 1/2b has been very rare, and only one case was reported in 2007–09. In the age group over 85 years, serotypes 4b and 1/2a accounted for 42% and 24% of reported serotypes (N=202, pooled data 2007–09). However, the proportion
of unknown serotypes is relatively high (about 56%) and any interpretation must be made with caution.
Figure 4-6. Most commonly reported Listeria monocytogenes serotypes by age groups, EU/EEA, 2007–09 (N=1965)
* Incomplete reporting of serotypes
Source: Austria, Denmark, France, Germany, Ireland, Italy, Latvia, Luxembourg, the Netherlands, Poland, Romania, Slovakia, Sweden, United Kingdom; non-EU country: Norway
0%
10%
20%
30%
40%
50%
60%
70%
80%
90%
100%
2007 2008 2009
Year
N=(457) (657) (857)
4* (N=101)
1/2* (N=288)
1/2c (N=66)
1/2b (N=166)
1/2a (N=550)
4b (N=800)
0%
10%
20%
30%
40%
50%
60%
70%
80%
90%
100%
<1 1–24 25–44 45–64 65–74 75–84 ≥85
Age group
N=(88) (65) (179) (487) (460) (484) (202)
Other (N=30)
4* (N=97)
1/2* (N=288)
1/2c (N=66)
1/2b (N=164)
1/2a (N=530)
4b (N=790)

SURVEILLANCE REPORT Surveillance of food- and waterborne diseases in the EU/EEA
59
Seasonality
Seasonality was analysed for the two most frequently reported serotypes 4b and 1/2a. Serotype 4b shows some seasonality, with a peak of reported cases in August and some lower peaks in the spring, whereas serotype 1/2a seems to peak in summer, between July and August.
Figure 4-7. Number of reported Listeria monocytogenes serotype 4b and 1/2a cases by month, EU/EEA, 2007–09 (N=795 for serotype 4b and N=545 for serotype 1/2a)
Source: Austria, Belgium, France, Germany, Ireland, Italy, the Netherlands, Romania and the United Kingdom
Travel-related listeriosis
By definition, cases of listeriosis are recorded as imported for the purpose of data collection if a case stayed outside the country of notification during the incubation period. Since listeriosis may have a long incubation period (2–88 days), any assumptions regarding the country of origin of the infection should be made with caution. In the three-year period 2007–09 (N=4 741, pooled data), 70 cases (1.5%) were reported as imported. The probable country of infection was indicated in 48 cases. EU countries were noted as the country of infection twice as often (32 cases, 67%) as a non-EU countries (16 cases, 33%).
Severity
The severity of listeriosis was evaluated by looking at the incidence of hospitalisation, the case-fatality rate, and the occurrence of pregnancy-associated infections with adverse outcomes.
Hospitalisation data were included in the EU-level surveillance for the first time in 2009. Eight countries (Estonia, Hungary, Ireland, Poland, Romania, Slovenia, the United Kingdom and Norway) provided data on hospitalisation status. As expected, most of the cases (99%) for which data were available (N=317) were hospitalised although the proportion of unknown data (including missing data) was high (81%) for the first reporting year. The high hospitalisation rate is due to a focus on invasive cases according to the EU case definition (see Annex).
Table 4-6. Hospitalisation of confirmed listeriosis cases, EU/EEA, 2009
Code Hospitalisation
Cases %
Yes 314 99.1
No 3 0.9
Total 317 100.0
Note: TESSy data as of 29 Nov 2010
Source: Estonia, Hungary, Ireland, Poland, Romania, Slovenia, the United Kingdom; non-EU country: Norway
Fifteen countries provided outcome data; the annual proportion of unknown data (including missing data) was about 50% between 2007 and 2009. Based on available data, listeriosis case-fatality rates ranged from about 20% in 2007 to 17% in 2009. In 2008 and 2009, the highest case-fatality rate was reported in the age group over 85 years (Table 4-7). The majority of deaths were linked to serotypes 4b and 1/2a (51% and 32%, respectively) (N=234).
0
5
10
15
20
25
30
35
40
Jan Feb Mar Apr May Jun Jul Aug Sep Oct Nov Dec
Co
nfi
rme
d c
ase
s
Month
Min Median Max
Serotype 4b (N=796)
0
5
10
15
20
25
30
35
Jan Feb Mar Apr May Jun Jul Aug Sep Oct Nov Dec
Co
nfi
rme
d c
ase
s
Month
Min Median Max
Serotype 1/2a (N=545)
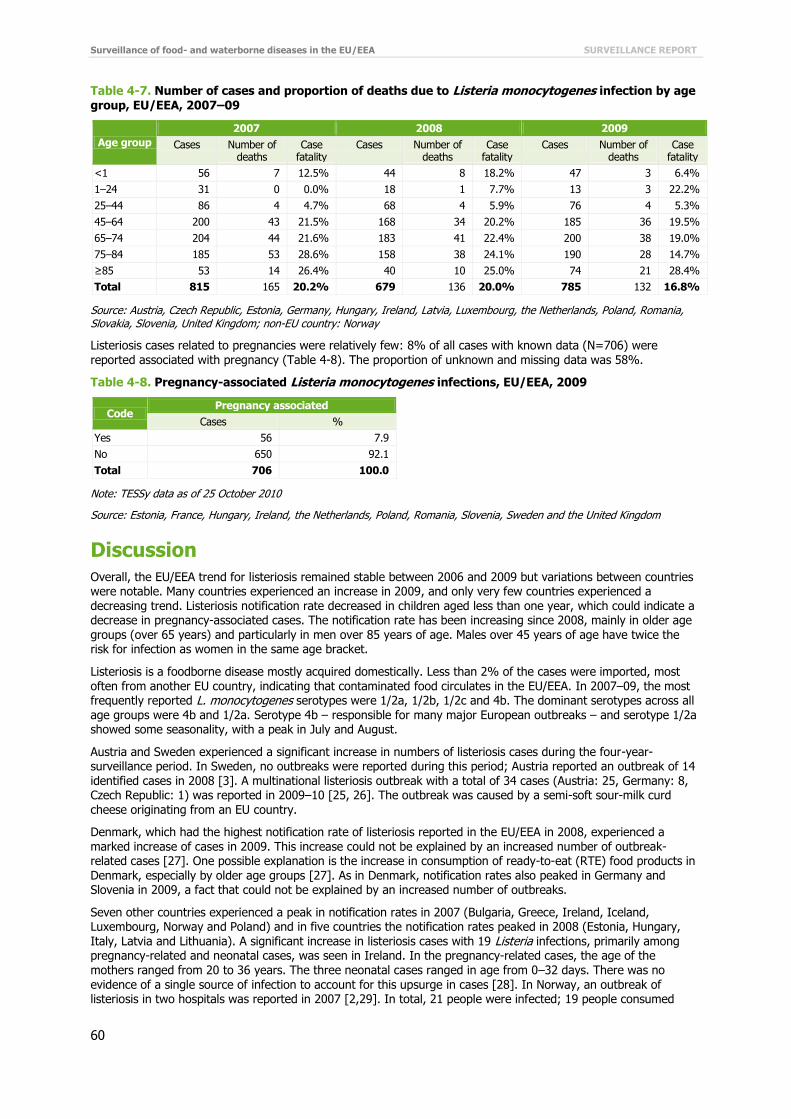
Surveillance of food- and waterborne diseases in the EU/EEA SURVEILLANCE REPORT
60
Table 4-7. Number of cases and proportion of deaths due to Listeria monocytogenes infection by age
group, EU/EEA, 2007–09
Age group
2007 2008 2009
Cases Number of deaths
Case fatality
Cases Number of deaths
Case fatality
Cases Number of deaths
Case fatality
<1 56 7 12.5% 44 8 18.2% 47 3 6.4%
1–24 31 0 0.0% 18 1 7.7% 13 3 22.2%
25–44 86 4 4.7% 68 4 5.9% 76 4 5.3%
45–64 200 43 21.5% 168 34 20.2% 185 36 19.5%
65–74 204 44 21.6% 183 41 22.4% 200 38 19.0%
75–84 185 53 28.6% 158 38 24.1% 190 28 14.7%
≥85 53 14 26.4% 40 10 25.0% 74 21 28.4%
Total 815 165 20.2% 679 136 20.0% 785 132 16.8%
Source: Austria, Czech Republic, Estonia, Germany, Hungary, Ireland, Latvia, Luxembourg, the Netherlands, Poland, Romania, Slovakia, Slovenia, United Kingdom; non-EU country: Norway
Listeriosis cases related to pregnancies were relatively few: 8% of all cases with known data (N=706) were reported associated with pregnancy (Table 4-8). The proportion of unknown and missing data was 58%.
Table 4-8. Pregnancy-associated Listeria monocytogenes infections, EU/EEA, 2009
Code Pregnancy associated
Cases %
Yes 56 7.9
No 650 92.1
Total 706 100.0
Note: TESSy data as of 25 October 2010
Source: Estonia, France, Hungary, Ireland, the Netherlands, Poland, Romania, Slovenia, Sweden and the United Kingdom
Discussion
Overall, the EU/EEA trend for listeriosis remained stable between 2006 and 2009 but variations between countries were notable. Many countries experienced an increase in 2009, and only very few countries experienced a decreasing trend. Listeriosis notification rate decreased in children aged less than one year, which could indicate a decrease in pregnancy-associated cases. The notification rate has been increasing since 2008, mainly in older age groups (over 65 years) and particularly in men over 85 years of age. Males over 45 years of age have twice the risk for infection as women in the same age bracket.
Listeriosis is a foodborne disease mostly acquired domestically. Less than 2% of the cases were imported, most often from another EU country, indicating that contaminated food circulates in the EU/EEA. In 2007–09, the most frequently reported L. monocytogenes serotypes were 1/2a, 1/2b, 1/2c and 4b. The dominant serotypes across all age groups were 4b and 1/2a. Serotype 4b – responsible for many major European outbreaks – and serotype 1/2a showed some seasonality, with a peak in July and August.
Austria and Sweden experienced a significant increase in numbers of listeriosis cases during the four-year-surveillance period. In Sweden, no outbreaks were reported during this period; Austria reported an outbreak of 14 identified cases in 2008 [3]. A multinational listeriosis outbreak with a total of 34 cases (Austria: 25, Germany: 8, Czech Republic: 1) was reported in 2009–10 [25, 26]. The outbreak was caused by a semi-soft sour-milk curd cheese originating from an EU country.
Denmark, which had the highest notification rate of listeriosis reported in the EU/EEA in 2008, experienced a marked increase of cases in 2009. This increase could not be explained by an increased number of outbreak-related cases [27]. One possible explanation is the increase in consumption of ready-to-eat (RTE) food products in Denmark, especially by older age groups [27]. As in Denmark, notification rates also peaked in Germany and Slovenia in 2009, a fact that could not be explained by an increased number of outbreaks.
Seven other countries experienced a peak in notification rates in 2007 (Bulgaria, Greece, Ireland, Iceland, Luxembourg, Norway and Poland) and in five countries the notification rates peaked in 2008 (Estonia, Hungary, Italy, Latvia and Lithuania). A significant increase in listeriosis cases with 19 Listeria infections, primarily among pregnancy-related and neonatal cases, was seen in Ireland. In the pregnancy-related cases, the age of the mothers ranged from 20 to 36 years. The three neonatal cases ranged in age from 0–32 days. There was no
evidence of a single source of infection to account for this upsurge in cases [28]. In Norway, an outbreak of listeriosis in two hospitals was reported in 2007 [2,29]. In total, 21 people were infected; 19 people consumed

SURVEILLANCE REPORT Surveillance of food- and waterborne diseases in the EU/EEA
61
contaminated soft cheese in hospitals and two cases bought the cheese at a local market. All cases were
hospitalised and five of them died. The outbreak was caused by pasteurised camembert cheese produced in a small farm and sold to hospitals and local food markets. A high infectious dose seems to be linked to a shorter incubation period of 3–4 days [29].
Other countries did not report increased numbers of outbreaks that could explain the peaks in notification rates in 2007 and 2008. Three cases of listeriosis were reported in patients in one hospital in England in 2011 [30]. Two cases were in the age group 50–59 years and one was over 80 years of age. All cases had underlying conditions. Consumption of hospital-supplied pre-packed sandwiches and salads were identified as a common source of exposure. Breaches in cold chain and shelf life controls at hospital level were identified as key contributing factors.
According to Regulation (EC) No 178/2002 of the European Parliament and of the Council of 28 January2002 laying down the general principles and requirements of food law, establishing the European Food Safety Authority and laying down procedures in matters of food safety, all food placed on the market must be safe to eat.
According to Commission Regulation (EC) No 2073/2005 of 15 November 2005 on microbiological criteria for foodstuffs, L. monocytogenes limits are set to ‘absence in 25 g’ in ready-to-eat food intended for infants and for special medical purposes. For other ready-to-eat (RTE) food items, L. monocytogenes bacteria levels shall not exceed 100 cfu/g during shelf life.
In 2006–09, L. monocytogenes was most commonly isolated from soft and semi-soft cheeses, RTE fishery and RTE meat products among single samples collected at retail in EU Member States [4]. A substantial number of food investigations in Member States found L. monocytogenes also in other RTE products, such as salads, sandwiches, sauces and soups, but levels above 100 cfu/g were rare.
The EU Regulation on microbiological criteria for foodstuffs should be followed strictly and levels of L. monocytogenes should stay well within the levels considered safe. However, even a low-level of L. monocytogenes contamination can cause listeriosis in compromised patients, the elderly and pregnant women. More awareness is needed about the listeria risk that certain RTE foods pose to certain groups.
Hospital-related outbreaks remain a significant patient safety concern and underline the risk related to processed RTE foods in settings where vulnerable population groups are served, such as hospitals and elderly homes.

Surveillance of food- and waterborne diseases in the EU/EEA SURVEILLANCE REPORT
62
References
1. European Food Safety Authority (EFSA) and European Centre for Disease Prevention and Control (ECDC). The community summary report on trends and sources of zoonoses, zoonotic agents and food-borne outbreaks in the European Union in 2008. EFSA Journal 2010; 8(1),410 pp.
2. Fretz R, Pichler J, Sagel U, Much P, Ruppitsch W, Pietzka AT, et al. Update: Multinational listeriosis outbreak due to 'Quargel', a sour milk curd cheese, caused by two different L. monocytogenes serotype 1/2a strains, 2009-2010. Euro Surveill. 2010 Apr 22;15(16).
3. Fretz R, Sagel U, Ruppitsch W, Pietzka A, Stoger A, Huhulescu S, et al. Listeriosis outbreak caused by acid curd cheese Quargel , Austria and Germany 2009. Euro Surveill. 2010 Feb 4;15(5).
4. Jensen AK, Ethelberg S, Smith B, Nielsen EM, Larsson J, Molbak K, et al. Substantial increase in listeriosis, Denmark 2009. Eurosurveillance. 2010 Mar 25;15(12):12-5.
5. Garvey P, McKeown P. Increase in Listeriosis in Ireland, 2007. Diseases Surveillance Report of HPSC, Epi Insight. 2007;8(12).
6. European Food Safety Authority (EFSA) and European Centre for Disease Prevention and Control (ECDC). The Community Summary Report on Food-Borne Outbreaks in The European Union in 2007. EFSA Journal 2009; 271,129 pp.
7. Johnsen BO, Lingaas E, Torfoss D, Strom EH, Nordoy I. A large outbreak of Listeria monocytogenes infection with short incubation period in a tertiary care hospital. J Infect. 2010 Dec;61(6):465-70.
8. Coetzee N, Laza-Stanca V, Orendi JM, Harvey S, Elviss NC, Grant KA. A cluster of Listeria monocytogenes infections in hospitalised adults, Midlands, England, February 2011. Eurosurveillance. 2011 May 19;16(20):2-4.
9. European Food Safety Authority (EFSA) and European Centre for Disease Prevention and Control (ECDC). The European Union Summary Report on Trends and Sources of Zoonoses, Zoonotic Agents and Food-borne Outbreaks in 2009. EFSA Journal 2011;9(3),378 pp.

SURVEILLANCE REPORT Surveillance of food- and waterborne diseases in the EU/EEA
63
5 Yersiniosis in the EU/EEA, 2006–09
Yersiniosis
Yersinia pseudotuberculosis and pathogenic biotypes of Y. enterocolitica cause foodborne enteric infections in humans. Yersiniosis occurs in all EU countries and is the third most commonly reported bacterial foodborne disease in the EU. Most enteric Yersinia infections are caused by Y. enterocolitica.
Infection with Y. enterocolitica is most often reported in young children, whereas Y. pseudotuberculosis is diagnosed more often in middle aged and elderly population. In young children, yersiniosis commonly causes fever, abdominal pain, and diarrhoea, which may be bloody. Fever and diarrhoea may last for 1–3 weeks. In older children and adults, acute mesenteric lymphadenitis is manifested by right-sided lower abdominal pain and may be confused with appendicitis. This can lead to unnecessary appendectomies, which may in turn result in a detection of an outbreak of yersiniosis. In a small proportion of cases, complications such as skin rash (erythema nodosum) or joint pains (reactive arthritis) may occur. Invasive infection (bacteraemia) may develop in immunocompromised
persons.
Oral transmission is the most common route, requiring a relatively high infective dose, sometimes up to 109 organisms. Infections are mainly contracted by the consumption of undercooked pork products, raw vegetables and fruits or unpasteurised milk and may also be contracted through contaminated natural or tap water. The incubation period is usually 3–7 days.
More information on yersiniosis can be found at the ECDC website: http://ecdc.europa.eu/en/healthtopics/yersiniosis/Pages/index.aspx
Surveillance of yersiniosis in the EU/EEA in 2006–09 Since 2008, ECDC has been coordinating the European surveillance of yersiniosis, in close collaboration with a network of nominated experts, epidemiologists and microbiologists from EU/EEA countries and as part of the Food- and Waterborne Diseases and Zoonoses (FWD) network.
The scope of yersiniosis surveillance is defined by the general surveillance objectives for food- and waterborne diseases (see Introduction) and the EU case definition for yersiniosis (see Annex).
The aims and specific activities needed to strengthen yersiniosis surveillance were discussed with the European Food- and Waterborne Diseases and Zoonoses network. For yersiniosis surveillance, two important areas were highlighted:
Determination of true incidence and prevalence of Yersinia infections in humans in the EU Harmonise laboratory methods and techniques by
identifying the most appropriate medium for Yersinia spp. isolation; defining standardised biotyping to monitor the level of pathogenicity; defining standardised molecular typing methods.
In 2009, the reporting of yersiniosis covered 26 variables, of which eight were specific for Yersinia. The common variables are presented in the first table of the chapter on ‘Data collection and analyses’. All additional Yersinia-specific variables are presented below in Table 5-1.
Table 5-1. Enhanced dataset collected for yersinosis cases, EU/EEA, 2006–09
Variable Description in TESSy
AntigenO Only somatic (O) antigen of the antigenic formula of the pathogen which is the cause of the reported disease
Biovara Biogrouping of Yersinia species
Hospitalisationa Hospitalisation of a case due to the cause of the disease
Imported Having been outside the country of notification during the incubation period of the reported disease
Pathogen Species or genus of the pathogen which is the cause of the reported disease
Probable country of infection If Imported=Yes: one entry for each country/region visited during the incubation period of the disease. The variable is repeatable in case several countries/regions were visited.
Suspected vehicle Suspected vehicle or source of infection
Transmission Suspected main mode of transmission
a Variable added in 2010 for 2009 reporting

Surveillance of food- and waterborne diseases in the EU/EEA SURVEILLANCE REPORT
64
National surveillance systems for yersiniosis
Table 5-2. Notification system of human yersiniosis cases in EU/EEA countries, 2009
Country Notifiable
since Legal
charactera Case based/ aggregatedb
National coveragec
Remarks on the surveillance systems in 2006–09
Austria 1947 Cp C Y 2009: introduction of the electronic Epidemic Reporting System (EMS)
Belgium <1999 V C Y -d
Bulgaria Yes Cp A Y -
Cyprus 2005 Cp C Y -
Czech Republic
Yes Cp C Y -
Denmark 1979 Cp C Y -
Estonia 1982 Cp C Y -
Finland 1995 Cp C Y -
France 1968 V C Y -
Germany 2 Cp C Y -
Greece - - - - -
Hungary 1998 Cp C Y -
Ireland 2004 Cp C Y -
Italy 1990 V C - No changes
Latvia 1986 Cp C Y -
Lithuania 1985 Cp C Y -
Luxembourg 2004 Cp+V C Y Since 2009, reported cases have included laboratory data (voluntary), in addition to cases reported by
physicians (compulsory)
Malta Yes Cp C Y -
Netherlands - - - - -
Poland 2004 Cp C Y -
Portugal - - - - -
Romania Yes Cp C Y -
Slovakia 1990 Cp C Y No changes
Slovenia 1977 Cp C Y -
Spain 1989 V C N -
Sweden 1996 Cp C Y -
United Kingdom
No O C Y -
Iceland - - - - -
Liechtenstein Yes - - - -
Norway 1992 Cp C Y -
a Legal character, Cp=compulsory, V=voluntary, O=other
b C=case based, A=aggregated
c National coverage Y=yes, N=No
d No data provided
Epidemiological situation in 2006–09
Major findings
Yersiniosis trends in 2006–09 declined steadily in EU/EEA countries, but trends varied considerably across countries. Half of the countries reported decreasing trends for yersiniosis between 2006 and 2009.
Yersiniosis places a heavy burden on children. Over 50% of the cases were notified in children below 15 years.
The notification rate in children below 15 years decreased for both genders in 2007–09. The majority of cases (97%) were of domestic origin or acquired in another EU country. Yersiniosis has a low known case-fatality ratio. Only three deaths due to Yersinia infection were reported
between 2007 and 2009.

SURVEILLANCE REPORT Surveillance of food- and waterborne diseases in the EU/EEA
65
The most common serotype is Yersinia enterocolitica O:3, which is spread across all age groups in the
EU/EEA.
Overview of trends
Based on the data reported by 21 EU/EEA countries for the whole four-year period, the trend of yersiniosis decreased between 2006 and 2009 (Figure 5-1). During the same period, the number of reported cases of yersiniosis declined by 16%: from 9 071 confirmed cases reported in 2006 to 7 638 cases in 2009 (Table 5-3). In 2009, the highest notification rates were reported by Lithuania and Finland, 14.42 and 11.88 per 100 000 population, respectively (Table 5-2). From 2006 to 2009, these two countries constantly reported notification rates that were five to eight times higher than the EU rate during the same period (Table 5-2).
Figure 5-1. Trend in notification rates of confirmed yersiniosis cases, EU/EEA, 2006–09
Source: Austria, Belgium, Bulgaria, Cyprus, Czech Republic, Denmark, Estonia, Finland, Germany, Hungary, Ireland, Latvia, Lithuania, Luxembourg, Malta, Poland, Slovakia, Slovenia, Sweden, United Kingdom; non-EU country: Norway
Table 5-3. Confirmed cases of yersiniosis and notification rates (per 100 000 population) by country, EU/EEA, 2006–09
Country
Year
2006 2007 2008 2009
Cases Rate/100 000 Cases Rate/100 000 Cases Rate/100 000 Cases Rate/100 000
Austria 158 1.91 142 1.71 93 1.12 140 1.68
Belgium 264 2.51 248 2.34 273 2.56 238 2.23
Bulgaria 5 0.06 8 0.10 10 0.13 8 0.11
Cyprus 0 0.00 0 0.00 0 0.00 0 0.00
Czech Republic 534 5.21 576 5.60 557 5.37 463 4.42
Denmark 215 3.96 274 5.03 331 6.04 238 4.32
Estonia 42 3.12 76 5.66 42 3.13 54 4.03
Finland 795 15.13 480 9.10 608 11.47 633 11.88
France - - - - 213 0.33 208 0.32
Germany 5 161 6.26 4987 6.06 4 352 5.29 3 731 4.55
Greece - - - - - - - -
Hungary 38 0.38 55 0.55 40 0.40 51 0.51
Ireland 1 0.02 6 0.14 3 0.07 3 0.07
Italy 0 0.00 - - - - 11 0.02
Latvia 92 4.01 41 1.80 50 2.20 45 1.99
Lithuania 411 12.08 569 16.81 536 15.92 483 14.42
Luxembourg 5 1.07 22 4.62 17 3.51 36 7.29
Malta 0 0.00 0 0.00 0 0.00 0 0.00
Netherlands - - - - - - - -
Poland 111 0.29 182 0.48 214 0.56 288 0.76
Portugal 0 0.00 - - - - - -
Romania - - 0 0.00 9 0.04 5 0.02
Slovakia 82 1.52 71 1.32 68 1.26 167 3.09
Slovenia 79 3.94 32 1.59 31 1.54 27 1.33
Spaina 375 - 381 - 315 - 291 -
0.00
0.50
1.00
1.50
2.00
2.50
3.00
3.50
2006 2007 2008 2009
Co
nfi
rme
d c
ase
s/1
00
00
0
Year

Surveillance of food- and waterborne diseases in the EU/EEA SURVEILLANCE REPORT
66
Country
Year
2006 2007 2008 2009
Cases Rate/100 000 Cases Rate/100 000 Cases Rate/100 000 Cases Rate/100 000
Sweden 558 6.17 567 6.22 546 5.95 397 4.29
United Kingdom
59 0.10 86 0.14 48 0.08 61 0.10
Total EU 8 985 2.58 8 803 2.92 8 356 2.28 7 578 1.78
Iceland 0 0.00 - - - - - -
Liechtenstein - - - - - - - -
Norway 86 1.85 71 1.52 50 1.06 60 1.25
Total EU/EEA 9 071 2.57 8 874 2.90 8 406 2.27 7 638 1.77
a Population coverage is 25%
Based on the data on confirmed yersiniosis cases that were reported by 27 EU/EEA countries in 2006–09 (cumulative total N=33 989), the highest burden of yersiniosis was in Germany (cumulative N=18 231), accounting
for 54% of all reported cases, followed by Finland with 7% (cumulative N=2 516) and the Czech Republic with 6% (cumulative N=2 130) of all reported cases. Germany accounted for 69% of the decrease in reported cases, whereas Poland accounted for 42% of the increase between 2006 and 2009 (Table 5-3).
Trends in the notification rates varied considerably across countries (Figure 5-2). Luxembourg and Poland showed an increasing four-year trend, whereas Germany and Slovenia suggested a decreasing trend (Figure 5-2). Four countries experienced a peak in notification rates in 2007 (Estonia, Lithuania, the United Kingdom and Ireland). One year later, notification rates peaked in Denmark and Bulgaria.
Figure 5-2. Trends in notification rates of confirmed yersiniosis cases in grouped EU/EEA countries, 2006–09
0.00
1.00
2.00
3.00
4.00
5.00
6.00
7.00
2006 2007 2008 2009
Co
nfi
rme
d c
ase
s/1
00
00
0
Year
Germany Slovenia
0.00
1.00
2.00
3.00
4.00
5.00
6.00
7.00
8.00
2006 2007 2008 2009
Co
nfi
rme
d c
ase
s/1
00
00
0
Year
Luxembourg Poland
0.00
2.00
4.00
6.00
8.00
10.00
12.00
14.00
16.00
18.00
2006 2007 2008 2009
Co
nfi
rme
d c
ase
s/1
00
00
0
Year
Lithuania Finland
0.00
1.00
2.00
3.00
4.00
5.00
6.00
7.00
2006 2007 2008 2009
Co
nfi
rme
d c
ase
s/1
00
00
0
Year
Czech Republic Sweden Belgium Austria

SURVEILLANCE REPORT Surveillance of food- and waterborne diseases in the EU/EEA
67
Please note that graphs are on different scales.
Age and gender
In 2009, data on age and gender were available for 90% of confirmed cases from 20 EU/EEA countries (Figure 5-3). The highest notification rates among both genders were in the youngest age groups, particularly in the age group 1–4 years, with a notification rate of 11.4 cases per 100 000 for females and 12.7 cases for males (Figure 5-3). Children between 1 and 14 years of age made up 53% of all reported cases with known data for gender and age (Table 5-4).
0.00
1.00
2.00
3.00
4.00
5.00
6.00
2006 2007 2008 2009
Co
nfi
rme
d c
ase
s/1
00
00
0
Year
Estonia Slovakia
0.00
0.20
0.40
0.60
0.80
1.00
1.20
1.40
1.60
1.80
2.00
2006 2007 2008 2009
Co
nfi
rme
d c
ase
s/1
00
00
0
Year
Norway Hungary
0.00
0.02
0.04
0.06
0.08
0.10
0.12
0.14
0.16
2006 2007 2008 2009
Co
nfi
rme
d c
ase
s/1
00
00
0
Year
Bulgaria United Kingdom Ireland
0.00
1.00
2.00
3.00
4.00
5.00
6.00
7.00
2006 2007 2008 2009
Co
nfi
rme
d c
ase
s/1
00
00
0
Year
Denmark Latvia

Surveillance of food- and waterborne diseases in the EU/EEA SURVEILLANCE REPORT
68
Figure 5-3. Notification rates of confirmed yersiniosis cases by age group and gender, EU/EEA, 2009
(N=6896)
Source: Austria, Belgium, Czech Republic, Denmark, Estonia, Finland, Germany, Hungary, Ireland, Italy, Latvia, Luxembourg, Poland, Romania, Slovakia, Slovenia, Spain, Sweden, United Kingdom; non-EU country: Norway
Table 5-4. Number of confirmed yersiniosis cases and notification rate (per 100 000 population) by age group and gender, EU/EEA, 2009
2009
Age group Female Male Total
Cases Rate/100 000 Cases Rate/100 000 Cases Rate/100 000
<1 111 5.6 133 6.4 244 6.0
1–4 867 11.4 1 021 12.7 1 888 12.1
5–14 702 3.6 1 038 5.1 1 740 4.4
15–24 329 1.4 455 1.9 784 1.6
25–44 496 0.9 518 0.9 1 014 0.9
45–64 392 0.8 359 0.7 751 0.7
≥65 286 0.7 189 0.7 475 0.7
Total 3 183 1.6 3 713 2.0 6 896 1.8
Source: Austria, Belgium, Czech Republic, Denmark, Estonia, Finland, Germany, Hungary, Ireland, Italy, Latvia, Luxembourg, Poland, Romania, Slovakia, Slovenia, Spain, Sweden, United Kingdom; non-EU country: Norway
Figure 5-4. Semi-logarithmic graph showing notification rates of confirmed yersiniosis cases by age group and gender, EU/EEA, 2007–09
Source: Austria, Belgium, Czech Republic, Denmark, Estonia, Finland, Germany, Hungary, Ireland, Latvia, Luxembourg, Poland, Slovakia, Slovenia, Spain, Sweden, United Kingdom; non-EU country: Norway
A total of 18 countries (17 EU countries plus Norway) provided data on age and gender for the three-year-period 2007–09. All age groups presented rather stable or slightly decreasing trends in both genders (Figure 5-4).
<1 1–4 5–14 15–24 25–44 45–64 ≥65
Male 6.4 12.7 5.1 1.9 0.9 0.7 0.7
Female 5.6 11.4 3.6 1.4 0.9 0.8 0.7
0.0
2.0
4.0
6.0
8.0
10.0
12.0
14.0
Co
nfi
rme
d c
ase
s/1
00
00
0
Male
Female
0.1
1
10
2007 2008 2009
Year
<1
1–4
5–14
15–24
25–44
45–64
≥65
Females (N=10 411)
Co
nfi
rme
d c
ase
s/1
00
00
0
0.1
1
10
2007 2008 2009
Year
<1
1–4
5–14
15–24
25–44
45–64
≥65
Males (N=12 240)
Co
nfi
rme
d c
ase
s/1
00
00
0

SURVEILLANCE REPORT Surveillance of food- and waterborne diseases in the EU/EEA
69
Yersinia species
Yersinia enterocolitica was the most commonly reported Yersinia species in all age groups in 2007–09, making up about 93% of cases with reported data on species (Table 5-5). The highest cumulative number of Y. enterocolitica cases was counted for children in the age group 1–4 years (N=5 922), followed by the age group 5–14 years (N=5 469), together covering 54% of all reported Y. enterocolitica cases in 2007–09. The lowest cumulative number of cases was reported for infants below one year (N=772), representing fewer than 4% of all reported Y. enterocolitica cases. The largest cumulative number of Y. pseudotuberculosis cases was reported in the age groups 25–44 years (N=101) and 45–64 years (N=78), which together accounted for 61% of the reported Y. pseudotuberculosis cases (Figure 5-5). However, Y. pseudotuberculosis cases represented a minor proportion (less than 2%) of all the reported Yersinia cases in 2007–09. Only one Y. pseudotuberculosis case was reported in the age group younger than one year. The proportion of non-speciated Yersinia spp. was about 6% during the three-year-period 2007–09.
Table 5-5. Yersinia species in confirmed yersiniosis cases, EU/EEA, 2007–09
Species 2007 2008 2009
Cases % Cases % Cases %
Y. enterocolitica 8 307 93.9 7 534 92.3 6 995 93.7
Y. pseudotuberculosis 64 0.7 146 1.8 97 1.3
Yersinia spp. 453 5.1 465 5.7 350 4.7
Yersinia other 20 0.2 16 0.2 27 0.4
Total 8 844 100.0 8 161 100.0 7 469 100.0
Source: Austria, Belgium, Czech Republic, Denmark, Estonia, Finland, Germany, Hungary, Ireland, Italy, Latvia, Lithuania, Luxembourg, Poland, Romania, Slovakia, Slovenia, Spain, Sweden, United Kingdom; non-EU country: Norway
Figure 5-5. Semi-logarithmic graph showing number of confirmed yersiniosis cases by species and age groups, EU/EEA, 2007–09 (N=21 394)
Source: Austria, Belgium, Czech Republic, Denmark, Estonia, Finland, Germany, Hungary, Ireland, Italy, Latvia, Luxembourg, Poland, Romania, Slovakia, Slovenia, Spain, Sweden, United Kingdom; non-EU country: Norway
Seasonality
The seasonality was analysed for Y. enterocolitica and Y. pseudotuberculosis separately. Y. enterocolitica showed some seasonality, with an increased number of cases in summer and autumn (Figure 5-6). Numbers for Y. pseudotuberculosis was stable throughout the years, with no clear seasonality and fewer than 20 cases/month reported. In July 2008, a Y. pseudotuberculosis outbreak in Finland caused an almost sixfold increase of confirmed cases (Figure 5-6).
1
10
100
1000
<1 1–4 5–14 15–24 25–44 45–64 ≥65
Co
nfi
rme
d c
ase
s
Age group
Y. enterocolitica x 10 (N=21 100)
Y. pseudotuberculosis (N=294)
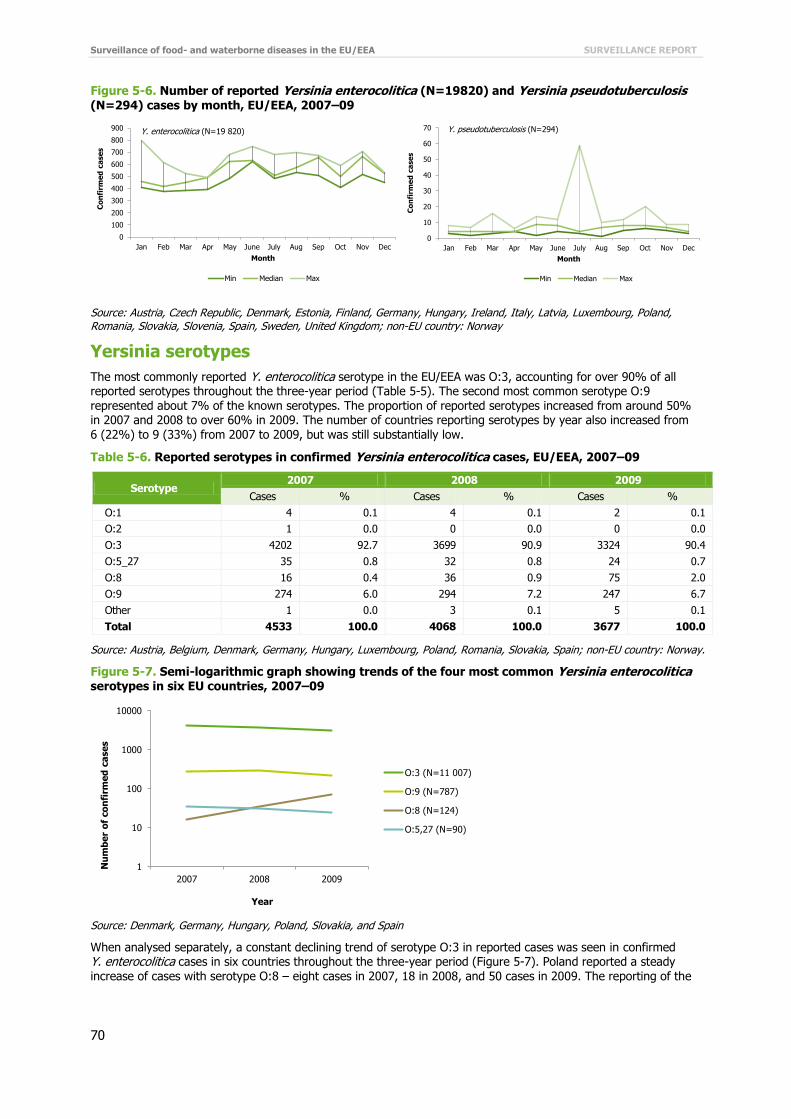
Surveillance of food- and waterborne diseases in the EU/EEA SURVEILLANCE REPORT
70
Figure 5-6. Number of reported Yersinia enterocolitica (N=19820) and Yersinia pseudotuberculosis
(N=294) cases by month, EU/EEA, 2007–09
Source: Austria, Czech Republic, Denmark, Estonia, Finland, Germany, Hungary, Ireland, Italy, Latvia, Luxembourg, Poland, Romania, Slovakia, Slovenia, Spain, Sweden, United Kingdom; non-EU country: Norway
Yersinia serotypes
The most commonly reported Y. enterocolitica serotype in the EU/EEA was O:3, accounting for over 90% of all reported serotypes throughout the three-year period (Table 5-5). The second most common serotype O:9 represented about 7% of the known serotypes. The proportion of reported serotypes increased from around 50% in 2007 and 2008 to over 60% in 2009. The number of countries reporting serotypes by year also increased from 6 (22%) to 9 (33%) from 2007 to 2009, but was still substantially low.
Table 5-6. Reported serotypes in confirmed Yersinia enterocolitica cases, EU/EEA, 2007–09
Serotype 2007 2008 2009
Cases % Cases % Cases %
O:1 4 0.1 4 0.1 2 0.1
O:2 1 0.0 0 0.0 0 0.0
O:3 4202 92.7 3699 90.9 3324 90.4
O:5_27 35 0.8 32 0.8 24 0.7
O:8 16 0.4 36 0.9 75 2.0
O:9 274 6.0 294 7.2 247 6.7
Other 1 0.0 3 0.1 5 0.1
Total 4533 100.0 4068 100.0 3677 100.0
Source: Austria, Belgium, Denmark, Germany, Hungary, Luxembourg, Poland, Romania, Slovakia, Spain; non-EU country: Norway.
Figure 5-7. Semi-logarithmic graph showing trends of the four most common Yersinia enterocolitica serotypes in six EU countries, 2007–09
Source: Denmark, Germany, Hungary, Poland, Slovakia, and Spain
When analysed separately, a constant declining trend of serotype O:3 in reported cases was seen in confirmed Y. enterocolitica cases in six countries throughout the three-year period (Figure 5-7). Poland reported a steady
increase of cases with serotype O:8 – eight cases in 2007, 18 in 2008, and 50 cases in 2009. The reporting of the
0
100
200
300
400
500
600
700
800
900
Jan Feb Mar Apr May June July Aug Sep Oct Nov Dec
Co
nfi
rme
d c
ase
s
Month
Min Median Max
Y. enterocolitica (N=19 820)
0
10
20
30
40
50
60
70
Jan Feb Mar Apr May June July Aug Sep Oct Nov Dec
Co
nfi
rme
d c
ase
s
Month
Min Median Max
Y. pseudotuberculosis (N=294)
1
10
100
1000
10000
2007 2008 2009
Nu
mb
er
of
co
nfi
rme
d c
ase
s
Year
O:3 (N=11 007)
O:9 (N=787)
O:8 (N=124)
O:5,27 (N=90)
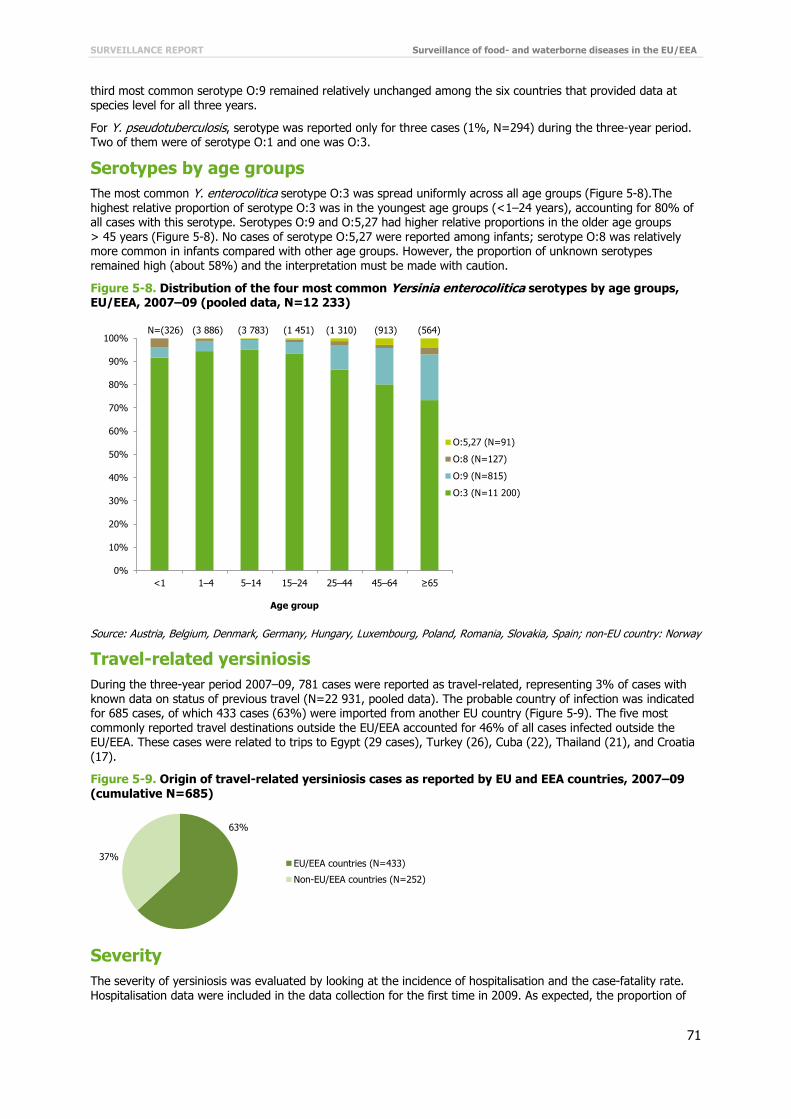
SURVEILLANCE REPORT Surveillance of food- and waterborne diseases in the EU/EEA
71
third most common serotype O:9 remained relatively unchanged among the six countries that provided data at
species level for all three years.
For Y. pseudotuberculosis, serotype was reported only for three cases (1%, N=294) during the three-year period. Two of them were of serotype O:1 and one was O:3.
Serotypes by age groups
The most common Y. enterocolitica serotype O:3 was spread uniformly across all age groups (Figure 5-8).The highest relative proportion of serotype O:3 was in the youngest age groups (<1–24 years), accounting for 80% of all cases with this serotype. Serotypes O:9 and O:5,27 had higher relative proportions in the older age groups > 45 years (Figure 5-8). No cases of serotype O:5,27 were reported among infants; serotype O:8 was relatively more common in infants compared with other age groups. However, the proportion of unknown serotypes remained high (about 58%) and the interpretation must be made with caution.
Figure 5-8. Distribution of the four most common Yersinia enterocolitica serotypes by age groups, EU/EEA, 2007–09 (pooled data, N=12 233)
Source: Austria, Belgium, Denmark, Germany, Hungary, Luxembourg, Poland, Romania, Slovakia, Spain; non-EU country: Norway
Travel-related yersiniosis
During the three-year period 2007–09, 781 cases were reported as travel-related, representing 3% of cases with known data on status of previous travel (N=22 931, pooled data). The probable country of infection was indicated for 685 cases, of which 433 cases (63%) were imported from another EU country (Figure 5-9). The five most commonly reported travel destinations outside the EU/EEA accounted for 46% of all cases infected outside the EU/EEA. These cases were related to trips to Egypt (29 cases), Turkey (26), Cuba (22), Thailand (21), and Croatia
(17).
Figure 5-9. Origin of travel-related yersiniosis cases as reported by EU and EEA countries, 2007–09 (cumulative N=685)
Severity
The severity of yersiniosis was evaluated by looking at the incidence of hospitalisation and the case-fatality rate. Hospitalisation data were included in the data collection for the first time in 2009. As expected, the proportion of
0%
10%
20%
30%
40%
50%
60%
70%
80%
90%
100%
<1 1–4 5–14 15–24 25–44 45–64 ≥65
Age group
N=(326) (3 886) (3 783) (1 451) (1 310) (913) (564)
O:5,27 (N=91)
O:8 (N=127)
O:9 (N=815)
O:3 (N=11 200)
63%
37%EU/EEA countries (N=433)
Non-EU/EEA countries (N=252)
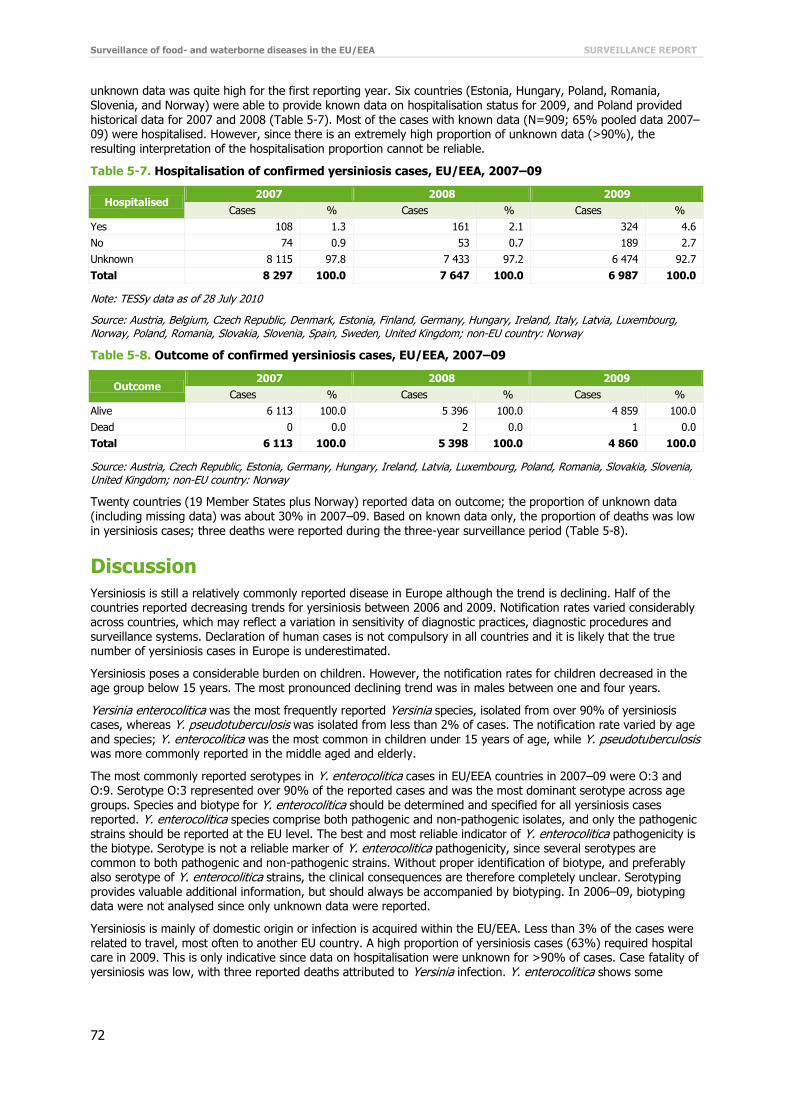
Surveillance of food- and waterborne diseases in the EU/EEA SURVEILLANCE REPORT
72
unknown data was quite high for the first reporting year. Six countries (Estonia, Hungary, Poland, Romania,
Slovenia, and Norway) were able to provide known data on hospitalisation status for 2009, and Poland provided historical data for 2007 and 2008 (Table 5-7). Most of the cases with known data (N=909; 65% pooled data 2007–09) were hospitalised. However, since there is an extremely high proportion of unknown data (>90%), the resulting interpretation of the hospitalisation proportion cannot be reliable.
Table 5-7. Hospitalisation of confirmed yersiniosis cases, EU/EEA, 2007–09
Hospitalised 2007 2008 2009
Cases % Cases % Cases %
Yes 108 1.3 161 2.1 324 4.6
No 74 0.9 53 0.7 189 2.7
Unknown 8 115 97.8 7 433 97.2 6 474 92.7
Total 8 297 100.0 7 647 100.0 6 987 100.0
Note: TESSy data as of 28 July 2010
Source: Austria, Belgium, Czech Republic, Denmark, Estonia, Finland, Germany, Hungary, Ireland, Italy, Latvia, Luxembourg, Norway, Poland, Romania, Slovakia, Slovenia, Spain, Sweden, United Kingdom; non-EU country: Norway
Table 5-8. Outcome of confirmed yersiniosis cases, EU/EEA, 2007–09
Outcome 2007 2008 2009
Cases % Cases % Cases %
Alive 6 113 100.0 5 396 100.0 4 859 100.0
Dead 0 0.0 2 0.0 1 0.0
Total 6 113 100.0 5 398 100.0 4 860 100.0
Source: Austria, Czech Republic, Estonia, Germany, Hungary, Ireland, Latvia, Luxembourg, Poland, Romania, Slovakia, Slovenia, United Kingdom; non-EU country: Norway
Twenty countries (19 Member States plus Norway) reported data on outcome; the proportion of unknown data (including missing data) was about 30% in 2007–09. Based on known data only, the proportion of deaths was low in yersiniosis cases; three deaths were reported during the three-year surveillance period (Table 5-8).
Discussion
Yersiniosis is still a relatively commonly reported disease in Europe although the trend is declining. Half of the countries reported decreasing trends for yersiniosis between 2006 and 2009. Notification rates varied considerably across countries, which may reflect a variation in sensitivity of diagnostic practices, diagnostic procedures and surveillance systems. Declaration of human cases is not compulsory in all countries and it is likely that the true number of yersiniosis cases in Europe is underestimated.
Yersiniosis poses a considerable burden on children. However, the notification rates for children decreased in the age group below 15 years. The most pronounced declining trend was in males between one and four years.
Yersinia enterocolitica was the most frequently reported Yersinia species, isolated from over 90% of yersiniosis cases, whereas Y. pseudotuberculosis was isolated from less than 2% of cases. The notification rate varied by age and species; Y. enterocolitica was the most common in children under 15 years of age, while Y. pseudotuberculosis was more commonly reported in the middle aged and elderly.
The most commonly reported serotypes in Y. enterocolitica cases in EU/EEA countries in 2007–09 were O:3 and O:9. Serotype O:3 represented over 90% of the reported cases and was the most dominant serotype across age groups. Species and biotype for Y. enterocolitica should be determined and specified for all yersiniosis cases reported. Y. enterocolitica species comprise both pathogenic and non-pathogenic isolates, and only the pathogenic strains should be reported at the EU level. The best and most reliable indicator of Y. enterocolitica pathogenicity is the biotype. Serotype is not a reliable marker of Y. enterocolitica pathogenicity, since several serotypes are common to both pathogenic and non-pathogenic strains. Without proper identification of biotype, and preferably also serotype of Y. enterocolitica strains, the clinical consequences are therefore completely unclear. Serotyping provides valuable additional information, but should always be accompanied by biotyping. In 2006–09, biotyping data were not analysed since only unknown data were reported.
Yersiniosis is mainly of domestic origin or infection is acquired within the EU/EEA. Less than 3% of the cases were related to travel, most often to another EU country. A high proportion of yersiniosis cases (63%) required hospital care in 2009. This is only indicative since data on hospitalisation were unknown for >90% of cases. Case fatality of yersiniosis was low, with three reported deaths attributed to Yersinia infection. Y. enterocolitica shows some
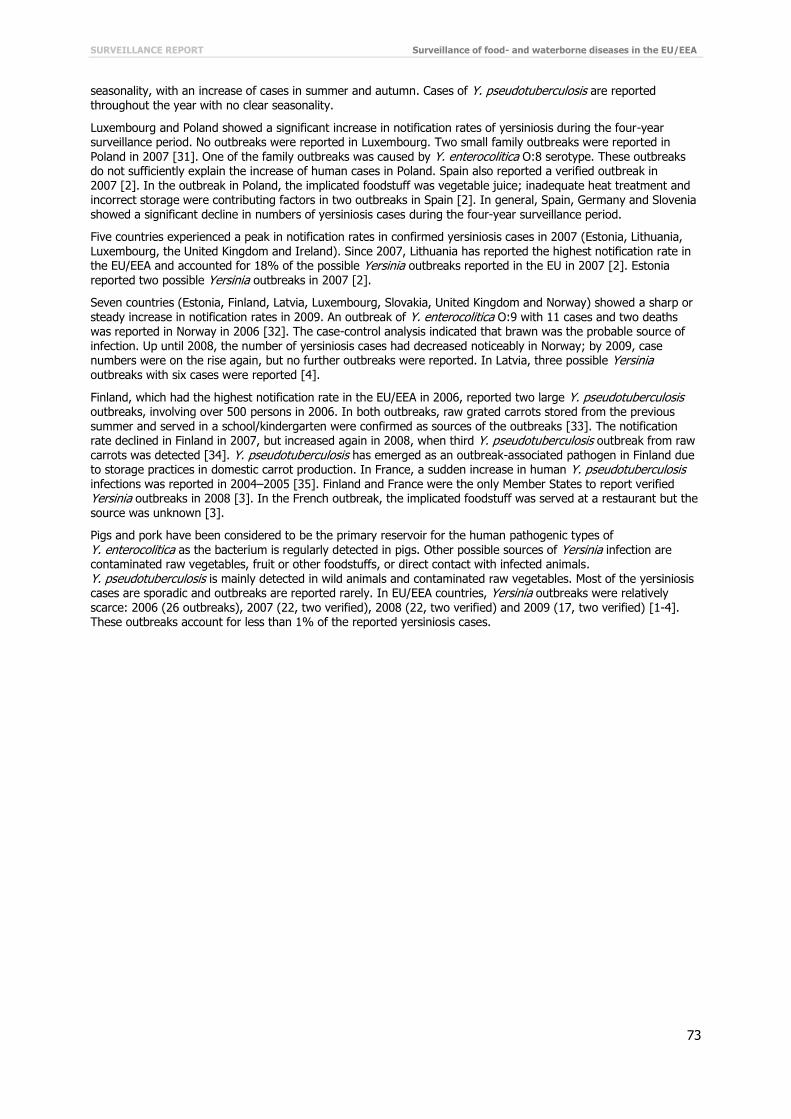
SURVEILLANCE REPORT Surveillance of food- and waterborne diseases in the EU/EEA
73
seasonality, with an increase of cases in summer and autumn. Cases of Y. pseudotuberculosis are reported
throughout the year with no clear seasonality.
Luxembourg and Poland showed a significant increase in notification rates of yersiniosis during the four-year surveillance period. No outbreaks were reported in Luxembourg. Two small family outbreaks were reported in Poland in 2007 [31]. One of the family outbreaks was caused by Y. enterocolitica O:8 serotype. These outbreaks do not sufficiently explain the increase of human cases in Poland. Spain also reported a verified outbreak in 2007 [2]. In the outbreak in Poland, the implicated foodstuff was vegetable juice; inadequate heat treatment and incorrect storage were contributing factors in two outbreaks in Spain [2]. In general, Spain, Germany and Slovenia showed a significant decline in numbers of yersiniosis cases during the four-year surveillance period.
Five countries experienced a peak in notification rates in confirmed yersiniosis cases in 2007 (Estonia, Lithuania, Luxembourg, the United Kingdom and Ireland). Since 2007, Lithuania has reported the highest notification rate in the EU/EEA and accounted for 18% of the possible Yersinia outbreaks reported in the EU in 2007 [2]. Estonia reported two possible Yersinia outbreaks in 2007 [2].
Seven countries (Estonia, Finland, Latvia, Luxembourg, Slovakia, United Kingdom and Norway) showed a sharp or steady increase in notification rates in 2009. An outbreak of Y. enterocolitica O:9 with 11 cases and two deaths was reported in Norway in 2006 [32]. The case-control analysis indicated that brawn was the probable source of infection. Up until 2008, the number of yersiniosis cases had decreased noticeably in Norway; by 2009, case numbers were on the rise again, but no further outbreaks were reported. In Latvia, three possible Yersinia outbreaks with six cases were reported [4].
Finland, which had the highest notification rate in the EU/EEA in 2006, reported two large Y. pseudotuberculosis outbreaks, involving over 500 persons in 2006. In both outbreaks, raw grated carrots stored from the previous summer and served in a school/kindergarten were confirmed as sources of the outbreaks [33]. The notification rate declined in Finland in 2007, but increased again in 2008, when third Y. pseudotuberculosis outbreak from raw carrots was detected [34]. Y. pseudotuberculosis has emerged as an outbreak-associated pathogen in Finland due to storage practices in domestic carrot production. In France, a sudden increase in human Y. pseudotuberculosis infections was reported in 2004–2005 [35]. Finland and France were the only Member States to report verified Yersinia outbreaks in 2008 [3]. In the French outbreak, the implicated foodstuff was served at a restaurant but the source was unknown [3].
Pigs and pork have been considered to be the primary reservoir for the human pathogenic types of
Y. enterocolitica as the bacterium is regularly detected in pigs. Other possible sources of Yersinia infection are contaminated raw vegetables, fruit or other foodstuffs, or direct contact with infected animals. Y. pseudotuberculosis is mainly detected in wild animals and contaminated raw vegetables. Most of the yersiniosis cases are sporadic and outbreaks are reported rarely. In EU/EEA countries, Yersinia outbreaks were relatively scarce: 2006 (26 outbreaks), 2007 (22, two verified), 2008 (22, two verified) and 2009 (17, two verified) [1-4]. These outbreaks account for less than 1% of the reported yersiniosis cases.

Surveillance of food- and waterborne diseases in the EU/EEA SURVEILLANCE REPORT
74
References
1. Napiorkowska A, Bobel D, Sadkowska-Todys M. [Yersiniosis in Poland in 2007]. Przegl Epidemiol. 2009;63(2):221–4.
2. European Food Safety Authority (EFSA) and European Centre for Disease Prevention and Control (ECDC). The community summary report on food-borne outbreaks in the European Union in 2007. EFSA Journal 2009; 271,129 pp.
3. Stenstad T, Grahek-Ogden D, Nilsen M, Skaare D, Martinsen TA, Lassen J, et al. [An outbreak of Yersinia enterocolitica O:9-infection]. Tidsskr Nor Laegeforen. 2007 Mar 1;127(5):586-9.
4. European Food Safety Authority (EFSA) and European Centre for Disease Prevention and Control (ECDC). The European Union summary report on trends and sources of zoonoses, zoonotic agents and food-borne outbreaks in 2009. EFSA Journal 2011;9(3),378 pp.
5. Rimhanen-Finne R, Niskanen T, Hallanvuo S, Makary P, Haukka K, Pajunen S, et al. Yersinia pseudotuberculosis causing a large outbreak associated with carrots in Finland, 2006. Epidemiology and
Infection. 2009 Mar;137(3):342-7.
6. Terveyden ja hyvinvoinnin laitos (THL). [Infectious diseases in Finland in 2008]. Raportti10/2009:14.
7. Vincent P, Leclercq A, Martin L, Duez JM, Simonet M, Carniel E. Sudden onset of pseudotuberculosis in humans, France, 2004-05. Emerg Infect Dis. 2008 Jul;14(7):1119-22.
8. European Food Safety Authority (EFSA) and European Centre for Disease Prevention and Control (ECDC). The Community summary report on trends and sources of zoonoses, zoonotic agents and food-borne outbreaks in the European Union in 2008. EFSA Journal 2010; 8(1),410 pp.
9. European Food Safety Authority (EFSA) and European Centre for Disease Prevention and Control (ECDC). The Community summary report on trends and sources of zoonoses, zoonotic agents, antimicrobial resistance and foodborne outbreaks in the European Union in 2006. EFSA Journal 2007;130,2-352.

SURVEILLANCE REPORT Surveillance of food- and waterborne diseases in the EU/EEA
75
6 Shigellosis in the EU/EEA, 2006–09
Shigellosis
Shigellosis is a gastrointestinal infection caused by bacteria of the genus Shigella. All known four Shigella species (S. sonnei, S. flexneri, S. boydii and S. dysenteriae) can cause human disease. The most affected are young children. Shigellosis is not endemic in the EU and most infections are acquired while travelling in endemic countries. S. sonnei is the most commonly reported species causing infections in the EU.
Clinical symptoms may range from mild enteric infection (watery, self-limiting diarrhoea) to very serious symptoms characterised by cramps, high fever, vomiting, intestinal perforation and bloody diarrhoea. Reiter's disease and haemolytic-uraemic syndrome (HUS) are possible post-infectious complications.
The usual transmission route is faecal-oral, directly from person-to-person or indirectly through contaminated food or water. Contaminated water and unsanitary handling of different fresh food products (salads and vegetables) by infected food handlers are the most common causes of the infections.
More information on shigellosis can be found at the ECDC website: http://ecdc.europa.eu/en/healthtopics/shigellosis/Pages/index.aspx
Surveillance of shigellosis the EU and EEA in 2006–09
Since 2008, ECDC has been coordinating the European surveillance of shigellosis, in close collaboration with a network of nominated experts, epidemiologists and microbiologists from EU/EEA countries and as part of the Food- and Waterborne Diseases and Zoonoses (FWD) network.
The scope of surveillance is defined by the general surveillance objectives for food- and waterborne diseases (see Introduction) and the EU case definition for shigellosis (Shigella spp.) (see Annex).
The aims and specific activities needed to strengthen shigellosis surveillance were discussed with the European Food- and Waterborne Diseases and Zoonoses network. For shigellosis surveillance, the following areas were highlighted:
Standardised diagnostic methods should be available before introducing an external quality assessment scheme for Shigella spp.
The molecular typing method for Shigella spp. should be explored further.
In 2006–09, the reporting of shigellosis covered 25 variables, seven of them are Shigella specific. The common variables are presented in the first table of the chapter on ‘Data collection and analyses’. Additional Shigella-specific variables are presented below in Table 6-1.
Table 6-1. Enhanced dataset collected for Shigella cases, EU/EEA, 2006–09
Variable Description in TESSy
Hospitalisationa Hospitalisation of a case due to the cause of the disease
Importeda Having been outside the country of notification during the incubation period of the reported disease
Pathogenb Species or genus of the pathogen which is the cause of the reported disease
Probable country of infectiona If Imported=Yes: one entry for each country/region visited during the incubation period of the disease. The variable is repeatable in case several countries/regions were visited
Serotypea Serotype of the pathogen which is the cause of the reported disease
Suspected vehiclea Suspected vehicle or source of infection
Transmissiona Suspected main mode of transmission
a Variable added in 2010 for 2009 reporting
b Variable added in 2008

Surveillance of food- and waterborne diseases in the EU/EEA SURVEILLANCE REPORT
76
National surveillance systems for shigellosis
Table 6-2. Notification systems for human shigellosis cases in EU/EEA countries, 2009
Country Notifiable since Legal
charactera Case based/ aggregatedb National coveragec
Changes in surveillance system in 2006–09
Austria 1947 Cp C Y 2009: introduction of the electronic Epidemic Reporting System (EMS)
Belgium - V C Y -d
Bulgaria - Cp A Y -
Cyprus - Cp C Y -
Czech Republic - Cp C Y -
Denmark - Cp C Y -
Estonia 1945 Cp C Y -
Finland - Cp C Y -
France - V C Y -
Germany 2001 Cp C Y -
Greece - Cp C Y -
Hungary - Cp C Y -
Ireland - Cp C Y -
Italy - - - - -
Latvia 1946 Cp C Y -
Lithuania - Cp C Y -
Luxembourg 2004 Cp+V C Y Since 2009, reported cases have included laboratory data
(voluntary), in addition to cases reported by physicians
(compulsory)
Malta - Cp C Y -
Netherlands - Cp C Y -
Poland - Cp C Y -
Portugal - Cp C Y -
Romania - Cp C Y -
Slovakia 1958 Cp C Y No changes
Slovenia - Cp C Y -
Spain 2009 Cp C Y Full national coverage in 2009
Sweden 1969 Cp C Y -
United Kingdom - O C Y -
Iceland - Cp C Y -
Liechtenstein - - - - -
Norway 1975 Cp C Y -
a Legal character: Cp=compulsory, V=voluntary, O=other
b C=case based, A=aggregated
c National coverage: Y=yes, N=no
d No data provided
Epidemiological situation in 2006–09
Major findings
The trend in shigellosis in the EU/EEA showed a consistent decrease between 2007 and 2009. The overall notification rate of shigellosis cases in 2009 was low (1.6 per 100 000 population).
Two thirds of Shigella infections were acquired abroad, mostly outside the EU/EEA. The highest rates of Shigella infections were reported in young children below five years. The highest burden in terms of number of reported cases was noted in the age group 25–44 years, most
likely related to trips to endemic countries. Foodborne shigellosis outbreaks have been recorded regularly in the EU/EEA, mainly linked to imported
fresh foods and infected food handlers.
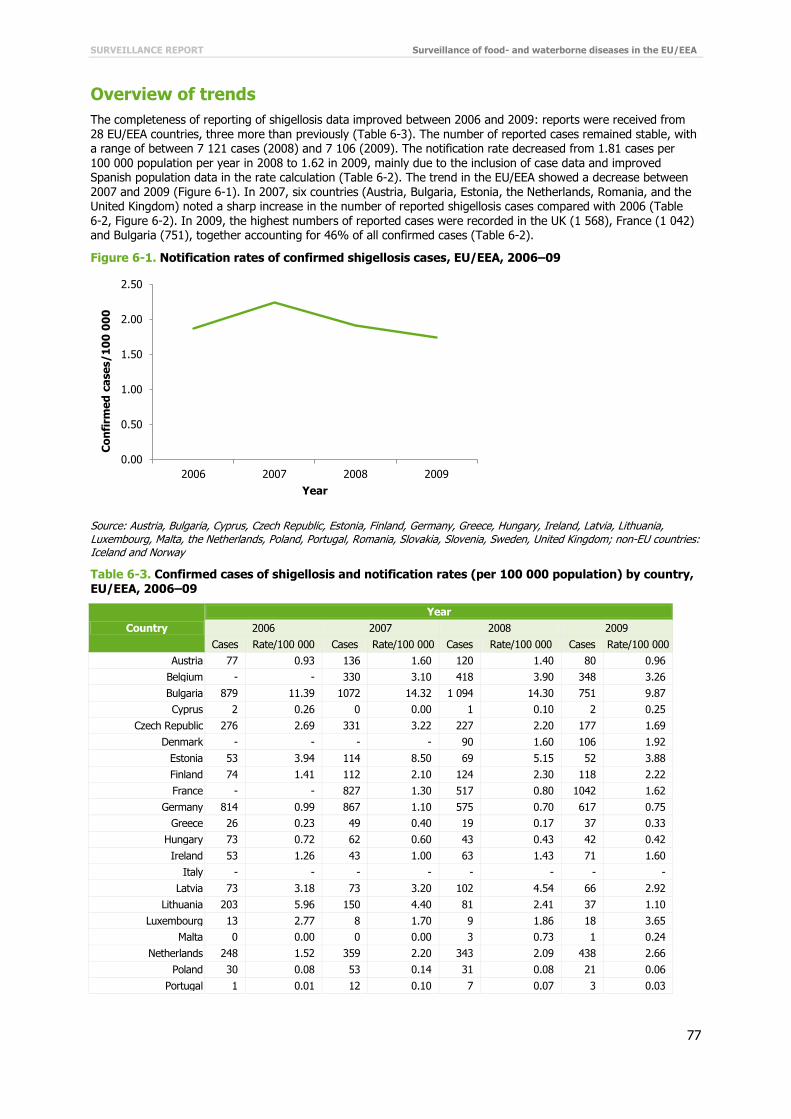
SURVEILLANCE REPORT Surveillance of food- and waterborne diseases in the EU/EEA
77
Overview of trends
The completeness of reporting of shigellosis data improved between 2006 and 2009: reports were received from 28 EU/EEA countries, three more than previously (Table 6-3). The number of reported cases remained stable, with a range of between 7 121 cases (2008) and 7 106 (2009). The notification rate decreased from 1.81 cases per 100 000 population per year in 2008 to 1.62 in 2009, mainly due to the inclusion of case data and improved Spanish population data in the rate calculation (Table 6-2). The trend in the EU/EEA showed a decrease between 2007 and 2009 (Figure 6-1). In 2007, six countries (Austria, Bulgaria, Estonia, the Netherlands, Romania, and the United Kingdom) noted a sharp increase in the number of reported shigellosis cases compared with 2006 (Table 6-2, Figure 6-2). In 2009, the highest numbers of reported cases were recorded in the UK (1 568), France (1 042) and Bulgaria (751), together accounting for 46% of all confirmed cases (Table 6-2).
Figure 6-1. Notification rates of confirmed shigellosis cases, EU/EEA, 2006–09
Source: Austria, Bulgaria, Cyprus, Czech Republic, Estonia, Finland, Germany, Greece, Hungary, Ireland, Latvia, Lithuania, Luxembourg, Malta, the Netherlands, Poland, Portugal, Romania, Slovakia, Slovenia, Sweden, United Kingdom; non-EU countries: Iceland and Norway
Table 6-3. Confirmed cases of shigellosis and notification rates (per 100 000 population) by country, EU/EEA, 2006–09
Country
Year
2006 2007 2008 2009
Cases Rate/100 000 Cases Rate/100 000 Cases Rate/100 000 Cases Rate/100 000
Austria 77 0.93 136 1.60 120 1.40 80 0.96
Belgium - - 330 3.10 418 3.90 348 3.26
Bulgaria 879 11.39 1072 14.32 1 094 14.30 751 9.87
Cyprus 2 0.26 0 0.00 1 0.10 2 0.25
Czech Republic 276 2.69 331 3.22 227 2.20 177 1.69
Denmark - - - - 90 1.60 106 1.92
Estonia 53 3.94 114 8.50 69 5.15 52 3.88
Finland 74 1.41 112 2.10 124 2.30 118 2.22
France - - 827 1.30 517 0.80 1042 1.62
Germany 814 0.99 867 1.10 575 0.70 617 0.75
Greece 26 0.23 49 0.40 19 0.17 37 0.33
Hungary 73 0.72 62 0.60 43 0.43 42 0.42
Ireland 53 1.26 43 1.00 63 1.43 71 1.60
Italy - - - - - - - -
Latvia 73 3.18 73 3.20 102 4.54 66 2.92
Lithuania 203 5.96 150 4.40 81 2.41 37 1.10
Luxembourg 13 2.77 8 1.70 9 1.86 18 3.65
Malta 0 0.00 0 0.00 3 0.73 1 0.24
Netherlands 248 1.52 359 2.20 343 2.09 438 2.66
Poland 30 0.08 53 0.14 31 0.08 21 0.06
Portugal 1 0.01 12 0.10 7 0.07 3 0.03
0.00
0.50
1.00
1.50
2.00
2.50
2006 2007 2008 2009
Co
nfi
rme
d c
ase
s/1
00
00
0
Year

Surveillance of food- and waterborne diseases in the EU/EEA SURVEILLANCE REPORT
78
Country
Year
2006 2007 2008 2009
Cases Rate/100 000 Cases Rate/100 000 Cases Rate/100 000 Cases Rate/100 000
Romania 559 2.59 733 3.40 371 1.72 414 1.93
Slovakia 436 8.09 525 9.70 446 8.26 370 6.84
Slovenia 36 1.80 39 1.90 44 2.19 42 2.07
Spaina 148 - 119 - 133 - 216 0.47
Sweden 429 4.74 470 5.20 596 6.49 469 5.07
United Kingdom 1425 2.36 1746 2.90 1595 2.61 1568 2.56
Total EU 5 928 1.90 8 230 2.13 7 121 1.81 7 106 1.62
Iceland 0 0.00 2 0.70 3 0.95 2 0.63
Liechtenstein - - - - - - - -
Norway 138 2.97 148 3.20 134 2.80 153 3.19
Total EU/EEA 6 066 1.92 8 380 2.14 7 258 1.82 7261 1.63
a Surveillance system changed to full national population coverage in 2009
Countries were grouped according to similarities in their trend curves: the four-year trend for the Netherlands and Slovenia showed a significant increase, while the trend for the Czech Republic, Lithuania, Germany and Hungary showed a significant decrease (Figure 6-2). Four countries experienced a peak in notification rates in 2007 (Greece, Estonia, Romania and Slovakia); in five countries notification rates peaked in 2008 (Bulgaria, Latvia, Sweden, Malta and Iceland). Luxembourg and the Netherlands experienced a peak in notification rates in 2009. The highest notification rates during the four-year surveillance period were recorded in 2007: Bulgaria (14.32 cases per 100 000), Slovakia (9.70 cases per 100 000) and Estonia (8.5 cases per 100 000).
Figure 6-2. Trends in notification rates of confirmed shigellosis cases in grouped EU/EEA countries, 2006–09
0.00
0.50
1.00
1.50
2.00
2.50
3.00
2006 2007 2008 2009
Co
nfi
rme
d c
ase
s/1
00
00
0
Year
Netherlands Slovenia
0.00
1.00
2.00
3.00
4.00
5.00
6.00
7.00
2006 2007 2008 2009
Co
nfi
rme
d c
ase
s/1
00
00
0
Year
Czech Republic Lithuania Germany Hungary
0.00
2.00
4.00
6.00
8.00
10.00
12.00
14.00
16.00
2006 2007 2008 2009
Co
nfi
rme
d c
ase
s/1
00
00
0
Year
Bulgaria Slovakia Sweden Latvia Finland
0.00
0.50
1.00
1.50
2.00
2.50
3.00
3.50
4.00
2006 2007 2008 2009
Co
nfi
rme
d c
ase
s/1
00
00
0
Year
Luxembourg Cyprus Ireland

SURVEILLANCE REPORT Surveillance of food- and waterborne diseases in the EU/EEA
79
Age and gender
In 2009, the highest notification rate of shigellosis was recorded in the age group 1–4 years (4.3 cases per 100 000), followed by the age group <1 year (2.7 cases per 100 000) (Table 6-4). Data on age and gender were available from 24 EU/EEA countries (Figure 6-3). Slovakia and Romania accounted for 81% of the reported cases (93/115) in the group <1 year of age; no cases were reported from the remaining 19 countries in this age group. The highest burden in terms of number of reported cases (248) was noted in the age group 25–44 years (Table 6-3).
The male-to-female ratio was similar in both the older (over 45 years) and the younger age groups (1–14 years). In the age group of 15–24 years, case numbers were higher for females than for males (male-to-female rate ratio 1:1.9); the ratio was 1:1.2 in the age group 25–44 years of age. In infants <1 year of age, the notification rates were higher for males than for females (male-to-female ratio 1.1:1) (Table 6-3).
Figure 6-3. Notification rates of confirmed shigellosis cases by age group and gender, EU/EEA, 2009 (N=6 287)
Source: Austria, Belgium, Cyprus, Czech Republic, Denmark, Estonia, Finland, France, Germany, Greece, Hungary, Ireland, Latvia, Luxembourg, Malta, the Netherlands, Portugal, Romania, Slovakia, Slovenia, Spain, Sweden, United Kingdom; non-EU countries: Iceland and Norway
0.00
0.10
0.20
0.30
0.40
0.50
0.60
0.70
0.80
0.90
1.00
2006 2007 2008 2009
Co
nfi
rme
d c
ase
s/1
00
00
0
Year
Greece Malta Iceland
0.00
1.00
2.00
3.00
4.00
5.00
6.00
7.00
8.00
9.00
2006 2007 2008 2009
Co
nfi
rme
d c
ase
s/1
00
00
0
Year
United Kingdom Estonia Norway
Romania Austria
<1 1–4 5–14 15–24 25–44 45–64 ≥65
Male 2.8 4.3 2.0 1.0 1.8 1.2 0.6
Female 2.5 4.2 2.1 1.9 2.2 1.3 0.5
0.0
1.0
2.0
3.0
4.0
5.0
Co
nfi
rme
d c
ase
s/1
00
00
0
Male
Female

Surveillance of food- and waterborne diseases in the EU/EEA SURVEILLANCE REPORT
80
Table 6-4. Number of confirmed shigellosis cases and notification rate (per 100 000 population) by
age group and gender, EU/EEA, 2009
2009
Age group Female Male Total
Cases Rate/100 000 Cases Rate/100 000 Cases Rate/100 000
<1 52 2.8 63 2.5 115 2.7
1–4 347 4.3 371 4.2 718 4.3
5–14 438 2.0 433 2.1 871 2.1
15–24 445 1.0 261 1.9 706 1.4
25–44 1 205 1.8 1 043 2.2 2 248 2.0
45–64 664 1.2 594 1.3 1 258 1.2
≥65 206 0.6 165 0.5 371 0.6
Total 3 357 1.5 2 930 1.7 6 287 1.6
Source: Austria, Belgium, Cyprus, Czech Republic, Denmark, Estonia, Finland, France, Germany, Greece, Hungary, Ireland, Latvia, Luxembourg, the Netherlands, Portugal, Romania, Slovakia, Slovenia, Spain, Sweden, United Kingdom; non-EU countries: Iceland and Norway
Figure 6-4. Trends in notification rates of confirmed shigellosis cases by age group and gender, EU/EEA, 2007–09
Source: Austria, Belgium, Czech Republic, Estonia, Finland, Germany, Greece, Hungary, Ireland, Luxembourg, the Netherlands, Portugal, Slovakia, Slovenia, Sweden, United Kingdom; non-EU countries: Iceland and Norway
Three-year trends in notification rates were analysed separately for each age group and by gender (Figure 6-4). The trend showed a distinct drop for both genders in the three youngest age groups (children below 15 years). Other age groups presented rather stable trends between 2007 and 2009.
Shigella species
The reporting of Shigella species was introduced in 2008. Data on Shigella species were available for 75% of confirmed cases (5 422/7 261) in 2009, excluding Shigella spp. and unknown data. In the two-year period 2008–09, the most commonly reported species was Shigella sonnei, followed by Shigella flexneri. Both species together account for over 87% of all cases with speciated isolates (Table 6-5).
Table 6-5. Shigella species in confirmed shigellosis cases, EU/EEA, 2008–09
Species 2008 2009 Total
N % N % N %
S. sonnei 2 080 56.9 3 380 60.1 5 460 58.8
S. flexneri 1 001 27.4 1 698 30.2 2 699 29.1
S. dysenteriae 125 3.4 186 3.3 311 3.4
S. boydii 222 6.1 158 2.8 380 4.1
Shigella spp. 225 6.2 203 3.6 428 4.6
Total 3 653 100.0 5 625 100.0 9 278 100.0
0.0
1.0
2.0
3.0
4.0
5.0
6.0
2007 2008 2009
Co
nfi
rme
d c
ase
s/1
00
00
0
Year
Males (N=6 573)
<1
1–4
5–14
15–24
25–44
45–64
≥65
0.0
1.0
2.0
3.0
4.0
5.0
6.0
2007 2008 2009
Co
nfi
rme
d c
ase
s/1
00
00
0
Year
Females (N=7 952)
<1
1–4
5–14
15–24
25–44
45–64
≥65

SURVEILLANCE REPORT Surveillance of food- and waterborne diseases in the EU/EEA
81
Source: Austria, Belgium, Cyprus, Denmark, Estonia, Finland, France, Germany, Greece, Hungary, Ireland, Luxembourg, Malta, the Netherlands, Portugal, Romania, Slovenia, Spain, Sweden, United Kingdom; non-EU countries: Iceland and Norway
Species by age groups
The different Shigella species are spread over all age groups (Figure 6-5).The most common species, Shigella sonnei, has the highest relative proportion in the age group 15–24 years (60%; N=992, pooled data 2008–09) and the lowest in infants (31%; N=58, pooled data 2008–09). S. flexneri has the highest relative proportion in infants (52%) and the lowest in age group 5–14 years (26%). S. dysenteriae and the other Shigella spp. seem to be more prevalent in the most susceptible age groups: the youngest (<1 year) and the oldest age group (>65 years). In 2008 and 2009, the female-to-male ratio in the age group 15–24 was 2:1 for S. sonnei.
Figure 6-5. Cumulative relative distribution of Shigella species by age groups, EU/EEA, 2008–09 (N=9093)
Source: Austria, Belgium, Cyprus, Denmark, Estonia, Finland, France, Germany, Greece, Hungary, Ireland, Luxembourg, Malta, the Netherlands, Portugal, Romania, Slovenia, Spain, Sweden, United Kingdom; non-EU countries: Iceland and Norway
Seasonality
Shigella sonnei infections showed seasonality, with a steady increase of reported cases from February until September (Figure 6-6). S. flexneri infections had two peaks (March and September). For other Shigella species, seasonal variation was not evident. S. sonnei cases showed a steady increase from February to September in all age groups between 1 and 44 years of age, particularly in the group 25–44 years of age (Figure 6-7).
0%
10%
20%
30%
40%
50%
60%
70%
80%
90%
100%
<1 1–4 5–14 15–24 25–44 45–64 ≥65
Age group
S. dysenteriae (N=305)
S. boydii (N=370)
Shigella spp. (N=423)
S. flexneri (N=2 620)
S. sonnei (N=5 375)

Surveillance of food- and waterborne diseases in the EU/EEA SURVEILLANCE REPORT
82
Figure 6-6. Confirmed shigellosis cases by Shigella species and month, EU/EEA, 2009 (N=5064)
Source: Austria, Belgium, Cyprus, Denmark, Estonia, Finland, France, Germany, Greece, Hungary, Ireland, Latvia, Luxembourg, Malta, the Netherlands, Portugal, Slovenia, Spain, Sweden, United Kingdom; non-EU countries: Iceland and Norway
Figure 6-7. Seasonality of Shigella sonnei cases by age groups, EU/EEA, 2009 (N=3019)
Source: Austria, Belgium, Cyprus, Denmark, Estonia, Finland, France, Germany, Greece, Hungary, Ireland, Latvia, Luxembourg, Malta, the Netherlands, Portugal, Slovenia, Spain, Sweden, United Kingdom; non-EU countries: Iceland and Norway
Travel-related shigellosis
Data on origin of infection were available for 4 055 shigellosis cases (22.4%) recorded in 2008–09. About 68% of shigellosis cases with known data were related to travel (N=2 749). The probable country of infection was indicated for 2 660 cases. The majority of travel-related infections (96%) were acquired outside the EU/EEA (Figure 6-8). The highest-ranking non-EU/EEA countries associated with Shigella infections in 2008–09 were Egypt (n=770), India (n=433), Morocco (n=154), Tunisia (n=98), and Pakistan (n=85).
0
50
100
150
200
250
300
350
400
Jan Feb Mar Apr May Jun Jul Aug Sep Oct Nov Dec
Co
nfi
rme
d c
ase
s
Month
S. Sonnei (N=3 068)
S. Flexneri (N=1 506)
S. Dysenteriae (N=174)
Shigella spp. (N=163)
S. Boydii (N=153)
0
20
40
60
80
100
120
140
Jan Feb Mar Apr May Jun Jul Aug Sep Oct Nov Dec
Co
nfi
rme
d c
ase
s
Month
<1 (N=8)
1–4 (N=226)
5–14 (N=337)
15–24 (N=353)
25–44 (N=1 241)
45–64 (N=674)
≥65 (N=180)

SURVEILLANCE REPORT Surveillance of food- and waterborne diseases in the EU/EEA
83
Figure 6-8. Origin of travel-related shigellosis cases as reported by EU/EEA countries, 2008–09
(cumulative N=2660)
Source: Austria, Cyprus, Denmark, Estonia, Finland, Germany, Hungary, Ireland, Latvia, the Netherlands, Portugal, Slovenia, Sweden, United Kingdom; non-EU countries: Iceland and Norway
Discussion
The overall EU/EEA trend showed a steady decrease in shigellosis cases between 2007 and 2009. In most of the countries, the notification rate and the number of shigellosis cases decreased or remained at a stable level. For two countries, the Netherlands and Slovenia, the trend showed a significant increase in the four-year surveillance period (2006–09). As the infection is not endemic in the EU/EEA, the overall notification rate of shigellosis was low (1.6 per 100 000 population).
The risk for Shigella infection is highest in young children below four years of age, while highest burden in terms of number of reported cases was in adults between 25 and 44 years, most likely related to the higher number of travellers in this age group. Two EU countries (Slovakia and Romania) accounted for over 80% of the reported cases in the age group below one year of age.
The two most commonly reported Shigella species causing human shigellosis were Shigella sonnei and S. flexneri. The most dominant species, S. sonnei, was the most common cause of shigellosis in children over five years of age, young adults and the middle-aged group. S. flexneri had the highest relative proportion in infants. S. dysenteriae seemed to be more prevalent in the youngest (<1 year of age) and the oldest age groups (>65 years).
S. sonnei infections showed seasonality, with a steady increase of reported cases between 2006 and 2009, particularly in the group 25–44 years of age; case numbers started to increase in February and peaked in September, most likely related to travelling during the summer holidays.
Two thirds of the shigellosis cases were reported as related to travel. The majority of travel-related infections were acquired outside the EU, particularly in northern African countries and on the Indian subcontinent. Although shigellosis is mostly brought into the EU by travellers, a considerable proportion of cases are of domestic origin. Every year, EU/EEA countries report foodborne Shigella outbreaks, sometimes caused by imported fresh food from non-EU/EEA countries.
In 2006, nine EU/EEA countries (Austria, Bulgaria, Denmark, France, Germany, Latvia, Lithuania, Poland and Norway) reported 33 Shigella outbreaks involving 138 persons, 22 of whom were admitted to a hospital. Two of these outbreaks were caused by dairy products (one made with unpasteurised milk) as the source of infection [1].
In 2007, Denmark reported a large S. sonnei outbreak affecting 200 people, which accounted for over 90% of all reported human cases caused by this species. The suspected source was uncooked baby corn from Thailand [36].
Soon after this outbreak, 11 laboratory-confirmed cases of S. sonnei with indistinguishable PFGE were associated with the same source in Australia [37,38]. In Finland, 90 S. boydii cases, representing 80% of all reported human shigellosis cases for that year, were notified in an outbreak with an unknown source. Several smaller Shigella outbreaks were reported in 2007: four outbreaks in France and Spain, with a total of 29 cases; three outbreaks in Latvia with 31 cases; and one outbreak in Norway with six cases [2].
In 2008, S. sonnei caused an international outbreak linked to a cultural event in Portugal. Following this event, Sweden, Germany and the Netherlands reported cases caused by a S. sonnei strain with a PFGE pattern indistinguishable from the Portuguese outbreak strain, suggesting the spread from Portugal to other countries [39]. S. sonnei also caused outbreaks in Austria, France and Sweden, with a total of 239 cases and six hospitalisations [3]. Two of these outbreaks were attributed to vegetables (carrots and salad). In Austria, the associated vehicle of transmission was a salad served in a hostel [40]. The assumed source of the contamination was an infected food handler who had prepared the salad with bare hands. A total of 53 cases met the outbreak case definition. In Sweden, a S. sonnei outbreak affected 145 people, of which five were hospitalised. The analytical epidemiological investigation pointed out that raw grated carrots served in a restaurant were the common source of infection but
the source of contamination remained unknown [3].
4%
96%
EU/EEA countries (N=110)
Non-EU/EEA countries (N=2 550)

Surveillance of food- and waterborne diseases in the EU/EEA SURVEILLANCE REPORT
84
In 2009, Norway and Denmark experienced shigellosis outbreaks by S. sonnei from sugar peas imported from
Kenya; about 20 cases were reported [41,42]. One month later, Sweden reported an outbreak of S. dysenteriae connected to sugar peas originating from the same country [43]. In total, 47 cases were involved in the Swedish outbreak. Between 2006 and 2009, two countries (the Netherlands and Slovenia) reported a significant increase in notification rates for shigellosis. The highest number of cases in both countries was recorded in the age group 25–45 years. Bulgaria, which reported the highest notification rates in the EU/EEA during the four-year surveillance period (2006–09), experienced a steady increase in cases until 2008, followed by a slight decrease in 2009. No foodborne outbreaks which could explain the increased numbers of Shigella infections, were reported in the Netherlands, Slovenia and Bulgaria. Luxembourg, Ireland and Cyprus notified a substantial increase of shigellosis cases in 2009, also without any reported outbreaks.

SURVEILLANCE REPORT Surveillance of food- and waterborne diseases in the EU/EEA
85
References
1. European Food Safety Authority (EFSA) and European Centre for Disease Prevention and Control (ECDC). The Community summary report on trends and sources of zoonoses, zoonotic agents, antimicrobial resistance and foodborne outbreaks in the European Union in 2006. EFSA Journal 2007;130,2-352.
2. Lewis HC, Ethelberg S, Lisby M, Madsen SB, Olsen KE, Rasmussen P, et al. Outbreak of shigellosis in Denmark associated with imported baby corn, August 2007. Euro Surveill. 2007 Aug;12(8):E070830 1.
3. Lewis HC, Ethelberg S, Olsen KEP, Nielsen EM, Lisby M, Madsen SB, et al. Outbreaks of Shigella sonnei infections in Denmark and Australia linked to consumption of imported raw baby corn. Epidemiology and Infection. 2009;137(3):326-34.
4. Stafford R, Kirk M, Selvey C, Staines D, Smith H, Towner C, et al. An outbreak of multi-resistant Shigella sonnei in Australia: possible link to the outbreak of shigellosis in Denmark associated with imported baby corn from Thailand. Euro Surveill. 2007 Sep;12(9):E070913 1.
5. European Food Safety Authority (EFSA) and European Centre for Disease Prevention and Control (ECDC).
The Community summary report on food-borne outbreaks in the European Union in 2007. EFSA Journal 2009; 271,129 pp.
6. European Centre for Disease Prevention and Control (ECDC). Annual epidemiological report on communicable diseases in Europe 2010. Stockholm: ECDC; 2010.
7. European Food Safety Authority (EFSA) and European Centre for Disease Prevention and Control (ECDC). The Community summary report on trends and sources of zoonoses, zoonotic agents and food-borne outbreaks in the European Union in 2008. EFSA Journal 2010; 8(1),410 pp.
8. Kuo H, Kasper S, Jelovcan S, Höger G, Lederer I, König C, et al. A food-borne outbreak of Shigella sonnei gastroenteritis, Austria, 2008. Wien Klin Wochenschr. 2009;121(3-4):157-63.
9. Heier BT, Nygard K, Kapperud G, Lindstedt BA, Johannessen GS, Blekkan H. Shigella sonnei infections in Norway associated with sugar peas, May–June 2009. Euro Surveill. 2009 Jun 18;14(24).
10. Muller L, Jensen T, Petersen RF, Molbak K, Ethelberg S. Imported fresh sugar peas as suspected source of
an outbreak of Shigella sonnei in Denmark, April–May 2009. Euro Surveill. 2009 Jun 18;14(24).
11. Lofdahl M, Ivarsson S, Andersson S, Langmark J, Plym-Forshell L. An outbreak of Shigella dysenteriae in Sweden, May–June 2009, with sugar snaps as the suspected source. Euro Surveill. 2009 Jul 16;14(28).

Surveillance of food- and waterborne diseases in the EU/EEA SURVEILLANCE REPORT
86
7 Typhoid and paratyphoid fever in the EU/EEA, 2006–09
Typhoid and paratyphoid fever
Salmonellosis is an infection caused by Salmonella (S. enterica) bacteria. The Salmonella species is divided into more than 2 500 serovars. Typhoid/paratyphoid fever is a systemic infection caused by Salmonella enterica subsp. enterica serovar S. Typhi (S. Typhi) and subsp. enterica serovar S. Paratyphi (S. Paratyphi A, B, and C).
Symptoms associated with typhoid fever include prolonged fever, severe headache, nausea, diarrhoea, stomach pain, spleen enlargement, malaise, rash and sometimes endocarditis and meningitis. In adults, typhoid fever causes constipation more often than diarrhoea. The clinical picture varies from mild to severe symptoms and untreated typhoid fever can be life-threatening. Unapparent and mild illnesses occur, particularly in endemic areas. The incubation period of typhoid fever varies from three days to over 60 days, usually ranging between eight to 14
days.
Paratyphoid fever has the same symptoms and clinical picture as typhoid fever, but the course of disease is milder and symptoms are less severe. Paratyphoid fever is caused mainly by S. Paratyphi A and B. It is estimated that S. Typhi is a more common cause of enteric fever than S. Paratyphi A/B. The incubation period of paratyphoid fever is one to 10 days.
Typhoid and paratyphoid Salmonella is found only in humans. Humans can be short- or long-term carriers of these bacteria. The organism can be isolated from blood early in the disease, and from urine and faeces after the first week. Transmission of the infection is by the faecal-oral route, person-to-person contact or through contaminated water or food. Typhoid/paratyphoid fever is uncommon in the EU/EEA. Infections are mainly sporadic and associated with travel to endemic areas outside the EU.
More information on typhoid/paratyphoid fever can be found at the ECDC website: http://ecdc.europa.eu/en/healthtopics/typhoid_paratyphoid_fever/Pages/index.aspx
Surveillance of typhoid and paratyphoid fever in the EU/EEA in 2006–09
Since 2008, ECDC has been coordinating the European surveillance of typhoid and paratyphoid fever, in close collaboration with a network of nominated experts, epidemiologists and microbiologists from EU/EEA countries and as part of the Food- and Waterborne Diseases and Zoonoses (FWD) network.
The scope of surveillance is defined by the general surveillance objectives for food- and waterborne diseases (see Introduction) and the EU case definition for typhoid and paratyphoid fever (see Annex).
The aims and purposes of the disease-specific surveillance were discussed with the European Food- and Waterborne Diseases and Zoonoses network. For typhoid and paratyphoid fever the suggested specific surveillance objectives are to:
monitor the importation of typhoid and paratyphoid fever from non-EU countries; monitor the severity of disease (hospitalisation, bloodstream infections); monitor antimicrobial resistance (AMR) development, particularly for ciprofloxacin and cefotaxime (currently
under revision; a separate monitoring protocol will be developed in 2012–13).
The reporting of Salmonella infections through The European Surveillance System (TESSy) currently features the standard reporting of cases and an agreed sub-dataset under the subject ‘salmonellosis’.
In 2006–09, the reporting of Salmonella infections covered 43 variables, 25 of which were specific for Salmonella. The common variables are presented in Table 1 under ‘Data collection and analyses’. Additional Salmonella-specific variables are presented below in Table 7-1.
Table 7-1. Enhanced dataset collected for Salmonella infections, EU/EEA, 2006–09
Variable Description in TESSy
AntigenH1 Flagellar (H) antigen – phase 1 – of the antigenic formula of the pathogen which is the cause of the reported disease
AntigenH2 Flagellar (H) antigen – phase 2 – of the antigenic formula of the pathogen which is the cause of the reported disease

SURVEILLANCE REPORT Surveillance of food- and waterborne diseases in the EU/EEA
87
Variable Description in TESSy
AntigenO Somatic (O) antigen of the antigenic formula of the pathogen which is the cause of the reported disease
DateOfReceiptReferenceLab Date of receipt in reference laboratory
DateOfReceiptSourceLab Date (YYYY-MM-DD or YYYY-Www or YYYY-MM or YYYY-Qq or YYYY), UNK
Hospitalisationa Hospitalisation of a case due to the cause of the disease
Imported Having been outside the country of notification during the incubation period of the reported disease
IsolateReferenceNumber The reference number currently used by the reference laboratory
Pathogen Species or genus of the pathogen which is the cause of the reported disease
Phagetype Name/number of phage type of the pathogen which is the cause of the reported disease
Probable country of infection If Imported=Yes: one entry for each country/region visited during the incubation period of the disease. The variable is repeatable in case several countries/regions were visited
Serotype Serotype of the pathogen which is the cause of the reported disease
SIR_AMP, SIR_CHL, SIR_CIP, SIR_CTX, SIR_GEN, SIR_KAN, SIR_NAL, SIR_SSS, SIR_STR, SIR_SXT, SIR_TCY
Susceptibility to 11 different antibiotics (ampicillin, chloramphenicol, ciprofloxacin, cefotaxime, gentamicin, kanamycin, nalidixic acid, sulphonamides, streptomycin, trimethoprim (co-trimoxazole), tetracyclines).
Specimen The relevant specimen type used for diagnosis of the case
Suspected vehicle Suspected vehicle or source of infection
Transmission Suspected main mode of transmission
a Variable added in 2010 for 2009 reporting
National surveillance systems for typhoid and paratyphoid fever
Table 7-2. Notification systems for typhoid and paratyphoid fever cases in EU/EEA countries, 2009
Country Notifiable in
humans since Legal charactera
Case based/ aggregatedb
National coveragec
Changes in surveillance system in 2006–09
Austria 1947 Cp C Y 2009: introduction of the electronic Epidemic Reporting System (EMS)
Belgium < 1999 V C Y -d
Bulgaria Yes Cp A Y -
Cyprus Yes Cp C Y -
Czech Republic
Yes Cp C Y -
Denmark 1979 Cp C Y -
Estonia 1945 Cp C Y -
Finland 1995 Cp C Y -
France 1986 V C Y A major clinical laboratory has been reporting data since mid-2008.
Germany 2001 Cp C Y -
Greece Yes Cp C Y -
Hungary 1959 Cp C Y -
Ireland 1948 Cp C Y -
Italy 1990 Cp C Y No changes
Latvia 1946 Cp C Y -
Lithuania 1962 Cp C Y -
Luxembourg 2004 Cp+V C Y Since 2009, reported cases have included laboratory data (voluntary), in addition to cases reported by physicians (compulsory)
Malta Yes Cp C Y -
Netherlands No V C N Non-typhoidal salmonellosis reporting
Netherlands - Cp C Y S. Typhi and S. Paratyphi: mandatory reporting
Poland 1961 Cp C Y -
Portugal Yes Cp C Y -
Romania Yes Cp C Y -

Surveillance of food- and waterborne diseases in the EU/EEA SURVEILLANCE REPORT
88
Country Notifiable in
humans since Legal charactera
Case based/ aggregatedb
National coveragec
Changes in surveillance system in 2006–09
Slovakia 1954 Cp C Y No changes
Slovenia 1949 Cp C Y -
Spain 1982 V C N -
Sweden 1969 Cp C Y -
United Kingdom
No O C Y -
Iceland Yes Cp C Y -
Liechtenstein Yes - - - -
Norway 1975 Cp C Y -
a Legal character: Cp=compulsory, V=voluntary, O=other
b C=case based, A=aggregated
c National coverage: Y=yes, N=no
d No data provided
Epidemiological situation in 2007–09
Major findings
The trend of reported cases of typhoid and paratyphoid fever stabilised between 2008 and 2009. The overall notification rates of typhoid and paratyphoid fever in 2009 were relatively low, with 1.7 and 1.5 cases reported per one million population, respectively, in the EU/EEA.
Typhoid and paratyphoid fever was reported infrequently: between 2007 and 2009, about 30% of the Member States reported less than one case of S. Typhi and S. Paratyphi infections per year.
Most of the typhoid/paratyphoid fever infections are acquired outside the EU/EEA, mainly on the Indian subcontinent.
The highest notification rates of S. Typhi and S. Paratyphi infections were detected in children between one
and four years. The highest burden in terms of number of reported cases in 2009 was carried by the age group 25–44
years for both typhoid and paratyphoid fever, covering 38% and 30% of all reported cases, respectively. S. Typhi and S. Paratyphi isolates expressed high resistance to nalidixic acid, 74% and 70% respectively.
Overview of trends
Very few records of cases with Salmonella Typhi and S. Paratyphi infection were reported to TESSy in 2006; therefore, the first year in the overview table is 2007. More stable data for Salmonella Typhi and S. Paratyphi serovars were available from 2008 onwards. No trend calculations were made.
In this report, typhoid and paratyphoid fever cases are presented separately. An overview of combined data for typhoid/paratyphoid fever cases are presented in ECDC’s Annual Epidemiological Report 2011 [44].
Table 7-3. Confirmed cases of Salmonella Typhi and S. Paratyphi and notification rates (per 100 000 population), EU/EEA, 2007–09
Serovar 2007 2008 2009
Cases Rate/100 000 Cases Rate/100 000 Cases Rate/100 000
Salmonella Typhi 357 0.08 696 0.16 684 0.16
Salmonella Paratyphi 38 0.01 105 0.02 85 0.02
Salmonella Paratyphi A 150 0.04 376 0.09 306 0.07
Salmonella Paratyphi B 164 0.04 170 0.04 230 0.05
Salmonella Paratyphi C 4 <0.01 3 <0.01 12 <0.01
Total EU/EEA 713 0.17 1350 0.32 1317 0.31
Note: updated data as of 22 March 2013
Source: Austria, Belgium, Cyprus, Czech Republic, Denmark, Estonia, Finland, France, Germany, Greece, Hungary, Ireland, Italy, Latvia, Lithuania, Luxembourg, Malta, the Netherlands, Portugal, Romania, Slovakia, Slovenia, Spain (25% coverage), Sweden, United Kingdom; non-EU countries: Iceland and Norway
The number of reported cases of typhoid and paratyphoid fever seems to have increased in the EU/EEA between
2007 and 2009. This perceived increase (from 712 confirmed cases in 2007 to 1397 cases in 2009) is due to

SURVEILLANCE REPORT Surveillance of food- and waterborne diseases in the EU/EEA
89
reporting artefacts because not all countries reported cases in 2007. In 2009, the notification rate stabilised at 0.31
cases/100 000 population (Table 7-3).
Note: Because of the low number of reported cases, rates in the tables below are given per one million population.
Table 7-4. Confirmed Salmonella Typhi cases and notification rates (per 1 million population) by country, EU/EEA, 2007–09 (as of 22 March 2013)
Area Country
Year
2007 2008 2009
Cases Rate/1 million Cases Rate/1 million Cases Rate/1 million
EU Austria 0 0.0 0 0.0 0 0.0
Belgium 11 1.0 27 2.5 26 2.4
Bulgaria - - - - - -
Cyprus 0 0.0 3 3.8 2 2.5
Czech Republic 2 0.2 4 0.4 3 0.3
Denmark 0 0.0 0 0.0 0 0.0
Estonia 1 0.7 0 0.0 3 2.2
Finland 20 3.8 6 1.1 9 1.7
France 80 1.3 138 2.2 166 2.6
Germany 55 0.7 69 0.8 65 0.8
Greece 6 0.5 8 0.7 4 0.4
Hungary 0 0.0 1 0.1 0 0.0
Ireland 8 1.9 5 1.1 9 2.0
Italy 23 0.4 7 0.1 29 0.5
Latvia 1 0.4 0 0.0 0 0.0
Lithuania 0 0.0 1 0.3 0 0.0
Luxembourg 0 0.0 1 2.1 0 0.0
Malta 0 0.0 0 0.0 0 0.0
Netherlands 22 1.3 29 1.8 19 1.2
Poland - - - - - -
Portugal 40 3.8 19 1.8 22 2.1
Romania 2 0.1 1 0.0 0 0.0
Slovakia 0 0.0 0 0.0 1 0.2
Slovenia 2 1.0 1 0.5 1 0.5
Spaina 26 - 17 - 21 -
Sweden 19 2.1 32 3.5 18 1.9
United Kingdom 10 0.2 311 5.1 275 4.5
Total EU 328 0.8 680 1.6 673 1.7
EEA Iceland 0 0.0 0 0.0 0 0.0
Liechtenstein 0 0.0 - - - -
Norway 29 6.2 16 3.4 11 2.3
a Population coverage is 25%
Of 25 EU and two EEA countries reporting typhoid fever data between 2007 and 2009 (cumulative total N=1 557), nine (33%) EU/EEA countries reported ≤1 cases of S. Typhi per year (Table 7-4). The highest number of S. Typhi cases was reported in the United Kingdom (cumulative N=596), accounting for 40% of all reported S. Typhi cases, followed by France with 26% (cumulative N=384) of all reported cases (Table 7-4).
Table 7-5. Confirmed Salmonella Paratyphi* cases and notification rates (per 1 million population) by country and year, EU/EEA, 2007–09 (as of 22 March 2013)
Area Country
Year
2007 2008 2009
Cases Rate/1 million Cases Rate/1 million Cases Rate/1 million
EU Austria 0 0.0 14 1.7 0 0.0
Belgium 32 3.0 34 3.2 78 7.3
Bulgaria - - - - - -
Cyprus 1 1.3 2 2.5 2 2.5
Czech Republic 4 0.4 2 0.2 1 0.1

Surveillance of food- and waterborne diseases in the EU/EEA SURVEILLANCE REPORT
90
Area Country
Year
2007 2008 2009
Cases Rate/1 million Cases Rate/1 million Cases Rate/1 million
Denmark 14 2.6 19 3.5 17 3.1
Estonia 1 0.7 0 0.0 0 0.0
Finland 0 0.0 0 0.0 0 0.0
France 87 1.4 98 1.5 98 1.5
Germany 71 0.9 86 1.0 76 0.9
Greece 12 1.1 3 0.3 0 0.0
Hungary 0 0.0 2 0.2 0 0.0
Ireland 4 0.9 8 1.8 8 1.8
Italy 20 0.3 15 0.3 37 0.6
Latvia 0 0.0 0 0.0 0 0.0
Lithuania 0 0.0 1 0.3 0 0.0
Luxembourg 0 0.0 0 0.0 0 0.0
Malta 0 0.0 0 0.0 1 2.4
Netherlands 33 2.0 37 2.3 29 1.8
Poland - - - - - -
Portugal 4 0.4 2 0.2 12 1.1
Romania 3 0.1 2 0.1 2 0.1
Slovakia 1 0.2 0 0.0 1 0.2
Slovenia 8 4.0 4 2.0 1 0.5
Spaina 7 - 4 - 5 -
Sweden 28 3.1 17 1.9 20 2.2
United Kingdom 10 0.2 285 4.7 228 3.7
Total EU 340 0.8 635 1.6 616 1.5
EEA Iceland 0 0.0 2 6.3 0 0.0
Liechtenstein 0 0.0 - - - -
Norway 16 3.4 17 3.6 17 3.5
* Includes serovars S. Paratyphi, S. Paratyphi A, S. Paratyphi B, and S. Paratyphi C
a Population coverage is 25%
The highest number of S. Paratyphi cases was reported in the United Kingdom (cumulative N=523) accounting for 36% of all reported cases, followed by France with 19% (cumulative N=283) (Table 7-5). Seven (26%) EU/EEA countries reported ≤1 cases of S. Typhi per year in 2007–2009 (Table 7-5).
Age and gender
Data on age and gender were available from 24 EU/EEA countries. The highest notification rate for S. Typhi was detected in the age group 1–4 years: the notification per 1 million in 2009 was 4.6 cases (females) and 6.7 cases (males) (Figure 7-1). The lowest notification rate was in the age group ≥65 years (0.2 cases per 1 million). The highest burden in terms of number of reported cases (N=165) in 2009 was noted in the age group 25–44 years (Table 7-6).

SURVEILLANCE REPORT Surveillance of food- and waterborne diseases in the EU/EEA
91
Figure 7-1. Notification rates of confirmed Salmonella Typhi cases by age group and gender, EU/EEA,
2009 (N=435)
Source: Belgium, Cyprus, Estonia, Finland, Germany, Greece, Ireland, Italy, the Netherlands, Portugal, Slovenia, and United Kingdom.
Table 7-6. Number of confirmed Salmonella Typhi cases and notification rates by age group and gender, EU/EEA, 2009
2009
Age group Female Male Total
Cases Rate/1 million Cases Rate/1 million Cases Rate/1 million
<1 2 0.71 1 1.53 3 1.11
1–4 34 4.57 25 6.70 59 5.59
5–14 35 2.57 36 2.69 71 2.63
15–24 29 2.38 38 1.94 67 2.17
25–44 74 2.40 91 2.02 165 2.21
45–64 29 0.78 27 0.84 56 0.81
≥65 7 0.34 7 0.25 14 0.29
Total 210 1.58 225 1.73 435 1.65
Source: Belgium, Cyprus, Estonia, Finland, Germany, Greece, Ireland, Italy, the Netherlands, Portugal, Slovenia, and United Kingdom
Paratyphoid fever cases with data on age and gender were reported from 12 EU Member States. In 2009, the highest rates for paratyphoid fever cases in these countries were detected in the age group 1–4 years for both gender with notification rates 6.2 and 5.4 per 1 million for males and females respectively (Figure 7-2). The lowest notification rate was recorded for the age group ≥65 years (<0.2 cases per 1 million) (Table 7-7). Highest number of reported paratyphoid fever cases (N=165) was noted in the age group 25–44 years.
<1 1–4 5–14 15–24 25–44 45–64 ≥65
Male 1.5 6.7 2.7 1.9 2.0 0.8 0.3
Female 0.7 4.6 2.6 2.4 2.4 0.8 0.3
0.0
1.0
2.0
3.0
4.0
5.0
6.0
7.0
8.0
Co
nfi
rme
d c
ase
s/1
mil
lio
n Male
Female

Surveillance of food- and waterborne diseases in the EU/EEA SURVEILLANCE REPORT
92
Figure 7-2. Notification rates of confirmed paratyphoid fevera cases by age group and gender in EU in
2009 (N=462)
a Includes reported Salmonella serovars: Paratyphi, Paratyphi A, Paratyphi B, Paratyphi C
Source: Belgium, Cyprus, Denmark, Germany, Ireland, Italy, Malta, the Netherlands, Portugal, Romania, Slovenia, and United Kingdom.
Table 7-7. Confirmed paratyphoid fevera cases and notification rates by age group and gender in the EU, 2009
2009
Age group Female Male Total
Cases Rate/1 million Cases Rate/1 million Cases Rate/1 million
<1 6 4.34 5 3.44 11 3.88
1–4 29 5.38 35 6.16 64 5.78
5–14 41 2.96 52 3.57 93 3.27
15–24 40 2.48 31 1.84 71 2.16
25–44 72 1.85 67 1.69 139 1.77
45–64 30 0.82 29 0.81 59 0.82
≥65 9 0.31 16 0.76 25 0.50
Total 227 1.61 235 1.74 462 1.68
a Includes reported Salmonella serovars: Paratyphi, Paratyphi A, Paratyphi B, Paratyphi C
Source: Belgium, Cyprus, Denmark, Germany, Ireland, Italy, Malta, the Netherlands, Portugal, Romania, Slovenia, and United Kingdom.
<1 1–4 5–14 15–24 25–44 45–64 ≥65
Male 3.4 6.2 3.6 1.8 1.7 0.8 0.8
Female 4.3 5.4 3.0 2.5 1.9 0.8 0.3
0.0
1.0
2.0
3.0
4.0
5.0
6.0
7.0
Co
nfi
rme
d c
ase
s/1
mil
lio
n Male
Female

SURVEILLANCE REPORT Surveillance of food- and waterborne diseases in the EU/EEA
93
Figure 7-3. Distribution of Salmonella Typhi and S. Paratyphi serovars by age groups, EU/EEA, 2007–
09 (N=2 252)
Source: Austria, Belgium, Cyprus, Denmark, Estonia, Finland, Germany, Greece, Hungary, Ireland, Italy, Latvia, Lithuania, Luxembourg, Malta, the Netherlands, Portugal, Romania, Slovakia, Slovenia, Spain, Sweden, United Kingdom; non-EU country: Iceland
S. Paratyphi B has the highest relative proportion in the youngest age groups, accounting for 62% of cases in children less than one year of age and for 34% of cases in children 1–4 years (Figure 7-3). S. Paratyphi A is merely represented in the adults (all age groups over 25 years), whereas S. Paratyphi C was only reported in the age group ≥65 years. S. Typhi has the highest relative distribution (54%) in the age group 25–44 (Figure 7-3).
Seasonality
The seasonality was analysed for serovars S. Typhi and S. Paratyphi (reported as Paratyphi, Paratyphi A or Paratyphi B) (Figure 7-4). All serovars showed a distinct seasonality, with an increase of cases in early July. All serovars showed the highest peaks in August-September and the lowest number of cases in the winter months.
Figure 7-4. Number of reported Salmonella Typhi and Salmonella Paratyphi serovars by month, EU/EEA, 2007–09
0%
10%
20%
30%
40%
50%
60%
70%
80%
90%
100%
<1 1–4 5–14 15–24 25–44 45–64 ≥65
Age group
N=(26) (284) (382) (396) (773) (291) (100)
S. Paratyphi (N=248)
S. Paratyphi C (N=10)
S. Paratyphi B (N=319)
S. Paratyphi A (N=581)
Salmonella Typhi (N=1 094)
0
20
40
60
80
100
120
Jan Feb Mar Apr May Jun Jul Aug Sep Oct Nov Dec
Co
nfi
rme
d c
ase
s
Month
S. Typhi (N=1 467)
Min Median Max
0
5
10
15
20
25
30
Jan Feb Mar Apr May Jun Jul Aug Sep Oct Nov Dec
Co
nfi
rme
d c
ase
s
Month
S. Paratyphi (N=216)
Min Median Max
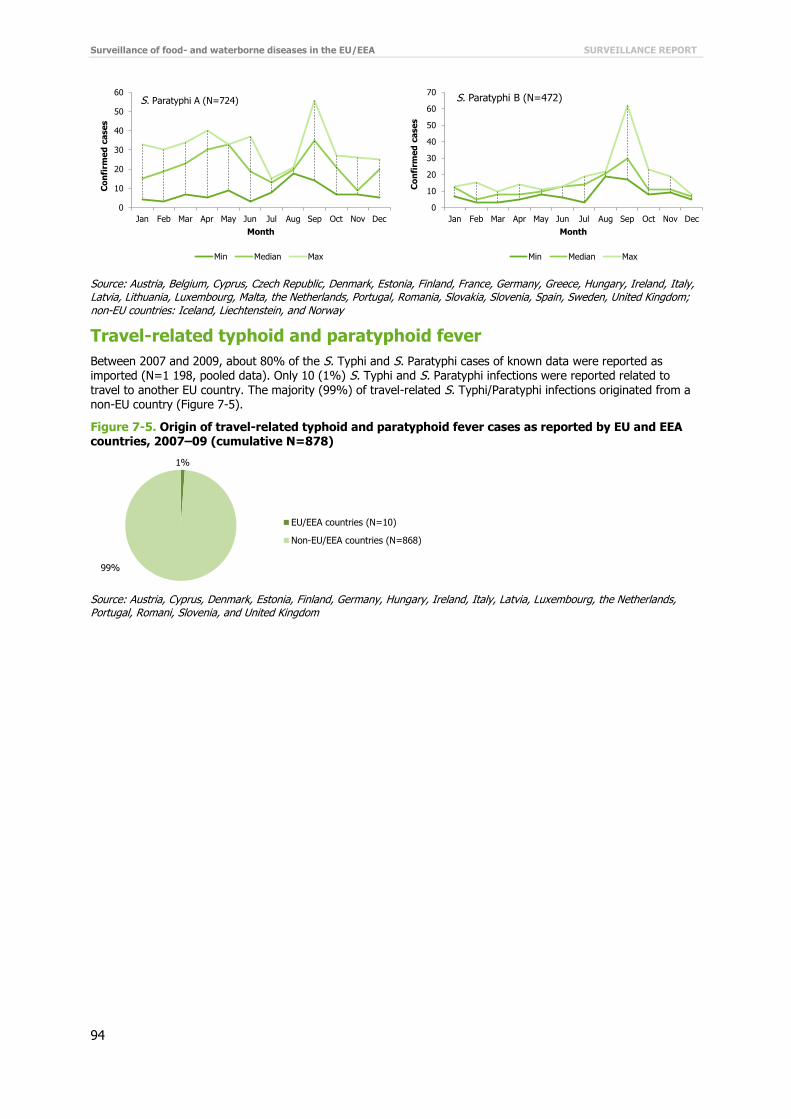
Surveillance of food- and waterborne diseases in the EU/EEA SURVEILLANCE REPORT
94
Source: Austria, Belgium, Cyprus, Czech Republic, Denmark, Estonia, Finland, France, Germany, Greece, Hungary, Ireland, Italy, Latvia, Lithuania, Luxembourg, Malta, the Netherlands, Portugal, Romania, Slovakia, Slovenia, Spain, Sweden, United Kingdom; non-EU countries: Iceland, Liechtenstein, and Norway
Travel-related typhoid and paratyphoid fever
Between 2007 and 2009, about 80% of the S. Typhi and S. Paratyphi cases of known data were reported as imported (N=1 198, pooled data). Only 10 (1%) S. Typhi and S. Paratyphi infections were reported related to travel to another EU country. The majority (99%) of travel-related S. Typhi/Paratyphi infections originated from a non-EU country (Figure 7-5).
Figure 7-5. Origin of travel-related typhoid and paratyphoid fever cases as reported by EU and EEA countries, 2007–09 (cumulative N=878)
Source: Austria, Cyprus, Denmark, Estonia, Finland, Germany, Hungary, Ireland, Italy, Latvia, Luxembourg, the Netherlands, Portugal, Romani, Slovenia, and United Kingdom
0
10
20
30
40
50
60
Jan Feb Mar Apr May Jun Jul Aug Sep Oct Nov Dec
Co
nfi
rme
d c
ase
s
Month
S. Paratyphi A (N=724)
Min Median Max
0
10
20
30
40
50
60
70
Jan Feb Mar Apr May Jun Jul Aug Sep Oct Nov Dec
Co
nfi
rme
d c
ase
s
Month
S. Paratyphi B (N=472)
Min Median Max
1%
99%
EU/EEA countries (N=10)
Non-EU/EEA countries (N=868)

SURVEILLANCE REPORT Surveillance of food- and waterborne diseases in the EU/EEA
95
Figure 7-6. Five most commonly reported non-EU countries in travel-related Salmonella Typhi and
Salmonella Paratyphi infections, EU, 2007–09 (N=868)
Source: Austria, Cyprus, Denmark, Estonia, Finland, Germany, Hungary, Ireland, Italy, Latvia, Luxembourg, the Netherlands, Portugal, Romani, Slovenia, and United Kingdom
In 2007–09, the five countries (India, Pakistan, Turkey, Bangladesh and Nepal) most frequently reported as a probable country of origin of typhoid/paratyphoid fever accounted for 83% of all imported cases with known data; 59% of the cases with a travel history had a link to the Indian subcontinent (Figure 7-6).
Severity
The severity of salmonellosis was evaluated by looking at the incidence of hospitalisation and systemic infections.
Hospitalisation data were included in the EU-level salmonellosis surveillance for the first time in 2009. Data on hospitalisation were available from four countries in 2009 and accounted for 7% of the reported typhoid/paratyphoid fever cases (Table 7-8). Overall, about 60% of the typhoid cases and 40% of paratyphoid cases were hospitalised, but the unknown proportion was high in 2009.
Table 7-8. Hospitalisation of confirmed typhoid and paratyphoid fever cases, EU/EEA, 2009
2009
Serovar Yes No Total
Cases % Cases % Cases %
Salmonella Typhi 37 59.7 8 28.6 45 50.0
Salmonella Paratyphi 2 3.2 1 3.6 3 3.3
Salmonella Paratyphi A 13 21.0 7 25.0 20 22.2
Salmonella Paratyphi B 10 16.1 12 42.9 22 24.4
Total 62 100.0 28 100.0 90 100.0
Source: Estonia, Ireland, the Netherlands, and Portugal
Table 7-9. Outcome of confirmed typhoid and paratyphoid fever cases, EU/EEA, 2007–09
Outcome 2007 2008 2009
Cases % Cases % Cases %
Alive 47 9.8 221 17.6 227 18.7
Dead 1 0.2 0 0.0 0 0.0
Unknown 432 90.0 1 038 82.4 989 81.3
Total 480 100.0 1 259 100.0 1 216 100.0
Source: Austria, Cyprus, Estonia, Germany, Hungary, Ireland, Malta, the Netherlands, Portugal, Romania, Slovakia; non-EU country: Iceland
Twelve countries (11 EU countries plus Iceland) provided data on outcome (Table 7-9). The proportion of unknown data was very high, ranging from 90% in 2007 to 81% in 2009. During the three-year period, only one death was reported. However, due to uncertainty related to unknown or missing data for the outcome, reporting needs to be improved before it can be considered as a parameter for severity.
41%
20%
12%
6%
3%
17%
0%
5%
10%
15%
20%
25%
30%
35%
40%
45%
India Pakistan Turkey Bangladesh Nepal Other

Surveillance of food- and waterborne diseases in the EU/EEA SURVEILLANCE REPORT
96
Table 7-10. Isolations of Salmonella Typhi and Salmonella Paratyphi serovars in human specimens,
EU/EEA, 2007–09
2007–09
Serovar Blood Faeces Urine Pus Other Total
N % N % N % N % N % N %
Salmonella Typhi 751 70.5 288 27.0 10 0.9 0 0.0 17 1.6 1066 100.0
Salmonella Paratyphi 22 81.5 5 18.5 0 0.0 0 0.0 0 0.0 27 100.0
Salmonella Paratyphi A 433 66.2 209 32.0 7 1.1 0 0.0 5 0.8 654 100.0
Salmonella Paratyphi B 42 14.7 219 76.8 5 1.8 2 0.7 17 6.0 285 100.0
Salmonella Paratyphi C 8 66.7 4 33.3 0 0.0 0 0.0 0 0.0 12 100.0
Source: Cyprus, Denmark, Estonia, France, Italy, Latvia, Lithuania, Malta, Portugal, Romania, Slovakia, Slovenia, Spain, United Kingdom; non-EU country: Iceland
Fifteen countries (14 Member States and Iceland) were able to provide data on isolation of serovars in different specimen for 69% of all cases during the years 2007 and 2009. Of all typhoid and paratyphoid fever cases with known data, 61% were systemic with bloodstream infections (Figure 7-10). Salmonella Typhi, S. Paratyphi and S. Paratyphi A were more frequently isolated from blood, whereas S. Paratyphi B was more frequently isolated from faeces samples (7-8).
Antimicrobial resistance
Table 7-11. Resistance of Salmonella Typhi isolates to antimicrobials, EU, 2007–09
Salmonella Typhi
Antimicrobial 2007 2008 2009 Total
Res (N)* % Res (N) % Res (N) % Res (N) %
Ampicillin 2 (27) 7.4 9 (19) 47.4 16 (41) 39.0 27 (87) 31.0
Chloramphenicol 1 (17) 5.9 105 (317) 33.1 79 (286) 27.6 185 (620) 29.8
Ciprofloxacin 1 (28) 3.6 1 (319) 0.3 43 (301) 14.3 45 (648) 6.9
Cefotaxime 0 (25) 0.0 0 (15) 0.0 0 (32) 0.0 0 (72) 0.0
Gentamicin 7 (23) 30.4 2 (319) 0.6 7 (292) 2.4 16 (634) 2.5
Kanamycin 0 (13) 0.0 0 (315) 0.0 1 (280) 0.4 1 (608) 0.2
Nalidixic acid 8 (14) 57.1 234 (316) 74.1 211 (285) 74.0 453 (615) 73.7
Sulphonamides 2 (13) 15.4 99 (315) 31.4 70 (280) 25.0 171(608) 28.1
Streptomycin 2 (13) 15.4 90 (315) 28.6 66 (280) 23.6 158 (608) 26.0
Tetracyclines 4 (23) 17.4 3 (13) 23.1 22 (290) 7.6 29 (326) 8.9
Trimethoprim (co-trimoxazole) 1 (13) 7.7 110 (318) 34.6 82 (296) 27.7 193 (627) 30.8
* Res(N) = Number of resistant strains (total number of the tested strains)
Source: Estonia, Italy, Lithuania, Luxembourg, Romania, Slovenia, and the United Kingdom
In 2007–09, information on antimicrobial resistance to S. Typhi isolates from human cases was reported by seven Member States. Data submitted by these countries represented isolates for around 43% of reported S. Typhi cases during the same time period. The highest resistance level among S. Typhi was detected for nalidixic acid: about 70% of the isolates showed resistance against this antimicrobial in 2008–09. The level of resistance to ampicillin,
chloramphenicol, sulphonamides, streptomycin and trimethoprim (co-trimoxazole) was around 30% in 2009. The resistance level in 2009 was low for cefotaxime, gentamicin, kanamycin and tetracyclines, and elevated for ciprofloxacin (Table 7-11).
Table 7-12. Resistance of Salmonella Paratyphi serovars (S. Paratyphi, S. Paratyphi A, S. Paratyphi B and S. Paratyphi C) to antimicrobials in the EU, 2007–09
Salmonella Paratyphi (all serovars)
Antimicrobial 2007 2008 2009 Total
Res (N)* % Res (N) % Res (N) % Res (N) %
Ampicillin 1 (47) 2.1 4 (63) 6.3 7 (58) 12.1 12 (168) 7.1
Chloramphenicol 1 (41) 0.0 11 (318) 3.5 4 (264) 1.5 16 (623) 2.6
Ciprofloxacin 7 (48) 0.1 17 (322) 5.3 50 (273) 18.3 74 (643) 11.5
Cefotaxime 0 (45) 0.0 1 (56) 1.8 0 (53) 0.0 1 (154) 0.6
Gentamicin 2 (43) 4.7 0 (320) 0.0 4 (266) 1.5 6 (629) 1.0
Kanamycin 0 (37) 0.0 0 (310) 0.0 1 (248) 0.4 1 (595) 0.2

SURVEILLANCE REPORT Surveillance of food- and waterborne diseases in the EU/EEA
97
Salmonella Paratyphi (all serovars)
Antimicrobial 2007 2008 2009 Total
Res (N)* % Res (N) % Res (N) % Res (N) %
Nalidixic acid 12 (40) 30.0 235 (319) 73.7 184 (261) 70.5 431 (620) 69.5
Sulphonamides 4 (37) 10.8 19 (310) 6.1 8 (249) 3.2 31 (596) 5.2
Streptomycin 3 (37) 8.1 13 (310) 4.2 2 (249) 0.8 18 (596) 3.0
Trimethoprim (co-trimoxazole) 3 (36) 8.3 23 (312) 7.4 12 (268) 4.5 38 (616) 6.2
Tetracyclines 7 (40) 17.5 6 (46) 13.0 9 (262) 3.4 22 (348) 6.3
* Res(N) = Number of resistant strains (total number of the tested strains)
Source: Denmark, Italy, Lithuania, Malta, Romania, Slovenia, and the United Kingdom
In 2007–09, information on antimicrobial resistance for S. Paratyphi isolates from human cases in the EU was reported by seven Member States. Data submitted by these countries represented isolates from 44% of the S. Paratyphi cases reported within the EU in the same time period. The highest resistance level of 70% was detected for nalidixic acid in S. Paratyphi isolates in 2009 (Table 7-12). The resistance level in 2009 was moderate (18%) for ciprofloxacin (Table 7-12). The level of resistance for other antimicrobials was low, ranging from 0.2% for kanamycin to 7% for ampicillin.
Generally, isolates of S. Typhi in 2007–09 were more commonly resistant to several antibiotics than S. Paratyphi serovars, and around 30% of S. Typhi strains had a specific ACSSuT antibiogram (Table 7-11 and 7-12).
Discussion
The reporting of typhoid and paratyphoid fever cases stabilised between 2008 and 2009, and the overall notification rates in 2009 were relatively low and nearly identical for both S. Typhi and S. Paratyphi serovars (1.7 and 1.5 per 1 million population, respectively). About 30 % of the Member States reported ≤1 cases of S. Typhi and S. Paratyphi infections in 2009. However, about 70% of all typhoid/paratyphoid fever cases were reported by three Member States (France, Germany and the United Kingdom) during the three-year surveillance period.
The highest notification rates of S. Typhi and S. Paratyphi infections were recorded in children 1–4 years, which is similar to the reporting of non-typhoidal salmonellosis. In children below one year of age, S. Paratyphi B had the
highest relative proportion, whereas S. Paratyphi C was only reported in the age group ≥65 years. Reporting of S. Paratyphi B may also include cases of S. Paratyphi B variant Java, which causes a non-typhoidal salmonellosis, not paratyphoid fever. The reporting of these two serotypes was harmonised to avoid misclassification of S. Java cases as S. Paratyphi B.
Overall, 82% of the typhoid and 56% of the paratyphoid cases were hospitalised but the unknown proportion was high and interpretation of the severity of typhoid/paratyphoid infections is only indicative.
S. Typhi and S. Paratyphi isolates showed very high resistance to nalidixic acid. Nalidixic acid is normally used as an indicator of ciprofloxacin resistance, not for the treatment of salmonellosis. Ciprofloxacin is the antimicrobial of choice for treatment of severe or invasive Salmonella infections in humans. However, resistance levels for ciprofloxacin of the S. Typhi and S. Paratyphi isolates were only moderate; the correlation between nalidixic acid resistance and susceptibility to ciprofloxacin was poor in the 2007–09 surveillance data.
No outbreaks of typhoid or paratyphoid fever were reported in the EU/EEA in 2006–09 and only few outbreaks of enteric fever were reported in Europe during the last 20 years [2-4]. These outbreaks are mostly linked to food
contaminated by a chronic S. Typhi carrier. The majority of enteric fever cases (about 80%) occurred as sporadic cases related to international travel in areas where typhoid fever is endemic, particularly the Indian subcontinent, but also Africa, South and Central America [5-9].

Surveillance of food- and waterborne diseases in the EU/EEA SURVEILLANCE REPORT
98
References
1. European Centre for Disease Prevention and Control (ECDC). Surveillance Report - Annual epidemiological report on communicable diseases in Europe 2011. ECDC 2011: Available from: http://ecdc.europa.eu/en/publications/Publications/1111_SUR_Annual_Epidemiological_Report_on_Communicable_Diseases_in_Europe.pdf.
2. Usera MA, Aladuena A, Echeita A, Amor E, Gomez-Garces JL, Ibanez C, et al. Investigation of an outbreak of Salmonella typhi in a public school in Madrid. Eur J Epidemiol. 1993 May;9(3):251-4.
3. Pradier C, Keita-Perse O, Bernard E, Gisbert C, Vezolles MJ, Armengaud A, et al. Outbreak of typhoid fever on the French Riviera. Eur J Clin Microbiol Infect Dis. 2000 Jun;19(6):464-7.
4. Muehlen M, Frank C, Rabsch W, Fruth A, Suckau M, Moeller I, et al. Outbreak of domestically acquired typhoid fever in Leipzig, Germany, June 2004. Euro Surveill. 2007 Feb 20;12(2).
5. Caumes E, Ehya N, Nguyen J, Bricaire F. Typhoid and paratyphoid fever: a 10-year retrospective study of 41 cases in a Parisian hospital. J Travel Med. 2001 Nov-Dec;8(6):293-7.
6. Jiang ZD, Lowe B, Verenkar MP, Ashley D, Steffen R, Tornieporth N, et al. Prevalence of enteric pathogens among international travelers with diarrhea acquired in Kenya (Mombasa), India (Goa), or Jamaica (Montego Bay). Journal of Infectious Diseases. 2002 Feb 15;185(4):497-502.
7. Keller A, Frey M, Schmid H, Steffen R, Walker T, Schlagenhauf P. Imported typhoid fever in Switzerland, 1993 to 2004. J Travel Med. 2008 Jul-Aug;15(4):248-51.
8. Gil R, Alvarez JL, Gomez C, Alvaro A, Gil A. Epidemiology of typhoid and paratyphoid fever hospitalizations in Spain (1997-2005). Hum Vaccin. 2009 Jun;5(6):420-4.
9. Clark TW, Daneshvar C, Pareek M, Perera N, Stephenson I. Enteric fever in a UK regional infectious diseases unit: a 10 year retrospective review. J Infect. 2010 Feb;60(2):91-8.

SURVEILLANCE REPORT Surveillance of food- and waterborne diseases in the EU/EEA
99
Annex. Case definitions
Campylobacteriosis (Campylobacter spp.) EU case definition
According to Commission Decision of 28/IV/2008
Clinical criteria
Any person with at least one of the following three:
diarrhoea abdominal pain fever
Laboratory criteria
Isolation of Campylobacter spp. from stool or blood
Differentiation of Campylobacter spp. should be performed if possible
Epidemiological criteria
At least one of the following five epidemiological links:
animal to human transmission human-to-human transmission exposure to a common source exposure to contaminated food/drinking water environmental exposure
Case classification
A. Possible case N/A
B. Probable case
Any person meeting the clinical criteria and with an epidemiological link
C. Confirmed case
Any person meeting the clinical and the laboratory criteria

Surveillance of food- and waterborne diseases in the EU/EEA SURVEILLANCE REPORT
100
Listeriosis (Listeria monocytogenes) EU case definition
According to Commission Decision of 28/IV/2008
Clinical criteria
Any person with at least one of the following three:
Listeriosis of newborns defined as
Stillbirth
OR
At least one of the following five in the first month of life:
granulomatosis infantiseptica meningitis or meningoencephalitis
septicaemia dyspnoea lesions on skin, mucosal membranes or conjunctivae listeriosis in pregnancy defined as at least one of the following three: abortion, miscarriage, stillbirth or premature birth fever influenza-like symptoms
Other forms of listeriosis defined as at least one of the following four:
fever meningitis or meningoencephalitis septicaemia localised infections such as arthritis, endocarditis, and abscesses
Laboratory criteria
At least one of the following two:
isolation of Listeria monocytogenes from a normally sterile site isolation of Listeria monocytogenes from a normally non-sterile site in a foetus, stillborn, newborn or the
mother at or within 24 hours of birth
Epidemiological criteria
At least one of the following three epidemiological links:
exposure to a common source human-to-human transmission (vertical transmission) exposure to contaminated food/drinking water
Additional information
Incubation period 3–70 days, most often 21 days
Case classification
A. Possible case N/A
B. Probable case
Any person meeting the clinical criteria and with an epidemiological link
C. Confirmed case
Any person meeting the laboratory criteria
OR
Any mother with a laboratory-confirmed listeriosis infection in her foetus, stillborn or newborn

SURVEILLANCE REPORT Surveillance of food- and waterborne diseases in the EU/EEA
101
Salmonellosis (Salmonella spp. other than S. Typhi and S. Paratyphi) EU case definition
According to Commission Decision of 28/IV/2008
Clinical criteria
Any person with at least one of the following four:
diarrhoea fever abdominal pain vomiting
Laboratory criteria
Isolation of Salmonella (other than S. Typhi and S. Paratyphi) from stool or blood
Epidemiological criteria
At least one of the following five epidemiological links:
human-to-human transmission exposure to a common source animal to human transmission exposure to contaminated food/drinking water environmental exposure
Case classification
A. Possible case N/A
B. Probable case
Any person meeting the clinical criteria and with an epidemiological link
C. Confirmed case
Any person meeting the clinical and the laboratory criteria

Surveillance of food- and waterborne diseases in the EU/EEA SURVEILLANCE REPORT
102
Shiga toxin/verotoxin-producing Escherichia coli infection (STEC/VTEC) EU case definition
According to Commission Decision of 28/IV/2008
Clinical criteria
STEC/VTEC diarrhoea
Any person with at least one of the following two:
diarrhoea abdominal pain
HUS
Any person with acute renal failure and at least one of the following two:
microangiopathic haemolytic anaemia thrombocytopenia
Laboratory criteria
At least one of the following three:
isolation of Shiga toxin/verotoxin (stec/vtec)-producing E. coli detection of stx1 or stx2 gene(s) nucleic acid detection of free Shiga toxins
Only for HUS the following can be used as laboratory criterion to confirm STEC/VTEC:
E. coli serotype-specific antibody response
Isolation and additional characterisation by serotype, phage type, eae genes, and subtypes of stx1/stx2 should be performed, if possible
Epidemiological criteria
At least one of the following five epidemiological links:
human-to-human transmission exposure to a common source animal to human transmission exposure to contaminated food/drinking water environmental exposure
Case classification
A. Possible case of STEC-associated HUS
Any person meeting the clinical criteria for HUS
B. Probable case of STEC/VTEC
Any person meeting the clinical criteria and with an epidemiological link or a laboratory-confirmed case without clinical criteria
C. Confirmed case of STEC/VTEC
Any person meeting the clinical and the laboratory criteria

SURVEILLANCE REPORT Surveillance of food- and waterborne diseases in the EU/EEA
103
Shigellosis (Shigella spp.) EU case definition
According to Commission Decision of 28/IV/2008
Clinical criteria
Any person with at least one of the following four:
diarrhoea fever vomiting abdominal pain
Laboratory criteria
Isolation of Shigella spp. from a clinical specimen
Epidemiological criteria
At least one of the following five epidemiological links:
human-to-human transmission exposure to a common source animal to human transmission exposure to contaminated food/drinking water environmental exposure
Case classification
A. Possible case N/A
B. Probable case
Any person meeting the clinical criteria and with an epidemiological link
C. Confirmed case
Any person meeting the clinical and the laboratory criteria

Surveillance of food- and waterborne diseases in the EU/EEA SURVEILLANCE REPORT
104
Typhoid/Paratyphoid fever (Salmonella Typhi/Paratyphi) EU case definition
According to Commission Decision of 28/IV/2008
Clinical criteria
Any person with at least one of the following two:
Onset of sustained fever
At least two of the following four:
Headache Relative bradycardia Non-productive cough Diarrhoea, constipation, malaise or abdominal pain
Paratyphoid fever has the same symptoms as typhoid fever, however usually a milder course.
Laboratory criteria
Isolation of Salmonella Typhi or Paratyphi from a clinical specimen
Epidemiological criteria
At least one of the following five epidemiological links:
exposure to a common source human-to-human transmission exposure to contaminated food/drinking water
Case classification
A. Possible case N/A
B. Probable case
Any person meeting the clinical criteria and with an epidemiological link
C. Confirmed case
Any person meeting the clinical and the laboratory criteria

SURVEILLANCE REPORT Surveillance of food- and waterborne diseases in the EU/EEA
105
Yersiniosis (Yersinia enterocolitica, Yersinia pseudotuberculosis) EU case definition
According to Commission Decision of 28/IV/2008
Clinical criteria
Any person with at least one of the following five:
fever diarrhoea vomiting abdominal pain (pseudoappendicitis) tenesmus
Laboratory criteria
Isolation of human pathogenic Yersinia enterocolitica or Yersinia pseudotuberculosis from a clinical specimen
Epidemiological criteria
At least one of the following four epidemiological links:
human-to-human transmission exposure to a common source animal to human transmission exposure to contaminated food
Case classification
A. Possible case N/A
B. Probable case
Any person meeting the clinical criteria and with an epidemiological link
C. Confirmed case
Any person meeting the clinical and the laboratory criteria