surplus allocation and development under global … · surplus allocation and development ... been...
TRANSCRIPT

ERC Working Papers in Economics 05/05 October 2005
Economic Research Center Middle East Technical University Ankara 06531 Turkey www.erc.metu.edu.tr
Surplus Allocation and Development under Global Capitalism
Cem Somel Department of Economics
Middle East Technical University, Ankara e-mail: [email protected]
1
Surplus allocation and development under global capitalism∗
1
Mainstream thinking in economics currently tends to describe the problem of
economic development as one of differential economic growth across space; a
differential which is ascribed to seizing or missing opportunities to solicit foreign
investment, to attract subcontracting orders, to upgrade activities in value chains and
to grow by exporting. This approach to development overlooks the mounting case-by-
case evidence on the lope-sided distribution along value chains (Gereffi 1989: 525;
Gereffi 1994: 102-3; Feenstra 1998: 36; Kaplan and Kaplinsky 1999: 1794;
Chossudovsky 1998: 87-90; Figueroa 1996: 37, 39; Talbot 1997: 181; Dikmen 2000:
215, 243). The evidence raises questions concerning the international distribution of
the ‘gains from trade’ and suggests that, if international growth differentials are driven
by international distribution mechanisms rather than the other way round, then the
development issue demands greater attention to global distribution mechanisms.
Economic development involves fixed capital accumulation. The capacity to
undertake fixed investment in underdeveloped countries that import capital goods
depends on these countries’ terms of trade, as much as on their efforts to save and
export. Institutionalist economists, aware of the importance of the terms of trade for
accumulation, have been careful to qualify their own recommendations for strategic
trade and industrial policies in that such policies might be self-defeating at the global
level, since implementation of export-based upgrading policies among many
∗ I owe thanks to Dr. Ahmet Ha�im Köse and to Mr. Tuncel Öncel for comments that helped improve the paper. 1 Page number on internet version.
2
underdeveloped countries may cause a general deterioration of the terms of trade
(UNCTAD 1996, Part Two Chapter III; UNCTAD 2002, Part Two Chapter IV; Mayer
2003).
Hence a framework apposite for studying the global distribution of investible
resources is necessary to understand the sustenance of differences in per capita
incomes between countries. Such a framework should preferably take the global
social product as given, and focus on attempts of firms and governments to extract the
maximum surplus out of the social product, on the struggle between social groups and
nations to appropriate the generated surplus, and on how the surplus is used.
This essay is an endeavour to understand and assess the developmental
consequences of global economic integration by focussing on the generation, transfer
and utilization of the global surplus. It tries to address the following questions: (1)
How does globalization affect surplus generation? (2) Where does the global surplus
accumulate? (3) How is the global surplus absorbed? (4) What prospects does this
pattern of absorption hold for the capital accumulation needs of poor countries? The
essay continues as follows: the second section presents a brief description of the
surplus concept, and questions whether the tendency for the share of the surplus in
GDP to rise has abated under globalizing capitalism. The third section discusses at an
abstract level how the surplus is generated and allocated in internationally organized
production. In the fourth section empirical clues on the last question are investigated,
which seem to indicate an increasing flow of surplus from periphery to core. The fifth
section takes up the problem of surplus absorption and juxtaposes the rising
consumption of the surplus in the core with the fixed capital formation in the
periphery. Section six concludes.
3
2
It seems useful to begin by reviewing the theoretical framework we will
employ. The social surplus is a basic concept of classical political economy which has
been revived in the post-war period by Paul Baran and Paul Sweezy.2 They defined it
as
... the difference between what a society produces and the costs of producing it. The size of a surplus is an index of productivity and wealth, and of how much freedom a society has to accomplish whatever goals it may set for itself. The composition of the surplus shows how it uses that freedom: how much it invests in expanding its productive capacity, how much it consumes in various forms, how much it wastes and in what ways. (Baran and Sweezy, 1966: 23).
The surplus can be calculated in alternative ways. One is to estimate the
necessary costs of producing the national product, and to deduct the costs from the
national product. This raises the conceptual problem of calculating the necessary costs
of production. Some of the outlays recorded as costs by firms (such as outlays for
superficial product differentiation and advertising) may be unnecessary from the
social viewpoint. Hence the determination of the necessary costs is crucial for this
first method. A second method is to estimate the various expenditures absorbing the
surplus (non-essential consumption, investment etc.) and to add them up.
The difficulties of estimating the surplus at the global level either way are
obvious.3 This paper does not attempt to estimate the global surplus produced, but
uses available statistics to make conjectures about trends in the generation and the
disposal of the surplus.
2 Baran and Sweezy made the surplus a measurable concept. Lippit (1985), Danielson (1990) , Yeldan (1995) provide similar definitions and descriptions of the concept. A more general theoretical presentation of the classical surplus approach can be found in Garegnani (1988). 3 There are surplus estimations for the US (Philips 1966, Stanfield 1973, Dawson and Foster 1992 and Lippit 1992) and one for Turkey (Somel 2003). Baran reports estimations of potential surplus -hypothetical surplus that could be produced in full employment- for a number of underdeveloped countries (1967: 227). Other work on the surplus in underdeveloped countries include Lippit (1988), Kanth (1987), Danielson (1990), Yeldan (1995).

4
The re-elaboration of the surplus concept in the post-war period is connected
to the evolution of certain features of capitalism. In Monopoly Capital (1966) Baran
and Sweezy argued that capitalism had made a transition from a competitive phase to
a monopolistic phase in the twentieth century. In their view, the concentration of
capital in giant corporations enables them to fix prices, in contrast to nineteenth
century capitalists who worked under more intense competition. These giant
corporations set their sales prices by adding mark-ups to production costs. Such price
setting gives the corporations control over the partition of the value added with their
workers.
Corporations also strive to increase their profits by reducing their production
costs. On the macroeconomic plane, the general endeavour to reduce production costs
(inclusive of labor costs) tends to raise the share of the surplus in GDP. This rising
surplus can be sustained only if it is absorbed. The consumption of capitalists, the
consumption of employees in non-productive activities (e.g. superficial product
differentiation, advertising, litigation etc.), investment and some part of government
expenditure (e.g. public investment, military outlays) are the main outlets for
absorbing the surplus.
As forty years have elapsed since the above framework was formulated, it is
legitimate to ask: has the increasing ratio of trade to global output in the last decades
of the twentieth century impaired the diagnosis of Baran and Sweezy with regard to
the monopolization of capital, and with respect to the inclination for the surplus in
GDP to increase? Has increasing trade and integration of markets raised competitive
pressures so as to restrict the pricing latitude of industrial conglomerates?
The immediate effect of global trade expansion obviously must be to increase
overall competition, as greater numbers of firms would come to compete in formerly

5
segregated markets. But a countervailing effect would emerge when large firms with
greater financial resources and organizational advantages eliminate smaller firms (as
happens when large transnationals take on firms of peripheral countries in opened
markets).
Another countervailing trend to the competition-enhancing effect of trade
expansion is mergers and acquisitions, on which there is evidence in the core
countries. Statistics show that in the US the number of merger and acquisition ‘deals’
have risen in a wave in 1965-73, in another wave in 1981-89 and between 1992 and
2000 (USBancorp 2001-3 : 4). The advent of the euro triggered a boom in cross-
border megamergers in Europe, an increase of 87% from 1998 to 1999 (Time Europe,
February 14, 2000). Overall, “[a] powerful trend increase in the extent of firm level
concentration of global markets share could be observed in industries as diverse as
aerospace and defence, pharmaceuticals, automobiles, trucks, power equipment, farm
equipment, oil and petrochemicals, mining, pulp and paper, brewing, banking,
insurance, advertising, and mass media” (Nolan 2003: 302-3).4 Indications are that the
competition-enhancing effect of trade is balanced (perhaps even overwhelmed) by the
monopolizing effect of the centralization of capital, which may sustain the ability of
large corporations to control the market prices of their products.
On the other hand, if mergers and acquisitions imply an increase in the
average size of the workforce of corporations, this could stimulate a counterbalance to
corporate power by higher unionization and worker militancy. However, the
increasing mobility of capital, goods and services on the one hand, and unemployment
on the other is weakening unionization in the core countries, and making workers
accept temporary employment, part-time employment, flexibility in hiring and
4 Frequent reports in The Economist (February 19, 2004; April 7 2005; July 14, 2005; September 1, 2005; September 8, 2005) testify to an ongoing boom in M&A activities in the US and Europe.

6
dismissing, flexible working days and weeks, and flexibility in assigning tasks in the
workplace (Walby 2000).5 Increasing flexibility in labor relations shifts various risks
related to the product markets and the associated costs from firms onto workers.
Enhanced flexibility cannot but boost gross profits. Hence the trend towards increased
flexibility in labor practices clearly implies increased surplus generation for given
output in individual countries.
The neoliberal global reform agenda also includes measures to increase
surplus generation through fiscal and institutional reforms, both in developed and
underdeveloped countries. Lowering taxes on corporate profits, capital gains and high
incomes; increasing taxes on consumption; raising fees on public services and
privatization of these services, of utilities and of social security – all these policies
aim at disburdening the high income earners and property owners of contributing to
financing essential services for the maintenance of the labor force (Jones 2001: 13).6
These reforms also contribute to increasing the share of surplus in total output.
In brief, in the era of neoliberal policies evidence does not seem to suggest that
the tendency for the share of surplus in GDP to rise in individual countries may have
waned. If so, what is happening to the surplus generated in international production?
5 See JIL (2004: 58) for the unionization rate decline in Japan over 1945-2003; JIL (2000) for the unionization rate decline in Japan, US, Germany (1985-1997) and the UK (1990-1997); Friedman (2005: Table 4) for the decline in the unionization rate in the US 1953-2000 and the decline in combined unionization rate in Canada, France, Germany, Italy, Japan and the UK 1980-1990. The weakness of labor and trade unionism in most peripheral countries needs no substantation. 6 Privatization of socially owned assets and services is a tendency of capitalism that stretches back to the sixteenth century English enclosures, a tendency that was driven off course by Keynesian policies in the twentieth century (Nasser 2003). Shaikh (2003) shows that the ‘net social wage’ has been a small fraction of GDP in the major industrialized countries in the 1980s and 90s. Privatization is penetrating the most vital services, provoking sharp social responses, as in the water crisis in Bolivia in 2000 (Gosh 2003; Moberg 2004).

7
3
Baran and Sweezy argued (1968; Baran 1952, 1967) that the surplus of
underdeveloped countries had been and was being drained away to the centers of the
world-system. Their description of core firms’ overseas activities in Monopoly
Capital can be read as a description of offshore outsourcing activities today if one
replaces ‘subsidiary’ with ‘suppliers’ (1968: 200):
What they [giant multinational corporations] want is monopolistic control
over foreign sources of supply and foreign markets, enabling them to buy and sell on specially privileged terms, to shift orders from one subsidiary to another, to favour this country or that depending on which has the most advantageous tax, labour and other policies...
The authors’ view was that imperialism had a two-fold function with respect
to the surplus: finding cheap foreign sources of supply (which increases the surplus in
the home country), and using other countries’ markets as outlets (which helps absorb
the surplus of the home country).
A major motive of transnational companies in their current practice of
outsourcing parts of production to underdeveloped countries is to cut production
costs, hence to increase gross profits. When the corporation of a core country decides
to outsource its production to a peripheral country, or when it shifts its sources of
supply of intermediate inputs to a peripheral country, this increases global surplus
creation. Global output remains the same, the costs of producing it decline.7 For the
firm, the effect of offshore outsourcing is the same as if it were to reduce its own (in-
house) costs of production, or were to outsource to a cheap supplier in the home
economy. If the workers in the core country dismissed due to the offshore outsourcing
find newly created jobs and continue to produce surplus, then global output increases
and surplus creation increases a fortiori. If the workers dismissed due to the 7 Here the implication is that integration of national economies through trade is reducing the ‘necessary costs of production’ which is taking the attribute of a global concept.

8
outsourcing remain unemployed, then their consumption (provided by family,
unemployment benefits etc.) absorbs part of the surplus produced by other workers in
employment. Should the supplier in the peripheral country expand her production to
meet the order under subcontract, there will also be some increase in surplus creation
in the peripheral country. In this case the total increase in surplus may accrue to both
countries’ economies - in indeterminate proportions.
Rough estimates suggest that by outsourcing globally a multinational firm may
be able to lower its costs by as much as 50-70% (The Economist, 2004: 4). The
McKinsey institution estimates that for every dollar American firms spend on services
from India, the US economy receives between $1.12 and $1.14 in benefits (Drezner
2004). Of that dollar spent in India only part contributes to surplus generation in
India; the rest is the necessary cost of production. But the $1.12 accruing to the US is
pure surplus.
It is worth noting that the effect of offshore outsourcing on productivity in the
core economies is ambiguous. The formula
productivity = sales revenue – material input cost number of workers
shows that an increase in material input cost (due to the increase in outsourced inputs)
and a reduction of the in-house workforce (due to outsourcing) may ultimately affect
the outsourcing firm’s productivity either way. The gains that motivate firms to
outsourcing are not gains in labor productivity (which arguably could legitimize
outsourcing from a social viewpoint), but gains in gross profits – i.e. in surplus
appropriation.

9
4
To substantiate their argument on the transfers of surplus from the periphery,
Baran and Sweezy (1966: 191-201; also Baran 1967: 228-230) showed that the
repatriated profits from investment exceeded investment in peripheral countries by
core countries’ firms, and that investment returns of firms in core countries exceeded
their returns in the periphery.
Today we have access to more factual information and analytical tools for
gauging international transfers of surplus. The first indicator of surplus flows is trade
balances: a country that runs a trade surplus must be transfering net resources (part of
its saved surplus) elsewhere. World Bank Indicators show that the high-income
countries (and also the high-income OECD countries) have recorded deficits in their
trade in goods and services with the low and middle income countries through 1999-
2002 (summary figures in Table 1); hence the periphery has been realizing a net
transfer of resources to the core, assuming that prices reflect values of resources.
This recent surplus of the periphery in recorded trade might not accurately
reflect the magnitude of the real transfer if the prices of peripheral exports were
increasing at a higher rate than the prices of core exports. However, evidence suggests
the converse. In a recent study investigating the terms of trade of twenty-six
developing countries Ram (2004: 251) found that “[w]hile there are some cases of
positive trends, the overall scenario is of sizable negative trends for most developing
countries over the thirty-year period 1970 to 1999.” Another study reports the
deterioration of the terms of trade in manufactured commodities for underdeveloped
countries in their trade with the EU by an average annual 2.2 percent over 1979-1995
(UNCTAD 1996: 148). Yet another calculation shows an average annual terms of
trade deterioration for non-oil exporting developing countries of 1.3 percent for 1982-

10
1988, and an average annual deterioration of 1.5 per cent for 1989-1996 (UNCTAD
1999: 85). Morisset (1998) highlights the increasing difference between commodity
prices in international trade and their prices in developed country markets, suggesting
that the increasing spread may be due inter alia to the ability of large international
trading companies to influence such spreads. He reports that “the spread between
world and domestic prices almost doubled in all major commodity markets during
1975-94” (1998: 503). To sum up, in view of the terms of trade deterioration of the
periphery, trade balances -whether in surplus or in deficit- tend to underestimate the
periphery’s actual resource exchange with the core countries.8
Changes in the periphery’s terms of trade with the core can be tracked to
various variables that affect the costs of production in different countries: real wage
differences, differences in profit margins, tax policies etc.9 Another important
variable that bears on terms of trade and on resource transfers in core–periphery trade
is the undervaluation of underdeveloped countries’ currencies with respect to their
purchasing power parity. Köhler (1998) has suggested that, as the purchasing power
parity exchange rates compiled by international agencies are based on a comparison
of prices of a certain basket of goods and services in the US and in other countries, the
purchasing power parity figures can be interpreted as, roughly, the price of goods and
services in local currency units in other countries that are priced at one dollar in the
US. Hence the difference between a currency’s purchasing power parity and its
8 Computations of the ecological and natural resource content of trade are not central to this
paper but significant from the viewpoint of surplus transfer. A study of the environmental and natural resource content of trade between the developed and underdeveloped countries finds that industrialized countries are in general physical net-importers of natural resources from other world regions. In some material categories (like fossil fuels and basic metal products) “a clear tendency toward an increasing physical trade surplus can be observed” (Giljum and Eisenmenger 2003: 16). The authors highlight the role of declining primary commodity prices in sustaining the imbalance in trade in physical resources. Lipke (2002) and Jorgenson and Rice (2005), using ecological footprint per capita, likewise find a net transfer of ecological capacity through trade from the periphery to the core. 9 Emmanuel (1972) argued that real wage differences are the main determinants of relative prices of the exports of core and periphery; and that differences in profit rates do not play the defining role in these prices.

11
market exchange rate to the dollar can be used as a rough measure of the
overvaluation or undervaluation of a countries’ exports with respect to their values in
the US.
Table 1
External balance in goods and services of country groups (annual average balance; billions current US dollars)
1975-1979 1980-1984 1985-1989 1990-1994 1995-1999 2000-2002 2003 2004
High income -1 -21 -39 86 165 -71 ... ...High income: OECD -35 -67 -68 49 112 -159 ... ...Low income -14 -27 -24 -19 -27 -18 -25 ...Middle income -12 1 17 -1 -13 93 140 127 Source: World Bank, World Development Indicators.
Table 2 shows the deviation of exchange rates from purchasing parities for 20
peripheral countries. Dividing the GDPs in current dollars by GDP in current
international dollars highlights the under- or overvaluation of currencies in market
exchange rates compared to their purchasing powers. The undervaluation in some of
the countries (the South Asian countries, China, Indonesia, Malaysia, Zimbabwe)
appears to have been increasing. To note some extreme cases: the average
undervaluation of the national currency against the US dollar compared to its
purchasing power in 2000-2004 was 78 per cent in Bangladesh and China, and 81 per
cent in Vietnam and India.
Table 3 shows the same exchange rate deviation for the currencies of ten
major core countries. The dollar exchange rates of the core currencies appear to
gyrate around unity; and the figures indicating an undervaluation generally do not
approach the extreme degrees seen in underdeveloped countries. It follows that the
currencies of underdeveloped countries generally tend to remain undervalued not only
with respect to the US dollar, but also with respect to the currencies of the other major
core countries. The undervaluation of peripheral countries’ exports with respect to

12
their values in the core countries implies that outsourcing production to the periphery
generates an unrecorded flow of surplus to the economies of the outsourcing firms in
the core.
Table 2 The ratio of GDP at current US dollars to GDP in current international dollars
for selected underdeveloped countries
1975-1979 1980-1984 1985-1989 1990-1994 1995-1999 2000-2004Bangladesh 0.39 0.31 0.28 0.27 0.25 0.22Bolivia 0.41 0.35 0.43 0.42 0.44 0.38Brazil 0.60 0.48 0.44 0.52 0.66 0.40Chile 0.73 0.78 0.44 0.52 0.59 0.48China 0.64 0.39 0.28 0.22 0.24 0.22Colombia 0.37 0.41 0.28 0.28 0.39 0.29Egypt 0.47 0.40 0.37 0.32 0.40 0.36India 0.37 0.35 0.30 0.21 0.20 0.19Indonesia 0.62 0.59 0.36 0.34 0.30 0.29Kenya 0.70 0.59 0.46 0.32 0.36 0.39Malaysia 0.75 0.72 0.56 0.55 0.53 0.44Mexico 0.55 0.58 0.41 0.60 0.52 0.68Nigeria 1.33 1.25 0.48 0.34 0.35 0.41Pakistan 0.47 0.46 0.33 0.29 0.28 0.27South Africa 0.36 0.43 0.39 0.42 0.39 0.32Thailand 0.50 0.46 0.39 0.44 0.40 0.30Turkey 0.79 0.53 0.43 0.54 0.49 0.44Venezuela 0.99 1.19 0.70 0.51 0.65 0.74Vietnam ... ... ... 0.14 0.20 0.19Zimbabwe 0.66 0.61 0.40 0.31 0.22 ...
Source: Calculated from World Bank http://devdata.worldbank.org/dataonline/ by dividing “GDP (current $)” data by “GDP, PPP (current international $)” data and taking arithmetic averages over periods.
Köhler (1998) estimated the unrequited transfer due to distorted exchange
rates from 97 underdeveloped countries to 22 OECD countries for 1995 and found a
transfer amounting to 8 percent of the GDP of the OECD countries and 24 percent of
the GDP of the underdeveloped countries.10
10 Lipke (2002), using and refining Köhler’s method, finds a positive correlation between the unequal exchange in goods and the unequal exchange in ecological content of exports and imports (ecological footprint).

13
Table 3 The ratio of GDP at current US dollars to GDP in current international dollars
for selected core countries
1975-1979 1980-1984 1985-1989 1990-1994 1995-1999 2000-2004Belgium 1.12 0.82 0.83 1.06 1.06 0.90Canada 1.09 1.00 0.96 1.03 0.88 0.87France 1.10 0.93 0.95 1.14 1.12 0.95Germany 1.11 0.90 0.97 1.22 1.20 0.98Italy 0.70 0.68 0.80 1.01 0.91 0.84Japan 0.97 0.90 1.22 1.50 1.49 1.24Netherlands 1.09 0.89 0.88 1.03 1.03 0.91Sweden 1.47 1.16 1.17 1.43 1.28 1.09Switzerland 1.12 1.00 1.15 1.40 1.43 1.24United Kingdom 0.71 0.81 0.76 0.94 0.95 0.99
Source: Calculated from World Bank http://devdata.worldbank.org/dataonline/ by dividing “GDP (current $)” data by “GDP, PPP (current international $)” data and taking arithmetic averages over periods.
What drives the currency undervaluation in peripheral countries? Capital
account convertibility in peripheral countries instigates a private demand for dollars
and for other reserve currencies as a store of savings and for capital flight.11 In
addition, volatile international capital flows unleashed by this convertibility compel
central banks to accumulate large reserves in order to prevent currency crises,
generating a rising official demand for reserve currencies. The accumulation of
foreign exchange reserves in poor countries is seen in Table 4. The rising trend of the
ratio of reserves to imports and to GDP reftects an increasingly costly hoard, and a
source of downward pressure on the exchange rates of peripheral national currencies
against the reserve currencies.12
11 “In the emerging markets, for each dollar of net inflow there was a net outflow of 14 cents in the 1980s, but of almost 24 cents in the 1990s. For developing countries as a whole, this share more than doubled during the 1990s alone” (UNCTAD 1999: 106). 12 In an alternative explanation for the undervaluation of currencies in the periphery, Reich (2004) argues that a country with a lower productivity in the production of tradables compared to its trading partners must have lower wages than its trading partners to be able to price its tradable goods competitively (“the law of one price”), given the exchange rate of its currency. Then wages in the non-tradables sectors in this country would also have to be lower. If productivity of labor in the non-tradables sectors of this country is comparable to that of its trading partners, then the prices of non-tradables are underpriced comparatively to the corresponding non-tradable goods in developed countries. Reich attributes exchange rate distorsion to this underpricing of non-tradables in excess of

14
Table 4
Low and middle income countries’ official reserves relative to imports, world reserves and GDP
1981-1985 1986-1990 1991-1995 1996-2000 2000-2003
Ratio to imports 0.21 0.22 0.30 0.41 0.52Ratio to GDP 0.04 0.04 0.07 0.11 0.15Ratio to world reserves ... 0.18 0.27 0.35 0.39
Source: World Bank, World Development Indicators. Note: Total reserves comprise special drawing rights, reserves of IMF members held by the IMF, and holdings of foreign exchange under the control of monetary authorities. Gold holdings are excluded.�Imports refers to imports of goods and services and does not include factor incomes.
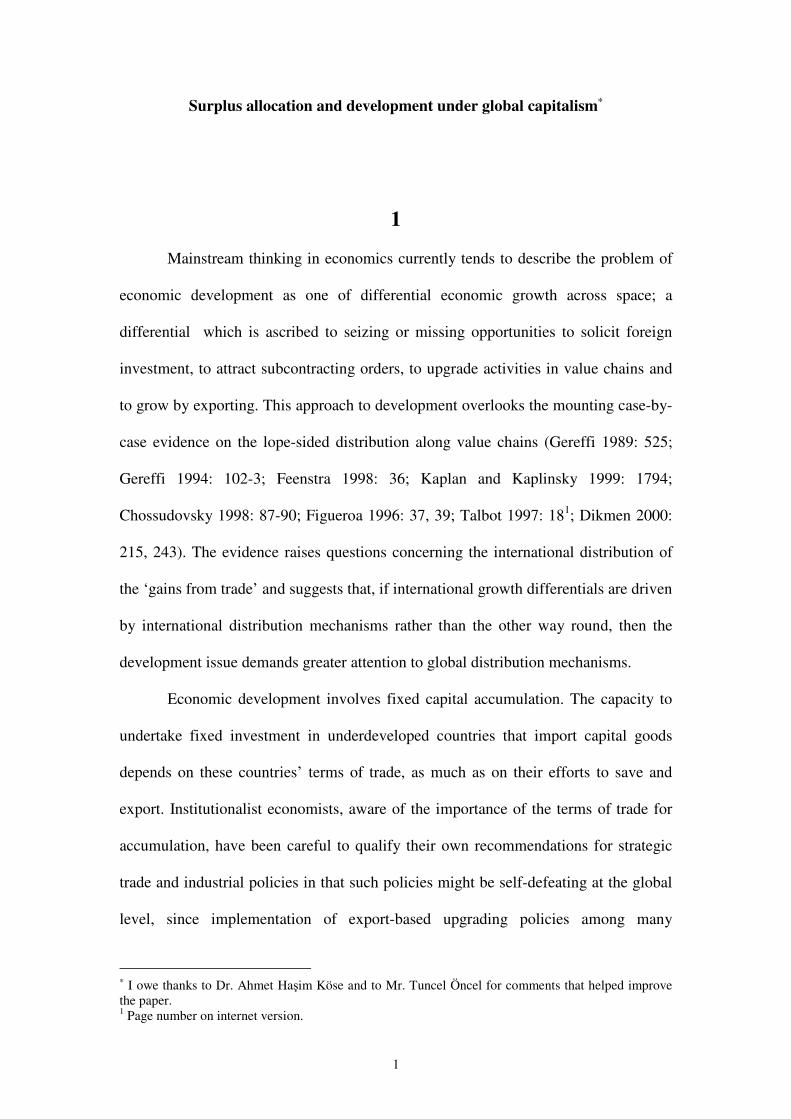
Table 1 showed that the high income countries as a group have been running
trade deficits in goods and services, largely due to OECD countries’ deficits in the
1980s and in recent years. Table 5 reveals that when the undervaluation of the
currencies of the low income countries is used to find a rough estimate of the value of
their exports in the markets of the core countries, this undervaluation overshadows
these countries’ recorded deficits in trade of goods and services. Similarly, Table 6,
comparing the value in the core countries of middle income countries’ exports with
their recorded external balance in goods and services, suggests that the undervaluation
these countries’ exports to the core countries may far exceed their recorded trade
surpluses. However, peripheral countries do not trade only with the core countries, but
also trade with each other. The different rates of undervaluation of currencies of
peripheral countries (highlighted in Table 2) suggest that trade among these countries
also incurs unrequited surplus transfers.
productivity differentials. But this cannot explain why transnational companies outsource production of tradable goods to suppliers in peripheral countries.
15
Table 5 Low income countries’ annual exports in current international dollars
and their external balances (billion US dollars)
1980-1984 1985-1989 1990-1994 1995-1999 2000-2003GDP in PPP $/GDP current $ (=current e-rate/PPP) 2.36 2.93 4.03 4.31 4.69Exports in current dollars 66 65 91 133 192Exports in PPP $ 154 191 366 575 953Exports in PPP $ - exports in current $ 88 126 275 442 750External balance on goods and services (current $) -24 -21 -16 -24 -14 Source: World Bank World Development Indicators. Notes: PPP $ rate/current $ rate is calculated by dividing GDP in current international US dollars by GDP in current US dollars. Exports in current international dollars are calculated by multiplying exports of goods and services by the PPP $ rate/current $ rate. Exports in current dollars are actual earnings from exports. All figures are simple arithmetic averages for periods indicated.
Table 6 Middle income countries’ annual exports in current international dollars
and their external balances (billion US dollars)
1982-1984 1985-1989 1990-1994 1995-1999 2000-2003GDP in PPP $/GDP current $ (=current e-rate/PPP) 2.20 2.59 2.56 2.53 2.98Exports in current $ 471 475 773 1292 1803Exports in PPP $ 1004 1231 1975 3278 5132Exports in PPP $ - exports in current $ 534 757 1202 1986 3416External balance on goods and services (current $) 11 4 2 1 130 Source: World Bank World Development Indicators. Note: Calculations are same as in Table 5. Averages begin in 1982 for lack of 1980 data.
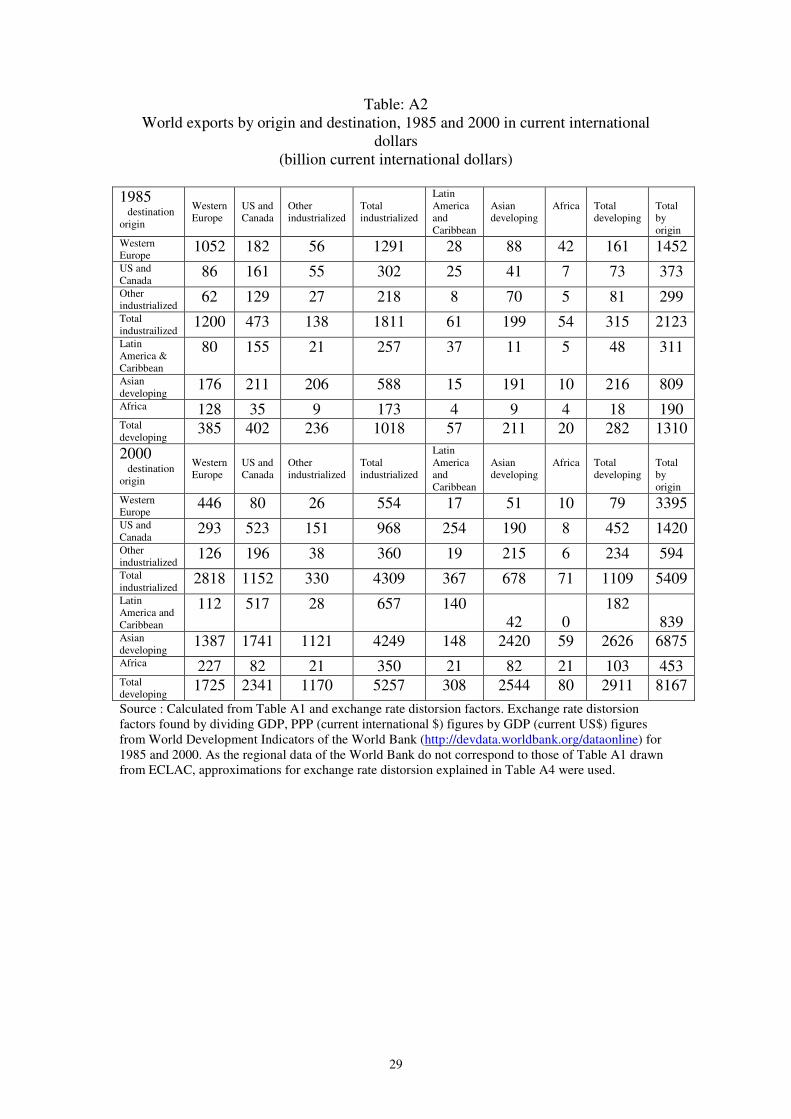
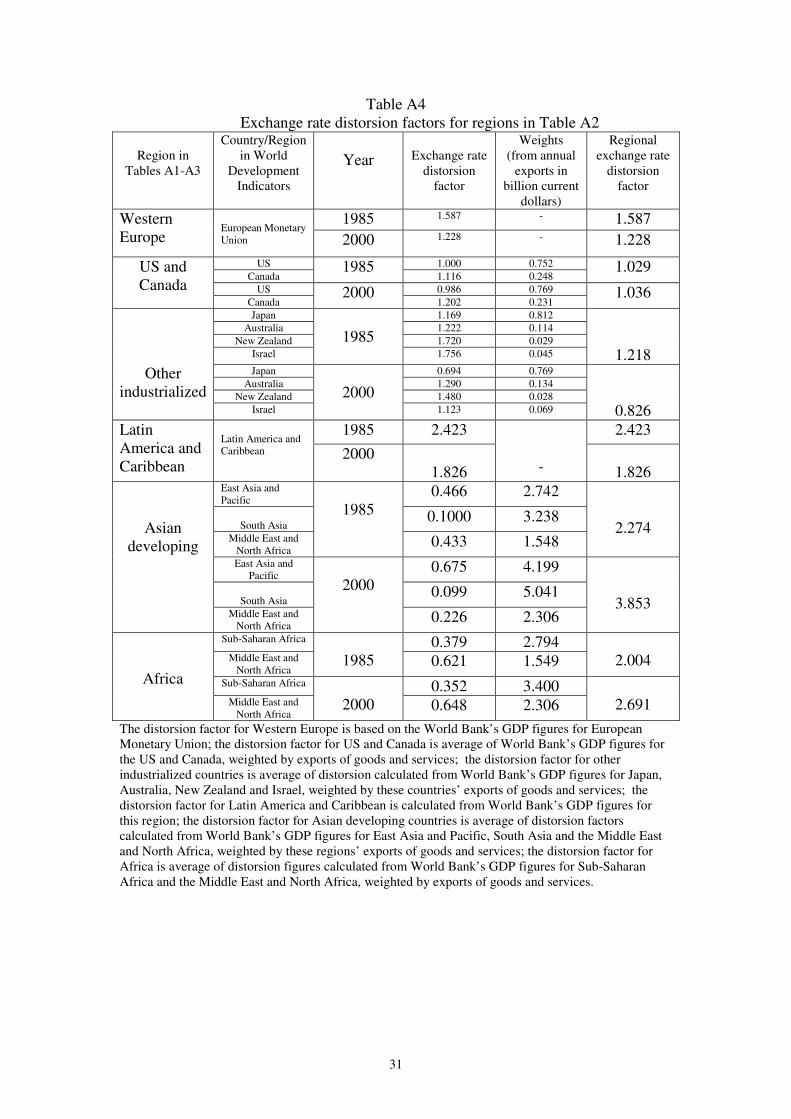
Tables A1-A3 in the appendix and Table 7 below present a tentative
calculation of unrequited transfers through exchange rate distorsions between regional
groups of core and peripheral countries. The reader should be reminded of the
exclusion of East European and Central Asian transition economies from the
estimations, and of our crude assumptions underlying the calculation of the distorsion
factors for whole regions -necessitated by the incongruence of aggregate data from
ECLAC and from the World Bank- so that the tables should be taken rather as a
methodological exercise than an estimation with any claim for precision.
Still, with due caution, the figures in Table 7 merit some scrutiny. The total
value of unrequited transfers appears to increase with trade from 1985 to 2000. Latin

16
America’s surplus transfers seem to concentrate in the US and Canada, while that of
developing Asia appears more balanced between Western Europe, North America and
‘other industrialized countries’. The net unrequited transfers from the Asian periphery
overshadow that from the other two peripheral regions. The change in the relative
position of Africa with respect to ‘developing’ Asia and Latin America from 1985 to
2000 is to be noted. The table shows an upward stream in 2000 of undervalued
exports from Africa to ‘developing Asia’, from Asia to Latin America, and from the
latter region to the core countries; and the confluence of surplus from each of the
‘developing’ regions directly to the core blocks.
Table 7 Net unrequited transfers between different regions, 1985 and 2000
(billion current international dollars)
1985 destination
Origin
Western Europe
US and Canada
Other
industrialized
Latin America
and Caribbean
Asian
developing Africa
Western Europe
- 65 10 - - - US and Canada
- - - - - - Other
industrialized - 21 - - - -
Latin America and
Caribbean
37 90 12 - - 1
Asian developing
67 117 102 2 - 2 Africa 48 18 3 - - - 2000
destination Origin
Western Europe
US and Canada
Other
industrialized
Latin America
and Caribbean
Asian
developing
Africa
Western Europe
- 70 53 - - - US and Canada
- - 46 - - - Other
industrialized - - - - - -
Latin America and
Caribbean
34 225 17 - - -
Asian developing
976 1282 875 90 - - Africa 132 52 14 13 8 -
Source: Table 3A. Inter-regional flows are ignored.

17
Table 7 depicts a hierarchy of transfers – the “structured inequality” of the
world-system demarcated by territorially based states (Tabb 2005: 50). Asian
peripheral countries’ undervalued exports to other peripheral countries may serve to
underpin local support in peripheral countries for free trade policies. Workers in
Turkey, for example, may be unaware of the market price in the EU of their products
exported there, or may not notice how export competition against other Asian
producers pushes down their wages and deprives them of their jobs; but they may see
more easily the advantages of purchasing cheap consumer articles imported from
China or India which enable them to survive on their wages.
Table 8 Per capita gross fixed capital of peripheral country groupings relative to per capita gross fixed capital formation in high-income OECD countries
1975-1979 1980-1984 1985-1989 1990-1994 1995-1999 2000-2002
East Asia and Pacific (a) 0.04 0.04 0.03 0.03 0.05 0.06East Asia and Pacific (b) 0.06 0.08 0.09 0.14 0.19 0.22Europe and Central Asia (a) ... ... ... 0.10 0.08 0.08Europe and Central Asia (b) ... ... ... 0.30 0.23 0.23Latin America and Caribbean (a) 0.22 0.20 0.12 0.11 0.13 0.12Latin America and Caribbean (b) 0.37 0.33 0.28 0.24 0.25 0.24Middle East and North Africa (a) ... ... ... ... 0.06 0.07Middle East and North Africa (b) ... ... ... ... 0.18 0.18South Asia (a) 0.02 0.02 0.02 0.01 0.02 0.02South Asia (b) 0.05 0.06 0.06 0.07 0.08 0.09Sub-Saharan Africa (a) 0.07 0.05 0.03 0.02 0.02 0.02Sub-Saharan Africa (b) 0.11 0.09 0.06 0.05 0.05 0.05Low income (a) 0.03 0.02 0.02 0.01 0.01 0.01Low income (b) 0.05 0.05 0.05 0.06 0.06 0.07Middle income (a) 0.12 0.11 0.08 0.06 0.07 0.08Middle income (b) 0.21 0.21 0.20 0.18 0.20 0.22 Source: World Bank World Development Indicators. Note: (a) The ratio of per capita gross fixed capital formation of indicated countries to that of high-income OECD countries in current US dollars. (b) The ratio of per capita gross fixed capital formation of indicated countries to that of high-income OECD countries in current international dollars.
From the viewpoint of economic development, the critical matter in the use of
the surplus is fixed investment in the underdeveloped countries. To investigate
whether the level of fixed capital formation in the periphery offers any prospects for

18
per capita income convergence, it seems logical to focus on fixed capital formation
per capita, as labor productivity is largely determined by the quantity of the means of
production per worker, and its quality. Table 8 shows per capita gross fixed capital
formation figures for underdeveloped regions as ratios to the corresponding figures in
the high-income OECD countries, and for the low income countries and the middle
income countries as blocks, estimated both on market exchange rate and purchasing
power parity bases. The relevant ratio for a country should lie between the two
estimates, depending on how imported investment goods and domestically produced
investment goods are combined in fixed capital formation.
5
The table reveals that the ratios in general appear to be stagnating in current
US dollars, and appear to be decreasing in purchasing power parities. The ratios for
East Asian and and the East European and Central Asian grouping show upward
trends. If these upward trends were to continue, they would imply a convergence not
of per capita stocks, but of rates of increase of per capita stocks. As long as the
absolute difference between per capita fixed investment in two regions continues, the
gap in per capita stock of fixed capital deepens. Convergence of per capita capital
stocks of peripheral countries with the core countries would necessitate that the
figures in the table be over unity – moreover, substantially over unity. Given the
figures, the prospects for the low and middle income countries’ raising their capital
accumulation and labor productivity to levels commensurate with that of the core
countries seems to be nil.
The alternative mode of surplus absorption is that part of private and
government consumption that cannot be categorized as necessary for the maintenance

19
of the workforce. There is no doubt that such non-essential consumption is
widespread in the periphery of the world-system (formerly among the comprador and
‘traditional’ ruling classes, now among the emerging transnational élite groups13) and
that this consumption diverts resources away from investment. It lies beyond the
scope of this paper to estimate non-essential consumption for groups of countries.
However Table 9 reveals that as the peripheral countries are being officially exhorted
to raise their saving rates, the propensity to consume in the core countries is
increasing. An increase in the share of consumption in national income in core
countries may be interpreted as impinging on the global surplus, unless there are
reasons to suppose that the necessary costs of maintaining the labor force in the core
rises faster than GDP. The declining overall saving rate and trade deficits of the core
countries as a block flies in the face of the need to make provisions for aging core
populations.
Table 9 Final consumption as percentage of GDP (%)
1975-1979 1980-1984 1985-1989 1990-1994 1995-1999 2000-2003Low income 84 85 83 82 82 80Middle income 74 74 73 74 74 73High income: OECD 76 78 78 79 78 80European Monetary Union 77 79 78 78 77 78Japan 67 69 67 67 71 74United States 80 81 83 84 82 85
Per capita GDP as percentageof high-income OECD 1975-1979 1980-1984 1985-1989 1990-1994 1995-1999 2000-2004Low income 7 6 6 6 6 7Middle income 17 18 18 17 18 19 Source: World Bank, World Development Indicators. Per capita GDP ratios (not in percentages) calculated by dividing ‘GDP per capita, PPP (current international $)’ figures of low and middle income country groupings by that of the high-income OECD countries.
The United Sates and the European Monetary Union countries as a group have
been contributing less to global saving (relative to GDP) than the middle income 13 Sklair (1994).
20
countries since the 1970s, and Japan appears to have joined the former group in this
respect since 2000. The high income OECD countries’ final consumption share in
GDP has risen by four percentage points from 1975-1979 to 2000-2003, and the final
consumption share of the low income countries has declined by four percentage
points. The average saving rate in the core has dropped to the level of the low income
countries in 2000-2003. The increase in the consumption rate from 0.78 in 1999 to
0.79, 0.80 and 0.81 in 2000, 2001 and 2002 in the high income OECD countries has
deprived the world of roughly 1.49 trillion dollars (1.55 trillion in current
international dollars) of saving in the three years, a sum equal to 1.5 percent of world
output in those years (1.1 percent by current international dollars). The increasing
flow of global surplus to the core countries makes it both possible and necessary to
increase consumption rates in the core.
The share in GDP of the other component of final consumption expenditure,
government expenditure, in the core countries appears to stable, balanced by Japan’s
rising share and a declining trend in the US. In the context of government
expenditure, US military expenditure played an important role in absorbing surplus
during the Cold War (Baran and Sweezy, 1966: Chapter 7). In the 1990s the
proportion of disclosed military expenditure in GDP and in central government
expenditures has been slightly declining according to World Development Indicators;
in 2002 its share in GDP was 3 percent in the US, and 2 percent in the European
Monetary Union. But a comparison of the level of military spending with investment
figures in the periphery yields a more telling picture.
The rise in the consumption rate in the major core countries appears to be
maintained inter alia by a rising household consumption rate in the US and Japan.
Private consumption expenditure is sustained by advertising, superficial product

21
differentiation and planned obsolescence. Asset prices inflated by speculation (such as
the current housing bubble in the US) play a part in encouraging consumption. As
income levels in the core countries become increasingly polarized, corporate sales
strategies develop mass markets in segments, e.g. in markets for ‘life-style model’
consumer goods and markets for discount-store consumer goods (Jones 2001: 14).
Capitalists, for their part, present advertising as necessary to serve consumers,
who are portrayed as having mysteriously become more whimsical in their demands
and preferences.14 World advertising expenditure (Table 10) amounted to around one
percent of world GDP in 2003 and 20 percent of the fixed capital formation
expenditure of the low and middle income countries combined. Much of expenditure
on advertisement can be seen as a waste of resources that is used to abet further waste.
Another factor that instigates private consumption in the core countries is consumer
credit, which has enabled US consumers to accumlate a debt of ten billion dollars at
the end of 2004 (Wolff 2005).
Table 10 Advertising expenditure through major media*
(billion US dollars) 1996 1997 1998 1999 2000 2001a 2002b 2003c 2004c North America
105.6 112.6 118.9 124.9 131.2 146.7 150.3 158.4 167.9 Europe 72.9 78.6 83.4 87.7 92.2 76.9 86.9 89.5 95.0 Asia and Pacific
61.7 67.2 67.2 70.4 74.0 61.3 66.2 69.7 75.0 Latin America
21.1 24.2 26.7 29.6 33.1 18.3 14.1 13.7 16.1 Rest of World
5.3 6.1 6.8 7.6 8.4 9.4 11.4 14.2 17.4 Total 266.5 288.8 303.1 320.1 338.9 312.6 328.9 345.5 371.4 Source: For 1996-2000 figures: http://www.asianmediaaccess.com.au/ftimes/adspend/summary.htm (14 July 2005), original source: Zenithmedia. a ZenithOptimedia Press Release June 30, 2003. b ZenithOptimedia Press Release July 19, 2004. c ZenithOptimedia Press Release April 18, 2005. *Major media comprises newspapers, magazines, televison, radio, cinema and outdoor advertising. The internet is also indicated in the source tables for figures beginning 2001.
14 An ICC Policy Statement argues “In an increasingly competitive environment and the tendency toward shorter product life spans, new products and services must be introduced without delay to the local market so that business can meet consumer expecations and or preference …” (ICC 2002).

22
Table 11 shows the share of the core in global military expenditure.15 In 2003
world military expenditure figures of the Stockholm International Peace Research
Institute amounted to 53 percent of gross fixed capital formation in the low and
middle income countries combined (1758 billion current US$ - World Development
Indicators); and the military expenditure of the core corresponded to 37 percent of this
investment. The opportunity cost of military expenditure is only one side of the coin.
Maintaining military might, flexing it and intermittently using it is necessary for the
core countries to maintain the momentum toward deregulating trade and capital
movements, and controlling global natural resources.
Table 11
Military expenditure (billion US $, 2003 prices and exchange rates)
1995 1996 1997 1998 1999 2000 2001 2002 2003 2004Western Europe 209 210 209 211 214 216 215 220 223 220North America 347 328 326 319 320 332 335 375 424 466World 789 772 774 765 773 806 819 864 927 975 Source SIPRI. http://www.sipri.org/contents/milap/milex/mex_wnr_table.html Western Europe comprises Austria, Belgium, Cyprus, Denmark, Finland, France, Germany, Greece, Iceland, Ireland, Italy, Luxembourg, Malta, Netherlands, Norway, Portugal, Spain, Sweden, Switzerland, Turkey, UK. North America comprises US and Canada.
6
In conclusion, it emerges from the observations above that the basic
tendencies in the production and growth of the social surplus described by Baran and
Sweezy have not changed under ‘globalizing capitalism’. New economic policies,
corporate strategies and international rules of conduct appear to promote increasing
surplus transfers from the periphery to the core of the world-system.
15 It should be recalled that in many countries part of military expenditure is concealed in other government accounts and SIPRI cannot give data on a number of countries.
23
In order to lift itself out of destitution the periphery is exhorted to remove
restrictions on trade and capital flows, and to compete for advantageous positions in
global value chains controlled by transnationals by improving quality, reducing costs,
innovating etc. The export-led growth economic strategy compels peripheral
producers to individually compete for exportation by repressing wages, and conceding
much of the surplus produced to their trade partners in the core countries. Part of the
surplus accruing to the periphery is consumed by transnational élites imitating the
consumption of the well-to-do in the core societies. On the other hand dollarization,
capital flight and official reserve accumulation exert downward pressure (a pressure
unrelated to trade balances) on the exchange rate of peripheral currencies. The
undervaluation of peripheral currencies, reflected in deteriorating terms of trade,
translates into a loss of surplus to the core countries, and reduces the capacity of poor
countries to import capital goods from the core. The resulting meager per capita fixed
capital formation in the underdeveloped countries bodes grim prospects for the
welfare of future generations of working people in the periphery.
These trends are maintained by the insertion of millions of workers in Asian
hinterlands into global production networks, and by the willingness of peripheral
states governed by transnational élites to continue free trade and capital transactions
policies, and to accumulate foreign exchange reserves. Africa’s poor populations
await their turn to be drawn into the world labor market, to eke out a subsistence and
produce a surplus, of which a large part will likely flow to the core.
In order to prevent the drift of the victims of globalizing capitalism to
irrational reaction (religious or nationalist fanaticism, ‘clash of civilizations’ etc.) and
to focus their attention on the real issues, social scientists and activists should open to
debate the social and economic consequences of the export-led growth idea, all the

24
theories and policies that give precedence to global efficiency over national saving
and investment, and the social psychology of consumerism. There is pressing need to
promote socio-economic programs based on the principle of self-sufficient and self-
reliant national development, wherein the people can decide through democratic
procedures how they will dispose the social surplus they produce (how they will
distribute it, how much they will save, invest, export) under less pressure from world
markets dominated by transnational companies, and with less interefence from
international institutions and core states. Within the framework of the capitalist world-
system, there is little hope for solving the deep social contradictions the system
reproduces. The solution, reason shows, lies outside the logic of the system.
References
Baran, P. A. 1952. On the Political Economy of Backwardness. The Manchester School,
January. Reprinted in A.N. Agarwala and S.P. Singh (ed.). The Economics of Underdevelopment. London. Oxford University Press. 1970.
Baran, P. 1967. The Political Economy of Growth. New York, Monthly Review Press.
(First published in 1957.)
Baran, P. and Sweezy, P. M. 1968. Monopoly Capital: An essay on the American Economic and Social Order. Harmondsworth. Penguin Books.
Chossudovsky, M. 1998. The Globalization of Poverty: Impacts of IMF and World
Bank Reforms. London. Zed Books.
Danielson, A. 1990. The Concept of Surplus and the Underdeveloped Countries: Critique and Suggestions. Review of Radical Political Economics. vol. 22, no. 2-3. 214-230.
Dawson, M. and Foster, J. B. 1992. The Tendency of the Surplus to Rise, 1963-1988. 42-70 in Davis, J. B. (ed.), The Economic Surplus in Advanced Economies. Aldershot. Edward Elgar.
Dikmen, A. A. 2000. Global Commodity Production and Ideologies of Work: Cases of Textiles Production in Turkey. Unpublished Ph.D. dissertation. Middle East Technical University, Graduate School for Social Sciences.

25
Drezner, Daniel W. 2004. The Outsourcing Bogeyman. Foreign Affairs. May/June, http://www.foreignaffairs.org. (1 November 2004).
ECLAC 2002. Globalization and Development, Twenty-Ninth Session: Brasilia, Brazil, 6-10 May 2002; ECLAC, United Nations. Dist. GENERAL LC/G.2157(SES.29/3) 15 April 2002.
Economist, The 2004. Survey of Outsourcing. Nov. 13, 2004.
Emmanuel, Arghiri. 1979. Unequal Exchange: A Study of the Imperialism of Trade. London. NLB.
Feenstra, R. C. 1998. Integration of Trade and Disintegration of Production in the Global Economy. Journal of Economic Perspectives. 12:4. Fall. 31-50.
Figueroa, H. 1996. In the Name of Fashion: Exploitation in the Garment Industry. NACLA Report on the Americas. XXIX:4, 34-40.
Friedman, G. 2005. Labor Unions in the United States.
http://www.eh.net/encyclopedia/?article=friedman.unions.us (11 May 2005).
Garegnani, Pierangelo. 1988. Surplus approach to value and distribution. The Palgrave: A Dictionary of Economics. (eds.) John Eatwell, Murray Milgate, Peter Newman. Vol. 4. London. Macmillan. 560-573.
Gereffi, G. 1989. Rethinking Development Theory: Insights from East Asia and Latin America. Sociological Forum. 4:4, 505-533.
Gereffi, G. 1994. The Organization of Buyer-Driven Global Commodity Chains: How U.S. Retailers Shape Overseas Production Networks. in G. Gereffi and M. Korzeniewicz (eds.), Commodity Chains and Global Capitalism. Westport, Connecticut. Praeger, 95-122.
Giljum, S. and Eisenmenger, N. 2003. North-South trade and the distribution of environmental goods and burdens: A biophysical perspective. SERI Working Paper No. 2, June 2003.
Gosh, Jayati. 2003. The New Water Wars. Frontline, 20 (04), February 15 – 28. http://www.flonnet.com/fl2004/stories/20030228004110700.htm (17.05.2005).
ICC (International Chamber of Commerce) 2002. The liberalization of advertising services. Commission on Marketing and Advertising. November 2002.
ttp://www.iccwbo.org/home/statements_rules/statements/2002/liberalization_advertising_services.asp
JIL 2000. The Japan Institute for Labor Policy and Training. Labor Situation in Japan. Japanese Working Life Profile 2000 -Labour Statistics; Labor Relations Table 69
http://www.jil.go.jp/test/eSituation/pdf/7.pdf (11 May 2005).
JIL 2004. The Japan Institute for Labor Policy and Training. Labor Situation in Japan and Analysis 2004/2005,
http://www.jil.go.jp/english/laborinfo/library/situation2004.htm (11 May 2005).
Jones, Marc. 2001. The Contradictions of Globalisation. Journal of Australian Political Economy. No. 48. December. 5-22.

26
Jorgenson, A. K. and James Rice. 2005. Structural Dynamics of International Trade and Material Consumption: A Cross-National Study of the Ecological Footprints of Less-Developed Countries. Journal of World-Systems Research. XI. I. July. 57-77.
Kanth, R. 1987. Against ‘Surplus’ Theorizing: A Comment, Review of Radical Political Economics. vol. 19. no. 2. 83-85.
Kaplan, D. and Kaplinsky, R. 1999. Trade and Industrial Policy on an Uneven Playing Field: The Case of the Deciduous Fruit Canning Industry in South Africa. World Development. 27:10. 1787-1801.
Köhler, G. 1998. The Structure of Global Money and World Tables of Unequal Exchange. Journal of World-Systems Research. vol. 4. no. 2. Fall. 145-168.
Lipke, J. 2002. Globaler Handel und ungleicher Tausch – Eine entwicklunsgeographische Studie unter Einbezug werttheoretischer und ökologischer Ansätze, Wissenschaftliche Hausarbeit für das 1. Staatsexamen (Studienrat), Berlin September 2002. Shorter English version: Unequal Exchange and Ecological Consumption – a Quantitative Study of Dependency Structures in the World System.
Both documents at http://www.zyklotrop.de/mulli (11 May 2005).
Lippit, V. D. 1985. The Concept of the Surplus in Economic Development. Review of Radical Political Economics. vol. 17. no. 1-2.. 1-19.
Lippit, V. D. 1987. Surplus Theorizing Reaffirmed. Review of Radical Political Economics. vol. 19. no. 2. 86-88.
Lippit, V. D. 1988. Class Structure, Modes of Production and Economic Development. Review of Radical Political Economics. vol. 20 no. 2-3. 18-24.
Lippit, V. 1992. Reevaluating the Concept of the Surplus. 71-90 in Davis, J. B. (ed.), The Economic Surplus in Advanced Economies. Aldershot. Edward Elgar.
Mayer, Jörg. 2003. The Fallacy of Compositon: A Review of the Literature. UNCTAD Discussion Papers No. 166. February.
Moberg, David. 2004. Plunder and Profit: The IMF and World Bank continue to push privatization, in spite of its massive failures. In These Times, March 4.
http://www.inthesetimes.com/comments.php?id=640_0_1_0_C (17.05.2005)
Morisset, Jacques. 1998. Unfair Trade? The Increasing Gap between World and Domestic Prices in Commodity Markets during the Past 25 Years. The World Bank Economic Review. 12(3) 503-25.
Nasser, Alan G. 2003. The Tendency to Privatize. Monthly Review. March.
Nolan, Peter. 2003. Industrial Policy in the Early 21st Century: The Challenges of the Global Business Revolution. In Chang, Ha-Joon Rethinking Development Economics. London. Anthem Press. 299-321.
Ram, R. 2004. Trends in Developing Countries’ Commodity Terms-of-Trade since 1970. Review of Radical Political Economics. 36:2. Spring. 241-253.
Reich, Utz-Peter. 2004. Inequality in International Trade, Paper Prepared for the 28th General Conference of The International Association for Research in Income and

27
Wealth, Cork, Ireland, August 22-28, 2004. http://www.iari.org (downloaded 131 May 2005).
Shaikh, Anwar. 2003. Who Pays for the “Welfare” in the Welfare State?: A Multicountry Study. Social Research. 70 (2) Summer.
Sklair, L. 1994. Capitalism and development in global perspective, 165-185 in Sklair, L. (ed.), Capitalism and Development, London, Routledge.
Stanfield, J. R. 1973. The Economic Surplus and Neo-Marxism, Lexington, Massachussetts, Lexington Books.
Tabb, William K. 2005. Capital, Class and the State in the Global Political Economy. Globalizations, May Vol. 2, No. 1, 47-60.
Talbot, J. M. 1997. Where does your coffee dollar go?: The division of income and surplus along the coffee commodity chain. Studies in Comparative International Development. 32:1. 56-92.
UNCTAD. 1996. Trade and Development Report 1996. New York, United Nations.
UNCTAD. 1999. Trade and Development Report 1999. New York, United Nations.
UNCTAD. 2002. Trade and Development Report 2002. New York, United Nations.
USBancorp. 2001-2003. Mergers and Acquisitions insights: Middle Market M&A Outlook 2001, Mergers and Acquisitions insights: Middle Market M&A Outlook 2002, Mergers and Acquisitions insights: Middle Market M&A Outlook 2003.
Walby, Sylvia. 2000. Analyzing Social Inequality in the Twenty-First Century: Globalization and Modernity Restructure Inequality. Contemporary Sociology. 29(6). November. 813-818.
Ward, M. 1985. Purchasing Power Parities and Real Expenditures in the OECD. Paris OECD.
Wolff, R. (2005) “Personal Debts and US Capitalism” Monthly Review, 15 October 2005.
http://mrzine.monthlyreview.org/wolff151005.html
World Bank. 2000. World Development Report 2000/2001: Attacking Poverty, New York, Oxford University Press.
Yeldan, E. 1995. Surplus Creation and Extraction Under Structural Adjustment: Turkey, 1980-1992. Review of Radical Political Economics. vol. 27, no. 2. 38-72.

28
Appendix Table A1
World exports by origin and destination , 1985 and 2000 (billions US dollars) 1985 destination origin
Western Europe
US and Canada
Other industrialized
Total industrialized
Latin America and Caribbean
Asian developing
Africa
Total developing
Total by origin
Western Europe
663 115 35 813 18 55 27 102 915 US and Canada
84 157 53 294 24 40 7 71 362 Other industrialized
51 106 22 179 7 57 4 66 245 Total industrialized
798 378 110 1284 49 152 38 239 1522 Latin America and Caribbean
33 64 9 106 15 4 2
20 128
Asian developing
77 93 91 259 7 84 4 95 356 Africa 64 18 4 86 2 4 2 9 95 Total developing
175 175 104 453 24 95 9 126 579 Rest of world
73 4 7 84 2 18 7 24 108 Total by destination
1045 557 221 1821 75 265 51 389 2209
2000 destination origin
Western Europe
US and Canada
Other industrialized
Total industrialized
Latin America and Caribbean
Asian developing
Africa
Total developing
Total by origin
Western Europe
1952 352 115 2427 77 222 46 345 2764 US and Canada
283 505 145 934 245 184 8 436 1371 Other industrialized
153 237 46 436 23 260 8 283 720 Total industrialized
2389 1095 306 3790 337 666 61 1064 4862 Latin America and Caribbean
61 283 15 360
77 23 0
100 459
Asian developing
360 452 291 1103 38 628 15 681 1784 Africa 84 31 8 130 8 31 8 38 168 Total developing
505 766 314 1585 123 674 23 819 2404 Rest of world
283 38 15 337 8 38 8 54 390 Total by destination
3185 1899 636 5720 467 1378 92 1937 7657 Source: Figures calculated from Table 2.2 (“Structure of World Imports, By Origin and Destination, 1985 and 2000” showing exports in percentages of world exports) from ECLAC (2002: 33); and from world “exports of goods and services” figures in World Development Indicators of the World Bank (http://devdata.worldbank.org/dataonline). Note to ECLAC table: The data on world imports refer to the total imports of 82 reporting countries, corresponding to approximately 90% of world trade. 1985 refers to the annual average for the period 1984-1986. 2000 refers to the annual average for 1999-2000. The countries not included as reporting countries are primarily those with economies in transition. Western Europe: European Union plus Switzerland, Norway and Iceland. Other industrailized: Japan, Australia, New Zealand and Israel. “Rest of World” is not included as a destination for lack of information. Asian origin, [sic] “Rest of World” refers to economies in transition, Oceania except Australia and New Zealand, free zones, etc.
29
Table: A2 World exports by origin and destination, 1985 and 2000 in current international
dollars (billion current international dollars)
1985 destination origin
Western Europe
US and Canada
Other industrialized
Total industrialized
Latin America and Caribbean
Asian developing
Africa
Total developing
Total by origin
Western Europe
1052 182 56 1291 28 88 42 161 1452 US and Canada
86 161 55 302 25 41 7 73 373 Other industrialized
62 129 27 218 8 70 5 81 299 Total industrailized
1200 473 138 1811 61 199 54 315 2123 Latin America & Caribbean
80 155 21 257 37 11 5 48 311
Asian developing
176 211 206 588 15 191 10 216 809 Africa 128 35 9 173 4 9 4 18 190 Total developing
385 402 236 1018 57 211 20 282 1310
2000 destination origin
Western Europe
US and Canada
Other industrialized
Total industrialized
Latin America and Caribbean
Asian developing
Africa
Total developing
Total by origin
Western Europe
446 80 26 554 17 51 10 79 3395 US and Canada
293 523 151 968 254 190 8 452 1420 Other industrialized
126 196 38 360 19 215 6 234 594 Total industrialized
2818 1152 330 4309 367 678 71 1109 5409 Latin America and Caribbean
112 517 28 657 140 42
0
182 839
Asian developing
1387 1741 1121 4249 148 2420 59 2626 6875 Africa 227 82 21 350 21 82 21 103 453 Total developing
1725 2341 1170 5257 308 2544 80 2911 8167 Source : Calculated from Table A1 and exchange rate distorsion factors. Exchange rate distorsion factors found by dividing GDP, PPP (current international $) figures by GDP (current US$) figures from World Development Indicators of the World Bank (http://devdata.worldbank.org/dataonline) for 1985 and 2000. As the regional data of the World Bank do not correspond to those of Table A1 drawn from ECLAC, approximations for exchange rate distorsion explained in Table A4 were used.

30
Table A3 Unrequited transfers through exports due to exchange rate distorsion, 1985 and 2000
(billion current international dollars) 1985 destination origin
Western Europe
US and Canada
Other industrialized
Total industrialized
Latin America and Caribbean
Asian developing
Africa
Total developing
Total by origin
Western Europe
389 67 21 478 10 32 16 60 597 US and Canada
2 5 2 9 1 1 0 2 11 Other industrialized
11 23 5 39 1 13 1 14 53 Total industrialized
403 95 27 525 13 46 17 76 601 Latin America and Caribbean
47 91 13 151 22 6 3 28 182
Asian developing
99 118 115 329 8 107 6 121 453 Africa 64 18 4 86 2 4 2 9 95 Total developing
210 227 132 567 33 118 11 158 731
2000 destination origin
Western Europe
US and Canada
Other industrialized
Total industrailized
Latin America & Caribbean
Asian developing
Africa
Total developing
Total by origin
Western Europe
446 80 26 554 17 51 10 79 631 US and Canada
10 18 5 33 9 7 0 16 49 Other industrialized
-27 -41 -8 -76 -4 -45 -1 -49 -125 Total industrialized
429 57 23 512 22 12 9 45 555 Latin America and Caribbean
51 234 13 297 63 19 0 82 380
Asian developing
1027 1289 830 3146 109 1792 44 1945 5091 Africa 142 52 13 220 13 52 13 65 285 Total developing
1220 1575 856 3664 185 1863 57 2092 5756 Source: Calculated by taking differences of corresponding regional export figures in Tables A1 and A2.
31
Table A4 Exchange rate distorsion factors for regions in Table A2
Region in
Tables A1-A3
Country/Region in World
Development Indicators
Year
Exchange rate
distorsion factor
Weights (from annual
exports in billion current
dollars)
Regional exchange rate
distorsion factor
1985 1.587 - 1.587 Western Europe
European Monetary Union 2000 1.228 - 1.228
US 1.000 0.752 Canada
1985 1.116 0.248
1.029 US 0.986 0.769
US and Canada
Canada 2000
1.202 0.231 1.036
Japan 1.169 0.812 Australia 1.222 0.114
New Zealand 1.720 0.029 Israel
1985
1.756 0.045
1.218 Japan 0.694 0.769
Australia 1.290 0.134 New Zealand 1.480 0.028
Other industrialized
Israel
2000
1.123 0.069
0.826 1985 2.423 2.423 Latin
America and Caribbean
Latin America and Caribbean 2000
1.826
-
1.826
East Asia and Pacific
0.466 2.742
South Asia 0.1000 3.238
Middle East and North Africa
1985
0.433 1.548
2.274
East Asia and Pacific
0.675 4.199
South Asia 0.099 5.041
Asian developing
Middle East and North Africa
2000
0.226 2.306
3.853
Sub-Saharan Africa 0.379 2.794 Middle East and
North Africa
1985 0.621 1.549
2.004
Sub-Saharan Africa 0.352 3.400
Africa Middle East and
North Africa
2000 0.648 2.306
2.691
The distorsion factor for Western Europe is based on the World Bank’s GDP figures for European Monetary Union; the distorsion factor for US and Canada is average of World Bank’s GDP figures for the US and Canada, weighted by exports of goods and services; the distorsion factor for other industrialized countries is average of distorsion calculated from World Bank’s GDP figures for Japan, Australia, New Zealand and Israel, weighted by these countries’ exports of goods and services; the distorsion factor for Latin America and Caribbean is calculated from World Bank’s GDP figures for this region; the distorsion factor for Asian developing countries is average of distorsion factors calculated from World Bank’s GDP figures for East Asia and Pacific, South Asia and the Middle East and North Africa, weighted by these regions’ exports of goods and services; the distorsion factor for Africa is average of distorsion figures calculated from World Bank’s GDP figures for Sub-Saharan Africa and the Middle East and North Africa, weighted by exports of goods and services.